Embed Size (px)
Citation preview

ARTICLE
Above- and belowground biodiversity jointlytighten the P cycle in agricultural grasslandsYvonne Oelmann 1✉, Markus Lange 2, Sophia Leimer 3, Christiane Roscher4,5, Felipe Aburto 6,
Fabian Alt1, Nina Bange1, Doreen Berner7, Steffen Boch 8, Runa S. Boeddinghaus 7, François Buscot 9,
Sigrid Dassen10, Gerlinde De Deyn 10,11, Nico Eisenhauer 5,12, Gerd Gleixner2, Kezia Goldmann 9,
Norbert Hölzel13, Malte Jochum 5,12, Ellen Kandeler7, Valentin H. Klaus 14, Till Kleinebecker 15,
Gaëtane Le Provost 16, Peter Manning 16, Sven Marhan7, Daniel Prati17, Deborah Schäfer17, Ingo Schöning2,
Marion Schrumpf2, Elisabeth Schurig1, Cameron Wagg 18,19, Tesfaye Wubet 5,20 & Wolfgang Wilcke 3
Experiments showed that biodiversity increases grassland productivity and nutrient exploi-
tation, potentially reducing fertiliser needs. Enhancing biodiversity could improve P-use
efficiency of grasslands, which is beneficial given that rock-derived P fertilisers are expected
to become scarce in the future. Here, we show in a biodiversity experiment that more diverse
plant communities were able to exploit P resources more completely than less diverse ones.
In the agricultural grasslands that we studied, management effects either overruled or
modified the driving role of plant diversity observed in the biodiversity experiment. Never-
theless, we show that greater above- (plants) and belowground (mycorrhizal fungi) biodi-
versity contributed to tightening the P cycle in agricultural grasslands, as reduced
management intensity and the associated increased biodiversity fostered the exploitation of P
resources. Our results demonstrate that promoting a high above- and belowground biodi-
versity has ecological (biodiversity protection) and economical (fertiliser savings) benefits.
Such win-win situations for farmers and biodiversity are crucial to convince farmers of the
benefits of biodiversity and thus counteract global biodiversity loss.
https://doi.org/10.1038/s41467-021-24714-4 OPEN
1 Geoecology, University of Tübingen, Tübingen, Germany. 2Max Planck Institute for Biogeochemistry, Jena, Germany. 3 Institute of Geography andGeoecology, Karlsruhe Institute of Technology (KIT), Karlsruhe, Germany. 4 UFZ - Helmholtz Centre for Environmental Research, Physiological Diversity,Leipzig, Germany. 5 German Centre for Integrative Biodiversity Research (iDiv) Halle-Jena-Leipzig, Leipzig, Germany. 6 LISAB, Dep. Silvicultura, Universidadde Concepción, Concepción, Chile. 7 Institute of Soil Science and Land Evaluation, Soil Biology Department, University of Hohenheim, Stuttgart, Germany.8WSL Swiss Federal Research Institute, Birmensdorf, Switzerland. 9 UFZ - Helmholtz Centre for Environmental Research, Soil Ecology Department,Halle, Germany. 10 Department of Terrestrial Ecology, Netherlands Institute of Ecology, Wageningen, The Netherlands. 11 Department of EnvironmentalSciences, Soil Biology, University of Wageningen, Wageningen, The Netherlands. 12 Leipzig University, Institute of Biology, Leipzig, Germany. 13 Institute ofLandscape Ecology, University of Münster, Münster, Germany. 14 Institute of Agricultural Sciences, ETH Zürich, Zürich, Switzerland. 15 Institute of LandscapeEcology and Resource Management, Justus-Liebig-University Gießen, Gießen, Germany. 16 Senckenberg Biodiversity and Climate Research Centre (SBiK-F),Frankfurt, Germany. 17 Institute of Plant Sciences, University of Bern, Bern, Switzerland. 18 Department of Evolutionary Ecology and Environmental Studies,University of Zürich, Zürich, Switzerland. 19 Fredericton Research and Development Center, Agriculture and Agri-Food Canada, Fredericton, NB, Canada.20 UFZ - Helmholtz Centre for Environmental Research, Community Ecology Department, Halle, Germany. ✉email: [email protected]
NATURE COMMUNICATIONS | (2021) 12:4431 | https://doi.org/10.1038/s41467-021-24714-4 |www.nature.com/naturecommunications 1
1234
5678
90():,;

Experiments have demonstrated that high biodiversity canincrease ecosystem functioning and service provision1–3.Increased productivity of plant species mixtures, in com-
parison to their component species in monocultures, is generallyattributed to facilitation and niche complementarity of speciesassociated with a more complete exploitation of resources4.Nutrients such as nitrogen (N) and phosphorus (P) are exploitedmore exhaustively with increasing diversity of plant mixtures5–9.Consequently, less N is leached to the groundwater10,11. There-fore, high biodiversity contributes to a tight N cycle (contrary to abroken cycle associated with element loss12). However, P leachingwas not reduced by increased plant species diversity8, partlybecause of the lower water solubility of mineral species of Pcompared to N, which forced plants to develop alternative Pacquisition strategies beyond the direct uptake from soil solutionby roots13. The low P concentrations in soil solution challengesthe study of the P cycle. Accordingly, we lack a mechanisticunderstanding of biodiversity effects on the P cycle despite theimportance of P as a limiting nutrient in terrestrial ecosystems inresponse to high N deposition14 and decreasing mineral P ferti-liser availability, which has been identified as a threat to globalfood security15.
In contrast to N, P resource acquisition by nearly all plant speciesin the temperate climate zone is linked to a symbiosis withmycorrhizal fungi (arbuscular mycorrhizal fungi [AMF] in grass-lands and ectomycorrhizal fungi [EMF] in forests)16. The plant-AMF symbiosis involves the direct transfer of P from the fungus tothe plant. Species identity and the richness of plant and mycorrhizalfungal species influence productivity16,17 and thus, potentially theextent of P transfer. Furthermore, P acquisition of plants can alsooriginate from an indirect transfer via the microbial communitysuch as the release of P during turnover of the microbial P pool18 orfrom enzymatically catalyzed release from soil organic matter19.Since all three processes (P acquisition by plants via fungi, microbialand enzyme-mediated P release) were previously shown to increasewith increasing plant species richness if studied separately8,19,20, wehypothesise that effects of biodiversity—including plant andmycorrhizal species richness—on the P cycle are mediated by plant-microbe interactions.
While the mechanisms that underlie biodiversity effects on theP cycle in controlled grassland experiments are partially under-stood, it remains unknown whether the same mechanismsoperate in permanent, managed agroecosystems such as agri-cultural grasslands. Approaching this knowledge gap from anexperimental perspective, biodiversity and management can bemanipulated simultaneously. Biodiversity experiments compris-ing management measures showed that positive biodiversityeffects on productivity persisted on top of managementeffects21–23. Furthermore, in such crossed biodiversity-fertilisation trials the exploitation of N resources by the plantcommunity increased with increasing diversity of plant mixturesirrespective of fertilisation24,25. However, already during theshort-term duration of these experiments, the authors mentionedthat the seeded species composition (and richness) changeddepending on the management treatments23,24. In long-established agricultural grasslands, biodiversity and manage-ment effects interact even more strongly26. Management drivesbiodiversity because it can be considered as an environmentalfilter of the community composition27. Grassland managementdirectly or indirectly filters plant species composition becausefertilisation, mowing, and grazing change abiotic site conditions.Accordingly, plant and AMF species richness are reduced by highmanagement intensity associated with high resource availabilityin soil28–30. At the same time, the few plant species growingunder high resource availability are known for their large pro-ductivity and thus, exploitative nutrient acquisition28,31. Whether
resource exploitation in agricultural grasslands is dominated bybiodiversity effects, i.e. the more diverse the more exhaustive isthe resource exploitation, or by direct management effects, i.e. themore intensive and the more productive the more exhaustive isthe resource exploitation, awaits to be shown. However, biodi-versity and management are closely intertwingled, with highnutrient concentrations resulting in lower plant biodiversity inthe long run, so that a fully crossed experiment cannot bemaintained for very long in reality. We therefore suggest that thecombination of insights gained from both, biodiversity experi-ments and observational data of agricultural grasslands representsan alternative promising avenue.
Here, we made use of the opportunity to combine results from76 grassland mixtures of a biodiversity experiment with thosefrom 100 permanent agricultural grasslands along a managementgradient. All grasslands were located on soils developed fromcalcareous bedrock, which can be considered representative oflarge parts of Central Europe. We were particularly interested inthe extent to which P resources are exploited by organisms(P exploitation, i.e. the part of the total bioavailable P pool in theecosystem that is stored in the biomass) and whether P exploi-tation is related to biodiversity. We related organismic P stocks(in the plant and microbial community) to the total bioavailableP pool in the system (sum of both organismic P stocks andbioavailable P stocks in the soil [HPO4
2− and H2PO4− and
organically bound P in labile and moderately labile P fractionsaccessible with moderate chemical extractants including NaHCO3
and dilute NaOH])8. We first tested mechanisms underlying thebiodiversity-P cycle relationship in the biodiversity experiment.Second, we explored whether biodiversity effects on the P cycleand the underlying mechanisms detected in the biodiversityexperiment persisted along a management gradient (in terms offertilisation, mowing, and grazing intensity). To do so, we usedstructural equation modelling (SEM) to set up an a priori definedmechanistic model of biodiversity effects on P exploitation in thebiodiversity experiment and applied this model to data from theagricultural grasslands.
In this work, we show that in agricultural grasslands, man-agement effects either overrule or modify the driving role of plantbiodiversity observed in the biodiversity experiment. Never-theless, greater above- (plants) and belowground (mycorrhizalfungi) biodiversity contributes to tightening the P cycle in agri-cultural grasslands. Our results demonstrate that promoting ahigh above- and belowground biodiversity has ecological (biodi-versity protection) and economical (fertiliser savings) benefits.
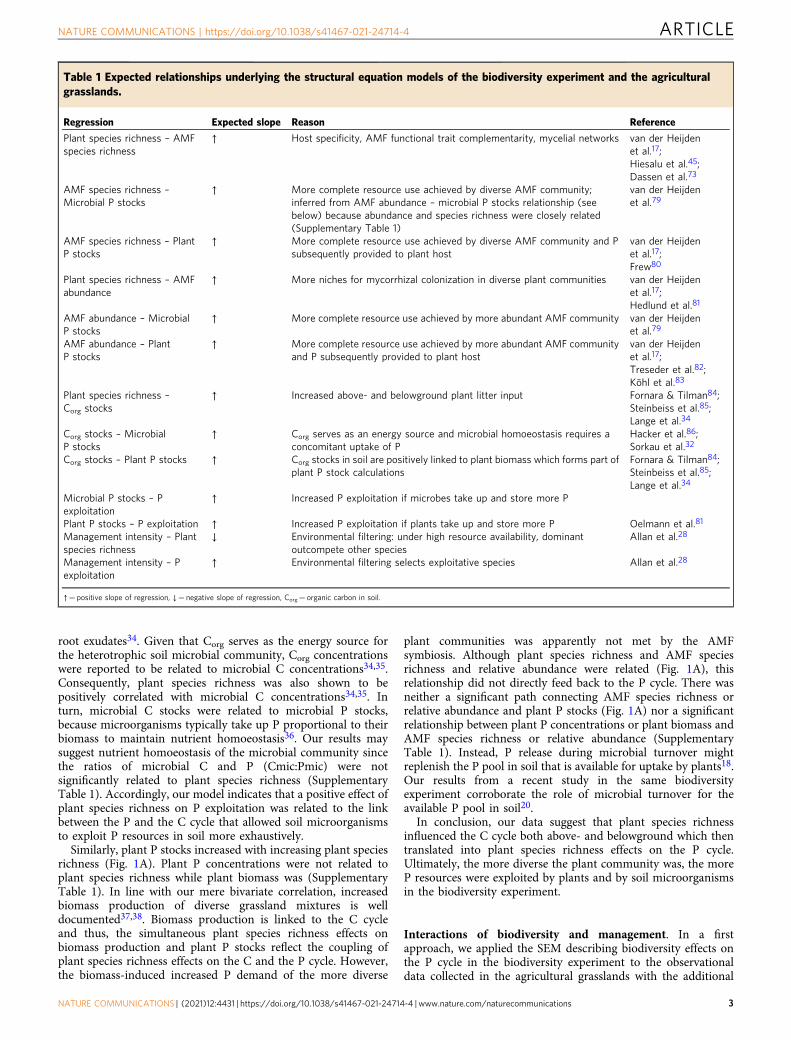
Results and discussionExplanation of the P exploitation. Based on the knowledge thathas been gathered so far for biodiversity effects on single pro-cesses of the P cycle (Table 1), we set up an SEM describing therelationships between biodiversity and P exploitation for thebiodiversity experiment (Supplementary Fig. 1). We consideredvariables that are known to influence the extent to which Presources can be exploited including (i) the soil organic carbon(Corg) stocks linked to microbial biomass32,33 and (ii) AMFspecies richness and relative abundance governing the symbiotictransfer of P from microbes to plants16,17. Because of the closecorrelation between AMF species richness and relative abun-dance, we introduced these two variables with correlated errors inthe SEM.
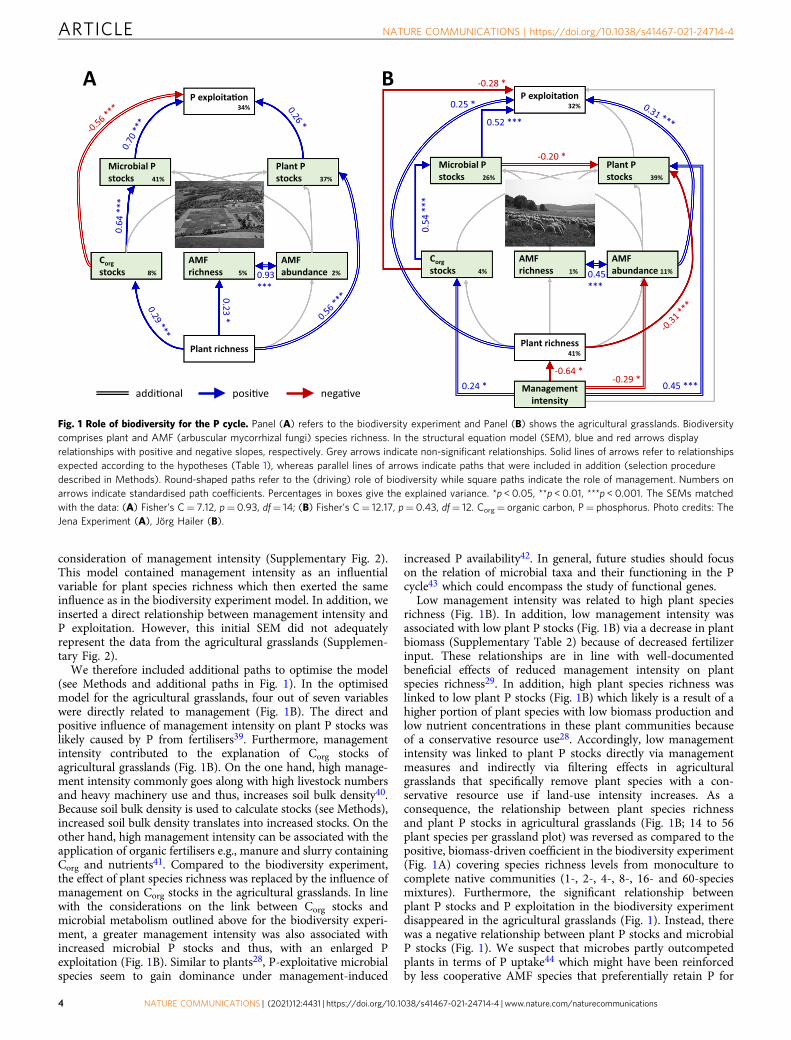
We found that P exploitation was positively related to plantspecies richness and this relationship was mediated by Corg stocksand microbial P stocks in soil (Fig. 1A). Under diverse plantmixtures, an increase of Corg stocks in soil likely resulted from anincreased C input from above- and belowground plant litter and
ARTICLE NATURE COMMUNICATIONS | https://doi.org/10.1038/s41467-021-24714-4
2 NATURE COMMUNICATIONS | (2021) 12:4431 | https://doi.org/10.1038/s41467-021-24714-4 | www.nature.com/naturecommunications
root exudates34. Given that Corg serves as the energy source forthe heterotrophic soil microbial community, Corg concentrationswere reported to be related to microbial C concentrations34,35.Consequently, plant species richness was also shown to bepositively correlated with microbial C concentrations34,35. Inturn, microbial C stocks were related to microbial P stocks,because microorganisms typically take up P proportional to theirbiomass to maintain nutrient homoeostasis36. Our results maysuggest nutrient homoeostasis of the microbial community sincethe ratios of microbial C and P (Cmic:Pmic) were notsignificantly related to plant species richness (SupplementaryTable 1). Accordingly, our model indicates that a positive effect ofplant species richness on P exploitation was related to the linkbetween the P and the C cycle that allowed soil microorganismsto exploit P resources in soil more exhaustively.
Similarly, plant P stocks increased with increasing plant speciesrichness (Fig. 1A). Plant P concentrations were not related toplant species richness while plant biomass was (SupplementaryTable 1). In line with our mere bivariate correlation, increasedbiomass production of diverse grassland mixtures is welldocumented37,38. Biomass production is linked to the C cycleand thus, the simultaneous plant species richness effects onbiomass production and plant P stocks reflect the coupling ofplant species richness effects on the C and the P cycle. However,the biomass-induced increased P demand of the more diverse
plant communities was apparently not met by the AMFsymbiosis. Although plant species richness and AMF speciesrichness and relative abundance were related (Fig. 1A), thisrelationship did not directly feed back to the P cycle. There wasneither a significant path connecting AMF species richness orrelative abundance and plant P stocks (Fig. 1A) nor a significantrelationship between plant P concentrations or plant biomass andAMF species richness or relative abundance (SupplementaryTable 1). Instead, P release during microbial turnover mightreplenish the P pool in soil that is available for uptake by plants18.Our results from a recent study in the same biodiversityexperiment corroborate the role of microbial turnover for theavailable P pool in soil20.
In conclusion, our data suggest that plant species richnessinfluenced the C cycle both above- and belowground which thentranslated into plant species richness effects on the P cycle.Ultimately, the more diverse the plant community was, the moreP resources were exploited by plants and by soil microorganismsin the biodiversity experiment.
Interactions of biodiversity and management. In a firstapproach, we applied the SEM describing biodiversity effects onthe P cycle in the biodiversity experiment to the observationaldata collected in the agricultural grasslands with the additional
Table 1 Expected relationships underlying the structural equation models of the biodiversity experiment and the agriculturalgrasslands.
Regression Expected slope Reason Reference
Plant species richness – AMFspecies richness
↑ Host specificity, AMF functional trait complementarity, mycelial networks van der Heijdenet al.17;Hiesalu et al.45;Dassen et al.73
AMF species richness –Microbial P stocks
↑ More complete resource use achieved by diverse AMF community;inferred from AMF abundance – microbial P stocks relationship (seebelow) because abundance and species richness were closely related(Supplementary Table 1)
van der Heijdenet al.79
AMF species richness – PlantP stocks
↑ More complete resource use achieved by diverse AMF community and Psubsequently provided to plant host
van der Heijdenet al.17;Frew80
Plant species richness – AMFabundance
↑ More niches for mycorrhizal colonization in diverse plant communities van der Heijdenet al.17;Hedlund et al.81
AMF abundance – MicrobialP stocks
↑ More complete resource use achieved by more abundant AMF community van der Heijdenet al.79
AMF abundance – PlantP stocks
↑ More complete resource use achieved by more abundant AMF communityand P subsequently provided to plant host
van der Heijdenet al.17;Treseder et al.82;Köhl et al.83
Plant species richness –Corg stocks
↑ Increased above- and belowground plant litter input Fornara & Tilman84;Steinbeiss et al.85;Lange et al.34
Corg stocks – MicrobialP stocks
↑ Corg serves as an energy source and microbial homoeostasis requires aconcomitant uptake of P
Hacker et al.86;Sorkau et al.32
Corg stocks – Plant P stocks ↑ Corg stocks in soil are positively linked to plant biomass which forms part ofplant P stock calculations
Fornara & Tilman84;Steinbeiss et al.85;Lange et al.34
Microbial P stocks – Pexploitation
↑ Increased P exploitation if microbes take up and store more P
Plant P stocks – P exploitation ↑ Increased P exploitation if plants take up and store more P Oelmann et al.81
Management intensity – Plantspecies richness
↓ Environmental filtering: under high resource availability, dominantoutcompete other species
Allan et al.28
Management intensity – Pexploitation
↑ Environmental filtering selects exploitative species Allan et al.28
↑= positive slope of regression, ↓= negative slope of regression, Corg= organic carbon in soil.
NATURE COMMUNICATIONS | https://doi.org/10.1038/s41467-021-24714-4 ARTICLE
NATURE COMMUNICATIONS | (2021) 12:4431 | https://doi.org/10.1038/s41467-021-24714-4 |www.nature.com/naturecommunications 3
consideration of management intensity (Supplementary Fig. 2).This model contained management intensity as an influentialvariable for plant species richness which then exerted the sameinfluence as in the biodiversity experiment model. In addition, weinserted a direct relationship between management intensity andP exploitation. However, this initial SEM did not adequatelyrepresent the data from the agricultural grasslands (Supplemen-tary Fig. 2).
We therefore included additional paths to optimise the model(see Methods and additional paths in Fig. 1). In the optimisedmodel for the agricultural grasslands, four out of seven variableswere directly related to management (Fig. 1B). The direct andpositive influence of management intensity on plant P stocks waslikely caused by P from fertilisers39. Furthermore, managementintensity contributed to the explanation of Corg stocks ofagricultural grasslands (Fig. 1B). On the one hand, high manage-ment intensity commonly goes along with high livestock numbersand heavy machinery use and thus, increases soil bulk density40.Because soil bulk density is used to calculate stocks (see Methods),increased soil bulk density translates into increased stocks. On theother hand, high management intensity can be associated with theapplication of organic fertilisers e.g., manure and slurry containingCorg and nutrients41. Compared to the biodiversity experiment,the effect of plant species richness was replaced by the influence ofmanagement on Corg stocks in the agricultural grasslands. In linewith the considerations on the link between Corg stocks andmicrobial metabolism outlined above for the biodiversity experi-ment, a greater management intensity was also associated withincreased microbial P stocks and thus, with an enlarged Pexploitation (Fig. 1B). Similar to plants28, P-exploitative microbialspecies seem to gain dominance under management-induced
increased P availability42. In general, future studies should focuson the relation of microbial taxa and their functioning in the Pcycle43 which could encompass the study of functional genes.
Low management intensity was related to high plant speciesrichness (Fig. 1B). In addition, low management intensity wasassociated with low plant P stocks (Fig. 1B) via a decrease in plantbiomass (Supplementary Table 2) because of decreased fertilizerinput. These relationships are in line with well-documentedbeneficial effects of reduced management intensity on plantspecies richness29. In addition, high plant species richness waslinked to low plant P stocks (Fig. 1B) which likely is a result of ahigher portion of plant species with low biomass production andlow nutrient concentrations in these plant communities becauseof a conservative resource use28. Accordingly, low managementintensity was linked to plant P stocks directly via managementmeasures and indirectly via filtering effects in agriculturalgrasslands that specifically remove plant species with a con-servative resource use if land-use intensity increases. As aconsequence, the relationship between plant species richnessand plant P stocks in agricultural grasslands (Fig. 1B; 14 to 56plant species per grassland plot) was reversed as compared to thepositive, biomass-driven coefficient in the biodiversity experiment(Fig. 1A) covering species richness levels from monoculture tocomplete native communities (1-, 2-, 4-, 8-, 16- and 60-speciesmixtures). Furthermore, the significant relationship betweenplant P stocks and P exploitation in the biodiversity experimentdisappeared in the agricultural grasslands (Fig. 1). Instead, therewas a negative relationship between plant P stocks and microbialP stocks (Fig. 1). We suspect that microbes partly outcompetedplants in terms of P uptake44 which might have been reinforcedby less cooperative AMF species that preferentially retain P for
posi�ve nega�veaddi�onal0.24 * -0.29 * 0.45 ***
0.52 ***
-0.20 *
0.54
***
-0.28 *
0.25 *
0.45***
-0.64 *
P exploita�on32%
Microbial Pstocks 26%
Plant Pstocks 39%
Corgstocks 4%
AMF richness 1%
AMFabundance 11%
Plant richness41%
Managementintensity
P exploita�on34%
Plant Pstocks 37%
Plant richness
Microbial Pstocks 41%
Corgstocks 8%
AMFabundance 2%
AMF richness 5%
0.23*
0.93***
A B
Fig. 1 Role of biodiversity for the P cycle. Panel (A) refers to the biodiversity experiment and Panel (B) shows the agricultural grasslands. Biodiversitycomprises plant and AMF (arbuscular mycorrhizal fungi) species richness. In the structural equation model (SEM), blue and red arrows displayrelationships with positive and negative slopes, respectively. Grey arrows indicate non-significant relationships. Solid lines of arrows refer to relationshipsexpected according to the hypotheses (Table 1), whereas parallel lines of arrows indicate paths that were included in addition (selection proceduredescribed in Methods). Round-shaped paths refer to the (driving) role of biodiversity while square paths indicate the role of management. Numbers onarrows indicate standardised path coefficients. Percentages in boxes give the explained variance. *p < 0.05, **p < 0.01, ***p < 0.001. The SEMs matchedwith the data: (A) Fisher’s C= 7.12, p= 0.93, df= 14; (B) Fisher’s C= 12.17, p= 0.43, df= 12. Corg= organic carbon, P= phosphorus. Photo credits: TheJena Experiment (A), Jörg Hailer (B).
ARTICLE NATURE COMMUNICATIONS | https://doi.org/10.1038/s41467-021-24714-4
4 NATURE COMMUNICATIONS | (2021) 12:4431 | https://doi.org/10.1038/s41467-021-24714-4 | www.nature.com/naturecommunications

themselves30,45 and thus, increased microbial P stocks at theexpense of plant P stocks. Yet, the positive relationship betweenplant species richness and P exploitation observed in thebiodiversity experiment stayed the same in the agriculturalgrasslands: Increasing plant species richness increased P exploita-tion (Fig. 1). However, the mechanism underlying the plantspecies richness effect on P exploitation in the biodiversityexperiment (i.e., the coupling of the C and P cycles above- andbelowground) did not apply to the agricultural grasslands.Instead, the direct link between plant species richness and Pexploitation implies that variables representing the underlyingmechanism were not included in our model of the agriculturalgrasslands.
The less intense the management was, the more abundant anddiverse were the AMF communities in the agricultural grasslands(Fig. 1B). Decreased P availability in soil due to reducedfertilisation is known to increase the species richness andabundance of the fungal community and in particular of theAMF community29,30. We were able to show that this increase inAMF abundance was associated with an increased P exploitation(Fig. 1B). The management effect on total P exploitation wasmainly mediated via AMF and plant species richness (combinedeffect of all paths leading to P exploitation via AMF and plantspecies richness=−0.22), while the combined effect via Corg
stocks was negligible (0.002). Therefore, management effects inagricultural grasslands either overruled and modified the role ofplant species richness observed in biodiversity experiments.Nonetheless, reduced management intensity was beneficial forabove- and belowground biodiversity and for the exploitation of Presources in soil. Here we showed that both, above- andbelowground biodiversity contribute to tightening the P cycle inagricultural grasslands.
Biodiversity theory put into practice. From an applied per-spective, even small positive effects of biodiversity on productivityand P exploitation could yield benefits in terms of savings offertilisation including labour and energy costs for application ofthe fertiliser. Such economic arguments should help to convincefarmers to promote and conserve biodiversity. The balancebetween benefits of reduced management for biodiversity andpotentially detrimental effects on yields remains a challengingissue and requires open-minded solutions. The identification ofwin-win situations is crucial to merge opposing views of repre-sentatives of agriculture – arguably one of the leading causes ofbiodiversity loss46 – and nature conservation. Only if these twotoo frequent opponents act in concert, biodiversity theory will beput into practice and could help counteract global biodiversityloss and develop sustainable management strategies.
MethodsStudy sites. Grassland biodiversity experiment: Our data originate from the JenaExperiment (http://www.the-jena-experiment.de)47. The field site is located nearthe German city of Jena (50°55′ N, 11°35′ E; 130 m above sea level). Mean annualair temperature is 9.9 °C, and mean annual precipitation amounts to 610 mm48.The soil is an Eutric Fluvisol49 developed from up to 2 m-thick fluvial sedimentsthat are almost free of stones. Sediments largely originated from the same geolo-gical series (Pleistocene loess on limestone [Anisian/Ladinian] of the MiddleTriassic) as described for one of the agricultural grassland regions (Hainich-Dün,see below). The systematic variation in soil texture as a consequence of fluvialdynamics was considered in the experimental design by arranging the experimentalplots in four blocks at different distances to the river. The study site was convertedfrom grassland to arable land in the early 1960s and used for cropping until theestablishment of the experiment in 2002.
The main experiment comprised 82 plots that were split in different subplotswith a core area of approximately 43.5 m2. Each plot contains a specificcombination of plant species (1, 2, 4, 8, 16, 60 species) that belong to differentnumbers (1, 2, 3, 4) of plant functional groups (grasses, [non-leguminous] smallherbs, [non-leguminous] tall herbs, legumes). The species were chosen from a poolof 60 species typically found in mesic Molinio-Arrhenatheretea meadows. Each
plant species richness level had 16 replicates except for 14 mixtures with 16 speciesand 4 replicates of the 60-species mixture. Monocultures of Bellis perennis L. andCynosurus cristatus L. included in the original design had to be abandoned becauseof poor establishment. We excluded the 60-species mixtures from statisticalanalyses (final n= 76), because they contain the complete species pool and thus,would potentially strengthen the sampling effect. To maintain the sown speciesrichness levels, plots were weeded three times a year by carefully removing weedsand their roots. This minimises potential bias from weed root contributions. Themanagement of all plots was adapted to extensive meadows used for hayproduction i.e., mown but not fertilised. All plots were mown twice a year in Juneand September with the harvest being removed from the plots.
Agricultural grasslands: We studied long-established, agriculturally managed(i.e. not experimentally assembled) grasslands in an interdisciplinary, large-scaleand long-term programme, the Biodiversity Exploratories (http://www.biodiversity-exploratories.de)50. The Biodiversity Exploratories comprise threestudy regions in Germany (Schwäbische Alb, Hainich-Dün, and Schorfheide-Chorin). We aimed to disentangle biodiversity and management effects andtherefore, had to remove additional confounding factors such as geologic parentmaterial (calcareous versus non-calcareous). Because of substantial differences inthe geologic parent material50 and of P fractions in soil51, we excluded theSchorfheide-Chorin from our analyses. Standardised field plots were located in theSchwäbische Alb and in the Hainich-Dün, both middle mountain ranges inGermany. The Schwäbische Alb is located between 460–860 m above sea level, hasan annual mean temperature of 6–7 °C and an annual precipitation of 700–1,000mm50. The geologic parent material is calcareous bedrock of the Oxfordian Age(Epoch: Upper Jurassic) from which Leptosols and Cambisols have developed49.The Hainich-Dün is located between 258–550 m above sea level, has an annualmean temperature of 6.5–8 °C and an annual precipitation of 500–800 mm50. Thegeologic parent material in the Hainich-Dün is calcareous bedrock of the MiddleTriassic Epoch partly covered by Pleistocene loess from which Cambisols,Stagnosols, Vertisols and Luvisols have developed49. The design of the BiodiversityExploratories was described in detail by Fischer et al.50 We used 100 grassland plots(50 in each of Schwäbische Alb and Hainich-Dün) which can be classified asmeadows (mown one to four times per year but not grazed), pastures (grazed butnot mown), and mown pastures (both mown and grazed). Plots were selected torepresent a gradient of management intensity with different fertilisation, frequencyof mowing, and livestock units.
Management intensity. Management intensity of the biodiversity experiment hasbeen the same since the establishment (no fertilisation, no grazing, mown twice ayear). In the agricultural grasslands, management intensity (number of livestockunits per hectare per year, frequency of mowing events per year, and amount of N-fertiliser applied per hectare per year) varied among plots and was assessed yearlyvia questionnaires answered by the farmers52. Notably, the plots were not amendedwith mineral P fertiliser except for two plots which received 25 kg ha−1 P in 2011.However, manure and slurry were applied and also contain labile P fractions whichmight transform into sparingly soluble P minerals in the long run53. To account forthe variation in management of the agricultural grasslands, we used data of thesampling campaigns in 2011 and 2014 as described below. We first measured andcalculated variables for each year individually. There were robust correlationsbetween years for the different variables (correlation coefficient of up to r= 0.86)and therefore, we used means of the two years for further evaluation. We con-sidered the mean land-use intensity of the years 2011 and 2014 as more robust thanthe single measurements alone, because the P availability in soil is determined bythe site conditions and the long-term land use, particularly in the absence ofmineral P fertilization as was the case at all our study sites, except two.
Plant species richness and biomass harvest. In the biodiversity experiment,sown species richness was determined on a 9 m2 (3 m × 3 m) area in May 2014. Inagricultural grasslands, vascular plant species richness was assessed on a 16 m2 (4m × 4 m) area by sampling all species from mid May to mid June in 2011 and 2014.In order to account for the difference in survey area between experimental andagricultural grasslands, a separate survey of 9 m² subplots nested within the 16 m2
subplots was conducted in April and May 2018 in a selected number of plots in theagricultural grasslands (n= 18). Species richness differed significantly between 9m2 and 16 m2 subplots (mean number of species ± standard error; 9 m2: 22 ± 2; 16m2: 24 ± 2; paired t-test: T=−5.15; p < 0.001). Accordingly, we used a scalingfactor of 0.91 i.e., the slope of the regression of species richness on 9 m2 on speciesrichness on 16 m2 (Supplementary Fig. 3), to adjust species richness of all agri-cultural grasslands to the area of species richness measurements in the biodiversityexperiment.
In the biodiversity experiment, aboveground plant biomass of target species washarvested in May 2014, at the estimated peak biomass before mowing.Aboveground plant biomass was sampled in all plots within a frame (0.2 × 0.5 m,height 0.03 m) at two random locations per plot and sorted by target species, weedsand detached dead plant material. Biomass was extrapolated to 1 m2. In agriculturalgrasslands, biomass of a 2 m2 large area was harvested as mixed samples of eightquadrats of 0.25 m2 in close proximity to the area in which the vegetation wasrecorded from mid May to mid June in 2011 and 2014. Temporary fences ensuredthat biomass was sampled at peak standing crop but without any effect of possible
NATURE COMMUNICATIONS | https://doi.org/10.1038/s41467-021-24714-4 ARTICLE
NATURE COMMUNICATIONS | (2021) 12:4431 | https://doi.org/10.1038/s41467-021-24714-4 |www.nature.com/naturecommunications 5
mowing or grazing events. Detached dead material was excluded from biomasssampling. Biomass was assessed on a dry-weight basis (drying at 70–80 °C for 48 h)in the experimental and agricultural grasslands.
Soil sampling. Soil in the biodiversity experiment was sampled in April 2014 foranalyses of Corg concentrations and bulk density. In each plot, three soil cores weretaken to a depth of 0.3 m using a split-tube sampler (4.8 cm diameter). Soil coreswere segmented into 5 cm-depth sections and pooled per depth sections and plot34.We used the mean Corg concentrations of the upper three intervals (0 to 0.15 m).For the measurement of P in soil of the biodiversity experiment, sampling tookplace in September 2013. Nine soil cores per plot with a diameter of 0.02 m weretaken at a depth of 0 to 0.15 m and combined to a composite sample consideredrepresentative for the plot. Although these samples were not taken during theidentical period of time as for the agricultural grasslands (see below), we testedwhether the results are applicable to the growing season of 2014. First, bioavailablePi concentrations in soil were closely correlated between years (September 2013and October 2014; r= 0.88, p < 0.001, n= 79). Second, resin-extractable P con-centrations on samples of the 2013 campaign measured in the laboratory matchedwith P released under field conditions in May 2014 (r= 0.40, p < 0.001, n= 78).
In agricultural grasslands, soil samples were collected simultaneously withintwo weeks in May 2011 and May 2014. Samples were taken along two orthogonaltransects of 20 m. Sampling points were shifted by 0.5 m in 2014 compared with2011 to avoid an overlap of sampling positions. In each plot, 14 samples from 0 to0.1 m soil depth were taken using core augers (diameter ~52 mm). Samples weremixed, cooled and transported to a field lab where they were sieved (<2 mm), allwithin 8 h of sampling. All measurements described below for agriculturalgrasslands were done on aliquots of samples of these joint sampling campaigns.
Laboratory analyses and calculations. Air-dry plant material sampled in theexperimental and agricultural grasslands was ground with a mill using a 0.5-mmscreen for chemical analyses. Nitrogen concentration of plant material was measuredin ground samples with an elemental analyser for the biodiversity experiment andnear-infrared spectroscopy (NIRS) for the agricultural grasslands. Plant samples weredigested in a microwave with concentrated nitric acid and hydrogen peroxide54 and Pconcentrations were determined by inductively-coupled plasma optical emissionspectrometry (ICP-OES). In 2011, P concentrations were measured by NIRS inbiomass of the agricultural grasslands. We multiplied the latter data by 0.9844 tomatch with the digestion method based on data of the year 2009 for which both thedigestion and NIRS method had been applied (Pdigestion= 0.9844 × PNIRS, r= 0.80, p< 0.001, n= 98). Plant samples collected in 2014 in the agricultural grasslands wereanalysed for P concentrations by means of an X-ray fluorescence spectrometer. Wecan exclude a methodological shift in plant P concentrations between years, becausedigestion followed by ICP-OES analyses and XRF analyses were shown to matchwell55. Nitrogen:P ratios in plant material were calculated on an elemental mass basis.We calculated P stocks in aboveground biomass by multiplying biomass [g m−2]harvested in May with their P concentrations [mg g−1] and with the number ofmowing events. In this way, we likely overestimated the absolute values of above-ground plant P stocks. But at the same time, we ensured comparability betweenexperimental and agricultural grasslands because, for the latter, plant material ofmowing events later than May was not available.
In the experimental and agricultural grasslands, soil pH values were determinedwith a glass electrode in a 1:2.5 soil:0.01 M CaCl2 water suspension. Total Cconcentrations were determined on ground air-dry samples by an elementalanalyser. Organic C concentrations were calculated by subtracting inorganic Cconcentrations (determined after removal of Corg at 450 °C in a muffle furnace)from total C concentration. Soil bulk density was calculated by weighing a 100-cm³core after drying the soil at 40 °C.
In the experimental and agricultural grasslands, various P fractions in soil weremeasured according to the method of Hedley et al.56 modified by Kuo57. Thesequential extraction scheme had three steps (bioavailable P (NaHCO3 extractable),moderately labile P (NaOH extractable), and mineral P (HCl extractable)). Thebioavailable P fraction comprises H2PO4
−/HPO42− ions in soil solution and those
weakly adsorbed to mineral surfaces. More strongly adsorbed P to iron andaluminium oxides and (oxy)hydroxides is recovered in the moderately labilefraction. The mineral P fraction contains P bound in apatite and other Caphosphates56,58,59. In all extraction solutions, Pi concentrations were analysedusing the ammonium molybdate-ascorbic acid blue method described by Murphyand Riley60 and measured with a continuous flow analyser. Total dissolved Pconcentrations in NaHCO3- and NaOH-extracts were measured with an ICP-OES.For the labile and moderately labile fractions (NaHCO3-P, NaOH-P), organic Pconcentrations were calculated by subtracting Pi from total dissolved Pconcentrations in the extracts.
In the experimental and agricultural grasslands, microbial P was measuredby hexanol fumigation using a combination of the methods of McLaughlinet al.61 and Kouno et al.62. Three subsamples of each soil sample were preparedby adding deionised water and one anion-exchange membrane. One of the threesubsamples was additionally mixed with hexanol as fumigation reagent (PHex)and one with a P spike (PSpike), while nothing was added to the last subsample(PH2O). Nitric acid was used to exchange the P adsorbed onto the membranes.Phosphate concentrations in solutions were measured with a continuous flow
analyser. We calculated microbial P concentrations as the difference betweenhexanol-fumigated and non-fumigated samples and accounted for P retentionduring extraction by including the P spike63. Because the calculated microbial Pconcentrations underestimate the amount of P stored in microbial biomassbecause of fumigation/extraction efficiency constraints e.g., with respect togram-positive bacteria, we divided calculated microbial P concentrations by0.462,64. We calculated stocks of P fractions and microbial P in soil based onbulk density [g m−2 (0.15 m soil depth)−1] and multiplication with therespective P concentrations [mg g−1]. Phosphorus exploitation was calculatedas the contribution [%] of organismic P stocks (either in the aboveground partof plants or microbes) to the sum of bioavailable P stocks (both organismic Pstocks + labile P stocks + moderately labile P stocks) according to Oelmannet al.8. The aboveground plant P stocks represent the plant demand of P that isremoved with the harvest(s) each year. It is reasonable to assume that microbialP stocks in soil can also be regarded as the annual microbial P demand since ithas been shown that the microbial P stock in soil turns over once every growingseason irrespective of management39.
In the biodiversity experiment, phosphomonoesterase (PAse) activity wasmeasured according to the modified assay of Eivazi and Tabatabai65. For each soilsample, one replicate and one blank value were included in the laboratory study.We incubated soil samples with p-nitrophenylphosphate as an organic substrate forenzyme activity (pH= 11). p-nitrophenylphosphate was added to blanks only afterincubation. Directly after filtration, p-nitrophenol concentrations were measuredwith a spectrophotometer. In agricultural grasslands, PAse activity was determinedby fluorescence measures in a buffered solution of pH 6.1 after Marx et al.66, asdescribed in Berner et al.67.
In the biodiversity experiment, the fungal-to-bacterial ratio was assessed byapplying the phospholipid fatty acids (PLFA) method68. Within 48 h after sampling,the soil was kept at 4 °C, sieved to 2mm, remains of roots were manually removedand the samples were stored at −20 °C until further sample processing. PLFA wereextracted according to the method of Bligh and Dyer69 as modified by Kramer andGleixner70. As an indicator for fungal PLFA 18:2ω6,9 was used71,72. The bacterialPLFA was calculated as sum of the PLFA markers 14:0i, 15:0i, 15:0a, 16:0i, c16:1ω7c,17:1, 17:0i, 17:0a and 18:1ω7 (Frostegard & Baath 1996). Furthermore, AMF speciesrichness and relative abundance in the biodiversity experiment was investigated in soilsamples (0–15 cm depth) collected in 2010 and analysed using DNA extraction andamplicon sequencing by 454-pyrosenquencing as described in Dassen et al.73. Weamplified 18 S rRNA gene fragments from fungi and protists with primer FR 1 andthe modified version of FF390 designed to also include the Glomeromycotacomprising AMF74 (Supplementary Table 3). In agricultural grasslands, AMF wereidentified based on DNA extraction. DNA was extracted from soil of each plot usingthe MO BIO Power Soil DNA isolation kit (MO BIO Laboratories, Carlsbad, CA,USA) following the manufacturer’s protocol. Afterwards we used a nested PCRapproach to amplify fungal 18S-rDNA by using the primer pairs GlomerWT0/Glomer153675 and NS31/AML276,77 (Supplementary Table 3), containing theIllumina adapter sequences. PCR products were then purified, cleaned and sequencedusing Illumina MiSeq. The AMF sequences were processed using a customizedbioinformatic pipeline following MOTHUR SOP (using Version 1.39.5) asimplemented in DeltaMP (https://github.com/lentendu/DeltaMP). The taxonomicalassignment was done against the MaarjAM database (https://maarjam.botany.ut.ee/).AMF OTUs were merged according to VT assignment. OTUs assigned only to genuslevel were kept as OTUs. Only those AMF appearing on more than five plots wereconsidered. AMF species richness was calculated as the number of species includingOTUs. The relative abundance of AMF was calculated by relating the reads perspecies/OTU to the total sum of reads across all plots. AMF appearing on less thanfive plots had low relative abundances (<1%) and thus, were considered to play anegligible role. Accordingly, only those AMF appearing on more than five plots wereincluded. AMF species richness was calculated as the number of species includingOTUs. The relative abundance of AMF was calculated by relating the reads perspecies/OTU to the total sum of reads across all plots.
Statistical analyses. Normal distribution of the variables and the homo-scedasticity of the models were visually inspected and if necessary, variables werelog-transformed to meet the prerequisite for statistical analyses (SupplementaryTables 1, 2). Pearson correlations were calculated applying the corr.test function inthe R library psych66. The Pearson correlations were corrected for multipleinference using the Benjamini & Hochberg correction. Using the R librarypiecewiseSEM78, confirmatory path analyses were applied to test the causal rela-tionships between plant diversity and P exploitation in the biodiversity experimentand in the agricultural grasslands and how land-use intensity impacts this relationin the latter. To identify the processes underlying the plant diversity and the landuse intensity effects on P exploitation, we set up conceptual path models for each,the biodiversity experiment and the agricultural grasslands (Supplementary Figs. 1and 2; Table 1). The models include AMF species richness, relative AMF abun-dance, Corg stocks, plant P stocks and microbial P stocks as possible mediators. Toaccount for the block design of the biodiversity experiment and the two regionsconsidered in the agricultural grasslands, block was fitted as a random factor in thebiodiversity experiment models and region as a random effect in the agriculturalgrassland models. Furthermore, we checked for spatial autocorrelation within eachregion. To this end, we related the residuals associated to each variable in the SEM
ARTICLE NATURE COMMUNICATIONS | https://doi.org/10.1038/s41467-021-24714-4
6 NATURE COMMUNICATIONS | (2021) 12:4431 | https://doi.org/10.1038/s41467-021-24714-4 | www.nature.com/naturecommunications

to the geographic coordinates of each plot. Since we found no indications ofrelationships or clustering of the residuals, we assumed independent data withinthe regions of the agricultural grasslands. In order to test whether the conceptualmodels adequately represent the measured data Fisher’s C test statistic was used.To obtain adequate models the conceptual models were updated stepwise byincluding missing paths as indicated by the tests of directed separation78. Details ofthe outcome of the SEMs in addition to that provided in Fig. 1 can be found inSupplementary Tables 4, 5 and 6.
Reporting summary. Further information on research design is available in the NatureResearch Reporting Summary linked to this article.
Data availabilityThis work is based on data from several projects of the Biodiversity Exploratoriesprogramme (DFG Priority Program 1374) and The Jena Experiment (DFG FOR 456 &1451). The data used for analyses are publicly available from the BiodiversityExploratories Information System (https://doi.org/10.17616/R32P9Q) and the jexisdatabase (https://jexis.idiv.de/), respectively, or will become publicly available after anembargo period of five years from the end of data assembly to give the owners andcollectors of the data time to perform their analysis. The raw AMF Illumina sequencesfor the Biodiversity Exploratories have been deposited in the National Center forBiotechnology Information (NCBI) Sequence Read Archive (SRA) under BioProjectaccession number PRJNA706003. Microbial community data of the Jena Experimenthave been archived in the Pangaea database (https://doi.org/10.1594/pangaea.874990).Any other relevant data are available from the corresponding author upon reasonablerequest.
Received: 29 June 2020; Accepted: 25 June 2021;
References1. Cardinale, B. J. et al. Biodiversity loss and its impact on humanity. Nature 486,
59–67 (2012).2. Hooper, D. U. et al. Effects of biodiversity on ecosystem functioning: a
consensus of current knowledge. Ecol. Monogr. 75, 3–35 (2005).3. Isbell, F. et al. Linking the influence and dependence of people on biodiversity
across scales. Nature 546, 65–72 (2017).4. Loreau, M. & Hector, A. Partitioning selection and complementarity in
biodiversity experiments. Nature 412, 72–76 (2001).5. Bessler, H. et al. Nitrogen uptake by grassland communities: contribution of
N2 fixation, facilitation, complementarity, and species dominance. Plant Soil358, 301–322 (2012).
6. Karanika, E. D., Alifragis, D. A., Mamolos, A. P. & Veresoglou, D. S.Differentiation between responses of primary productivity and phosphorusexploitation to species richness. Plant Soil 297, 69–81 (2007).
7. Lange, M. et al. How plant diversity impacts the coupled water, nutrient andcarbon cycles. Adv. Ecol. Res. 61, 185–219 (2019).
8. Oelmann, Y. et al. Does plant diversity influence phosphorus cycling inexperimental grasslands? Geoderma 167-68, 178–187 (2011).
9. Tilman, D., Wedin, D. & Knops, J. Productivity and sustainability influencedby biodiversity in grassland ecosystems. Nature 379, 718–720 (1996).
10. Leimer, S., Oelmann, Y., Wirth, C. & Wilcke, W. Time matters for plantdiversity effects on nitrate leaching from temperate grassland. Agric Ecosyst.Environ. 211, 155–163 (2015).
11. Scherer-Lorenzen, M., Palmborg, C., Prinz, A. & Schulze, E.-D. The role ofplant diversity and composition for nitrate leaching in grasslands. Ecology 84,1539–1552 (2003).
12. Elser, J. & Bennett, E. A broken biogeochemical cycle. Nature 478, 29–31(2011).
13. Lambers, H., Mougel, C., Jaillard, B. & Hinsinger, P. Plant-microbe-soilinteractions in the rhizosphere: an evolutionary perspective. Plant Soil 321,83–115 (2009).
14. Wassen, M. J., Olde Venterink, H., Lapshina, E. D. & Tanneberger, F. Endangeredplants persist under phosphorus limitation. Nature 437, 547–550 (2005).
15. Cordell, D., Drangert, J.-O. & White, S. The story of phosphorus: Global foodsecurity and food for thought. Glob. Environ. Change-Hum. Policy Dimens. 19,292–305 (2009).
16. van der Heijden, M. G. A., Martin, F. M., Selosse, M.-A. & Sanders, I. R.Mycorrhizal ecology and evolution: the past, the present, and the future. N.Phytol. 205, 1406–1423 (2015).
17. van der Heijden, M. G. A. et al. Mycorrhizal fungal diversity determines plantbiodiversity, ecosystem variability and productivity. Nature 396, 69–72 (1998).
18. Richardson, A. E. & Simpson, R. J. Soil microorganisms mediatingphosphorus availability. Plant Physiol. 156, 989–996 (2011).
19. Hacker, N. et al. Plant diversity shapes microbe-rhizosphere effects on Pmobilisation from organic matter in soil. Ecol. Lett. 18, 1356–1365 (2015).
20. Hacker, N., Wilcke, W. & Oelmann, Y. The oxygen isotope composition ofbioavailable phosphate in soil reflects the oxygen isotope composition in soilwater driven by plant diversity effects on evaporation. Geochim. Cosmochim.Acta 248, 387–399 (2019).
21. Craven, D. et al. Plant diversity effects on grassland productivity are robust toboth nutrient enrichment and drought. Philos. Trans. R. Soc. B 371, 8 (2016).
22. Fridley, J. D. Resource availability dominates and alters the relationshipbetween species diversity and ecosystem productivity in experimental plantcommunities. Oecologia 132, 271–277 (2002).
23. Weigelt, A., Weisser, W. W., Buchmann, N. & Scherer-Lorenzen, M. Biodiversityfor multifunctional grasslands: equal productivity in high-diversity low-inputand low-diversity high-input systems. Biogeosciences 6, 1695–1706 (2009).
24. Nyfeler, D. et al. Strong mixture effects among four species in fertilizedagricultural grassland led to persistent and consistent transgressiveoveryielding. J. Appl Ecol. 46, 683–691 (2009).
25. Oelmann, Y., Vogel, A., Wegener, F., Weigelt, A. & Scherer-Lorenzen, M.Management intensity modifies plant diversity effects on N yield and mineralN in soil. Soil Sci. Soc. Am. J. 79, 559–568 (2015).
26. Manning P., et al. Transferring biodiversity-ecosystem function research tothe management of ‘real-world’ ecosystems. In: Mechanisms Underlying theRelationship between Biodiversity and Ecosystem Function (ed^(edsEisenhauer N., Bohan D. A., Dumbrell A. J.). Academic Press Ltd-ElsevierScience Ltd (2019).
27. Kraft, N. J. B. et al. Community assembly, coexistence and the environmentalfiltering metaphor. Funct. Ecol. 29, 592–599 (2015).
28. Allan, E. et al. Land use intensification alters ecosystem multifunctionality vialoss of biodiversity and changes to functional composition. Ecol. Lett. 18,834–843 (2015).
29. Collins, C. D. & Foster, B. L. Community-level consequences of mycorrhizaedepend on phosphorus availability. Ecology 90, 2567–2576 (2009).
30. Klironomos, J. N., McCune, J., Hart, M. & Neville, J. The influence ofarbuscular mycorrhizae on the relationship between plant diversity andproductivity. Ecol. Lett. 3, 137–141 (2000).
31. Busch, V. et al. Will I stay or will I go? Plant species-specific response andtolerance to high land-use intensity in temperate grassland ecosystems. J. Veg.Sci. 30, 674–686 (2019).
32. Sorkau, E. et al. The role of soil chemical properties, land use and plantdiversity for microbial phosphorus in forest and grassland soils. J. Plant Nutr.Soil Sci. 181, 185–197 (2018).
33. Wardle, D. A. A comparative assessment of factors which influence microbialbiomass carbon and nitrogen levels in soil. Biol. Rev. Camb. Philos. Soc. 67,321–358 (1992).
34. Lange, M. et al. Plant diversity increases soil microbial activity and soil carbonstorage. Nat. Commun. 6, 6707 (2015).
35. Eisenhauer, N. et al. Plant diversity effects on soil microorganisms support thesingular hypothesis. Ecology 91, 485–496 (2010).
36. Cleveland, C. C. & Liptzin, D. C. N: P stoichiometry in soil: is there a “Redfieldratio” for the microbial biomass? Biogeochemistry 85, 235–252 (2007).
37. Cardinale, B. J. et al. Impacts of plant diversity on biomass productionincrease through time because of species complementarity. Proc. Natl Acad.Sci. USA 104, 18123–18128 (2007).
38. Marquard, E. et al. Plant species richness and functional composition driveoveryielding in a 6-year grassland experiment. Ecology 90, 3290–3302 (2009).
39. Liebisch, F. et al. Seasonal dynamics and turnover of microbial phosphorus ina permanent grassland. Biol. Fertil. Soils 50, 465–475 (2014).
40. Boeddinghaus, R. S. et al. Plant functional trait shifts explain concurrentchanges in the structure and function of grassland soil microbial communities.J. Ecol. 107, 2197–2210 (2019).
41. Soussana, J. F. et al. Carbon cycling and sequestration opportunities intemperate grasslands. Soil Use Manag. 20, 219–230 (2004).
42. Waldrop, M. P., Zak, D. R., Blackwood, C. B., Curtis, C. D. & Tilman, D.Resource availability controls fungal diversity across a plant diversity gradient.Ecol. Lett. 9, 1127–1135 (2006).
43. Kour, D. et al. Biodiversity, current developments and potentialbiotechnological applications of phosphorus-solubilizing and -mobilizingmicrobes: a review. Pedosphere 31, 43–75 (2021).
44. Dijkstra, F. A., He, M. Z., Johansen, M. P., Harrison, J. J. & Keitel, C. Plant andmicrobial uptake of nitrogen and phosphorus affected by drought using N-15and P-32 tracers. Soil Biol. Biochem. 82, 135–142 (2015).
45. Hiiesalu, I. et al. Species richness of arbuscular mycorrhizal fungi: associationswith grassland plant richness and biomass. N. Phytol. 203, 233–244 (2014).
46. Tilman, D., Cassman, K. G., Matson, P. A., Naylor, R. & Polasky, S. Agriculturalsustainability and intensive production practices. Nature 418, 671–677 (2002).
47. Roscher, C. et al. The role of biodiversity for element cycling and trophicinteractions: an experimental approach in a grassland community. Bas Appl.Ecol. 5, 107–121 (2004).
NATURE COMMUNICATIONS | https://doi.org/10.1038/s41467-021-24714-4 ARTICLE
NATURE COMMUNICATIONS | (2021) 12:4431 | https://doi.org/10.1038/s41467-021-24714-4 |www.nature.com/naturecommunications 7

48. Hoffmann K., Bivour W., Früh B., Koßmann M., Voß P.-H. Climate studies inJena for adaption to climate change and ist expected consequences. (InGerman). Selbstverlag des Deutschen Wetterdienstes (2014).
49. IUSS Working Group WRB. World Reference Base for Soil Resources 2014,update 2015: International soil classification system for naming soils andcreating legends for soil maps. FAO (2015).
50. Fischer, M. et al. Implementing large-scale and long-term functionalbiodiversity research: the biodiversity exploratories. Bas Appl Ecol. 11,473–485 (2010).
51. Alt, F., Oelmann, Y., Herold, N., Schrumpf, M. & Wilcke, W. Phosphoruspartitioning in grassland and forest soils of Germany as related to land-usetype, management intensity, and land use-related pH. J. Plant Nutr. Soil Sci.174, 195–209 (2011).
52. Vogt, J. et al. Eleven years’ data of grassland management in Germany.Biodiver Data J. 7, 38 (2019).
53. Alt, F., Oelmann, Y., Schöning, I. & Wilcke, W. Phosphate release kinetics atstable pH in calcareous grassland and forest soils. Soil Sci. Soc. Am. J. 77,2060–2070 (2013).
54. Jones J. B., Wolf B., Mills H. A. Plant analysis handbook. Micro MacroPublishing (1991).
55. Marina, M. A. & Lopez, M. C. B. Determination of phosphorus in rawmaterials for ceramics: comparison between X-ray fluorescence spectrometryand inductively coupled plasma-atomic emission spectrometry. Anal. Chim.Acta 432, 157–163 (2001).
56. Hedley, M. J., Stewart, J. W. B. & Chauhan, B. S. Changes in inorganic andorganic soil-phosphorus fractions induced by cultivation practices and bylaboratory incubations. Soil Sci. Soc. Am. J. 46, 970–976 (1982).
57. Kuo S. Phosphorus. In: Methods of Soil Analysis - Part 3 Chemical Methods(eds Sparks D. L., et al.). SSSA (1996).
58. Cross, A. F. & Schlesinger, W. H. A literature review and evaluation of theHedley fractionation - applications to the biogeochemical cycle of soilphosphorus in natural ecosystems. Geoderma 64, 197–214 (1995).
59. Negassa, W. & Leinweber, P. How does the Hedley sequential phosphorusfractionation reflect impacts of land use and management on soil phosphorus:a review. J. Plant Nutr. Soil Sci. 172, 305–325 (2009).
60. Murphy, J. & Riley, J. P. A modified single solution method for determinationof phosphate in natural waters. Anal. Chim. Acta 26, 31–36 (1962).
61. McLaughlin, M. J., Alston, A. M. & Martin, J. K. Measurement of phosphorusin the soil microbial biomass - a modified procedure for field soils. Soil Biol.Biochem. 18, 437–443 (1986).
62. Kouno, K., Tuchiya, Y. & Ando, T. Measurement of soil microbial biomassphosphorus by an anion exchange membrane method. Soil Biol. Biochem. 27,1353–1357 (1995).
63. Bünemann, E. K., Marschner, P., Smernik, R. J., Conyers, M. & McNeill, A. M.Soil organic phosphorus and microbial community composition as affected by26 years of different management strategies. Biol. Fertil. Soils 44, 717–726 (2008).
64. Brookes, P. C., Powlson, D. S. & Jenkinson, D. S. Measurement of microbialbiomass phosphorus in soil. Soil Biol. Biochem 14, 319–329 (1982).
65. Eivazi, F. & Tabatabai, M. A. Phosphatases in soils. Soil Biol. Biochem. 9,167–172 (1977).
66. Marx, M. C., Wood, M. & Jarvis, S. C. A microplate fluorimetric assay for thestudy of enzyme diversity in soils. Soil Biol. Biochem. 33, 1633–1640 (2001).
67. Berner, D. et al. Land-use intensity modifies spatial distribution and functionof soil microorganisms in grasslands. Pedobiologia 54, 341–351 (2011).
68. White, D. C., Davis, W. M., Nickels, J. S., King, J. D. & Bobbie, R. J.Determination of the sedimentary microbial biomass by extractable lipidphosphate. Oecologia 40, 51–62 (1979).
69. Bligh, E. G. & Dyer, W. J. A rapid method of total lipid extraction andpurification. Can. J. Biochem. Physiol. 37, 911–917 (1959).
70. Kramer, C. & Gleixner, G. Variable use of plant- and soil-derived carbon bymicroorganisms in agricultural soils. Soil Biol. Biochem. 38, 3267–3278 (2006).
71. Frostegard, A. & Baath, E. The use of phospholipid fatty acid analysis to estimatebacterial and fungal biomass in soil. Biol. Fertil. Soils 22, 59–65 (1996).
72. Zelles, L. Identification of single cultured micro-organisms based on theirwhole-community fatty acid profiles, using an extended extraction procedure.Chemosphere 39, 665–682 (1999).
73. Dassen, S. et al. Differential responses of soil bacteria, fungi, archaea andprotists to plant species richness and plant functional group identity. Mol.Ecol. 26, 4085–4098 (2017).
74. Kuramae, E. E. et al. Tracking fungal community responses to maize plants byDNA- and RNA-based pyrosequencing. PLoS ONE 8, 8 (2013).
75. Wubet, T., Weiss, M., Kottke, I. & Oberwinkler, F. Two threatened coexistingindigenous conifer species in the dry Afromontane forests of Ethiopia areassociated with distinct arbuscular mycorrhizal fungal communities. Can. J.Bot.-Rev. Canadienne De. Botanique 84, 1617–1627 (2006).
76. Lee, J., Lee, S. & Young, J. P. W. Improved PCR primers for the detection andidentification of arbuscular mycorrhizal fungi. FEMS Microbiol. Ecol. 65,339–349 (2008).
77. Simon, L., Lalonde, M. & Bruns, T. D. Specific amplification of 18S fungalribosomal genes from vesicular-arbuscular endomycorrhizal fungi colonizingroots. Appl. Environ. Microbiol. 58, 291–295 (1992).
78. Lefcheck, J. S. PIECEWISESEM: Piecewise structural equation modelling in Rfor ecology, evolution, and systematics. Methods Ecol. Evol. 7, 573–579 (2016).
79. van der Heijden, M. G. A. et al. The mycorrhizal contribution to plantproductivity, plant nutrition and soil structure in experimental grassland. N.Phytol. 172, 739–752 (2006).
80. Frew, A. Arbuscular mycorrhizal fungal diversity increases growth andphosphorus uptake in C-3 and C-4 crop plants. Soil Biol. Biochem. 135,248–250 (2019).
81. Hedlund, K. et al. Plant species diversity, plant biomass and responses of thesoil community on abandoned land across Europe: idiosyncracy or above-belowground time lags. Oikos 103, 45–58 (2003).
82. Treseder, K. K. The extent of mycorrhizal colonization of roots and itsinfluence on plant growth and phosphorus content. Plant Soil 371, 1–13(2013).
83. Köhl, L., Oehl, F. & van der Heijden, M. G. A. Agricultural practices indirectlyinfluence plant productivity and ecosystem services through effects on soilbiota. Ecol. Appl. 24, 1842–1853 (2014).
84. Fornara, D. A. & Tilman, D. Plant functional composition influences rates ofsoil carbon and nitrogen accumulation. J. Ecol. 96, 314–322 (2008).
85. Steinbeiss, S. et al. Plant diversity positively affects short-term soil carbonstorage in experimental grasslands. Glob. Change Biol. 14, 2937–2949 (2008).
86. Hacker N. Phosphorus Release Mechanisms in an Experimental Grassland ofVarying Biodiversity. Doctoral thesis, University of Tübingen, Germany(2017).
AcknowledgementsWe thank all people who helped with the setup and management of the Jena Experiment(biodiversity experiment) and in particular the initiators, E.-D. Schulze, B. Schmid, andW.W. Weisser. Thanks also to all the helpers who assisted during the weeding cam-paigns. The Jena Experiment is funded by the Deutsche Forschungsgemeinschaft (DFG,FOR 456 & 1451) with additional support from the Swiss National Science Foundation(SNF), the Friedrich Schiller University Jena and the Max Planck Society. NEacknowledges support by the German Centre for Integrative Biodiversity ResearchHalle–Jena–Leipzig, funded by the German Research Foundation (FZT 118). M.L.gratefully acknowledges the support of the Zwillenberg-Tietz Foundation. We furtherthank A. Hemp, S. Gockel, M. Gorke, K. Lorenzen, K. Reichel-Jung, S. Renner, I. Steitz, F.Straub, M. Teuscher, J. Vogt, S. Weithmann, K. Wells and K. Wiesner (local managementteams), C. Fischer, M. Gleisberg, J. Mangels and S. Pfeiffer (central office), B. König-Ries,J. Nieschulze, A. Ostrowski and M. Owonibi (central database management), M. Fischer,D. Hessenmöller, E. Linsenmair, J. Nieschulze, E-D. Schulze, and the late E. Kalko fortheir roles in setting up the Biodiversity Exploratories program (agricultural grasslands),which was funded by the Deutsche Forschungsgemeinschaft Priority Program 1374Infrastructure-Biodiversity Exploratories. Fieldwork permits were given by the respon-sible state environmental offices of Baden-Württemberg, Thüringen, and Brandenburg(according to §72 BbgNatSchG). We are grateful to Barbara Schmitt, Stefan Blaser,Verena Busch, Helmut Hillebrand and Anne Ebeling for sharing their data.
Author contributionsY.O. and W.W. conceived the idea of this study. Y.O. and M.L. contributed equally to thedata analysis and writing of the manuscript. C.R., F.A. (Alt), N.B., D.B., S.B., R.S.B., F.B.,S.D., G.D.D., N.E., G.G., K.G., N.H., M.J., E.K., V.H.K., T.K., G.L.P., P.M., S.M., D.P.,D.S., I.S., M.S., E.S., C.W., T.W., namely all authors but F.A. (Aburto) and S.L. con-tributed data. Y.O., S.L. and M.L. performed the analyses. Y.O. performed the literaturesearch and wrote the first draft of the manuscript and all the authors contributed sub-stantially to the revisions.
Competing interestsThe authors declare no competing interests.
Additional informationSupplementary information The online version contains supplementary materialavailable at https://doi.org/10.1038/s41467-021-24714-4.
Correspondence and requests for materials should be addressed to Y.O.
Peer review information Nature Communications thanks Ning Ling, Maarja Öpik, andthe other, anonymous, reviewer(s) for their contribution to the peer review of this work.Peer reviewer reports are available.
Reprints and permission information is available at http://www.nature.com/reprints
Publisher’s note Springer Nature remains neutral with regard to jurisdictional claims inpublished maps and institutional affiliations.
ARTICLE NATURE COMMUNICATIONS | https://doi.org/10.1038/s41467-021-24714-4
8 NATURE COMMUNICATIONS | (2021) 12:4431 | https://doi.org/10.1038/s41467-021-24714-4 | www.nature.com/naturecommunications
Open Access This article is licensed under a Creative CommonsAttribution 4.0 International License, which permits use, sharing,
adaptation, distribution and reproduction in any medium or format, as long as you giveappropriate credit to the original author(s) and the source, provide a link to the CreativeCommons license, and indicate if changes were made. The images or other third partymaterial in this article are included in the article’s Creative Commons license, unlessindicated otherwise in a credit line to the material. If material is not included in thearticle’s Creative Commons license and your intended use is not permitted by statutoryregulation or exceeds the permitted use, you will need to obtain permission directly fromthe copyright holder. To view a copy of this license, visit http://creativecommons.org/licenses/by/4.0/.
© The Author(s) 2021
NATURE COMMUNICATIONS | https://doi.org/10.1038/s41467-021-24714-4 ARTICLE
NATURE COMMUNICATIONS | (2021) 12:4431 | https://doi.org/10.1038/s41467-021-24714-4 |www.nature.com/naturecommunications 9