Embed Size (px)
Citation preview

Air Permitting and Advanced Dispersion
Modeling Services
Ron Petersen, PhD, CCM Sergio Guerra, Ph.D.
Cell: 970 690 1344 Cell: 612 584 9595
[email protected] [email protected]
CPP, Inc.
2400 Midpoint Drive, Suite 190
Fort Collins, CO 80525
www.cppwind.com @CPPWindExperts
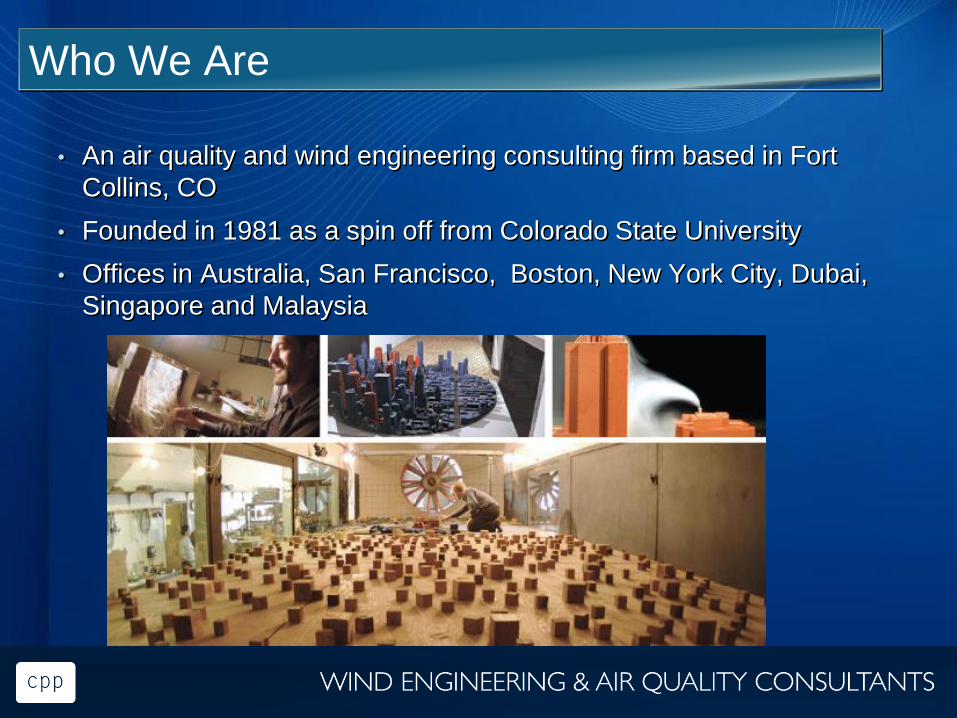
Who We Are
• An air quality and wind engineering consulting firm based in Fort
Collins, CO
• Founded in 1981 as a spin off from Colorado State University
• Offices in Australia, San Francisco, Boston, New York City, Dubai,
Singapore and Malaysia
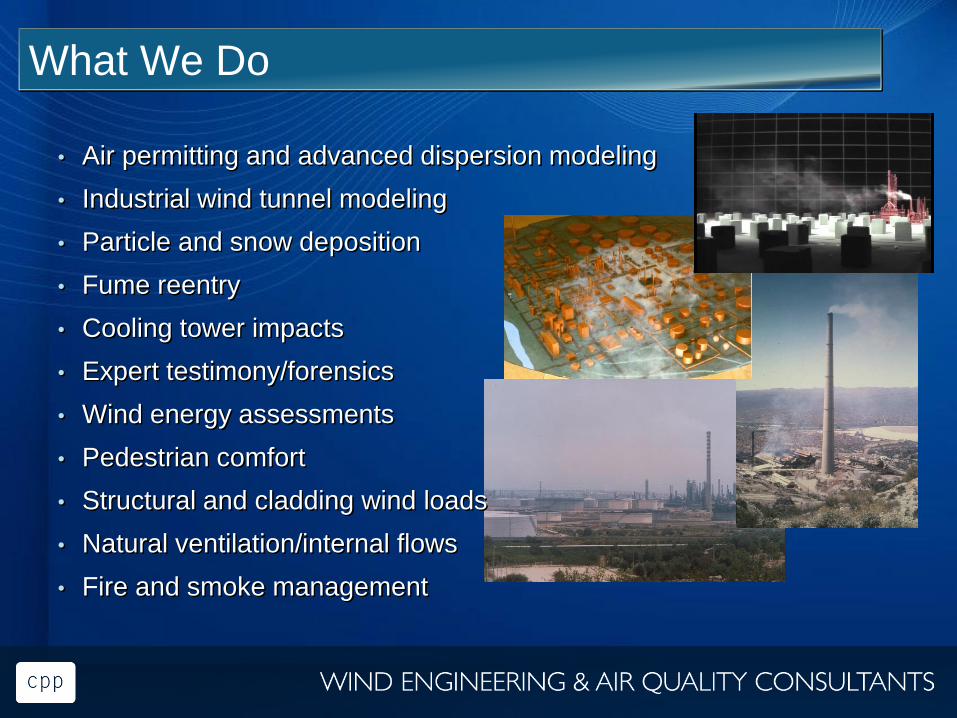
What We Do
• Air permitting and advanced dispersion modeling
• Industrial wind tunnel modeling
• Particle and snow deposition
• Fume reentry
• Cooling tower impacts
• Expert testimony/forensics
• Wind energy assessments
• Pedestrian comfort
• Structural and cladding wind loads
• Natural ventilation/internal flows
• Fire and smoke management
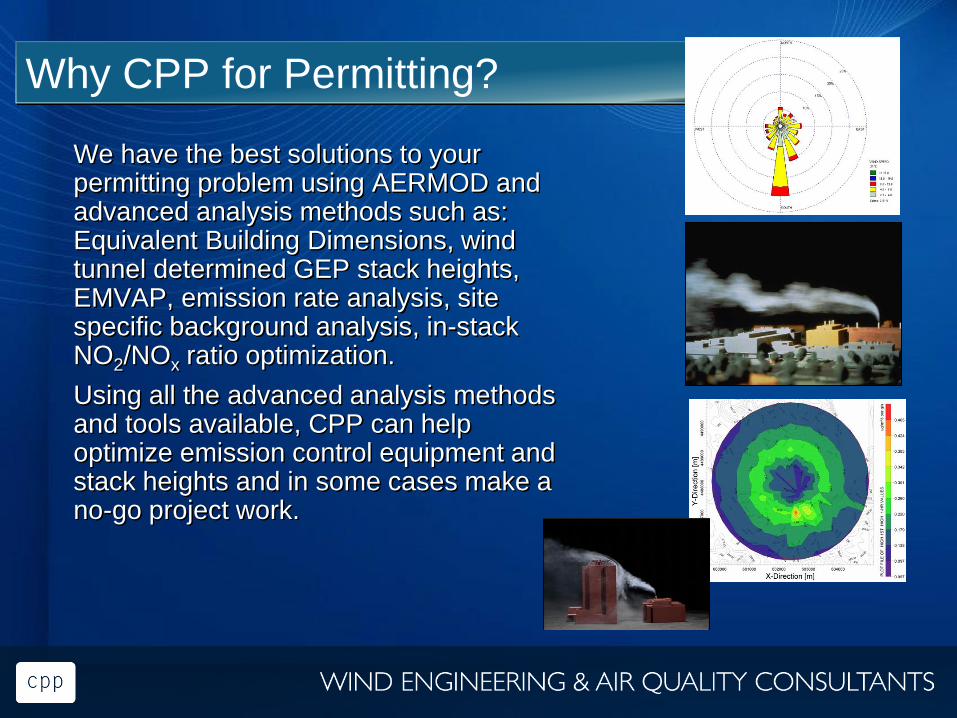
Why CPP for Permitting?
We have the best solutions to your permitting problem using AERMOD and advanced analysis methods such as: Equivalent Building Dimensions, wind tunnel determined GEP stack heights, EMVAP, emission rate analysis, site specific background analysis, in-stack NO2/NOx ratio optimization.
Using all the advanced analysis methods and tools available, CPP can help optimize emission control equipment and stack heights and in some cases make a no-go project work.
• NAAQS are more stringent
• Initial modeling may show your project exceeds the
Significant Impact Levels (SILs) >> will trigger
requirement for a detailed Air Quality Impact
Assessment
• AERMOD modeling is likely to show non-compliance
with NAAQS in many situations
• AERMOD tends to overpredict in many cases
Problem
Air Permitting
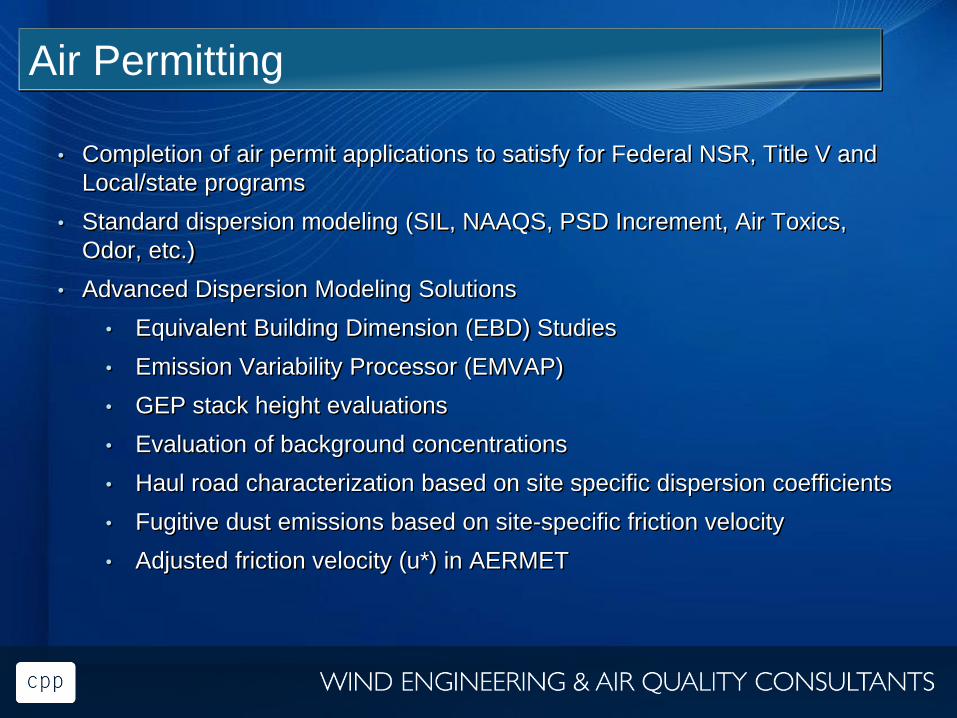
• Completion of air permit applications to satisfy for Federal NSR, Title V and
Local/state programs
• Standard dispersion modeling (SIL, NAAQS, PSD Increment, Air Toxics,
Odor, etc.)
• Advanced Dispersion Modeling Solutions
• Equivalent Building Dimension (EBD) Studies
• Emission Variability Processor (EMVAP)
• GEP stack height evaluations
• Evaluation of background concentrations
• Haul road characterization based on site specific dispersion coefficients
• Fugitive dust emissions based on site-specific friction velocity
• Adjusted friction velocity (u*) in AERMET

Standard AERMOD Modeling Process
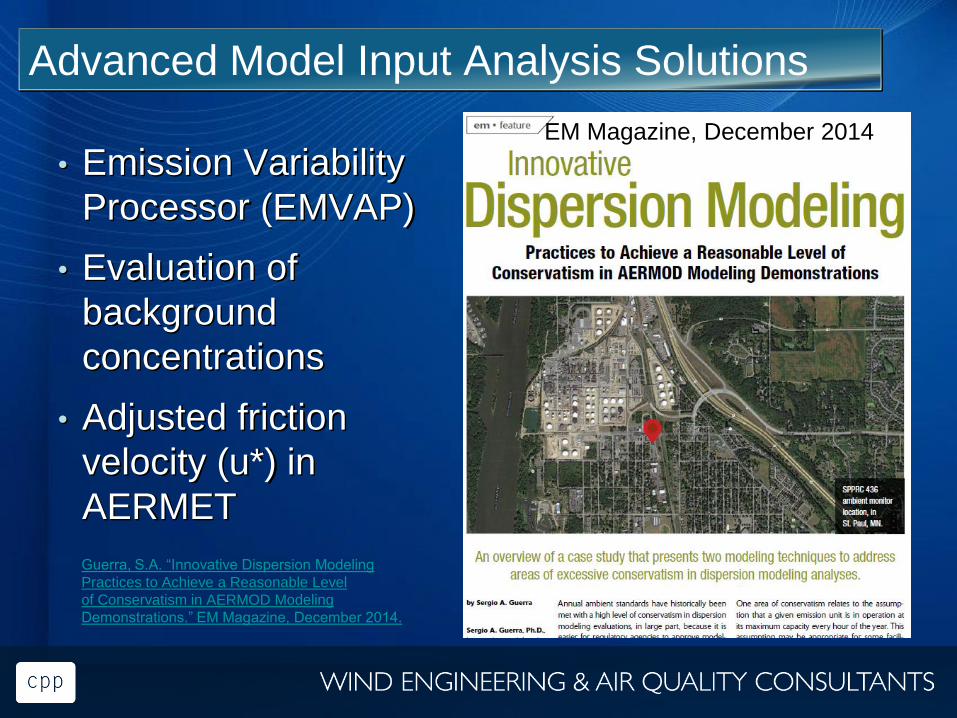
Advanced Model Input Analysis Solutions
• Emission Variability
Processor (EMVAP)
• Evaluation of
background
concentrations
• Adjusted friction
velocity (u*) in
AERMET
EM Magazine, December 2014
Guerra, S.A. “Innovative Dispersion Modeling
Practices to Achieve a Reasonable Level
of Conservatism in AERMOD Modeling
Demonstrations.” EM Magazine, December 2014.
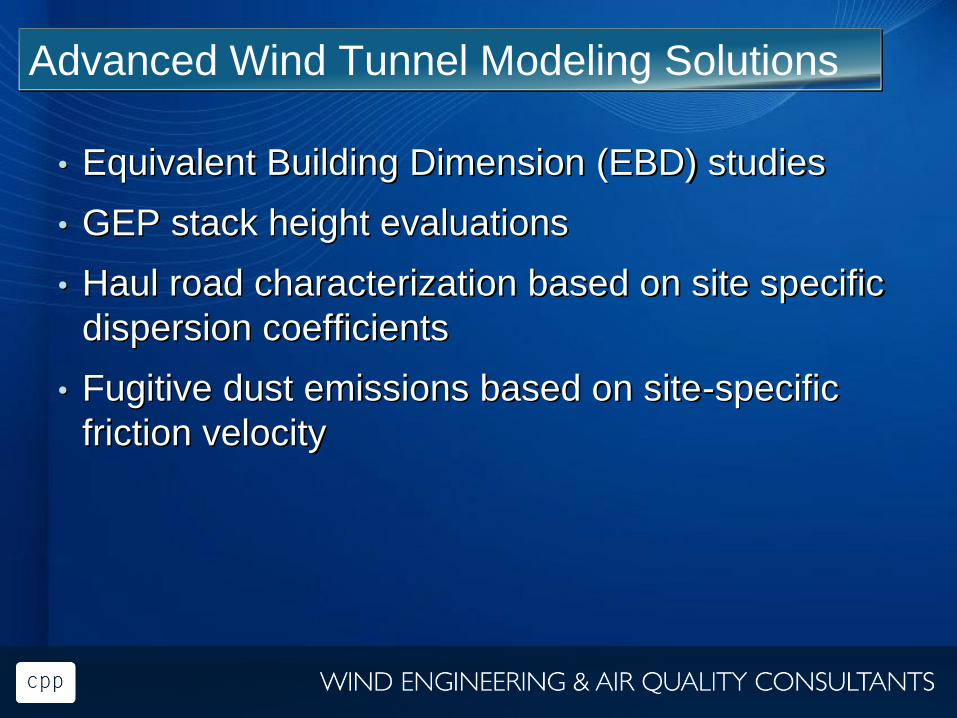
Advanced Wind Tunnel Modeling Solutions
• Equivalent Building Dimension (EBD) studies
• GEP stack height evaluations
• Haul road characterization based on site specific
dispersion coefficients
• Fugitive dust emissions based on site-specific
friction velocity

Basic Wind Tunnel Modeling Methodology
• Specify model operating conditions
• Construct scale model
• Install model in wind tunnel and
measure desired quantity
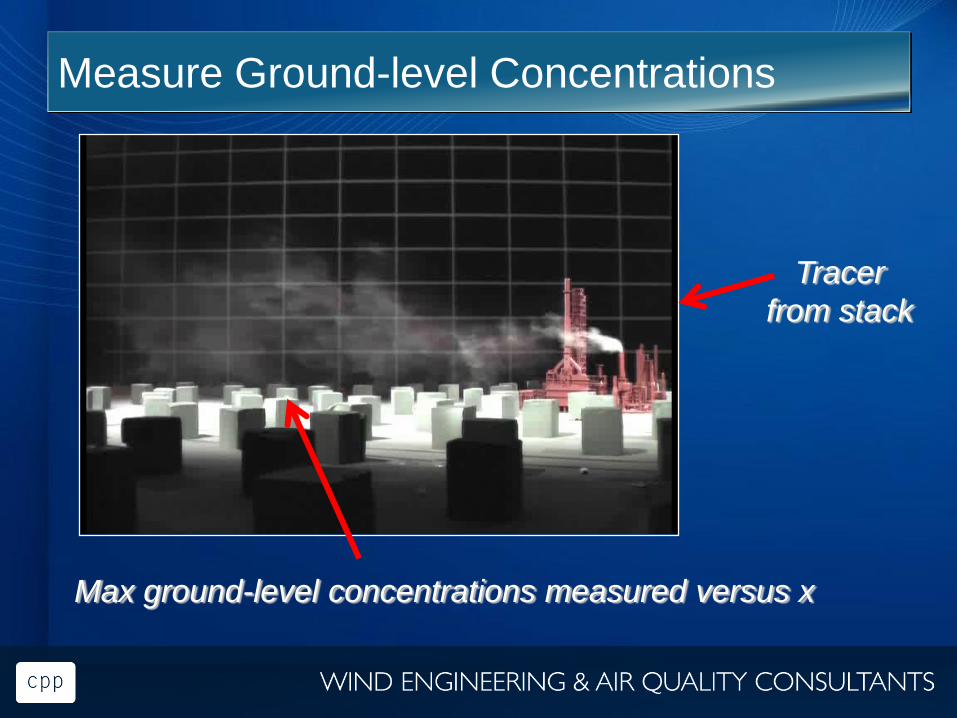
Measure Ground-level Concentrations
Tracer
from stack
Max ground-level concentrations measured versus x
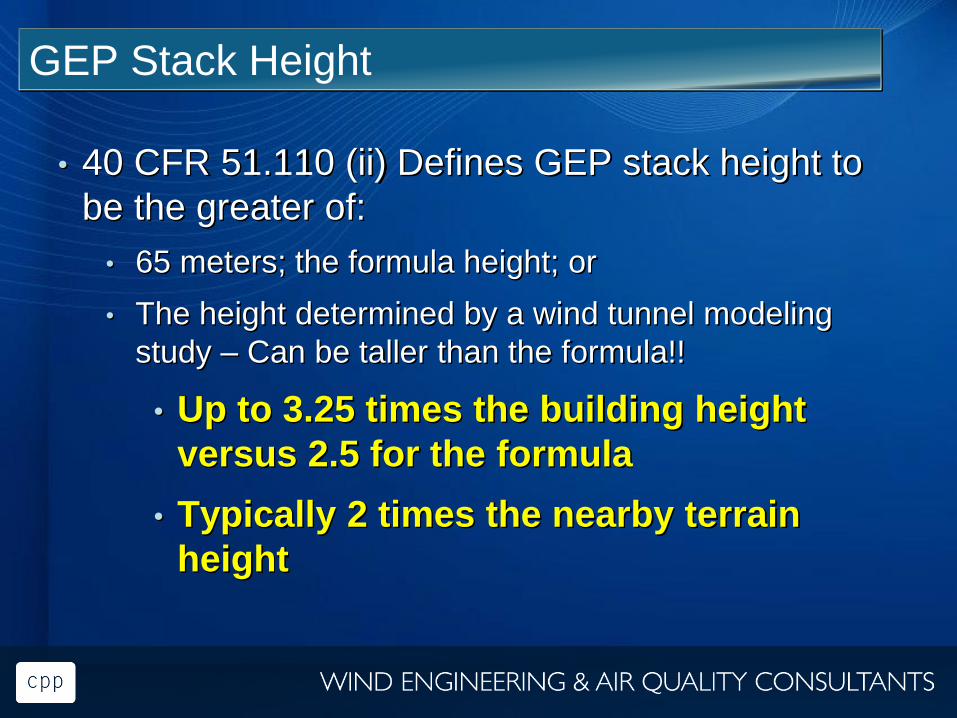
GEP Stack Height
• 40 CFR 51.110 (ii) Defines GEP stack height to
be the greater of:
• 65 meters; the formula height; or
• The height determined by a wind tunnel modeling
study – Can be taller than the formula!!
• Up to 3.25 times the building height
versus 2.5 for the formula
• Typically 2 times the nearby terrain
height
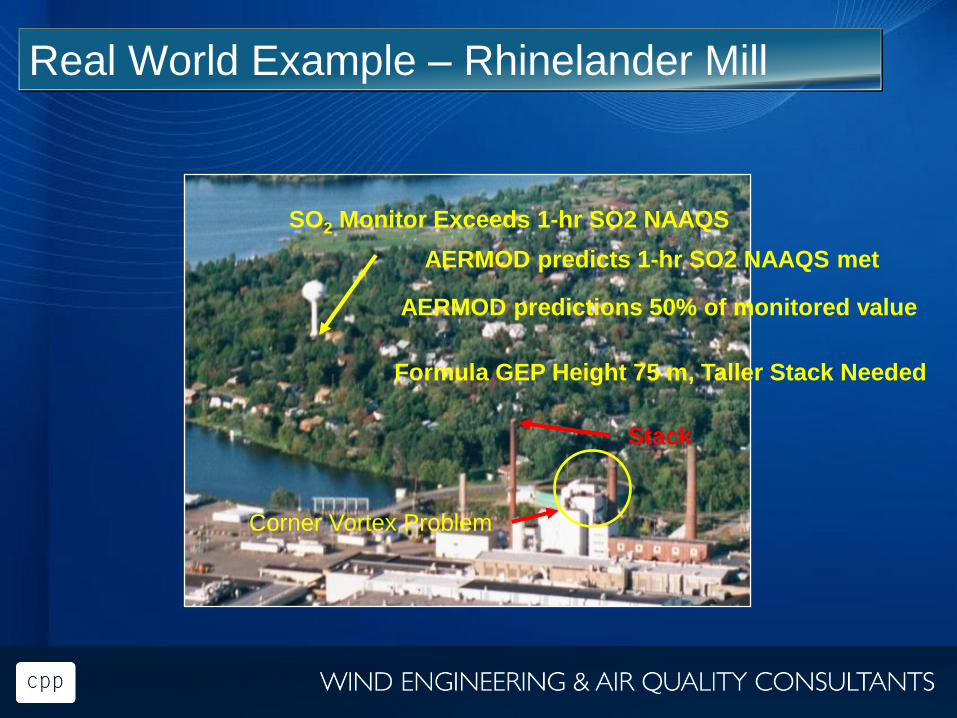
Real World Example – Rhinelander Mill
SO2 Monitor Exceeds 1-hr SO2 NAAQS
Stack
AERMOD predicts 1-hr SO2 NAAQS met
AERMOD predictions 50% of monitored value
Corner Vortex Problem
Formula GEP Height 75 m, Taller Stack Needed
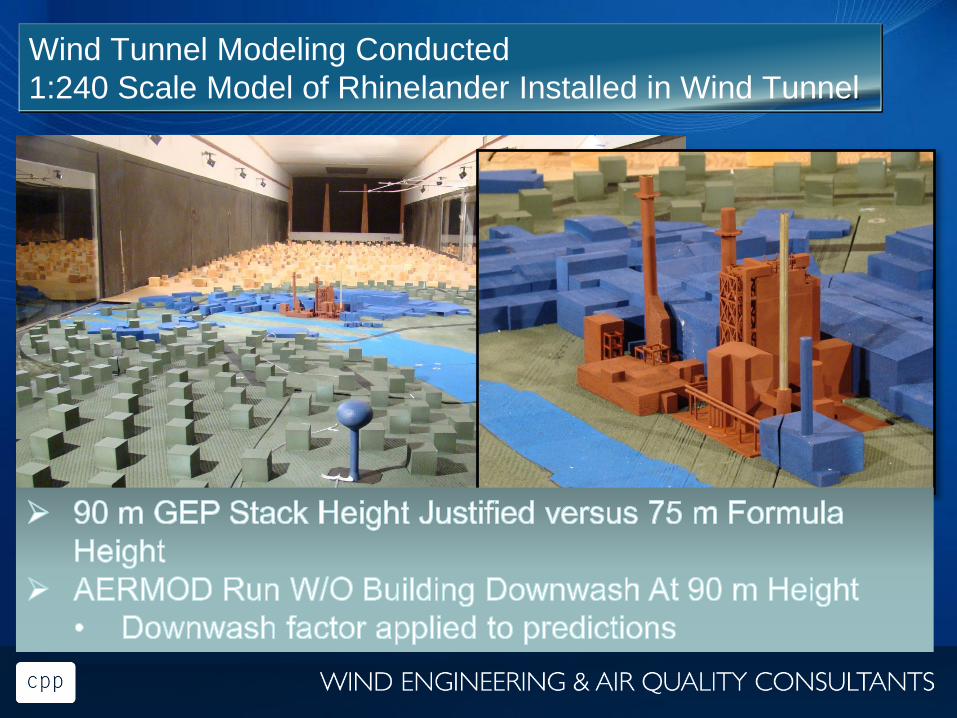
Wind Tunnel Modeling Conducted
1:240 Scale Model of Rhinelander Installed in Wind Tunnel
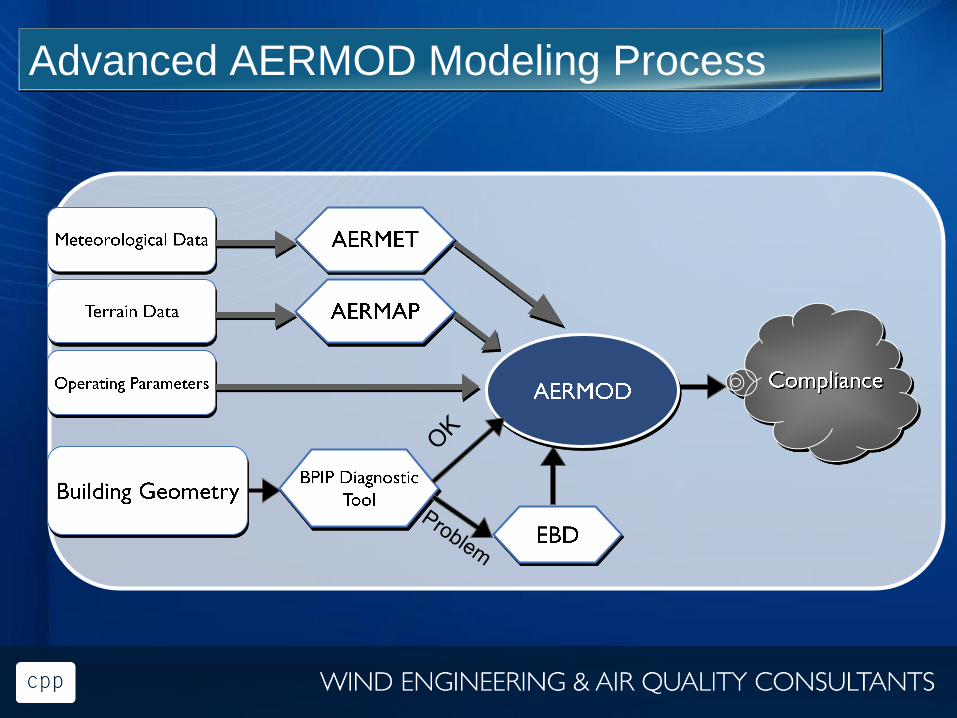
Advanced AERMOD Modeling Process
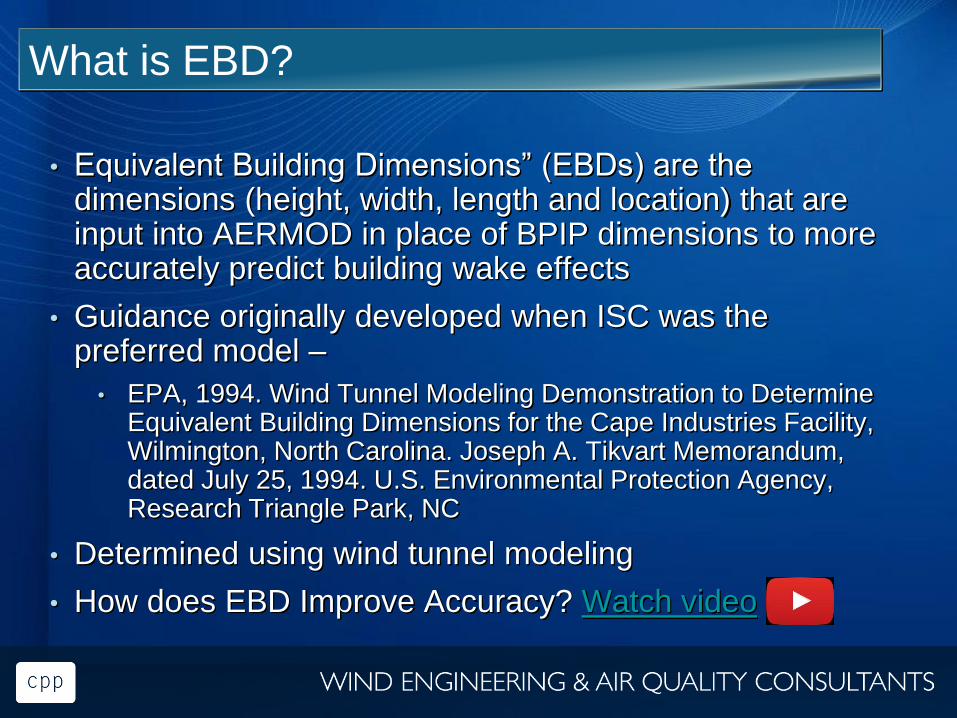
• Equivalent Building Dimensions” (EBDs) are the dimensions (height, width, length and location) that are input into AERMOD in place of BPIP dimensions to more accurately predict building wake effects
• Guidance originally developed when ISC was the preferred model –
• EPA, 1994. Wind Tunnel Modeling Demonstration to Determine Equivalent Building Dimensions for the Cape Industries Facility, Wilmington, North Carolina. Joseph A. Tikvart Memorandum, dated July 25, 1994. U.S. Environmental Protection Agency, Research Triangle Park, NC
• Determined using wind tunnel modeling
• How does EBD Improve Accuracy? Watch video
What is EBD?
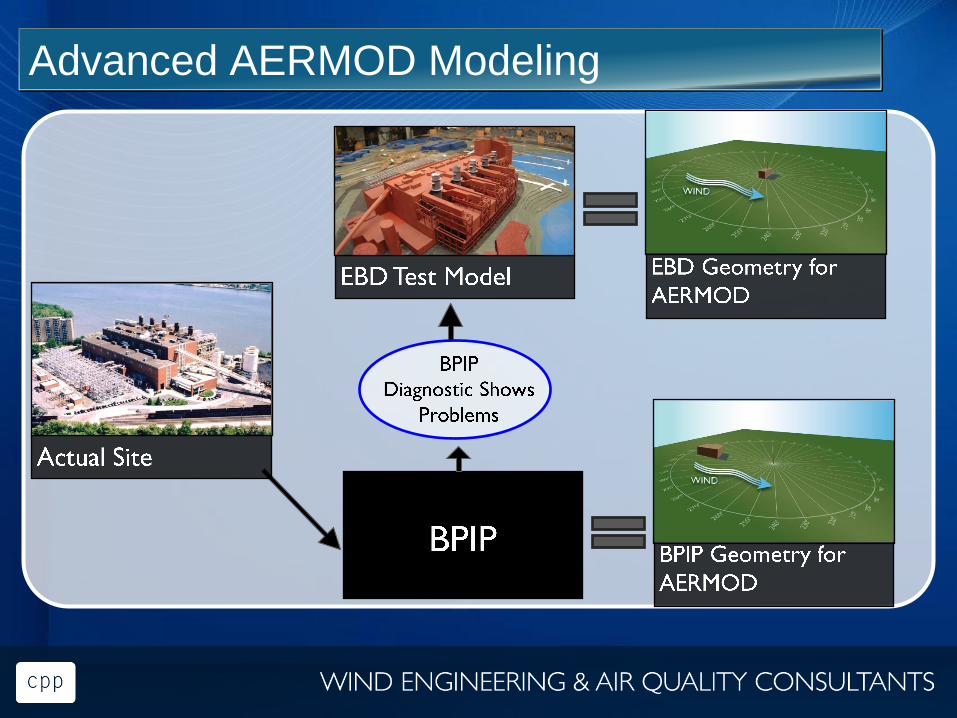
Advanced AERMOD Modeling
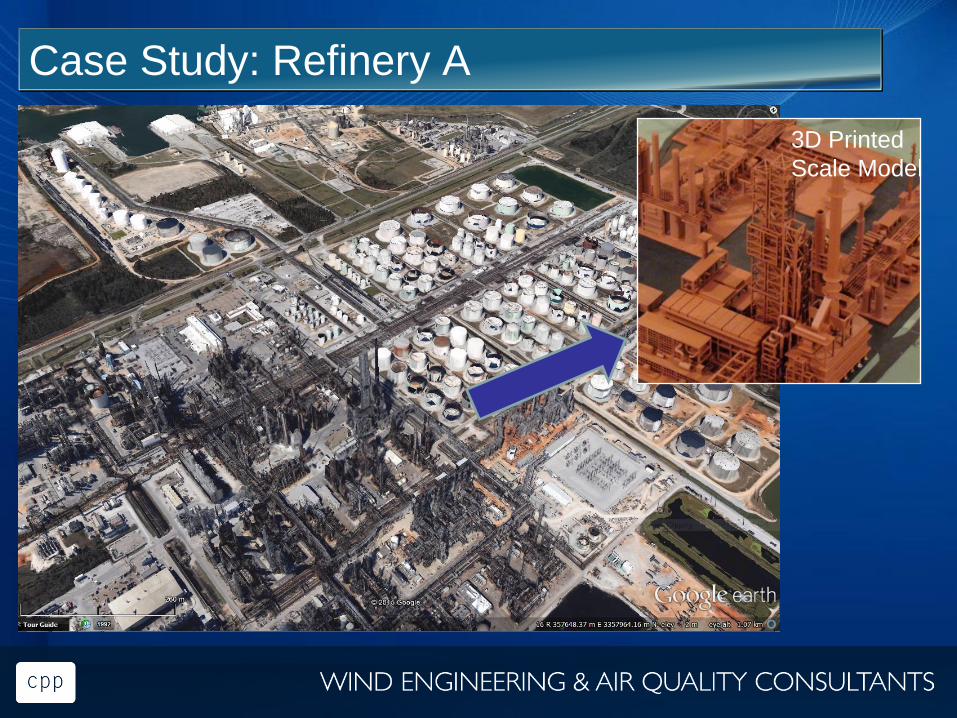
Case Study: Refinery A
3D Printed
Scale Model
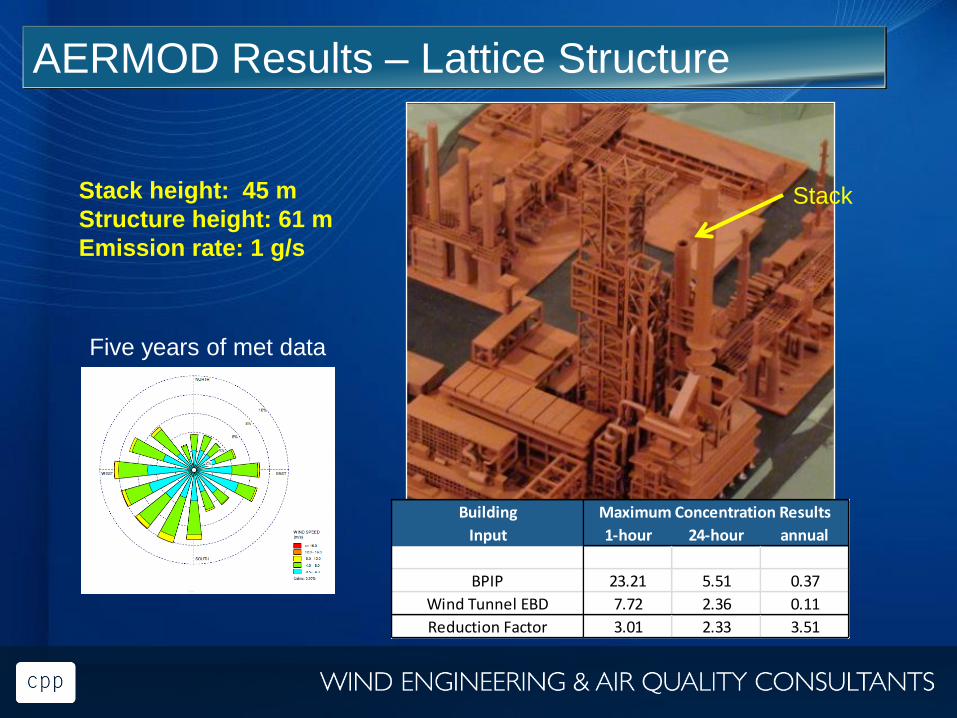
Stack height: 45 m
Structure height: 61 m
Emission rate: 1 g/s
Five years of met data
Stack
Building
Input 1-hour 24-hour annual
BPIP 23.21 5.51 0.37
Wind Tunnel EBD 7.72 2.36 0.11
Reduction Factor 3.01 2.33 3.51
Maximum Concentration Results
AERMOD Results – Lattice Structure
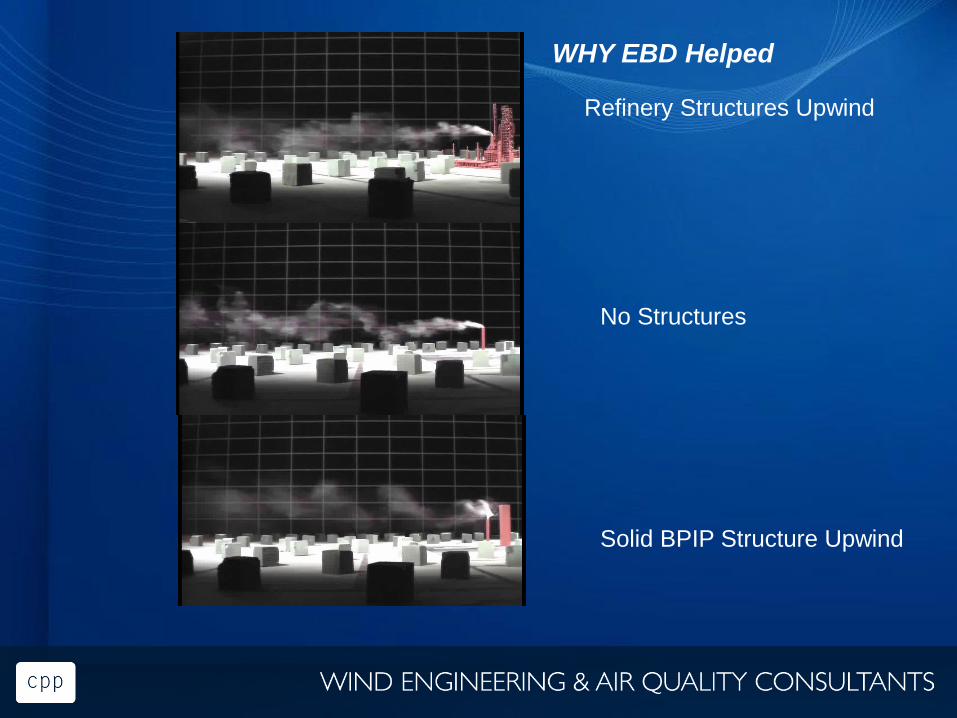
Refinery Structures Upwind
Solid BPIP Structure Upwind
No Structures
WHY EBD Helped
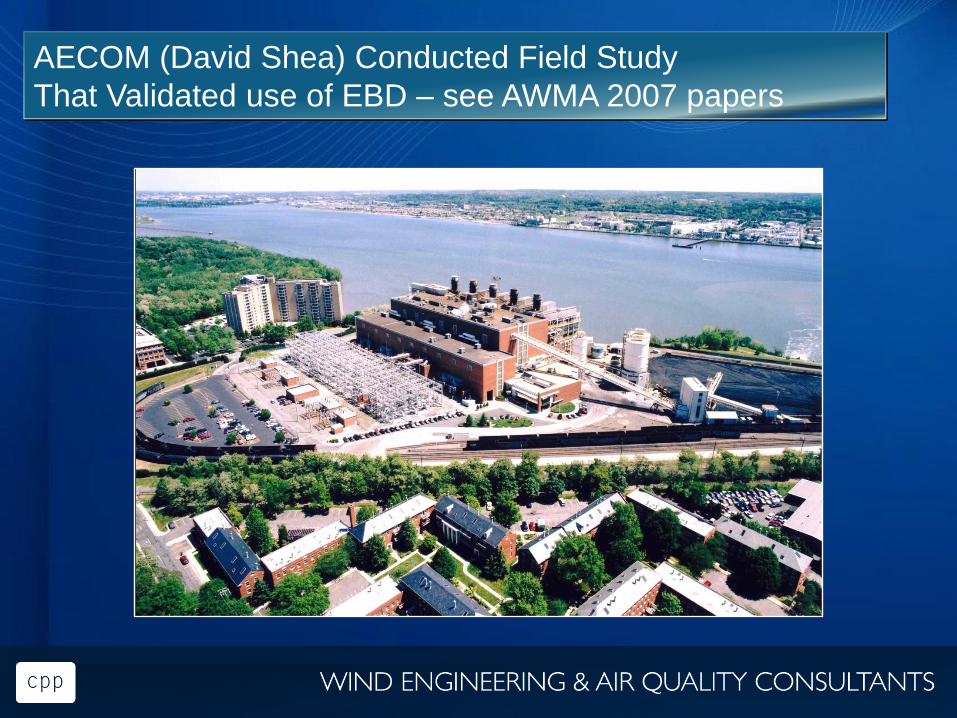
AECOM (David Shea) Conducted Field Study
That Validated use of EBD – see AWMA 2007 papers

• Short, wide and long buildings
• Wide and narrow buildings
• Lattice structures
• Streamlined structures
Other Examples Where AERMOD Overpredicts
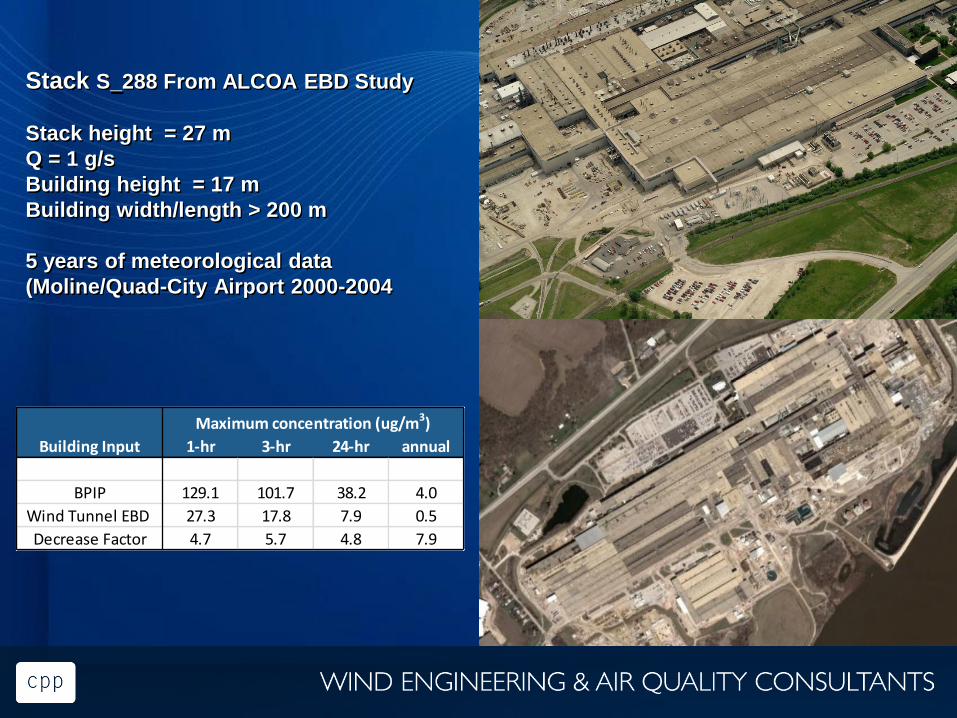
Stack S_288 From ALCOA EBD Study
Stack height = 27 m
Q = 1 g/s
Building height = 17 m
Building width/length > 200 m
5 years of meteorological data
(Moline/Quad-City Airport 2000-2004
Building Input 1-hr 3-hr 24-hr annual
BPIP 129.1 101.7 38.2 4.0
Wind Tunnel EBD 27.3 17.8 7.9 0.5
Decrease Factor 4.7 5.7 4.8 7.9
Maximum concentration (ug/m3)
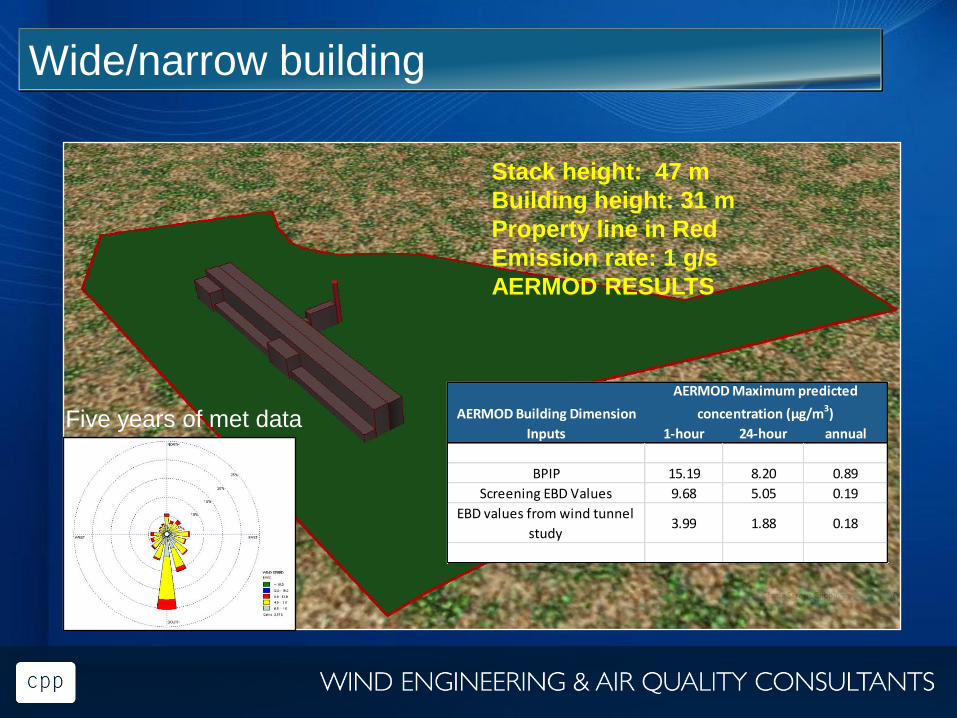
Stack height: 47 m
Building height: 31 m
Property line in Red
Emission rate: 1 g/s
AERMOD RESULTS
Five years of met data AERMOD Building Dimension
Inputs 1-hour 24-hour annual
BPIP 15.19 8.20 0.89
Screening EBD Values 9.68 5.05 0.19
EBD values from wind tunnel
study3.99 1.88 0.18
AERMOD Maximum predicted
concentration (μg/m3)
Wide/narrow building
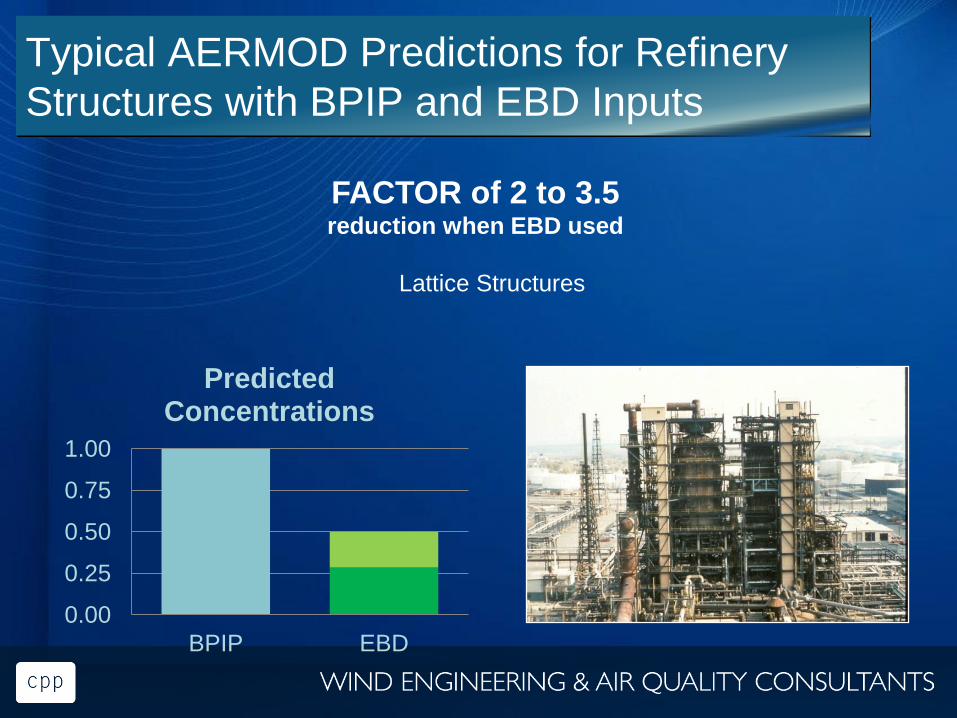
Typical AERMOD Predictions for Refinery
Structures with BPIP and EBD Inputs
0.00
0.25
0.50
0.75
1.00
BPIP EBD
Predicted Concentrations
FACTOR of 2 to 3.5 reduction when EBD used
Lattice Structures
0.00
0.25
0.50
0.75
1.00
BPIP EBD
Predicted Concentrations
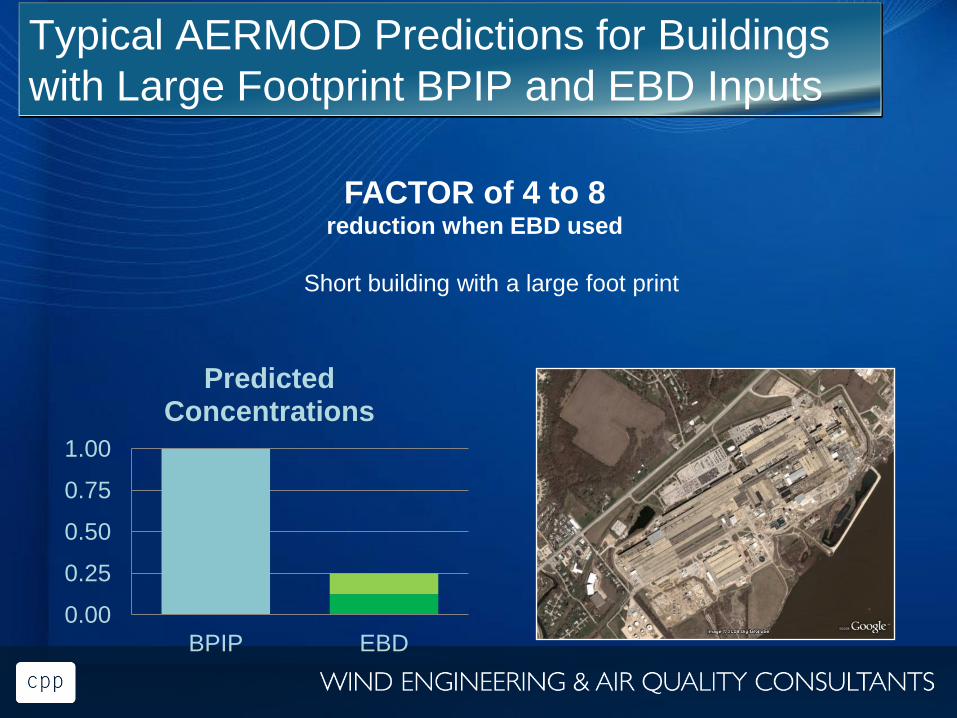
FACTOR of 4 to 8 reduction when EBD used
Short building with a large foot print
Typical AERMOD Predictions for Buildings
with Large Footprint BPIP and EBD Inputs
0.00
0.25
0.50
0.75
1.00
BPIP EBD
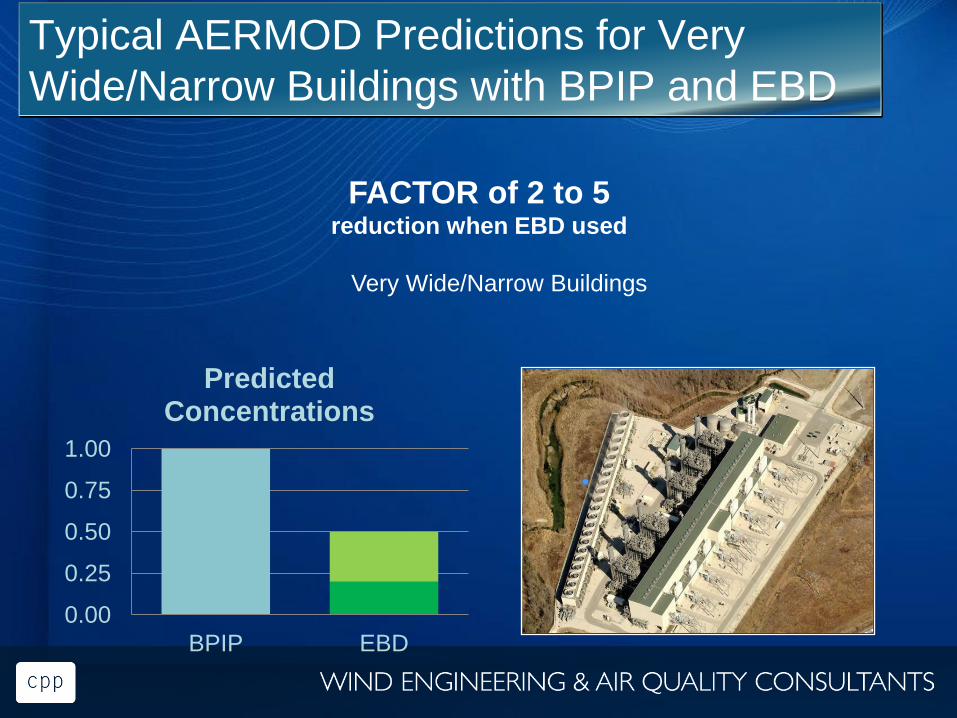
Predicted Concentrations
FACTOR of 2 to 5
reduction when EBD used
Very Wide/Narrow Buildings
Typical AERMOD Predictions for Very
Wide/Narrow Buildings with BPIP and EBD
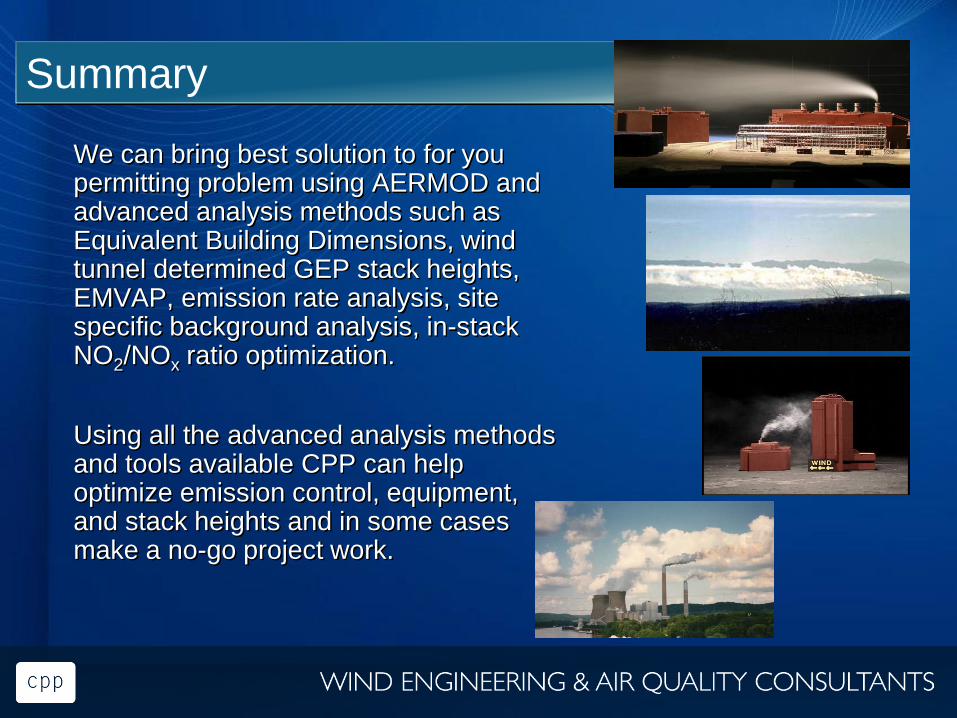
Summary
We can bring best solution to for you permitting problem using AERMOD and advanced analysis methods such as Equivalent Building Dimensions, wind tunnel determined GEP stack heights, EMVAP, emission rate analysis, site specific background analysis, in-stack NO2/NOx ratio optimization.
Using all the advanced analysis methods and tools available CPP can help optimize emission control, equipment, and stack heights and in some cases make a no-go project work.
Ron Petersen, PhD, CCM, FASHRAE Sergio Guerra, PhD [email protected] [email protected]
Mobile: + 970 690 1344 Mobile: + 612 584 9595
CPP, Inc.
2400 Midpoint Drive, Suite 190
Fort Collins, CO 80525
+ 970 221 3371
www.cppwind.com @CPPWindExperts
Questions?