Embed Size (px)
Citation preview
Version 12-4-15
Iowa Department of Natural Resources Environmental Services Division Air Quality Bureau
Air Dispersion Modeling Guidelines
For PSD Projects
Version 12-4-15
Table of Contents OVERVIEW ................................................................................................................................................. 1 THE MODELING PROTOCOL ................................................................................................................ 2
VOLATILE ORGANIC COMPOUND (VOC) EMISSIONS................................................................... 2
PRE-CONSTRUCTION MONITORING .................................................................................................. 2
POST-CONSTRUCTION MONITORING................................................................................................ 3
MODEL SELECTION AND OPTIONS .................................................................................................... 3
RECEPTOR INFORMATION ................................................................................................................... 3 AMBIENT AIR ............................................................................................................................................................. 3 RECEPTOR SPACING REQUIREMENTS .......................................................................................................................... 3 TERRAIN DATA ........................................................................................................................................................... 4
SOURCE INFORMATION ......................................................................................................................... 4 INDOOR VENTING EMISSION UNITS ............................................................................................................................ 4 FUGITIVE SOURCES .................................................................................................................................................... 4 COOLING TOWERS ...................................................................................................................................................... 5 OTHER NON-STANDARD TYPE EMISSION UNITS ........................................................................................................ 5 ANCILLARY SOURCES ................................................................................................................................................. 6 INTERMITTENT EMISSION UNITS AND THE 1-HOUR NOX AND SO2 NAAQS ............................................................... 6 AMBIENT CONDITIONS ............................................................................................................................................... 6 VARYING OPERATIONAL LOADS ................................................................................................................................ 6 BUILDING DOWNWASH............................................................................................................................................... 7
METEOROLOGICAL DATA .................................................................................................................... 7
DETERMINATION OF IMPACT ON AIR QUALITY ........................................................................... 8 PRELIMINARY MODELING ANALYSIS ......................................................................................................................... 8 FULL IMPACT ANALYSIS............................................................................................................................................. 8 SOURCE AND MODELING INVENTORIES ...................................................................................................................... 9 NAAQS MODELING ................................................................................................................................................. 11 SECONDARY PM2.5 IMPACTS ..................................................................................................................................... 12 PSD INCREMENT MODELING .................................................................................................................................... 12 NOX TIERING METHODS ........................................................................................................................................... 13
ADDITIONAL IMPACT ANALYSIS ...................................................................................................... 15 GROWTH ANALYSIS ................................................................................................................................................. 15 SOILS AND VEGETATION ANALYSIS ......................................................................................................................... 15 VISIBILITY ANALYSIS ............................................................................................................................................... 16 LEVEL-1 SCREENING ANALYSIS ................................................................................................................................... 16 LEVEL-2 SCREENING ANALYSIS ................................................................................................................................... 17 CONDENSATION PLUMES .......................................................................................................................................... 17
CLASS I AREA IMPACT ANALYSIS .................................................................................................... 17
MODELING DATA SUBMITTAL REQUIREMENTS ......................................................................... 18 SITE PLAN (CONSTRUCTION PERMIT FORM MI-1) .................................................................................................... 18 EMISSION RATES AND SOURCE PARAMETERS .......................................................................................................... 18 FILE FORMAT ........................................................................................................................................................... 19 MEDIA ...................................................................................................................................................................... 19
Version 12-4-15 1
Overview This document gives a general background of the modeling and additional impact requirements associated with a Prevention of Significant Deterioration (PSD) air quality assessment. Since every PSD project is unique, it is impossible to address the varied details of every modeling analysis. This document should only be used as a guideline for conducting an air quality analysis; applicants are responsible for accomplishing the analysis according to requirements set forth under 567 IAC Chapter 33. Additional information can be found in 40 CFR Part 52.21, 40 CFR Part 51 Appendix W, EPA’s draft “New Source Review Workshop Manual” October 1990, EPA’s “Workbook for Plume Visual Screening and Analysis (Revised)” October 1992 (EPA-454/R-92-023), and EPA’s website for the Technology Transfer Network (TTN) Support Center for Regulatory Air Models (SCRAM) at: http://www.epa.gov/ttn/scram/. Additional guidance and Air Quality Bureau staff contact information can be found at the DNR website: Home page: http://www.iowacleanair.gov Modeling: http://www.iowadnr.gov/Environmental-Protection/Air-Quality/Modeling/Dispersion-Modeling Permitting: http://www.iowadnr.gov/Environmental-Protection/Air-Quality/Construction-Permits Contact info: http://www.iowadnr.gov/About-DNR/DNR-Staff-Offices/Air-Quality-Staff All PSD permits require an air quality analysis of the ambient impacts associated with the project. This analysis includes an assessment of existing air quality, an air dispersion modeling analysis, an additional impact analysis, and an evaluation of any adverse impacts to Class I areas. The air dispersion modeling analysis is required to demonstrate that new emissions from the source or major modification, in conjunction with applicable emissions from other existing sources, will not cause or contribute to a violation of any applicable National Ambient Air Quality Standards (NAAQS) or PSD increment. The analysis involves two distinct phases: a preliminary analysis and a full impact analysis. The preliminary analysis evaluates the potential increase in emissions from the project or the net increase in emissions associated with the modification. The results of the preliminary analysis determine whether or not a full impact analysis is required. In addition to emissions from the project, the full impact analysis also considers any existing emission units at the facility, nearby facilities, and any growth resulting from the new project. For PM2.5, PM10, SO2, and NO2, the full impact analysis consists of separate modeling analyses for the NAAQS and the PSD increments. The Iowa Department of Natural Resources (DNR) may require a NAAQS modeling analysis for non-PSD significant pollutants, especially in areas of NAAQS concern. Since there are known areas with existing ambient concentrations close to the NAAQS for some pollutants, projects that emit these pollutants may need to be evaluated even if these pollutants are proposed to be emitted in amounts less than the PSD significant emission rates. This modeling can be conducted according to the DNR’s “Air Dispersion Modeling Guidelines for Non-PSD, Pre-Construction Permit Applications.”
Version 12-4-15 2
The additional impact analysis must be conducted for all PSD projects. This analysis assesses the impact of the emissions from the project and any associated growth on soils, vegetation, and visibility. Although there are currently no Class I areas located in Iowa or within 100 kilometers of the borders, a Class I visibility analysis must also be addressed.
The Modeling Protocol Because air dispersion modeling is a complicated process, the DNR requires that all PSD applicants submit a detailed modeling protocol prior to attending the pre-application meeting. By doing so, the DNR can communicate to the applicant the acceptability of the proposed methodology prior to conducting any extensive modeling analysis, hopefully decreasing the chance of errors or inadvertent exclusion of required information. Changes to the protocol may occur as the analysis progresses; however the protocol establishes a common understanding of the requirements. The DNR has developed a modeling protocol template that lists each topic that should be discussed in the modeling protocol. After the modeling protocol is submitted, the DNR modeling team will review it and provide comments during the pre-application meeting.
Volatile Organic Compound (VOC) Emissions There is currently no EPA approved methodology for evaluating the 8-hour ozone standard on a local scale, therefore no ambient air analysis is required for ozone at this time.
Pre-Construction Monitoring Pre-construction ambient monitoring may be required for any criteria pollutant that is proposed to be emitted above the significant emission rates (or 100 tpy or more of VOCs). The DNR can exempt the applicant from this requirement if the highest modeled concentrations from the project are below the significant monitoring concentrations (SMCs). The SMCs are listed below in Table 1.
Table 1: Significant Monitoring Concentrations
Pollutant Averaging Period Significant Monitoring Concentrations (µg/m3)
NO2 Annual 14
SO2 24-hr 13
PM10 24-hr 10
CO 8-hr 575
Pb Calendar quarter 0.1
Version 12-4-15 3
If the predicted concentrations are above the significant monitoring concentrations and the DNR determines that ambient monitoring is required, the applicant can satisfy the requirement by either 1) establishing a site specific ambient monitoring network, or 2) using existing ambient monitoring data. Should the applicant elect to use existing ambient monitoring data, then the applicant must justify the representativeness of the existing monitoring data. The decision to accept or reject existing ambient monitoring data to meet this requirement is made by the DNR. On January 22, 2013, the D.C. Court of Appeals vacated the SMC for PM2.5, finding that the EPA was precluded from using the PM2.5 SMCs to exempt permit applicants from the statutory requirement to compile preconstruction monitoring data. Currently the SMCs can still be applied for the remaining criteria pollutants.
Post-Construction Monitoring EPA’s Ambient Monitoring Guidelines for Prevention of Significant Deterioration (May 1987), recommends post-construction monitoring be done when there is a valid reason, such as when predicted concentrations are close to the NAAQS and when there are uncertainties in the data modeled. A decision by permitting staff to require post-construction monitoring would be made after the PSD application has been thoroughly reviewed.
Model Selection and Options The latest version of the AMS/EPA Regulatory Model (AERMOD) is preferred for conducting the dispersion modeling analysis. The regulatory default options should be used in the modeling analysis. The default option includes the use of stack-tip downwash and incorporates the effects of elevated terrain. The AERMOD model automatically selects the default options unless specified to override these options. There are currently no portions of the state for which the urban modeling option should be used.
Receptor Information Ambient Air Ambient air is defined in 567 IAC 20.2 as “that portion of the atmosphere, external to buildings, to which the general public has access. Ambient air does not include the atmosphere over land owned or controlled by the source and to which public access is precluded by a fence or other physical barriers.” For PSD modeling, receptors only need to be placed in ambient air locations. Receptor Spacing Requirements At a minimum, receptors should include a Cartesian grid with receptors spaced as follows:
• 50 m along the facility fence line • 50 m extending from the fence line to 0.5 km • 100 m extending from 0.5 km to 1.5 km • 250 m extending from 1.5 km to 3 km • 500 m extending from 3 km to 5 km
Version 12-4-15 4
Additional receptors, spaced at 1000 meters, may be necessary beyond 5 km from the source. Concentrations should clearly be decreasing near the edge of the receptor grid. If not, additional receptors should be added. Fine grids (50 m) should be placed over the area(s) of maximum concentration to ensure that the true maximum concentration is identified. Terrain Data The most recent version of AERMAP should be used to import terrain and source elevations from the National Elevation Dataset (NED). These data are available on the DNR’s elevation data webpage. All terrain that would intersect a line projected at a 10% slope from each and every receptor must be included in the AERMAP domain. Depending on the topography, source base elevations may not necessarily match the base elevation of a building on or near which it is located. This is most notable when a building is built into the side of a hill. When this occurs, the elevation of the source should be based on the natural contour of the hill as if the land had not been graded when the building was constructed, and the stack height should be the height of the top of the stack above that base elevation. The base height of the building should be the lowest elevation along the base of the building.
Source Information Indoor Venting Emission Units Indoor venting units must be included in the modeling analysis as a volume source or series of volume sources who’s dimensions are based on the size and shape of the building(s) unless the majority of the emissions will exit via a building vent or other opening, in which case the emissions should be modeled as exiting the building through the vent or opening. For guidance on modeling emission units that vent inside a building please use the Volume Source Tool located on the DNR’s website. Please note that the use of the building enclosure credit included on the above referenced spreadsheet is for use with PM10 only and will not be applicable for the modeling of PM2.5 emissions. Fugitive Sources All fugitive sources such as storage piles, transfer points and haul roads must be included in the modeling analysis. Fugitive emissions at nearby facilities generally do not need to be included in the full modeling analysis, unless the nearby facility is located adjacent to the source being evaluated, then the fugitive source must be included in the modeling analysis. It is the current DNR practice to allow the haul road emissions to be omitted from the 24-hour PSD PM2.5 and PM10 increment analyses, provided that the facility agrees to apply best management practices for haul roads as determined by the construction permit staff. Storage piles are typically modeled as area sources. The following area source parameters are generally accepted for characterizing storage piles:
Version 12-4-15 5
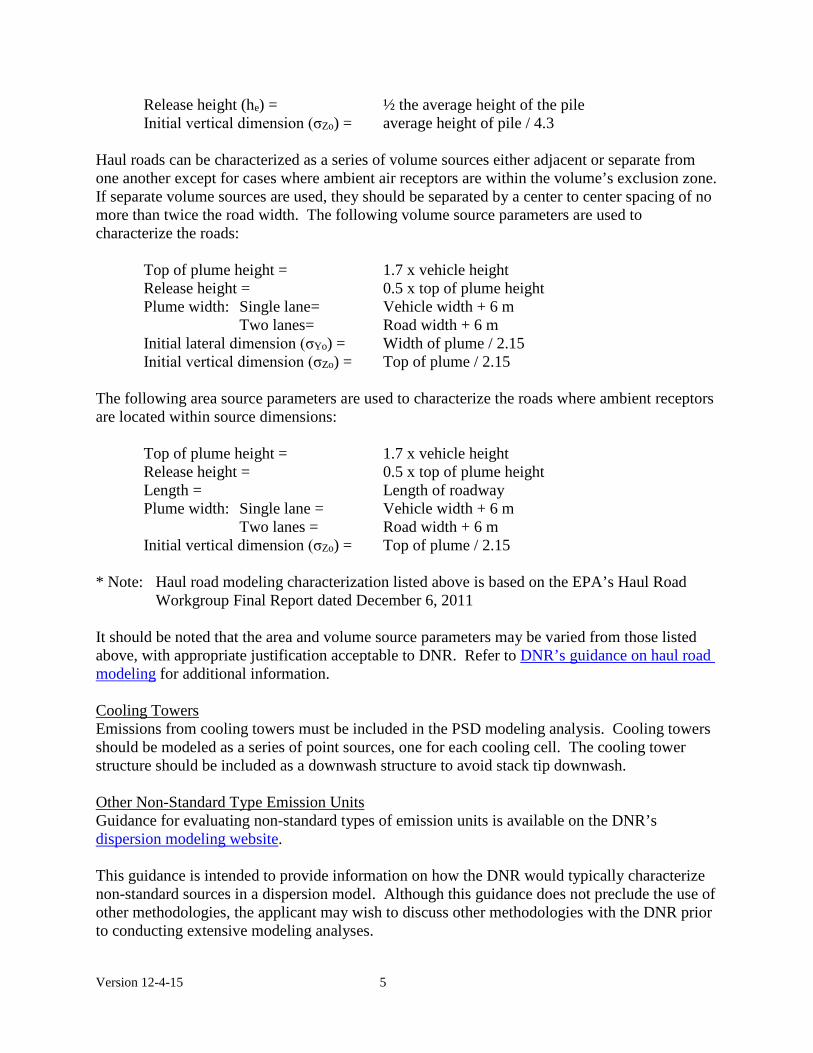
Release height (he) = ½ the average height of the pile Initial vertical dimension (σZo) = average height of pile / 4.3 Haul roads can be characterized as a series of volume sources either adjacent or separate from one another except for cases where ambient air receptors are within the volume’s exclusion zone. If separate volume sources are used, they should be separated by a center to center spacing of no more than twice the road width. The following volume source parameters are used to characterize the roads: Top of plume height = 1.7 x vehicle height
Release height = 0.5 x top of plume height Plume width: Single lane= Vehicle width + 6 m
Two lanes= Road width + 6 m Initial lateral dimension (σYo) = Width of plume / 2.15 Initial vertical dimension (σZo) = Top of plume / 2.15 The following area source parameters are used to characterize the roads where ambient receptors are located within source dimensions: Top of plume height = 1.7 x vehicle height
Release height = 0.5 x top of plume height Length = Length of roadway
Plume width: Single lane = Vehicle width + 6 m Two lanes = Road width + 6 m
Initial vertical dimension (σZo) = Top of plume / 2.15 * Note: Haul road modeling characterization listed above is based on the EPA’s Haul Road
Workgroup Final Report dated December 6, 2011 It should be noted that the area and volume source parameters may be varied from those listed above, with appropriate justification acceptable to DNR. Refer to DNR’s guidance on haul road modeling for additional information. Cooling Towers Emissions from cooling towers must be included in the PSD modeling analysis. Cooling towers should be modeled as a series of point sources, one for each cooling cell. The cooling tower structure should be included as a downwash structure to avoid stack tip downwash. Other Non-Standard Type Emission Units Guidance for evaluating non-standard types of emission units is available on the DNR’s dispersion modeling website. This guidance is intended to provide information on how the DNR would typically characterize non-standard sources in a dispersion model. Although this guidance does not preclude the use of other methodologies, the applicant may wish to discuss other methodologies with the DNR prior to conducting extensive modeling analyses.
Version 12-4-15 6
Ancillary Sources Ancillary sources include fire pumps, emergency (not back-up) generators, black start generators, and any other source that will only be operated when the rest of the facility is not (except for test and maintenance purposes). Ancillary sources must be evaluated as part of the PSD NAAQS evaluation; however they may be modeled in a separate analysis. All ancillary sources should be modeled to assure attainment with all applicable (short-term) NAAQS. Intermittent Emission Units and the 1-Hour NOx and SO2 NAAQS The assumption of continuous operation for intermittent emission sources would in many cases result in them becoming the controlling emission scenario for determining compliance with a 1-hour NAAQS. Based on guidance from the March 1, 2011 EPA Memo (Additional Clarification Regarding Application of Appendix W Modeling Guidance for the 1-Hour NO2 National Ambient Air Quality Standard), the “EPA believes the most appropriate data to use for compliance demonstrations for the 1-hour NAAQS are those based on emissions scenarios that are continuous enough or frequent enough to contribute significantly to the annual distribution of daily maximum 1-hour concentrations.” Based on EPA guidance, the DNR has concluded that any source that operates on a purely random schedule (including testing and maintenance) and is limited to operating for no more than 500 hours/yr can be considered an intermittent source. In addition, any source that meets the 500 hour/yr criterion, but operates on a scheduled basis for testing and maintenance purposes, can be considered an intermittent source if the scheduled testing and maintenance is limited to the time of the day with the most favorable dispersion conditions (between 9 AM and 4 PM). Intermittent sources may be excluded from the 1-hour NO2 and SO2 NAAQS analyses. The protocol should include a discussion of how intermittent sources will be addressed. Ambient Conditions An emission point with stack gas exit temperature equal to the interior temperature of the building where the emission unit is located should be modeled at 68° F per the definition of “standard conditions” in 567 IAC rule 20.2, unless the applicant can provide justification acceptable to the DNR that another temperature is representative of the interior building temperature. An emission point with a temperature equal to that of the ambient air should be modeled at 0° K (which instructs the model to vary the temperature of the source with the ambient temperature). Varying Operational Loads If a source(s) will be operated continuously at reduced loads (50 percent, 75 percent, etc.) then screening modeling should be performed to determine which operating load produces the worse-case predicted impacts for each applicable averaging period. Additional information on this requirement can be found in Section 8.1 of Appendix W of 40 CFR Part 51. If a source(s) will operate at greater than design capacity for periods that could result in violations of the NAAQS, this load should be modeled. In either case, the load causing the highest predicted concentration, in addition to the design load, should be modeled. Alternatively, the worse-case stack parameters (lowest temperature and exit velocity, and highest emission rate) from each of the operational loads for each source may be modeled simultaneously to produce a conservative prediction. If the conservative approach results in
Version 12-4-15 7
model concentrations that are less than the applicable standards, then a more refined method is not necessary. This approach can significantly reduce the time it takes to conduct the analysis, as well as the time it takes for the DNR review. Operating Restrictions To incorporate operating restrictions in the modeling analysis, the following methodologies should be used: Annual Hourly Operating Restrictions: If annual hourly limitations are to be implemented without regard to season or month, the number of hours used should be divided by 730 hours and the result rounded to the nearest integer. Monthly averaging periods will then be modeled and the predicted concentrations from the highest months will be averaged. The number of months to include in the average is given by the integer from the previous calculation. The average predicted concentration is then multiplied by the number of hours of operation to which the emission unit will be limited and divided by 8760 hours. The result is the annual average and should be performed for each of the five years. If the number of hours to which the emission unit is to be limited is less than 365, the same procedure should be used replacing 730 hours with 24 hours and using the highest 24-hr averages rather than monthly averages. Daily Hourly Operating Restrictions: If daily hourly operating restrictions are to be implemented without regard to specific times of day, the emission unit(s) should be modeled with an averaging period that corresponds to the number of hours requested as the daily operating hour restriction. The impacts from this averaging period are then multiplied by the requested hours of operation and divided by 24 hours per day. The calculated impacts from the emission unit(s) with the daily operating restriction should be added to the impacts from the rest of the facility for each year of the modeling analysis. For situations where the emission unit(s) are limited to a period of operation other than the averaging periods available in the model, or for additional information on modeling restricted hours of operation, please refer to the “DNR Suggested Methodology for Modeling Restricted Hours of Operation” document. Building Downwash A building downwash analysis shall be conducted using the most recent version of EPA’s Building Profile Input Program with Plume Rise Enhancements (BPIP-PRIME) after determining the source and building base elevations. Off-property buildings that affect downwash must also be included in this analysis.
Meteorological Data The DNR maintains pre-processed meteorological data for AERMOD for several National Weather Service (NWS) station locations. Applicants can obtain meteorological data suitable for use in the AERMOD model from the DNR’s meteorological data webpage. The Iowa map on the website depicts which meteorological stations are considered
Version 12-4-15 8
representative of each county in the state. Use the links provided to download the latest pre-processed and approved meteorological data for use in AERMOD. The profile base should be set to the station elevation of the station being used. The meteorological data sets located on the web site include information on the profile base elevations for each station. The use of meteorological data sets other than those provided on the website is not permissible without prior approval of the DNR modeling team.
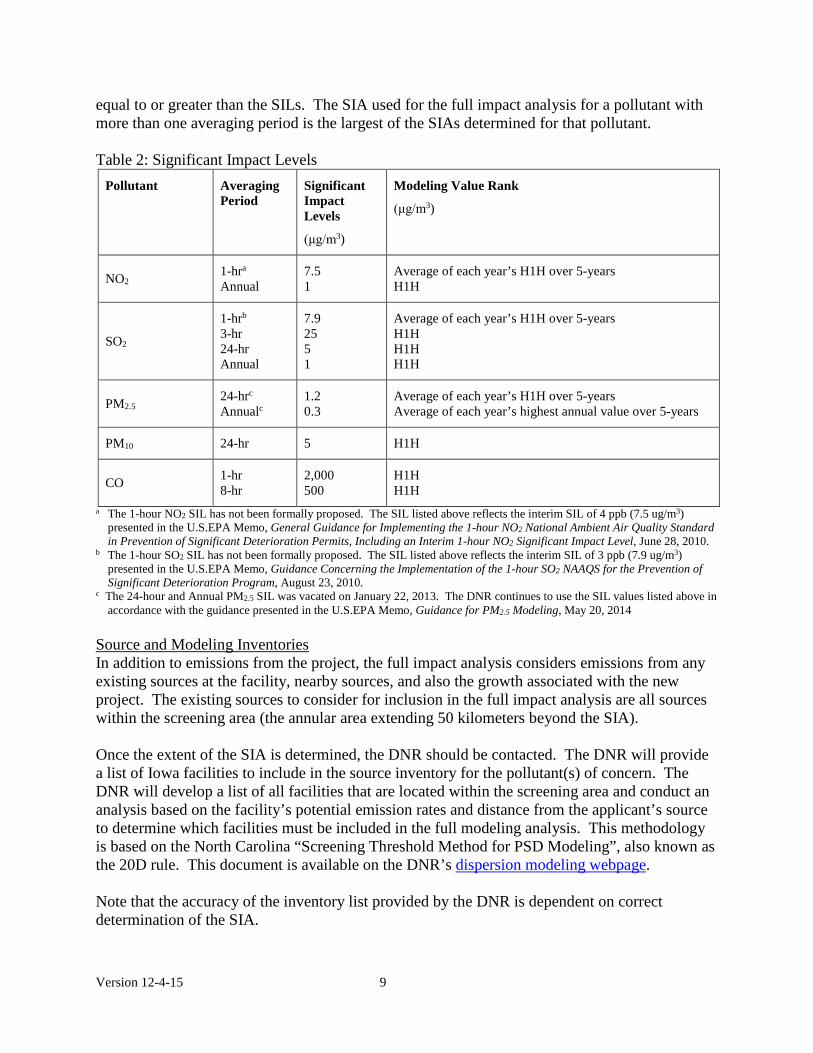
Determination of Impact on Air Quality Preliminary Modeling Analysis The preliminary analysis evaluates the potential increase in emissions from the project or the net increase in emissions associated with the modification. If the net increase in emissions associated with a PSD modification is to be evaluated, the project may include changes to the existing stack parameters. In this case the stack parameters and emission rates associated with the emission units before and after the modification are input into the same model run, with the emission units before the modification modeled as negative emissions and the emission units after the proposed modification modeled as positive emissions, each with the appropriate stack parameters. Please note: All three tiers of NO2 modeling are classified as screening techniques and therefore negative emission rates should not be used to account for emissions reductions when conducting dispersion modeling to determine net ambient impacts associated with emissions changes for comparison to the SILs, NAAQS, and PSD Increment. An alternative method would be to perform a modeling analysis on the existing configuration and a separate modeling analysis on the proposed configuration to determine the change in predicted concentration. The results of the preliminary analysis determine whether or not a full impact analysis is required. If predicted concentrations from the project are below the applicable Significant Impact Levels (SILs), a full impact analysis is not required. The SILs are listed in Table 2.
Due to the January 22, 2013 court decision, the PM2.5 SILs may only be used to exempt the project from a full impact analysis if the difference between the NAAQS and the monitored background is greater than the SIL. Information related to determining the use of appropriate monitoring data for this evaluation can be found in EPA’s July, 1987 “Ambient Monitoring Guidelines for Prevention of Significant Deterioration (PSD)” document. Full Impact Analysis If any of the modeled concentrations from the preliminary modeling analysis equal or exceed the SILs, then a full impact analysis must be conducted. The preliminary analysis should be used to determine the Significant Impact Area (SIA). The SIA is a circular area with a radius that extends from the source to the most distant point where the modeling predicts concentrations equal to the SIL, or 50 kilometers, whichever is less. The SIA is determined for each averaging period for each pollutant with predicted concentrations
Version 12-4-15 9
equal to or greater than the SILs. The SIA used for the full impact analysis for a pollutant with more than one averaging period is the largest of the SIAs determined for that pollutant. Table 2: Significant Impact Levels
a The 1-hour NO2 SIL has not been formally proposed. The SIL listed above reflects the interim SIL of 4 ppb (7.5 ug/m3) presented in the U.S.EPA Memo, General Guidance for Implementing the 1-hour NO2 National Ambient Air Quality Standard in Prevention of Significant Deterioration Permits, Including an Interim 1-hour NO2 Significant Impact Level, June 28, 2010.
b The 1-hour SO2 SIL has not been formally proposed. The SIL listed above reflects the interim SIL of 3 ppb (7.9 ug/m3) presented in the U.S.EPA Memo, Guidance Concerning the Implementation of the 1-hour SO2 NAAQS for the Prevention of Significant Deterioration Program, August 23, 2010.
c The 24-hour and Annual PM2.5 SIL was vacated on January 22, 2013. The DNR continues to use the SIL values listed above in accordance with the guidance presented in the U.S.EPA Memo, Guidance for PM2.5 Modeling, May 20, 2014
Source and Modeling Inventories In addition to emissions from the project, the full impact analysis considers emissions from any existing sources at the facility, nearby sources, and also the growth associated with the new project. The existing sources to consider for inclusion in the full impact analysis are all sources within the screening area (the annular area extending 50 kilometers beyond the SIA). Once the extent of the SIA is determined, the DNR should be contacted. The DNR will provide a list of Iowa facilities to include in the source inventory for the pollutant(s) of concern. The DNR will develop a list of all facilities that are located within the screening area and conduct an analysis based on the facility’s potential emission rates and distance from the applicant’s source to determine which facilities must be included in the full modeling analysis. This methodology is based on the North Carolina “Screening Threshold Method for PSD Modeling”, also known as the 20D rule. This document is available on the DNR’s dispersion modeling webpage. Note that the accuracy of the inventory list provided by the DNR is dependent on correct determination of the SIA.
Pollutant Averaging Period
Significant Impact Levels
(μg/m3)
Modeling Value Rank
(μg/m3)
NO2 1-hra Annual
7.5 1
Average of each year’s H1H over 5-years H1H
SO2
1-hrb 3-hr 24-hr Annual
7.9 25 5 1
Average of each year’s H1H over 5-years H1H H1H H1H
PM2.5 24-hrc Annualc
1.2 0.3
Average of each year’s H1H over 5-years Average of each year’s highest annual value over 5-years
PM10 24-hr 5 H1H
CO 1-hr 8-hr
2,000 500
H1H H1H
Version 12-4-15 10
The applicant is responsible for developing a modeling inventory from the source list provided by the DNR. Information required to develop the modeling inventory is available on DNR’s web site and in the Air Quality Bureau’s Records Section, which is open Monday through Friday from 8:00 AM to 4:30 PM. Contact the records section at (515) 725-9500 to obtain information on records procedures and photocopying costs. The DNR will provide input files for facilities and pollutants that have been previously modeled, as available. Since the full impact analysis consists of separate modeling analyses for the NAAQS and the PSD increments, two separate modeling inventories may need to be developed. The modeling inventory for both the facility associated with the PSD project and other nearby sources will include the following:
• Emission point ID and/or description • Stack Height • Stack Exit Diameter • Exhaust Temperature • Discharge Style (i.e., Vertical, Vertical Obstructed, Horizontal, Downward, Internal) • Exhaust Flow Rate • Dimensions of source (fugitive sources only) • Operating Hours • Maximum allowable emission rate
The emissions inventories for nearby facilities should document the source of the inventory information. If the SIA or the screening areas extend into surrounding states, the appropriate agency should be contacted to obtain the appropriate NAAQS emissions inventory for those states. An alternative approach to determining the emissions inventories for 1-hour NO2 modeling may be considered using a smaller screening area. The March 1, 2011 EPA Memo (Additional Clarification Regarding Application of Appendix W Modeling Guidance for the 1-hour NO2 National Ambient Air Quality Standard) suggests using a screening area within about 10 kilometers of the project location. The inclusion of all sources within 50 kilometers of the project location as outlined above may produce an overly conservative result in relation to 1-hour NO2 modeling. The memo states “a general rule of thumb for estimating the distance to maximum 1-hour impact and the region of significant concentration gradients that may apply in relatively flat terrain is approximately 10 times the source release height” (i.e. 100 meter stack in flat terrain equals a max impact area and region of significant concentration of approximately 1,000 meters downwind of the source). The memo goes on to state that “accounting for some terrain influences on the location and gradients of maximum 1-hour concentrations, these considerations suggest that the emphasis on determining which nearby sources to include in the modeling analysis should focus on the area within 10 kilometers of the project location in most cases.” Based on this guidance, the use of a screening area within 10 kilometers for modeling of the 1-hour NO2 NAAQS is acceptable to the DNR.
Version 12-4-15 11
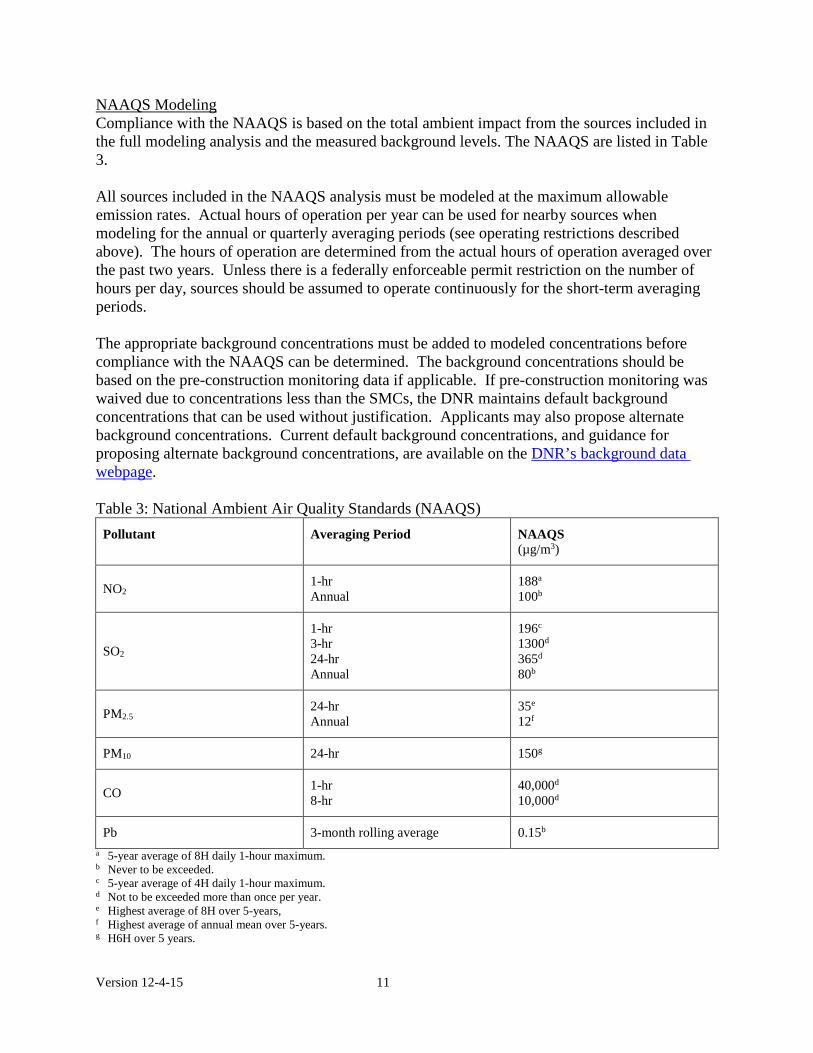
NAAQS Modeling Compliance with the NAAQS is based on the total ambient impact from the sources included in the full modeling analysis and the measured background levels. The NAAQS are listed in Table 3. All sources included in the NAAQS analysis must be modeled at the maximum allowable emission rates. Actual hours of operation per year can be used for nearby sources when modeling for the annual or quarterly averaging periods (see operating restrictions described above). The hours of operation are determined from the actual hours of operation averaged over the past two years. Unless there is a federally enforceable permit restriction on the number of hours per day, sources should be assumed to operate continuously for the short-term averaging periods. The appropriate background concentrations must be added to modeled concentrations before compliance with the NAAQS can be determined. The background concentrations should be based on the pre-construction monitoring data if applicable. If pre-construction monitoring was waived due to concentrations less than the SMCs, the DNR maintains default background concentrations that can be used without justification. Applicants may also propose alternate background concentrations. Current default background concentrations, and guidance for proposing alternate background concentrations, are available on the DNR’s background data webpage.
Table 3: National Ambient Air Quality Standards (NAAQS)
Pollutant Averaging Period NAAQS (µg/m3)
NO2 1-hr Annual
188a 100b
SO2
1-hr 3-hr 24-hr Annual
196c 1300d 365d 80b
PM2.5 24-hr Annual
35e 12f
PM10 24-hr 150g
CO 1-hr 8-hr
40,000d 10,000d
Pb 3-month rolling average 0.15b a 5-year average of 8H daily 1-hour maximum. b Never to be exceeded. c 5-year average of 4H daily 1-hour maximum. d Not to be exceeded more than once per year. e Highest average of 8H over 5-years, f Highest average of annual mean over 5-years. g H6H over 5 years.
Version 12-4-15 12
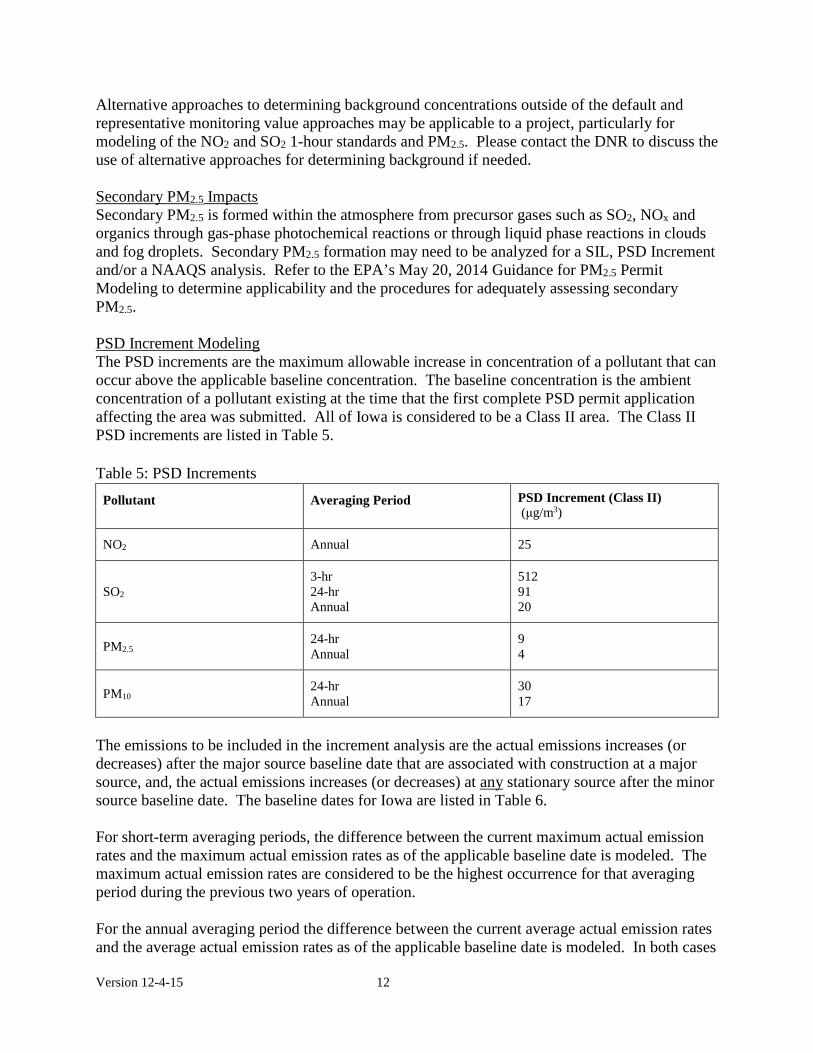
Alternative approaches to determining background concentrations outside of the default and representative monitoring value approaches may be applicable to a project, particularly for modeling of the NO2 and SO2 1-hour standards and PM2.5. Please contact the DNR to discuss the use of alternative approaches for determining background if needed. Secondary PM2.5 Impacts Secondary PM2.5 is formed within the atmosphere from precursor gases such as SO2, NOx and organics through gas-phase photochemical reactions or through liquid phase reactions in clouds and fog droplets. Secondary PM2.5 formation may need to be analyzed for a SIL, PSD Increment and/or a NAAQS analysis. Refer to the EPA’s May 20, 2014 Guidance for PM2.5 Permit Modeling to determine applicability and the procedures for adequately assessing secondary PM2.5. PSD Increment Modeling The PSD increments are the maximum allowable increase in concentration of a pollutant that can occur above the applicable baseline concentration. The baseline concentration is the ambient concentration of a pollutant existing at the time that the first complete PSD permit application affecting the area was submitted. All of Iowa is considered to be a Class II area. The Class II PSD increments are listed in Table 5. Table 5: PSD Increments
Pollutant Averaging Period PSD Increment (Class II) (μg/m3)
NO2 Annual 25
SO2 3-hr 24-hr Annual
512 91 20
PM2.5 24-hr Annual
9 4
PM10 24-hr Annual
30
17
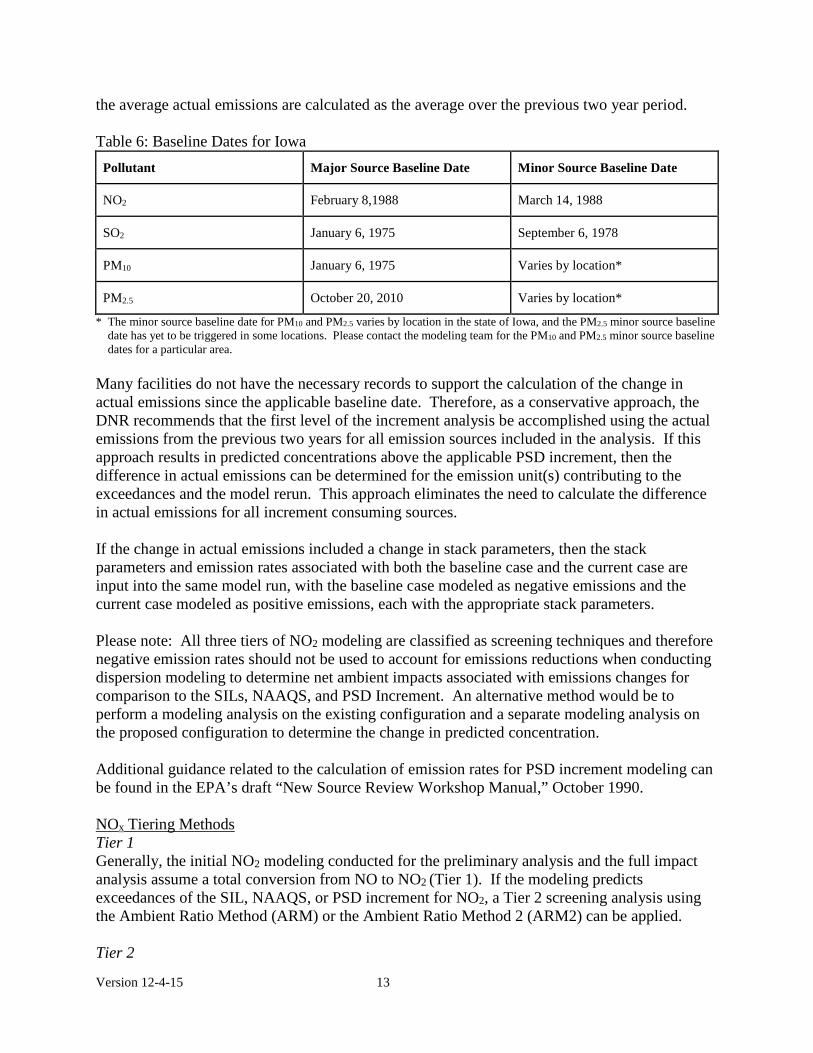
The emissions to be included in the increment analysis are the actual emissions increases (or decreases) after the major source baseline date that are associated with construction at a major source, and, the actual emissions increases (or decreases) at any stationary source after the minor source baseline date. The baseline dates for Iowa are listed in Table 6. For short-term averaging periods, the difference between the current maximum actual emission rates and the maximum actual emission rates as of the applicable baseline date is modeled. The maximum actual emission rates are considered to be the highest occurrence for that averaging period during the previous two years of operation. For the annual averaging period the difference between the current average actual emission rates and the average actual emission rates as of the applicable baseline date is modeled. In both cases
Version 12-4-15 13
the average actual emissions are calculated as the average over the previous two year period. Table 6: Baseline Dates for Iowa
Pollutant Major Source Baseline Date Minor Source Baseline Date
NO2 February 8,1988 March 14, 1988
SO2 January 6, 1975 September 6, 1978
PM10 January 6, 1975 Varies by location*
PM2.5 October 20, 2010 Varies by location*
* The minor source baseline date for PM10 and PM2.5 varies by location in the state of Iowa, and the PM2.5 minor source baseline date has yet to be triggered in some locations. Please contact the modeling team for the PM10 and PM2.5 minor source baseline dates for a particular area.
Many facilities do not have the necessary records to support the calculation of the change in actual emissions since the applicable baseline date. Therefore, as a conservative approach, the DNR recommends that the first level of the increment analysis be accomplished using the actual emissions from the previous two years for all emission sources included in the analysis. If this approach results in predicted concentrations above the applicable PSD increment, then the difference in actual emissions can be determined for the emission unit(s) contributing to the exceedances and the model rerun. This approach eliminates the need to calculate the difference in actual emissions for all increment consuming sources. If the change in actual emissions included a change in stack parameters, then the stack parameters and emission rates associated with both the baseline case and the current case are input into the same model run, with the baseline case modeled as negative emissions and the current case modeled as positive emissions, each with the appropriate stack parameters. Please note: All three tiers of NO2 modeling are classified as screening techniques and therefore negative emission rates should not be used to account for emissions reductions when conducting dispersion modeling to determine net ambient impacts associated with emissions changes for comparison to the SILs, NAAQS, and PSD Increment. An alternative method would be to perform a modeling analysis on the existing configuration and a separate modeling analysis on the proposed configuration to determine the change in predicted concentration. Additional guidance related to the calculation of emission rates for PSD increment modeling can be found in the EPA’s draft “New Source Review Workshop Manual,” October 1990. NOx Tiering Methods Tier 1 Generally, the initial NO2 modeling conducted for the preliminary analysis and the full impact analysis assume a total conversion from NO to NO2 (Tier 1). If the modeling predicts exceedances of the SIL, NAAQS, or PSD increment for NO2, a Tier 2 screening analysis using the Ambient Ratio Method (ARM) or the Ambient Ratio Method 2 (ARM2) can be applied. Tier 2
Version 12-4-15 14
The Tier 2 ARM for the annual NAAQS is calculated by multiplying the predicted NOx concentrations from the Tier 1 analysis by the national default NO2/NOx value of 0.75 to determine the predicted concentrations of NO2. For the 1-hour averaging period, U.S. EPA has recommended a default of 0.8 with no additional justification required. Refer to Appendix W of 40 CFR Part 51 for using an ARM NO2/NOx value other than the default values. The ratios should be applied only to the modeled concentrations, and the monitored NO2 background levels should be added to the modeled concentrations to compute the design value. The ARM2 is based on an evaluation of the ratios of NO2/NOx from the EPA’s Air Quality System (AQS) record of ambient air quality data. ARM2 incorporates a variable ambient ratio that is a function of model predicted 1-hour NOx concentration to determine the total modeled NO2. For a NAAQS modeling analysis, monitored NO2 background levels should not be adjusted by the ARM2 ratio but should be added to the modeled NO2 result. The ARM2 method includes a default maximum NO2/NOx ratio of 0.9 at very low levels of NOx and a default minimum ratio of 0.2 at very high levels of NOx. The maximum and minimum ratios can be adjusted in ARM2. ARM2 is available as a non-regulatory default BETA option in AERMOD and therefore requires justification and approval by the EPA Region 7 office on a case-by-case basis. Tier 3 A Tier 3 detailed screening analysis is also available as a non-regulatory default option within the AERMOD model for the 1-hour averaging period. Tier 3 can utilize either the Plume Volume Molar Ratio Method (PVMRM) or Ozone Limiting Method (OLM), both of which have been incorporated into AERMOD, as clarified in the June 29, 2010 EPA memo, Guidance Concerning the Implementation of the 1-hour NO2 NAAQS for the Prevention of Significant Deterioration Program. Since the PVMRM and OLM methods are currently implemented as non-regulatory default options within the AERMOD dispersion model, the use of these methods requires justification and approval by the EPA Region 7 office on a case-by-case basis. Key model inputs for both the PVMRM and OLM options are the in-stack ratios of NO2/NOx emissions and background ozone concentrations. The model also requires an ambient equilibrium ratio input for PVMRM and OLM. Below are the current default ratios as proposed by the EPA in a memo dated March 1, 2011 (Additional Clarification Regarding Application of Appendix W Modeling Guidance for the 1-hour NO2 National Ambient Air Quality Standard): Default in-stack NO2/NOx ratio = 0.50 Default ambient equilibrium ratio = 0.90 The use of an alternative ratio is permissible but must be justified and accepted by the DNR and EPA Region 7 prior to implementation. The default in-stack ratio of 0.50 may still be considered too conservative for many specific applications and therefore the EPA has created a NO2/NOx In-Stack Ratio (ISR) Database of site specific data submitted by various facilities. The use of any values in this database still requires approval by the DNR and EPA Region 7. The database can be found at the following web address: www.epa.gov/scram001/no2_isr_database.htm. In a September 30, 2014 EPA memo, Clarification on the Use of AERMOD Dispersion Modeling for Demonstrating Compliance with the NO2 National Ambient Air Quality Standard, the EPA proposes the use of a separate default ratio for the more distant nearby sources (greater than 1-3
Version 12-4-15 15
km away) included in a cumulative modeling analysis. That default ratio is the following: Default nearby source NO2/NOx ratio = 0.20 The incorporation of background ozone concentrations is also part of the inputs required by use of the PVMRM and OLM options. The model allows for the use of a single ozone background concentration, temporally-varying background concentrations, or the import of an hourly monitored ozone background concentration file. The DNR has provided an hourly monitored ozone background concentration file for use across the state of Iowa that is available on the DNR’s website. If an applicant would like the hourly ozone background file for a specific monitor location, please contact the DNR for this information. Please refer to the September 30, 2014 EPA memo referenced above for guidance on which applications PVMRM and OLM are best suited. Please note: All three tiers of NO2 modeling are classified as screening techniques and therefore negative emission rates should not be used to account for emissions reductions when conducting dispersion modeling to determine net ambient impacts associated with emissions changes for comparison to the SILs, NAAQS, and PSD Increment. An alternative method would be to perform a modeling analysis on the existing configuration and a separate modeling analysis on the proposed configuration to determine the change in predicted concentration.
Additional Impact Analysis A Class II additional impact analysis must be conducted for all PSD projects. The purpose of this analysis is to make the public aware of the impacts the proposed project will have on residential, commercial, and industrial growth in the area, and on soils, vegetation and visibility in the vicinity of the proposed project location. Therefore, data from the additional impacts analysis must be presented so that it is logical and understandable to the interested public. Growth Analysis This analysis is an estimate of the projected residential, commercial, and industrial growth that will occur as a result of the PSD project and an estimate of the air emissions associated with this growth. Air emissions associated with any new growth predicted to result from the proposed project and the air emissions from the proposed PSD project are modeled together. The applicable background values are added to the resulting modeled concentrations and the results compared with the applicable NAAQS and PSD increments. Often the new residential, commercial, and industrial growth estimated to occur as a result of the PSD project is negligible. In this case, further modeling analyses for growth is not necessary. Soils and Vegetation Analysis This analysis must be conducted for all PSD projects. Based on guidance from EPA Region VII, stating that predicted concentrations from the modeling analyses are below the SILs or the NAAQS is not adequate. The soils and vegetation analysis is based on an inventory of the soils and vegetation types found
Version 12-4-15 16
in the area. The inventory of vegetation should include all vegetation with any commercial or recreational value. Once an inventory of soils and vegetation has been completed, a literature search is conducted to determine the sensitivity of these soils and vegetation to each of the applicable pollutants that will be emitted in significant amounts. This information should be compared to the predicted concentrations determined from the modeling analyses. A screening tool has been developed by the DNR to aid in evaluation of potential impacts on soils and vegetation. The tool is primarily based on the EPA document “A Screening Procedure for the Impacts of Air Pollution Sources on Plants, Soils, and Animals” (EPA 450/2-81-078, December 1980). This tool and the associated background document are available on the DNR’s dispersion modeling webpage. Potentially sensitive vegetation species (such as soybeans) may require a more careful examination. Some species may be harmed by long-term exposure to low concentrations of pollutants. The analysis should evaluate predicted concentrations for the averaging periods associated with the averaging periods addressed in the applicable vegetation impact studies. Since multiple pollutants may impact soils and vegetation synergistically, the combined impacts of NOx and SO2 (if applicable) should be evaluated. One reference for information on the relative sensitivities of plants to NO2 is Table 9-6 of EPA’s “Air Quality Criteria for Oxides of Nitrogen, Summary of Vegetation Impacts” Volume II, August 1993 (EPA 600/8-91/049bF). This document is also available at the website listed above. Visibility Analysis The applicant shall perform a visibility analysis to determine the impacts that the PSD project will have on sensitive areas such as state parks, wilderness areas, airports, scenic sites and overlooks. The DNR should be consulted prior to completing the visibility analysis to ensure that acceptable sensitive areas are considered. The visibility analysis shall be conducted according to EPA’s “Workbook for Plume Visual Screening and Analysis (Revised)” October 1992 (EPA-454/R-92-023). This analysis should be completed using the EPA’s VISCREEN model. The purpose of the analysis is to determine the expected number of days in a year when a plume might be visible at the selected sensitive areas. For most sensitive areas in Iowa it is appropriate to limit the review to the maximum visual impacts for a SKY background from INSIDE the sensitive location. The VISCREEN model input and output files, and a summary of the expected number of days a plume might be visible at each sensitive area should be submitted to the DNR. Screening Analysis for New Facilities Level-1 Screening Analysis The Level-1 screening analysis conducted with the VISCREEN model is conservative and relatively simple to run. The required inputs for performing the analysis are emission rates, distances, and the background visual range. The facility-wide allowable short-term emissions of PM (including soot and primary sulfate) and NOx (including primary NO2) should be used (regardless of the pollutants for which the project is major). Alternatively, the emission rates used in the analysis can be limited to only those
Version 12-4-15 17
emission sources that are likely to cause a visible plume in the vicinity of the selected sensitive areas with prior approval from the DNR. The required distances are: 1) the distance between the source and the area being observed and 2) the distance between the source and the observer location. These two distances may or may not be the same. The background visual range for Iowa is 40 kilometers. From these inputs the VISCREEN model calculates visibility variables that can be compared to the standardized screening values. If the results of the Level-1 screening analysis exceed any of the applicable screening values, then a Level-2 screening analysis should be conducted. Level-2 Screening Analysis The Level-2 analysis is less conservative but is also more complex to perform. More specific information regarding the source, topography, regional visual range and meteorology is required for the Level-2 analysis. The worst-case plume conditions are determined by developing a joint frequency distribution. A tool for developing a joint frequency distribution from the applicable meteorological data set is available on the DNR’s dispersion modeling webpage. Like the Level-1 screening analysis, the facility-wide allowable short-term emissions should be used, or, with prior approval from the DNR, the emissions can be limited to only those emission sources that are likely to cause a visible plume in the vicinity of the selected sensitive areas. Screening Analysis for Modifications at Existing Major Facilities If the analysis is being conducted for a modification to an existing major source, a net increase (or decrease) in the number of days with a visible plume at each sensitive area can be determined. This shall be accomplished by executing the Level-2 analysis once for the existing facility-wide emissions, and again for the proposed facility-wide emissions. Using the joint-frequency distribution, the number of days with a visible plume for each scenario shall be determined and the difference between the two can be calculated and included with the modeling report. Please refer to the Information tab on the DNR’s joint frequency distribution tool (viscreen_tool_v1.2.xls) for additional instructions. Condensation Plumes Possible impairments to visibility on off-site roads adjacent to a facility due to the condensation of plumes will be considered on a case-by-case basis. Sources of condensation plumes that could impair visibility include, but are not limited to, cooling towers and scrubber exhausts.
Class I Area Impact Analysis All PSD projects for facilities that propose to locate within 100 kilometers of a Class I area must conduct a Class I area impact analysis. In addition, PSD projects for facilities proposing to locate at a distance greater than 100 kilometers that are large enough that they may have an impact on a Class I area, must conduct a Class I area impact analysis. There are currently no Class I areas located within the state of Iowa or within 100 kilometers of Iowa’s borders. During review of the submitted modeling protocol, the DNR will determine if the PSD project is large enough to require a Class I area impact analysis.
Version 12-4-15 18
The closest Class I areas to Iowa are the Boundary Waters National Wilderness Area and Voyageurs National Park in Minnesota, Badlands National Park in South Dakota, and Hercules-Glades and Mingo National Wilderness Areas in Missouri. A tool for determining the distance to the nearest Class I area is available on the DNR’s dispersion modeling webpage.
Modeling Data Submittal Requirements Site plan (Construction Permit Form MI-1) The site plan is a vital part of the modeling analysis submittal. The site plan MUST contain ALL of the following:
• A North arrow oriented with true north, not plant north. • A graphical scale (a printed bar on the map with tick marks indicating the true scale of
the plot plan). A simple statement of “1 inch equals 10 feet” is not adequate by itself. The reason for this is that, when the map is enlarged or reduced, the true scale is no longer evident. When a graphical scale bar is printed on the map, it is resized along with the map if reduced in size for shipping, etc.
• All solid structures (buildings) on the facility property and the surrounding area (if they could influence plume downwash at the facility in question) must be shown along with the peak height of each building and/or tier. Eave heights may be included in addition to the peak heights, but are generally not required. Lattice-type structures, such as substations, should not be included on the site plan.
• All emission points should be shown on the plot plan and must be labeled, including internal emissions and fugitive emissions (storage piles, haul roads, etc.).
• The property line, the fence line, and any other boundary that would preclude the public access, must be shown on the map. If necessary, a separate, smaller scale map may be included with the submittal to show the full extent of the boundaries.
The site plan may be submitted in either hard copy or electronic format. If submitted electronically it must be in AutoCAD’s DWG or DXF formats. Alternatively, the site plan may be converted into a PDF file (Adobe Acrobat) or any type of image file (BMP, JPG, TIF, etc.). Site plans that are submitted electronically allow the modeling team to import them directly into the modeling software, which tends to simplify the review process. Emission Rates and Source Parameters All applicable emission rates and source parameters must be summarized in the modeling report. This includes the following:
• Potential hourly emission rates for all applicable pollutants • Actual hourly emission rates (only necessary if actual emissions are used) • Stack height • Diameter (or dimensions if rectangular) • Flow rate (specify acfm or scfm) • Temperature • Exhaust type (vertical, obstructed, horizontal, etc.) • Any enforceable operating restrictions
Version 12-4-15 19
The summary must include all sources that were included in the modeling analysis, not just those that are a part of the project. The summary must contain enough detail so that the modeling team can easily verify every emission rate and source parameter used in the analysis. The modeling report must also indicate the reference(s) from which the emission rates and source parameters were obtained (i.e. permit numbers, etc.). File Format Electronic modeling files must be submitted. Hard copies of the input and output files should not be submitted. All model input and output files are required, including the AERMAP and BPIP-PRIME input and output files. Media The electronic files may be submitted on either CD-ROM or DVD. The files may also be emailed to the modeler assigned to the project if known. However, attachments must be limited to 10 Mb, and may not contain an “.exe” or “.zip” file extension. Contact the modeling team for additional information regarding email attachments and alternative methods for submitting data.