Embed Size (px)
Citation preview
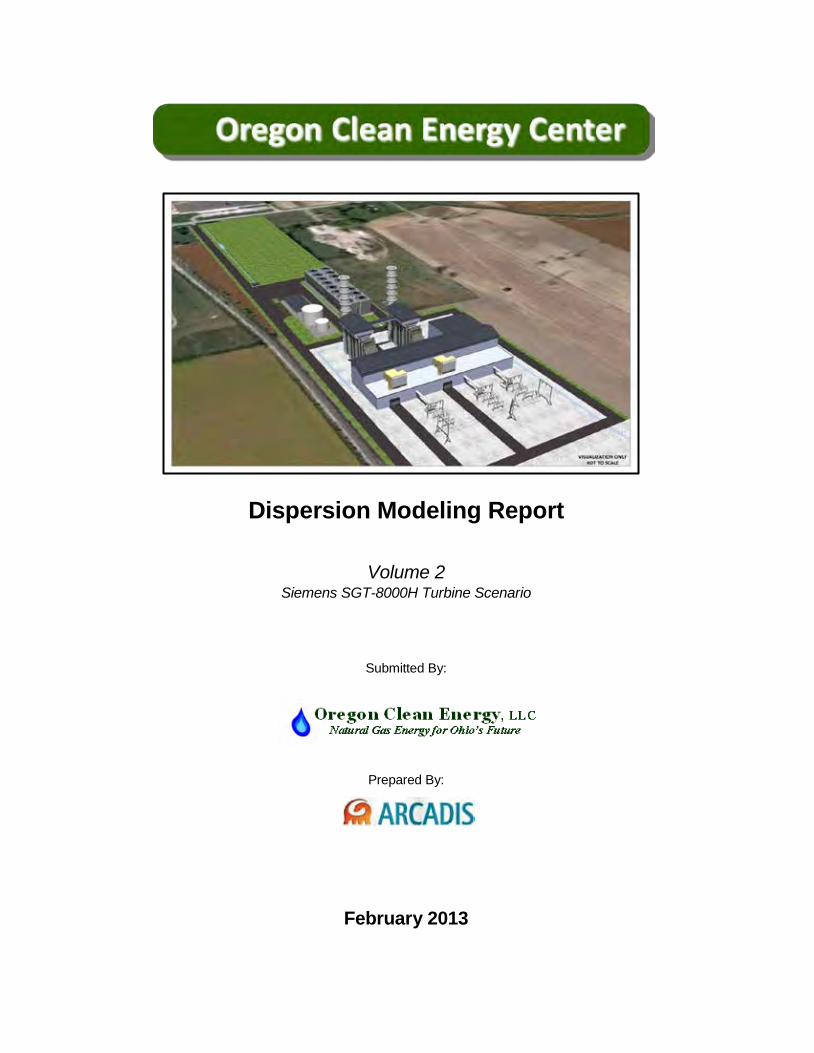
Dispersion Modeling Report
Volume 2 Siemens SGT-8000H Turbine Scenario
Submitted By:
Prepared By:
February 2013
Table of Contents Page i
Dispersion Modeling Report Oregon Clean Energy
Lucas County, OH Siemens Turbines, Volume 2
1. Introduction 1-1
2. Project Description 2-1
2.1 Overview 2-1
2.2 Site Location 2-3
2.3 Project Emissions 2-3
3. Regulatory Applicability Evaluation 3-1
3.1 PSD New Source Review 3-1
3.1.1 Best Available Control Technology 3-2
3.1.2 Air Quality Impact Analysis 3-2
3.1.1 PSD Class I Area Impact Analysis 3-2
3.1.2 Additional Impact Analyses 3-4
3.2 Other Applicable Regulations 3-4
4. Modeling Procedures 4-1
4.1 Model Selection 4-1
4.2 Receptors 4-1
4.3 Meteorological Data 4-2
4.4 Emissions Data and Stack Parameters 4-2
4.4.1 Combined Cycle Turbines 4-3
4.4.2 Ancillary Equipment 4-5
4.5 Good Engineering Practice Stack Height Analysis 4-6
4.6 Background Air Quality 4-7
5. Modeling Results 5-1
5.1 Modeling to Determine Maximum-Impact Operating Conditions 5-1
5.2 Comparison of Predicted Impacts with Significant Impact Levels 5-1
5.3 Comparison of Predicted Impacts with NAAQS 5-2
5.4 Comparison with Significant Monitoring Concentrations 5-3
Table of Contents Page ii
Dispersion Modeling Report Oregon Clean Energy
Lucas County, OH Siemens Turbines, Volume 2
6. Additional Impacts Analyses 6-1
6.1 PSD Class I Area Impact Analysis 6-1
6.2 Growth Analysis 6-2
6.2.1 Work Force 6-2
6.2.2 Industry 6-3
6.3 Soils and Vegetation Analysis 6-3
6.4 Endangered Species 6-8
6.5 Air Toxics 6-8
7. References 7-1
Appendices
Appendix A: Emission Calculations and Other Supporting Documentation Appendix B: Modeling Results Appendix C: Plots of Maximum-Impact Cases Appendix D: Modeling Files Appendix E: Agency Correspondence
Table of Contents Page iii
Dispersion Modeling Report Oregon Clean Energy
Lucas County, OH Siemens Turbines, Volume 2
List of Tables
Table 1-1: Summary of Proposed Potential Emissions and Applicable Regulatory Thresholds Table 3-1: Summary of Primary National Ambient Air Quality Standards Table 4-1: Stack Parameters and Emission Rates for Each Combustion Turbine a Table 4-2: Modeling Inputs for CTG Startup Events Table 4-3: Stack Parameters and Emission Rates for Ancillary Equipment Table 4-4: Major Building Structures for the Oregon Clean Energy Center Table 4-5: Background Air Quality Monitoring Stations Table 4-6: Background Air Quality Data Table 5-1: Maximum Predicted Impacts Table 5-2: Maximum Predicted Impacts Added to Monitored Background Concentrations Table 6-1: “Q/d” Screening Analysis for PSD Class I Areas Table 6-2: Predicted Air Quality Impacts Compared to NO2 Vegetation Impact Thresholds Table 6-3: Predicted Air Quality Impacts Compared to CO Vegetation Impact Thresholds Table 6-4: Predicted Air Quality Impacts Compared to Particulate Vegetation Impact Thresholds Table 6-5: Predicted Air Quality Impacts Compared to Formaldehyde Vegetation Impact Thresholds Table 6-6: MAGLC Calculations for Air Toxics Table 6-7: Air Toxics Modeling Results
List of Figures
Figure 1-1: Site Location Map Figure 2-1: Site Layout Figure 4-1: Background Air Quality Monitoring Station Locations
Table of Contents Page iv
Dispersion Modeling Report Oregon Clean Energy
Lucas County, OH Siemens Turbines, Volume 2
List of Acronyms and Abbreviations
% percent
°F degrees Fahrenheit
°K degrees Kelvin
µg/m3 micrograms per cubic meter
ACGIH American Conference of Governmental Industrial Hygienists
AERMAP terrain data preprocessor
AERMET meteorological data preprocessor
AERMOD air dispersion model
AERSURFACE surface characteristics preprocessor
AQRV Air Quality Related Values
Aux. Boiler auxiliary boiler
AWMA Air and Waste Management Association
BACT Best Available Control Technology
BAT Best Available Technology
BPIP Building Profile Input Program
BPIPPRM PRIME Version of BPIP
BP British Petroleum
Btu British thermal units
CAA Clean Air Act
CCGT combined cycle gas turbine
CFR Code of Federal Regulations
CO carbon monoxide
CO2e carbon dioxide equivalents
CTG combustion turbine generator
DAPC Department of Air Pollution Control
DB duct burner
Table of Contents Page v
Dispersion Modeling Report Oregon Clean Energy
Lucas County, OH Siemens Turbines, Volume 2
DLN dry low NOx
EPRI Electric Power Research Institute
FLAG Federal Land Managers’ Air Quality Related Values Working Group
FLM Federal Land Manager
GEP Good Engineering Practice
GHG greenhouse gases
g/m2/yr grams per square meter per year
g/s grams per second
Hp horsepower
HRSG heat recovery steam generator
HRSGN northern heat recovery steam generator
HRSGS southern heat recovery steam generator
H2SO4 sulfuric acid mist
ISO International Organization for Standardization
km kilometer
kV kilovolt
kW kilowatts
m meters
m/s meters per second
MAGLC Maximum Allowable Ground Level Concentration
mg/m3 milligrams per cubic meter
MMBtu million British thermal units
msl mean sea level
MW megawatts
NAAQS National Ambient Air Quality Standards
Nat. gas natural gas
O3 ozone
Table of Contents Page vi
Dispersion Modeling Report Oregon Clean Energy
Lucas County, OH Siemens Turbines, Volume 2
OCE Oregon Clean Energy
Ohio EPA Ohio Environmental Protection Agency
ODNR Ohio Department of Natural Resources
NED National Elevation Dataset
NPS National Park Service
NWS National Weather Service
NO2 nitrogen dioxide
NOx nitrogen oxides
Pb Lead
PM10 particulate matter with a diameter equal to or less than 10 microns
PM2.5 particulate matter with a diameter equal to or less than 2.5 microns
ppb parts per billion
ppm parts per million
the Project the Oregon Clean Energy Center
PSD Prevention of Significant Deterioration
the PSD Permit Application
the Prevention of Significant Deterioration Preconstruction Permit Application
SCR selective catalytic reduction
SER Significant Emission Rate
SIL Significant Impact Level
SMC Significant Monitoring Concentration
SO2 sulfur dioxide
STG steam turbine generator
TAP toxic air pollutant
TES Toledo Environmental Services Division
TLV threshold limit value
tpy tons per year
Table of Contents Page vii
Dispersion Modeling Report Oregon Clean Energy
Lucas County, OH Siemens Turbines, Volume 2
TSP total suspended particulates
ULSD ultra-low sulfur diesel
USEPA United States Environmental Protection Agency
USFS United States Forest Service
USFWS United States Fish and Wildlife Service
USGS United States Geological Survey
VOC volatile organic compounds
Introduction Page 1-1
Dispersion Modeling Report Oregon Clean Energy
Lucas County, OH Siemens Turbines, Volume 2
1. INTRODUCTION
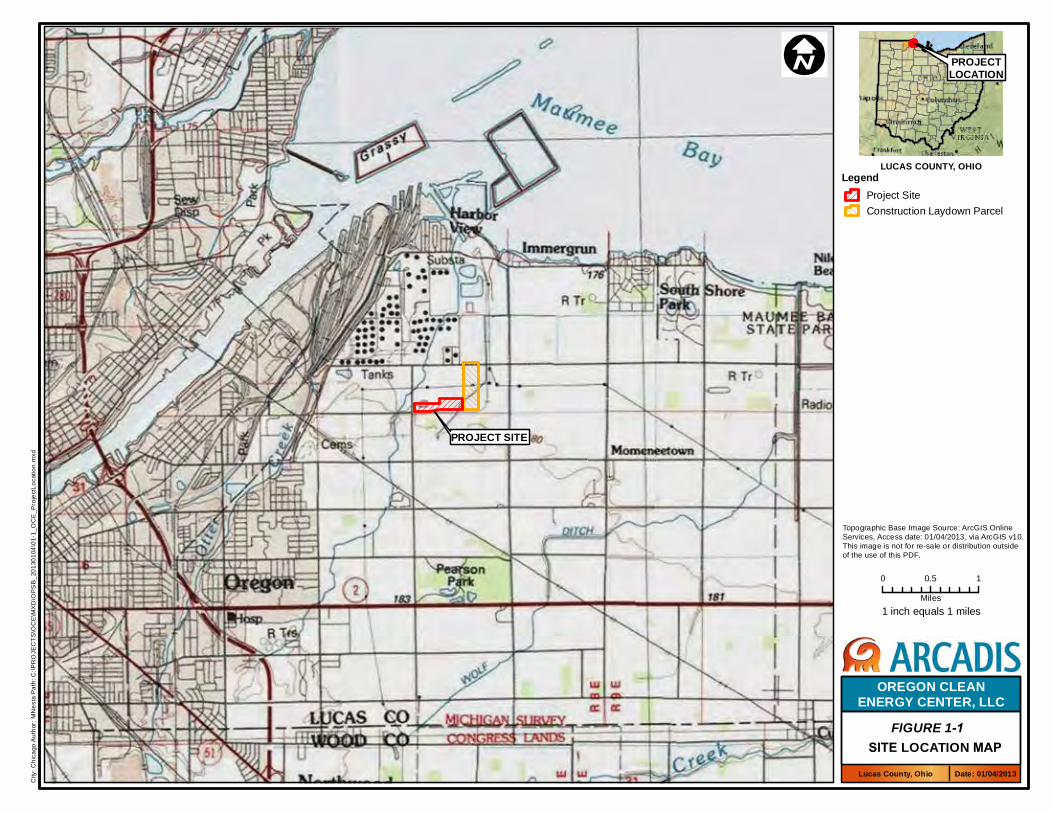
Oregon Clean Energy, LLC (OCE) is proposing to construct the Oregon Clean Energy Center, a nominal 799-megawatt (MW) (unfired International Organization for Standardization [ISO] conditions) combined cycle gas turbine (CCGT) facility (the Project). OCE proposes to construct the Project within an approximately 30-acre parcel of land located entirely within Lucas County in the City of Oregon, Ohio. The general location of the Project is provided in Figure 1-1. The Project will utilize combined cycle combustion turbine technology in a 2 x 2 x 1 configuration. OCE is requesting a permit-to-install that will allow two optional plant configurations. The turbines being considered for the Project are:
· Option 1 – Two Mitsubishi M501 GAC units; or · Option 2 – Two Siemens SGT-8000H units.
The permit application is being provided in two volumes to differentiate information associated with the two turbine engines. A two-volume application for the Prevention of Significant Deterioration (PSD) Preconstruction Permit (the PSD Permit Application) was submitted to the Ohio Environmental Protection Agency (Ohio EPA) for review by the Toledo Environmental Services Division (TES) on February 1, 2013 that included information for both Option 1 and Option 2. This document presents dispersion modeling information for the Siemens turbine scenario. The PSD Permit Application (Volume 2) provides a comprehensive description of the Project and its associated emissions. The application also provides a detailed regulatory review and a Best Available Control Technology (BACT)/Best Available Technology (BAT) analysis. This document provides the modeling analyses required for those pollutants triggering PSD review.
Major Project equipment will include two combustion turbine generators (CTGs), two supplementary-fired heat recovery steam generators (HRSGs), one steam turbine generator (STG), a 16-cell mechanical draft wet cooling tower, and associated auxiliary and balance-of-plant equipment and systems. The Project is intended to operate as a base-load facility and is proposed to be available to operate up to 8,760 hours per year, incorporating a range of load conditions. The Project seeks the flexibility to operate with frequent starts in order to meet energy demands.
0 0.5 1
Miles
City
: Chi
cago
Aut
hor:
MN
esta
Pat
h: C
:\PR
OJE
CT
S\O
CE
\MX
D\O
PS
B_2
0130
104\
01-1
_OC
E_P
roje
ctLo
catio
n.m
xd
LegendProject SiteConstruction Laydown Parcel
PROJECTLOCATION
FIGURE 1-1
OREGON CLEANENERGY CENTER, LLC
SITE LOCATION MAP
LUCAS COUNTY, OHIO
Topographic Base Image Source: ArcGIS OnlineServices, Access date: 01/04/2013, via ArcGIS v10.This image is not for re-sale or distribution outsideof the use of this PDF.
PROJECT SITE
1 inch equals 1 miles
Lucas County, Ohio Date: 01/04/2013
Introduction Page 1-3
Dispersion Modeling Report Oregon Clean Energy
Lucas County, OH Siemens Turbines, Volume 2
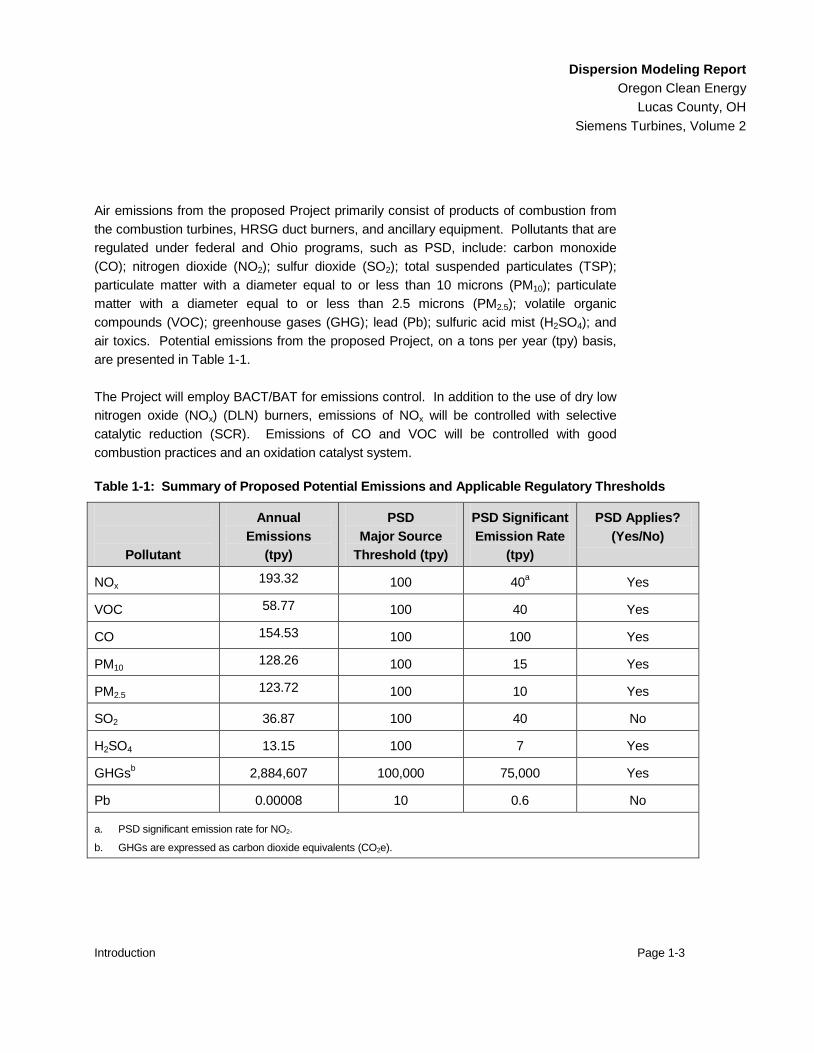
Air emissions from the proposed Project primarily consist of products of combustion from the combustion turbines, HRSG duct burners, and ancillary equipment. Pollutants that are regulated under federal and Ohio programs, such as PSD, include: carbon monoxide (CO); nitrogen dioxide (NO2); sulfur dioxide (SO2); total suspended particulates (TSP); particulate matter with a diameter equal to or less than 10 microns (PM10); particulate matter with a diameter equal to or less than 2.5 microns (PM2.5); volatile organic compounds (VOC); greenhouse gases (GHG); lead (Pb); sulfuric acid mist (H2SO4); and air toxics. Potential emissions from the proposed Project, on a tons per year (tpy) basis, are presented in Table 1-1.
The Project will employ BACT/BAT for emissions control. In addition to the use of dry low nitrogen oxide (NOx) (DLN) burners, emissions of NOx will be controlled with selective catalytic reduction (SCR). Emissions of CO and VOC will be controlled with good combustion practices and an oxidation catalyst system.
Table 1-1: Summary of Proposed Potential Emissions and Applicable Regulatory Thresholds
Pollutant
Annual Emissions
(tpy)
PSD Major Source
Threshold (tpy)
PSD Significant Emission Rate
(tpy)
PSD Applies? (Yes/No)
NOx 193.32 100 40a Yes
VOC 58.77 100 40 Yes
CO 154.53 100 100 Yes
PM10 128.26 100 15 Yes
PM2.5 123.72 100 10 Yes
SO2 36.87 100 40 No
H2SO4 13.15 100 7 Yes
GHGsb 2,884,607 100,000 75,000 Yes
Pb 0.00008 10 0.6 No
a. PSD significant emission rate for NO2.
b. GHGs are expressed as carbon dioxide equivalents (CO2e).
Project Description Page 2-1
Dispersion Modeling Report Oregon Clean Energy
Lucas County, OH Siemens Turbines, Volume 2
2. PROJECT DESCRIPTION
2.1 Overview
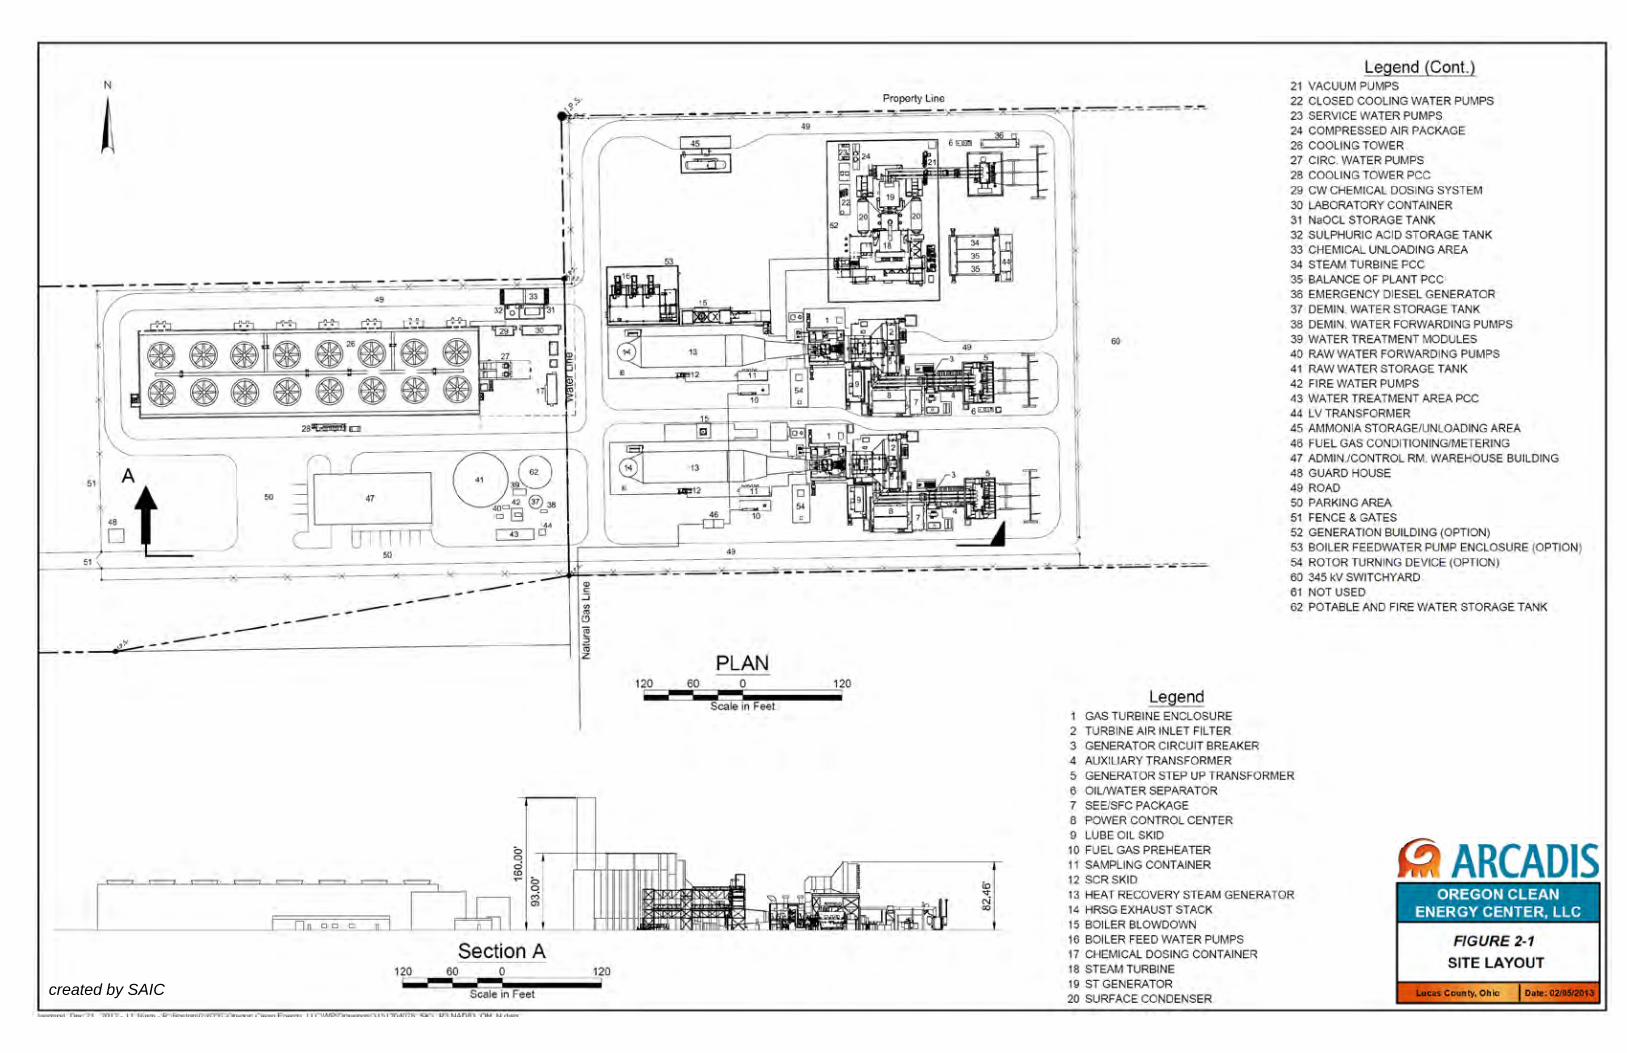
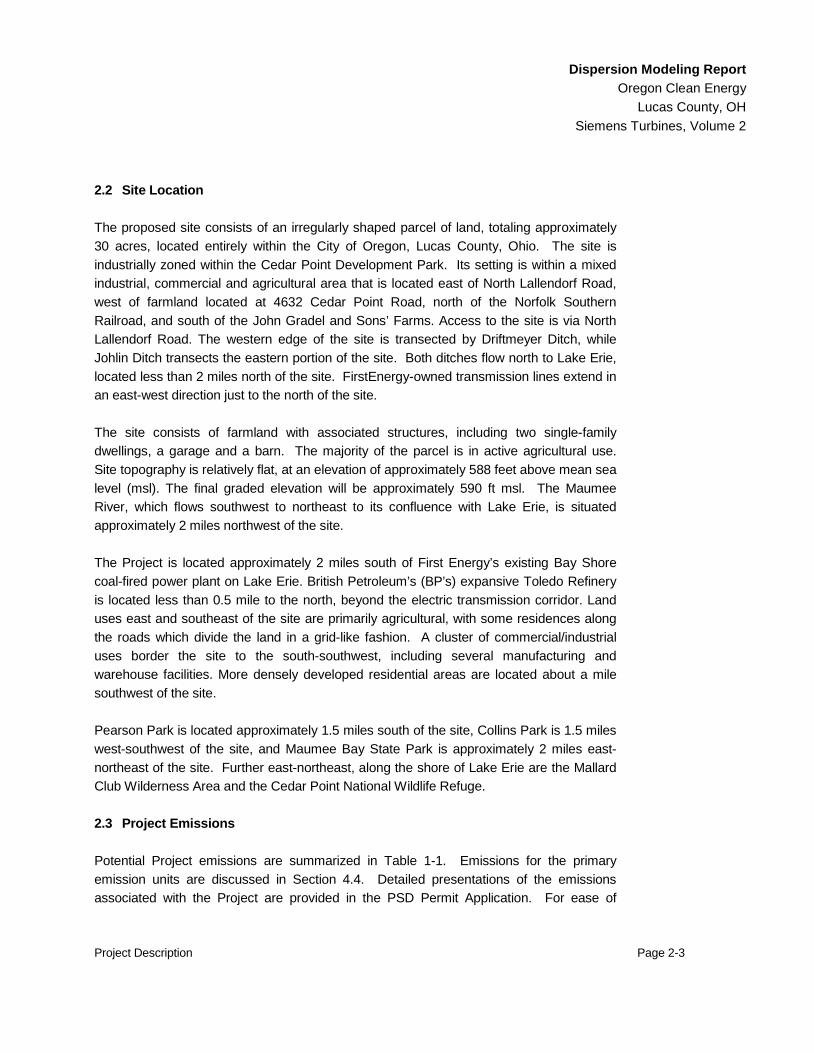
OCE proposes development of a nominal 799-MW electric generating facility (ISO conditions) at an industrially zoned site in the City of Oregon, Ohio. Figure 1-1 presents the proposed Project location on a topographic map. Figure 2-1 provides a site layout of the facility. The facility will be comprised of the following major and ancillary equipment:
· Two CTGs;
· Two HRSGs with supplemental duct firing;
· One STG;
· One 16-cell mechanical draft wet cooling tower;
· One 2,250 kilowatt (kW) emergency diesel generator using ultra-low sulfur diesel (ULSD) fuel; OCE is proposing a permit limit of 500 hours of operation per year;
· One natural gas-fired, 99-million British thermal units (MMBtu) steam production auxiliary boiler; OCE is proposing a permit limit of 2,000 hours of operation per year; and
· One 300-horsepower (hp) fire pump using ULSD fuel; OCE is proposing a permit limit of 500 hours of operation per year.
The Project will be fueled by clean-burning natural gas. A new natural gas lateral will be built and operated to connect with nearby natural gas transmission lines. Electrical interconnection will be to the 345-kilovolt (kV) FirstEnergy transmission line, located just north of the site.
The facility will utilize a 16-cell mechanical draft wet cooling tower with an average consumptive water use of 3-4 million gallons per day. Raw water from the City of Oregon is being proposed for process use. Discharge of wastewater will be to the Oregon sanitary sewer system for treatment at the wastewater treatment plant, located within 1 mile of the site. The cooling tower will be equipped with high efficiency (0.0005%) drift eliminators.
created by SAIC
Project Description Page 2-3
Dispersion Modeling Report Oregon Clean Energy
Lucas County, OH Siemens Turbines, Volume 2
2.2 Site Location
The proposed site consists of an irregularly shaped parcel of land, totaling approximately 30 acres, located entirely within the City of Oregon, Lucas County, Ohio. The site is industrially zoned within the Cedar Point Development Park. Its setting is within a mixed industrial, commercial and agricultural area that is located east of North Lallendorf Road, west of farmland located at 4632 Cedar Point Road, north of the Norfolk Southern Railroad, and south of the John Gradel and Sons’ Farms. Access to the site is via North Lallendorf Road. The western edge of the site is transected by Driftmeyer Ditch, while Johlin Ditch transects the eastern portion of the site. Both ditches flow north to Lake Erie, located less than 2 miles north of the site. FirstEnergy-owned transmission lines extend in an east-west direction just to the north of the site.
The site consists of farmland with associated structures, including two single-family dwellings, a garage and a barn. The majority of the parcel is in active agricultural use. Site topography is relatively flat, at an elevation of approximately 588 feet above mean sea level (msl). The final graded elevation will be approximately 590 ft msl. The Maumee River, which flows southwest to northeast to its confluence with Lake Erie, is situated approximately 2 miles northwest of the site.
The Project is located approximately 2 miles south of First Energy’s existing Bay Shore coal-fired power plant on Lake Erie. British Petroleum’s (BP’s) expansive Toledo Refinery is located less than 0.5 mile to the north, beyond the electric transmission corridor. Land uses east and southeast of the site are primarily agricultural, with some residences along the roads which divide the land in a grid-like fashion. A cluster of commercial/industrial uses border the site to the south-southwest, including several manufacturing and warehouse facilities. More densely developed residential areas are located about a mile southwest of the site.
Pearson Park is located approximately 1.5 miles south of the site, Collins Park is 1.5 miles west-southwest of the site, and Maumee Bay State Park is approximately 2 miles east-northeast of the site. Further east-northeast, along the shore of Lake Erie are the Mallard Club Wilderness Area and the Cedar Point National Wildlife Refuge.
2.3 Project Emissions
Potential Project emissions are summarized in Table 1-1. Emissions for the primary emission units are discussed in Section 4.4. Detailed presentations of the emissions associated with the Project are provided in the PSD Permit Application. For ease of

Project Description Page 2-4
Dispersion Modeling Report Oregon Clean Energy
Lucas County, OH Siemens Turbines, Volume 2
review, supporting emissions calculations are also provided in Appendix A of this document.
Regulatory Applicability Evaluation Page 3-1
Dispersion Modeling Report Oregon Clean Energy
Lucas County, OH Siemens Turbines, Volume 2
3. REGULATORY APPLICABILITY EVALUATION
OCE is requesting approval to construct a nominal 799-MW (ISO conditions) combined cycle electric generating facility at an industrially zoned site in the City of Oregon, Ohio. The Project is considered a new major stationary combustion source under PSD regulations because the potential annual emissions from the facility exceed major source thresholds, as illustrated in Table 1-1.
A comprehensive regulatory review for the Project is provided in the Section 3 of the PSD Permit Application (Volume 2). This section contains an analysis of the applicability of federal and state air quality regulations to the proposed Project as they pertain to dispersion modeling requirements.
3.1 PSD New Source Review
OCE is requesting approval to construct a nominal 799-MW (ISO Conditions) combined cycle electric generating facility in the City of Oregon, Lucas County, Ohio. Lucas County is in attainment of the National Ambient Air Quality Standards (NAAQS) for all criteria pollutants and is, therefore, regulated under the PSD program.
Combined cycle power plants with potential emissions greater than 100 tpy of one or more criteria pollutants are considered new major stationary sources under the PSD program. As shown in Table 1-1, the potential emissions of at least one regulated criteria pollutant will exceed this threshold. As such, the proposed facility is subject to PSD New Source Review. Under the PSD regulations, once a major source threshold is triggered, PSD review must be completed for all pollutants whose potential emissions exceed their respective Significant Emission Rate (SER).
As presented in Table 1-1, OCE has triggered the major source threshold for at least one pollutant. As such, PSD review is required for NOx, CO, VOC, H2SO4, PM2.5, PM10 and GHG emissions. Of these pollutants, an ambient air quality impact analysis is required for NOx (as NO2), CO, PM2.5 and PM10. PSD review requirements include application of BACT, an ambient air quality modeling analysis demonstrating compliance with the NAAQS and PSD increments, an analysis of potential impacts to designated PSD Class I areas, and an additional impacts analysis. Ohio has been delegated PSD review authority by the United States Environmental Protection Agency (USEPA).
Regulatory Applicability Evaluation Page 3-2
Dispersion Modeling Report Oregon Clean Energy
Lucas County, OH Siemens Turbines, Volume 2
3.1.1 Best Available Control Technology
Pollutants subject to PSD review are required to apply BACT for control of emissions of PSD pollutants. BACT is defined as an emission limitation based on the maximum degree of reduction, on a case-by-case basis, taking into account energy, environmental and economic considerations. A BACT analysis is presented in the PSD Permit Application.
3.1.2 Air Quality Impact Analysis
An ambient air quality impact analysis must be performed to demonstrate compliance with NAAQS and PSD increments. Proposed new sources subject to PSD review may not cause or significantly contribute to a violation of the NAAQS. As part of this demonstration, the USEPA has established Significant Impact Levels (SILs) for all of the criteria pollutants. SILs represent concentrations of pollutants that are considered to be insignificant with respect to demonstration of NAAQS compliance. Proposed new sources whose air quality impacts exceed the SILs must complete a cumulative analysis taking into consideration existing background air quality levels and contributions from other sources. In addition to demonstrating compliance with the NAAQS, new sources must comply with PSD increments, which specify the maximum allowable increase in concentration that is allowed to occur in areas meeting the NAAQS for any regulated pollutant.
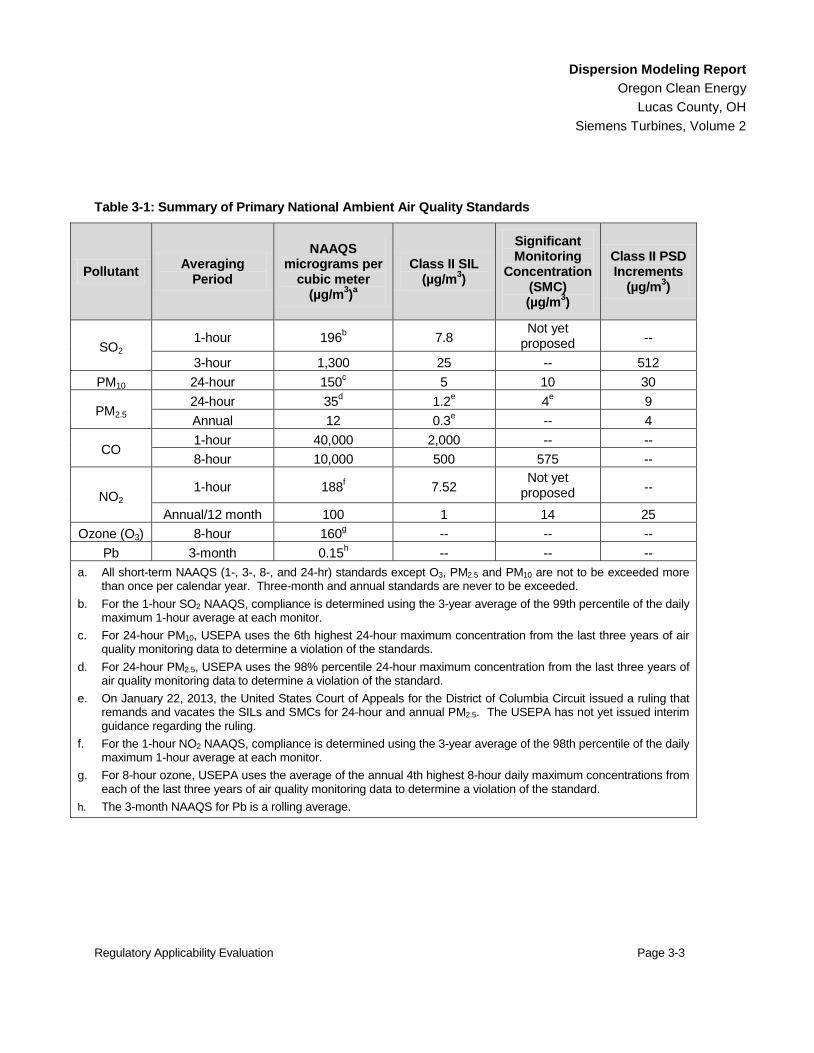
Table 3-1 presents a summary of the NAAQS, SILs, and PSD increments. The air quality impact analysis for the Project is provided in Section 5 of this document.
3.1.1 PSD Class I Area Impact Analysis
PSD regulations require that proposed major sources within 100 kilometers (km) of a PSD Class I area perform an assessment of potential impacts in the PSD Class I area. PSD Class I areas are specifically designated areas of special national or regional value from a natural, scenic, recreational or historic perspective. These areas are administered by the National Park Service (NPS), United States Fish and Wildlife Service (USFWS), or the United States Forest Service (USFS). Federal Land Managers (FLMs) are responsible for evaluating proposed projects’ air quality impacts in the Class I areas and may make recommendations to the permitting agency to approve or deny permit applications. The PSD Class I area impact analysis is presented in Section 6.
Regulatory Applicability Evaluation Page 3-3
Dispersion Modeling Report Oregon Clean Energy
Lucas County, OH Siemens Turbines, Volume 2
Table 3-1: Summary of Primary National Ambient Air Quality Standards
Pollutant Averaging Period
NAAQS micrograms per
cubic meter (µg/m3)a
Class II SIL (µg/m3)
Significant Monitoring
Concentration (SMC) (µg/m3)
Class II PSD Increments
(µg/m3)
SO2 1-hour 196b 7.8
Not yet proposed --
3-hour 1,300 25 -- 512 PM10 24-hour 150c 5 10 30
PM2.5 24-hour 35d 1.2e 4e 9 Annual 12 0.3e -- 4
CO 1-hour 40,000 2,000 -- -- 8-hour 10,000 500 575 --
NO2 1-hour 188f 7.52
Not yet proposed --
Annual/12 month 100 1 14 25 Ozone (O3) 8-hour 160g -- -- --
Pb 3-month 0.15h -- -- -- a. All short-term NAAQS (1-, 3-, 8-, and 24-hr) standards except O3, PM2.5 and PM10 are not to be exceeded more
than once per calendar year. Three-month and annual standards are never to be exceeded. b. For the 1-hour SO2 NAAQS, compliance is determined using the 3-year average of the 99th percentile of the daily
maximum 1-hour average at each monitor. c. For 24-hour PM10, USEPA uses the 6th highest 24-hour maximum concentration from the last three years of air
quality monitoring data to determine a violation of the standards. d. For 24-hour PM2.5, USEPA uses the 98% percentile 24-hour maximum concentration from the last three years of
air quality monitoring data to determine a violation of the standard. e. On January 22, 2013, the United States Court of Appeals for the District of Columbia Circuit issued a ruling that
remands and vacates the SILs and SMCs for 24-hour and annual PM2.5. The USEPA has not yet issued interim guidance regarding the ruling.
f. For the 1-hour NO2 NAAQS, compliance is determined using the 3-year average of the 98th percentile of the daily maximum 1-hour average at each monitor.
g. For 8-hour ozone, USEPA uses the average of the annual 4th highest 8-hour daily maximum concentrations from each of the last three years of air quality monitoring data to determine a violation of the standard.
h. The 3-month NAAQS for Pb is a rolling average.
Regulatory Applicability Evaluation Page 3-4
Dispersion Modeling Report Oregon Clean Energy
Lucas County, OH Siemens Turbines, Volume 2
3.1.2 Additional Impact Analyses
Additional impact analyses are also required as part of PSD review. These additional analyses include an assessment of impacts on community growth resulting from the Project and an assessment of impacts to soils and vegetation. The additional impact analyses are presented in Section 6.
The Endangered Species Act of 1973 requires that all federal actions, such as the issuance of PSD permits, not jeopardize the existence of any endangered or threatened species or result in the destruction or adverse modification of the habitat of such species. Section 6.4 provides a discussion on endangered species considered for the Project.
3.2 Other Applicable Regulations
Other federal and state regulations applicable to the Project are described in the PSD Permit Application (Volume 2). Of relevance to the Dispersion Modeling Report, Ohio EPA’s Air Toxics Policy (Ohio EPA, 1986) requires a modeling evaluation of the ambient impacts of toxic air pollutant (TAP) emissions. This analysis is provided in Section 6.5.
Modeling Procedures Page 4-1
Dispersion Modeling Report Oregon Clean Energy
Lucas County, OH Siemens Turbines, Volume 2
4. MODELING PROCEDURES
The methodology used for the modeling presented below is consistent with the guidance provided by the USEPA in the “Guideline on Air Quality Models” (USEPA, 2005); and by the Ohio EPA in “Engineering Guide 69” (Ohio EPA, 2003).
4.1 Model Selection
AERMOD (version 12345) was selected to predict ambient concentrations in simple (below stack height), complex (above plume height) and intermediate (between stack height and plume height) terrain. The AERMOD Modeling System includes preprocessor programs (AERMET, AERSURFACE, and AERMAP) to create the required input files for meteorology and receptor terrain elevations. AERMOD is the recommended model in USEPA’s Guideline on Air Quality Models (40 Code of Federal Regulations [CFR] Part 51, Appendix W) (USEPA, 2005). The regulatory default option was used in the modeling for all pollutants, which includes the following commands:
· The elevated terrain algorithms requiring input of terrain height data for receptors and emission sources;
· Stack-tip downwash (building downwash automatically overrides);
· The “calms” processing routines;
· Buoyancy-induced dispersion; and
· The missing meteorological data processing routines.
4.2 Receptors
A 5 km x 5 km Cartesian receptor grid with 100-meter (m) spacing between the receptors and a 25 km x 25 km Cartesian grid with a 1,000-m spacing between receptors was used. Fence-line receptors were placed around the property boundary at 25-m spacing.
Receptor elevations were assigned using the USEPA’s AERMAP software tool (version 06341), which is designed to extract elevations from United States Geological Survey (USGS) National Elevation Dataset (NED) data at 1/3 arc second resolution in GeoTIFF format (USGS, 2002). This represents the highest resolution digital terrain data available from the USGS for this geographic area.
AERMAP, the terrain preprocessor for AERMOD, uses interpolation procedures to assign elevations to a receptor:
Modeling Procedures Page 4-2
Dispersion Modeling Report Oregon Clean Energy
Lucas County, OH Siemens Turbines, Volume 2
· For each receptor, the program searches through the NED data index files to determine the two profiles (longitudes or eastings) that straddle the receptor.
· For each of these two profiles, the program then searches through the nodes in the index file to determine which two rows (latitudes or northings) straddle the receptor.
· The program then reads the elevations for these four points. A two-dimensional distance-weighted interpolation is then used to determine the elevation at the receptor location based on the elevations at the four nodes determined above.
The AERMAP files are provided on the compact disc in Appendix D.
4.3 Meteorological Data
The AERMOD-ready, five-year meteorological data set obtained from Ohio EPA was used for meteorological inputs. This data set includes hourly surface data from the National Weather Service (NWS) site at Toledo Express Airport and upper air observations from Detroit, Michigan for calendar years 2006 through 2010.
Land use for the area surrounding the Toledo Airport anemometer site was used to estimate surface characteristics (surface roughness, albedo and Bowen ratio). The AERSURFACE processor was used to determine seasonal surface characteristics as a function of wind direction.
4.4 Emissions Data and Stack Parameters
The modeling analyses include the following Project sources:
· Two combined cycle combustion turbines with HRSG duct burners (combusting only natural gas);
· An auxiliary boiler (combusting only natural gas); and
· A 16-cell mechanical draft wet cooling system.
The emission rates and stack exit parameters used in the modeling analyses are provided in the following tables: combined cycle units (Table 4-1), turbine start-up events (Table 4-2), and ancillary equipment (Table 4-3). Detailed emission calculations are provided in Appendix A of this report.
Modeling Procedures Page 4-3
Dispersion Modeling Report Oregon Clean Energy
Lucas County, OH Siemens Turbines, Volume 2
4.4.1 Combined Cycle Turbines
Impacts were evaluated for a representative range of steady-state turbine operating scenarios provided by the turbine supplier. The scenarios selected for modeling cover a wide range of temperature, load and supplemental duct firing conditions. The modeled operating scenarios identified in Table 4-1 were selected as being representative of the full range of proposed operating scenarios to ensure model prediction of maximum Project impacts. The minimum load at which the turbine will achieve the guaranteed emission performance varies with ambient temperature. Duct firing is proposed only at full load, with temperature at or above 59 degrees Fahrenheit (°F). Impacts for PM2.5 and for PM10 were assessed for the turbines (worst case) and the cooling tower.
The auxiliary boiler will not operate when the turbines are running, aside from starts and periodic testing. Peak 1-hour impacts for CO were predicted to occur during warm starts with the auxiliary boiler operating. One-hour impacts of NO2 during cold starts were not considered pursuant to the March 1, 2011 USEPA guidance memorandum entitled "Additional Clarification Regarding Applicability of Appendix W Modeling Guidance for the 1-hour NO2 NAAQS" (USEPA, 2011) which allows intermittent events (like cold starts) to be excluded from modeling for 1-hour NO2. The worst case 1-hour operating scenario for NO2 impacts was determined to be one turbine during a warm start with the auxiliary boiler operating. Shutdown scenarios were not modeled, since the hot, warm, and cold start scenarios were determined to represent worst case. Emissions of PM10, PM2.5, and NOx (annual) are highest during steady state scenarios, and impacts for those pollutants were, therefore, not evaluated for start-up and shutdown scenarios. Emissions during start-up scenarios are provided in Table 4-2.
The auxiliary boiler stack runs alongside and at the same height as the north HRSG stack. As per the USEPA criteria for merging plumes (USEPA, 1996), when the north turbine and the auxiliary boiler were both operating, those two stacks were modeled as a single stack, using the diameter, exit velocity and temperature of the HRSG stack. However, when the south turbine and the auxiliary boiler were running, the south HRSG stack and the auxiliary boiler stack were modeled as separate stacks due to their considerable separation. It was determined that the maximum impacts for 1-hour NO2 and CO resulted from operation of the south turbine with the auxiliary boiler during start-up.
Modeling Procedures Page 4-4
Dispersion Modeling Report Oregon Clean Energy
Lucas County, OH Siemens Turbines, Volume 2
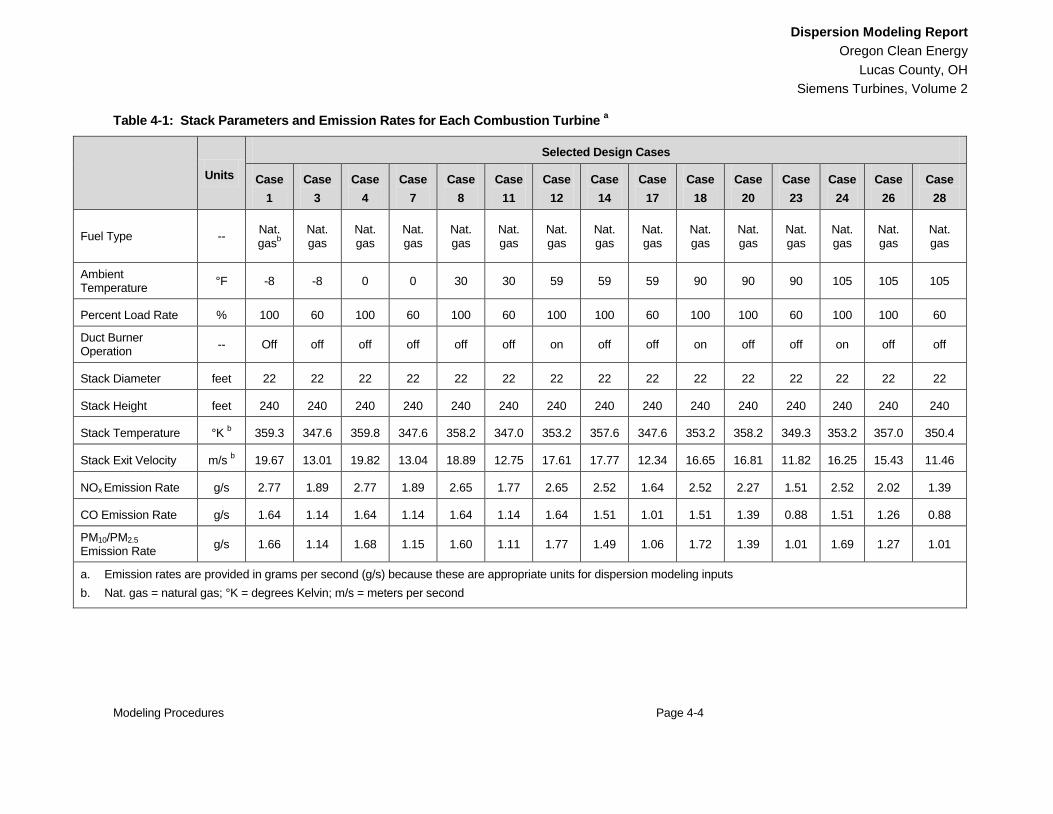
Table 4-1: Stack Parameters and Emission Rates for Each Combustion Turbine a
Units
Selected Design Cases
Case 1
Case 3
Case 4
Case 7
Case 8
Case 11
Case 12
Case 14
Case 17
Case 18
Case 20
Case 23
Case 24
Case 26
Case 28
Fuel Type -- Nat. gasb
Nat. gas
Nat. gas
Nat. gas
Nat. gas
Nat. gas
Nat. gas
Nat. gas
Nat. gas
Nat. gas
Nat. gas
Nat. gas
Nat. gas
Nat. gas
Nat. gas
Ambient Temperature °F -8 -8 0 0 30 30 59 59 59 90 90 90 105 105 105
Percent Load Rate % 100 60 100 60 100 60 100 100 60 100 100 60 100 100 60
Duct Burner Operation -- Off off off off off off on off off on off off on off off
Stack Diameter feet 22 22 22 22 22 22 22 22 22 22 22 22 22 22 22
Stack Height feet 240 240 240 240 240 240 240 240 240 240 240 240 240 240 240
Stack Temperature °K b 359.3 347.6 359.8 347.6 358.2 347.0 353.2 357.6 347.6 353.2 358.2 349.3 353.2 357.0 350.4
Stack Exit Velocity m/s b 19.67 13.01 19.82 13.04 18.89 12.75 17.61 17.77 12.34 16.65 16.81 11.82 16.25 15.43 11.46
NOx Emission Rate g/s 2.77 1.89 2.77 1.89 2.65 1.77 2.65 2.52 1.64 2.52 2.27 1.51 2.52 2.02 1.39
CO Emission Rate g/s 1.64 1.14 1.64 1.14 1.64 1.14 1.64 1.51 1.01 1.51 1.39 0.88 1.51 1.26 0.88
PM10/PM2.5 Emission Rate g/s 1.66 1.14 1.68 1.15 1.60 1.11 1.77 1.49 1.06 1.72 1.39 1.01 1.69 1.27 1.01
a. Emission rates are provided in grams per second (g/s) because these are appropriate units for dispersion modeling inputs b. Nat. gas = natural gas; °K = degrees Kelvin; m/s = meters per second
Modeling Procedures Page 4-5
Dispersion Modeling Report Oregon Clean Energy
Lucas County, OH Siemens Turbines, Volume 2
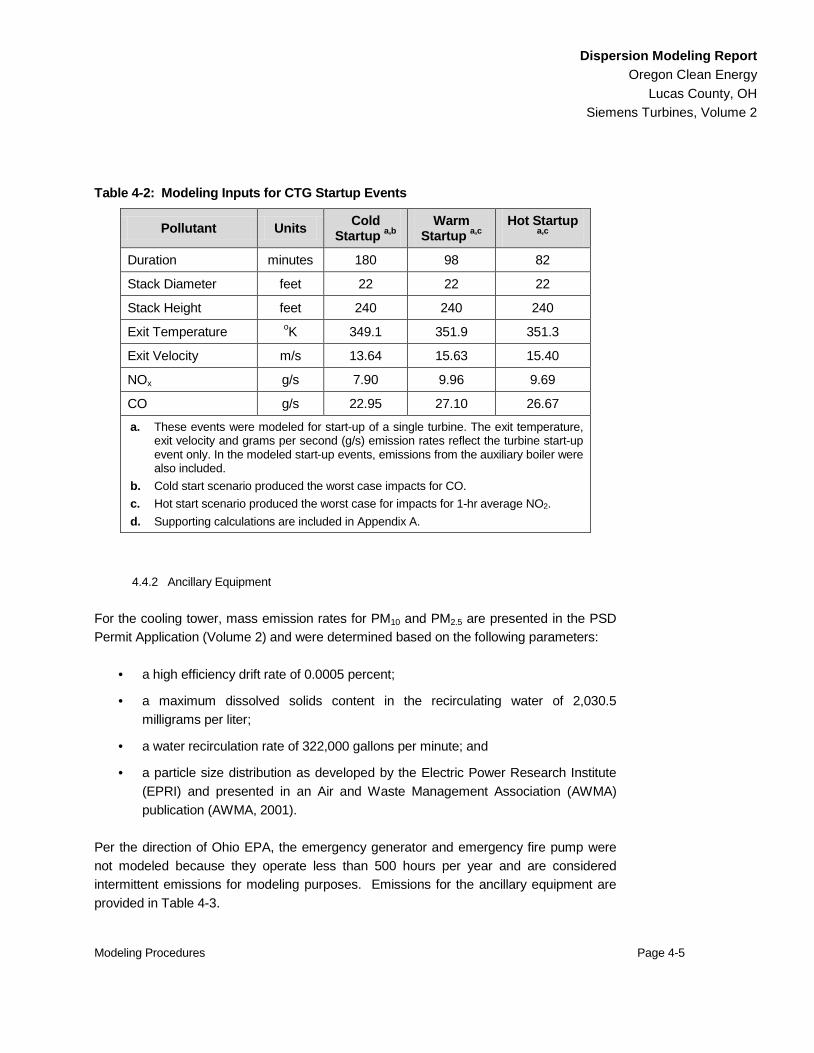
Table 4-2: Modeling Inputs for CTG Startup Events
Pollutant Units Cold Startup a,b
Warm Startup a,c
Hot Startup a,c
Duration minutes 180 98 82
Stack Diameter feet 22 22 22
Stack Height feet 240 240 240
Exit Temperature oK 349.1 351.9 351.3
Exit Velocity m/s 13.64 15.63 15.40
NOx g/s 7.90 9.96 9.69
CO g/s 22.95 27.10 26.67
a. These events were modeled for start-up of a single turbine. The exit temperature, exit velocity and grams per second (g/s) emission rates reflect the turbine start-up event only. In the modeled start-up events, emissions from the auxiliary boiler were also included.
b. Cold start scenario produced the worst case impacts for CO. c. Hot start scenario produced the worst case for impacts for 1-hr average NO2. d. Supporting calculations are included in Appendix A.
4.4.2 Ancillary Equipment
For the cooling tower, mass emission rates for PM10 and PM2.5 are presented in the PSD Permit Application (Volume 2) and were determined based on the following parameters:
· a high efficiency drift rate of 0.0005 percent;
· a maximum dissolved solids content in the recirculating water of 2,030.5 milligrams per liter;
· a water recirculation rate of 322,000 gallons per minute; and
· a particle size distribution as developed by the Electric Power Research Institute (EPRI) and presented in an Air and Waste Management Association (AWMA) publication (AWMA, 2001).
Per the direction of Ohio EPA, the emergency generator and emergency fire pump were not modeled because they operate less than 500 hours per year and are considered intermittent emissions for modeling purposes. Emissions for the ancillary equipment are provided in Table 4-3.
Modeling Procedures Page 4-6
Dispersion Modeling Report Oregon Clean Energy
Lucas County, OH Siemens Turbines, Volume 2
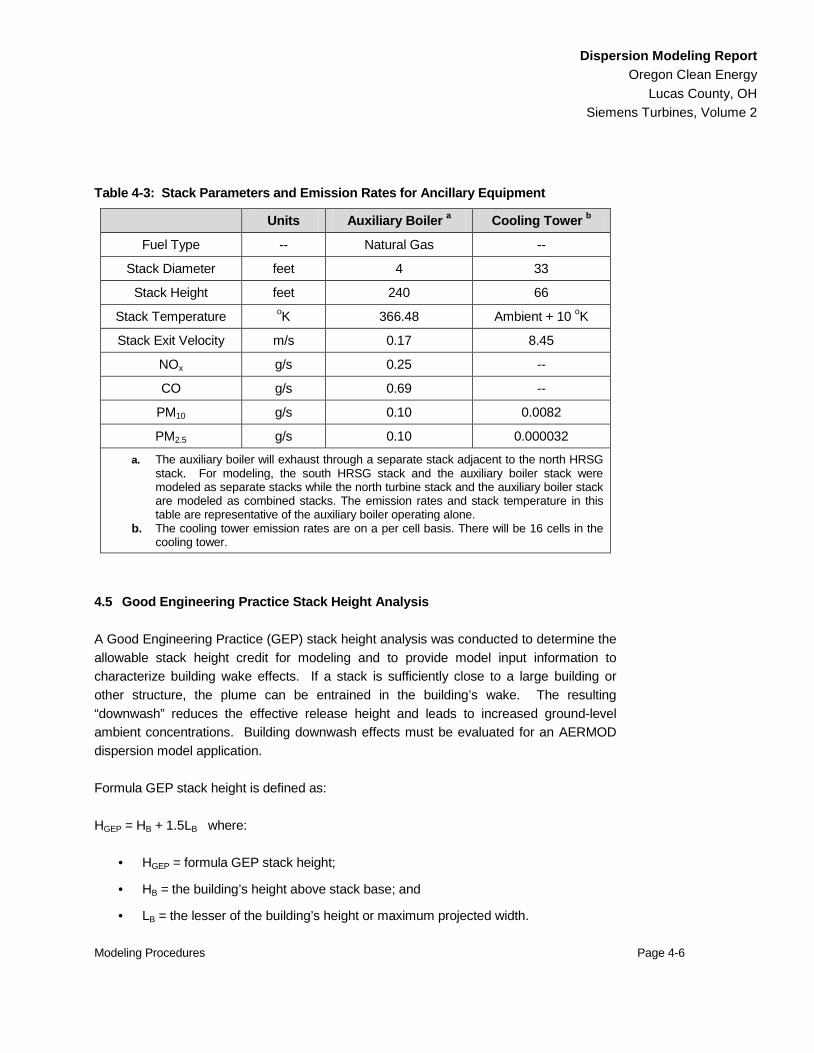
Table 4-3: Stack Parameters and Emission Rates for Ancillary Equipment
Units Auxiliary Boiler a Cooling Tower b
Fuel Type -- Natural Gas --
Stack Diameter feet 4 33
Stack Height feet 240 66
Stack Temperature oK 366.48 Ambient + 10 oK
Stack Exit Velocity m/s 0.17 8.45
NOx g/s 0.25 --
CO g/s 0.69 --
PM10 g/s 0.10 0.0082
PM2.5 g/s 0.10 0.000032
a. The auxiliary boiler will exhaust through a separate stack adjacent to the north HRSG stack. For modeling, the south HRSG stack and the auxiliary boiler stack were modeled as separate stacks while the north turbine stack and the auxiliary boiler stack are modeled as combined stacks. The emission rates and stack temperature in this table are representative of the auxiliary boiler operating alone.
b. The cooling tower emission rates are on a per cell basis. There will be 16 cells in the cooling tower.
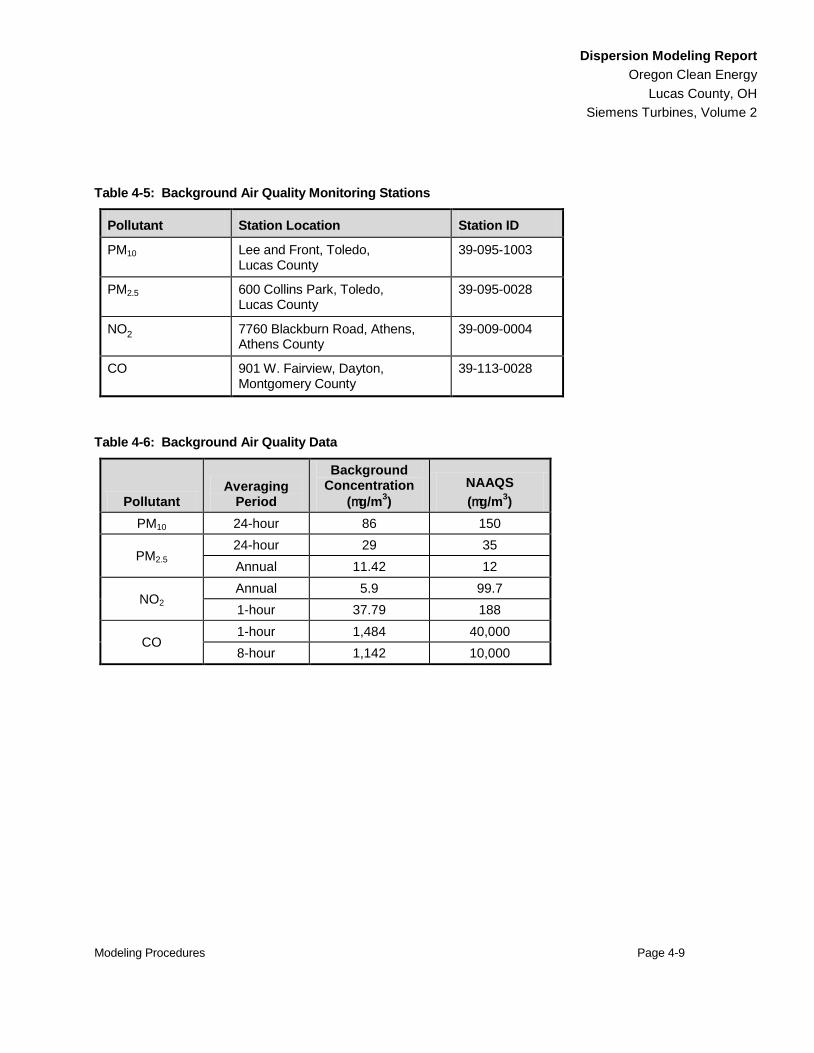
4.5 Good Engineering Practice Stack Height Analysis
A Good Engineering Practice (GEP) stack height analysis was conducted to determine the allowable stack height credit for modeling and to provide model input information to characterize building wake effects. If a stack is sufficiently close to a large building or other structure, the plume can be entrained in the building’s wake. The resulting “downwash” reduces the effective release height and leads to increased ground-level ambient concentrations. Building downwash effects must be evaluated for an AERMOD dispersion model application.
Formula GEP stack height is defined as:
HGEP = HB + 1.5LB where:
· HGEP = formula GEP stack height;
· HB = the building’s height above stack base; and
· LB = the lesser of the building’s height or maximum projected width.
Modeling Procedures Page 4-7
Dispersion Modeling Report Oregon Clean Energy
Lucas County, OH Siemens Turbines, Volume 2
A second definition of GEP stack height is “regulatory” GEP stack height. Regulatory GEP stack height is either 65 m or formula GEP stack height, whichever is greater. Sources are not allowed to take credit for stack height above regulatory GEP stack height when modeling to demonstrate compliance with ambient air quality standards.
The USEPA Building Profile Input Program (BPIP) (USEPA, 1995) produces the model input information necessary to account for building wake effects, based on the dimensions of buildings in the vicinity of the stacks. The “PRIME” version of BPIP (BPIPPRM) (Schulman, et al., 1997) is used with AERMOD. The position and height of buildings relative to the stack positions must be evaluated in the GEP analysis. Figure 2-1 presents a site layout of the facility.
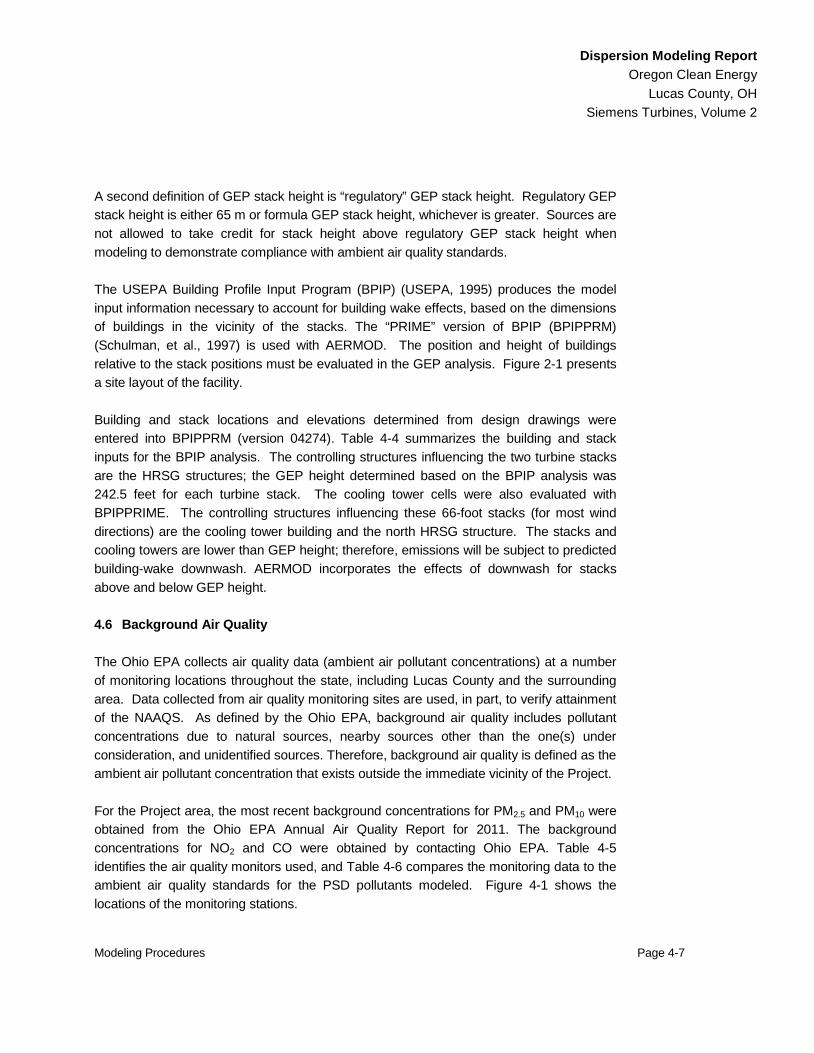
Building and stack locations and elevations determined from design drawings were entered into BPIPPRM (version 04274). Table 4-4 summarizes the building and stack inputs for the BPIP analysis. The controlling structures influencing the two turbine stacks are the HRSG structures; the GEP height determined based on the BPIP analysis was 242.5 feet for each turbine stack. The cooling tower cells were also evaluated with BPIPPRIME. The controlling structures influencing these 66-foot stacks (for most wind directions) are the cooling tower building and the north HRSG structure. The stacks and cooling towers are lower than GEP height; therefore, emissions will be subject to predicted building-wake downwash. AERMOD incorporates the effects of downwash for stacks above and below GEP height.
4.6 Background Air Quality
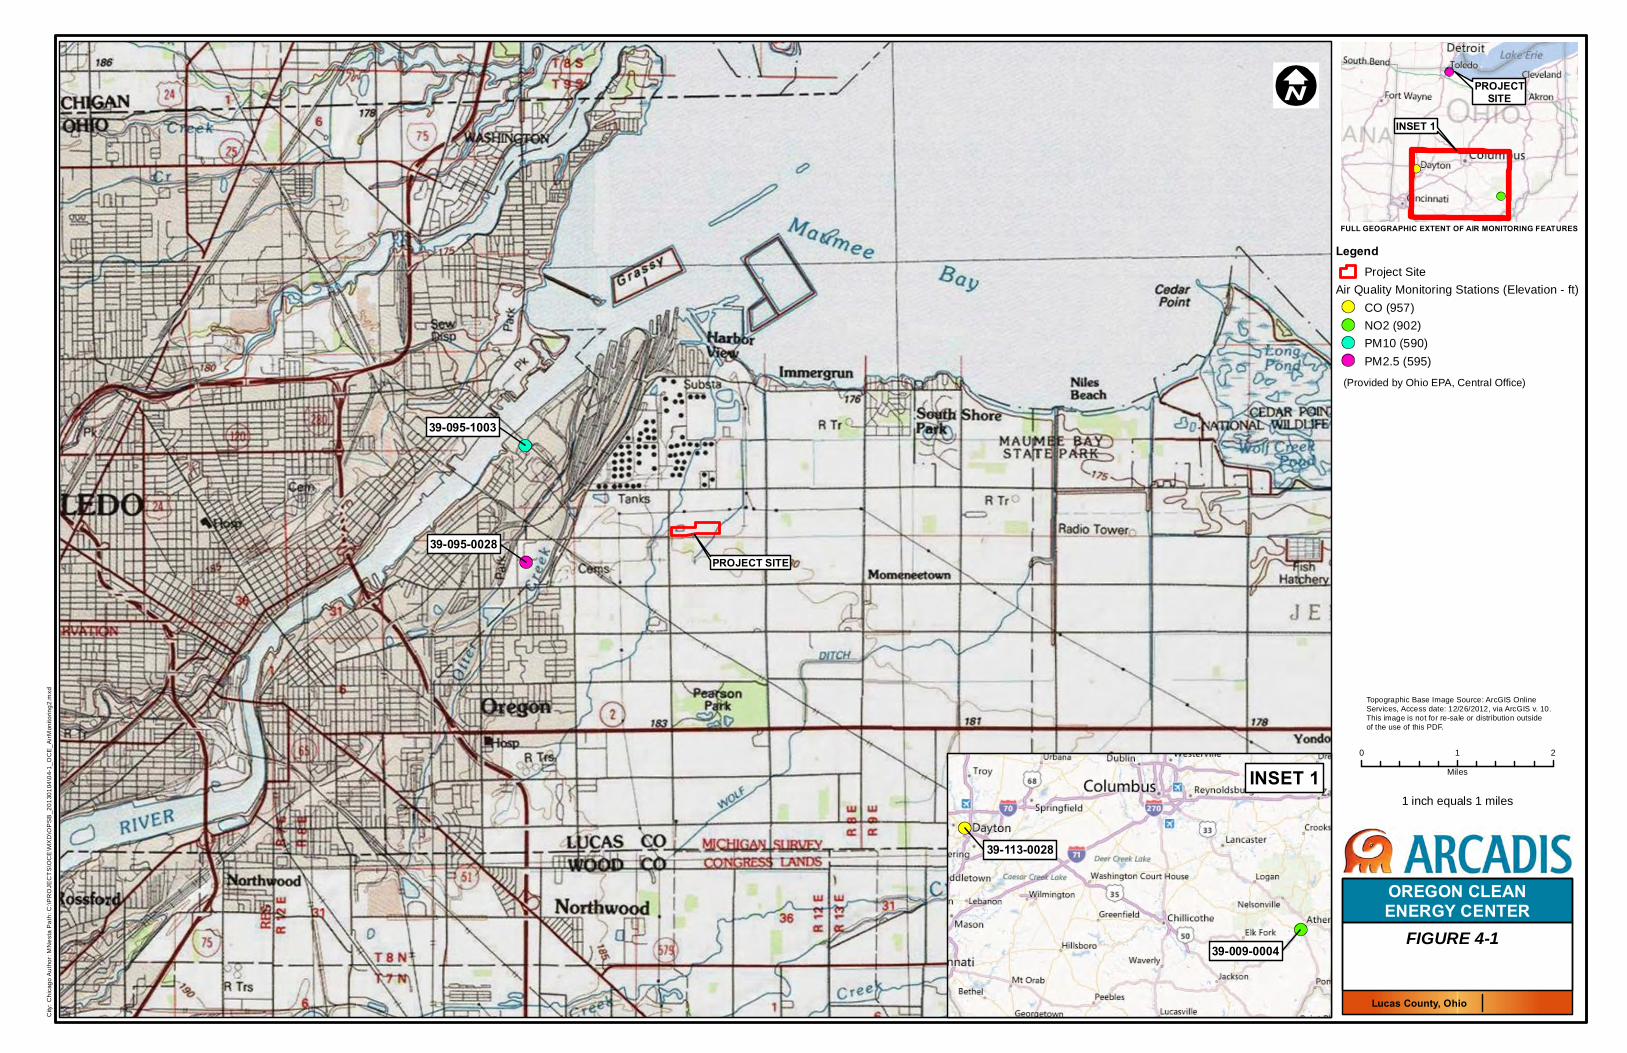
The Ohio EPA collects air quality data (ambient air pollutant concentrations) at a number of monitoring locations throughout the state, including Lucas County and the surrounding area. Data collected from air quality monitoring sites are used, in part, to verify attainment of the NAAQS. As defined by the Ohio EPA, background air quality includes pollutant concentrations due to natural sources, nearby sources other than the one(s) under consideration, and unidentified sources. Therefore, background air quality is defined as the ambient air pollutant concentration that exists outside the immediate vicinity of the Project.
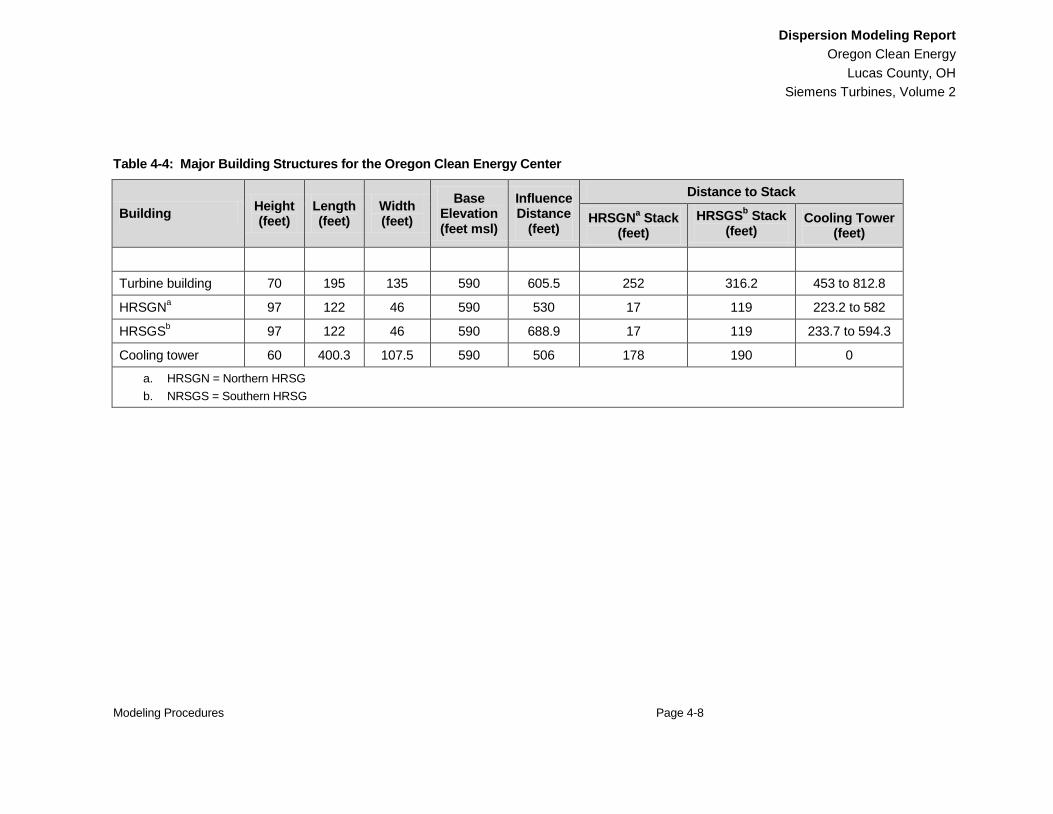
For the Project area, the most recent background concentrations for PM2.5 and PM10 were obtained from the Ohio EPA Annual Air Quality Report for 2011. The background concentrations for NO2 and CO were obtained by contacting Ohio EPA. Table 4-5 identifies the air quality monitors used, and Table 4-6 compares the monitoring data to the ambient air quality standards for the PSD pollutants modeled. Figure 4-1 shows the locations of the monitoring stations.
Modeling Procedures Page 4-8
Dispersion Modeling Report Oregon Clean Energy
Lucas County, OH Siemens Turbines, Volume 2
Table 4-4: Major Building Structures for the Oregon Clean Energy Center
Building Height (feet)
Length (feet)
Width (feet)
Base Elevation (feet msl)
Influence Distance
(feet)
Distance to Stack
HRSGNa Stack (feet)
HRSGSb Stack (feet)
Cooling Tower (feet)
Turbine building 70 195 135 590 605.5 252 316.2 453 to 812.8
HRSGNa 97 122 46 590 530 17 119 223.2 to 582
HRSGSb 97 122 46 590 688.9 17 119 233.7 to 594.3
Cooling tower 60 400.3 107.5 590 506 178 190 0
a. HRSGN = Northern HRSG b. NRSGS = Southern HRSG
Modeling Procedures Page 4-9
Dispersion Modeling Report Oregon Clean Energy
Lucas County, OH Siemens Turbines, Volume 2
Table 4-5: Background Air Quality Monitoring Stations
Pollutant Station Location Station ID
PM10 Lee and Front, Toledo, Lucas County
39-095-1003
PM2.5 600 Collins Park, Toledo, Lucas County
39-095-0028
NO2 7760 Blackburn Road, Athens, Athens County
39-009-0004
CO 901 W. Fairview, Dayton, Montgomery County
39-113-0028
Table 4-6: Background Air Quality Data
Pollutant Averaging
Period
Background Concentration
(mg/m3) NAAQS (mg/m3)
PM10 24-hour 86 150
PM2.5 24-hour 29 35 Annual 11.42 12
NO2 Annual 5.9 99.7 1-hour 37.79 188
CO 1-hour 1,484 40,000 8-hour 1,142 10,000
39-095-1003
39-095-0028
0 1 2
Miles
City
: Chi
cago
Aut
hor:
MN
esta
Pat
h: C
:\PR
OJE
CT
S\O
CE
\MX
D\O
PS
B_2
0130
104\
04-1
_OC
E_A
irMon
itorin
g2.m
xd
LegendProject Site
Air Quality Monitoring Stations (Elevation - ft)CO (957)NO2 (902)PM10 (590)PM2.5 (595)
PROJECTSITE
FULL GEOGRAPHIC EXTENT OF AIR MONITORING FEATURES
Topographic Base Image Source: ArcGIS OnlineServices, Access date: 12/26/2012, via ArcGIS v. 10.This image is not for re-sale or distribution outsideof the use of this PDF.
PROJECT SITE
FIGURE 4-1
OREGON CLEANENERGY CENTER
Lucas County, Ohio
1 inch equals 1 miles
39-009-0004
39-113-0028
INSET 1
INSET 1
(Provided by Ohio EPA, Central Office)
Modeling Results Page 5-1
Dispersion Modeling Report Oregon Clean Energy
Lucas County, OH Siemens Turbines, Volume 2
5. MODELING RESULTS
The following sections describe the results of air quality modeling for the Project to demonstrate compliance with regulatory requirements.
5.1 Modeling to Determine Maximum-Impact Operating Conditions
Modeling of the combined cycle units was conducted for several steady-state operating conditions, spanning the range of anticipated turbine loads and ambient temperatures. Duct firing is reflected only at full load, with ambient temperature at or above 59°F. The operating scenarios that were modeled to determine worst-case impacts are presented in Table 4-1. Cold and warm-start scenarios, with the auxiliary boiler, were also modeled to assess potential peak short-term impacts.
5.2 Comparison of Predicted Impacts with Significant Impact Levels
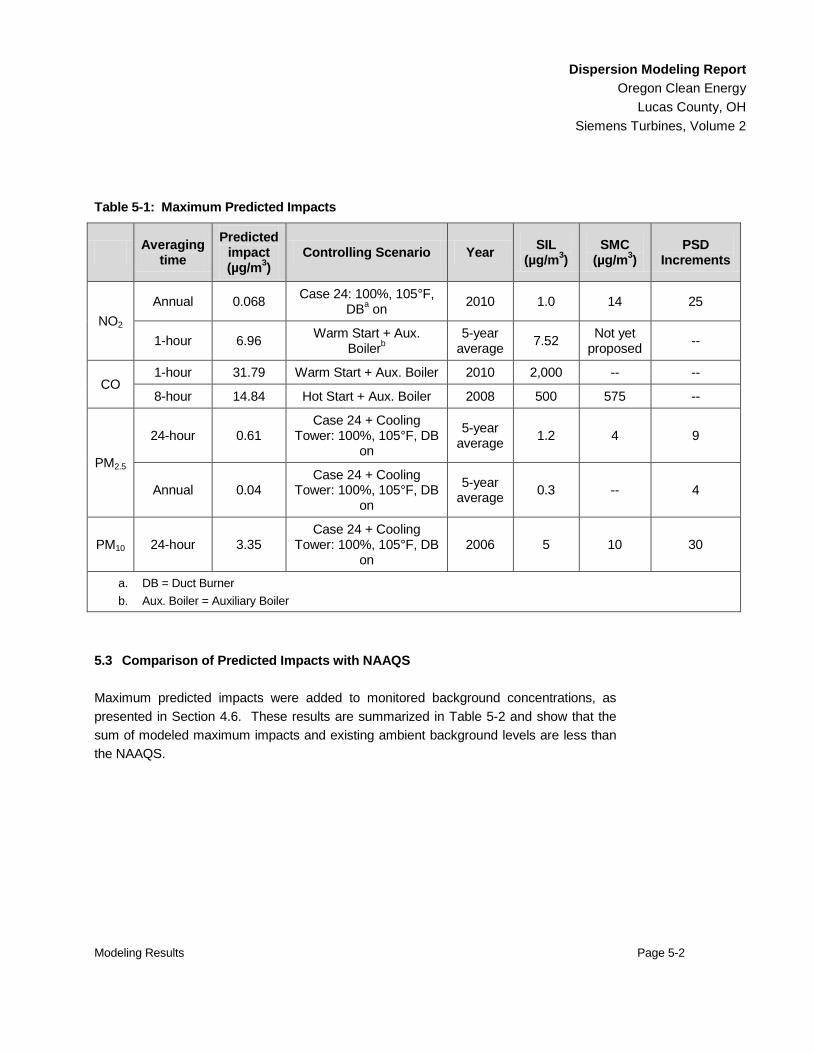
Each scenario was modeled for the five-year meteorological period. The scenarios that yielded the highest predicted impacts for each pollutant and averaging time were identified. The maximum predicted impacts from these scenarios were evaluated relative to SILs (shown in Table 3-1), to determine whether cumulative interactive modeling was warranted for any pollutant. The maximum predicted impacts for the Project for each pollutant and averaging time are provided in Table 5-1. Table 5-1 also presents the turbine operating scenario and year of meteorological data that resulted in the worst-case predicted impact. Detailed modeling results for all operating scenarios and applicable pollutants are presented in Appendix B. Plot files depicting the annual and short-term impacts from the Project for the maximum-impact scenarios are provided in Appendix C. AERMOD input and output files are provided on a compact disc included in Appendix D.
The results indicate that the maximum predicted Project impacts are below the SILs for all averaging times for all applicable PSD pollutants (CO, NO2, PM10 and PM2.5). As described previously, a demonstration that maximum impacts are less than SILs for a given pollutant indicates that the Project will not contribute significantly to any violation of the corresponding NAAQS or PSD increment. If a major source or major modification is predicted to have maximum impacts that are below the SILs, then a cumulative impact modeling analysis is generally not required.
Modeling Results Page 5-2
Dispersion Modeling Report Oregon Clean Energy
Lucas County, OH Siemens Turbines, Volume 2
Table 5-1: Maximum Predicted Impacts
Averaging time
Predicted impact (µg/m3)
Controlling Scenario Year SIL (µg/m3)
SMC (µg/m3)
PSD Increments
NO2 Annual 0.068 Case 24: 100%, 105°F,
DBa on 2010 1.0 14 25
1-hour 6.96 Warm Start + Aux. Boilerb
5-year average 7.52 Not yet
proposed --
CO 1-hour 31.79 Warm Start + Aux. Boiler 2010 2,000 -- --
8-hour 14.84 Hot Start + Aux. Boiler 2008 500 575 --
PM2.5
24-hour 0.61 Case 24 + Cooling
Tower: 100%, 105°F, DB on
5-year average 1.2 4 9
Annual 0.04 Case 24 + Cooling
Tower: 100%, 105°F, DB on
5-year average 0.3 -- 4
PM10 24-hour 3.35 Case 24 + Cooling
Tower: 100%, 105°F, DB on
2006 5 10 30
a. DB = Duct Burner b. Aux. Boiler = Auxiliary Boiler
5.3 Comparison of Predicted Impacts with NAAQS
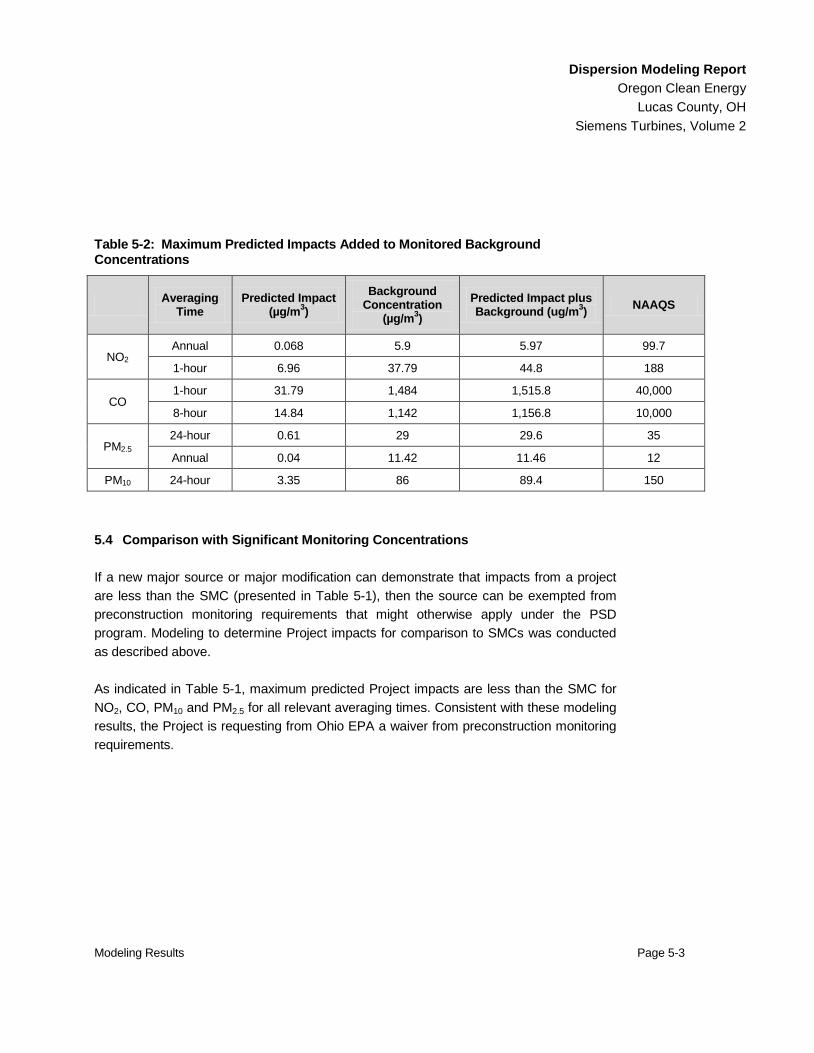
Maximum predicted impacts were added to monitored background concentrations, as presented in Section 4.6. These results are summarized in Table 5-2 and show that the sum of modeled maximum impacts and existing ambient background levels are less than the NAAQS.
Modeling Results Page 5-3
Dispersion Modeling Report Oregon Clean Energy
Lucas County, OH Siemens Turbines, Volume 2
Table 5-2: Maximum Predicted Impacts Added to Monitored Background Concentrations
Averaging Time
Predicted Impact (µg/m3)
Background Concentration
(µg/m3) Predicted Impact plus Background (ug/m3) NAAQS
NO2 Annual 0.068 5.9 5.97 99.7
1-hour 6.96 37.79 44.8 188
CO 1-hour 31.79 1,484 1,515.8 40,000
8-hour 14.84 1,142 1,156.8 10,000
PM2.5 24-hour 0.61 29 29.6 35
Annual 0.04 11.42 11.46 12
PM10 24-hour 3.35 86 89.4 150
5.4 Comparison with Significant Monitoring Concentrations
If a new major source or major modification can demonstrate that impacts from a project are less than the SMC (presented in Table 5-1), then the source can be exempted from preconstruction monitoring requirements that might otherwise apply under the PSD program. Modeling to determine Project impacts for comparison to SMCs was conducted as described above.
As indicated in Table 5-1, maximum predicted Project impacts are less than the SMC for NO2, CO, PM10 and PM2.5 for all relevant averaging times. Consistent with these modeling results, the Project is requesting from Ohio EPA a waiver from preconstruction monitoring requirements.
Additional Impact Analysis Page 6-1
Dispersion Modeling Report Oregon Clean Energy
Lucas County, OH Siemens Turbines, Volume 2
6. ADDITIONAL IMPACTS ANALYSES
6.1 PSD Class I Area Impact Analysis
PSD regulations require that proposed major sources within 100 km of a PSD Class I area perform an assessment of potential impacts in the Class I area. PSD Class I areas are specifically designated areas of special national or regional value from a natural, scenic, recreational or historic perspective. These areas are administered by the NPS, USFWS, or the USFS. FLMs are responsible for evaluating proposed projects’ air quality impacts in Class I areas and may make recommendations to permitting agencies to approve or deny permit applications.
PSD Class I area impact analyses can consist of:
· An air quality impact analysis;
· A visibility impairment analysis; and
· An analysis of impacts on other air quality related values (AQRVs) such as impacts to flora and fauna, water, and cultural resources.
There are no PSD Class I areas within 100 km of the Project site. The nearest PSD Class I Areas are the Otter Creek and Dolly Sods Wilderness Areas in West Virginia, and the Mammoth Cave National Park in Kentucky both of which are over 400 km from the Project site. Ohio EPA recommends that a screening formula be used to determine if a Class I Area is close enough to warrant analysis. The screening formula, which is found in The Federal Land Managers AQRV Workgroup (FLAG) Phase I Report – Revised (FLAG, 2010) indicates that a PSD Class I area analysis is not required if:
Q/d < 10,
where:
· Q is the combined emissions increase from a source of SO2, NOx, PM10, and H2SO4 in tpy based on 24-hour maximum allowable emissions (which are annualized); and
· d is the nearest distance in km to a Class I area from the source.
Additional Impact Analysis Page 6-2
Dispersion Modeling Report Oregon Clean Energy
Lucas County, OH Siemens Turbines, Volume 2
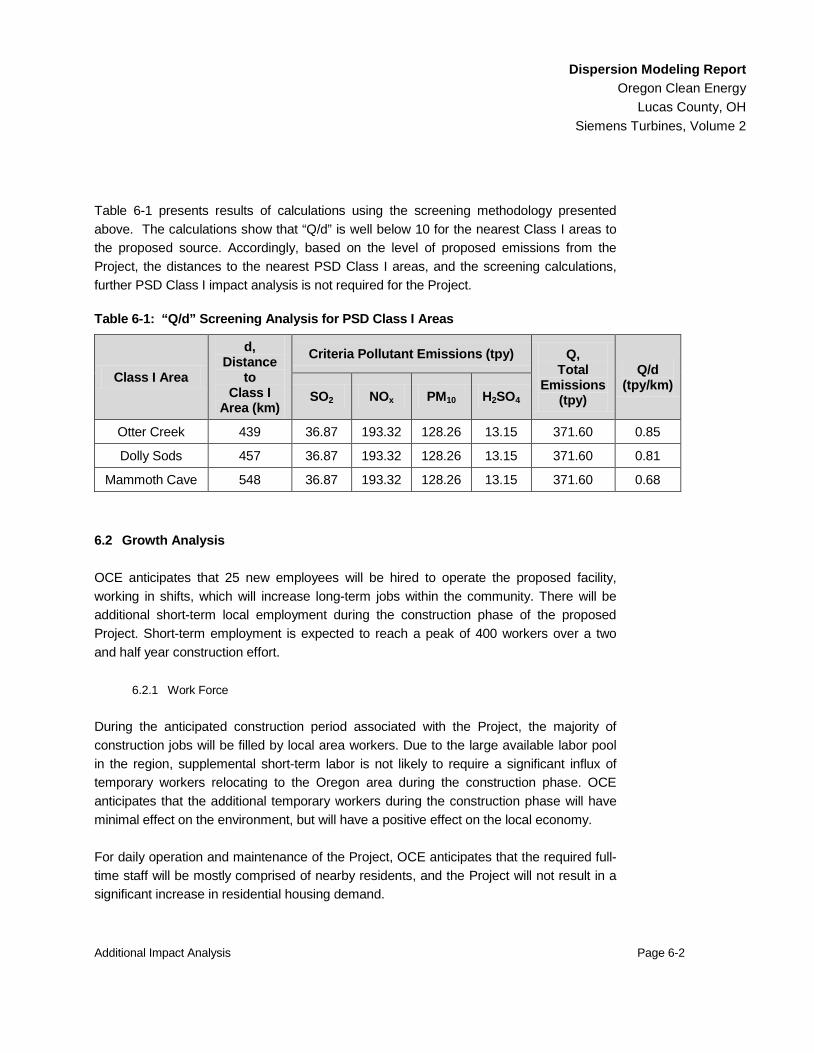
Table 6-1 presents results of calculations using the screening methodology presented above. The calculations show that “Q/d” is well below 10 for the nearest Class I areas to the proposed source. Accordingly, based on the level of proposed emissions from the Project, the distances to the nearest PSD Class I areas, and the screening calculations, further PSD Class I impact analysis is not required for the Project.
Table 6-1: “Q/d” Screening Analysis for PSD Class I Areas
Class I Area
d, Distance
to Class I
Area (km)
Criteria Pollutant Emissions (tpy) Q, Total
Emissions (tpy)
Q/d (tpy/km)
SO2 NOx PM10 H2SO4
Otter Creek 439 36.87 193.32 128.26 13.15 371.60 0.85
Dolly Sods 457 36.87 193.32 128.26 13.15 371.60 0.81
Mammoth Cave 548 36.87 193.32 128.26 13.15 371.60 0.68
6.2 Growth Analysis
OCE anticipates that 25 new employees will be hired to operate the proposed facility, working in shifts, which will increase long-term jobs within the community. There will be additional short-term local employment during the construction phase of the proposed Project. Short-term employment is expected to reach a peak of 400 workers over a two and half year construction effort.
6.2.1 Work Force
During the anticipated construction period associated with the Project, the majority of construction jobs will be filled by local area workers. Due to the large available labor pool in the region, supplemental short-term labor is not likely to require a significant influx of temporary workers relocating to the Oregon area during the construction phase. OCE anticipates that the additional temporary workers during the construction phase will have minimal effect on the environment, but will have a positive effect on the local economy.
For daily operation and maintenance of the Project, OCE anticipates that the required full-time staff will be mostly comprised of nearby residents, and the Project will not result in a significant increase in residential housing demand.
Additional Impact Analysis Page 6-3
Dispersion Modeling Report Oregon Clean Energy
Lucas County, OH Siemens Turbines, Volume 2
The resulting increase in employment is not anticipated to impact significantly the air quality of the area because the increase represents a small fraction of the regional population and is expected to be met largely from the existing labor pool. Thus, construction and operation of the proposed Project will have a positive impact on the work force in Oregon and the surrounding areas, but its net impact on the environment and to residential resource consumption is anticipated to be insignificant.
6.2.2 Industry
The Project will add a new industry to the area that will provide for economic benefit through primary and secondary effects. However, because much of the growth from the Project will be filled by existing local labor and resources, no new influx of commercial or industrial development that would increase air emissions is anticipated. In addition, the Project is intended to support existing energy needs throughout the regional electricity grid area. OCE does not anticipate any significant corresponding commercial or industrial growth as a result of the additional energy contribution of the Project. Because the commercial and industrial growth resulting from the Project is anticipated to be minimal, air quality impacts resulting from such commercial and industrial growth are also expected to be minimal.
6.3 Soils and Vegetation Analysis
PSD review requirements include an analysis to determine the potential air quality impacts on sensitive vegetation or soil types that may be present in the vicinity of a proposed project. Ambient air quality screening levels for sensitive vegetation are provided in USEPA guidance (USEPA, 1980) and in related technical publications.
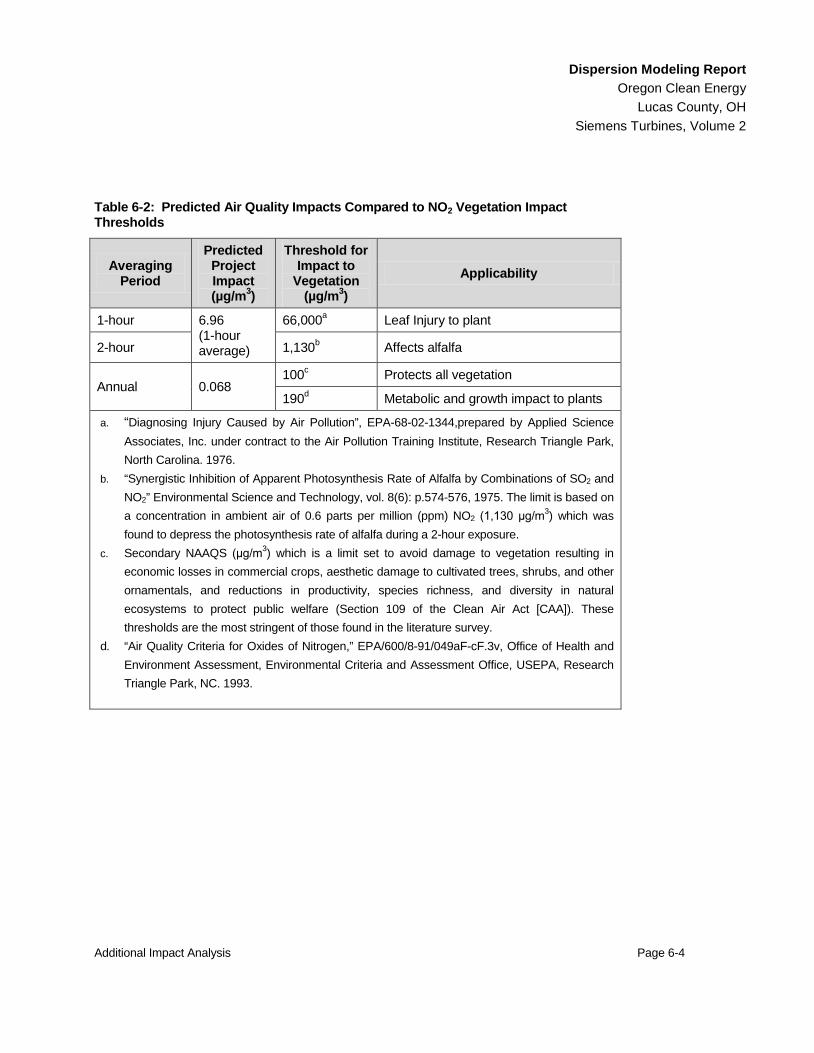
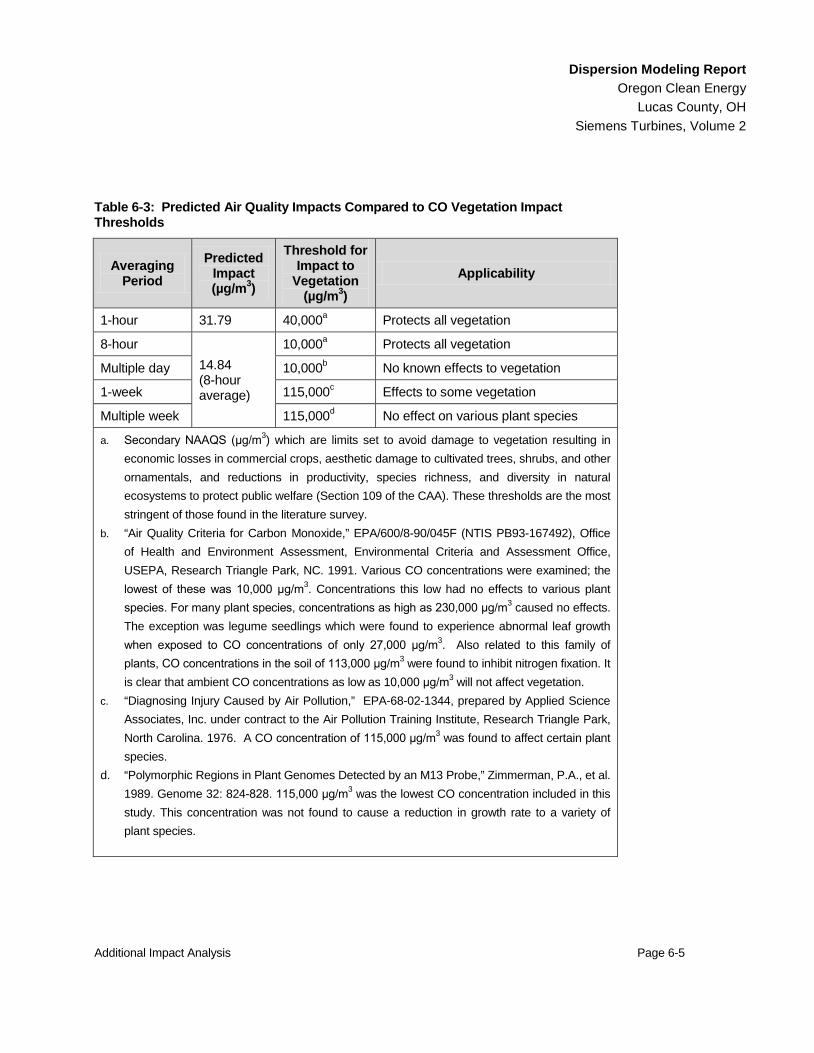
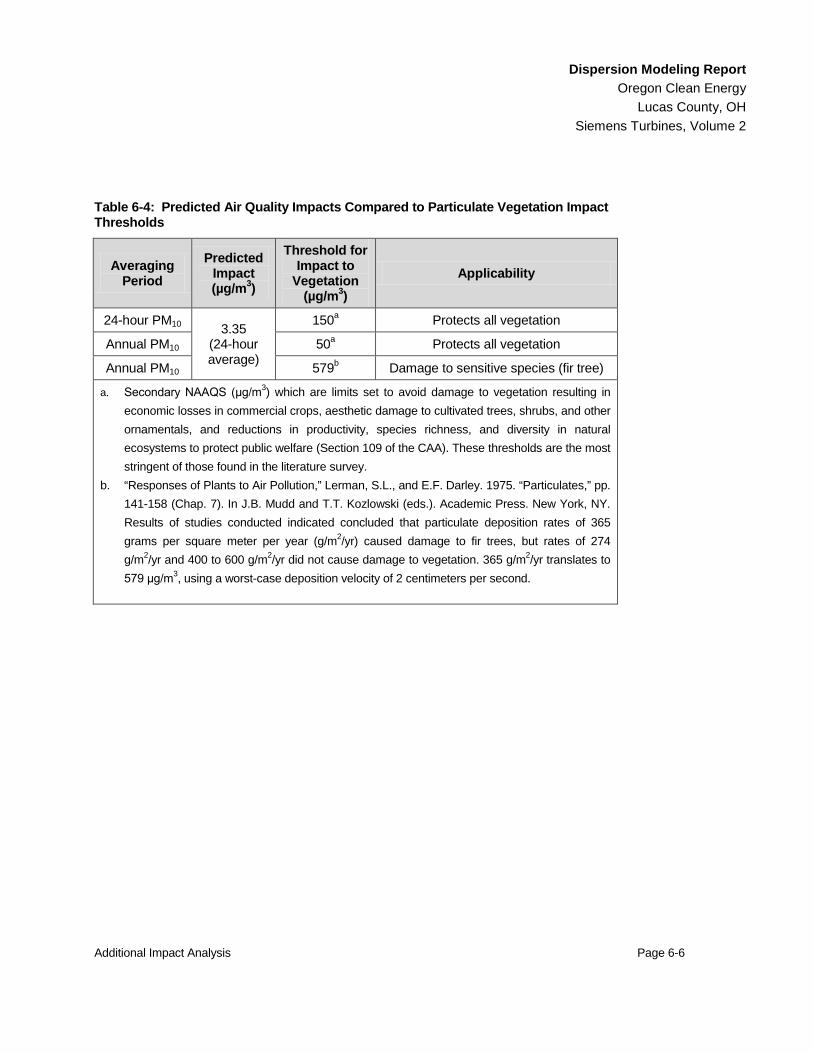
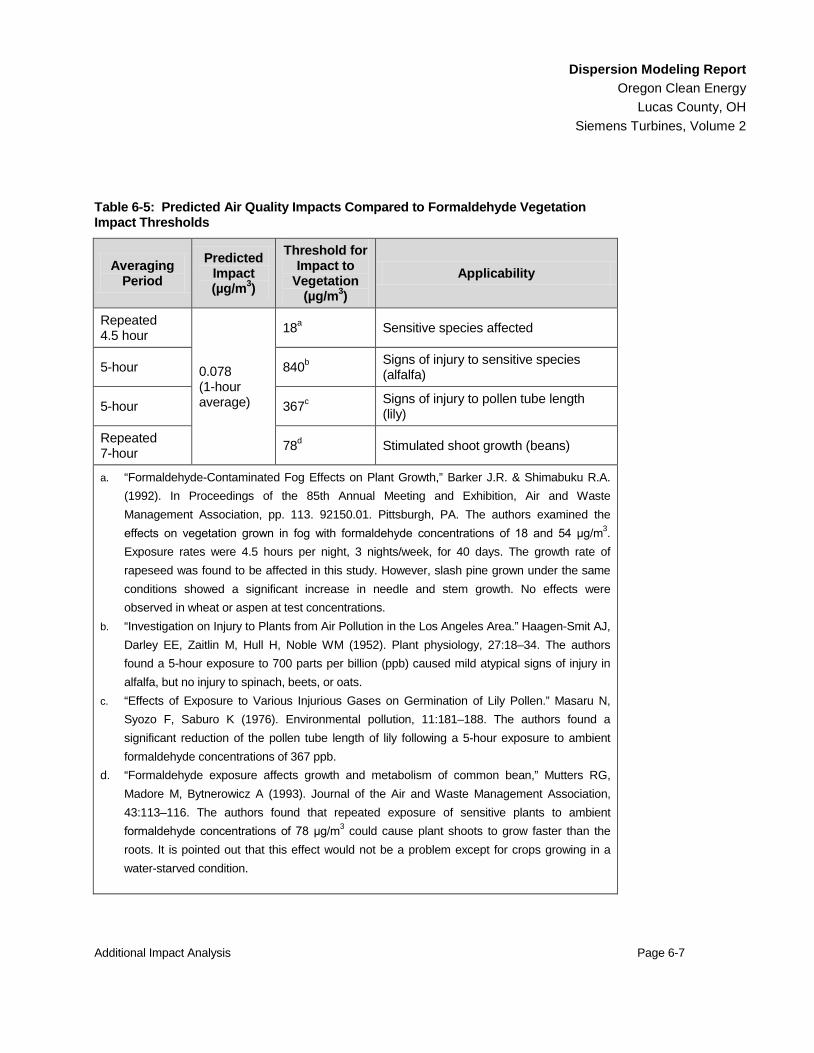
Maximum predicted Project impacts are compared to relevant screening levels in Tables 6-2, 6-3, 6-4, and 6-5. All predicted Project impacts are well below the vegetation impact threshold levels. The screening analysis and USEPA guidance support the conclusion that the proposed Project will not adversely impact vegetation or soils in the Project surroundings.
Additional Impact Analysis Page 6-4
Dispersion Modeling Report Oregon Clean Energy
Lucas County, OH Siemens Turbines, Volume 2
Table 6-2: Predicted Air Quality Impacts Compared to NO2 Vegetation Impact Thresholds
Averaging Period
Predicted Project Impact (µg/m3)
Threshold for Impact to
Vegetation (µg/m3)
Applicability
1-hour 6.96 (1-hour average)
66,000a Leaf Injury to plant
2-hour 1,130b Affects alfalfa
Annual 0.068 100c Protects all vegetation
190d Metabolic and growth impact to plants
a. “Diagnosing Injury Caused by Air Pollution”, EPA-68-02-1344,prepared by Applied Science Associates, Inc. under contract to the Air Pollution Training Institute, Research Triangle Park, North Carolina. 1976.
b. “Synergistic Inhibition of Apparent Photosynthesis Rate of Alfalfa by Combinations of SO2 and NO2” Environmental Science and Technology, vol. 8(6): p.574-576, 1975. The limit is based on a concentration in ambient air of 0.6 parts per million (ppm) NO2 (1,130 μg/m3) which was found to depress the photosynthesis rate of alfalfa during a 2-hour exposure.
c. Secondary NAAQS (μg/m3) which is a limit set to avoid damage to vegetation resulting in economic losses in commercial crops, aesthetic damage to cultivated trees, shrubs, and other ornamentals, and reductions in productivity, species richness, and diversity in natural ecosystems to protect public welfare (Section 109 of the Clean Air Act [CAA]). These thresholds are the most stringent of those found in the literature survey.
d. “Air Quality Criteria for Oxides of Nitrogen,” EPA/600/8-91/049aF-cF.3v, Office of Health and Environment Assessment, Environmental Criteria and Assessment Office, USEPA, Research Triangle Park, NC. 1993.
Additional Impact Analysis Page 6-5
Dispersion Modeling Report Oregon Clean Energy
Lucas County, OH Siemens Turbines, Volume 2
Table 6-3: Predicted Air Quality Impacts Compared to CO Vegetation Impact Thresholds
Averaging Period
Predicted Impact (µg/m3)
Threshold for Impact to
Vegetation (µg/m3)
Applicability
1-hour 31.79 40,000a Protects all vegetation
8-hour 14.84 (8-hour average)
10,000a Protects all vegetation
Multiple day 10,000b No known effects to vegetation
1-week 115,000c Effects to some vegetation
Multiple week 115,000d No effect on various plant species
a. Secondary NAAQS (μg/m3) which are limits set to avoid damage to vegetation resulting in economic losses in commercial crops, aesthetic damage to cultivated trees, shrubs, and other ornamentals, and reductions in productivity, species richness, and diversity in natural ecosystems to protect public welfare (Section 109 of the CAA). These thresholds are the most stringent of those found in the literature survey.
b. “Air Quality Criteria for Carbon Monoxide,” EPA/600/8-90/045F (NTIS PB93-167492), Office of Health and Environment Assessment, Environmental Criteria and Assessment Office, USEPA, Research Triangle Park, NC. 1991. Various CO concentrations were examined; the lowest of these was 10,000 μg/m3. Concentrations this low had no effects to various plant species. For many plant species, concentrations as high as 230,000 μg/m3 caused no effects. The exception was legume seedlings which were found to experience abnormal leaf growth when exposed to CO concentrations of only 27,000 μg/m3. Also related to this family of plants, CO concentrations in the soil of 113,000 μg/m3 were found to inhibit nitrogen fixation. It is clear that ambient CO concentrations as low as 10,000 μg/m3 will not affect vegetation.
c. “Diagnosing Injury Caused by Air Pollution,” EPA-68-02-1344, prepared by Applied Science Associates, Inc. under contract to the Air Pollution Training Institute, Research Triangle Park, North Carolina. 1976. A CO concentration of 115,000 μg/m3 was found to affect certain plant species.
d. “Polymorphic Regions in Plant Genomes Detected by an M13 Probe,” Zimmerman, P.A., et al. 1989. Genome 32: 824-828. 115,000 μg/m3 was the lowest CO concentration included in this study. This concentration was not found to cause a reduction in growth rate to a variety of plant species.
Additional Impact Analysis Page 6-6
Dispersion Modeling Report Oregon Clean Energy
Lucas County, OH Siemens Turbines, Volume 2
Table 6-4: Predicted Air Quality Impacts Compared to Particulate Vegetation Impact Thresholds
Averaging Period
Predicted Impact (µg/m3)
Threshold for Impact to
Vegetation (µg/m3)
Applicability
24-hour PM10 3.35 (24-hour average)
150a Protects all vegetation
Annual PM10 50a Protects all vegetation
Annual PM10 579b Damage to sensitive species (fir tree)
a. Secondary NAAQS (μg/m3) which are limits set to avoid damage to vegetation resulting in economic losses in commercial crops, aesthetic damage to cultivated trees, shrubs, and other ornamentals, and reductions in productivity, species richness, and diversity in natural ecosystems to protect public welfare (Section 109 of the CAA). These thresholds are the most stringent of those found in the literature survey.
b. “Responses of Plants to Air Pollution,” Lerman, S.L., and E.F. Darley. 1975. “Particulates,” pp. 141-158 (Chap. 7). In J.B. Mudd and T.T. Kozlowski (eds.). Academic Press. New York, NY. Results of studies conducted indicated concluded that particulate deposition rates of 365 grams per square meter per year (g/m2/yr) caused damage to fir trees, but rates of 274 g/m2/yr and 400 to 600 g/m2/yr did not cause damage to vegetation. 365 g/m2/yr translates to 579 μg/m3, using a worst-case deposition velocity of 2 centimeters per second.
Additional Impact Analysis Page 6-7
Dispersion Modeling Report Oregon Clean Energy
Lucas County, OH Siemens Turbines, Volume 2
Table 6-5: Predicted Air Quality Impacts Compared to Formaldehyde Vegetation Impact Thresholds
Averaging Period
Predicted Impact (µg/m3)
Threshold for Impact to
Vegetation (µg/m3)
Applicability
Repeated 4.5 hour
0.078 (1-hour average)
18a Sensitive species affected
5-hour 840b Signs of injury to sensitive species (alfalfa)
5-hour 367c Signs of injury to pollen tube length (lily)
Repeated 7-hour 78d Stimulated shoot growth (beans)
a. “Formaldehyde-Contaminated Fog Effects on Plant Growth,” Barker J.R. & Shimabuku R.A. (1992). In Proceedings of the 85th Annual Meeting and Exhibition, Air and Waste Management Association, pp. 113. 92150.01. Pittsburgh, PA. The authors examined the effects on vegetation grown in fog with formaldehyde concentrations of 18 and 54 μg/m3. Exposure rates were 4.5 hours per night, 3 nights/week, for 40 days. The growth rate of rapeseed was found to be affected in this study. However, slash pine grown under the same conditions showed a significant increase in needle and stem growth. No effects were observed in wheat or aspen at test concentrations.
b. “Investigation on Injury to Plants from Air Pollution in the Los Angeles Area.” Haagen-Smit AJ, Darley EE, Zaitlin M, Hull H, Noble WM (1952). Plant physiology, 27:18–34. The authors found a 5-hour exposure to 700 parts per billion (ppb) caused mild atypical signs of injury in alfalfa, but no injury to spinach, beets, or oats.
c. “Effects of Exposure to Various Injurious Gases on Germination of Lily Pollen.” Masaru N, Syozo F, Saburo K (1976). Environmental pollution, 11:181–188. The authors found a significant reduction of the pollen tube length of lily following a 5-hour exposure to ambient formaldehyde concentrations of 367 ppb.
d. “Formaldehyde exposure affects growth and metabolism of common bean,” Mutters RG, Madore M, Bytnerowicz A (1993). Journal of the Air and Waste Management Association, 43:113–116. The authors found that repeated exposure of sensitive plants to ambient formaldehyde concentrations of 78 μg/m3 could cause plant shoots to grow faster than the roots. It is pointed out that this effect would not be a problem except for crops growing in a water-starved condition.
Additional Impact Analysis Page 6-8
Dispersion Modeling Report Oregon Clean Energy
Lucas County, OH Siemens Turbines, Volume 2
6.4 Endangered Species
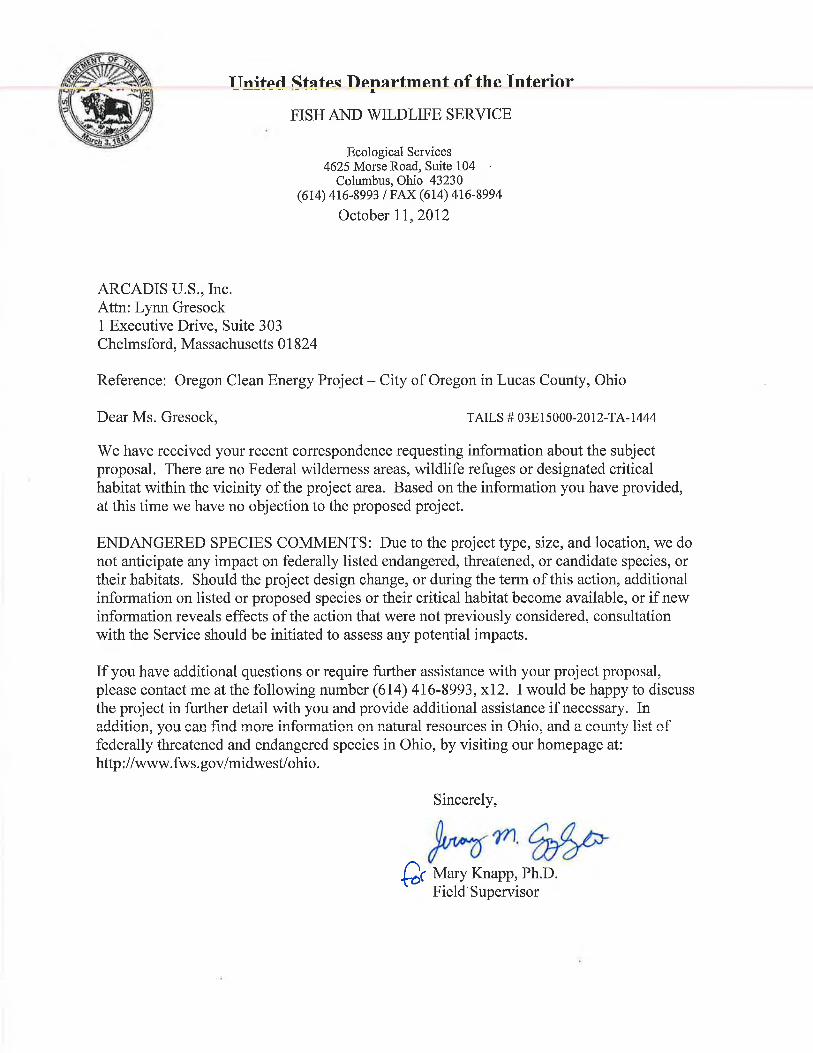
The USFWS and the Ohio Department of Natural Resources (ODNR) were contacted regarding the potential presence of any sensitive natural communities or rare or endangered species in the vicinity of the site. The response letter from ODNR indicated that no records exist in its database of unique ecological attributes or rare or endangered species within 1 mile of the site.
Federally listed endangered and threatened species in Lucas County, Ohio include the Indiana bat (Myotis sodalis), Karner blue butterfly (Lycaeides melissa samuelis), Kirtland’s warbler (Dendroica kirtlandii), piping plover (Charadrius melodus), rayed bean (Villosa fabalis), and the Eastern prairie fringed orchid (Platanthera leucophaea). No favorable habitat for these species was observed within the site.
The USFWS correspondence indicated there were no federal wilderness areas, wildlife refuges, or designated critical habitat within the vicinity of the Project area. Additionally, the USFWS indicated that it did not anticipate any impacts to federally listed endangered, threatened or candidates species or their habitats and had no objection to the Project as proposed. Correspondence related to endangered species is presented in Appendix E.
6.5 Air Toxics
Ohio EPA’s Air Toxics Policy (Ohio EPA, 1986) provides guidelines for evaluating the ambient impacts of TAPs emitted from new or modified sources. The guidelines, outlined in the Department of Air Pollution Control (DAPC) document “Option A, Review of New Sources of Air Toxic Emissions,” are:
· Determine if a threshold limit value (TLV) exists for the specific compound, which is emitted from the source.
· Divide the TLV by ten to adjust the standard from the working population to the general public (TLV/10).
· Adjust the standard to account for the duration of the exposure (operating hours of source) of “X” hours per day and “Y” days per week from 8 hours per day and 5 days per week. The following formula is used to obtain the Maximum Acceptable Ground-Level Concentration (MAGLC) or Acceptable Incremental Impact:
MAGLCXY
TLVX
TLV 4 Y5 x 8 x
10==
Additional Impact Analysis Page 6-9
Dispersion Modeling Report Oregon Clean Energy
Lucas County, OH Siemens Turbines, Volume 2
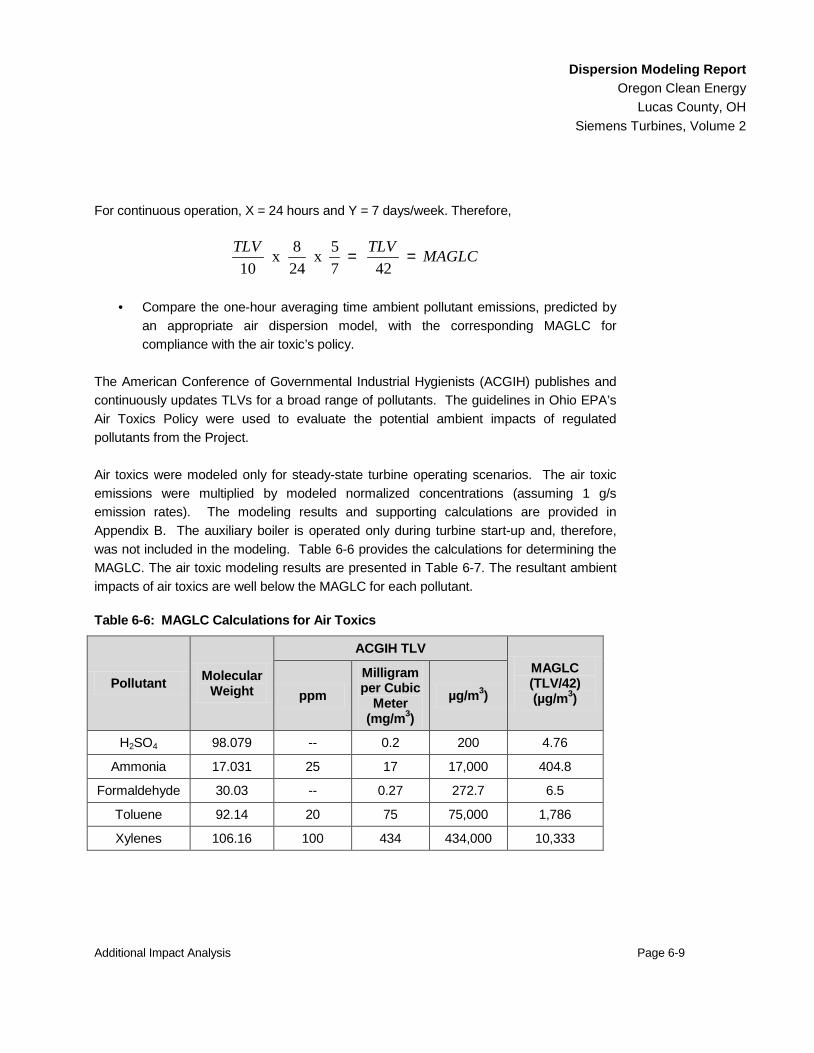
For continuous operation, X = 24 hours and Y = 7 days/week. Therefore,
MAGLCTLVTLV 42
75 x
248 x
10==
· Compare the one-hour averaging time ambient pollutant emissions, predicted by an appropriate air dispersion model, with the corresponding MAGLC for compliance with the air toxic’s policy.
The American Conference of Governmental Industrial Hygienists (ACGIH) publishes and continuously updates TLVs for a broad range of pollutants. The guidelines in Ohio EPA’s Air Toxics Policy were used to evaluate the potential ambient impacts of regulated pollutants from the Project.
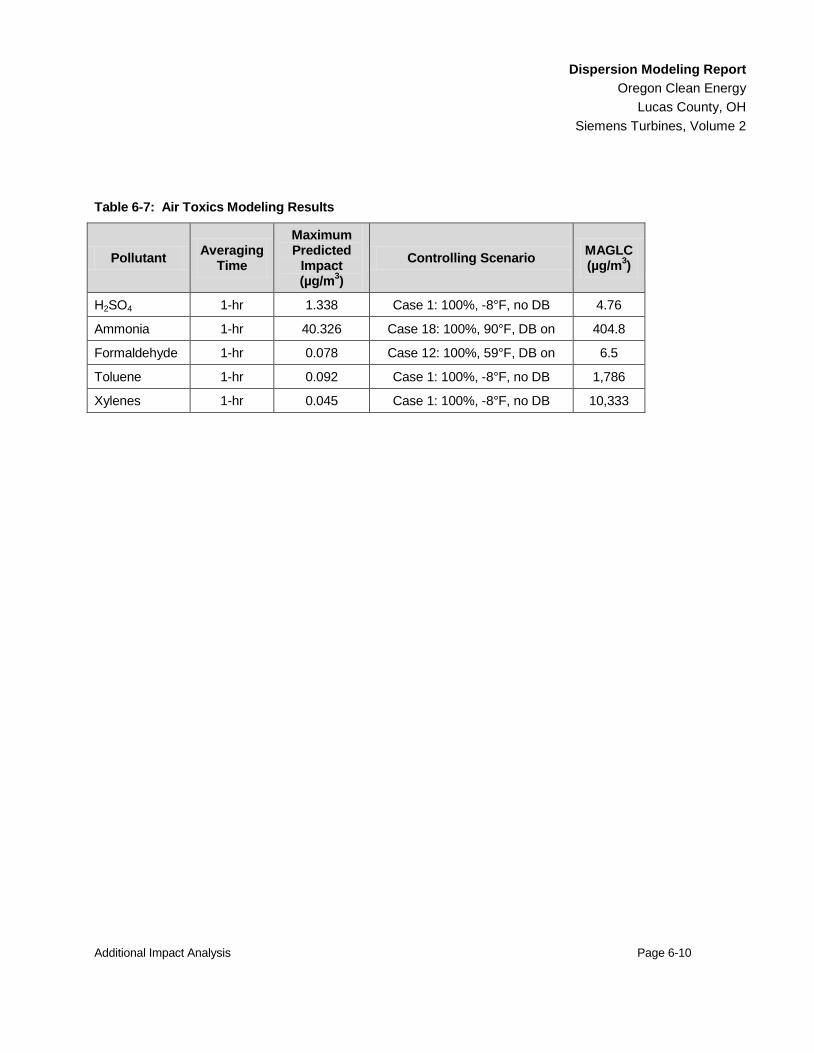
Air toxics were modeled only for steady-state turbine operating scenarios. The air toxic emissions were multiplied by modeled normalized concentrations (assuming 1 g/s emission rates). The modeling results and supporting calculations are provided in Appendix B. The auxiliary boiler is operated only during turbine start-up and, therefore, was not included in the modeling. Table 6-6 provides the calculations for determining the MAGLC. The air toxic modeling results are presented in Table 6-7. The resultant ambient impacts of air toxics are well below the MAGLC for each pollutant.
Table 6-6: MAGLC Calculations for Air Toxics
Pollutant Molecular Weight
ACGIH TLV MAGLC (TLV/42) (µg/m3) ppm
Milligram per Cubic
Meter (mg/m3)
µg/m3)
H2SO4 98.079 -- 0.2 200 4.76
Ammonia 17.031 25 17 17,000 404.8
Formaldehyde 30.03 -- 0.27 272.7 6.5
Toluene 92.14 20 75 75,000 1,786
Xylenes 106.16 100 434 434,000 10,333
Additional Impact Analysis Page 6-10
Dispersion Modeling Report Oregon Clean Energy
Lucas County, OH Siemens Turbines, Volume 2
Table 6-7: Air Toxics Modeling Results
Pollutant Averaging Time
Maximum Predicted
Impact (µg/m3)
Controlling Scenario MAGLC (µg/m3)
H2SO4 1-hr 1.338 Case 1: 100%, -8°F, no DB 4.76
Ammonia 1-hr 40.326 Case 18: 100%, 90°F, DB on 404.8
Formaldehyde 1-hr 0.078 Case 12: 100%, 59°F, DB on 6.5
Toluene 1-hr 0.092 Case 1: 100%, -8°F, no DB 1,786
Xylenes 1-hr 0.045 Case 1: 100%, -8°F, no DB 10,333
References Page 7-1
Dispersion Modeling Report Oregon Clean Energy
Lucas County, OH Siemens Turbines, Volume 2
7. REFERENCES
AWMA, 2001. Abstract No 216, Session No. AM-1b, Orlando, 2001.
FLAG, 2010. The Federal Land Managers AQRU Workgroup (FLAG) Phase I Report, Revised 2010.
Ohio EPA, 2003. Engineering Guide 69.
Ohio EPA, 1986. Air Toxics Policy. “Option A, Review of New Sources of Air Toxic Emissions.”
Schulman, et al., 1997. “The PRIME Plume Rise and Building Downwash Model,” Addendum to ISC3 User’s Guide. November 1997.
USEPA, 1980. “A Screening Procedure for the Impacts of Air Pollution Sources on Plants, Soils and Animals.” EPA 450/2-81-078. December 12, 1980.
USEPA, 1995. User's Guide To The Building Profile Input Program, EPA-454/R-93-038. Revised February 8, 1995.
USEPA, 1996. “Maximum Stack Separation for Merging Plumes.” Model Clearinghouse Information Storage and Retrieval System Record Details. October 29, 1996.
USEPA, 2005. Guideline on Air Quality Models. November 2005.
USEPA, 2011. Additional Clarification Regarding Applicability of Appendix W Modeling Gudiance for the 1-hour NO2 NAAQS. March 1, 2011.
USGS, 2002. The National Map – Elevation, Fact Sheet 106-02. http://egsc.usgs.gov/isb/ pubs/factsheets/fs10602.html, U.S. Department of the Interior. November 2002.
Dispersion Modeling Report Oregon Clean Energy Center
Lucas County, OH Siemens Turbines, Volume 2
Appendix A: Emissions Calculations and Other Supporting Documentation
Summary of Annual Emissions OCE_summary of potential emissions - Siemens_01-31-13.xlsx
Summary of Annual Emissions 1/31/2013Oregon Clean Energy
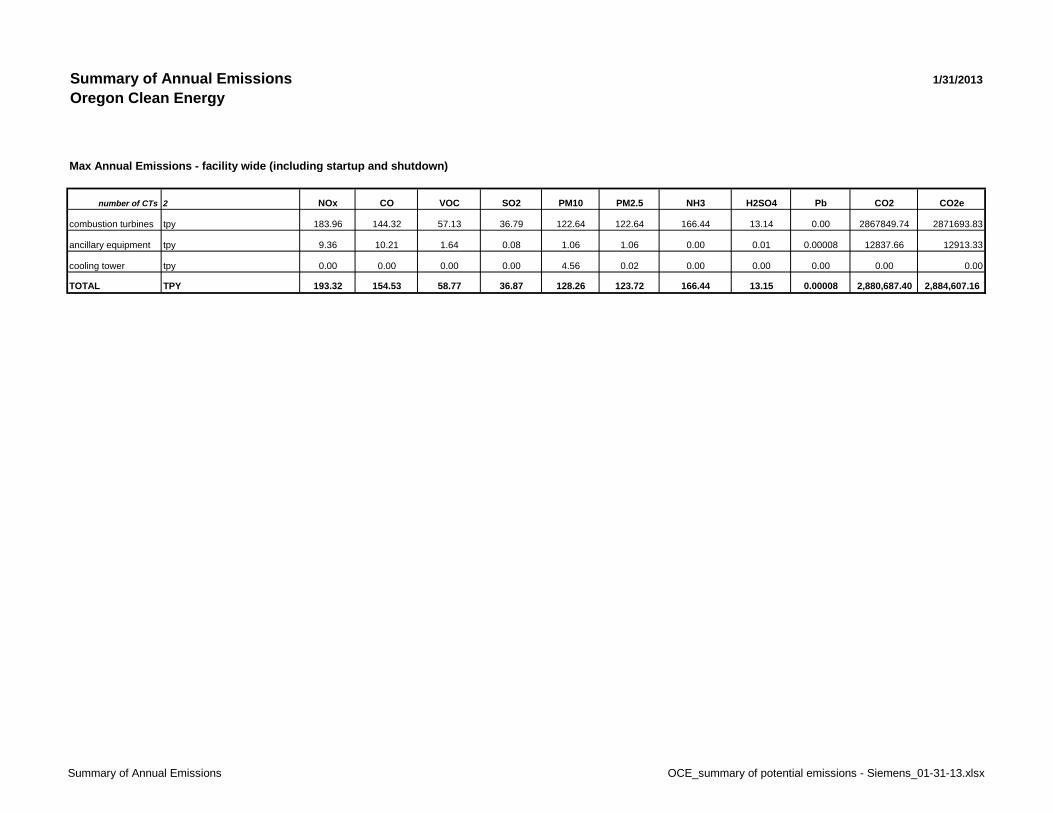
Max Annual Emissions - facility wide (including startup and shutdown)
number of CTs 2 NOx CO VOC SO2 PM10 PM2.5 NH3 H2SO4 Pb CO2 CO2e
combustion turbines tpy 183.96 144.32 57.13 36.79 122.64 122.64 166.44 13.14 0.00 2867849.74 2871693.83
ancillary equipment tpy 9.36 10.21 1.64 0.08 1.06 1.06 0.00 0.01 0.00008 12837.66 12913.33
cooling tower tpy 0.00 0.00 0.00 0.00 4.56 0.02 0.00 0.00 0.00 0.00 0.00
TOTAL TPY 193.32 154.53 58.77 36.87 128.26 123.72 166.44 13.15 0.00008 2,880,687.40 2,884,607.16
ISO Conditions OCE_summary of potential emissions - Siemens_01-31-13.xlsx
Summary of Annual Emissions 1/31/2013
Oregon Clean Energy
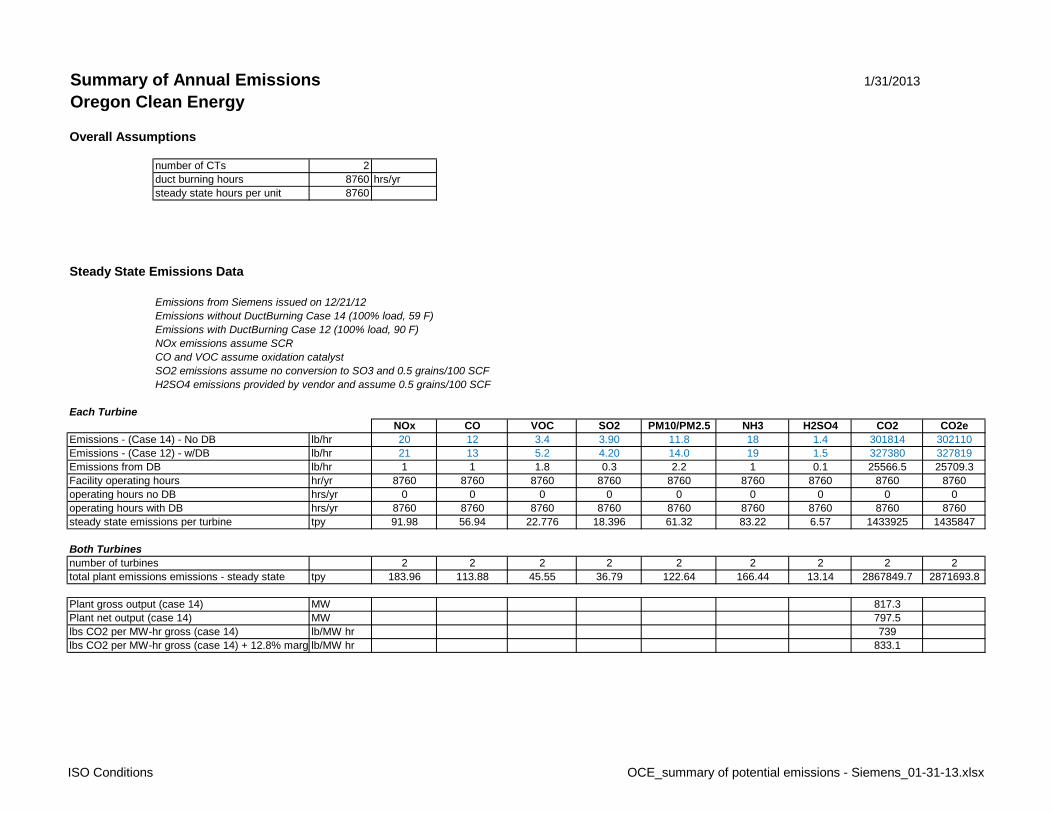
Overall Assumptions
number of CTs 2duct burning hours 8760 hrs/yrsteady state hours per unit 8760
Steady State Emissions Data
Emissions from Siemens issued on 12/21/12Emissions without DuctBurning Case 14 (100% load, 59 F)Emissions with DuctBurning Case 12 (100% load, 90 F)NOx emissions assume SCRCO and VOC assume oxidation catalystSO2 emissions assume no conversion to SO3 and 0.5 grains/100 SCFH2SO4 emissions provided by vendor and assume 0.5 grains/100 SCF
Each TurbineNOx CO VOC SO2 PM10/PM2.5 NH3 H2SO4 CO2 CO2e
Emissions - (Case 14) - No DB lb/hr 20 12 3.4 3.90 11.8 18 1.4 301814 302110Emissions - (Case 12) - w/DB lb/hr 21 13 5.2 4.20 14.0 19 1.5 327380 327819Emissions from DB lb/hr 1 1 1.8 0.3 2.2 1 0.1 25566.5 25709.3Facility operating hours hr/yr 8760 8760 8760 8760 8760 8760 8760 8760 8760operating hours no DB hrs/yr 0 0 0 0 0 0 0 0 0operating hours with DB hrs/yr 8760 8760 8760 8760 8760 8760 8760 8760 8760steady state emissions per turbine tpy 91.98 56.94 22.776 18.396 61.32 83.22 6.57 1433925 1435847
Both Turbinesnumber of turbines 2 2 2 2 2 2 2 2 2total plant emissions emissions - steady state tpy 183.96 113.88 45.55 36.79 122.64 166.44 13.14 2867849.7 2871693.8
Plant gross output (case 14) MW 817.3Plant net output (case 14) MW 797.5lbs CO2 per MW-hr gross (case 14) lb/MW hr 739lbs CO2 per MW-hr gross (case 14) + 12.8% marg lb/MW hr 833.1
SU-SD OCE_summary of potential emissions - Siemens_01-31-13.xlsx
Summary of Annual EmissionsOregon Clean Energy
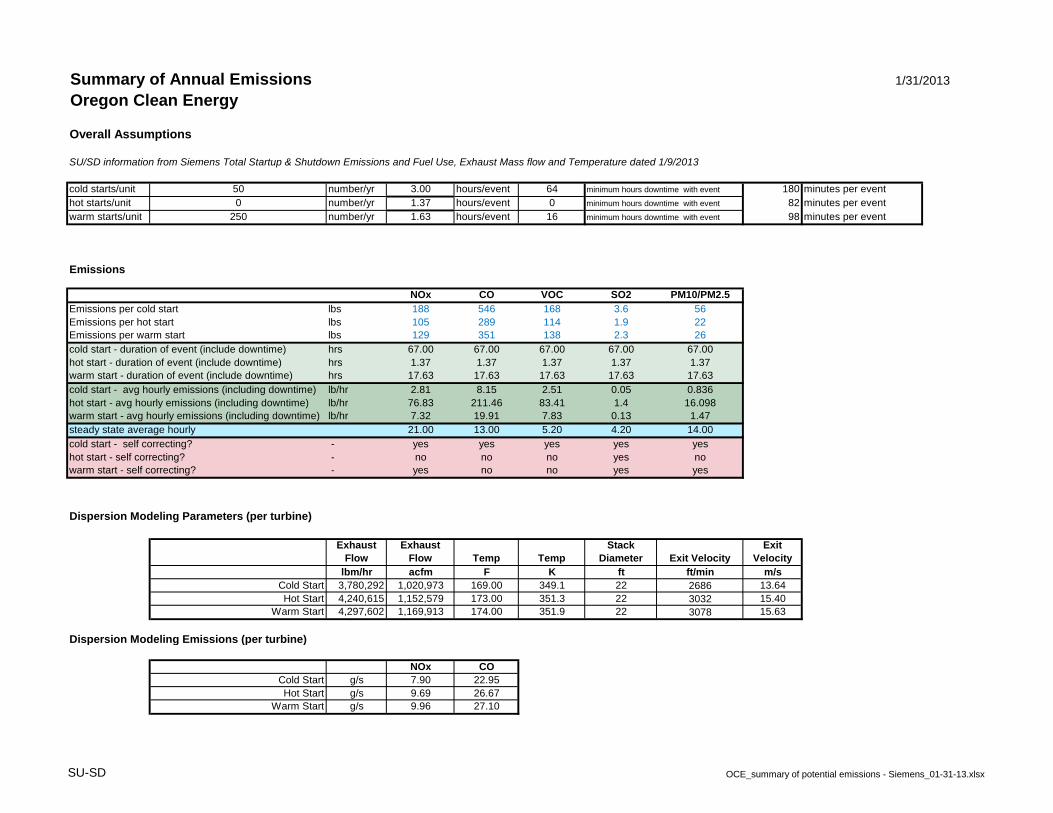
Overall Assumptions
SU/SD information from Siemens Total Startup & Shutdown Emissions and Fuel Use, Exhaust Mass flow and Temperature dated 1/9/2013
cold starts/unit 50 number/yr 3.00 hours/event 64 minimum hours downtime with event 180 minutes per eventhot starts/unit 0 number/yr 1.37 hours/event 0 minimum hours downtime with event 82 minutes per eventwarm starts/unit 250 number/yr 1.63 hours/event 16 minimum hours downtime with event 98 minutes per event
Emissions
NOx CO VOC SO2 PM10/PM2.5Emissions per cold start lbs 188 546 168 3.6 56Emissions per hot start lbs 105 289 114 1.9 22Emissions per warm start lbs 129 351 138 2.3 26cold start - duration of event (include downtime) hrs 67.00 67.00 67.00 67.00 67.00hot start - duration of event (include downtime) hrs 1.37 1.37 1.37 1.37 1.37warm start - duration of event (include downtime) hrs 17.63 17.63 17.63 17.63 17.63cold start - avg hourly emissions (including downtime) lb/hr 2.81 8.15 2.51 0.05 0.836hot start - avg hourly emissions (including downtime) lb/hr 76.83 211.46 83.41 1.4 16.098warm start - avg hourly emissions (including downtime) lb/hr 7.32 19.91 7.83 0.13 1.47steady state average hourly 21.00 13.00 5.20 4.20 14.00cold start - self correcting? - yes yes yes yes yeshot start - self correcting? - no no no yes nowarm start - self correcting? - yes no no yes yes
Dispersion Modeling Parameters (per turbine)
Exhaust Flow
Exhaust Flow Temp Temp
Stack Diameter Exit Velocity
Exit Velocity
lbm/hr acfm F K ft ft/min m/sCold Start 3,780,292 1,020,973 169.00 349.1 22 2686 13.64Hot Start 4,240,615 1,152,579 173.00 351.3 22 3032 15.40
Warm Start 4,297,602 1,169,913 174.00 351.9 22 3078 15.63
Dispersion Modeling Emissions (per turbine)
NOx COCold Start g/s 7.90 22.95Hot Start g/s 9.69 26.67
Warm Start g/s 9.96 27.10
1/31/2013
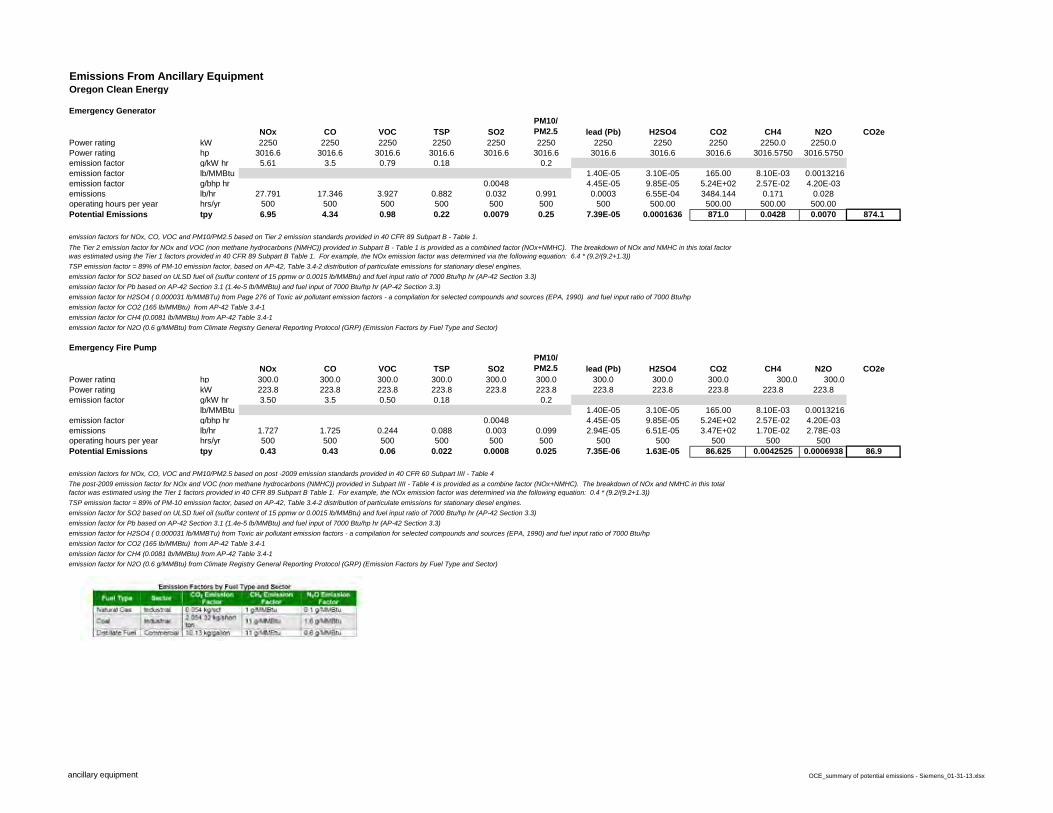
ancillary equipment OCE_summary of potential emissions - Siemens_01-31-13.xlsx
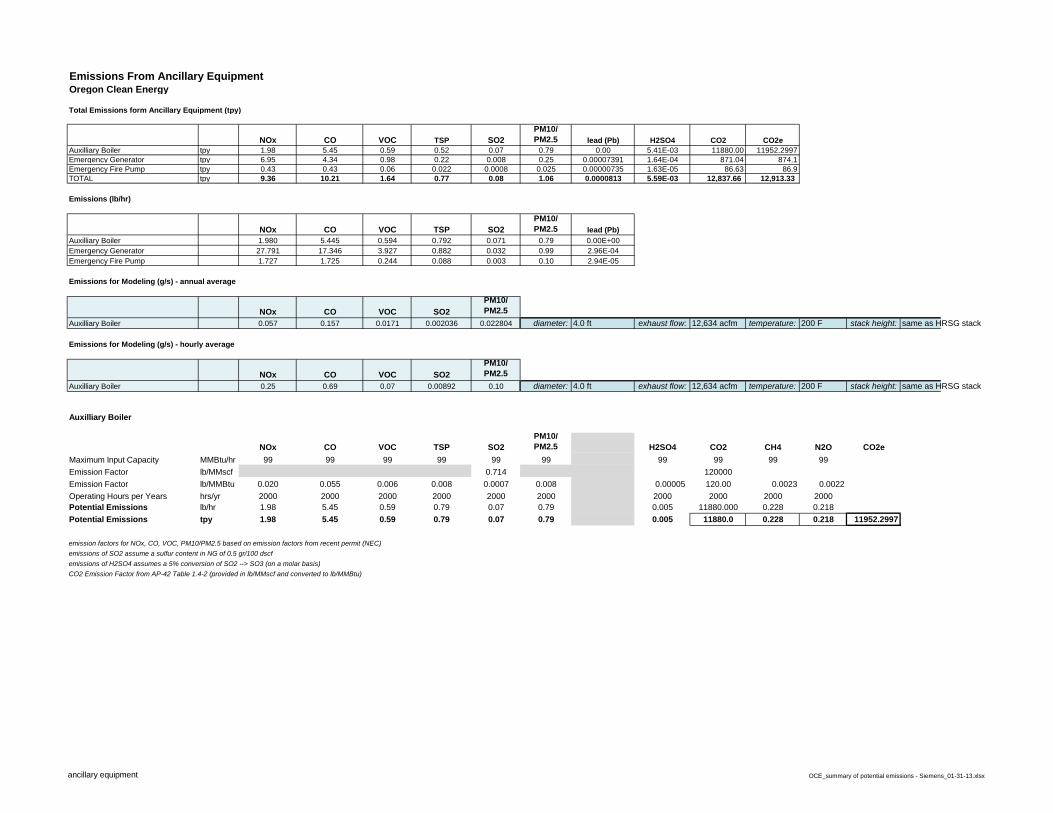
Emissions From Ancillary EquipmentOregon Clean Energy
Total Emissions form Ancillary Equipment (tpy)
NOx CO VOC TSP SO2PM10/ PM2.5 lead (Pb) H2SO4 CO2 CO2e
Auxilliary Boiler tpy 1.98 5.45 0.59 0.52 0.07 0.79 0.00 5.41E-03 11880.00 11952.2997Emergency Generator tpy 6.95 4.34 0.98 0.22 0.008 0.25 0.00007391 1.64E-04 871.04 874.1Emergency Fire Pump tpy 0.43 0.43 0.06 0.022 0.0008 0.025 0.00000735 1.63E-05 86.63 86.9TOTAL tpy 9.36 10.21 1.64 0.77 0.08 1.06 0.0000813 5.59E-03 12,837.66 12,913.33
Emissions (lb/hr)
NOx CO VOC TSP SO2PM10/ PM2.5 lead (Pb)
Auxilliary Boiler 1.980 5.445 0.594 0.792 0.071 0.79 0.00E+00Emergency Generator 27.791 17.346 3.927 0.882 0.032 0.99 2.96E-04Emergency Fire Pump 1.727 1.725 0.244 0.088 0.003 0.10 2.94E-05
Emissions for Modeling (g/s) - annual average
NOx CO VOC SO2PM10/ PM2.5
Auxilliary Boiler 0.057 0.157 0.0171 0.002036 0.022804 diameter: 4.0 ft exhaust flow: 12,634 acfm temperature: 200 F stack height: same as HRSG stack
Emissions for Modeling (g/s) - hourly average
NOx CO VOC SO2PM10/ PM2.5
Auxilliary Boiler 0.25 0.69 0.07 0.00892 0.10 diameter: 4.0 ft exhaust flow: 12,634 acfm temperature: 200 F stack height: same as HRSG stack
Auxilliary Boiler
NOx CO VOC TSP SO2PM10/ PM2.5 H2SO4 CO2 CH4 N2O CO2e
Maximum Input Capacity MMBtu/hr 99 99 99 99 99 99 99 99 99 99Emission Factor lb/MMscf 0.714 120000Emission Factor lb/MMBtu 0.020 0.055 0.006 0.008 0.0007 0.008 0.00005 120.00 0.0023 0.0022Operating Hours per Years hrs/yr 2000 2000 2000 2000 2000 2000 2000 2000 2000 2000Potential Emissions lb/hr 1.98 5.45 0.59 0.79 0.07 0.79 0.005 11880.000 0.228 0.218Potential Emissions tpy 1.98 5.45 0.59 0.79 0.07 0.79 0.005 11880.0 0.228 0.218 11952.2997
emission factors for NOx, CO, VOC, PM10/PM2.5 based on emission factors from recent permit (NEC)emissions of SO2 assume a sulfur content in NG of 0.5 gr/100 dscfemissions of H2SO4 assumes a 5% conversion of SO2 --> SO3 (on a molar basis)CO2 Emission Factor from AP-42 Table 1.4-2 (provided in lb/MMscf and converted to lb/MMBtu)
ancillary equipment OCE_summary of potential emissions - Siemens_01-31-13.xlsx
Emissions From Ancillary EquipmentOregon Clean Energy
Emergency Generator
NOx CO VOC TSP SO2PM10/ PM2.5 lead (Pb) H2SO4 CO2 CH4 N2O CO2e
Power rating kW 2250 2250 2250 2250 2250 2250 2250 2250 2250 2250.0 2250.0Power rating hp 3016.6 3016.6 3016.6 3016.6 3016.6 3016.6 3016.6 3016.6 3016.6 3016.5750 3016.5750emission factor g/kW hr 5.61 3.5 0.79 0.18 0.2emission factor lb/MMBtu 1.40E-05 3.10E-05 165.00 8.10E-03 0.0013216emission factor g/bhp hr 0.0048 4.45E-05 9.85E-05 5.24E+02 2.57E-02 4.20E-03emissions lb/hr 27.791 17.346 3.927 0.882 0.032 0.991 0.0003 6.55E-04 3484.144 0.171 0.028operating hours per year hrs/yr 500 500 500 500 500 500 500 500.00 500.00 500.00 500.00Potential Emissions tpy 6.95 4.34 0.98 0.22 0.0079 0.25 7.39E-05 0.0001636 871.0 0.0428 0.0070 874.1
emission factors for NOx, CO, VOC and PM10/PM2.5 based on Tier 2 emission standards provided in 40 CFR 89 Subpart B - Table 1.
TSP emission factor = 89% of PM-10 emission factor, based on AP-42, Table 3.4-2 distribution of particulate emissions for stationary diesel engines.emission factor for SO2 based on ULSD fuel oil (sulfur content of 15 ppmw or 0.0015 lb/MMBtu) and fuel input ratio of 7000 Btu/hp hr (AP-42 Section 3.3)emission factor for Pb based on AP-42 Section 3.1 (1.4e-5 lb/MMBtu) and fuel input of 7000 Btu/hp hr (AP-42 Section 3.3)emission factor for H2SO4 ( 0.000031 lb/MMBTu) from Page 276 of Toxic air pollutant emission factors - a compilation for selected compounds and sources (EPA, 1990) and fuel input ratio of 7000 Btu/hpemission factor for CO2 (165 lb/MMBtu) from AP-42 Table 3.4-1emission factor for CH4 (0.0081 lb/MMBtu) from AP-42 Table 3.4-1emission factor for N2O (0.6 g/MMBtu) from Climate Registry General Reporting Protocol (GRP) (Emission Factors by Fuel Type and Sector)
Emergency Fire Pump
NOx CO VOC TSP SO2PM10/ PM2.5 lead (Pb) H2SO4 CO2 CH4 N2O CO2e
Power rating hp 300.0 300.0 300.0 300.0 300.0 300.0 300.0 300.0 300.0 300.0 300.0Power rating kW 223.8 223.8 223.8 223.8 223.8 223.8 223.8 223.8 223.8 223.8 223.8emission factor g/kW hr 3.50 3.5 0.50 0.18 0.2
lb/MMBtu 1.40E-05 3.10E-05 165.00 8.10E-03 0.0013216emission factor g/bhp hr 0.0048 4.45E-05 9.85E-05 5.24E+02 2.57E-02 4.20E-03emissions lb/hr 1.727 1.725 0.244 0.088 0.003 0.099 2.94E-05 6.51E-05 3.47E+02 1.70E-02 2.78E-03operating hours per year hrs/yr 500 500 500 500 500 500 500 500 500 500 500Potential Emissions tpy 0.43 0.43 0.06 0.022 0.0008 0.025 7.35E-06 1.63E-05 86.625 0.0042525 0.0006938 86.9
emission factors for NOx, CO, VOC and PM10/PM2.5 based on post -2009 emission standards provided in 40 CFR 60 Subpart IIII - Table 4
TSP emission factor = 89% of PM-10 emission factor, based on AP-42, Table 3.4-2 distribution of particulate emissions for stationary diesel engines.emission factor for SO2 based on ULSD fuel oil (sulfur content of 15 ppmw or 0.0015 lb/MMBtu) and fuel input ratio of 7000 Btu/hp hr (AP-42 Section 3.3)emission factor for Pb based on AP-42 Section 3.1 (1.4e-5 lb/MMBtu) and fuel input of 7000 Btu/hp hr (AP-42 Section 3.3)emission factor for H2SO4 ( 0.000031 lb/MMBTu) from Toxic air pollutant emission factors - a compilation for selected compounds and sources (EPA, 1990) and fuel input ratio of 7000 Btu/hpemission factor for CO2 (165 lb/MMBtu) from AP-42 Table 3.4-1emission factor for CH4 (0.0081 lb/MMBtu) from AP-42 Table 3.4-1emission factor for N2O (0.6 g/MMBtu) from Climate Registry General Reporting Protocol (GRP) (Emission Factors by Fuel Type and Sector)
The post-2009 emission factor for NOx and VOC (non methane hydrocarbons (NMHC)) provided in Subpart IIII - Table 4 is provided as a combine factor (NOx+NMHC). The breakdown of NOx and NMHC in this total factor was estimated using the Tier 1 factors provided in 40 CFR 89 Subpart B Table 1. For example, the NOx emission factor was determined via the following equation: 0.4 * (9.2/(9.2+1.3))
The Tier 2 emission factor for NOx and VOC (non methane hydrocarbons (NMHC)) provided in Subpart B - Table 1 is provided as a combined factor (NOx+NMHC). The breakdown of NOx and NMHC in this total factor was estimated using the Tier 1 factors provided in 40 CFR 89 Subpart B Table 1. For example, the NOx emission factor was determined via the following equation: 6.4 * (9.2/(9.2+1.3))
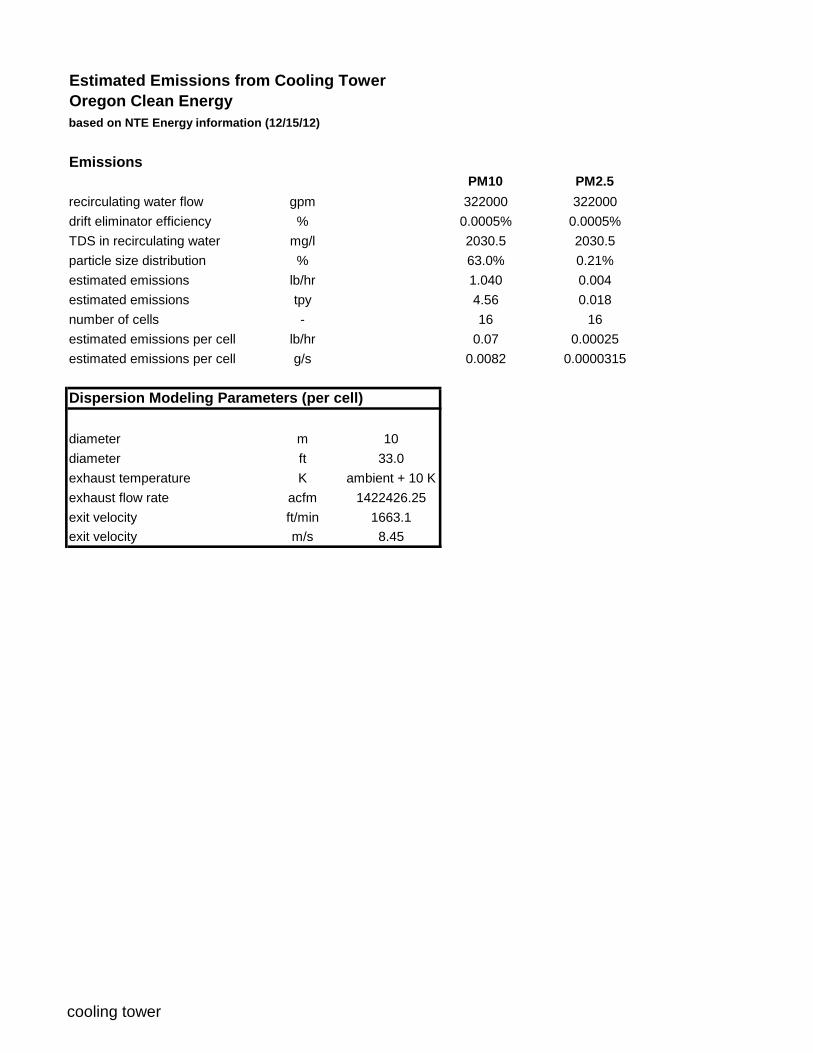
cooling tower
Estimated Emissions from Cooling TowerOregon Clean Energybased on NTE Energy information (12/15/12)
EmissionsPM10 PM2.5
recirculating water flow gpm 322000 322000drift eliminator efficiency % 0.0005% 0.0005%TDS in recirculating water mg/l 2030.5 2030.5particle size distribution % 63.0% 0.21%estimated emissions lb/hr 1.040 0.004estimated emissions tpy 4.56 0.018number of cells - 16 16estimated emissions per cell lb/hr 0.07 0.00025estimated emissions per cell g/s 0.0082 0.0000315
Dispersion Modeling Parameters (per cell)
diameter m 10diameter ft 33.0exhaust temperature K ambient + 10 Kexhaust flow rate acfm 1422426.25exit velocity ft/min 1663.1exit velocity m/s 8.45
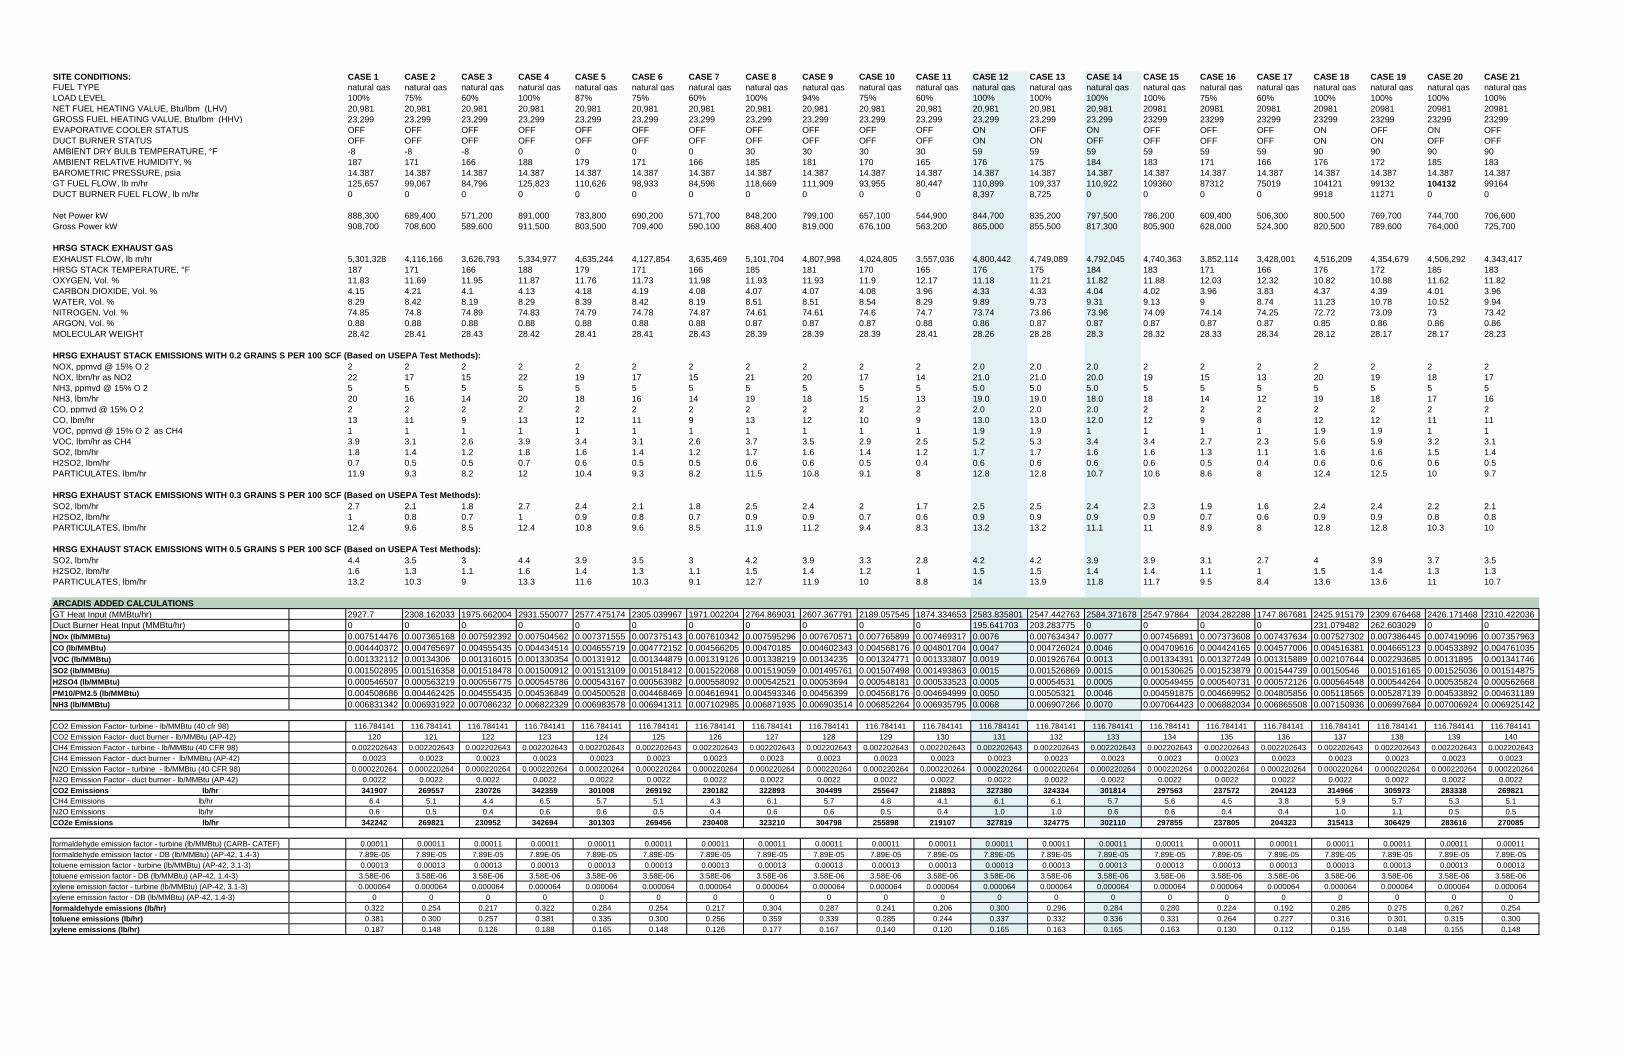
SITE CONDITIONS: CASE 1 CASE 2 CASE 3 CASE 4 CASE 5 CASE 6 CASE 7 CASE 8 CASE 9 CASE 10 CASE 11 CASE 12 CASE 13 CASE 14 CASE 15 CASE 16 CASE 17 CASE 18 CASE 19 CASE 20 CASE 21FUEL TYPE natural gas natural gas natural gas natural gas natural gas natural gas natural gas natural gas natural gas natural gas natural gas natural gas natural gas natural gas natural gas natural gas natural gas natural gas natural gas natural gas natural gasLOAD LEVEL 100% 75% 60% 100% 87% 75% 60% 100% 94% 75% 60% 100% 100% 100% 100% 75% 60% 100% 100% 100% 100%NET FUEL HEATING VALUE, Btu/lbm (LHV) 20,981 20,981 20,981 20,981 20,981 20,981 20,981 20,981 20,981 20,981 20,981 20,981 20,981 20,981 20981 20981 20981 20981 20981 20981 20981GROSS FUEL HEATING VALUE, Btu/lbm (HHV) 23,299 23,299 23,299 23,299 23,299 23,299 23,299 23,299 23,299 23,299 23,299 23,299 23,299 23,299 23299 23299 23299 23299 23299 23299 23299EVAPORATIVE COOLER STATUS OFF OFF OFF OFF OFF OFF OFF OFF OFF OFF OFF ON OFF ON OFF OFF OFF ON OFF ON OFFDUCT BURNER STATUS OFF OFF OFF OFF OFF OFF OFF OFF OFF OFF OFF ON ON OFF OFF OFF OFF ON ON OFF OFFAMBIENT DRY BULB TEMPERATURE, °F -8 -8 -8 0 0 0 0 30 30 30 30 59 59 59 59 59 59 90 90 90 90AMBIENT RELATIVE HUMIDITY, % 187 171 166 188 179 171 166 185 181 170 165 176 175 184 183 171 166 176 172 185 183BAROMETRIC PRESSURE, psia 14.387 14.387 14.387 14.387 14.387 14.387 14.387 14.387 14.387 14.387 14.387 14.387 14.387 14.387 14.387 14.387 14.387 14.387 14.387 14.387 14.387GT FUEL FLOW, lb m/hr 125,657 99,067 84,796 125,823 110,626 98,933 84,596 118,669 111,909 93,955 80,447 110,899 109,337 110,922 109360 87312 75019 104121 99132 104132 99164DUCT BURNER FUEL FLOW, lb m/hr 0 0 0 0 0 0 0 0 0 0 0 8,397 8,725 0 0 0 0 9918 11271 0 0
Net Power kW 888,300 689,400 571,200 891,000 783,800 690,200 571,700 848,200 799,100 657,100 544,900 844,700 835,200 797,500 786,200 609,400 506,300 800,500 769,700 744,700 706,600Gross Power kW 908,700 708,600 589,600 911,500 803,500 709,400 590,100 868,400 819,000 676,100 563,200 865,000 855,500 817,300 805,900 628,000 524,300 820,500 789,600 764,000 725,700
HRSG STACK EXHAUST GASEXHAUST FLOW, lb m/hr 5,301,328 4,116,166 3,626,793 5,334,977 4,635,244 4,127,854 3,635,469 5,101,704 4,807,998 4,024,805 3,557,036 4,800,442 4,749,089 4,792,045 4,740,363 3,852,114 3,428,001 4,516,209 4,354,679 4,506,292 4,343,417HRSG STACK TEMPERATURE, °F 187 171 166 188 179 171 166 185 181 170 165 176 175 184 183 171 166 176 172 185 183OXYGEN, Vol. % 11.83 11.69 11.95 11.87 11.76 11.73 11.98 11.93 11.93 11.9 12.17 11.18 11.21 11.82 11.88 12.03 12.32 10.82 10.88 11.62 11.82CARBON DIOXIDE, Vol. % 4.15 4.21 4.1 4.13 4.18 4.19 4.08 4.07 4.07 4.08 3.96 4.33 4.33 4.04 4.02 3.96 3.83 4.37 4.39 4.01 3.96WATER, Vol. % 8.29 8.42 8.19 8.29 8.39 8.42 8.19 8.51 8.51 8.54 8.29 9.89 9.73 9.31 9.13 9 8.74 11.23 10.78 10.52 9.94NITROGEN, Vol. % 74.85 74.8 74.89 74.83 74.79 74.78 74.87 74.61 74.61 74.6 74.7 73.74 73.86 73.96 74.09 74.14 74.25 72.72 73.09 73 73.42ARGON, Vol. % 0.88 0.88 0.88 0.88 0.88 0.88 0.88 0.87 0.87 0.87 0.88 0.86 0.87 0.87 0.87 0.87 0.87 0.85 0.86 0.86 0.86MOLECULAR WEIGHT 28.42 28.41 28.43 28.42 28.41 28.41 28.43 28.39 28.39 28.39 28.41 28.26 28.28 28.3 28.32 28.33 28.34 28.12 28.17 28.17 28.23
HRSG EXHAUST STACK EMISSIONS WITH 0.2 GRAINS S PER 100 SCF (Based on USEPA Test Methods):NOX, ppmvd @ 15% O 2 2 2 2 2 2 2 2 2 2 2 2 2.0 2.0 2.0 2 2 2 2 2 2 2NOX, lbm/hr as NO2 22 17 15 22 19 17 15 21 20 17 14 21.0 21.0 20.0 19 15 13 20 19 18 17NH3, ppmvd @ 15% O 2 5 5 5 5 5 5 5 5 5 5 5 5.0 5.0 5.0 5 5 5 5 5 5 5NH3, lbm/hr 20 16 14 20 18 16 14 19 18 15 13 19.0 19.0 18.0 18 14 12 19 18 17 16CO, ppmvd @ 15% O 2 2 2 2 2 2 2 2 2 2 2 2 2.0 2.0 2.0 2 2 2 2 2 2 2CO, lbm/hr 13 11 9 13 12 11 9 13 12 10 9 13.0 13.0 12.0 12 9 8 12 12 11 11VOC, ppmvd @ 15% O 2 as CH4 1 1 1 1 1 1 1 1 1 1 1 1.9 1.9 1 1 1 1 1.9 1.9 1 1VOC, lbm/hr as CH4 3.9 3.1 2.6 3.9 3.4 3.1 2.6 3.7 3.5 2.9 2.5 5.2 5.3 3.4 3.4 2.7 2.3 5.6 5.9 3.2 3.1SO2, lbm/hr 1.8 1.4 1.2 1.8 1.6 1.4 1.2 1.7 1.6 1.4 1.2 1.7 1.7 1.6 1.6 1.3 1.1 1.6 1.6 1.5 1.4H2SO2, lbm/hr 0.7 0.5 0.5 0.7 0.6 0.5 0.5 0.6 0.6 0.5 0.4 0.6 0.6 0.6 0.6 0.5 0.4 0.6 0.6 0.6 0.5PARTICULATES, lbm/hr 11.9 9.3 8.2 12 10.4 9.3 8.2 11.5 10.8 9.1 8 12.8 12.8 10.7 10.6 8.6 8 12.4 12.5 10 9.7
HRSG EXHAUST STACK EMISSIONS WITH 0.3 GRAINS S PER 100 SCF (Based on USEPA Test Methods):SO2, lbm/hr 2.7 2.1 1.8 2.7 2.4 2.1 1.8 2.5 2.4 2 1.7 2.5 2.5 2.4 2.3 1.9 1.6 2.4 2.4 2.2 2.1H2SO2, lbm/hr 1 0.8 0.7 1 0.9 0.8 0.7 0.9 0.9 0.7 0.6 0.9 0.9 0.9 0.9 0.7 0.6 0.9 0.9 0.8 0.8PARTICULATES, lbm/hr 12.4 9.6 8.5 12.4 10.8 9.6 8.5 11.9 11.2 9.4 8.3 13.2 13.2 11.1 11 8.9 8 12.8 12.8 10.3 10
HRSG EXHAUST STACK EMISSIONS WITH 0.5 GRAINS S PER 100 SCF (Based on USEPA Test Methods):SO2, lbm/hr 4.4 3.5 3 4.4 3.9 3.5 3 4.2 3.9 3.3 2.8 4.2 4.2 3.9 3.9 3.1 2.7 4 3.9 3.7 3.5H2SO2, lbm/hr 1.6 1.3 1.1 1.6 1.4 1.3 1.1 1.5 1.4 1.2 1 1.5 1.5 1.4 1.4 1.1 1 1.5 1.4 1.3 1.3PARTICULATES, lbm/hr 13.2 10.3 9 13.3 11.6 10.3 9.1 12.7 11.9 10 8.8 14 13.9 11.8 11.7 9.5 8.4 13.6 13.6 11 10.7
ARCADIS ADDED CALCULATIONSGT Heat Input (MMBtu/hr) 2927.7 2308.162033 1975.662004 2931.550077 2577.475174 2305.039967 1971.002204 2764.869031 2607.367791 2189.057545 1874.334653 2583.835801 2547.442763 2584.371678 2547.97864 2034.282288 1747.867681 2425.915179 2309.676468 2426.171468 2310.422036Duct Burner Heat Input (MMBtu/hr) 0 0 0 0 0 0 0 0 0 0 0 195.641703 203.283775 0 0 0 0 231.079482 262.603029 0 0NOx (lb/MMBtu) 0.007514476 0.007365168 0.007592392 0.007504562 0.007371555 0.007375143 0.007610342 0.007595296 0.007670571 0.007765899 0.007469317 0.0076 0.007634347 0.0077 0.007456891 0.007373608 0.007437634 0.007527302 0.007386445 0.007419096 0.007357963CO (lb/MMBtu) 0.004440372 0.004765697 0.004555435 0.004434514 0.004655719 0.004772152 0.004566205 0.00470185 0.004602343 0.004568176 0.004801704 0.0047 0.004726024 0.0046 0.004709616 0.004424165 0.004577006 0.004516381 0.004665123 0.004533892 0.004761035VOC (lb/MMBtu) 0.001332112 0.00134306 0.001316015 0.001330354 0.00131912 0.001344879 0.001319126 0.001338219 0.00134235 0.001324771 0.001333807 0.0019 0.001926764 0.0013 0.001334391 0.001327249 0.001315889 0.002107644 0.002293685 0.00131895 0.001341746SO2 (lb/MMBtu) 0.001502895 0.001516358 0.001518478 0.001500912 0.001513109 0.001518412 0.001522068 0.001519059 0.001495761 0.001507498 0.001493863 0.0015 0.001526869 0.0015 0.001530625 0.001523879 0.001544739 0.00150546 0.001516165 0.001525036 0.001514875H2SO4 (lb/MMBtu) 0.000546507 0.000563219 0.000556775 0.000545786 0.000543167 0.000563982 0.000558092 0.000542521 0.00053694 0.000548181 0.000533523 0.0005 0.00054531 0.0005 0.000549455 0.000540731 0.000572126 0.000564548 0.000544264 0.000535824 0.000562668PM10/PM2.5 (lb/MMBtu) 0.004508686 0.004462425 0.004555435 0.004536849 0.004500528 0.004468469 0.004616941 0.004593346 0.00456399 0.004568176 0.004694999 0.0050 0.00505321 0.0046 0.004591875 0.004669952 0.004805856 0.005118565 0.005287139 0.004533892 0.004631189NH3 (lb/MMBtu) 0.006831342 0.006931922 0.007086232 0.006822329 0.006983578 0.006941311 0.007102985 0.006871935 0.006903514 0.006852264 0.006935795 0.0068 0.006907266 0.0070 0.007064423 0.006882034 0.006865508 0.007150936 0.006997684 0.007006924 0.006925142
CO2 Emission Factor- turbine - lb/MMBtu (40 cfr 98) 116.784141 116.784141 116.784141 116.784141 116.784141 116.784141 116.784141 116.784141 116.784141 116.784141 116.784141 116.784141 116.784141 116.784141 116.784141 116.784141 116.784141 116.784141 116.784141 116.784141 116.784141CO2 Emission Factor- duct burner - lb/MMBtu (AP-42) 120 121 122 123 124 125 126 127 128 129 130 131 132 133 134 135 136 137 138 139 140CH4 Emission Factor - turbine - lb/MMBtu (40 CFR 98) 0.002202643 0.002202643 0.002202643 0.002202643 0.002202643 0.002202643 0.002202643 0.002202643 0.002202643 0.002202643 0.002202643 0.002202643 0.002202643 0.002202643 0.002202643 0.002202643 0.002202643 0.002202643 0.002202643 0.002202643 0.002202643CH4 Emission Factor - duct burner - lb/MMBtu (AP-42) 0.0023 0.0023 0.0023 0.0023 0.0023 0.0023 0.0023 0.0023 0.0023 0.0023 0.0023 0.0023 0.0023 0.0023 0.0023 0.0023 0.0023 0.0023 0.0023 0.0023 0.0023N2O Emission Factor - turbine - lb/MMBtu (40 CFR 98) 0.000220264 0.000220264 0.000220264 0.000220264 0.000220264 0.000220264 0.000220264 0.000220264 0.000220264 0.000220264 0.000220264 0.000220264 0.000220264 0.000220264 0.000220264 0.000220264 0.000220264 0.000220264 0.000220264 0.000220264 0.000220264N2O Emission Factor - duct burner - lb/MMBtu (AP-42) 0.0022 0.0022 0.0022 0.0022 0.0022 0.0022 0.0022 0.0022 0.0022 0.0022 0.0022 0.0022 0.0022 0.0022 0.0022 0.0022 0.0022 0.0022 0.0022 0.0022 0.0022CO2 Emissions lb/hr 341907 269557 230726 342359 301008 269192 230182 322893 304499 255647 218893 327380 324334 301814 297563 237572 204123 314966 305973 283338 269821CH4 Emissions lb/hr 6.4 5.1 4.4 6.5 5.7 5.1 4.3 6.1 5.7 4.8 4.1 6.1 6.1 5.7 5.6 4.5 3.8 5.9 5.7 5.3 5.1N2O Emissions lb/hr 0.6 0.5 0.4 0.6 0.6 0.5 0.4 0.6 0.6 0.5 0.4 1.0 1.0 0.6 0.6 0.4 0.4 1.0 1.1 0.5 0.5CO2e Emissions lb/hr 342242 269821 230952 342694 301303 269456 230408 323210 304798 255898 219107 327819 324775 302110 297855 237805 204323 315413 306429 283616 270085
formaldehyde emission factor - turbine (lb/MMBtu) (CARB- CATEF) 0.00011 0.00011 0.00011 0.00011 0.00011 0.00011 0.00011 0.00011 0.00011 0.00011 0.00011 0.00011 0.00011 0.00011 0.00011 0.00011 0.00011 0.00011 0.00011 0.00011 0.00011formaldehyde emission factor - DB (lb/MMBtu) (AP-42, 1.4-3) 7.89E-05 7.89E-05 7.89E-05 7.89E-05 7.89E-05 7.89E-05 7.89E-05 7.89E-05 7.89E-05 7.89E-05 7.89E-05 7.89E-05 7.89E-05 7.89E-05 7.89E-05 7.89E-05 7.89E-05 7.89E-05 7.89E-05 7.89E-05 7.89E-05toluene emission factor - turbine (lb/MMBtu) (AP-42, 3.1-3) 0.00013 0.00013 0.00013 0.00013 0.00013 0.00013 0.00013 0.00013 0.00013 0.00013 0.00013 0.00013 0.00013 0.00013 0.00013 0.00013 0.00013 0.00013 0.00013 0.00013 0.00013toluene emission factor - DB (lb/MMBtu) (AP-42, 1.4-3) 3.58E-06 3.58E-06 3.58E-06 3.58E-06 3.58E-06 3.58E-06 3.58E-06 3.58E-06 3.58E-06 3.58E-06 3.58E-06 3.58E-06 3.58E-06 3.58E-06 3.58E-06 3.58E-06 3.58E-06 3.58E-06 3.58E-06 3.58E-06 3.58E-06xylene emission factor - turbine (lb/MMBtu) (AP-42, 3.1-3) 0.000064 0.000064 0.000064 0.000064 0.000064 0.000064 0.000064 0.000064 0.000064 0.000064 0.000064 0.000064 0.000064 0.000064 0.000064 0.000064 0.000064 0.000064 0.000064 0.000064 0.000064xylene emission factor - DB (lb/MMBtu) (AP-42, 1.4-3) 0 0 0 0 0 0 0 0 0 0 0 0 0 0 0 0 0 0 0 0 0formaldehyde emissions (lb/hr) 0.322 0.254 0.217 0.322 0.284 0.254 0.217 0.304 0.287 0.241 0.206 0.300 0.296 0.284 0.280 0.224 0.192 0.285 0.275 0.267 0.254toluene emissions (lb/hr) 0.381 0.300 0.257 0.381 0.335 0.300 0.256 0.359 0.339 0.285 0.244 0.337 0.332 0.336 0.331 0.264 0.227 0.316 0.301 0.315 0.300xylene emissions (lb/hr) 0.187 0.148 0.126 0.188 0.165 0.148 0.126 0.177 0.167 0.140 0.120 0.165 0.163 0.165 0.163 0.130 0.112 0.155 0.148 0.155 0.148
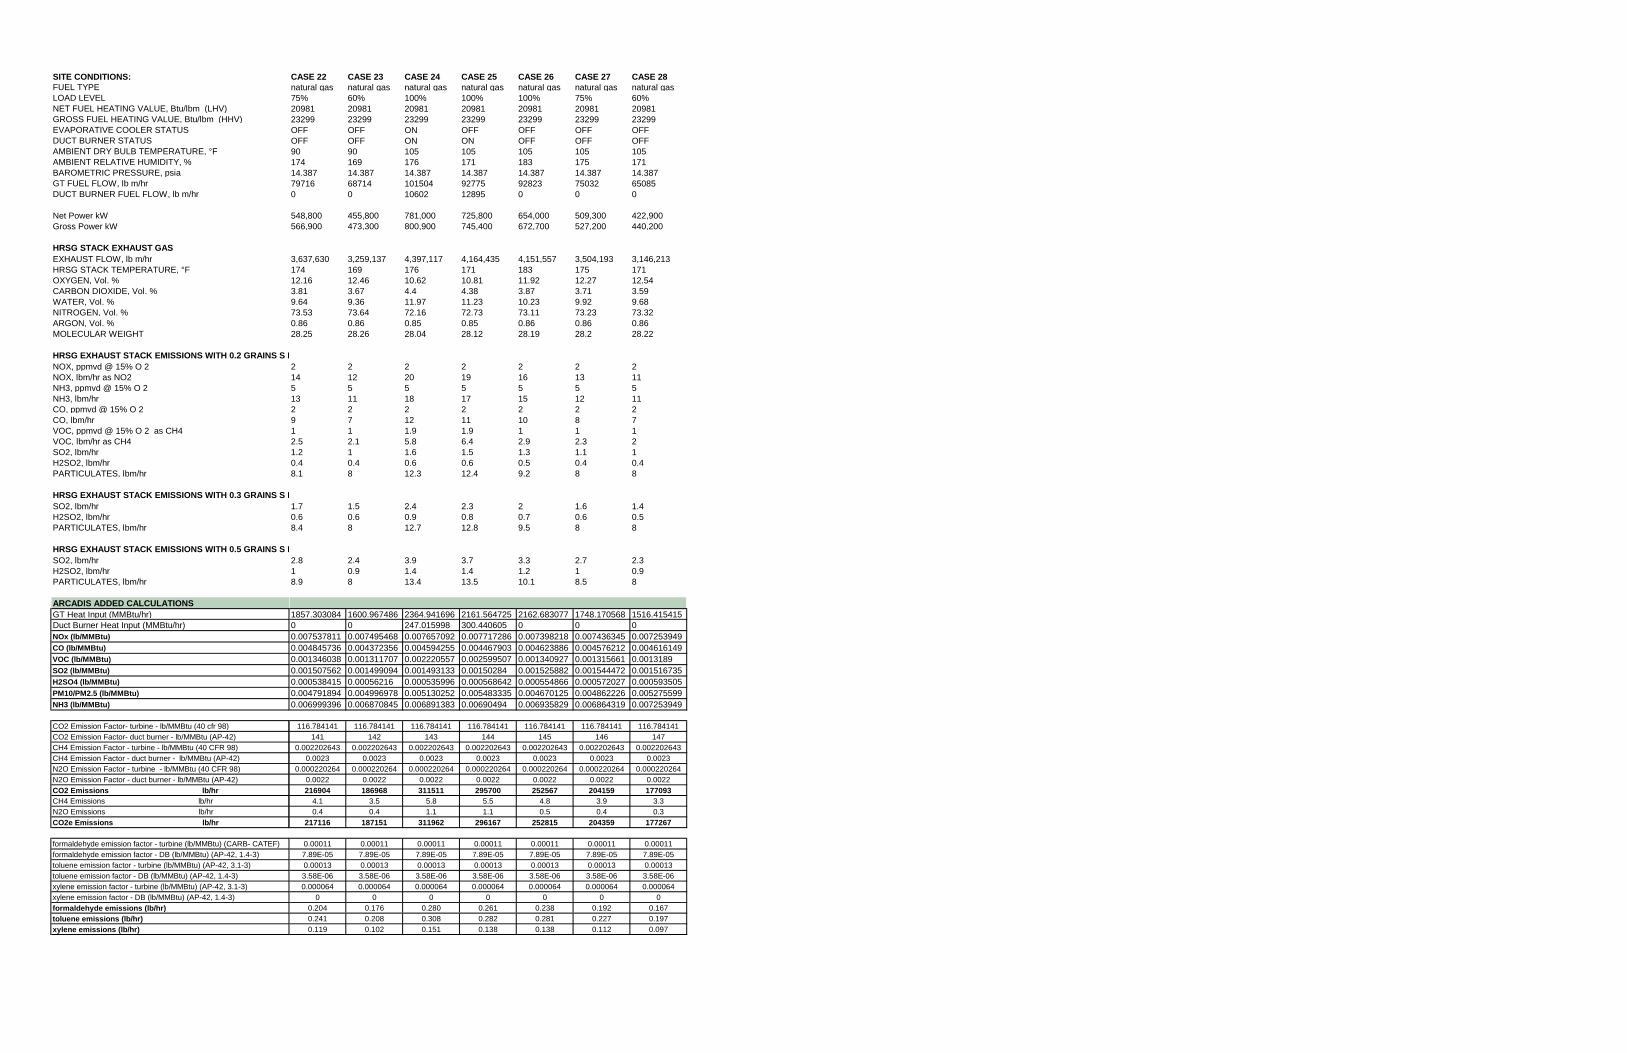
SITE CONDITIONS:FUEL TYPELOAD LEVELNET FUEL HEATING VALUE, Btu/lbm (LHV)GROSS FUEL HEATING VALUE, Btu/lbm (HHV)EVAPORATIVE COOLER STATUSDUCT BURNER STATUSAMBIENT DRY BULB TEMPERATURE, °FAMBIENT RELATIVE HUMIDITY, %BAROMETRIC PRESSURE, psiaGT FUEL FLOW, lb m/hrDUCT BURNER FUEL FLOW, lb m/hr
Net Power kWGross Power kW
HRSG STACK EXHAUST GASEXHAUST FLOW, lb m/hrHRSG STACK TEMPERATURE, °FOXYGEN, Vol. %CARBON DIOXIDE, Vol. %WATER, Vol. %NITROGEN, Vol. %ARGON, Vol. %MOLECULAR WEIGHT
HRSG EXHAUST STACK EMISSIONS WITH 0.2 GRAINS S P NOX, ppmvd @ 15% O 2NOX, lbm/hr as NO2NH3, ppmvd @ 15% O 2NH3, lbm/hrCO, ppmvd @ 15% O 2CO, lbm/hrVOC, ppmvd @ 15% O 2 as CH4VOC, lbm/hr as CH4SO2, lbm/hrH2SO2, lbm/hrPARTICULATES, lbm/hr
HRSG EXHAUST STACK EMISSIONS WITH 0.3 GRAINS S P SO2, lbm/hrH2SO2, lbm/hrPARTICULATES, lbm/hr
HRSG EXHAUST STACK EMISSIONS WITH 0.5 GRAINS S P SO2, lbm/hrH2SO2, lbm/hrPARTICULATES, lbm/hr
ARCADIS ADDED CALCULATIONSGT Heat Input (MMBtu/hr)Duct Burner Heat Input (MMBtu/hr)NOx (lb/MMBtu)CO (lb/MMBtu)VOC (lb/MMBtu)SO2 (lb/MMBtu)H2SO4 (lb/MMBtu)PM10/PM2.5 (lb/MMBtu)NH3 (lb/MMBtu)
CO2 Emission Factor- turbine - lb/MMBtu (40 cfr 98)CO2 Emission Factor- duct burner - lb/MMBtu (AP-42)CH4 Emission Factor - turbine - lb/MMBtu (40 CFR 98)CH4 Emission Factor - duct burner - lb/MMBtu (AP-42)N2O Emission Factor - turbine - lb/MMBtu (40 CFR 98)N2O Emission Factor - duct burner - lb/MMBtu (AP-42)CO2 Emissions lb/hrCH4 Emissions lb/hrN2O Emissions lb/hrCO2e Emissions lb/hr
formaldehyde emission factor - turbine (lb/MMBtu) (CARB- CATEF)formaldehyde emission factor - DB (lb/MMBtu) (AP-42, 1.4-3)toluene emission factor - turbine (lb/MMBtu) (AP-42, 3.1-3)toluene emission factor - DB (lb/MMBtu) (AP-42, 1.4-3)xylene emission factor - turbine (lb/MMBtu) (AP-42, 3.1-3)xylene emission factor - DB (lb/MMBtu) (AP-42, 1.4-3)formaldehyde emissions (lb/hr)toluene emissions (lb/hr)xylene emissions (lb/hr)
CASE 22 CASE 23 CASE 24 CASE 25 CASE 26 CASE 27 CASE 28natural gas natural gas natural gas natural gas natural gas natural gas natural gas75% 60% 100% 100% 100% 75% 60%20981 20981 20981 20981 20981 20981 2098123299 23299 23299 23299 23299 23299 23299OFF OFF ON OFF OFF OFF OFFOFF OFF ON ON OFF OFF OFF90 90 105 105 105 105 105174 169 176 171 183 175 17114.387 14.387 14.387 14.387 14.387 14.387 14.38779716 68714 101504 92775 92823 75032 650850 0 10602 12895 0 0 0
548,800 455,800 781,000 725,800 654,000 509,300 422,900566,900 473,300 800,900 745,400 672,700 527,200 440,200
3,637,630 3,259,137 4,397,117 4,164,435 4,151,557 3,504,193 3,146,213174 169 176 171 183 175 17112.16 12.46 10.62 10.81 11.92 12.27 12.543.81 3.67 4.4 4.38 3.87 3.71 3.599.64 9.36 11.97 11.23 10.23 9.92 9.6873.53 73.64 72.16 72.73 73.11 73.23 73.320.86 0.86 0.85 0.85 0.86 0.86 0.8628.25 28.26 28.04 28.12 28.19 28.2 28.22
2 2 2 2 2 2 214 12 20 19 16 13 115 5 5 5 5 5 513 11 18 17 15 12 112 2 2 2 2 2 29 7 12 11 10 8 71 1 1.9 1.9 1 1 12.5 2.1 5.8 6.4 2.9 2.3 21.2 1 1.6 1.5 1.3 1.1 10.4 0.4 0.6 0.6 0.5 0.4 0.48.1 8 12.3 12.4 9.2 8 8
1.7 1.5 2.4 2.3 2 1.6 1.40.6 0.6 0.9 0.8 0.7 0.6 0.58.4 8 12.7 12.8 9.5 8 8
2.8 2.4 3.9 3.7 3.3 2.7 2.31 0.9 1.4 1.4 1.2 1 0.98.9 8 13.4 13.5 10.1 8.5 8
1857.303084 1600.967486 2364.941696 2161.564725 2162.683077 1748.170568 1516.4154150 0 247.015998 300.440605 0 0 00.007537811 0.007495468 0.007657092 0.007717286 0.007398218 0.007436345 0.0072539490.004845736 0.004372356 0.004594255 0.004467903 0.004623886 0.004576212 0.0046161490.001346038 0.001311707 0.002220557 0.002599507 0.001340927 0.001315661 0.00131890.001507562 0.001499094 0.001493133 0.00150284 0.001525882 0.001544472 0.0015167350.000538415 0.00056216 0.000535996 0.000568642 0.000554866 0.000572027 0.0005935050.004791894 0.004996978 0.005130252 0.005483335 0.004670125 0.004862226 0.0052755990.006999396 0.006870845 0.006891383 0.00690494 0.006935829 0.006864319 0.007253949
116.784141 116.784141 116.784141 116.784141 116.784141 116.784141 116.784141141 142 143 144 145 146 147
0.002202643 0.002202643 0.002202643 0.002202643 0.002202643 0.002202643 0.0022026430.0023 0.0023 0.0023 0.0023 0.0023 0.0023 0.0023
0.000220264 0.000220264 0.000220264 0.000220264 0.000220264 0.000220264 0.0002202640.0022 0.0022 0.0022 0.0022 0.0022 0.0022 0.0022216904 186968 311511 295700 252567 204159 177093
4.1 3.5 5.8 5.5 4.8 3.9 3.30.4 0.4 1.1 1.1 0.5 0.4 0.3
217116 187151 311962 296167 252815 204359 177267
0.00011 0.00011 0.00011 0.00011 0.00011 0.00011 0.000117.89E-05 7.89E-05 7.89E-05 7.89E-05 7.89E-05 7.89E-05 7.89E-050.00013 0.00013 0.00013 0.00013 0.00013 0.00013 0.000133.58E-06 3.58E-06 3.58E-06 3.58E-06 3.58E-06 3.58E-06 3.58E-060.000064 0.000064 0.000064 0.000064 0.000064 0.000064 0.000064
0 0 0 0 0 0 00.204 0.176 0.280 0.261 0.238 0.192 0.1670.241 0.208 0.308 0.282 0.281 0.227 0.1970.119 0.102 0.151 0.138 0.138 0.112 0.097
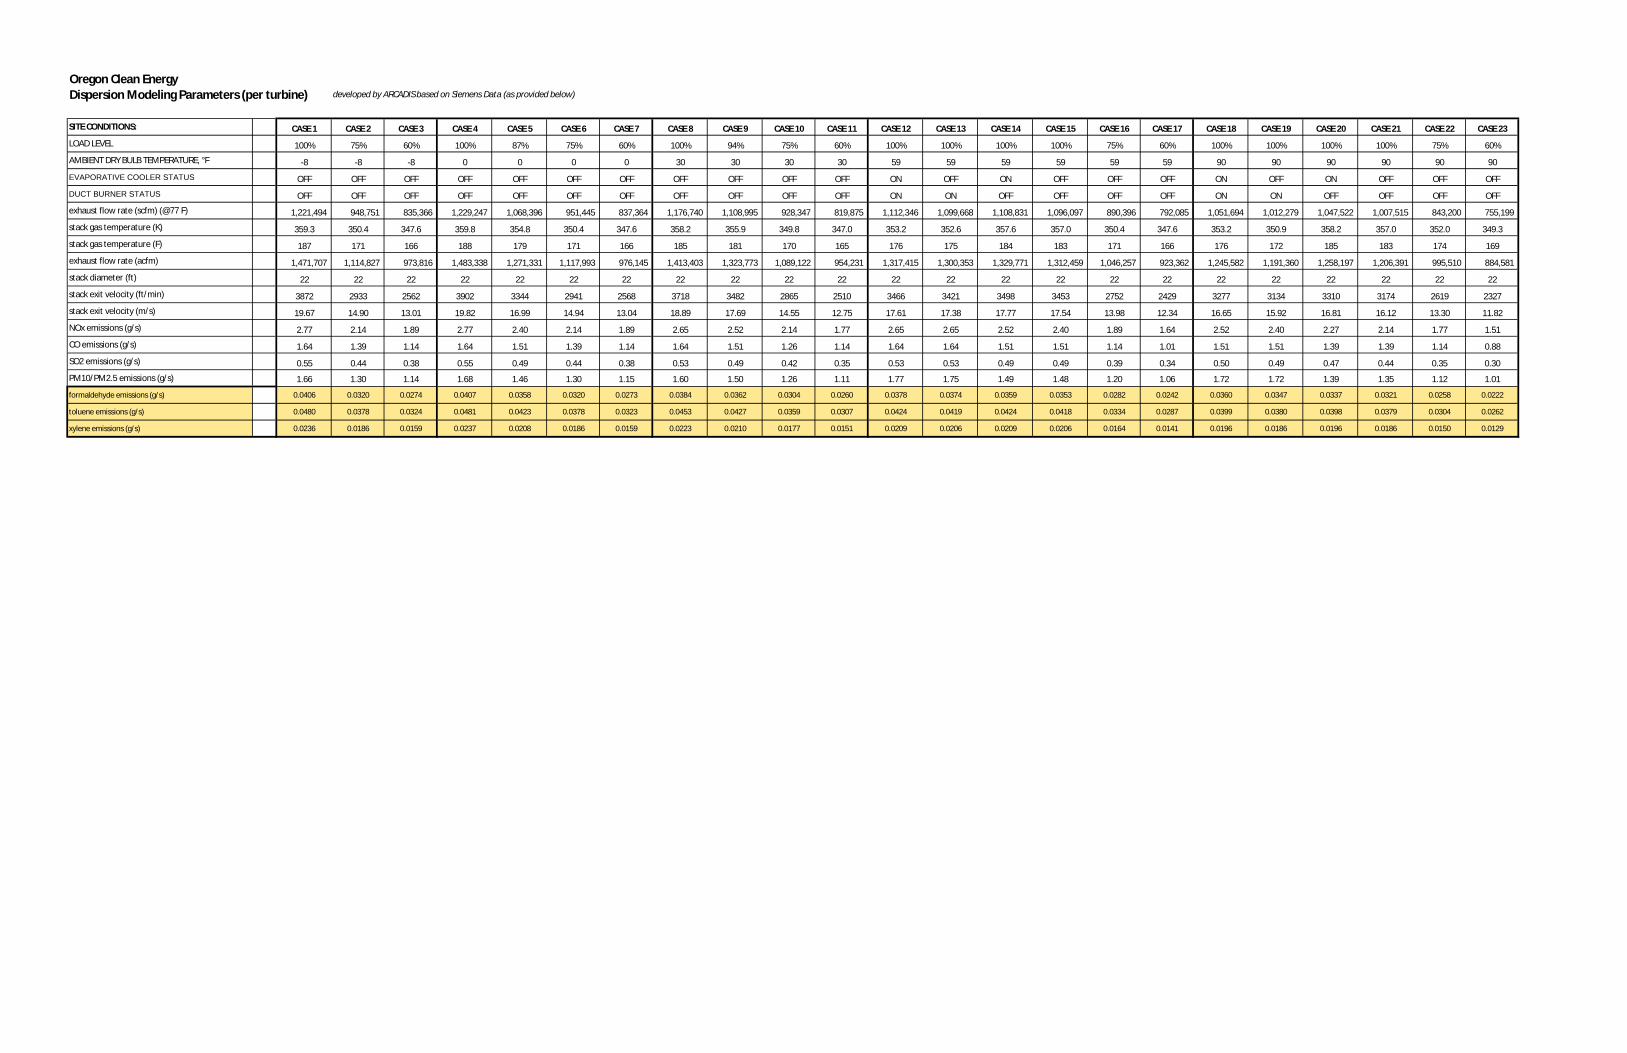
Oregon Clean EnergyDispersion Modeling Parameters (per turbine) developed by ARCADIS based on Siemens Data (as provided below)
SITE CONDITIONS: CASE 1 CASE 2 CASE 3 CASE 4 CASE 5 CASE 6 CASE 7 CASE 8 CASE 9 CASE 10 CASE 11 CASE 12 CASE 13 CASE 14 CASE 15 CASE 16 CASE 17 CASE 18 CASE 19 CASE 20 CASE 21 CASE 22 CASE 23
LOAD LEVEL 100% 75% 60% 100% 87% 75% 60% 100% 94% 75% 60% 100% 100% 100% 100% 75% 60% 100% 100% 100% 100% 75% 60%
AMBIENT DRY BULB TEMPERATURE, °F -8 -8 -8 0 0 0 0 30 30 30 30 59 59 59 59 59 59 90 90 90 90 90 90
EVAPORATIVE COOLER STATUS OFF OFF OFF OFF OFF OFF OFF OFF OFF OFF OFF ON OFF ON OFF OFF OFF ON OFF ON OFF OFF OFF
DUCT BURNER STATUS OFF OFF OFF OFF OFF OFF OFF OFF OFF OFF OFF ON ON OFF OFF OFF OFF ON ON OFF OFF OFF OFF
exhaust flow rate (scfm) (@77 F) 1,221,494 948,751 835,366 1,229,247 1,068,396 951,445 837,364 1,176,740 1,108,995 928,347 819,875 1,112,346 1,099,668 1,108,831 1,096,097 890,396 792,085 1,051,694 1,012,279 1,047,522 1,007,515 843,200 755,199
stack gas temperature (K) 359.3 350.4 347.6 359.8 354.8 350.4 347.6 358.2 355.9 349.8 347.0 353.2 352.6 357.6 357.0 350.4 347.6 353.2 350.9 358.2 357.0 352.0 349.3
stack gas temperature (F) 187 171 166 188 179 171 166 185 181 170 165 176 175 184 183 171 166 176 172 185 183 174 169
exhaust flow rate (acfm) 1,471,707 1,114,827 973,816 1,483,338 1,271,331 1,117,993 976,145 1,413,403 1,323,773 1,089,122 954,231 1,317,415 1,300,353 1,329,771 1,312,459 1,046,257 923,362 1,245,582 1,191,360 1,258,197 1,206,391 995,510 884,581
stack diameter (ft) 22 22 22 22 22 22 22 22 22 22 22 22 22 22 22 22 22 22 22 22 22 22 22
stack exit velocity (ft/min) 3872 2933 2562 3902 3344 2941 2568 3718 3482 2865 2510 3466 3421 3498 3453 2752 2429 3277 3134 3310 3174 2619 2327
stack exit velocity (m/s) 19.67 14.90 13.01 19.82 16.99 14.94 13.04 18.89 17.69 14.55 12.75 17.61 17.38 17.77 17.54 13.98 12.34 16.65 15.92 16.81 16.12 13.30 11.82
NOx emissions (g/s) 2.77 2.14 1.89 2.77 2.40 2.14 1.89 2.65 2.52 2.14 1.77 2.65 2.65 2.52 2.40 1.89 1.64 2.52 2.40 2.27 2.14 1.77 1.51
CO emissions (g/s) 1.64 1.39 1.14 1.64 1.51 1.39 1.14 1.64 1.51 1.26 1.14 1.64 1.64 1.51 1.51 1.14 1.01 1.51 1.51 1.39 1.39 1.14 0.88
SO2 emissions (g/s) 0.55 0.44 0.38 0.55 0.49 0.44 0.38 0.53 0.49 0.42 0.35 0.53 0.53 0.49 0.49 0.39 0.34 0.50 0.49 0.47 0.44 0.35 0.30
PM10/PM2.5 emissions (g/s) 1.66 1.30 1.14 1.68 1.46 1.30 1.15 1.60 1.50 1.26 1.11 1.77 1.75 1.49 1.48 1.20 1.06 1.72 1.72 1.39 1.35 1.12 1.01
formaldehyde emissions (g/s) 0.0406 0.0320 0.0274 0.0407 0.0358 0.0320 0.0273 0.0384 0.0362 0.0304 0.0260 0.0378 0.0374 0.0359 0.0353 0.0282 0.0242 0.0360 0.0347 0.0337 0.0321 0.0258 0.0222
toluene emissions (g/s) 0.0480 0.0378 0.0324 0.0481 0.0423 0.0378 0.0323 0.0453 0.0427 0.0359 0.0307 0.0424 0.0419 0.0424 0.0418 0.0334 0.0287 0.0399 0.0380 0.0398 0.0379 0.0304 0.0262
xylene emissions (g/s) 0.0236 0.0186 0.0159 0.0237 0.0208 0.0186 0.0159 0.0223 0.0210 0.0177 0.0151 0.0209 0.0206 0.0209 0.0206 0.0164 0.0141 0.0196 0.0186 0.0196 0.0186 0.0150 0.0129

Oregon Clean EnergyDispersion Modeling Parameters (per tu
SITE CONDITIONS:
LOAD LEVEL
AMBIENT DRY BULB TEMPERATURE, °F
EVAPORATIVE COOLER STATUS
DUCT BURNER STATUS
exhaust flow rate (scfm) (@77 F)
stack gas temperature (K)
stack gas temperature (F)
exhaust flow rate (acfm)
stack diameter (ft)
stack exit velocity (ft/min)
stack exit velocity (m/s)
NOx emissions (g/s)
CO emissions (g/s)
SO2 emissions (g/s)
PM10/PM2.5 emissions (g/s)
formaldehyde emissions (g/s)
toluene emissions (g/s)
xylene emissions (g/s)
CASE 24 CASE 25 CASE 26 CASE 27 CASE 28
100% 100% 100% 75% 60%
105 105 105 105 105
ON OFF OFF OFF OFF
ON ON OFF OFF OFF
1,026,883 969,776 964,377 813,710 730,066
353.2 350.4 357.0 352.6 350.4
176 171 183 175 171
1,216,196 1,139,532 1,154,738 962,208 857,861
22 22 22 22 22
3199 2998 3038 2531 2257
16.25 15.23 15.43 12.86 11.46
2.52 2.40 2.02 1.64 1.39
1.51 1.39 1.26 1.01 0.88
0.49 0.47 0.42 0.34 0.29
1.69 1.70 1.27 1.07 1.01
0.0353 0.0330 0.0300 0.0243 0.0210
0.0389 0.0356 0.0355 0.0287 0.0249
0.0191 0.0174 0.0175 0.0141 0.0122
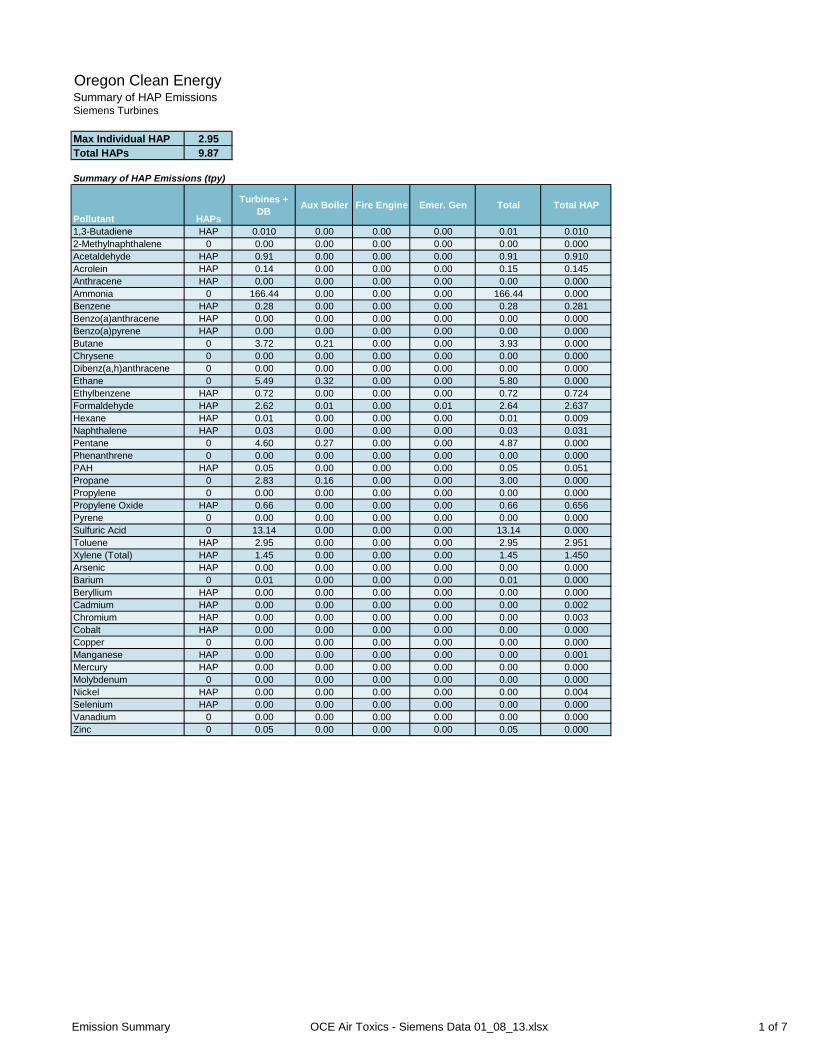
Emission Summary OCE Air Toxics - Siemens Data 01_08_13.xlsx 1 of 7
Oregon Clean EnergySummary of HAP Emissions Siemens Turbines
Max Individual HAP 2.95Total HAPs 9.87
Summary of HAP Emissions (tpy)
Pollutant HAPs
Turbines + DB Aux Boiler Fire Engine Emer. Gen Total Total HAP
1,3-Butadiene HAP 0.010 0.00 0.00 0.00 0.01 0.0102-Methylnaphthalene 0 0.00 0.00 0.00 0.00 0.00 0.000Acetaldehyde HAP 0.91 0.00 0.00 0.00 0.91 0.910Acrolein HAP 0.14 0.00 0.00 0.00 0.15 0.145Anthracene HAP 0.00 0.00 0.00 0.00 0.00 0.000Ammonia 0 166.44 0.00 0.00 0.00 166.44 0.000Benzene HAP 0.28 0.00 0.00 0.00 0.28 0.281Benzo(a)anthracene HAP 0.00 0.00 0.00 0.00 0.00 0.000Benzo(a)pyrene HAP 0.00 0.00 0.00 0.00 0.00 0.000Butane 0 3.72 0.21 0.00 0.00 3.93 0.000Chrysene 0 0.00 0.00 0.00 0.00 0.00 0.000Dibenz(a,h)anthracene 0 0.00 0.00 0.00 0.00 0.00 0.000Ethane 0 5.49 0.32 0.00 0.00 5.80 0.000Ethylbenzene HAP 0.72 0.00 0.00 0.00 0.72 0.724Formaldehyde HAP 2.62 0.01 0.00 0.01 2.64 2.637Hexane HAP 0.01 0.00 0.00 0.00 0.01 0.009Naphthalene HAP 0.03 0.00 0.00 0.00 0.03 0.031Pentane 0 4.60 0.27 0.00 0.00 4.87 0.000Phenanthrene 0 0.00 0.00 0.00 0.00 0.00 0.000PAH HAP 0.05 0.00 0.00 0.00 0.05 0.051Propane 0 2.83 0.16 0.00 0.00 3.00 0.000Propylene 0 0.00 0.00 0.00 0.00 0.00 0.000Propylene Oxide HAP 0.66 0.00 0.00 0.00 0.66 0.656Pyrene 0 0.00 0.00 0.00 0.00 0.00 0.000Sulfuric Acid 0 13.14 0.00 0.00 0.00 13.14 0.000Toluene HAP 2.95 0.00 0.00 0.00 2.95 2.951Xylene (Total) HAP 1.45 0.00 0.00 0.00 1.45 1.450Arsenic HAP 0.00 0.00 0.00 0.00 0.00 0.000Barium 0 0.01 0.00 0.00 0.00 0.01 0.000Beryllium HAP 0.00 0.00 0.00 0.00 0.00 0.000Cadmium HAP 0.00 0.00 0.00 0.00 0.00 0.002Chromium HAP 0.00 0.00 0.00 0.00 0.00 0.003Cobalt HAP 0.00 0.00 0.00 0.00 0.00 0.000Copper 0 0.00 0.00 0.00 0.00 0.00 0.000Manganese HAP 0.00 0.00 0.00 0.00 0.00 0.001Mercury HAP 0.00 0.00 0.00 0.00 0.00 0.000Molybdenum 0 0.00 0.00 0.00 0.00 0.00 0.000Nickel HAP 0.00 0.00 0.00 0.00 0.00 0.004Selenium HAP 0.00 0.00 0.00 0.00 0.00 0.000Vanadium 0 0.00 0.00 0.00 0.00 0.00 0.000Zinc 0 0.05 0.00 0.00 0.00 0.05 0.000
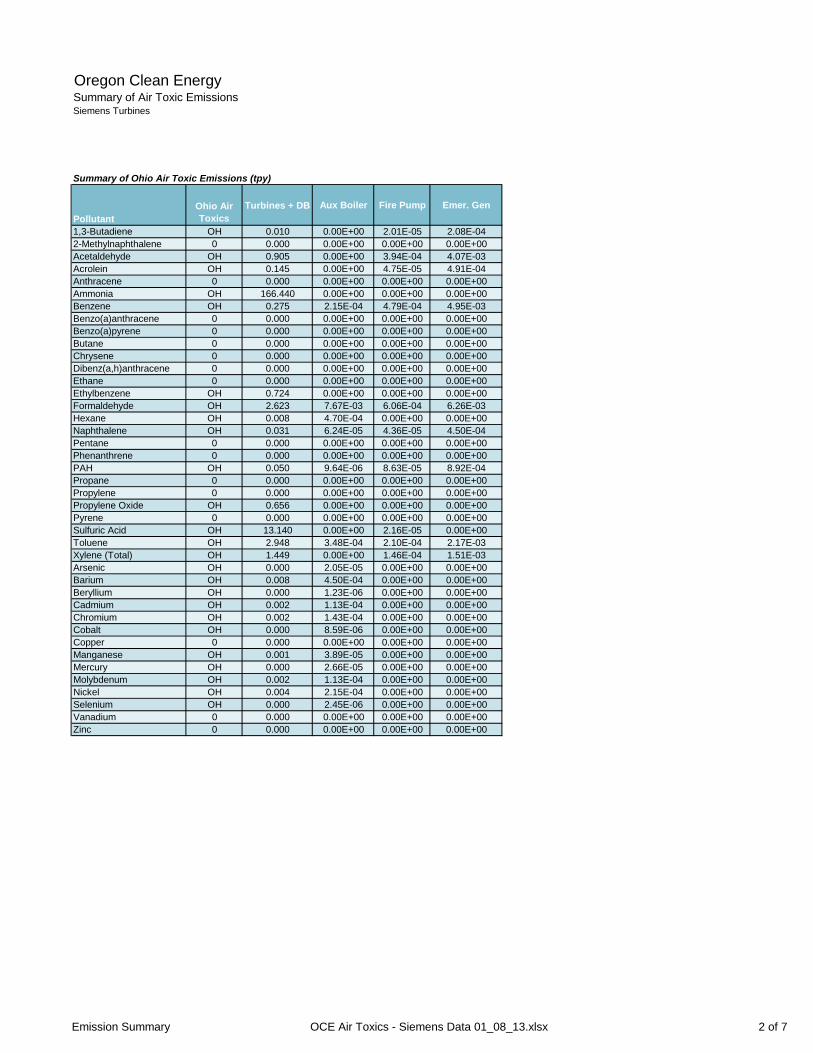
Emission Summary OCE Air Toxics - Siemens Data 01_08_13.xlsx 2 of 7
Oregon Clean EnergySummary of Air Toxic EmissionsSiemens Turbines
Summary of Ohio Air Toxic Emissions (tpy)
PollutantOhio Air Toxics
Turbines + DB Aux Boiler Fire Pump Emer. Gen
1,3-Butadiene OH 0.010 0.00E+00 2.01E-05 2.08E-042-Methylnaphthalene 0 0.000 0.00E+00 0.00E+00 0.00E+00Acetaldehyde OH 0.905 0.00E+00 3.94E-04 4.07E-03Acrolein OH 0.145 0.00E+00 4.75E-05 4.91E-04Anthracene 0 0.000 0.00E+00 0.00E+00 0.00E+00Ammonia OH 166.440 0.00E+00 0.00E+00 0.00E+00Benzene OH 0.275 2.15E-04 4.79E-04 4.95E-03Benzo(a)anthracene 0 0.000 0.00E+00 0.00E+00 0.00E+00Benzo(a)pyrene 0 0.000 0.00E+00 0.00E+00 0.00E+00Butane 0 0.000 0.00E+00 0.00E+00 0.00E+00Chrysene 0 0.000 0.00E+00 0.00E+00 0.00E+00Dibenz(a,h)anthracene 0 0.000 0.00E+00 0.00E+00 0.00E+00Ethane 0 0.000 0.00E+00 0.00E+00 0.00E+00Ethylbenzene OH 0.724 0.00E+00 0.00E+00 0.00E+00Formaldehyde OH 2.623 7.67E-03 6.06E-04 6.26E-03Hexane OH 0.008 4.70E-04 0.00E+00 0.00E+00Naphthalene OH 0.031 6.24E-05 4.36E-05 4.50E-04Pentane 0 0.000 0.00E+00 0.00E+00 0.00E+00Phenanthrene 0 0.000 0.00E+00 0.00E+00 0.00E+00PAH OH 0.050 9.64E-06 8.63E-05 8.92E-04Propane 0 0.000 0.00E+00 0.00E+00 0.00E+00Propylene 0 0.000 0.00E+00 0.00E+00 0.00E+00Propylene Oxide OH 0.656 0.00E+00 0.00E+00 0.00E+00Pyrene 0 0.000 0.00E+00 0.00E+00 0.00E+00Sulfuric Acid OH 13.140 0.00E+00 2.16E-05 0.00E+00Toluene OH 2.948 3.48E-04 2.10E-04 2.17E-03Xylene (Total) OH 1.449 0.00E+00 1.46E-04 1.51E-03Arsenic OH 0.000 2.05E-05 0.00E+00 0.00E+00Barium OH 0.008 4.50E-04 0.00E+00 0.00E+00Beryllium OH 0.000 1.23E-06 0.00E+00 0.00E+00Cadmium OH 0.002 1.13E-04 0.00E+00 0.00E+00Chromium OH 0.002 1.43E-04 0.00E+00 0.00E+00Cobalt OH 0.000 8.59E-06 0.00E+00 0.00E+00Copper 0 0.000 0.00E+00 0.00E+00 0.00E+00Manganese OH 0.001 3.89E-05 0.00E+00 0.00E+00Mercury OH 0.000 2.66E-05 0.00E+00 0.00E+00Molybdenum OH 0.002 1.13E-04 0.00E+00 0.00E+00Nickel OH 0.004 2.15E-04 0.00E+00 0.00E+00Selenium OH 0.000 2.45E-06 0.00E+00 0.00E+00Vanadium 0 0.000 0.00E+00 0.00E+00 0.00E+00Zinc 0 0.000 0.00E+00 0.00E+00 0.00E+00
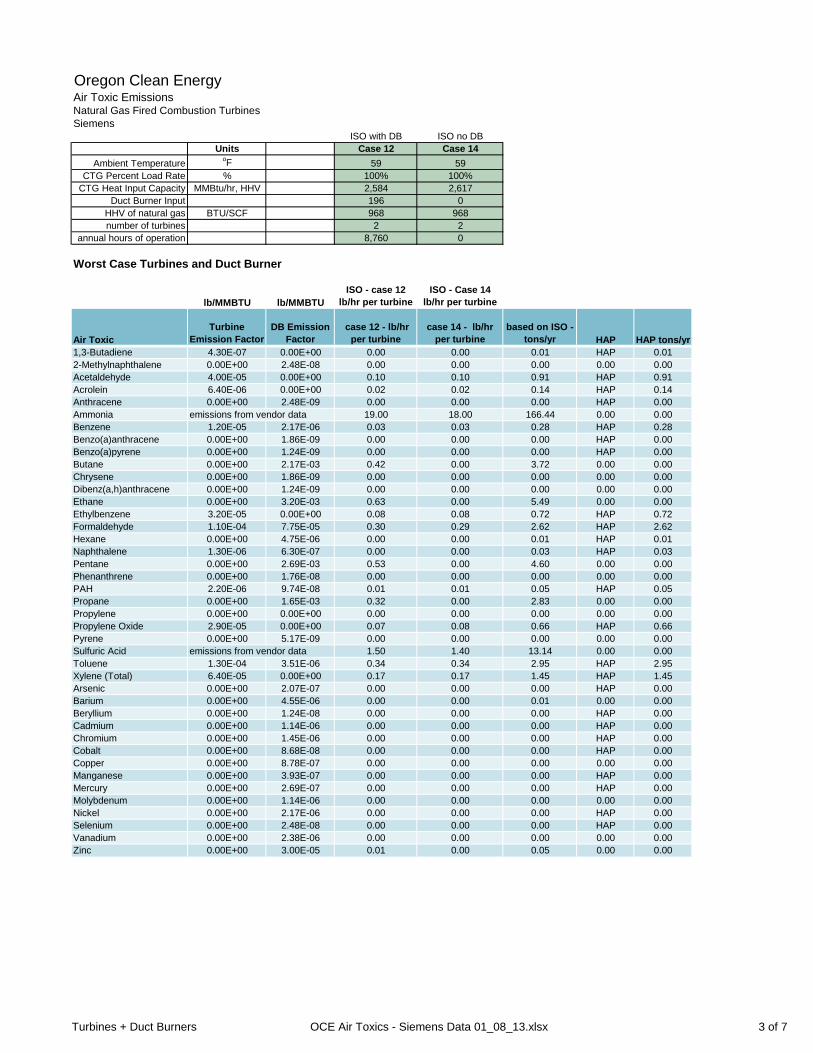
Turbines + Duct Burners OCE Air Toxics - Siemens Data 01_08_13.xlsx 3 of 7
Oregon Clean EnergyAir Toxic EmissionsNatural Gas Fired Combustion TurbinesSiemens
ISO with DB ISO no DBUnits Case 12 Case 14
Ambient Temperature oF 59 59CTG Percent Load Rate % 100% 100%
CTG Heat Input Capacity MMBtu/hr, HHV 2,584 2,617Duct Burner Input 196 0
HHV of natural gas BTU/SCF 968 968number of turbines 2 2
annual hours of operation 8,760 0
Worst Case Turbines and Duct Burner
lb/MMBTU lb/MMBTUISO - case 12
lb/hr per turbineISO - Case 14
lb/hr per turbine
Air ToxicTurbine
Emission FactorDB Emission
Factor case 12 - lb/hr
per turbinecase 14 - lb/hr
per turbinebased on ISO -
tons/yr HAP HAP tons/yr1,3-Butadiene 4.30E-07 0.00E+00 0.00 0.00 0.01 HAP 0.012-Methylnaphthalene 0.00E+00 2.48E-08 0.00 0.00 0.00 0.00 0.00Acetaldehyde 4.00E-05 0.00E+00 0.10 0.10 0.91 HAP 0.91Acrolein 6.40E-06 0.00E+00 0.02 0.02 0.14 HAP 0.14Anthracene 0.00E+00 2.48E-09 0.00 0.00 0.00 HAP 0.00Ammonia emissions from vendor data 19.00 18.00 166.44 0.00 0.00Benzene 1.20E-05 2.17E-06 0.03 0.03 0.28 HAP 0.28Benzo(a)anthracene 0.00E+00 1.86E-09 0.00 0.00 0.00 HAP 0.00Benzo(a)pyrene 0.00E+00 1.24E-09 0.00 0.00 0.00 HAP 0.00Butane 0.00E+00 2.17E-03 0.42 0.00 3.72 0.00 0.00Chrysene 0.00E+00 1.86E-09 0.00 0.00 0.00 0.00 0.00Dibenz(a,h)anthracene 0.00E+00 1.24E-09 0.00 0.00 0.00 0.00 0.00Ethane 0.00E+00 3.20E-03 0.63 0.00 5.49 0.00 0.00Ethylbenzene 3.20E-05 0.00E+00 0.08 0.08 0.72 HAP 0.72Formaldehyde 1.10E-04 7.75E-05 0.30 0.29 2.62 HAP 2.62Hexane 0.00E+00 4.75E-06 0.00 0.00 0.01 HAP 0.01Naphthalene 1.30E-06 6.30E-07 0.00 0.00 0.03 HAP 0.03Pentane 0.00E+00 2.69E-03 0.53 0.00 4.60 0.00 0.00Phenanthrene 0.00E+00 1.76E-08 0.00 0.00 0.00 0.00 0.00PAH 2.20E-06 9.74E-08 0.01 0.01 0.05 HAP 0.05Propane 0.00E+00 1.65E-03 0.32 0.00 2.83 0.00 0.00Propylene 0.00E+00 0.00E+00 0.00 0.00 0.00 0.00 0.00Propylene Oxide 2.90E-05 0.00E+00 0.07 0.08 0.66 HAP 0.66Pyrene 0.00E+00 5.17E-09 0.00 0.00 0.00 0.00 0.00Sulfuric Acid emissions from vendor data 1.50 1.40 13.14 0.00 0.00Toluene 1.30E-04 3.51E-06 0.34 0.34 2.95 HAP 2.95Xylene (Total) 6.40E-05 0.00E+00 0.17 0.17 1.45 HAP 1.45Arsenic 0.00E+00 2.07E-07 0.00 0.00 0.00 HAP 0.00Barium 0.00E+00 4.55E-06 0.00 0.00 0.01 0.00 0.00Beryllium 0.00E+00 1.24E-08 0.00 0.00 0.00 HAP 0.00Cadmium 0.00E+00 1.14E-06 0.00 0.00 0.00 HAP 0.00Chromium 0.00E+00 1.45E-06 0.00 0.00 0.00 HAP 0.00Cobalt 0.00E+00 8.68E-08 0.00 0.00 0.00 HAP 0.00Copper 0.00E+00 8.78E-07 0.00 0.00 0.00 0.00 0.00Manganese 0.00E+00 3.93E-07 0.00 0.00 0.00 HAP 0.00Mercury 0.00E+00 2.69E-07 0.00 0.00 0.00 HAP 0.00Molybdenum 0.00E+00 1.14E-06 0.00 0.00 0.00 0.00 0.00Nickel 0.00E+00 2.17E-06 0.00 0.00 0.00 HAP 0.00Selenium 0.00E+00 2.48E-08 0.00 0.00 0.00 HAP 0.00Vanadium 0.00E+00 2.38E-06 0.00 0.00 0.00 0.00 0.00Zinc 0.00E+00 3.00E-05 0.01 0.00 0.05 0.00 0.00
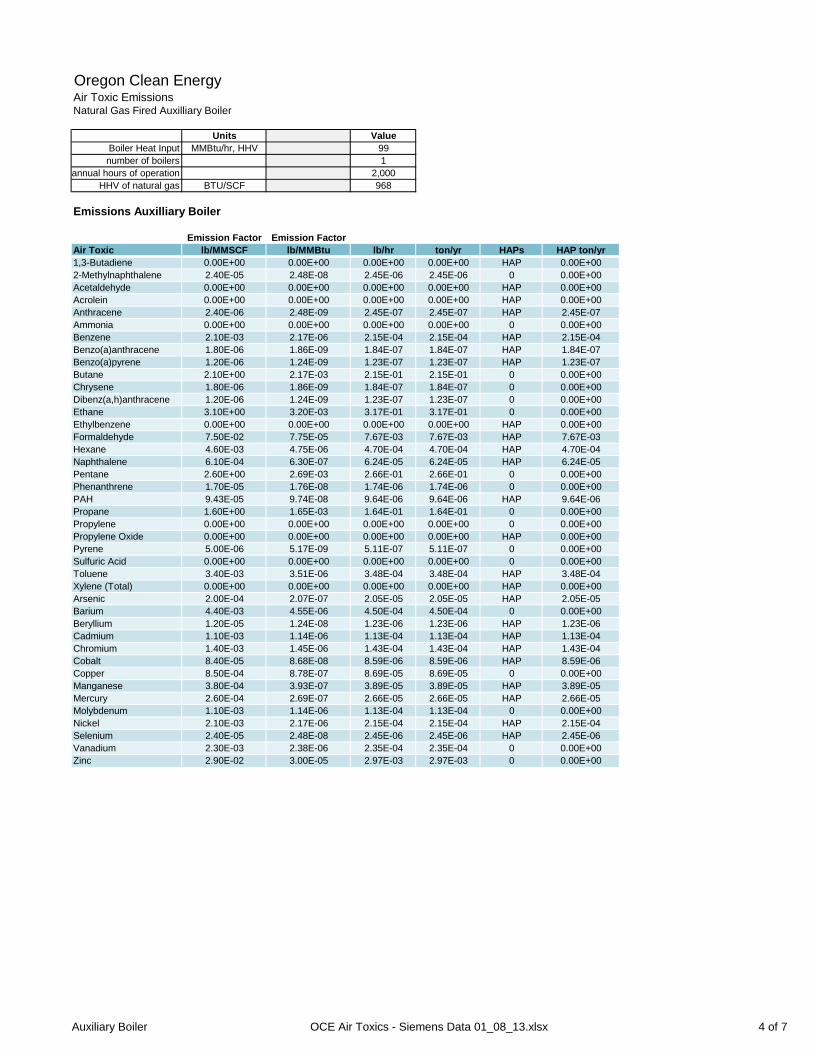
Auxiliary Boiler OCE Air Toxics - Siemens Data 01_08_13.xlsx 4 of 7
Oregon Clean EnergyAir Toxic EmissionsNatural Gas Fired Auxilliary Boiler
Units ValueBoiler Heat Input MMBtu/hr, HHV 99number of boilers 1
annual hours of operation 2,000HHV of natural gas BTU/SCF 968
Emissions Auxilliary Boiler
Emission Factor Emission FactorAir Toxic lb/MMSCF lb/MMBtu lb/hr ton/yr HAPs HAP ton/yr1,3-Butadiene 0.00E+00 0.00E+00 0.00E+00 0.00E+00 HAP 0.00E+002-Methylnaphthalene 2.40E-05 2.48E-08 2.45E-06 2.45E-06 0 0.00E+00Acetaldehyde 0.00E+00 0.00E+00 0.00E+00 0.00E+00 HAP 0.00E+00Acrolein 0.00E+00 0.00E+00 0.00E+00 0.00E+00 HAP 0.00E+00Anthracene 2.40E-06 2.48E-09 2.45E-07 2.45E-07 HAP 2.45E-07Ammonia 0.00E+00 0.00E+00 0.00E+00 0.00E+00 0 0.00E+00Benzene 2.10E-03 2.17E-06 2.15E-04 2.15E-04 HAP 2.15E-04Benzo(a)anthracene 1.80E-06 1.86E-09 1.84E-07 1.84E-07 HAP 1.84E-07Benzo(a)pyrene 1.20E-06 1.24E-09 1.23E-07 1.23E-07 HAP 1.23E-07Butane 2.10E+00 2.17E-03 2.15E-01 2.15E-01 0 0.00E+00Chrysene 1.80E-06 1.86E-09 1.84E-07 1.84E-07 0 0.00E+00Dibenz(a,h)anthracene 1.20E-06 1.24E-09 1.23E-07 1.23E-07 0 0.00E+00Ethane 3.10E+00 3.20E-03 3.17E-01 3.17E-01 0 0.00E+00Ethylbenzene 0.00E+00 0.00E+00 0.00E+00 0.00E+00 HAP 0.00E+00Formaldehyde 7.50E-02 7.75E-05 7.67E-03 7.67E-03 HAP 7.67E-03Hexane 4.60E-03 4.75E-06 4.70E-04 4.70E-04 HAP 4.70E-04Naphthalene 6.10E-04 6.30E-07 6.24E-05 6.24E-05 HAP 6.24E-05Pentane 2.60E+00 2.69E-03 2.66E-01 2.66E-01 0 0.00E+00Phenanthrene 1.70E-05 1.76E-08 1.74E-06 1.74E-06 0 0.00E+00PAH 9.43E-05 9.74E-08 9.64E-06 9.64E-06 HAP 9.64E-06Propane 1.60E+00 1.65E-03 1.64E-01 1.64E-01 0 0.00E+00Propylene 0.00E+00 0.00E+00 0.00E+00 0.00E+00 0 0.00E+00Propylene Oxide 0.00E+00 0.00E+00 0.00E+00 0.00E+00 HAP 0.00E+00Pyrene 5.00E-06 5.17E-09 5.11E-07 5.11E-07 0 0.00E+00Sulfuric Acid 0.00E+00 0.00E+00 0.00E+00 0.00E+00 0 0.00E+00Toluene 3.40E-03 3.51E-06 3.48E-04 3.48E-04 HAP 3.48E-04Xylene (Total) 0.00E+00 0.00E+00 0.00E+00 0.00E+00 HAP 0.00E+00Arsenic 2.00E-04 2.07E-07 2.05E-05 2.05E-05 HAP 2.05E-05Barium 4.40E-03 4.55E-06 4.50E-04 4.50E-04 0 0.00E+00Beryllium 1.20E-05 1.24E-08 1.23E-06 1.23E-06 HAP 1.23E-06Cadmium 1.10E-03 1.14E-06 1.13E-04 1.13E-04 HAP 1.13E-04Chromium 1.40E-03 1.45E-06 1.43E-04 1.43E-04 HAP 1.43E-04Cobalt 8.40E-05 8.68E-08 8.59E-06 8.59E-06 HAP 8.59E-06Copper 8.50E-04 8.78E-07 8.69E-05 8.69E-05 0 0.00E+00Manganese 3.80E-04 3.93E-07 3.89E-05 3.89E-05 HAP 3.89E-05Mercury 2.60E-04 2.69E-07 2.66E-05 2.66E-05 HAP 2.66E-05Molybdenum 1.10E-03 1.14E-06 1.13E-04 1.13E-04 0 0.00E+00Nickel 2.10E-03 2.17E-06 2.15E-04 2.15E-04 HAP 2.15E-04Selenium 2.40E-05 2.48E-08 2.45E-06 2.45E-06 HAP 2.45E-06Vanadium 2.30E-03 2.38E-06 2.35E-04 2.35E-04 0 0.00E+00Zinc 2.90E-02 3.00E-05 2.97E-03 2.97E-03 0 0.00E+00
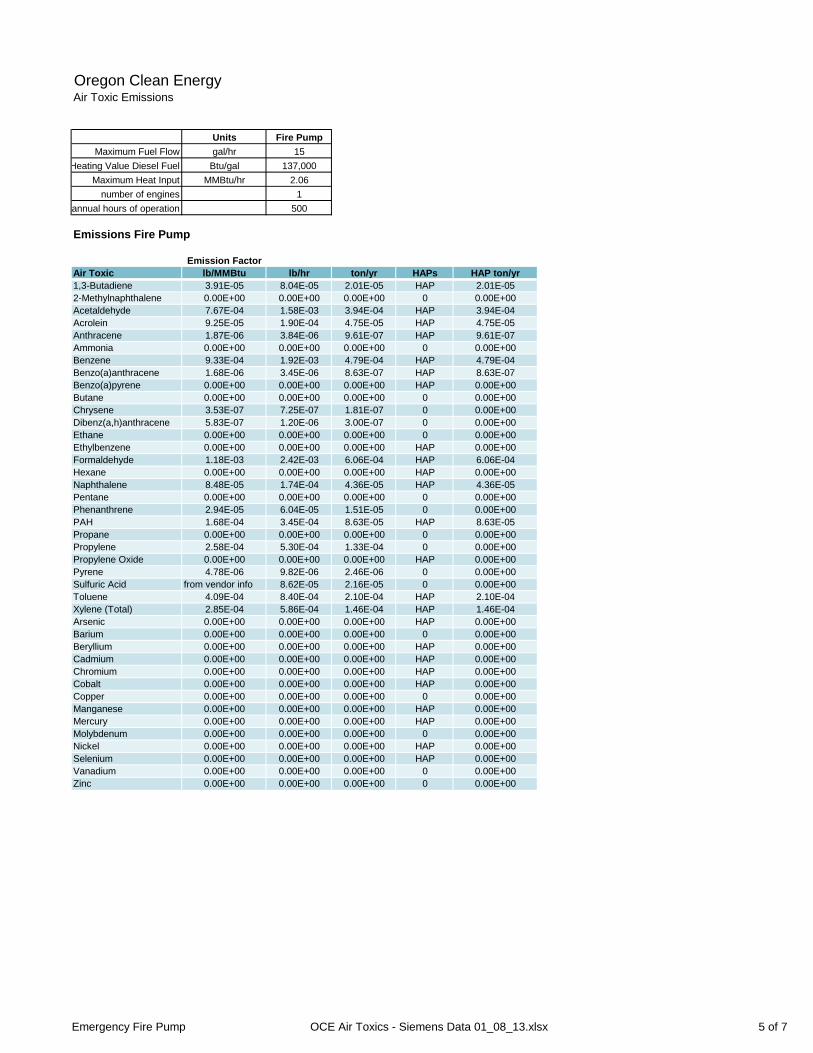
Emergency Fire Pump OCE Air Toxics - Siemens Data 01_08_13.xlsx 5 of 7
Oregon Clean EnergyAir Toxic Emissions
Units Fire PumpMaximum Fuel Flow gal/hr 15
Heating Value Diesel Fuel Btu/gal 137,000Maximum Heat Input MMBtu/hr 2.06
number of engines 1annual hours of operation 500
Emissions Fire Pump
Emission FactorAir Toxic lb/MMBtu lb/hr ton/yr HAPs HAP ton/yr1,3-Butadiene 3.91E-05 8.04E-05 2.01E-05 HAP 2.01E-052-Methylnaphthalene 0.00E+00 0.00E+00 0.00E+00 0 0.00E+00Acetaldehyde 7.67E-04 1.58E-03 3.94E-04 HAP 3.94E-04Acrolein 9.25E-05 1.90E-04 4.75E-05 HAP 4.75E-05Anthracene 1.87E-06 3.84E-06 9.61E-07 HAP 9.61E-07Ammonia 0.00E+00 0.00E+00 0.00E+00 0 0.00E+00Benzene 9.33E-04 1.92E-03 4.79E-04 HAP 4.79E-04Benzo(a)anthracene 1.68E-06 3.45E-06 8.63E-07 HAP 8.63E-07Benzo(a)pyrene 0.00E+00 0.00E+00 0.00E+00 HAP 0.00E+00Butane 0.00E+00 0.00E+00 0.00E+00 0 0.00E+00Chrysene 3.53E-07 7.25E-07 1.81E-07 0 0.00E+00Dibenz(a,h)anthracene 5.83E-07 1.20E-06 3.00E-07 0 0.00E+00Ethane 0.00E+00 0.00E+00 0.00E+00 0 0.00E+00Ethylbenzene 0.00E+00 0.00E+00 0.00E+00 HAP 0.00E+00Formaldehyde 1.18E-03 2.42E-03 6.06E-04 HAP 6.06E-04Hexane 0.00E+00 0.00E+00 0.00E+00 HAP 0.00E+00Naphthalene 8.48E-05 1.74E-04 4.36E-05 HAP 4.36E-05Pentane 0.00E+00 0.00E+00 0.00E+00 0 0.00E+00Phenanthrene 2.94E-05 6.04E-05 1.51E-05 0 0.00E+00PAH 1.68E-04 3.45E-04 8.63E-05 HAP 8.63E-05Propane 0.00E+00 0.00E+00 0.00E+00 0 0.00E+00Propylene 2.58E-04 5.30E-04 1.33E-04 0 0.00E+00Propylene Oxide 0.00E+00 0.00E+00 0.00E+00 HAP 0.00E+00Pyrene 4.78E-06 9.82E-06 2.46E-06 0 0.00E+00Sulfuric Acid from vendor info 8.62E-05 2.16E-05 0 0.00E+00Toluene 4.09E-04 8.40E-04 2.10E-04 HAP 2.10E-04Xylene (Total) 2.85E-04 5.86E-04 1.46E-04 HAP 1.46E-04Arsenic 0.00E+00 0.00E+00 0.00E+00 HAP 0.00E+00Barium 0.00E+00 0.00E+00 0.00E+00 0 0.00E+00Beryllium 0.00E+00 0.00E+00 0.00E+00 HAP 0.00E+00Cadmium 0.00E+00 0.00E+00 0.00E+00 HAP 0.00E+00Chromium 0.00E+00 0.00E+00 0.00E+00 HAP 0.00E+00Cobalt 0.00E+00 0.00E+00 0.00E+00 HAP 0.00E+00Copper 0.00E+00 0.00E+00 0.00E+00 0 0.00E+00Manganese 0.00E+00 0.00E+00 0.00E+00 HAP 0.00E+00Mercury 0.00E+00 0.00E+00 0.00E+00 HAP 0.00E+00Molybdenum 0.00E+00 0.00E+00 0.00E+00 0 0.00E+00Nickel 0.00E+00 0.00E+00 0.00E+00 HAP 0.00E+00Selenium 0.00E+00 0.00E+00 0.00E+00 HAP 0.00E+00Vanadium 0.00E+00 0.00E+00 0.00E+00 0 0.00E+00Zinc 0.00E+00 0.00E+00 0.00E+00 0 0.00E+00
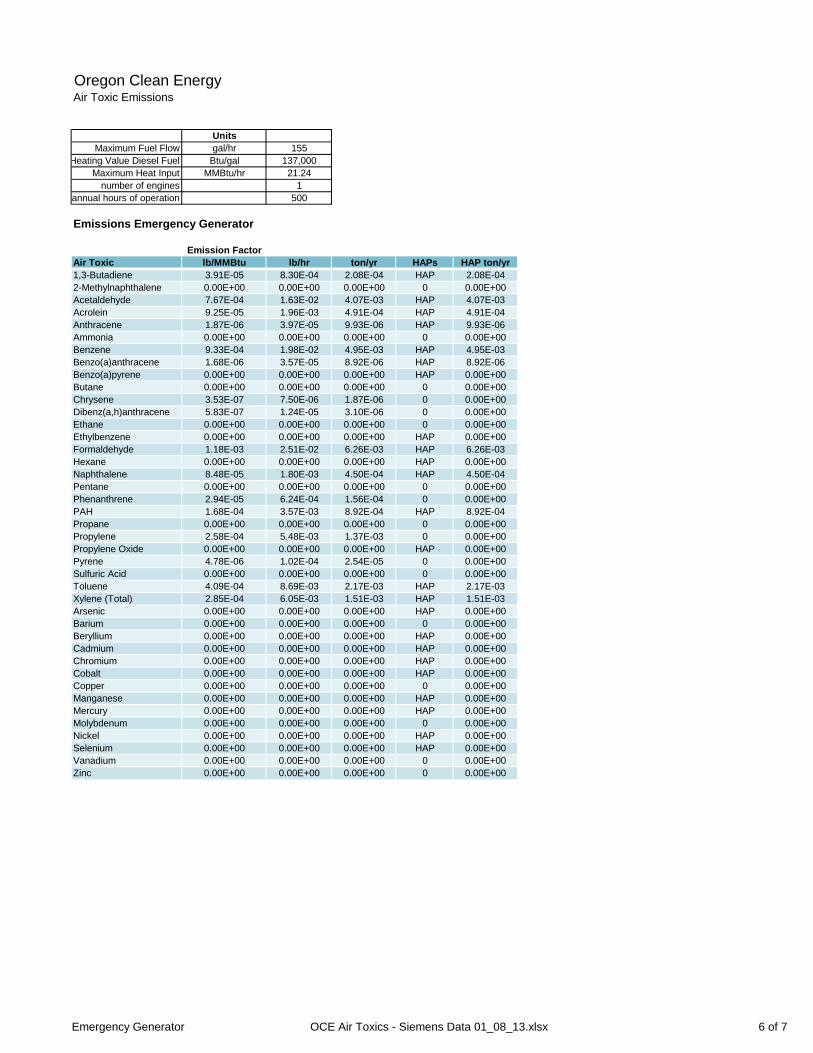
Emergency Generator OCE Air Toxics - Siemens Data 01_08_13.xlsx 6 of 7
Oregon Clean EnergyAir Toxic Emissions
UnitsMaximum Fuel Flow gal/hr 155
Heating Value Diesel Fuel Btu/gal 137,000Maximum Heat Input MMBtu/hr 21.24
number of engines 1annual hours of operation 500
Emissions Emergency Generator
Emission FactorAir Toxic lb/MMBtu lb/hr ton/yr HAPs HAP ton/yr1,3-Butadiene 3.91E-05 8.30E-04 2.08E-04 HAP 2.08E-042-Methylnaphthalene 0.00E+00 0.00E+00 0.00E+00 0 0.00E+00Acetaldehyde 7.67E-04 1.63E-02 4.07E-03 HAP 4.07E-03Acrolein 9.25E-05 1.96E-03 4.91E-04 HAP 4.91E-04Anthracene 1.87E-06 3.97E-05 9.93E-06 HAP 9.93E-06Ammonia 0.00E+00 0.00E+00 0.00E+00 0 0.00E+00Benzene 9.33E-04 1.98E-02 4.95E-03 HAP 4.95E-03Benzo(a)anthracene 1.68E-06 3.57E-05 8.92E-06 HAP 8.92E-06Benzo(a)pyrene 0.00E+00 0.00E+00 0.00E+00 HAP 0.00E+00Butane 0.00E+00 0.00E+00 0.00E+00 0 0.00E+00Chrysene 3.53E-07 7.50E-06 1.87E-06 0 0.00E+00Dibenz(a,h)anthracene 5.83E-07 1.24E-05 3.10E-06 0 0.00E+00Ethane 0.00E+00 0.00E+00 0.00E+00 0 0.00E+00Ethylbenzene 0.00E+00 0.00E+00 0.00E+00 HAP 0.00E+00Formaldehyde 1.18E-03 2.51E-02 6.26E-03 HAP 6.26E-03Hexane 0.00E+00 0.00E+00 0.00E+00 HAP 0.00E+00Naphthalene 8.48E-05 1.80E-03 4.50E-04 HAP 4.50E-04Pentane 0.00E+00 0.00E+00 0.00E+00 0 0.00E+00Phenanthrene 2.94E-05 6.24E-04 1.56E-04 0 0.00E+00PAH 1.68E-04 3.57E-03 8.92E-04 HAP 8.92E-04Propane 0.00E+00 0.00E+00 0.00E+00 0 0.00E+00Propylene 2.58E-04 5.48E-03 1.37E-03 0 0.00E+00Propylene Oxide 0.00E+00 0.00E+00 0.00E+00 HAP 0.00E+00Pyrene 4.78E-06 1.02E-04 2.54E-05 0 0.00E+00Sulfuric Acid 0.00E+00 0.00E+00 0.00E+00 0 0.00E+00Toluene 4.09E-04 8.69E-03 2.17E-03 HAP 2.17E-03Xylene (Total) 2.85E-04 6.05E-03 1.51E-03 HAP 1.51E-03Arsenic 0.00E+00 0.00E+00 0.00E+00 HAP 0.00E+00Barium 0.00E+00 0.00E+00 0.00E+00 0 0.00E+00Beryllium 0.00E+00 0.00E+00 0.00E+00 HAP 0.00E+00Cadmium 0.00E+00 0.00E+00 0.00E+00 HAP 0.00E+00Chromium 0.00E+00 0.00E+00 0.00E+00 HAP 0.00E+00Cobalt 0.00E+00 0.00E+00 0.00E+00 HAP 0.00E+00Copper 0.00E+00 0.00E+00 0.00E+00 0 0.00E+00Manganese 0.00E+00 0.00E+00 0.00E+00 HAP 0.00E+00Mercury 0.00E+00 0.00E+00 0.00E+00 HAP 0.00E+00Molybdenum 0.00E+00 0.00E+00 0.00E+00 0 0.00E+00Nickel 0.00E+00 0.00E+00 0.00E+00 HAP 0.00E+00Selenium 0.00E+00 0.00E+00 0.00E+00 HAP 0.00E+00Vanadium 0.00E+00 0.00E+00 0.00E+00 0 0.00E+00Zinc 0.00E+00 0.00E+00 0.00E+00 0 0.00E+00
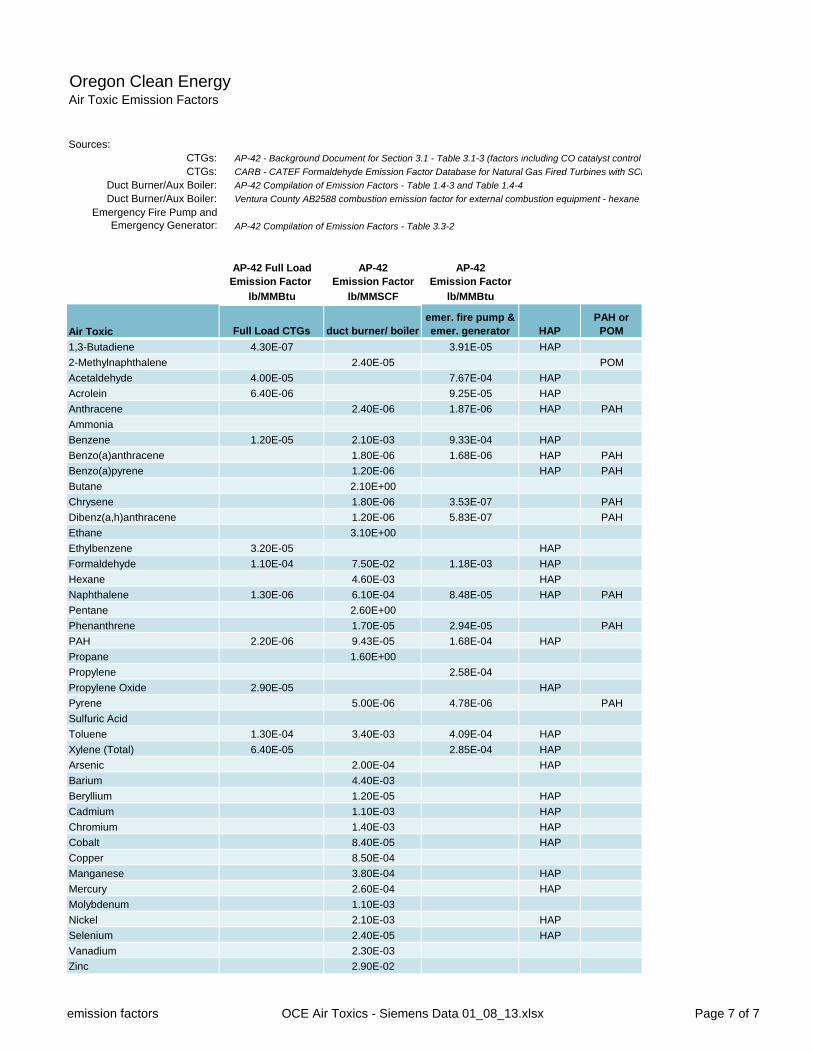
emission factors OCE Air Toxics - Siemens Data 01_08_13.xlsx Page 7 of 7
Oregon Clean EnergyAir Toxic Emission Factors
Sources:CTGs: AP-42 - Background Document for Section 3.1 - Table 3.1-3 (factors including CO catalyst control CTGs: CARB - CATEF Formaldehyde Emission Factor Database for Natural Gas Fired Turbines with SCR
Duct Burner/Aux Boiler: AP-42 Compilation of Emission Factors - Table 1.4-3 and Table 1.4-4Duct Burner/Aux Boiler: Ventura County AB2588 combustion emission factor for external combustion equipment - hexane
Emergency Fire Pump and Emergency Generator: AP-42 Compilation of Emission Factors - Table 3.3-2
AP-42 Full Load AP-42 AP-42Emission Factor Emission Factor Emission Factor
lb/MMBtu lb/MMSCF lb/MMBtu
Air Toxic Full Load CTGs duct burner/ boileremer. fire pump & emer. generator HAP
PAH or POM
1,3-Butadiene 4.30E-07 3.91E-05 HAP2-Methylnaphthalene 2.40E-05 POMAcetaldehyde 4.00E-05 7.67E-04 HAPAcrolein 6.40E-06 9.25E-05 HAPAnthracene 2.40E-06 1.87E-06 HAP PAHAmmoniaBenzene 1.20E-05 2.10E-03 9.33E-04 HAPBenzo(a)anthracene 1.80E-06 1.68E-06 HAP PAHBenzo(a)pyrene 1.20E-06 HAP PAHButane 2.10E+00Chrysene 1.80E-06 3.53E-07 PAHDibenz(a,h)anthracene 1.20E-06 5.83E-07 PAHEthane 3.10E+00Ethylbenzene 3.20E-05 HAPFormaldehyde 1.10E-04 7.50E-02 1.18E-03 HAPHexane 4.60E-03 HAPNaphthalene 1.30E-06 6.10E-04 8.48E-05 HAP PAHPentane 2.60E+00Phenanthrene 1.70E-05 2.94E-05 PAHPAH 2.20E-06 9.43E-05 1.68E-04 HAPPropane 1.60E+00Propylene 2.58E-04Propylene Oxide 2.90E-05 HAPPyrene 5.00E-06 4.78E-06 PAHSulfuric AcidToluene 1.30E-04 3.40E-03 4.09E-04 HAPXylene (Total) 6.40E-05 2.85E-04 HAPArsenic 2.00E-04 HAPBarium 4.40E-03Beryllium 1.20E-05 HAPCadmium 1.10E-03 HAPChromium 1.40E-03 HAPCobalt 8.40E-05 HAPCopper 8.50E-04Manganese 3.80E-04 HAPMercury 2.60E-04 HAPMolybdenum 1.10E-03Nickel 2.10E-03 HAPSelenium 2.40E-05 HAPVanadium 2.30E-03Zinc 2.90E-02

Dispersion Modeling Report Oregon Clean Energy Center
Lucas County, OH Siemens Turbines, Volume 2
Appendix B: Modeling Results
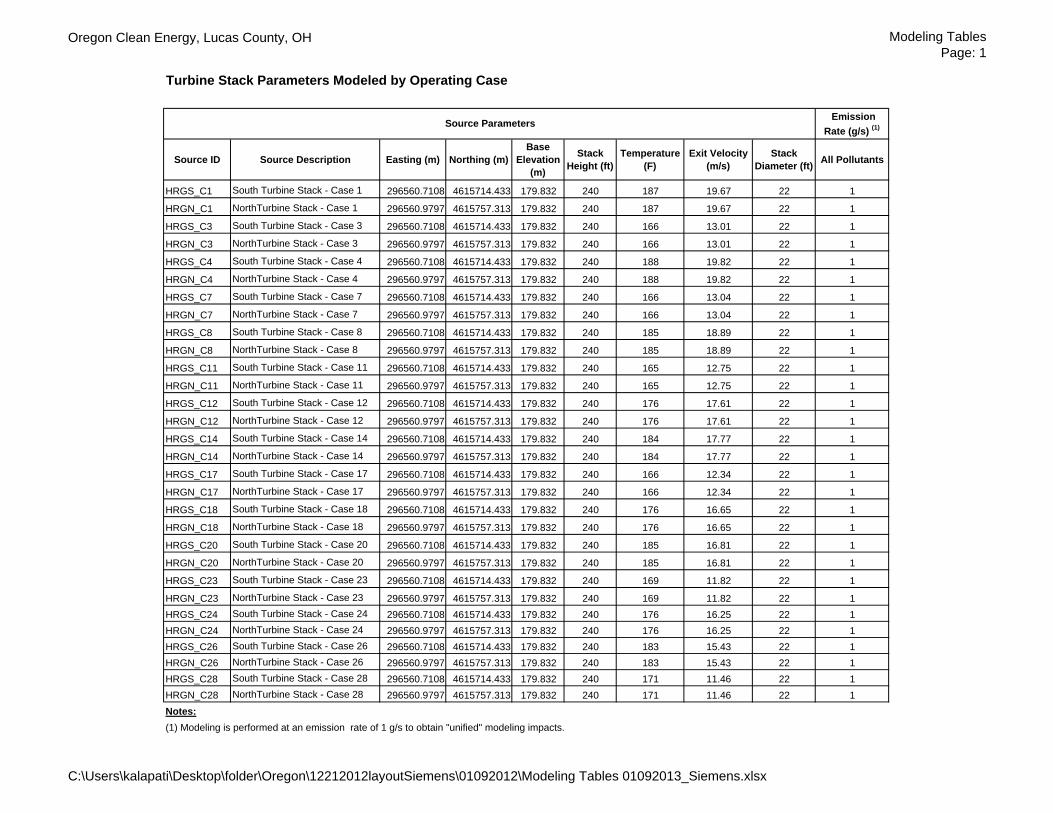
Oregon Clean Energy, Lucas County, OH Modeling Tables Page: 1
Turbine Stack Parameters Modeled by Operating Case
Emission Rate (g/s) (1)
Source ID Source Description Easting (m) Northing (m)Base
Elevation (m)
Stack Height (ft)
Temperature (F)
Exit Velocity (m/s)
Stack Diameter (ft) All Pollutants
HRGS_C1 South Turbine Stack - Case 1 296560.7108 4615714.433 179.832 240 187 19.67 22 1
HRGN_C1 NorthTurbine Stack - Case 1 296560.9797 4615757.313 179.832 240 187 19.67 22 1
HRGS_C3 South Turbine Stack - Case 3 296560.7108 4615714.433 179.832 240 166 13.01 22 1
HRGN_C3 NorthTurbine Stack - Case 3 296560.9797 4615757.313 179.832 240 166 13.01 22 1
HRGS_C4 South Turbine Stack - Case 4 296560.7108 4615714.433 179.832 240 188 19.82 22 1
HRGN_C4 NorthTurbine Stack - Case 4 296560.9797 4615757.313 179.832 240 188 19.82 22 1
HRGS_C7 South Turbine Stack - Case 7 296560.7108 4615714.433 179.832 240 166 13.04 22 1
HRGN_C7 NorthTurbine Stack - Case 7 296560.9797 4615757.313 179.832 240 166 13.04 22 1
HRGS_C8 South Turbine Stack - Case 8 296560.7108 4615714.433 179.832 240 185 18.89 22 1
HRGN_C8 NorthTurbine Stack - Case 8 296560.9797 4615757.313 179.832 240 185 18.89 22 1
HRGS_C11 South Turbine Stack - Case 11 296560.7108 4615714.433 179.832 240 165 12.75 22 1
HRGN_C11 NorthTurbine Stack - Case 11 296560.9797 4615757.313 179.832 240 165 12.75 22 1
HRGS_C12 South Turbine Stack - Case 12 296560.7108 4615714.433 179.832 240 176 17.61 22 1
HRGN_C12 NorthTurbine Stack - Case 12 296560.9797 4615757.313 179.832 240 176 17.61 22 1
HRGS_C14 South Turbine Stack - Case 14 296560.7108 4615714.433 179.832 240 184 17.77 22 1
HRGN_C14 NorthTurbine Stack - Case 14 296560.9797 4615757.313 179.832 240 184 17.77 22 1
HRGS_C17 South Turbine Stack - Case 17 296560.7108 4615714.433 179.832 240 166 12.34 22 1
HRGN_C17 NorthTurbine Stack - Case 17 296560.9797 4615757.313 179.832 240 166 12.34 22 1
HRGS_C18 South Turbine Stack - Case 18 296560.7108 4615714.433 179.832 240 176 16.65 22 1
HRGN_C18 NorthTurbine Stack - Case 18 296560.9797 4615757.313 179.832 240 176 16.65 22 1
HRGS_C20 South Turbine Stack - Case 20 296560.7108 4615714.433 179.832 240 185 16.81 22 1
HRGN_C20 NorthTurbine Stack - Case 20 296560.9797 4615757.313 179.832 240 185 16.81 22 1
HRGS_C23 South Turbine Stack - Case 23 296560.7108 4615714.433 179.832 240 169 11.82 22 1
HRGN_C23 NorthTurbine Stack - Case 23 296560.9797 4615757.313 179.832 240 169 11.82 22 1HRGS_C24 South Turbine Stack - Case 24 296560.7108 4615714.433 179.832 240 176 16.25 22 1HRGN_C24 NorthTurbine Stack - Case 24 296560.9797 4615757.313 179.832 240 176 16.25 22 1HRGS_C26 South Turbine Stack - Case 26 296560.7108 4615714.433 179.832 240 183 15.43 22 1HRGN_C26 NorthTurbine Stack - Case 26 296560.9797 4615757.313 179.832 240 183 15.43 22 1HRGS_C28 South Turbine Stack - Case 28 296560.7108 4615714.433 179.832 240 171 11.46 22 1HRGN_C28 NorthTurbine Stack - Case 28 296560.9797 4615757.313 179.832 240 171 11.46 22 1Notes:(1) Modeling is performed at an emission rate of 1 g/s to obtain "unified" modeling impacts.
Source Parameters
C:\Users\kalapati\Desktop\folder\Oregon\12212012layoutSiemens\01092012\Modeling Tables 01092013_Siemens.xlsx
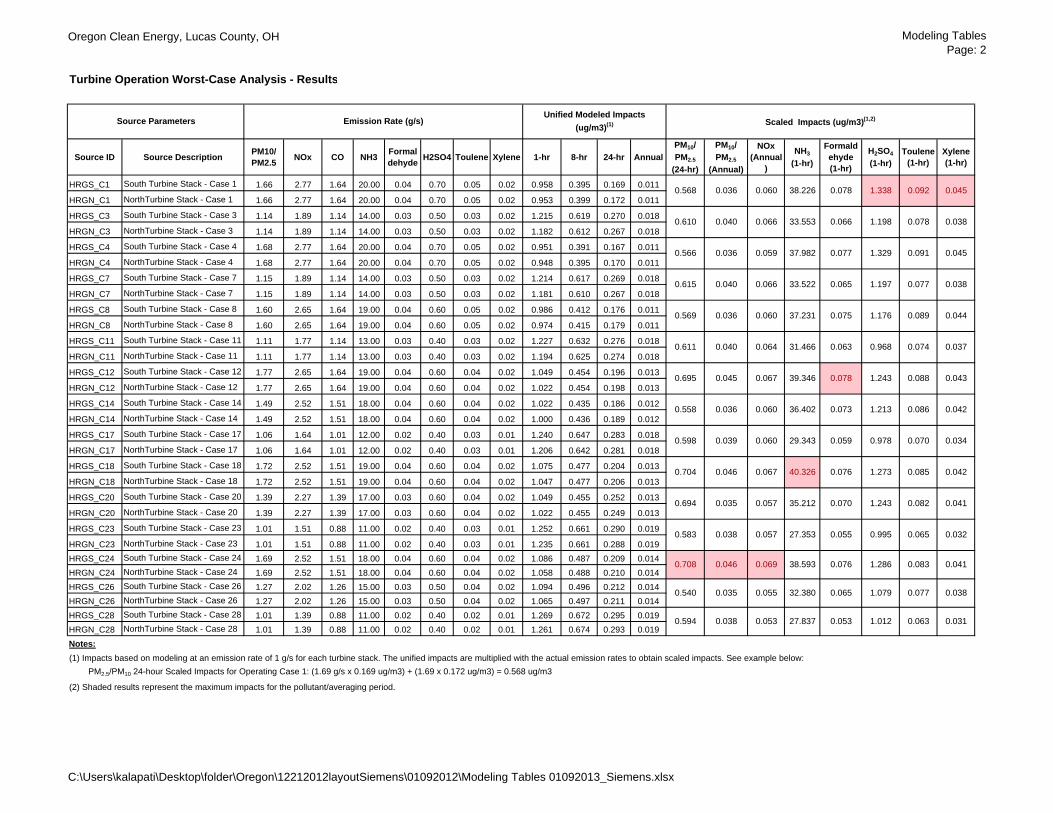
Oregon Clean Energy, Lucas County, OH Modeling Tables Page: 2
Turbine Operation Worst-Case Analysis - Results
Source ID Source Description PM10/ PM2.5 NOx CO NH3 Formal
dehyde H2SO4 Toulene Xylene 1-hr 8-hr 24-hr AnnualPM10/ PM2.5
(24-hr)
PM10/ PM2.5
(Annual)
NOx (Annual
)
NH3
(1-hr)
Formaldehyde (1-hr)
H2SO4
(1-hr)Toulene
(1-hr)Xylene (1-hr)
HRGS_C1 South Turbine Stack - Case 1 1.66 2.77 1.64 20.00 0.04 0.70 0.05 0.02 0.958 0.395 0.169 0.011
HRGN_C1 NorthTurbine Stack - Case 1 1.66 2.77 1.64 20.00 0.04 0.70 0.05 0.02 0.953 0.399 0.172 0.011
HRGS_C3 South Turbine Stack - Case 3 1.14 1.89 1.14 14.00 0.03 0.50 0.03 0.02 1.215 0.619 0.270 0.018
HRGN_C3 NorthTurbine Stack - Case 3 1.14 1.89 1.14 14.00 0.03 0.50 0.03 0.02 1.182 0.612 0.267 0.018
HRGS_C4 South Turbine Stack - Case 4 1.68 2.77 1.64 20.00 0.04 0.70 0.05 0.02 0.951 0.391 0.167 0.011
HRGN_C4 NorthTurbine Stack - Case 4 1.68 2.77 1.64 20.00 0.04 0.70 0.05 0.02 0.948 0.395 0.170 0.011
HRGS_C7 South Turbine Stack - Case 7 1.15 1.89 1.14 14.00 0.03 0.50 0.03 0.02 1.214 0.617 0.269 0.018
HRGN_C7 NorthTurbine Stack - Case 7 1.15 1.89 1.14 14.00 0.03 0.50 0.03 0.02 1.181 0.610 0.267 0.018
HRGS_C8 South Turbine Stack - Case 8 1.60 2.65 1.64 19.00 0.04 0.60 0.05 0.02 0.986 0.412 0.176 0.011
HRGN_C8 NorthTurbine Stack - Case 8 1.60 2.65 1.64 19.00 0.04 0.60 0.05 0.02 0.974 0.415 0.179 0.011
HRGS_C11 South Turbine Stack - Case 11 1.11 1.77 1.14 13.00 0.03 0.40 0.03 0.02 1.227 0.632 0.276 0.018
HRGN_C11 NorthTurbine Stack - Case 11 1.11 1.77 1.14 13.00 0.03 0.40 0.03 0.02 1.194 0.625 0.274 0.018
HRGS_C12 South Turbine Stack - Case 12 1.77 2.65 1.64 19.00 0.04 0.60 0.04 0.02 1.049 0.454 0.196 0.013
HRGN_C12 NorthTurbine Stack - Case 12 1.77 2.65 1.64 19.00 0.04 0.60 0.04 0.02 1.022 0.454 0.198 0.013
HRGS_C14 South Turbine Stack - Case 14 1.49 2.52 1.51 18.00 0.04 0.60 0.04 0.02 1.022 0.435 0.186 0.012
HRGN_C14 NorthTurbine Stack - Case 14 1.49 2.52 1.51 18.00 0.04 0.60 0.04 0.02 1.000 0.436 0.189 0.012
HRGS_C17 South Turbine Stack - Case 17 1.06 1.64 1.01 12.00 0.02 0.40 0.03 0.01 1.240 0.647 0.283 0.018
HRGN_C17 NorthTurbine Stack - Case 17 1.06 1.64 1.01 12.00 0.02 0.40 0.03 0.01 1.206 0.642 0.281 0.018
HRGS_C18 South Turbine Stack - Case 18 1.72 2.52 1.51 19.00 0.04 0.60 0.04 0.02 1.075 0.477 0.204 0.013
HRGN_C18 NorthTurbine Stack - Case 18 1.72 2.52 1.51 19.00 0.04 0.60 0.04 0.02 1.047 0.477 0.206 0.013
HRGS_C20 South Turbine Stack - Case 20 1.39 2.27 1.39 17.00 0.03 0.60 0.04 0.02 1.049 0.455 0.252 0.013
HRGN_C20 NorthTurbine Stack - Case 20 1.39 2.27 1.39 17.00 0.03 0.60 0.04 0.02 1.022 0.455 0.249 0.013
HRGS_C23 South Turbine Stack - Case 23 1.01 1.51 0.88 11.00 0.02 0.40 0.03 0.01 1.252 0.661 0.290 0.019
HRGN_C23 NorthTurbine Stack - Case 23 1.01 1.51 0.88 11.00 0.02 0.40 0.03 0.01 1.235 0.661 0.288 0.019HRGS_C24 South Turbine Stack - Case 24 1.69 2.52 1.51 18.00 0.04 0.60 0.04 0.02 1.086 0.487 0.209 0.014HRGN_C24 NorthTurbine Stack - Case 24 1.69 2.52 1.51 18.00 0.04 0.60 0.04 0.02 1.058 0.488 0.210 0.014HRGS_C26 South Turbine Stack - Case 26 1.27 2.02 1.26 15.00 0.03 0.50 0.04 0.02 1.094 0.496 0.212 0.014HRGN_C26 NorthTurbine Stack - Case 26 1.27 2.02 1.26 15.00 0.03 0.50 0.04 0.02 1.065 0.497 0.211 0.014HRGS_C28 South Turbine Stack - Case 28 1.01 1.39 0.88 11.00 0.02 0.40 0.02 0.01 1.269 0.672 0.295 0.019HRGN_C28 NorthTurbine Stack - Case 28 1.01 1.39 0.88 11.00 0.02 0.40 0.02 0.01 1.261 0.674 0.293 0.019Notes:(1) Impacts based on modeling at an emission rate of 1 g/s for each turbine stack. The unified impacts are multiplied with the actual emission rates to obtain scaled impacts. See example below:
PM2.5/PM10 24-hour Scaled Impacts for Operating Case 1: (1.69 g/s x 0.169 ug/m3) + (1.69 x 0.172 ug/m3) = 0.568 ug/m3
(2) Shaded results represent the maximum impacts for the pollutant/averaging period.
0.610 0.040 0.066
Source Parameters Emission Rate (g/s)Unified Modeled Impacts
(ug/m3)(1) Scaled Impacts (ug/m3)(1,2)
0.568 0.036 0.060
33.553 0.066 1.198 0.078 0.038
38.226 0.078 1.338 0.092 0.045
0.615 0.040 0.066
0.566 0.036 0.059
33.522 0.065 1.197 0.077 0.038
37.982 0.077 1.329 0.091 0.045
0.611 0.040 0.064
0.569 0.036 0.060
31.466 0.063 0.968 0.074 0.037
37.231 0.075 1.176 0.089 0.044
0.558 0.036 0.060
0.695 0.045 0.067
36.402 0.073 1.213 0.086 0.042
39.346 0.078 1.243 0.088 0.043
0.704 0.046 0.067
0.598 0.039 0.060
40.326 0.076 1.273 0.085 0.042
29.343 0.059 0.978 0.070 0.034
0.583 0.038 0.057
0.694 0.035 0.057
27.353 0.055 0.995 0.065 0.032
35.212 0.070 1.243 0.082 0.041
0.540 0.035 0.055
0.708 0.046 0.069
32.380 0.065 1.079 0.077 0.038
38.593 0.076 1.286 0.083 0.041
27.837 0.053 1.012 0.063 0.0310.594 0.038 0.053
C:\Users\kalapati\Desktop\folder\Oregon\12212012layoutSiemens\01092012\Modeling Tables 01092013_Siemens.xlsx
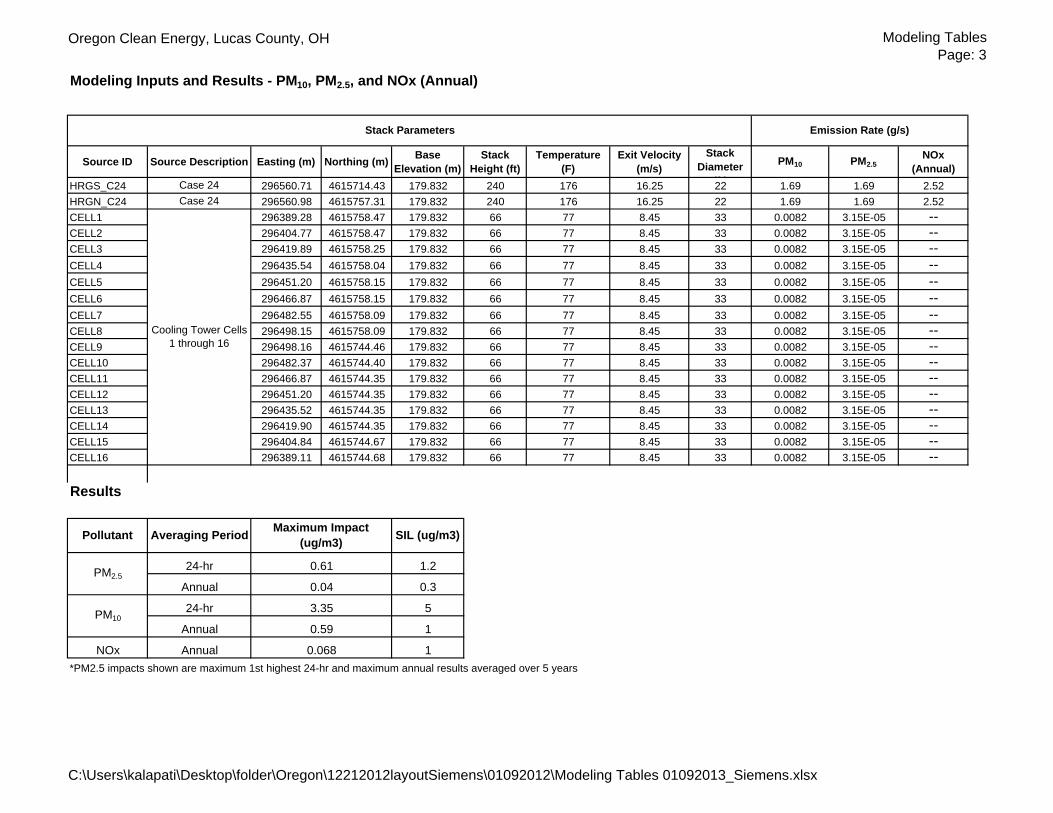
Oregon Clean Energy, Lucas County, OH Modeling Tables Page: 3
Modeling Inputs and Results - PM10, PM2.5, and NOx (Annual)
Source ID Source Description Easting (m) Northing (m) Base Elevation (m)
Stack Height (ft)
Temperature (F)
Exit Velocity (m/s)
Stack Diameter
(ft)
PM10 PM2.5NOx
(Annual)HRGS_C24 Case 24 296560.71 4615714.43 179.832 240 176 16.25 22 1.69 1.69 2.52HRGN_C24 Case 24 296560.98 4615757.31 179.832 240 176 16.25 22 1.69 1.69 2.52CELL1 296389.28 4615758.47 179.832 66 77 8.45 33 0.0082 3.15E-05 --CELL2 296404.77 4615758.47 179.832 66 77 8.45 33 0.0082 3.15E-05 --CELL3 296419.89 4615758.25 179.832 66 77 8.45 33 0.0082 3.15E-05 --CELL4 296435.54 4615758.04 179.832 66 77 8.45 33 0.0082 3.15E-05 --CELL5 296451.20 4615758.15 179.832 66 77 8.45 33 0.0082 3.15E-05 --CELL6 296466.87 4615758.15 179.832 66 77 8.45 33 0.0082 3.15E-05 --CELL7 296482.55 4615758.09 179.832 66 77 8.45 33 0.0082 3.15E-05 --CELL8 296498.15 4615758.09 179.832 66 77 8.45 33 0.0082 3.15E-05 --CELL9 296498.16 4615744.46 179.832 66 77 8.45 33 0.0082 3.15E-05 --CELL10 296482.37 4615744.40 179.832 66 77 8.45 33 0.0082 3.15E-05 --CELL11 296466.87 4615744.35 179.832 66 77 8.45 33 0.0082 3.15E-05 --CELL12 296451.20 4615744.35 179.832 66 77 8.45 33 0.0082 3.15E-05 --CELL13 296435.52 4615744.35 179.832 66 77 8.45 33 0.0082 3.15E-05 --CELL14 296419.90 4615744.35 179.832 66 77 8.45 33 0.0082 3.15E-05 --CELL15 296404.84 4615744.67 179.832 66 77 8.45 33 0.0082 3.15E-05 --CELL16 296389.11 4615744.68 179.832 66 77 8.45 33 0.0082 3.15E-05 --
Results
24-hr 1.2
Annual 0.3
24-hr 5
Annual 1
NOx Annual 1
Emission Rate (g/s)
PM2.50.61
0.04
*PM2.5 impacts shown are maximum 1st highest 24-hr and maximum annual results averaged over 5 years
PM103.35
0.59
0.068
Stack Parameters
Cooling Tower Cells 1 through 16
Pollutant Averaging Period Maximum Impact (ug/m3) SIL (ug/m3)
C:\Users\kalapati\Desktop\folder\Oregon\12212012layoutSiemens\01092012\Modeling Tables 01092013_Siemens.xlsx
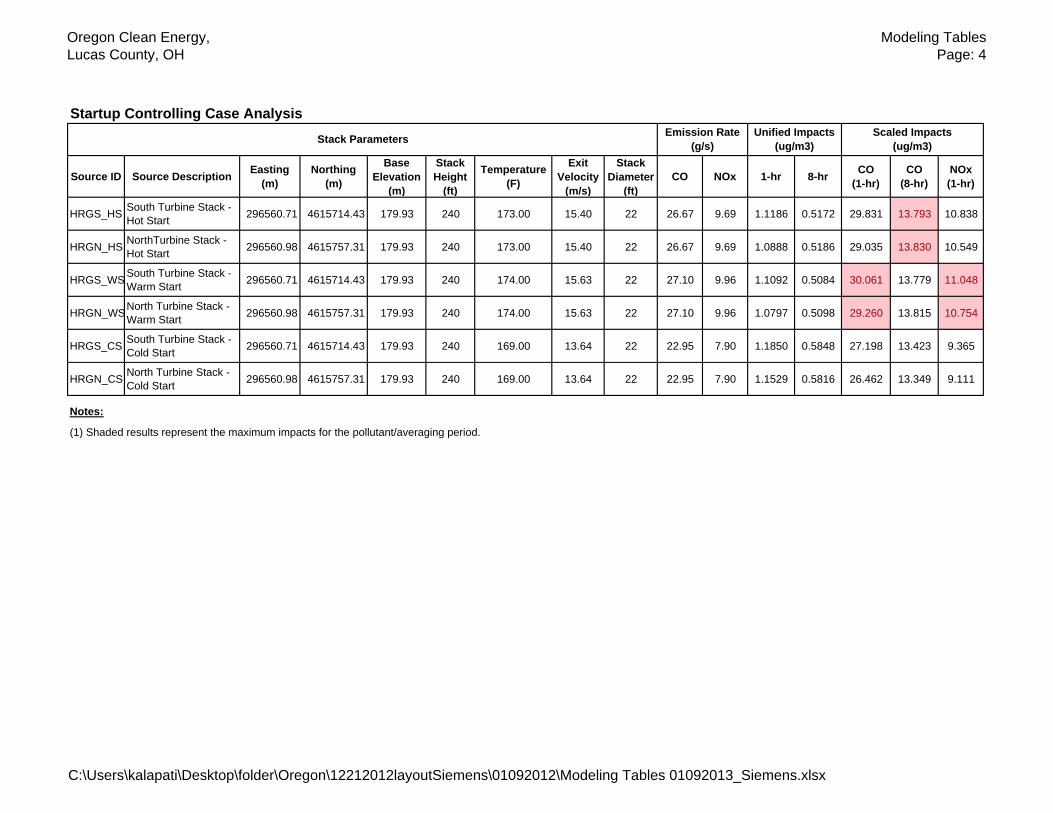
Oregon Clean Energy, Lucas County, OH
Modeling Tables Page: 4
Startup Controlling Case Analysis
Source ID Source Description Easting (m)
Northing (m)
Base Elevation
(m)
Stack Height
(ft)
Temperature (F)
Exit Velocity
(m/s)
Stack Diameter
(ft)CO NOx 1-hr 8-hr CO
(1-hr)CO
(8-hr)NOx (1-hr)
HRGS_HS South Turbine Stack - Hot Start 296560.71 4615714.43 179.93 240 173.00 15.40 22 26.67 9.69 1.1186 0.5172 29.831 13.793 10.838
HRGN_HS NorthTurbine Stack - Hot Start 296560.98 4615757.31 179.93 240 173.00 15.40 22 26.67 9.69 1.0888 0.5186 29.035 13.830 10.549
HRGS_WS South Turbine Stack - Warm Start 296560.71 4615714.43 179.93 240 174.00 15.63 22 27.10 9.96 1.1092 0.5084 30.061 13.779 11.048
HRGN_WSNorth Turbine Stack - Warm Start 296560.98 4615757.31 179.93 240 174.00 15.63 22 27.10 9.96 1.0797 0.5098 29.260 13.815 10.754
HRGS_CS South Turbine Stack - Cold Start 296560.71 4615714.43 179.93 240 169.00 13.64 22 22.95 7.90 1.1850 0.5848 27.198 13.423 9.365
HRGN_CS North Turbine Stack - Cold Start 296560.98 4615757.31 179.93 240 169.00 13.64 22 22.95 7.90 1.1529 0.5816 26.462 13.349 9.111
Notes:
(1) Shaded results represent the maximum impacts for the pollutant/averaging period.
Stack Parameters Unified Impacts (ug/m3)
Scaled Impacts (ug/m3)
Emission Rate (g/s)
C:\Users\kalapati\Desktop\folder\Oregon\12212012layoutSiemens\01092012\Modeling Tables 01092013_Siemens.xlsx
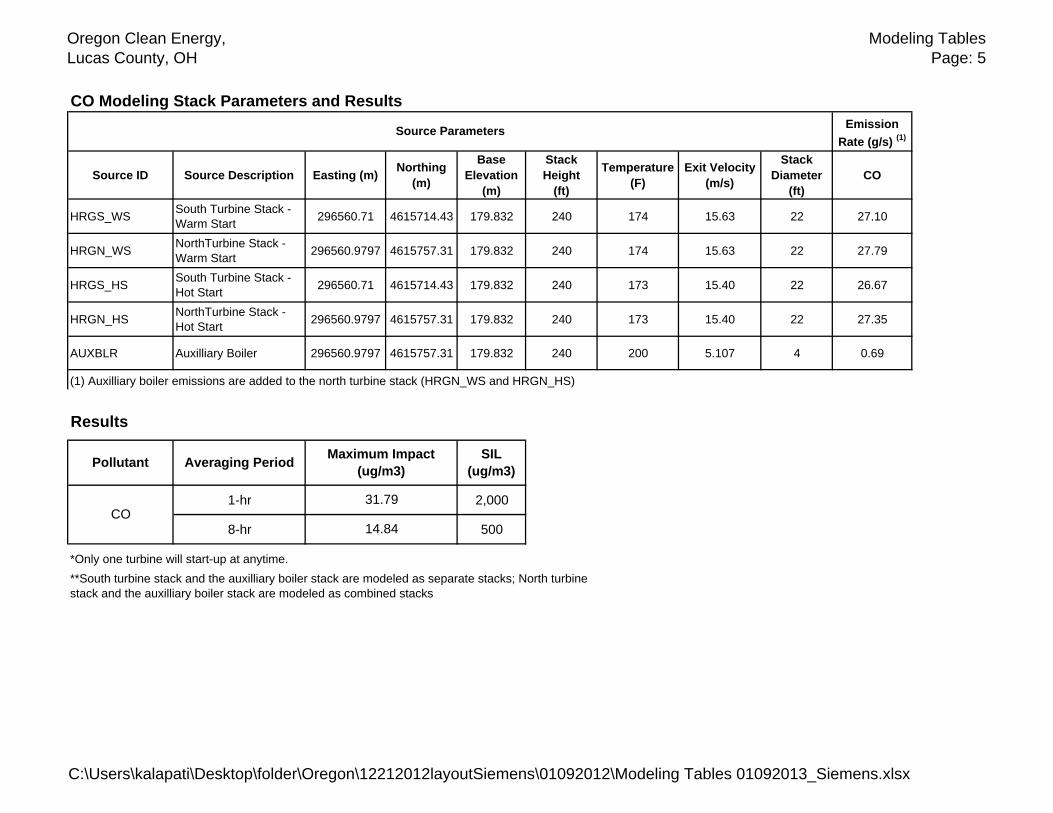
Oregon Clean Energy, Lucas County, OH
Modeling Tables Page: 5
CO Modeling Stack Parameters and ResultsEmission
Rate (g/s) (1)
Source ID Source Description Easting (m) Northing (m)
Base Elevation
(m)
Stack Height
(ft)
Temperature (F)
Exit Velocity (m/s)
Stack Diameter
(ft)CO
HRGS_WS South Turbine Stack - Warm Start 296560.71 4615714.43 179.832 240 174 15.63 22 27.10
HRGN_WS NorthTurbine Stack - Warm Start 296560.9797 4615757.31 179.832 240 174 15.63 22 27.79
HRGS_HS South Turbine Stack - Hot Start 296560.71 4615714.43 179.832 240 173 15.40 22 26.67
HRGN_HS NorthTurbine Stack - Hot Start 296560.9797 4615757.31 179.832 240 173 15.40 22 27.35
AUXBLR Auxilliary Boiler 296560.9797 4615757.31 179.832 240 200 5.107 4 0.69
(1) Auxilliary boiler emissions are added to the north turbine stack (HRGN_WS and HRGN_HS)
Results
1-hr 2,000
8-hr 500
*Only one turbine will start-up at anytime.**South turbine stack and the auxilliary boiler stack are modeled as separate stacks; North turbine stack and the auxilliary boiler stack are modeled as combined stacks
CO14.84
Source Parameters
Pollutant Averaging Period Maximum Impact (ug/m3)
SIL (ug/m3)
31.79
C:\Users\kalapati\Desktop\folder\Oregon\12212012layoutSiemens\01092012\Modeling Tables 01092013_Siemens.xlsx
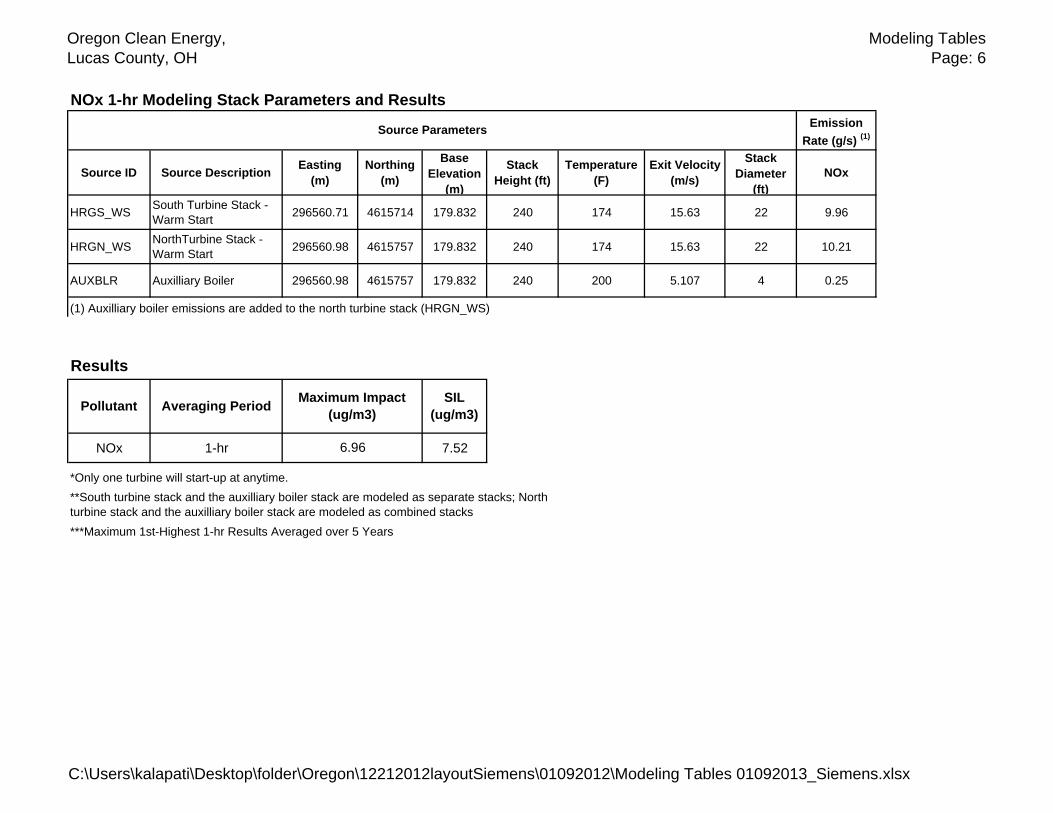
Oregon Clean Energy, Lucas County, OH
Modeling Tables Page: 6
NOx 1-hr Modeling Stack Parameters and ResultsEmission
Rate (g/s) (1)
Source ID Source Description Easting (m)
Northing (m)
Base Elevation
(m)
Stack Height (ft)
Temperature (F)
Exit Velocity (m/s)
Stack Diameter
(ft)NOx
HRGS_WS South Turbine Stack - Warm Start 296560.71 4615714 179.832 240 174 15.63 22 9.96
HRGN_WS NorthTurbine Stack - Warm Start 296560.98 4615757 179.832 240 174 15.63 22 10.21
AUXBLR Auxilliary Boiler 296560.98 4615757 179.832 240 200 5.107 4 0.25
(1) Auxilliary boiler emissions are added to the north turbine stack (HRGN_WS)
Results
NOx 1-hr 7.52
*Only one turbine will start-up at anytime.
***Maximum 1st-Highest 1-hr Results Averaged over 5 Years
Source Parameters
Maximum Impact (ug/m3)
6.96
**South turbine stack and the auxilliary boiler stack are modeled as separate stacks; North turbine stack and the auxilliary boiler stack are modeled as combined stacks
SIL (ug/m3)Pollutant Averaging Period
C:\Users\kalapati\Desktop\folder\Oregon\12212012layoutSiemens\01092012\Modeling Tables 01092013_Siemens.xlsx
Dispersion Modeling Report Oregon Clean Energy Center
Lucas County, OH Siemens Turbines, Volume 2
Appendix C: Plots of Maximum-Impact Cases
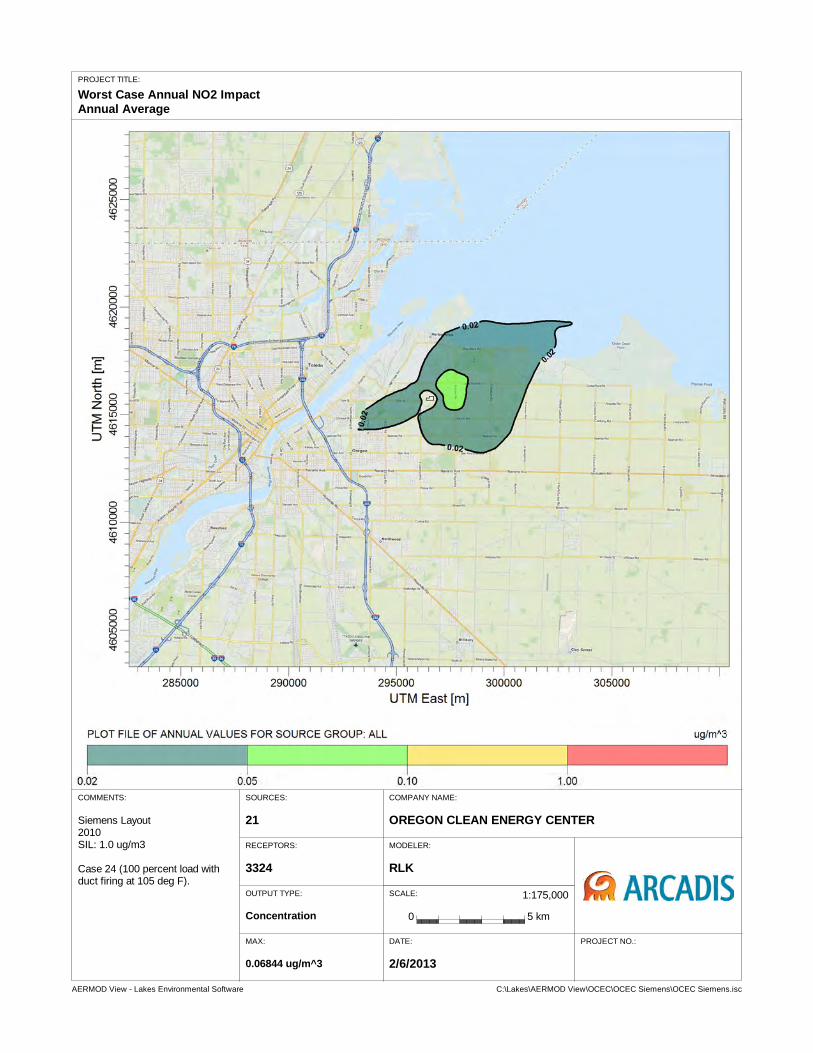
AERMOD View - Lakes Environmental Software C:\Lakes\AERMOD View\OCEC\OCEC Siemens\OCEC Siemens.isc
SCALE:
0 5 km
1:175,000
PROJECT TITLE:
Worst Case Annual NO2 ImpactAnnual Average
COMMENTS:
Siemens Layout2010SIL: 1.0 ug/m3
Case 24 (100 percent load with duct firing at 105 deg F).
COMPANY NAME:
OREGON CLEAN ENERGY CENTER
MODELER:
RLK
DATE:
2/6/2013
PROJECT NO.:
SOURCES:
21
RECEPTORS:
3324
OUTPUT TYPE:
Concentration
MAX:
0.06844 ug/m^3
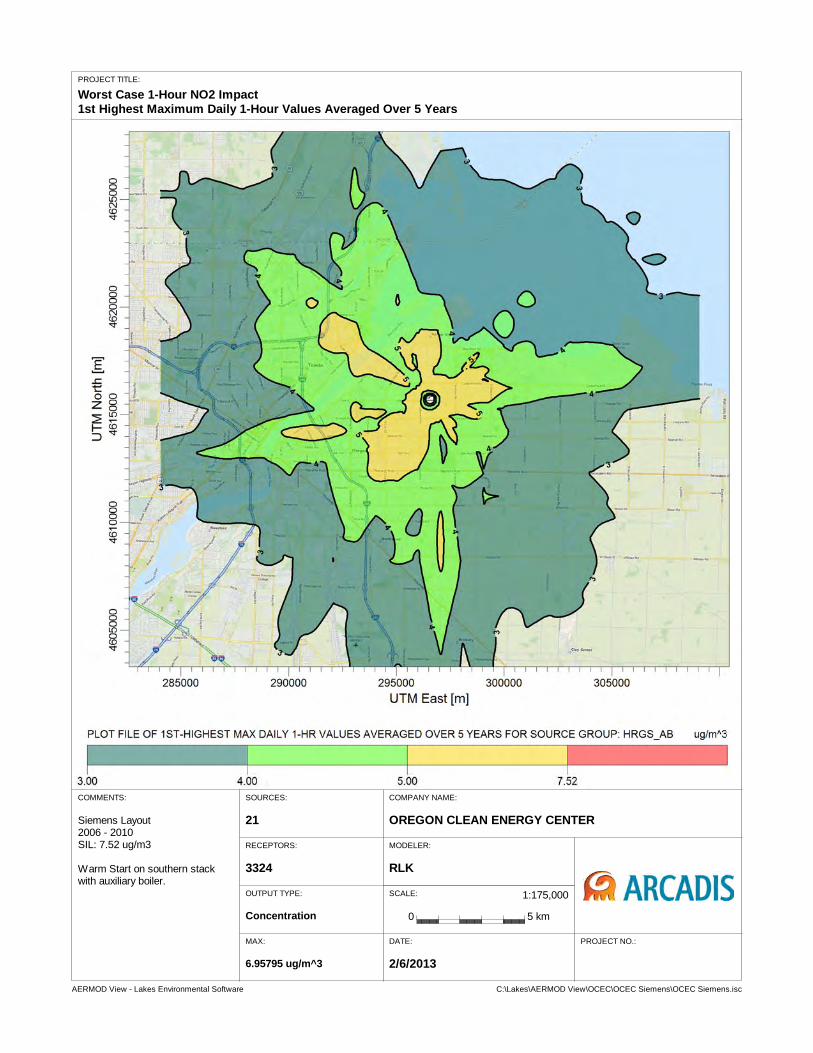
AERMOD View - Lakes Environmental Software C:\Lakes\AERMOD View\OCEC\OCEC Siemens\OCEC Siemens.isc
SCALE:
0 5 km
1:175,000
PROJECT TITLE:
Worst Case 1-Hour NO2 Impact1st Highest Maximum Daily 1-Hour Values Averaged Over 5 Years
COMMENTS:
Siemens Layout2006 - 2010SIL: 7.52 ug/m3
Warm Start on southern stack with auxiliary boiler.
COMPANY NAME:
OREGON CLEAN ENERGY CENTER
MODELER:
RLK
DATE:
2/6/2013
PROJECT NO.:
SOURCES:
21
RECEPTORS:
3324
OUTPUT TYPE:
Concentration
MAX:
6.95795 ug/m^3
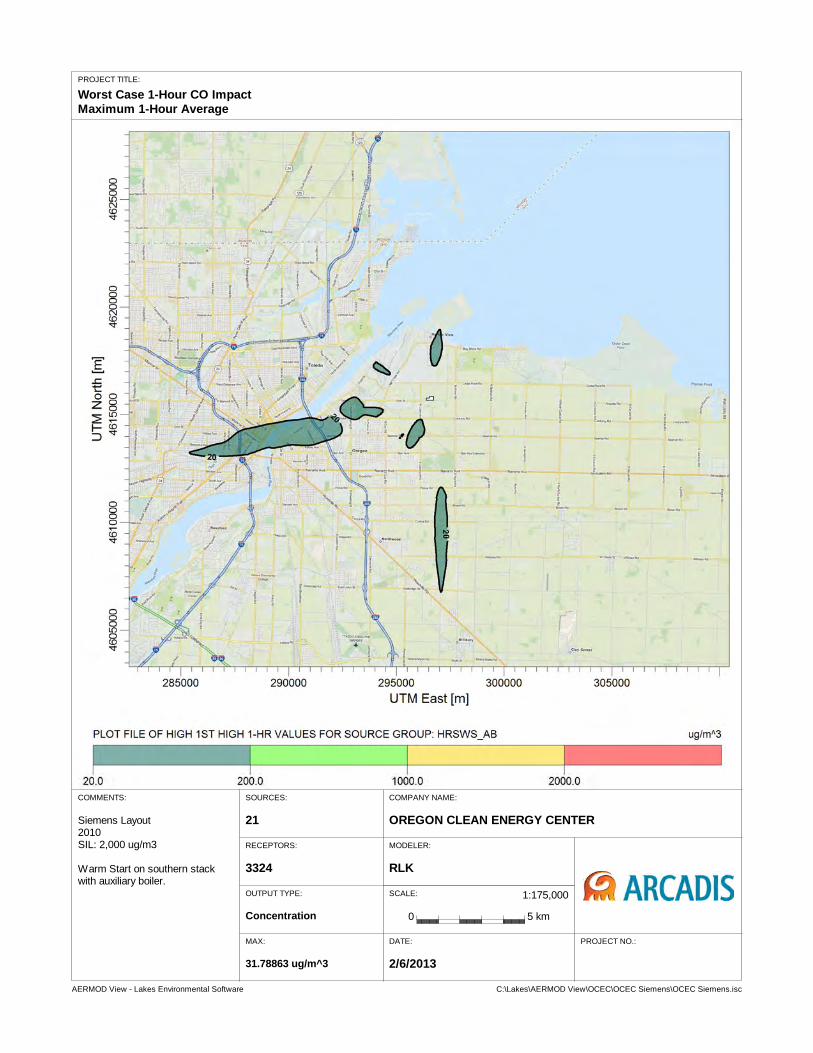
AERMOD View - Lakes Environmental Software C:\Lakes\AERMOD View\OCEC\OCEC Siemens\OCEC Siemens.isc
SCALE:
0 5 km
1:175,000
PROJECT TITLE:
Worst Case 1-Hour CO ImpactMaximum 1-Hour Average
COMMENTS:
Siemens Layout2010SIL: 2,000 ug/m3
Warm Start on southern stack with auxiliary boiler.
COMPANY NAME:
OREGON CLEAN ENERGY CENTER
MODELER:
RLK
DATE:
2/6/2013
PROJECT NO.:
SOURCES:
21
RECEPTORS:
3324
OUTPUT TYPE:
Concentration
MAX:
31.78863 ug/m^3
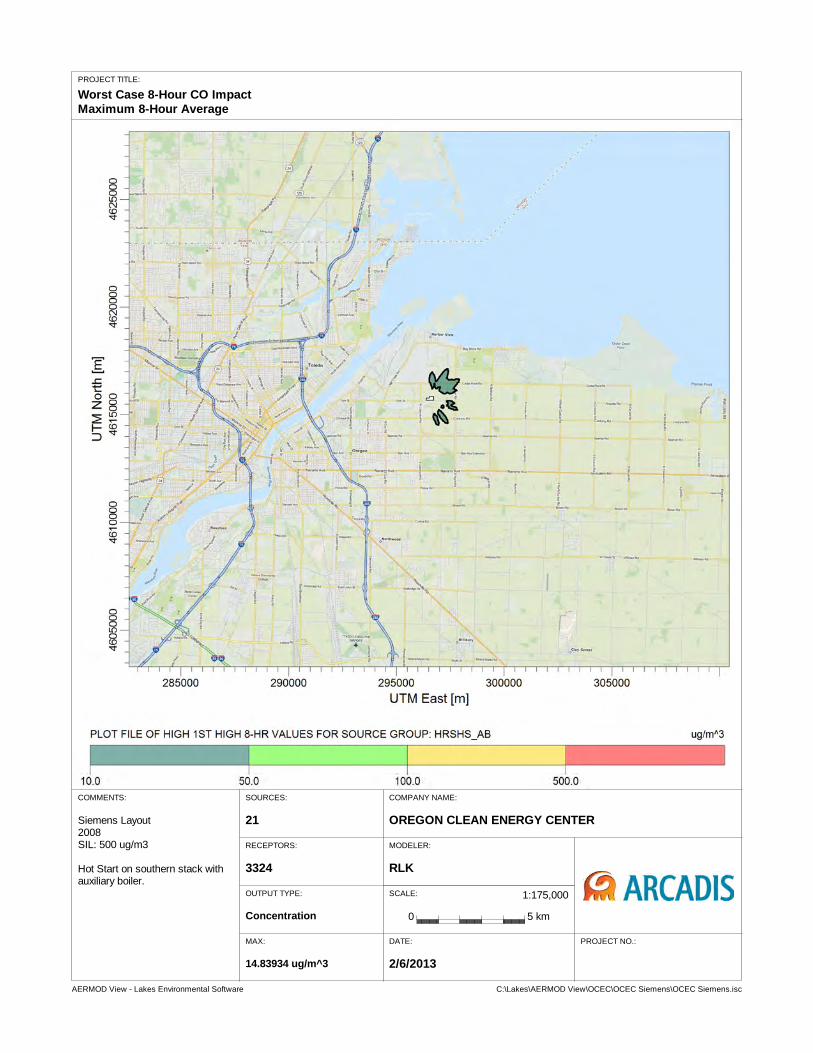
AERMOD View - Lakes Environmental Software C:\Lakes\AERMOD View\OCEC\OCEC Siemens\OCEC Siemens.isc
SCALE:
0 5 km
1:175,000
PROJECT TITLE:
Worst Case 8-Hour CO ImpactMaximum 8-Hour Average
COMMENTS:
Siemens Layout2008SIL: 500 ug/m3
Hot Start on southern stack with auxiliary boiler.
COMPANY NAME:
OREGON CLEAN ENERGY CENTER
MODELER:
RLK
DATE:
2/6/2013
PROJECT NO.:
SOURCES:
21
RECEPTORS:
3324
OUTPUT TYPE:
Concentration
MAX:
14.83934 ug/m^3
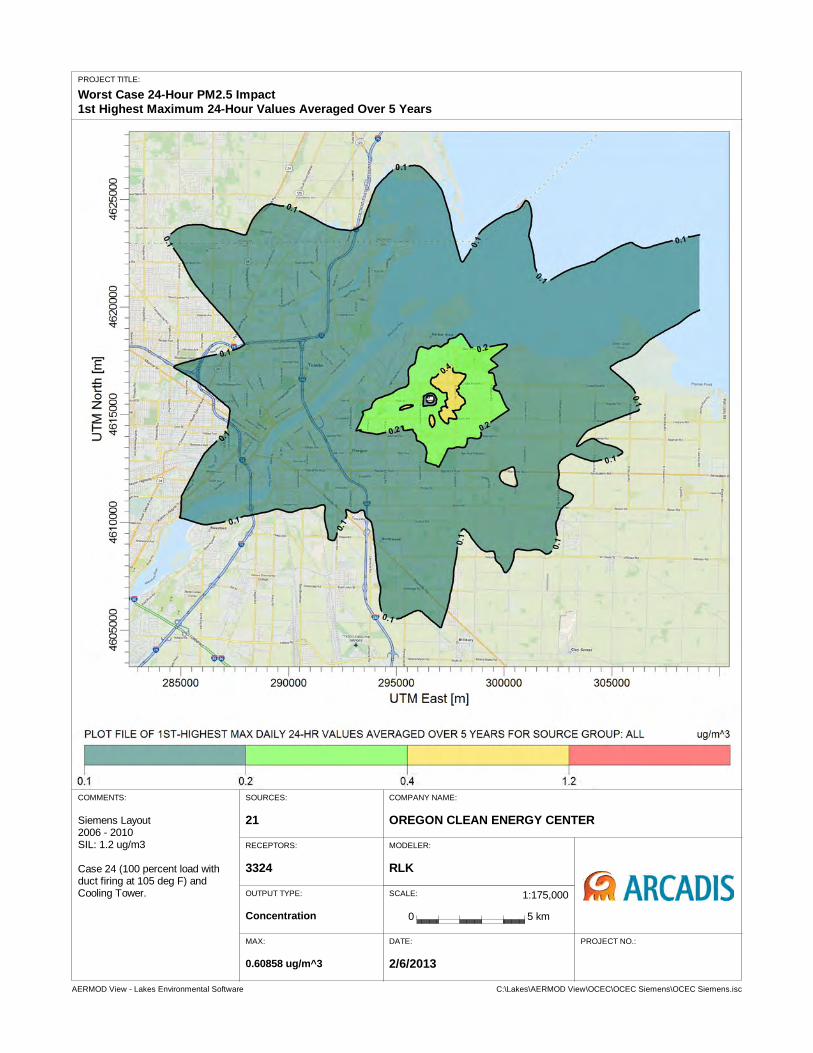
AERMOD View - Lakes Environmental Software C:\Lakes\AERMOD View\OCEC\OCEC Siemens\OCEC Siemens.isc
SCALE:
0 5 km
1:175,000
PROJECT TITLE:
Worst Case 24-Hour PM2.5 Impact1st Highest Maximum 24-Hour Values Averaged Over 5 Years
COMMENTS:
Siemens Layout2006 - 2010SIL: 1.2 ug/m3
Case 24 (100 percent load with duct firing at 105 deg F) and Cooling Tower.
COMPANY NAME:
OREGON CLEAN ENERGY CENTER
MODELER:
RLK
DATE:
2/6/2013
PROJECT NO.:
SOURCES:
21
RECEPTORS:
3324
OUTPUT TYPE:
Concentration
MAX:
0.60858 ug/m^3
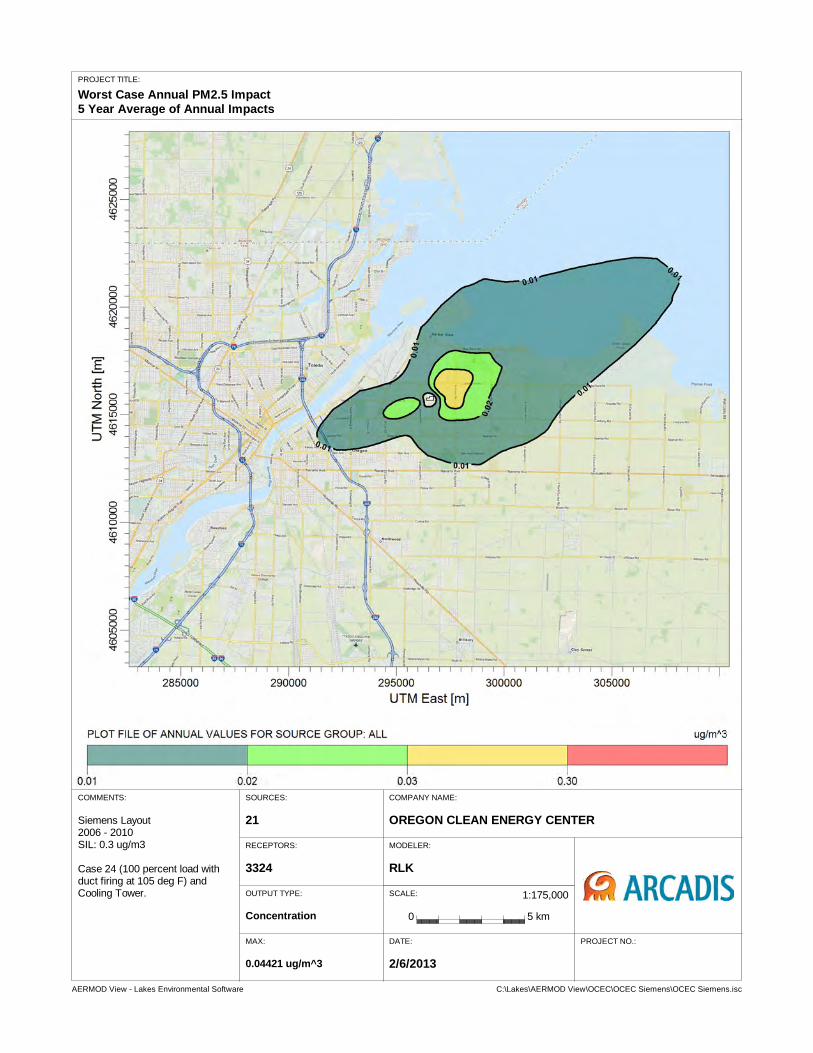
AERMOD View - Lakes Environmental Software C:\Lakes\AERMOD View\OCEC\OCEC Siemens\OCEC Siemens.isc
SCALE:
0 5 km
1:175,000
PROJECT TITLE:
Worst Case Annual PM2.5 Impact5 Year Average of Annual Impacts
COMMENTS:
Siemens Layout2006 - 2010SIL: 0.3 ug/m3
Case 24 (100 percent load with duct firing at 105 deg F) and Cooling Tower.
COMPANY NAME:
OREGON CLEAN ENERGY CENTER
MODELER:
RLK
DATE:
2/6/2013
PROJECT NO.:
SOURCES:
21
RECEPTORS:
3324
OUTPUT TYPE:
Concentration
MAX:
0.04421 ug/m^3
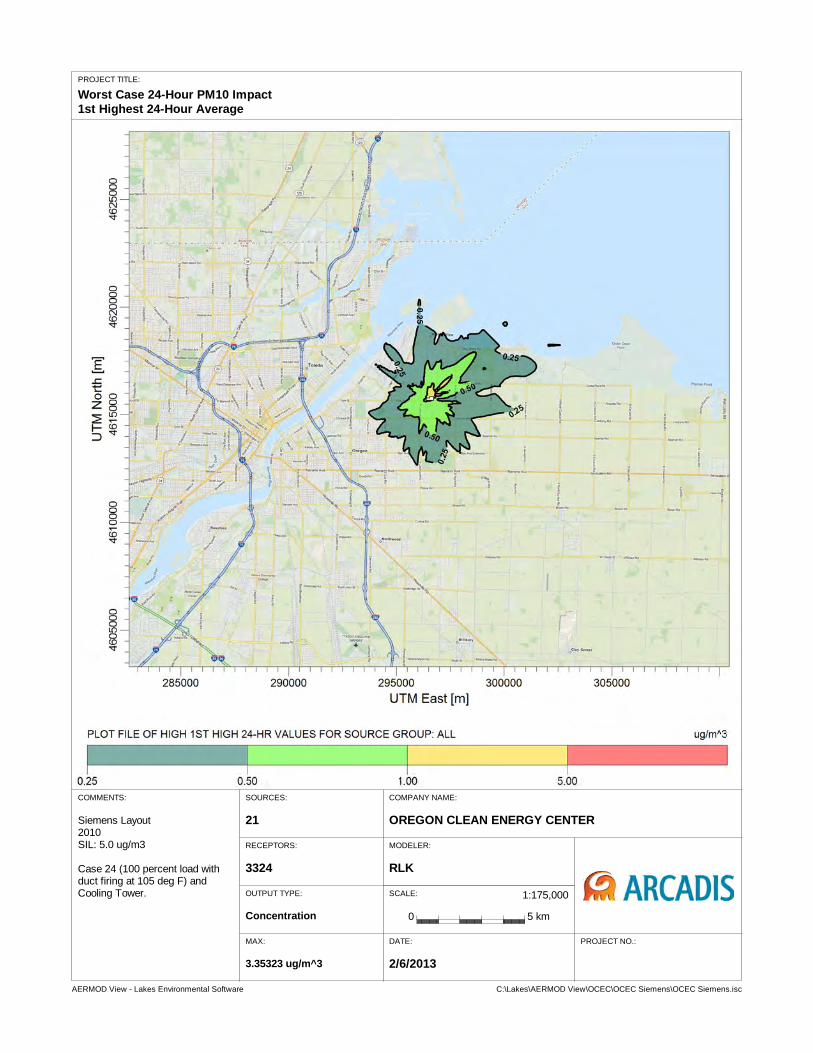
AERMOD View - Lakes Environmental Software C:\Lakes\AERMOD View\OCEC\OCEC Siemens\OCEC Siemens.isc
SCALE:
0 5 km
1:175,000
PROJECT TITLE:
Worst Case 24-Hour PM10 Impact1st Highest 24-Hour Average
COMMENTS:
Siemens Layout2010SIL: 5.0 ug/m3
Case 24 (100 percent load with duct firing at 105 deg F) and Cooling Tower.
COMPANY NAME:
OREGON CLEAN ENERGY CENTER
MODELER:
RLK
DATE:
2/6/2013
PROJECT NO.:
SOURCES:
21
RECEPTORS:
3324
OUTPUT TYPE:
Concentration
MAX:
3.35323 ug/m^3

Dispersion Modeling Report Oregon Clean Energy Center
Lucas County, OH Siemens Turbines, Volume 2
Appendix D: Modeling Files
Dispersion Modeling Report Oregon Clean Energy Center
Lucas County, OH Siemens Turbines, Volume 2
Appendix E: Agency Correspondence
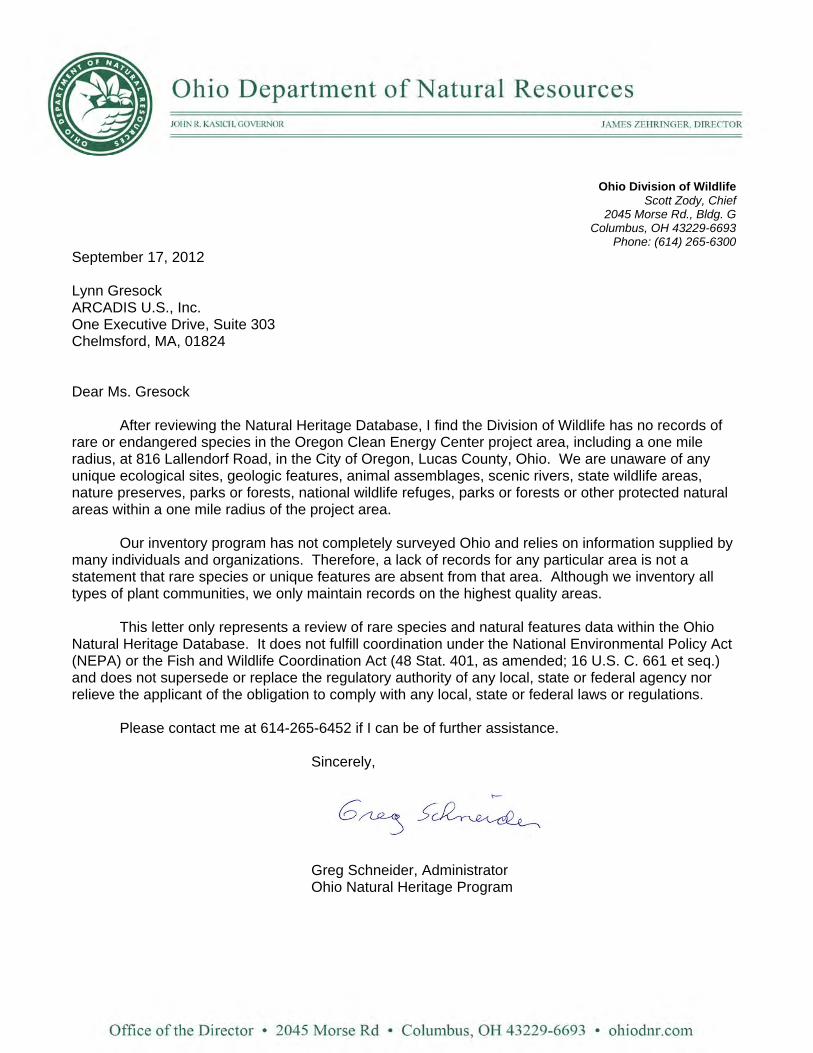
Ohio Division of Wildlife Scott Zody, Chief
2045 Morse Rd., Bldg. G Columbus, OH 43229-6693
Phone: (614) 265-6300 September 17, 2012 Lynn Gresock ARCADIS U.S., Inc. One Executive Drive, Suite 303 Chelmsford, MA, 01824 Dear Ms. Gresock After reviewing the Natural Heritage Database, I find the Division of Wildlife has no records of rare or endangered species in the Oregon Clean Energy Center project area, including a one mile radius, at 816 Lallendorf Road, in the City of Oregon, Lucas County, Ohio. We are unaware of any unique ecological sites, geologic features, animal assemblages, scenic rivers, state wildlife areas, nature preserves, parks or forests, national wildlife refuges, parks or forests or other protected natural areas within a one mile radius of the project area. Our inventory program has not completely surveyed Ohio and relies on information supplied by many individuals and organizations. Therefore, a lack of records for any particular area is not a statement that rare species or unique features are absent from that area. Although we inventory all types of plant communities, we only maintain records on the highest quality areas. This letter only represents a review of rare species and natural features data within the Ohio Natural Heritage Database. It does not fulfill coordination under the National Environmental Policy Act (NEPA) or the Fish and Wildlife Coordination Act (48 Stat. 401, as amended; 16 U.S. C. 661 et seq.) and does not supersede or replace the regulatory authority of any local, state or federal agency nor relieve the applicant of the obligation to comply with any local, state or federal laws or regulations.
Please contact me at 614-265-6452 if I can be of further assistance. Sincerely,
Greg Schneider, Administrator Ohio Natural Heritage Program