Embed Size (px)
Citation preview

Acknowledgement
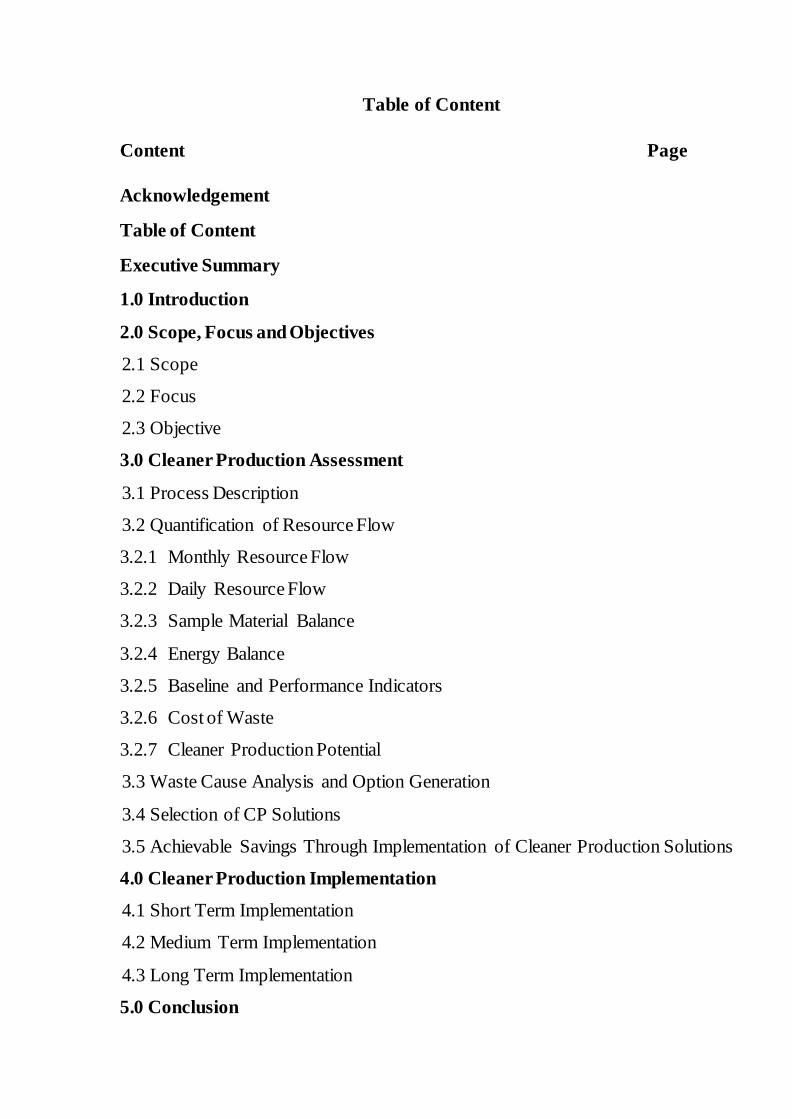
Table of Content
Content Page
Acknowledgement
Table of Content
Executive Summary
1.0 Introduction
2.0 Scope, Focus and Objectives
2.1 Scope
2.2 Focus
2.3 Objective
3.0 Cleaner Production Assessment
3.1 Process Description
3.2 Quantification of Resource Flow
3.2.1 Monthly Resource Flow
3.2.2 Daily Resource Flow
3.2.3 Sample Material Balance
3.2.4 Energy Balance
3.2.5 Baseline and Performance Indicators
3.2.6 Cost of Waste
3.2.7 Cleaner Production Potential
3.3 Waste Cause Analysis and Option Generation
3.4 Selection of CP Solutions
3.5 Achievable Savings Through Implementation of Cleaner Production Solutions
4.0 Cleaner Production Implementation
4.1 Short Term Implementation
4.2 Medium Term Implementation
4.3 Long Term Implementation
5.0 Conclusion

Executive Summary
1.0 INTRODUCTION
Name and Address
of Company
Telephone
Fax
Website
Year of
Establishment
Ownership Sole
Proprietor
Joint
Venture
Multi-
national
Limited
Liability
Company
Other
(Please
Specify)
Physical Location
Manufacturing Service Other (Please Specify) Type of Activity
Sector
Size of the Facility Small Medium Large
Industrial Process
Used
Production / Service
Capacity Current Full Capacity
Market Export Local Mix Export %
Local %
Total No. of
Employees
Direct
(Permanent)
Direct
(Casual)
Direct
(Contract) Outsourced Others
Company Highlights
Contact Person
(Name &
Designation)
CP Team members
Name Designation Section
Leader:

2.0 SCOPE, FOCUS AND OBJECTIVES
2.1 Scope
2.2 Focus
2.3 Objectives

3.0 CLEANER PRODUCTION ASSESSMENT
3.1 Process Description
Detailed Process Flow Diagram(s) is given in Annex ……
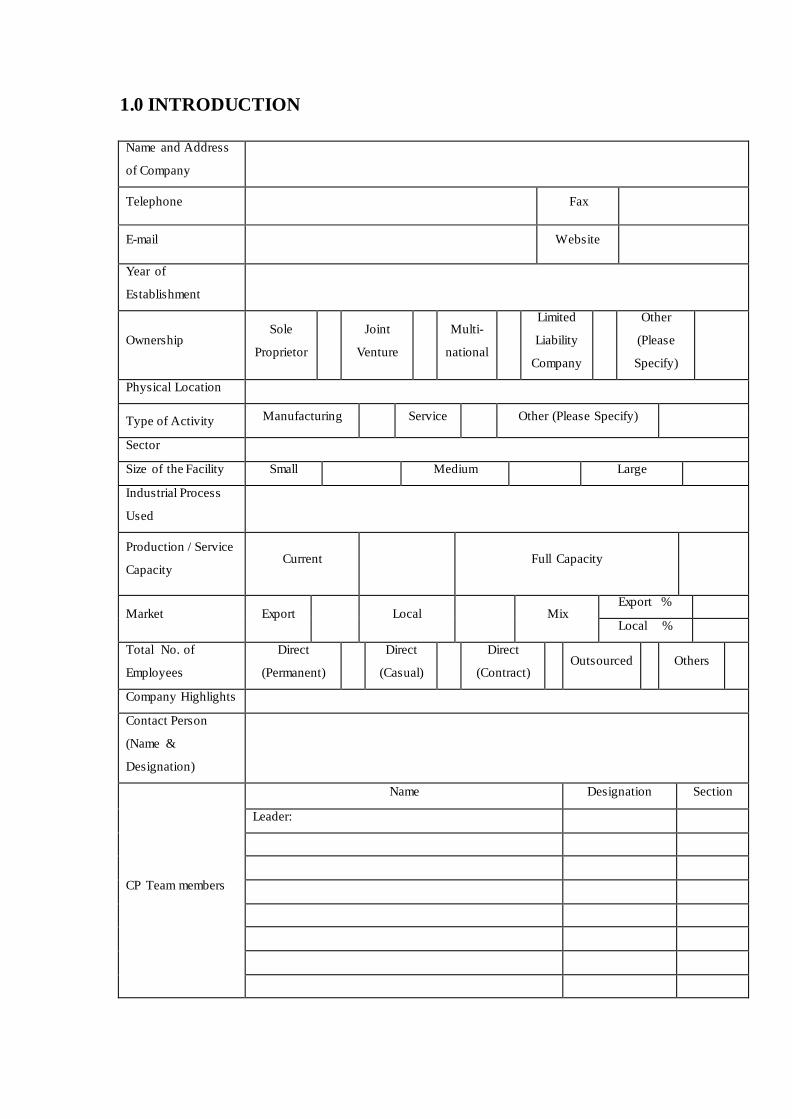
3.2 Quantification of Resource Flow
3.2.1 Monthly Resource Flow: (From ........................... To ……………………)
Item Unit Period
Inputs
Raw materials
Main Raw Materials
Other Raw Materials
Water
From national supply m3
From own source m3
From contractors m3
Energy
Electricity from grid kWh
Electricity from generator kWh
Electricity (Max. demand) kVA
Fuel (furnace) oil Litre
Diesel / kerosene Litre
LPG Kg
Firewood
Other renewable sources TOE
Products
Main product output
By Products
Wastes
Solid waste Ton/kg
Liquid waste m3
Air Emission (GHG) tCO2e
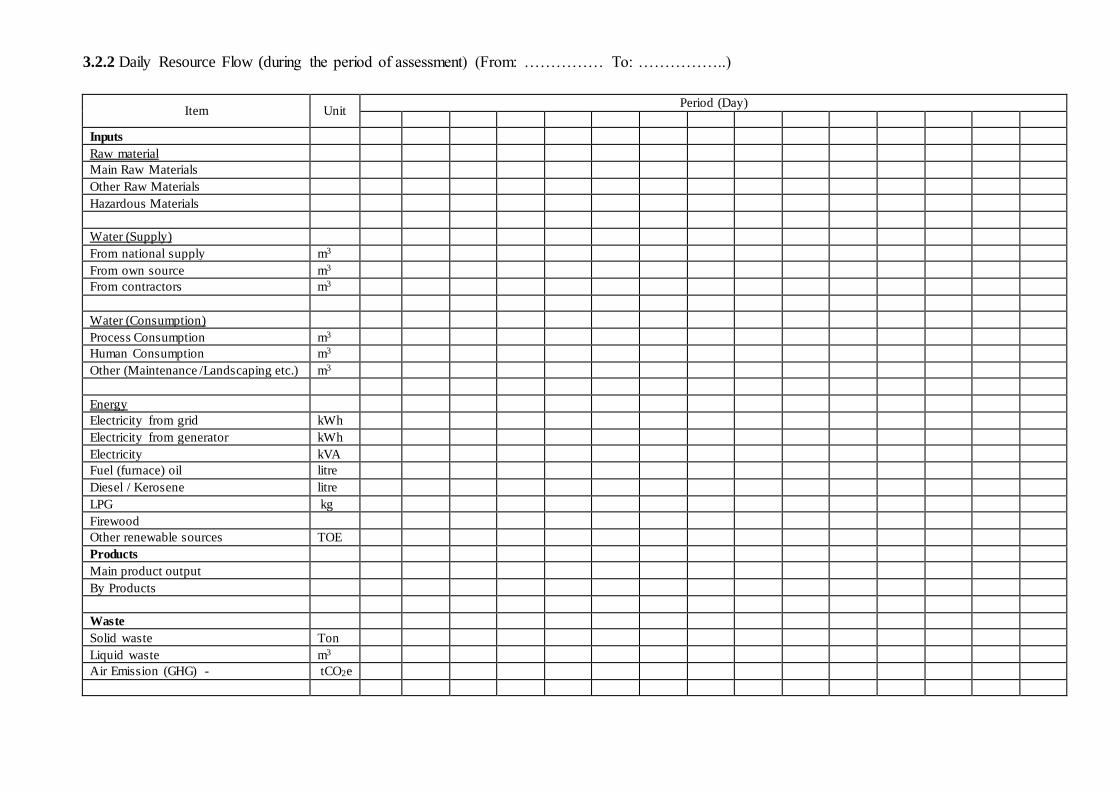
3.2.2 Daily Resource Flow (during the period of assessment) (From: …………… To: ……………..)
Item Unit Period (Day)
Inputs
Raw material
Main Raw Materials
Other Raw Materials
Hazardous Materials
Water (Supply)
From national supply m3
From own source m3
From contractors m3
Water (Consumption)
Process Consumption m3
Human Consumption m3
Other (Maintenance /Landscaping etc.) m3
Energy
Electricity from grid kWh
Electricity from generator kWh
Electricity kVA
Fuel (furnace) oil litre
Diesel / Kerosene litre
LPG kg
Firewood
Other renewable sources TOE
Products
Main product output
By Products
Waste
Solid waste Ton
Liquid waste m3
Air Emission (GHG) - tCO2e
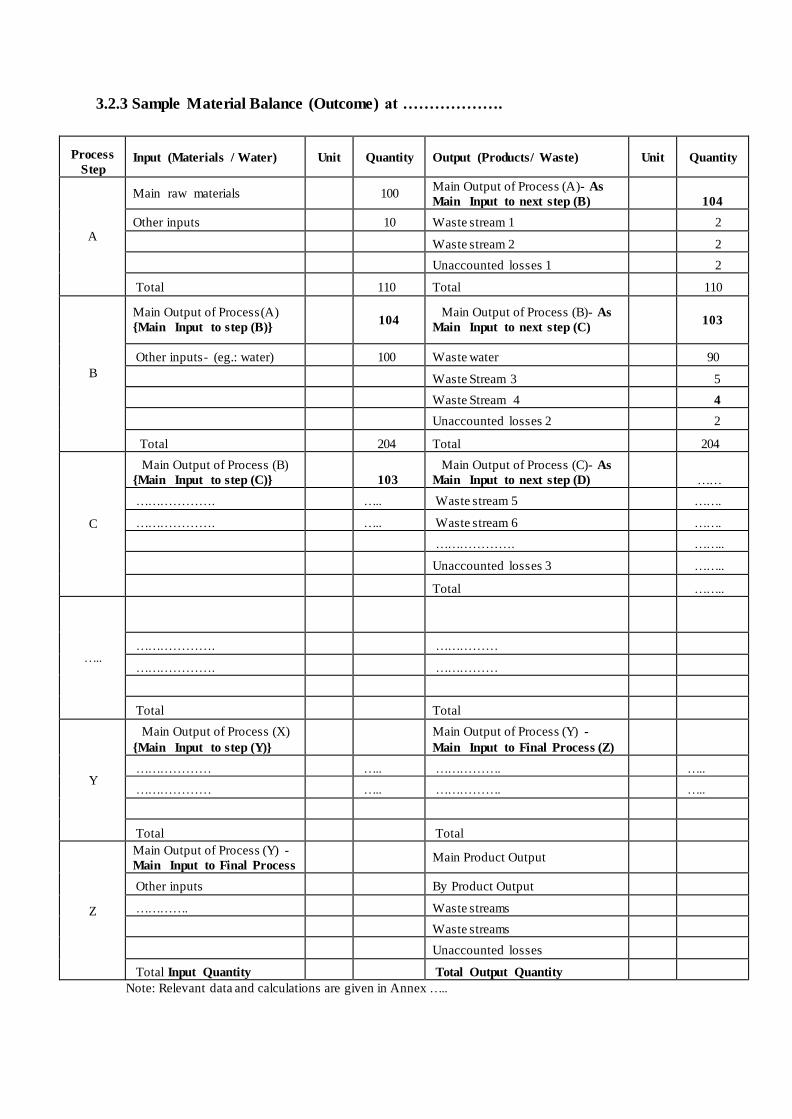
3.2.3 Sample Material Balance (Outcome) at ……………….
Process
Step Input (Materials / Water) Unit Quantity Output (Products/ Waste) Unit Quantity
A
Main raw materials
100 Main Output of Process (A)- As
Main Input to next step (B) 104
Other inputs
10 Waste stream 1 2
Waste stream 2 2
Unaccounted losses 1 2
Total 110 Total 110
B
Main Output of Process(A)
{Main Input to step (B)} 104
Main Output of Process (B)- As
Main Input to next step (C) 103
Other inputs- (eg.: water)
100 Waste water 90
Waste Stream 3 5
Waste Stream 4
4
Unaccounted losses 2 2
Total 204 Total 204
C
Main Output of Process (B)
{Main Input to step (C)} 103
Main Output of Process (C)- As
Main Input to next step (D) ……
………………. ….. Waste stream 5 …….
………………. ….. Waste stream 6 …….
………………. ……..
Unaccounted losses 3
……..
Total ……..
…..
………………. ……………
………………. ……………
Total Total
Y
Main Output of Process (X)
{Main Input to step (Y)}
Main Output of Process (Y) -
Main Input to Final Process (Z)
……………… ….. ……………. …..
……………… ….. ……………. …..
Total Total
Z
Main Output of Process (Y) -
Main Input to Final Process Main Product Output
Other inputs By Product Output
…………. Waste streams
Waste streams
Unaccounted losses
Total Input Quantity Total Output Quantity
Note: Relevant data and calculations are given in Annex …..
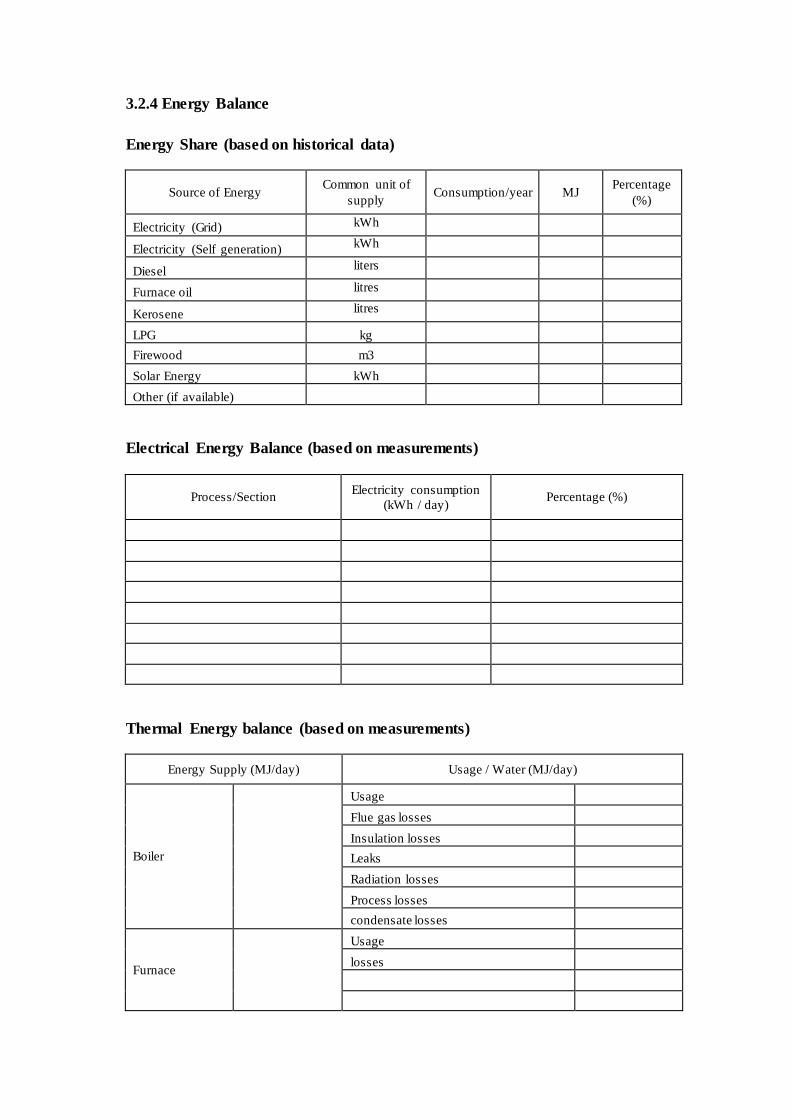
3.2.4 Energy Balance
Energy Share (based on historical data)
Source of Energy Common unit of
supply Consumption/year MJ
Percentage
(%)
Electricity (Grid) kWh
Electricity (Self generation) kWh
Diesel liters
Furnace oil litres
Kerosene litres
LPG kg
Firewood m3
Solar Energy kWh
Other (if available)
Electrical Energy Balance (based on measurements)
Process/Section Electricity consumption
(kWh / day) Percentage (%)
Thermal Energy balance (based on measurements)
Energy Supply (MJ/day) Usage / Water (MJ/day)
Boiler
Usage
Flue gas losses
Insulation losses
Leaks
Radiation losses
Process losses
condensate losses
Furnace
Usage
losses
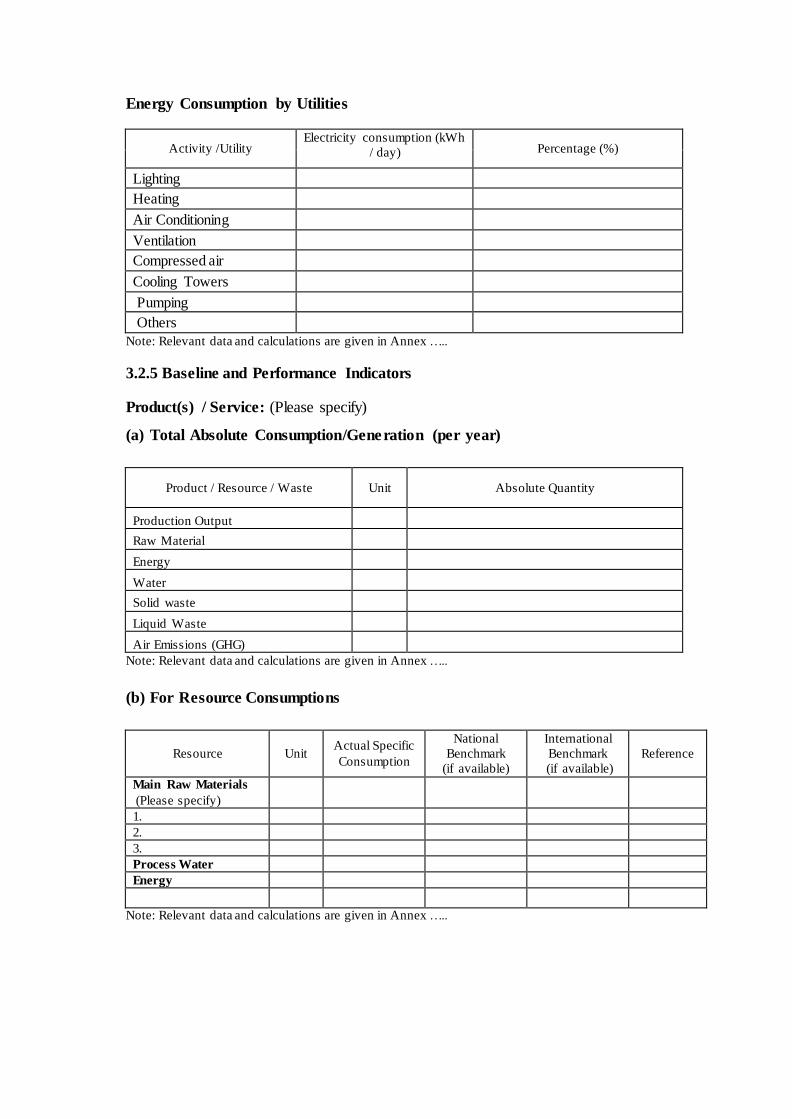
Energy Consumption by Utilities
Activity /Utility Electricity consumption (kWh
/ day) Percentage (%)
Lighting
Heating
Air Conditioning
Ventilation
Compressed air
Cooling Towers Pumping
Others
Note: Relevant data and calculations are given in Annex …..
3.2.5 Baseline and Performance Indicators
Product(s) / Service: (Please specify)
(a) Total Absolute Consumption/Generation (per year)
Product / Resource / Waste Unit Absolute Quantity
Production Output
Raw Material
Energy
Water
Solid waste
Liquid Waste
Air Emissions (GHG)
Note: Relevant data and calculations are given in Annex …..
(b) For Resource Consumptions
Resource Unit Actual Specific
Consumption
National
Benchmark
(if available)
International
Benchmark
(if available)
Reference
Main Raw Materials
(Please specify)
1.
2.
3.
Process Water
Energy
Note: Relevant data and calculations are given in Annex …..
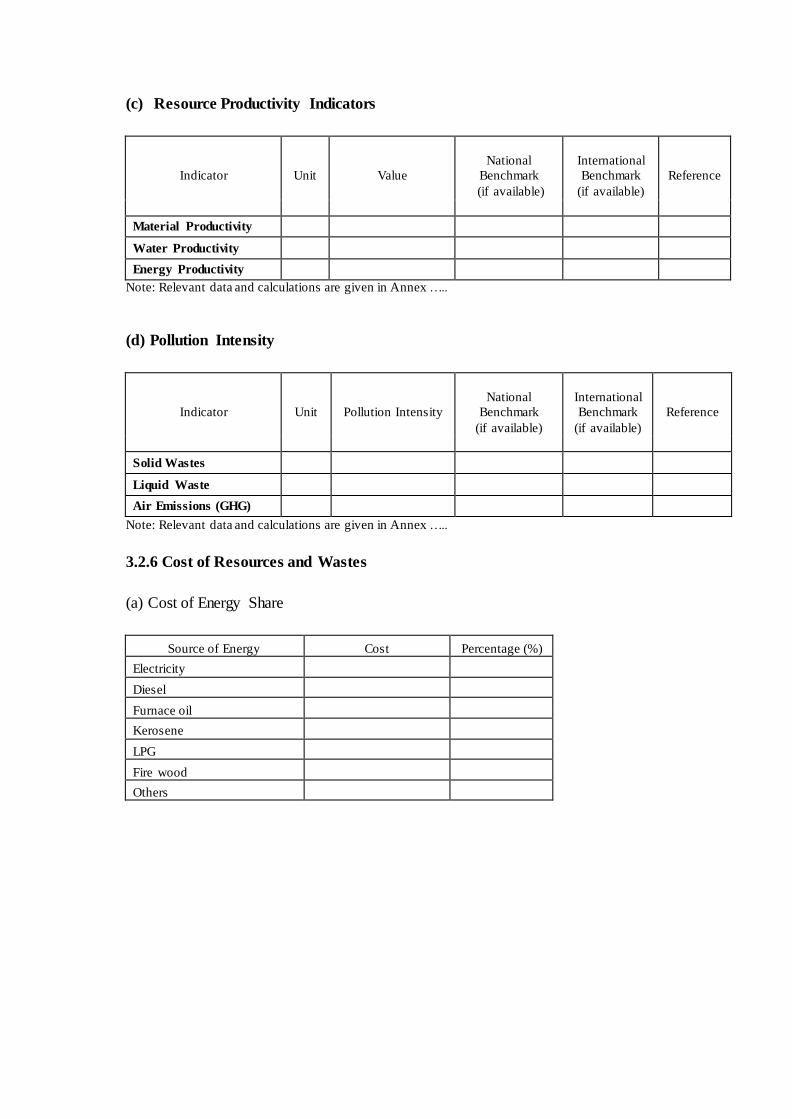
(c) Resource Productivity Indicators
Indicator Unit Value
National
Benchmark
(if available)
International
Benchmark
(if available)
Reference
Material Productivity
Water Productivity
Energy Productivity
Note: Relevant data and calculations are given in Annex …..
(d) Pollution Intensity
Indicator Unit Pollution Intensity
National
Benchmark
(if available)
International
Benchmark
(if available)
Reference
Solid Wastes
Liquid Waste
Air Emissions (GHG) Note: Relevant data and calculations are given in Annex …..
3.2.6 Cost of Resources and Wastes
(a) Cost of Energy Share
Source of Energy Cost Percentage (%)
Electricity
Diesel
Furnace oil
Kerosene
LPG
Fire wood
Others
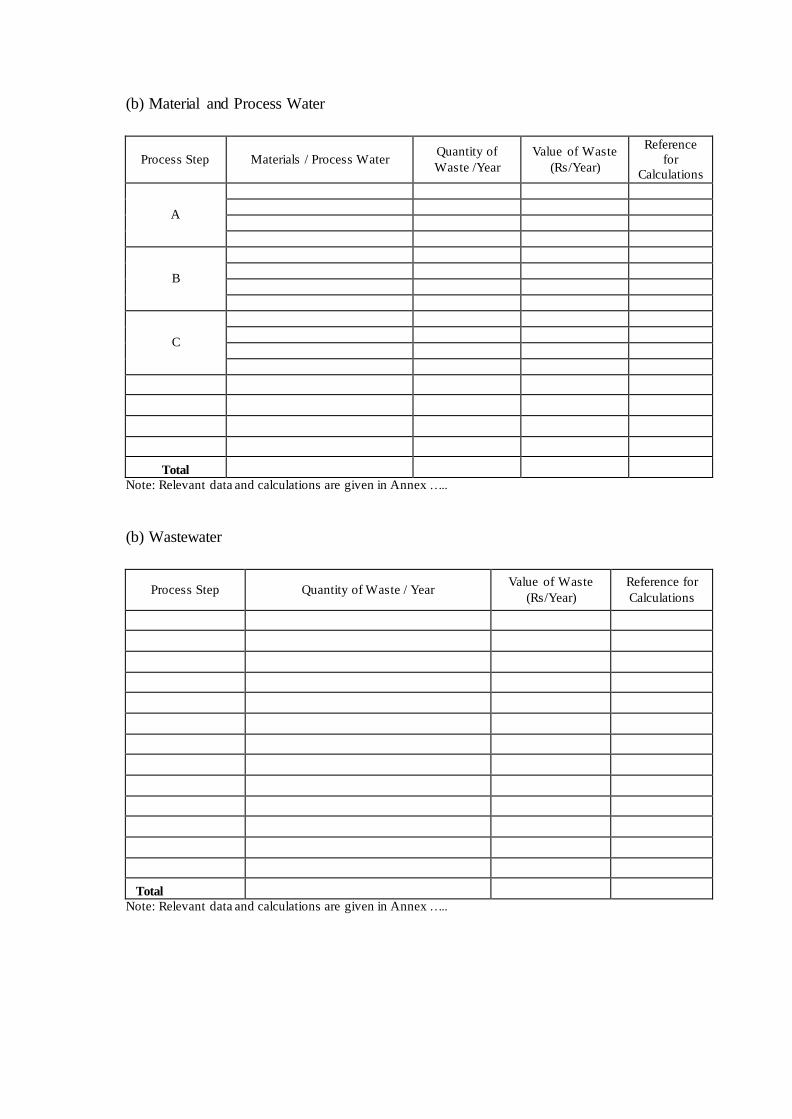
(b) Material and Process Water
Process Step Materials / Process Water Quantity of
Waste /Year
Value of Waste
(Rs/Year)
Reference
for
Calculations
A
B
C
Total
Note: Relevant data and calculations are given in Annex …..
(b) Wastewater
Process Step Quantity of Waste / Year Value of Waste
(Rs/Year)
Reference for
Calculations
Total
Note: Relevant data and calculations are given in Annex …..
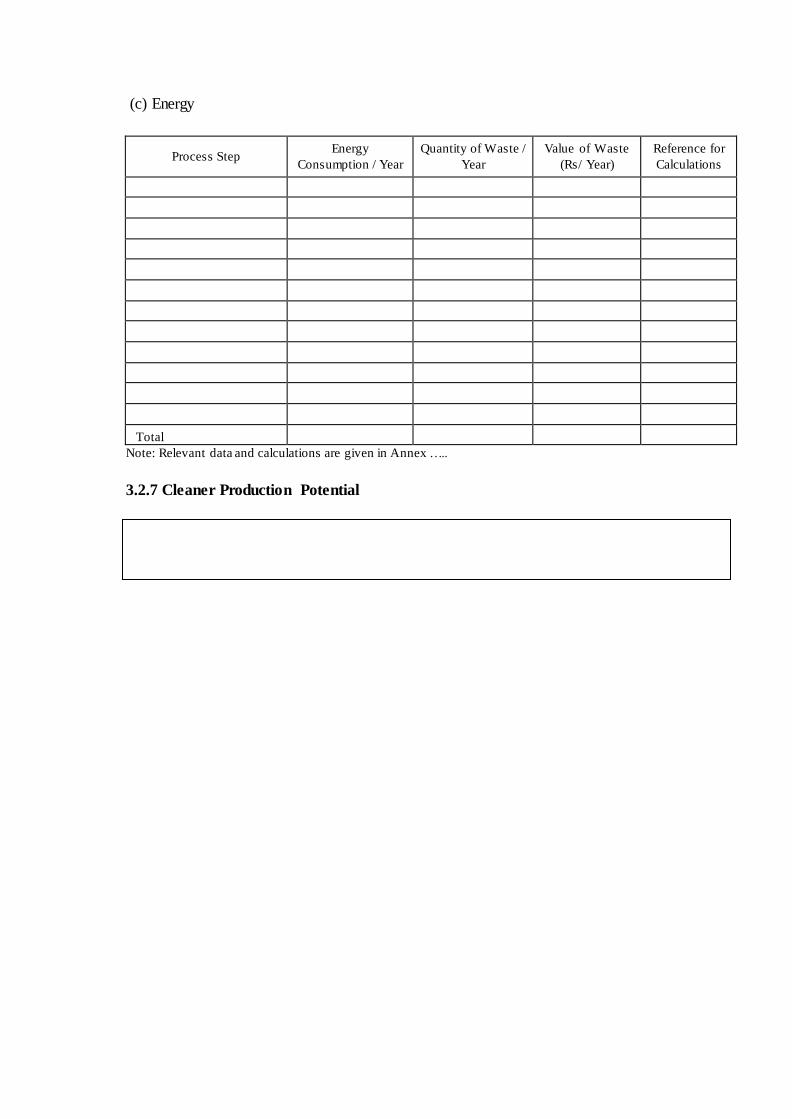
(c) Energy
Process Step Energy
Consumption / Year
Quantity of Waste /
Year
Value of Waste
(Rs/ Year)
Reference for
Calculations
Total
Note: Relevant data and calculations are given in Annex …..
3.2.7 Cleaner Production Potential
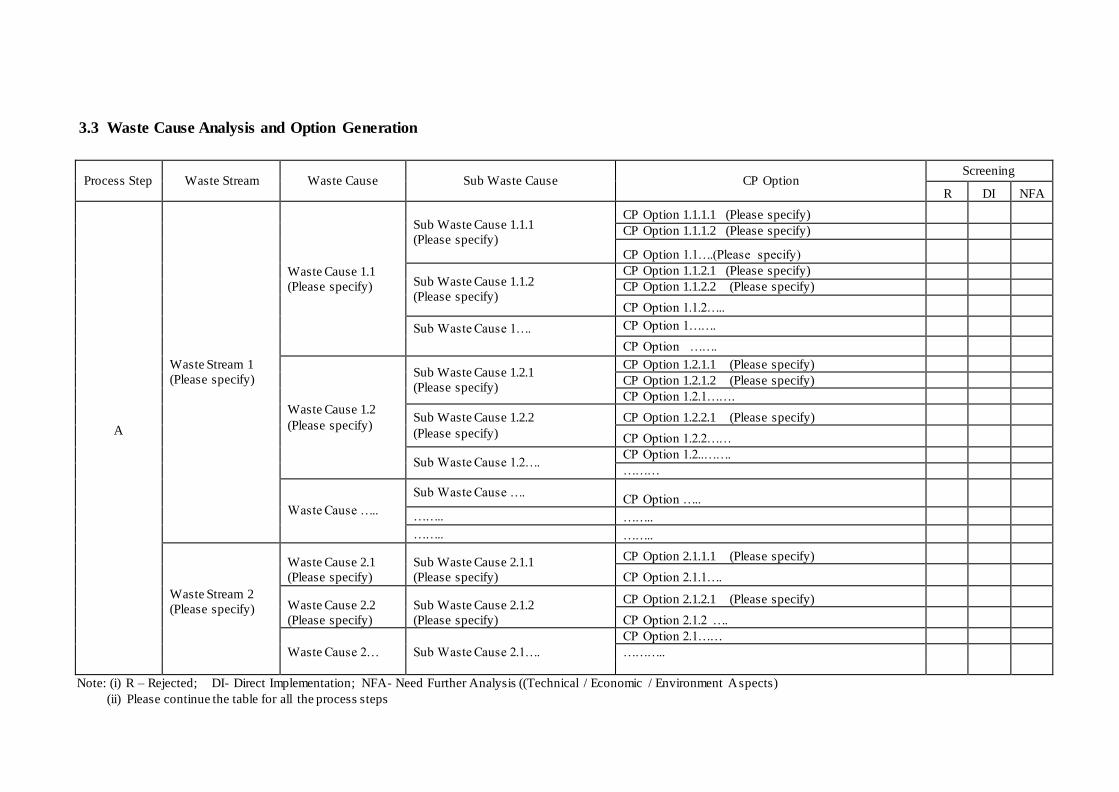
3.3 Waste Cause Analysis and Option Generation
Process Step Waste Stream Waste Cause Sub Waste Cause CP Option Screening
R DI NFA
A
Waste Stream 1
(Please specify)
Waste Cause 1.1
(Please specify)
Sub Waste Cause 1.1.1
(Please specify)
CP Option 1.1.1.1 (Please specify)
CP Option 1.1.1.2 (Please specify)
CP Option 1.1….(Please specify)
Sub Waste Cause 1.1.2
(Please specify)
CP Option 1.1.2.1 (Please specify)
CP Option 1.1.2.2 (Please specify)
CP Option 1.1.2…..
Sub Waste Cause 1….
CP Option 1…….
CP Option …….
Waste Cause 1.2
(Please specify)
Sub Waste Cause 1.2.1
(Please specify)
CP Option 1.2.1.1 (Please specify)
CP Option 1.2.1.2 (Please specify)
CP Option 1.2.1…….
Sub Waste Cause 1.2.2
(Please specify)
CP Option 1.2.2.1 (Please specify)
CP Option 1.2.2……
Sub Waste Cause 1.2….
CP Option 1.2..…….
………
Waste Cause …..
Sub Waste Cause …. CP Option …..
…….. ……..
…….. ……..
Waste Stream 2
(Please specify)
Waste Cause 2.1
(Please specify)
Sub Waste Cause 2.1.1
(Please specify)
CP Option 2.1.1.1 (Please specify)
CP Option 2.1.1….
Waste Cause 2.2
(Please specify)
Sub Waste Cause 2.1.2
(Please specify)
CP Option 2.1.2.1 (Please specify)
CP Option 2.1.2 ….
Waste Cause 2… Sub Waste Cause 2.1….
CP Option 2.1……
………..
Note: (i) R – Rejected; DI- Direct Implementation; NFA- Need Further Analysis ((Technical / Economic / Environment Aspects)
(ii) Please continue the table for all the process steps
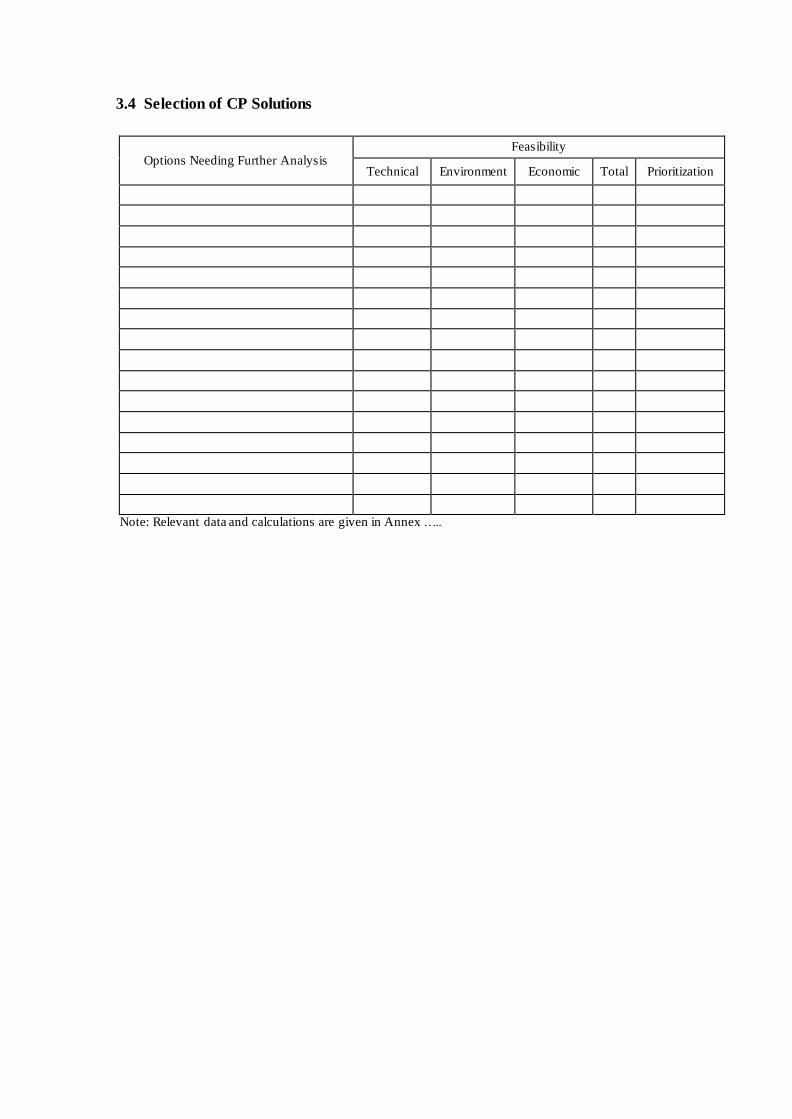
3.4 Selection of CP Solutions
Options Needing Further Analysis Feasibility
Technical Environment Economic Total Prioritization
Note: Relevant data and calculations are given in Annex …..
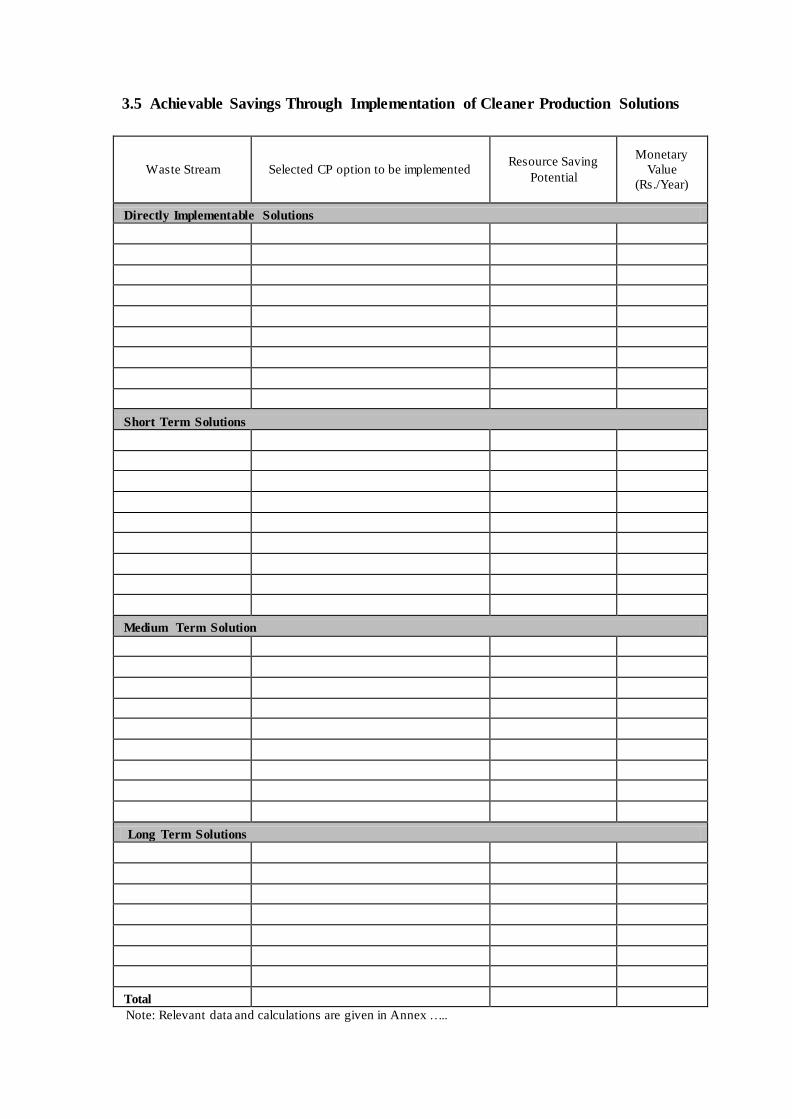
3.5 Achievable Savings Through Implementation of Cleaner Production Solutions
Waste Stream Selected CP option to be implemented Resource Saving
Potential
Monetary
Value
(Rs./Year)
Directly Implementable Solutions
Short Term Solutions
Medium Term Solution
Long Term Solutions
Total
Note: Relevant data and calculations are given in Annex …..
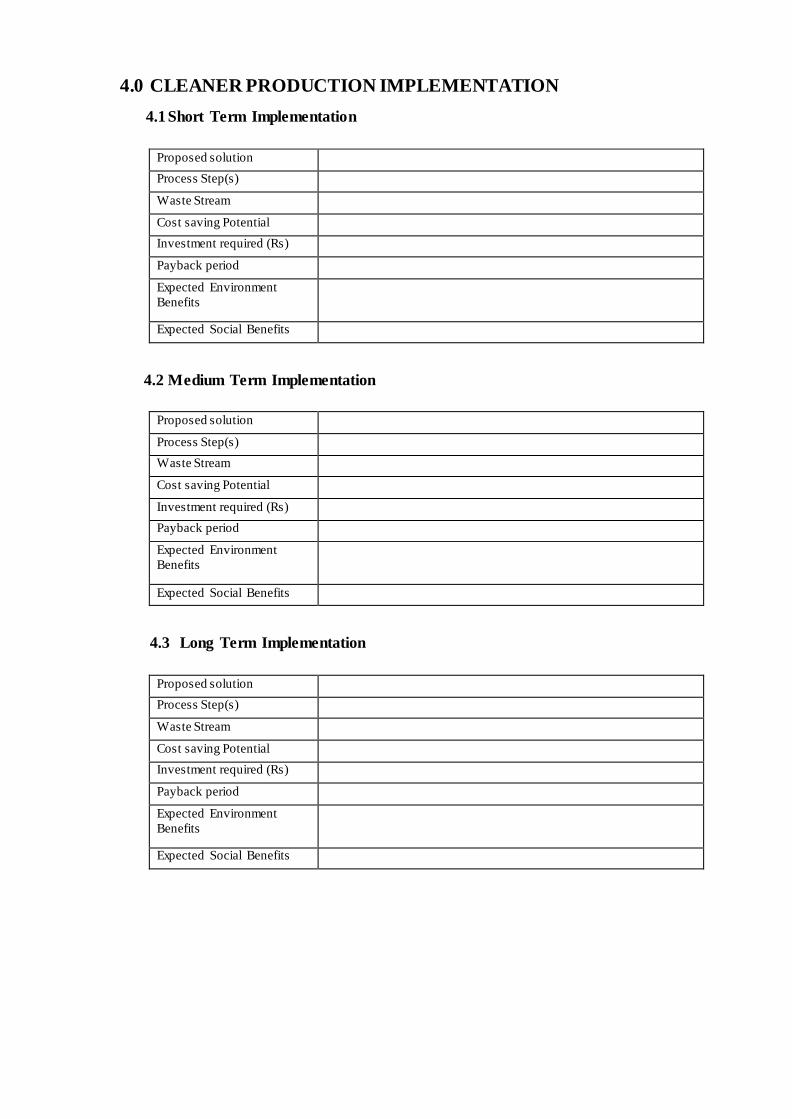
4.0 CLEANER PRODUCTION IMPLEMENTATION
4.1 Short Term Implementation
Proposed solution Process Step(s) Waste Stream Cost saving Potential Investment required (Rs) Payback period Expected Environment
Benefits
Expected Social Benefits
4.2 Medium Term Implementation
Proposed solution Process Step(s) Waste Stream Cost saving Potential Investment required (Rs) Payback period Expected Environment
Benefits
Expected Social Benefits
4.3 Long Term Implementation
Proposed solution Process Step(s) Waste Stream Cost saving Potential Investment required (Rs) Payback period Expected Environment
Benefits
Expected Social Benefits

5.0 CONCLUSION


![CR-1 : @TAWAS B LIB.TAWAS B(SCH 1):PAGE1 TAWASnotebookschematic.org/data/NOTEBOOK/attachments/SC... · resume gp[6] gp[7] gp[8] gp[9] 3.3v 3.3v 3.3v 3.3v gp[23] gp[24] gp[25] gp[26]](https://img.pdfslide.us/doc/110x75/5f812ff679030c23f20de0bd/cr-1-tawas-b-libtawas-bsch-1page1-ta-resume-gp6-gp7-gp8-gp9-33v.jpg)