Embed Size (px)
Citation preview

Blue Energy: a new opportunity
Focus offshore wind energy
Pieter Jan Jordaens, Oostende
28 november 2012
www.owi-lab.be
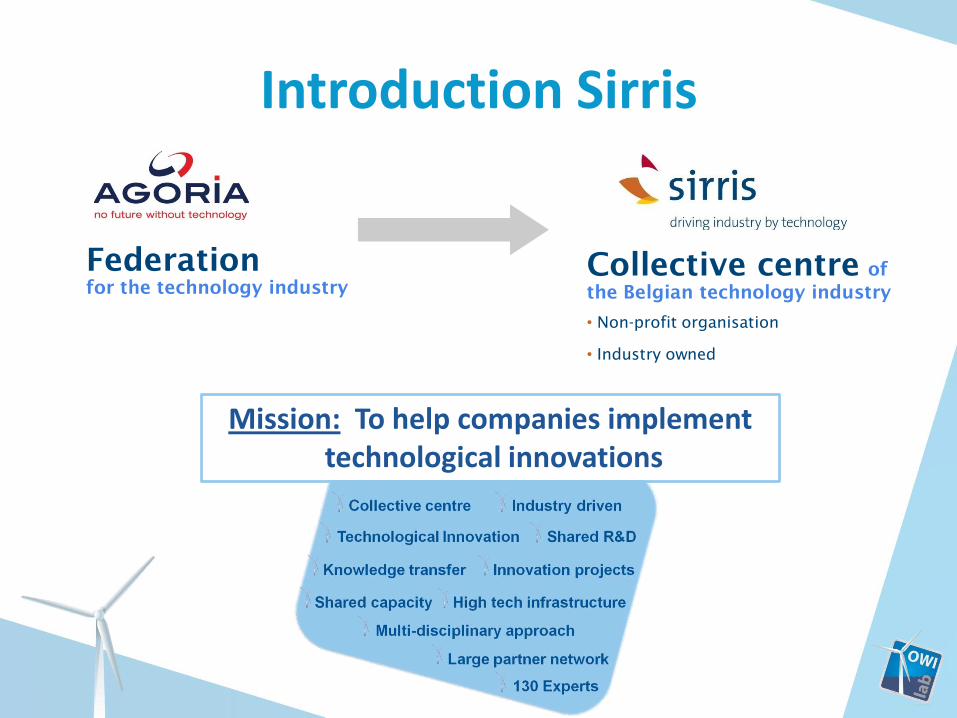
Introduction Sirris
Federation
for the technology industry
Collective centre of
the Belgian technology industry
• Non-profit organisation
• Industry owned
Mission: To help companies implement technological innovations
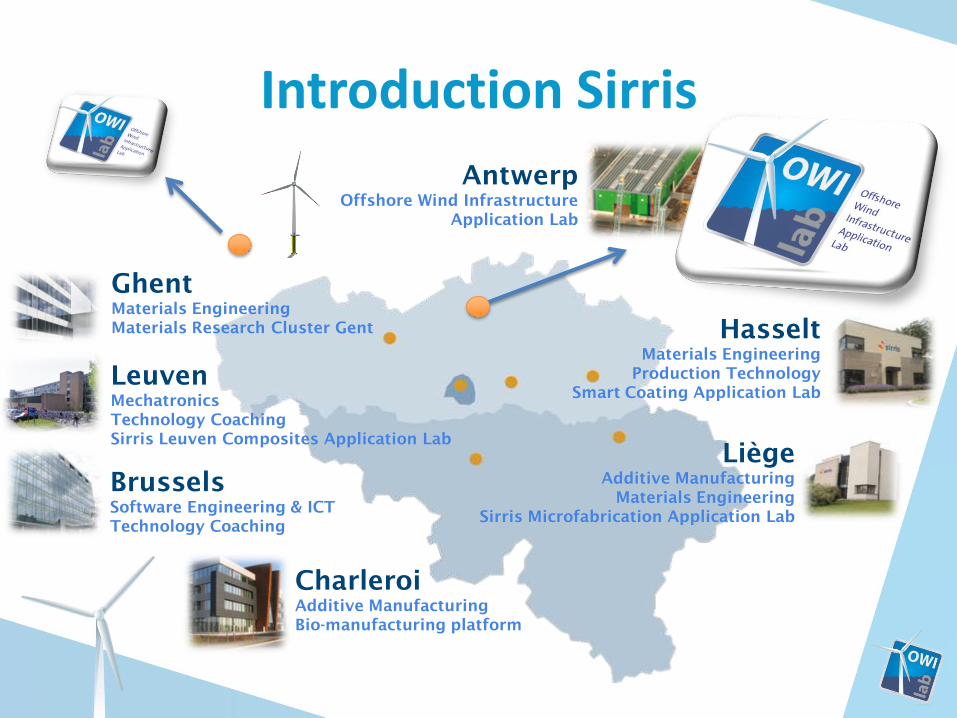
Introduction Sirris
Leuven
Mechatronics
Technology Coaching
Sirris Leuven Composites Application Lab
Hasselt
Materials Engineering
Production Technology
Smart Coating Application Lab
Charleroi
Additive Manufacturing
Bio-manufacturing platform
Brussels
Software Engineering & ICT
Technology Coaching
Ghent
Materials Engineering
Materials Research Cluster Gent
Liège
Additive Manufacturing
Materials Engineering
Sirris Microfabrication Application Lab
Antwerp
Offshore Wind Infrastructure
Application Lab

4th Sirris Application Lab: OWI-Lab
Sirris Leuven-Gent Composites Application Lab
Sirris Microfabrication Application Lab
Sirris Smart Coating Application Lab
Offshore Wind Infrastructure Application Lab
“The Sirris Application labs focus on technological
themes that will be crucial for the future of our companies
in the coming years”.

DATA (Processed)
Offering OWI-Lab
Test & Monitoring Infrastructure
Test & Measurement
services
(Raw)
DATA
Information &
insights
Knowledge • Design purpose (CAPEX)
• O&M purpose (OPEX)
• Higher energy yield

Drivers in wind energy Wind Energy: Onshore
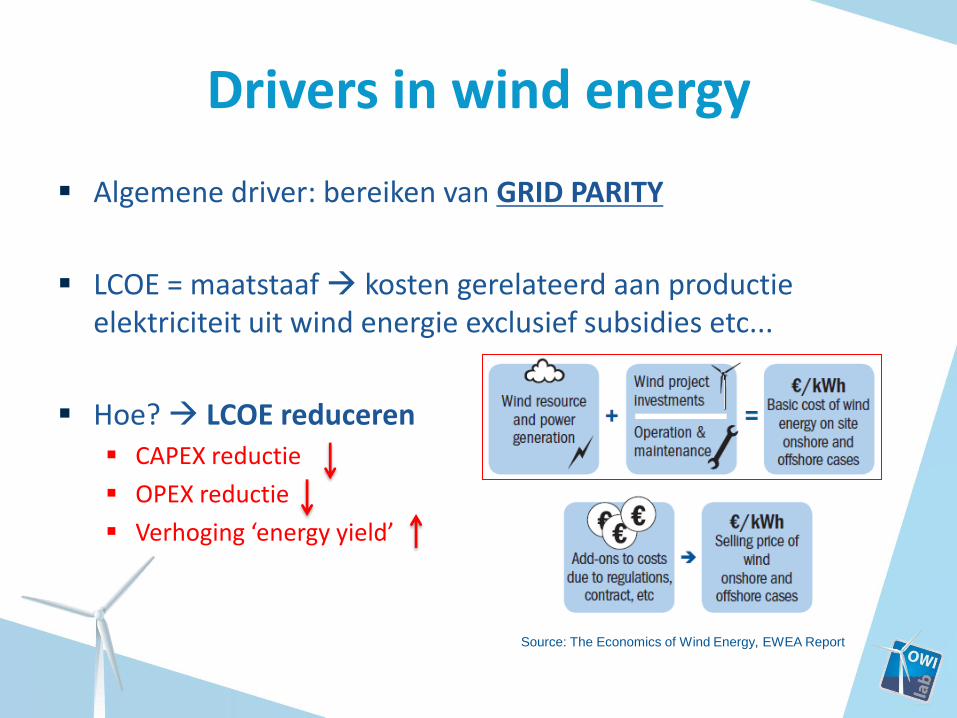
Drivers in wind energy
Algemene driver: bereiken van GRID PARITY
LCOE = maatstaaf kosten gerelateerd aan productie elektriciteit uit wind energie exclusief subsidies etc...
Hoe? LCOE reduceren CAPEX reductie
OPEX reductie
Verhoging ‘energy yield’
Source: The Economics of Wind Energy, EWEA Report
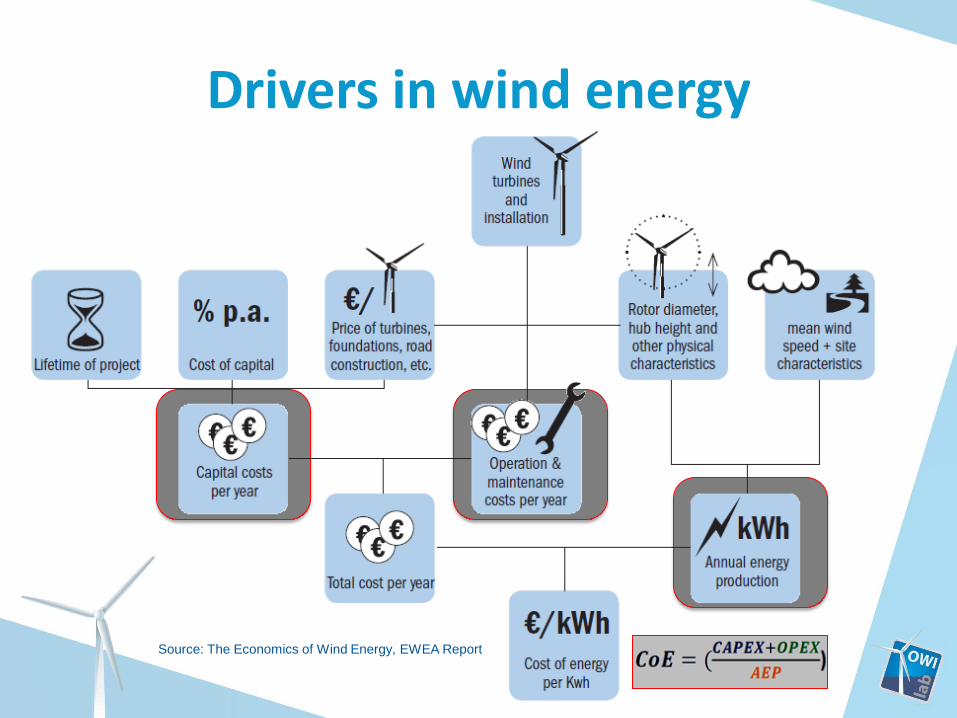
Drivers in wind energy
Source: The Economics of Wind Energy, EWEA Report
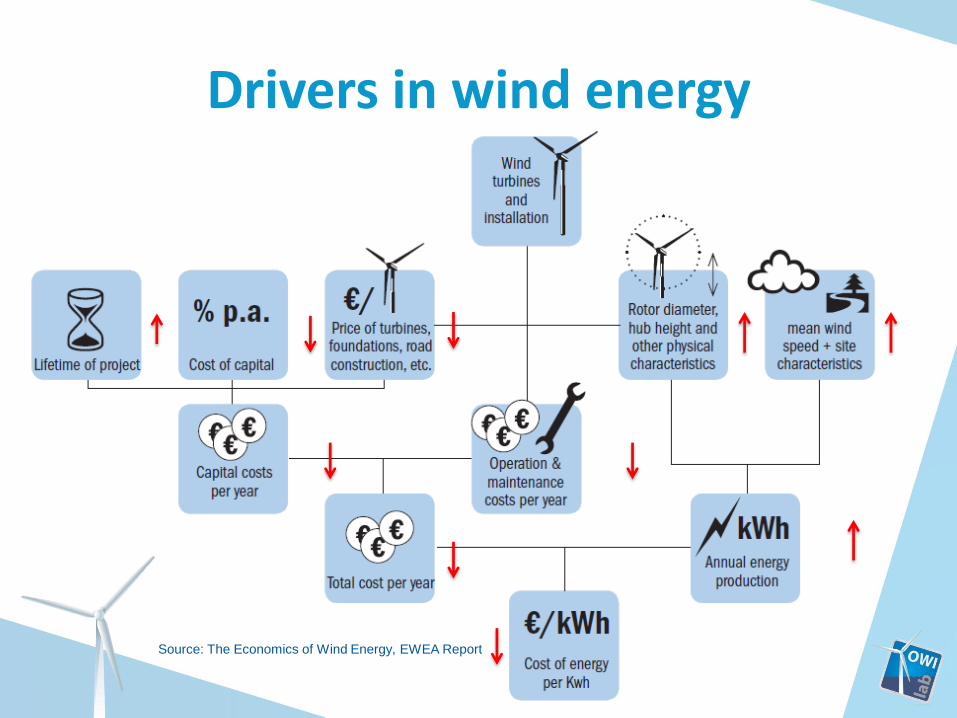
Drivers in wind energy
Source: The Economics of Wind Energy, EWEA Report

Wind Energy: Onshore
LCOE in ONSHORE wind is laatste jaren enorm gedaald en zal nog verder dalen! Doelstelling = ±40-50 €/MWh
Verwacht: 12% extra reductie in LCOE de komende 5 jaar (Bloomberg New Energy Finance 2011)
Sommige onshore wind farm zijn nu al concurrentieel met gascentrales als men CO2 kosten mee in rekening neemt.
Afh. van de wind kwaliteit op de locatie
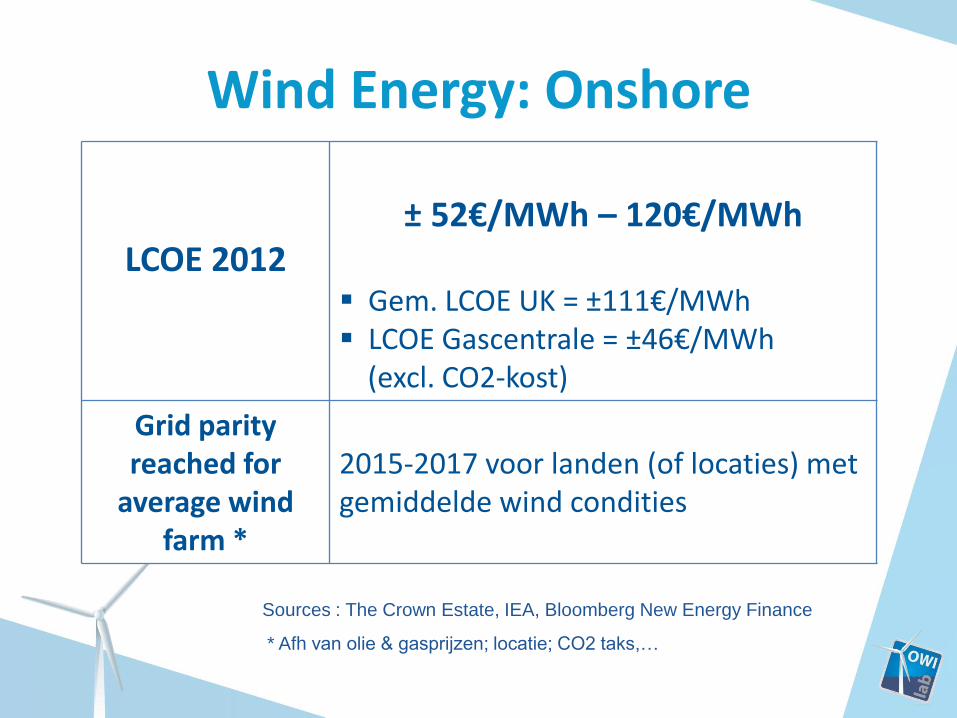
Wind Energy: Onshore
LCOE 2012
± 52€/MWh – 120€/MWh
Gem. LCOE UK = ±111€/MWh LCOE Gascentrale = ±46€/MWh (excl. CO2-kost)
Grid parity reached for
average wind farm *
2015-2017 voor landen (of locaties) met gemiddelde wind condities
* Afh van olie & gasprijzen; locatie; CO2 taks,…
Sources : The Crown Estate, IEA, Bloomberg New Energy Finance

ONSHORE VS OFFSHORE LCOE Offshore wind energy Challenges in offshore wind energy Offshore wind energy market Cost reduction pathways Technological evolution
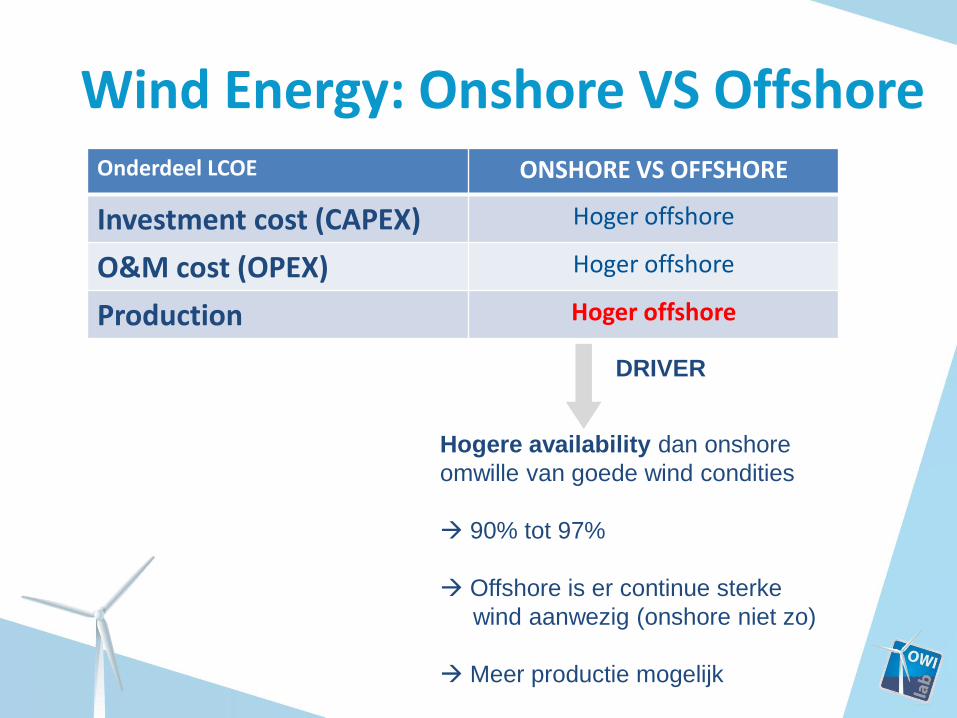
Wind Energy: Onshore VS Offshore
Onderdeel LCOE ONSHORE VS OFFSHORE
Investment cost (CAPEX) Hoger offshore
O&M cost (OPEX) Hoger offshore
Production Hoger offshore
Hogere availability dan onshore
omwille van goede wind condities
90% tot 97%
Offshore is er continue sterke
wind aanwezig (onshore niet zo)
Meer productie mogelijk
DRIVER
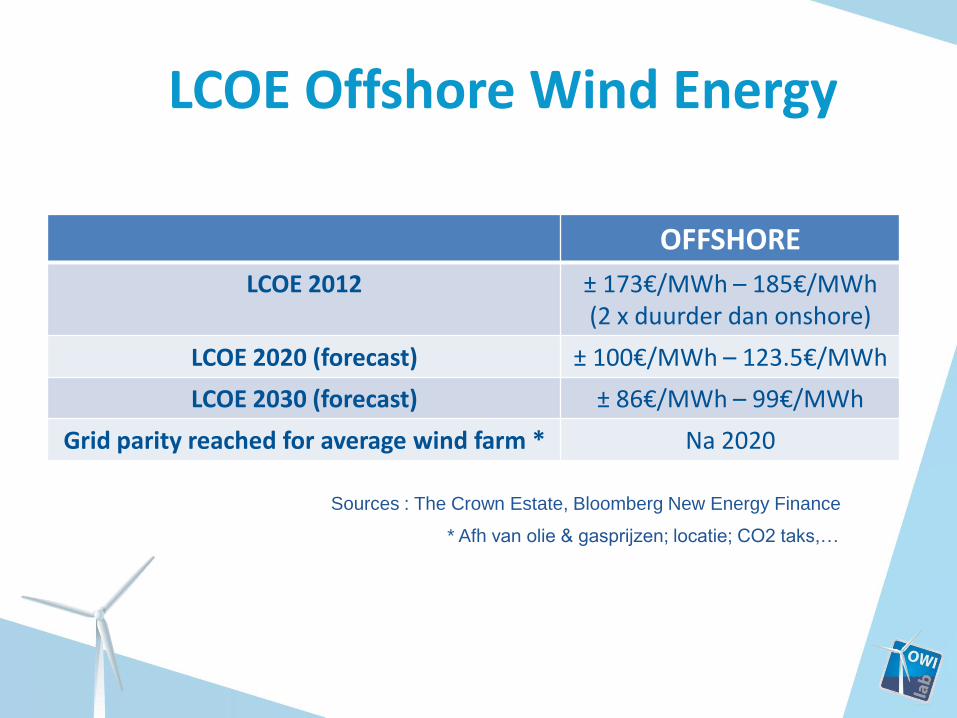
LCOE Offshore Wind Energy
OFFSHORE
LCOE 2012 ± 173€/MWh – 185€/MWh (2 x duurder dan onshore)
LCOE 2020 (forecast) ± 100€/MWh – 123.5€/MWh
LCOE 2030 (forecast) ± 86€/MWh – 99€/MWh
Grid parity reached for average wind farm * Na 2020
* Afh van olie & gasprijzen; locatie; CO2 taks,…
Sources : The Crown Estate, Bloomberg New Energy Finance
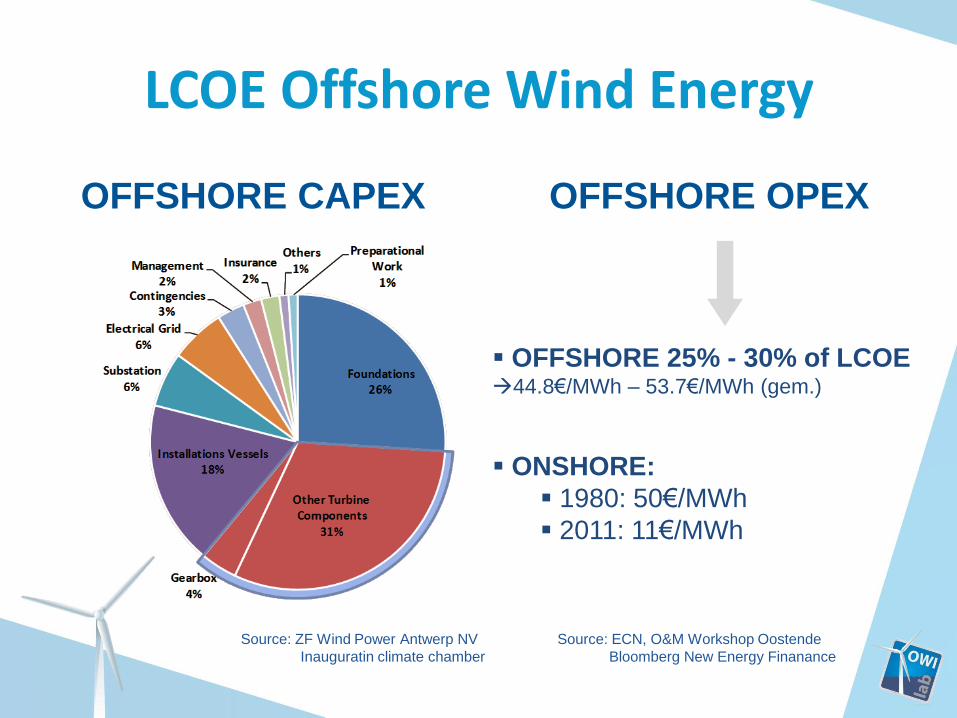
LCOE Offshore Wind Energy
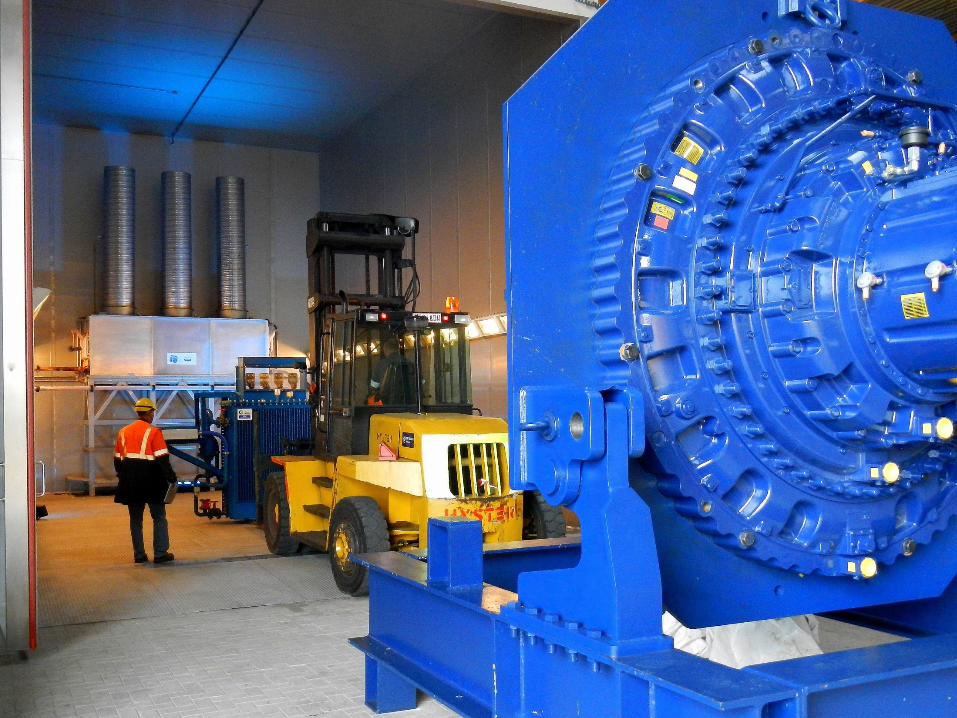
OFFSHORE CAPEX
Source: ZF Wind Power Antwerp NV
Inauguratin climate chamber
OFFSHORE OPEX
OFFSHORE 25% - 30% of LCOE 44.8€/MWh – 53.7€/MWh (gem.)
ONSHORE:
1980: 50€/MWh
2011: 11€/MWh
Source: ECN, O&M Workshop Oostende
Bloomberg New Energy Finanance
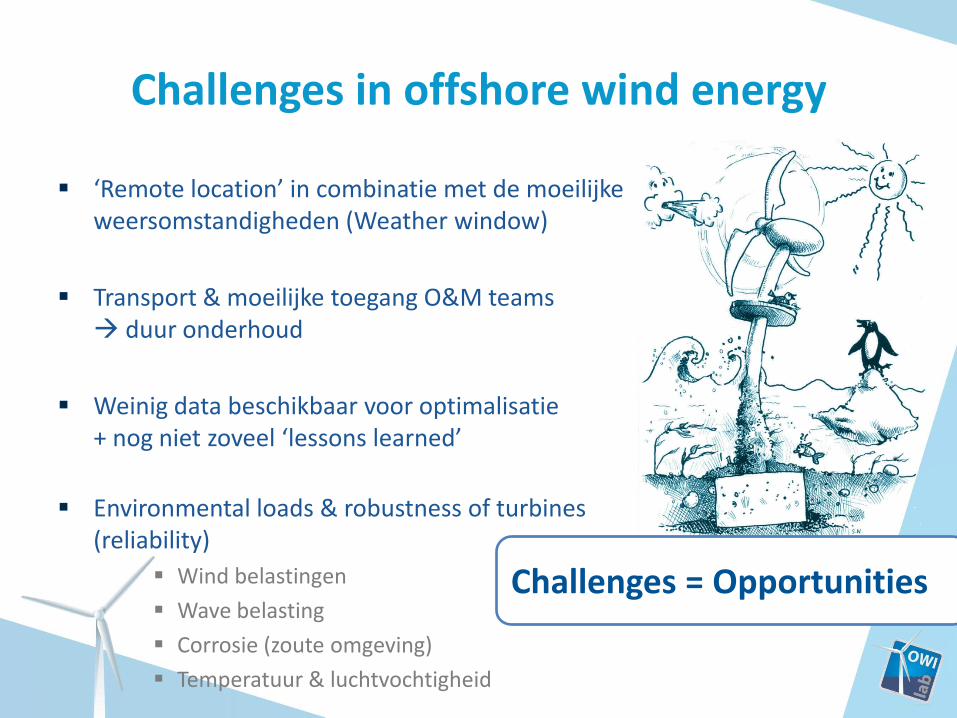
Challenges in offshore wind energy
‘Remote location’ in combinatie met de moeilijke weersomstandigheden (Weather window)
Transport & moeilijke toegang O&M teams duur onderhoud
Weinig data beschikbaar voor optimalisatie + nog niet zoveel ‘lessons learned’
Environmental loads & robustness of turbines (reliability)
Wind belastingen
Wave belasting
Corrosie (zoute omgeving)
Temperatuur & luchtvochtigheid
Challenges = Opportunities
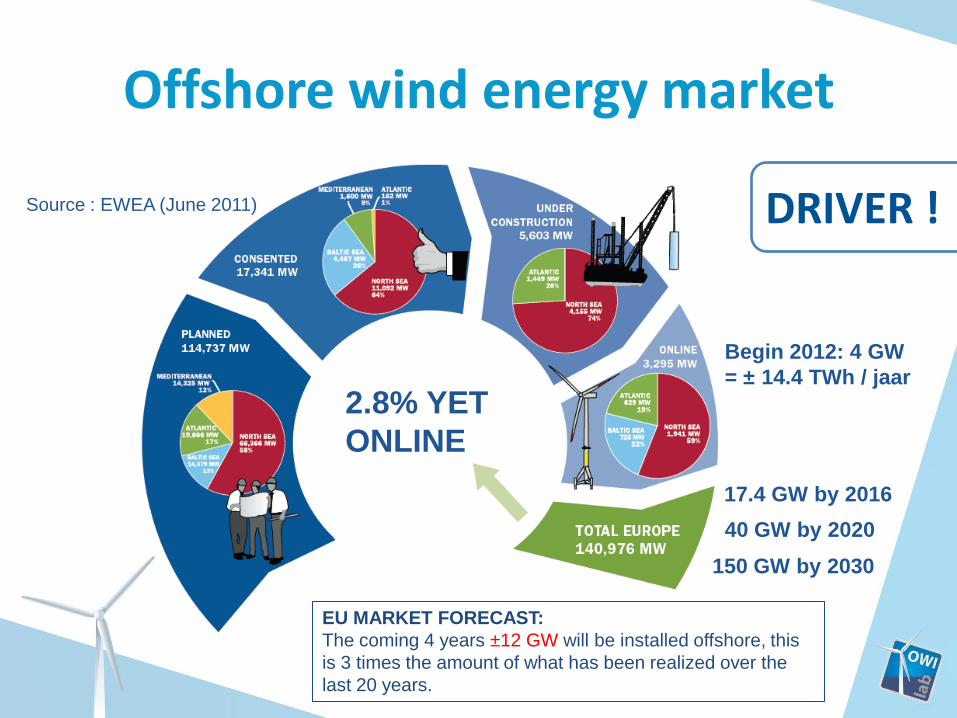
Offshore wind energy market
Source : EWEA (June 2011)
Begin 2012: 4 GW
= ± 14.4 TWh / jaar
2.8% YET
ONLINE
EU MARKET FORECAST:
The coming 4 years ±12 GW will be installed offshore, this
is 3 times the amount of what has been realized over the
last 20 years.
40 GW by 2020
150 GW by 2030
17.4 GW by 2016
DRIVER !

Cost reduction pathways
Development & Design Installation O&M Decommissioning
Improved reliability for
turbines & components
• Advanced testing
• New standards
• New drivetrain topologies
Improved accessibility
to turbine for O&M team Extend lifetime
(health assessment)
Retro-fits
Offshore wind farm life-cycle
Better availability
of vessels and
crane ships
New installation
tools & concepts
Reduce downtime and
increase energy
production with
decision support tools
(OPEX cost modeling)
and Improved
monitoring technology
for health diagnostics:
• CMS
• SHM
Improved efficiency through
better siting of wind farms
(resource assessment,
advanced models,…)
Bigger wind turbines (scale
factor) & larger blades for
more yield Multi-MW Advanced weather
forecasting
Advanced weather
forecasting
Dedicated offshore
wind installation
hubs close to sea
O&M service hubs
with close access to
wind farms
Weight reduction
… … …

Cost reduction pathways
Development & Design Installation O&M Decommissioning
Offshore wind farm life-cycle
CAPEX REDUCTION
&
OPEX REDUCTION
&
INCREASED ENERGY YIELD
CAPEX REDUCTION OPEX REDUCTION
&
INCREASED ENERGY
YIELD
INCREASED ENERGY
YIELD

Technological evolution
TIME
Fluid phase Growth phase Maturity phase
Degree of technological maturity
and deployment of potential
Creation of new
Technology with base
performance ;
new industry opportunity
Evolution of
successive new
technologies and industries
(Industrial R&D)
Infancy stage were major
problems occur; opportunities
for optimization & need for basic R&D
Performance index
of the system reaches physical limits
Previous technological
evolution
S-CURVE Technological life cycles
New technology needed
for further development
(radical innovation)
Aging phase Technology completely understood.
Research can be directed towards specific needs.
Utilization becomes routine.
Technological evolution
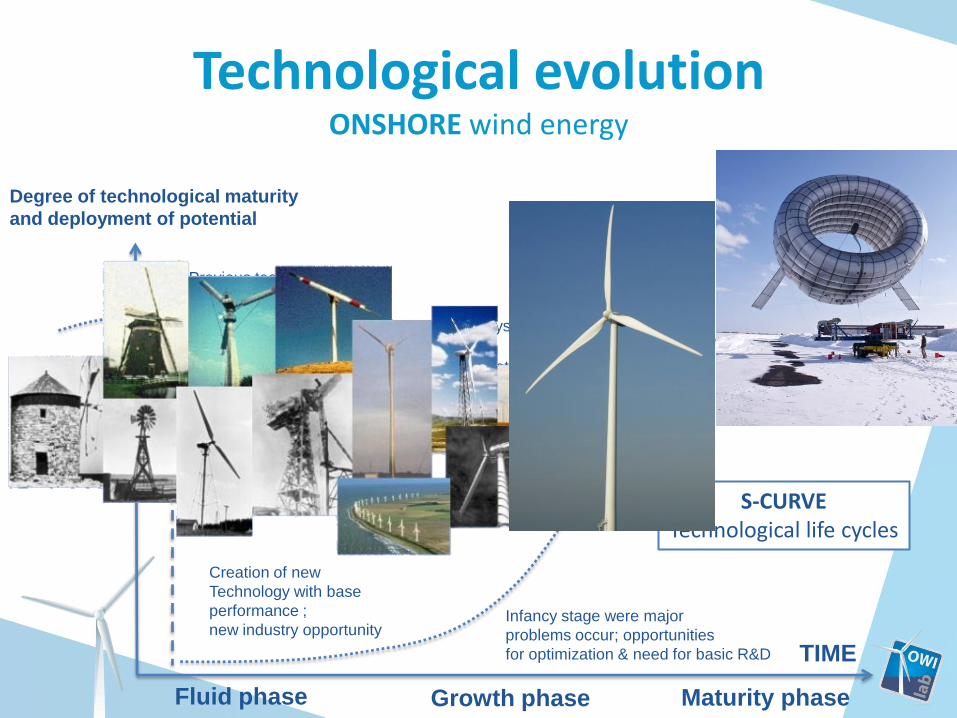
Technological evolution ONSHORE wind energy
TIME
Fluid phase Growth phase Maturity phase
Degree of technological maturity
and deployment of potential
Creation of new
Technology with base
performance ;
new industry opportunity
Evolution of
successive new
technologies and industries
(Industrial R&D)
Infancy stage were major
problems occur; opportunities
for optimization & need for basic R&D
Performance index
of the system reaches physical limits
Previous technological
evolution
S-CURVE Technological life cycles
New technology needed
for further development
(radical innovation)
Aging phase Technology completely understood.
Research can be directed towards specific needs.
Utilization becomes routine.
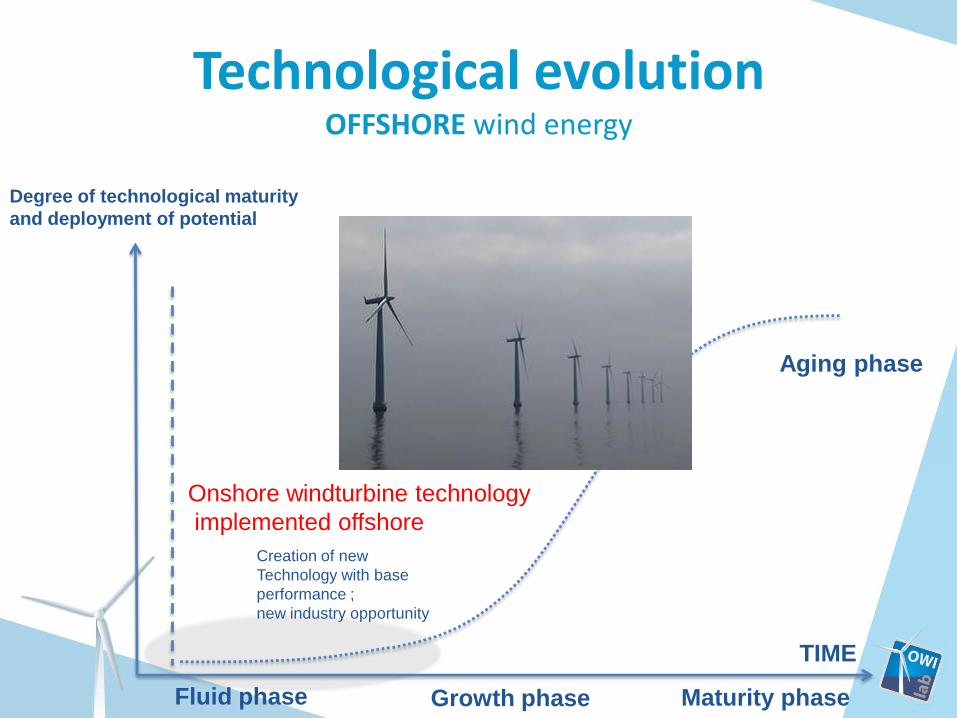
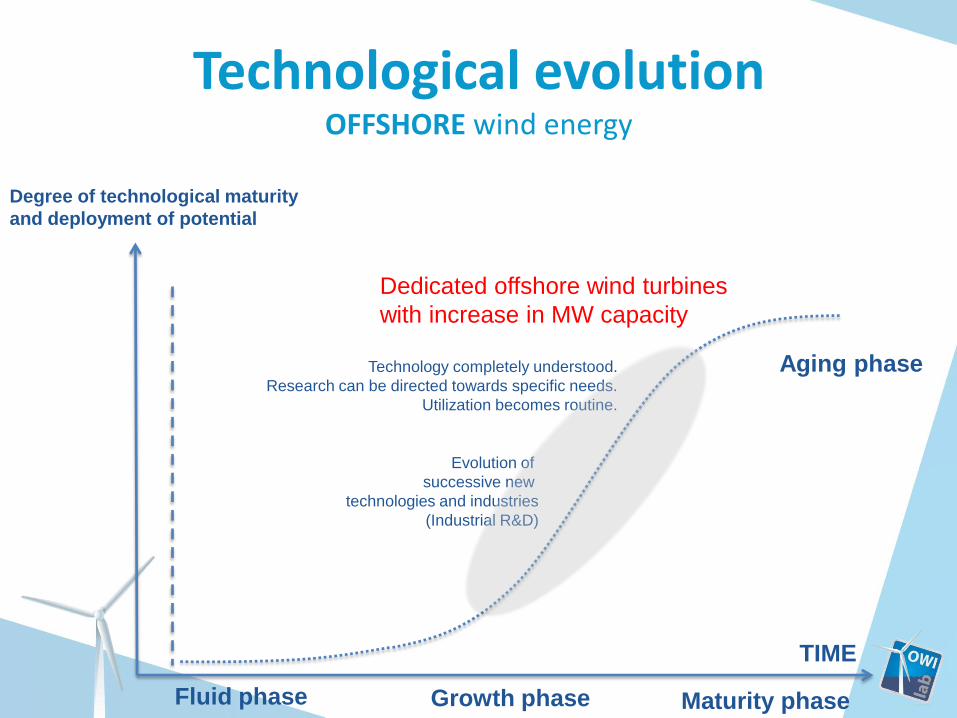
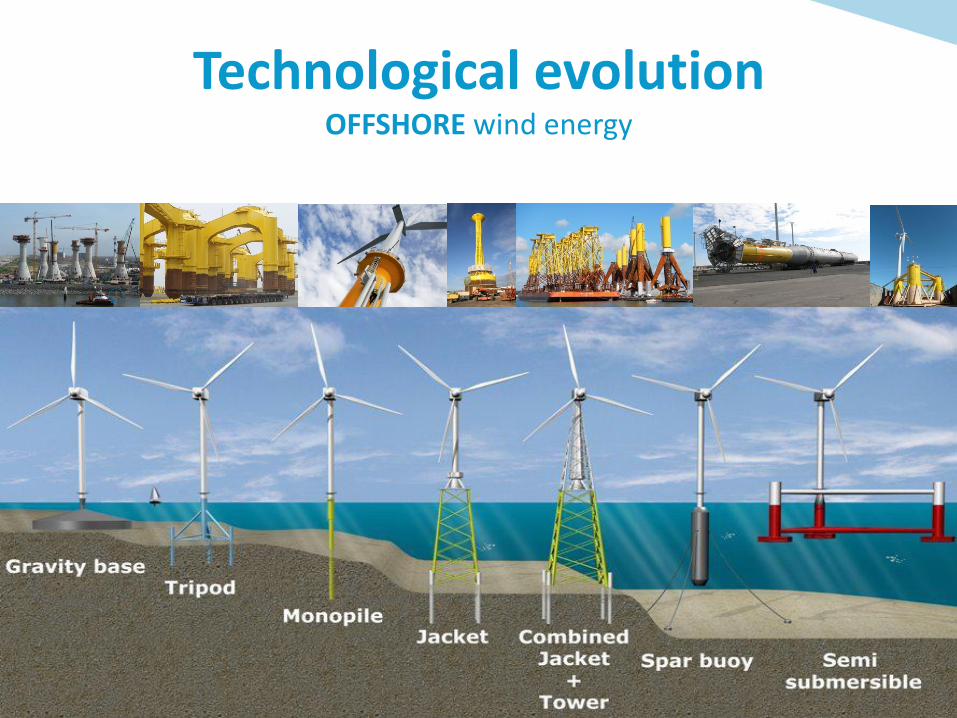
Technological evolution OFFSHORE wind energy
TIME
Fluid phase Growth phase Maturity phase
Degree of technological maturity
and deployment of potential
Creation of new
Technology with base
performance ;
new industry opportunity
Aging phase
Onshore windturbine technology
implemented offshore
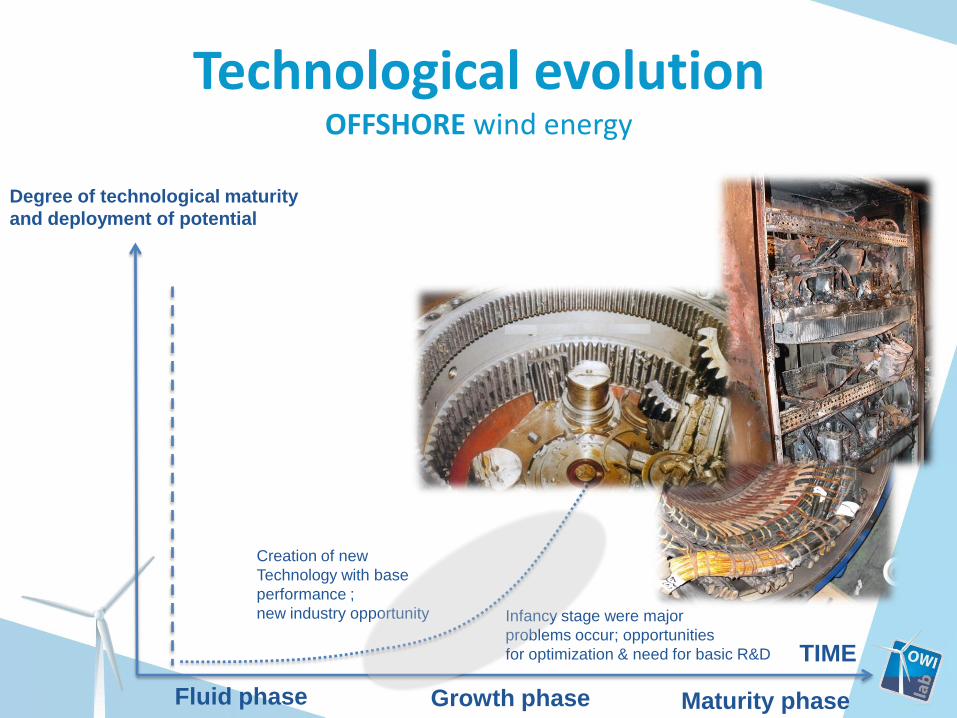
Technological evolution OFFSHORE wind energy
TIME
Fluid phase Growth phase Maturity phase
Degree of technological maturity
and deployment of potential
Creation of new
Technology with base
performance ;
new industry opportunity Infancy stage were major
problems occur; opportunities
for optimization & need for basic R&D
Aging phase
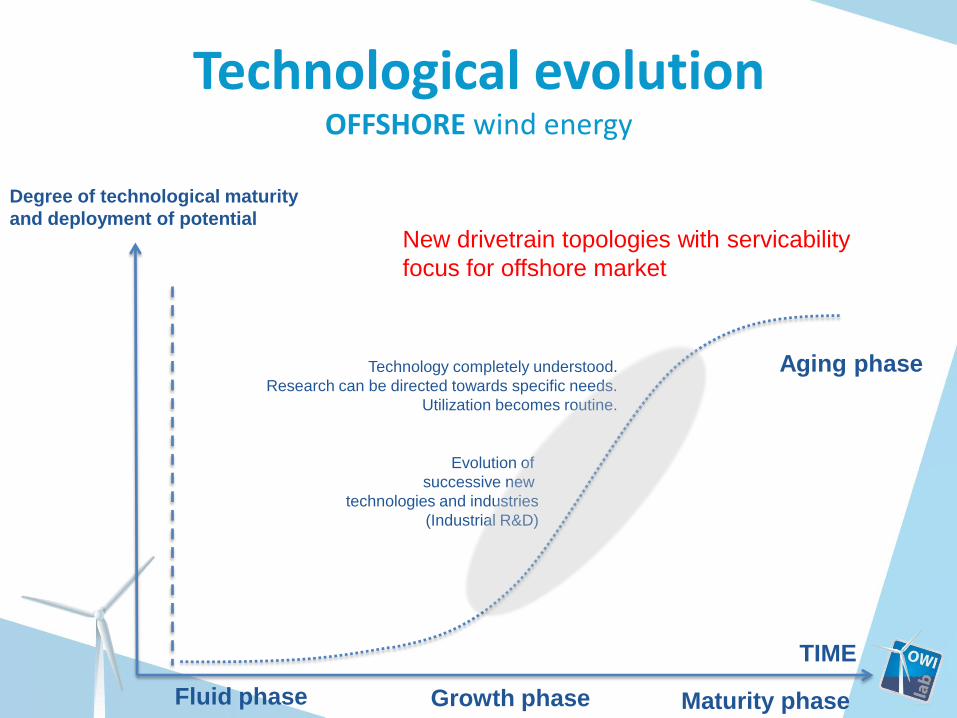
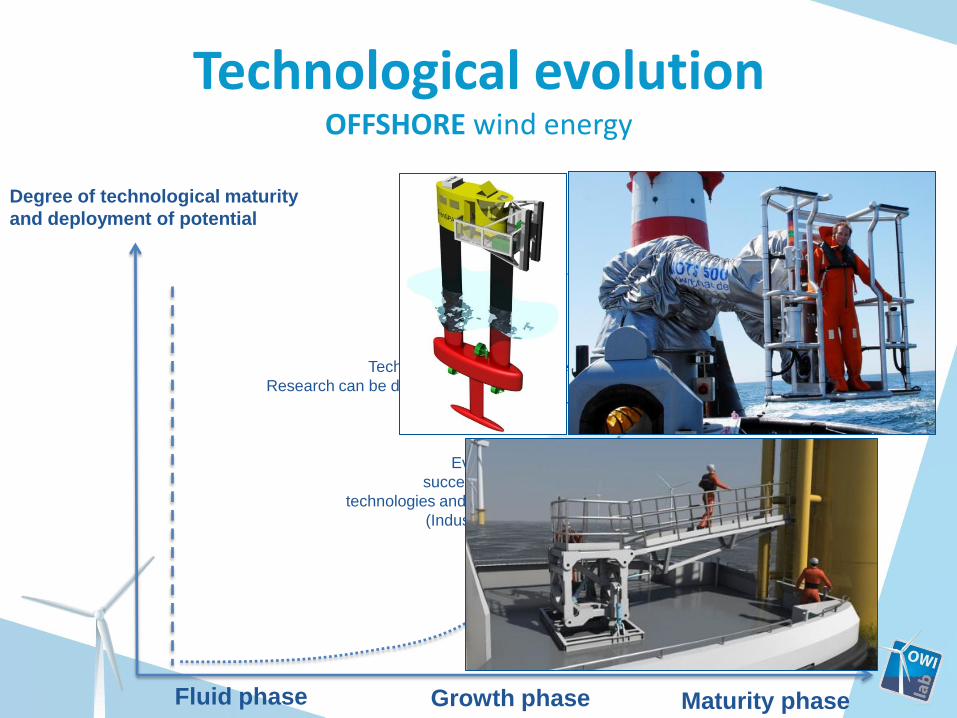
Technological evolution OFFSHORE wind energy
TIME
Fluid phase Growth phase Maturity phase
Degree of technological maturity
and deployment of potential
Evolution of
successive new
technologies and industries
(Industrial R&D)
Aging phase Technology completely understood.
Research can be directed towards specific needs.
Utilization becomes routine.
New drivetrain topologies with servicability
focus for offshore market
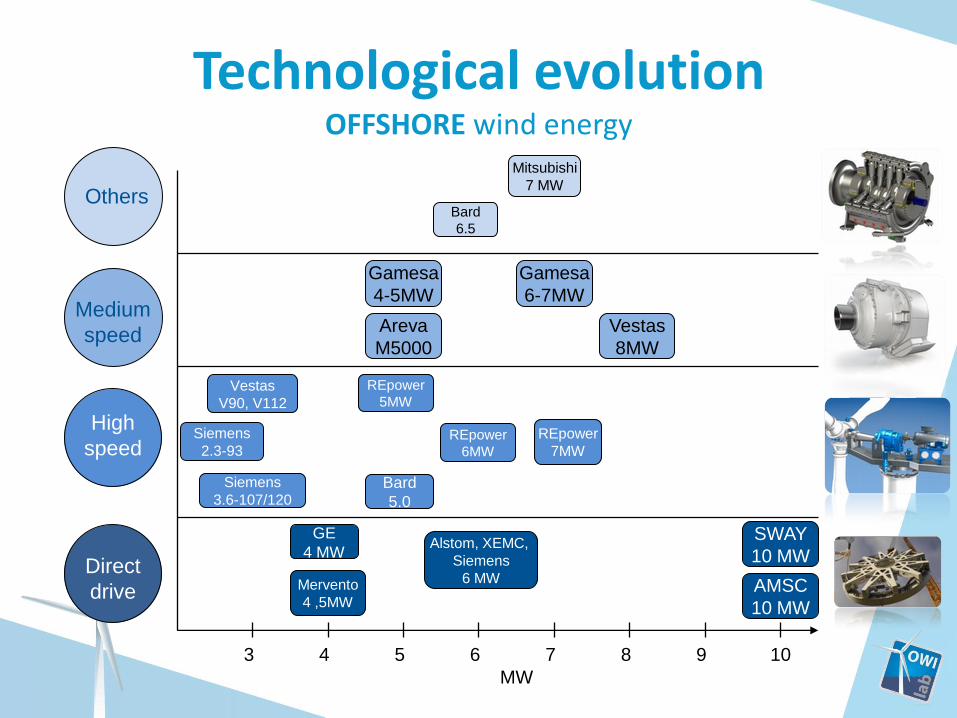
Technological evolution OFFSHORE wind energy
3 4 5 6 7 8 9 10
MW
Direct
drive
High
speed
Medium
speed
Others
Siemens
3.6-107/120
Siemens
2.3-93
Alstom, XEMC,
Siemens
6 MW
GE
4 MW
AMSC
10 MW
Gamesa
6-7MW
Vestas
8MW
Gamesa
4-5MW
Vestas
V90, V112
REpower
5MW
REpower
6MW
Bard
5.0
Bard
6.5
Mitsubishi
7 MW
Areva
M5000
SWAY
10 MW
Mervento
4 ,5MW
REpower
7MW
Technological evolution OFFSHORE wind energy
TIME
Fluid phase Growth phase Maturity phase
Degree of technological maturity
and deployment of potential
Evolution of
successive new
technologies and industries
(Industrial R&D)
Aging phase Technology completely understood.
Research can be directed towards specific needs.
Utilization becomes routine.
Dedicated offshore wind turbines
with increase in MW capacity

Technological evolution OFFSHORE wind energy
36 8 3 10
Vestas, Siemens,Gamesa, Alstom, GE, Nordex, Repower, Areva, BARD, Daewoo, Dongfang,
Doosan, Sinovel, 2-B Energy, Mitsubishi, Mervento, Goldwind, Guodian, Hitachi, Hyundai,
Hyosung, Mingyang, Samsung, Shanghai Elec.,Toshiba, STX, WinWind, XEMC, Sany, …
Technological evolution OFFSHORE wind energy
Technological evolution OFFSHORE wind energy
TIME
Fluid phase Growth phase Maturity phase
Degree of technological maturity
and deployment of potential
Evolution of
successive new
technologies and industries
(Industrial R&D)
Aging phase Technology completely understood.
Research can be directed towards specific needs.
Utilization becomes routine.
Servicability focus
Technological evolution OFFSHORE wind energy
TIME
Fluid phase Growth phase Maturity phase
Degree of technological maturity
and deployment of potential
Evolution of
successive new
technologies and industries
(Industrial R&D)
Aging phase Technology completely understood.
Research can be directed towards specific needs.
Utilization becomes routine.
GRID-Connection
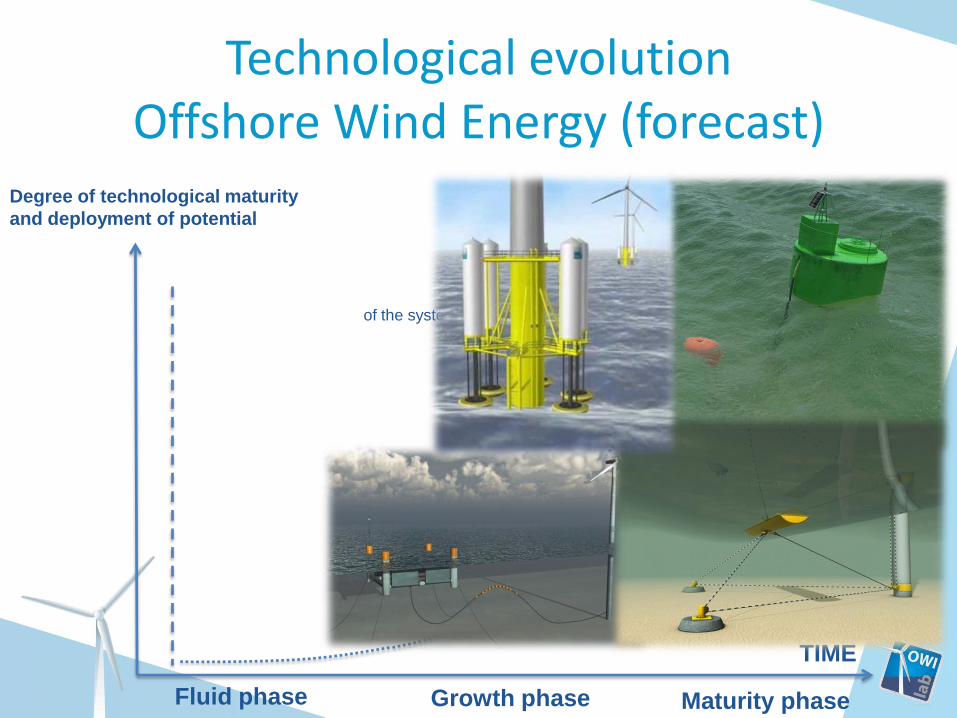
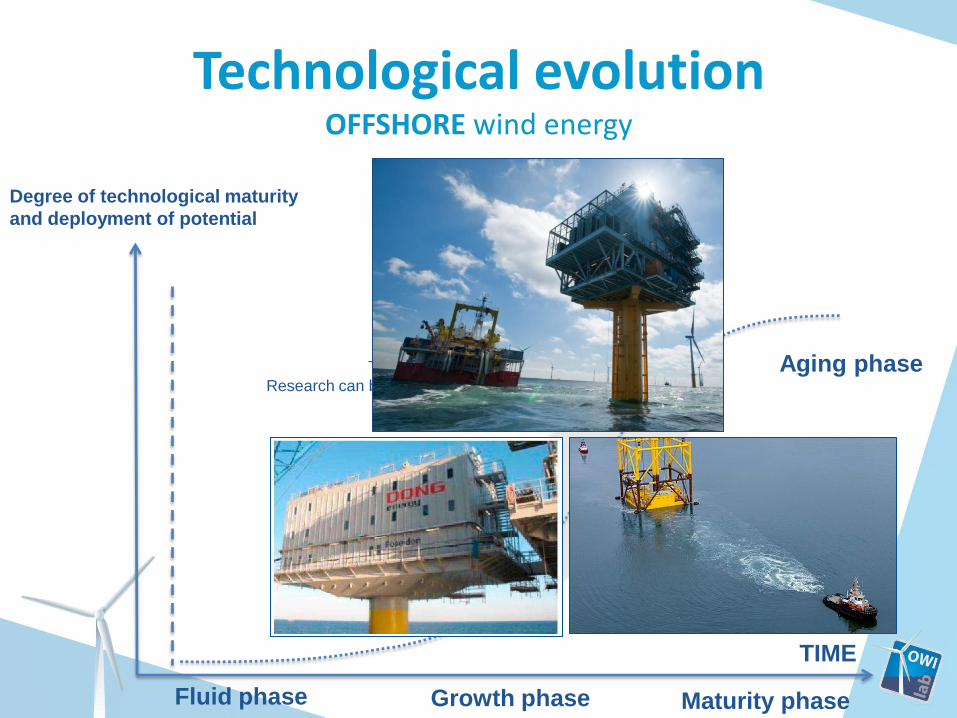
Technological evolution Offshore Wind Energy (forecast)
TIME
Fluid phase Growth phase Maturity phase
Degree of technological maturity
and deployment of potential
Performance index
of the system reaches physical limits
Aging phase
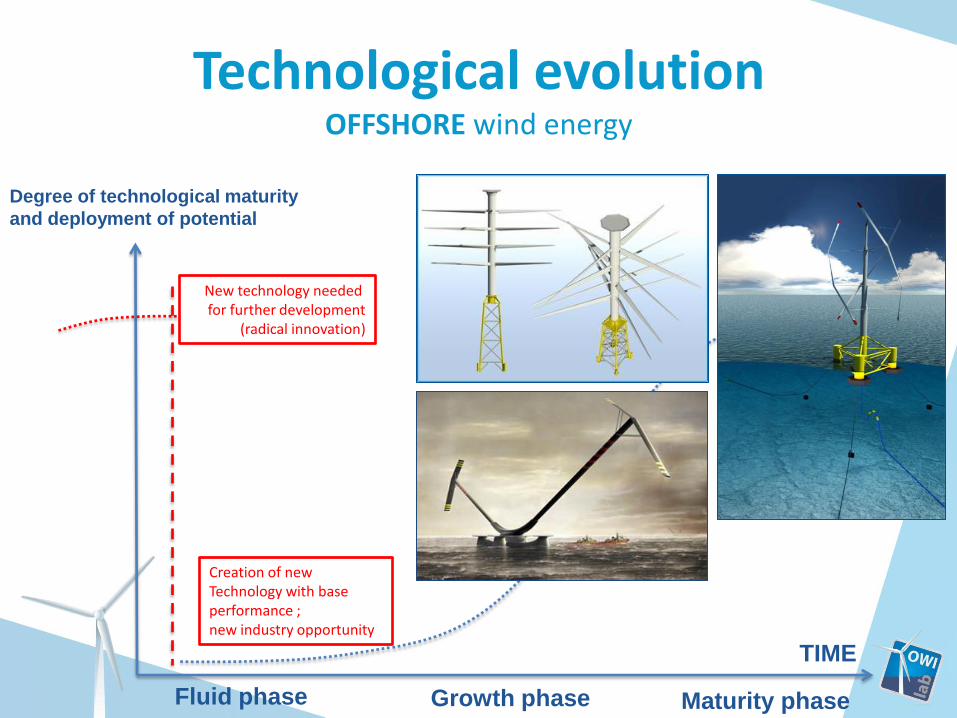
Technological evolution OFFSHORE wind energy
TIME
Fluid phase Growth phase Maturity phase
Degree of technological maturity
and deployment of potential
Creation of new Technology with base performance ; new industry opportunity
New technology needed for further development
(radical innovation)
Aging phase

Growing industrial involvement
Growing industrial involvement
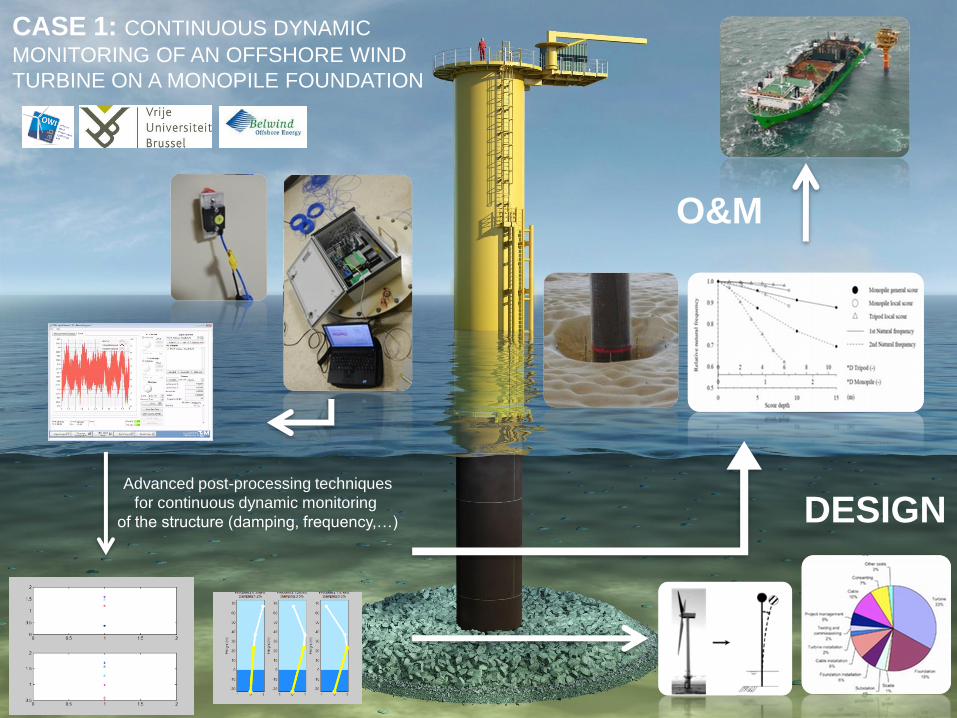
CASE 1: CONTINUOUS DYNAMIC
MONITORING OF AN OFFSHORE WIND
TURBINE ON A MONOPILE FOUNDATION
Advanced post-processing techniques
for continuous dynamic monitoring
of the structure (damping, frequency,…)
O&M
DESIGN

Need for more information?
Pieter Jan Jordaens
Project Leader
Mobile: +32/491 345382
Thank you for your attention!
http://www.owi-lab.be/
@OWI_lab
Group: Offshore Wind
Infrastructure
Application Lab
(OWI-Lab)