Embed Size (px)
Citation preview

Social Web @VU���2015
Final Student PresentationsLecturer: Lora Aroyo
The Network InstituteVU University Amsterdam

Student housing in Amsterdam
Group 1
Menno Nelis Rutger van Gennep Melanie van der Velde

The idea
- Finding a home in a new city can be difficult for students
- Provide an overview of the largest student houses and
their surroundings - Preferably even filter on certain types of venues such as
restaurants, bars or fitness centers

The idea
Red circles = existing student housing Blue circles = student housing in development

Used data sources - Amsterdam Open Data - Dataset that provides
DUWO/de Key available housing for students - Foursquare - Data on public venues
- Facebook - Likes of the venues
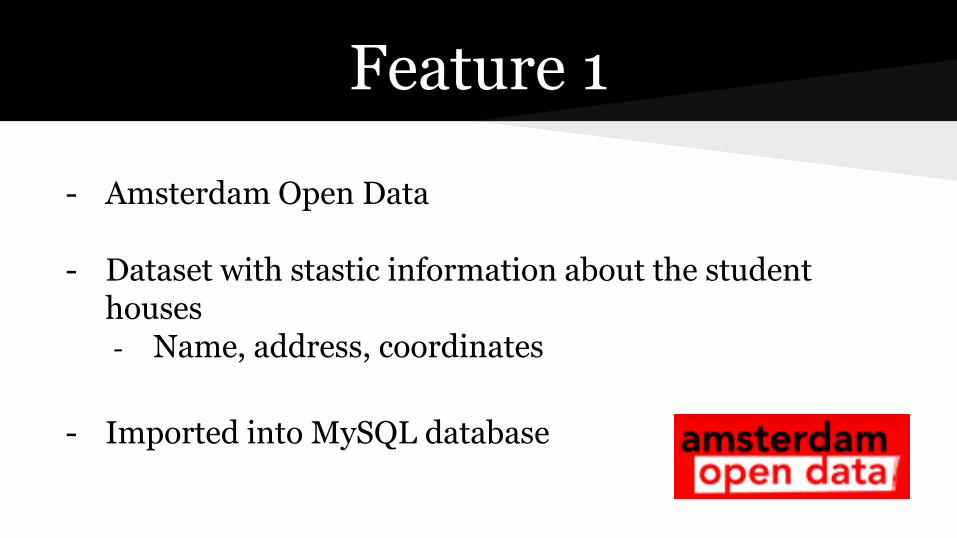
Feature 1 - Amsterdam Open Data
- Dataset with stastic information about the student
houses - Name, address, coordinates
- Imported into MySQL database

Feature 2 - Information extracted from Foursquare
- Search for venues based on coordinates from
Amsterdam Open Data dataset - Result is exported into a JSON file
- JSON is displayed on website
via Javascript or PHP

Feature 3 - Retrieve extra information from Facebook pages of the
student houses - Likes - Other information possible

Screenshots
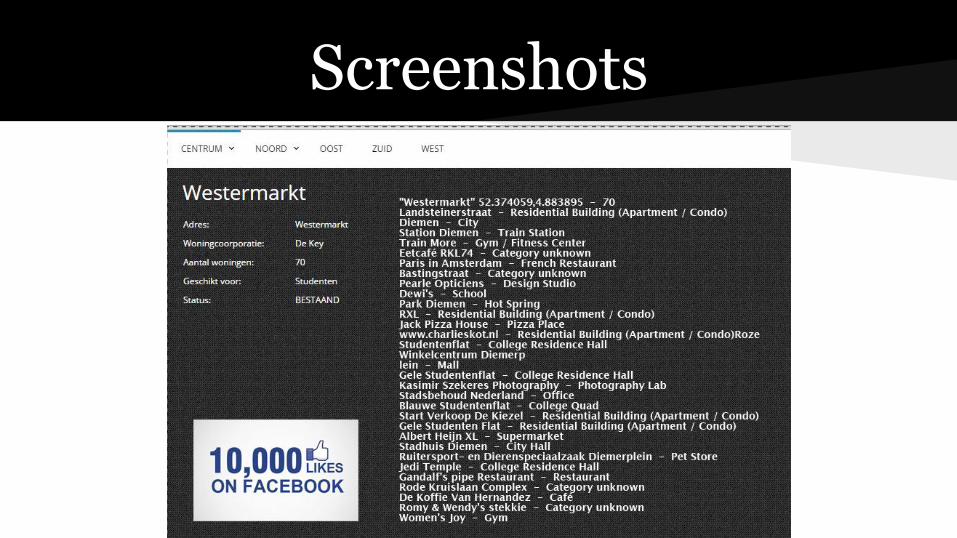
Screenshots

The GoTwi Grab BagJosephine Jessen, Roxane Lubbers & Arjan Vis
Group 2

Structure
The GoTwi Grab BagWorkflow of ApplicationSome screenshots AnalyseFutureIndividualQ&A

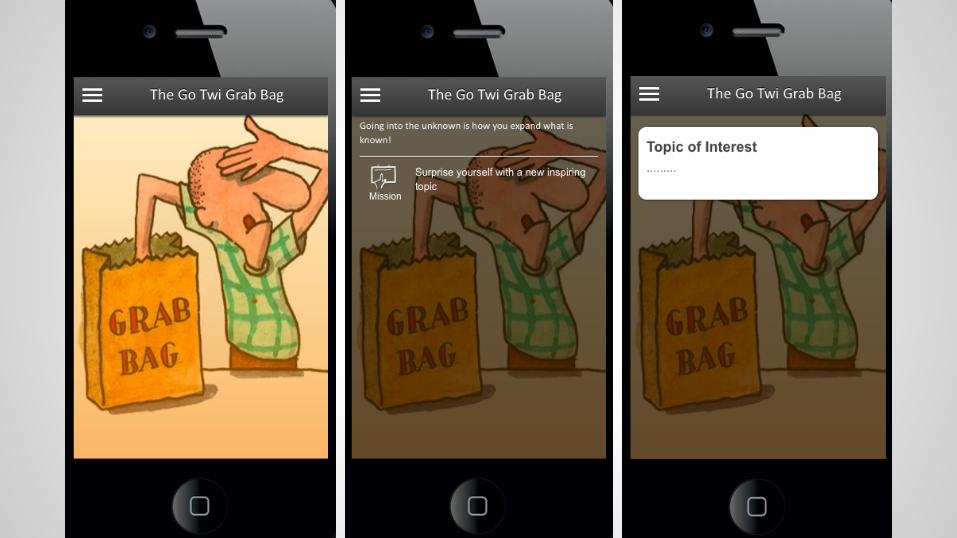
The GoTwi Grab Bag
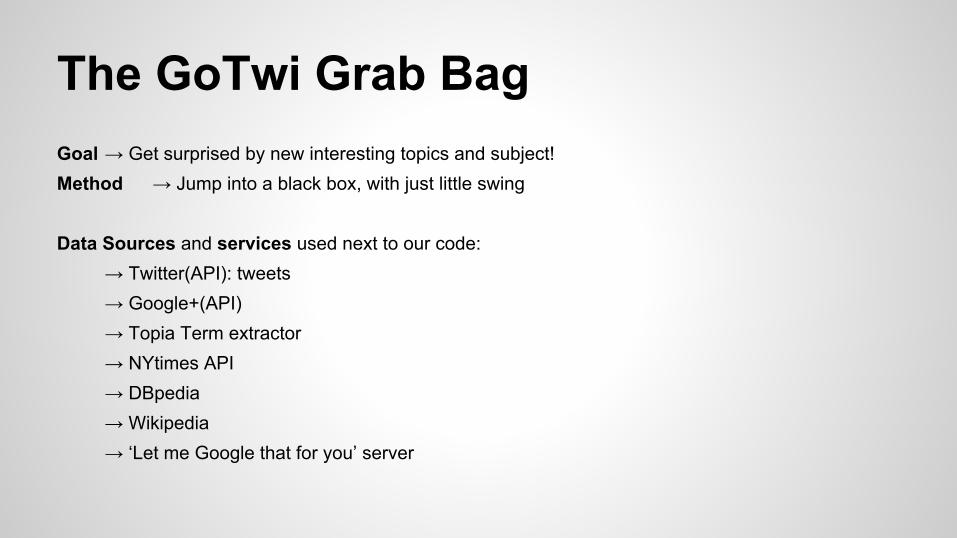
The GoTwi Grab BagGoal → Get surprised by new interesting topics and subject!Method → Jump into a black box, with just little swing
Data Sources and services used next to our code:→ Twitter(API): tweets → Google+(API)→ Topia Term extractor→ NYtimes API → DBpedia → Wikipedia→ ‘Let me Google that for you’ server

Workflow of the Application- Query a subject of your interest
- Retrieve 20 Popular Tweets (if less than 6 popular tweets, go to 20 recent tweets) + 20 Google+ Posts → One list is formed out of the Tweets and Google+ Posts
- Choose random one Tweet or G+Post → If Twitter, the timeline of the users account will be retrieved → If Google, the activity of user will be retrieved
- Randomly choose one Tweet/activity→ mine subjects, take one randomly → result: one new ‘inspiring’ subject→ subject links to DBpedia, wikipedia and 10 articles from the New York Times
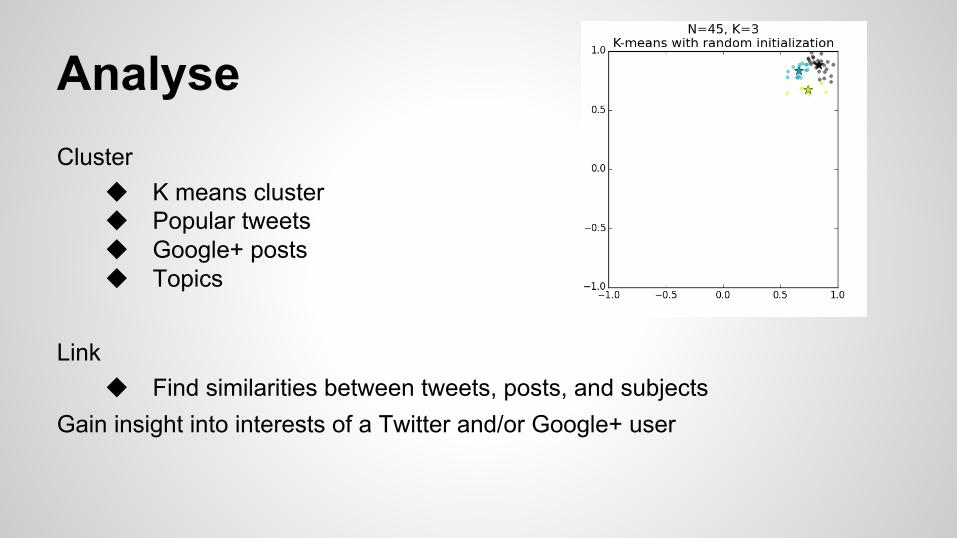
AnalyseCluster
◆ K means cluster ◆ Popular tweets ◆ Google+ posts◆ Topics
Link◆ Find similarities between tweets, posts, and subjects
Gain insight into interests of a Twitter and/or Google+ user
Individual: Josephine➔ Rationale: Surprise yourself with a new inspiring topic➔ Motivation: Let go of your structured search, through the
uncertainty you will invite new interesting topics out of your scope
➔ Evaluation: How ‘new’ are the subjects to the user ➔ Scoping: Is the new subject really new? Design of
application➔ Future work: Create a sort of loop, so the application
can see if the user is already familiar with the randomly chosen topic (and if so, take other topic etc.)
Individual: Roxane
➔ Rationale: Gain new insights with the topics you like
➔ Motivation: Meet new people with same interests
➔ Scoping: More user friendly ➔ Evaluation: How many users? ➔ Future work: Do clusters change over time?

Individual: Arjan
➔ Selecting random tweet / activity➔ Limitations: Number of tweets / activities that
can be retrieved➔ Evaluation: Usage of the app➔ Future work: Visualisation & tagging

Giada Binelli
Rio Essed Aydan Gasimova
Group 3
VU Amsterdam: Social Web 2015
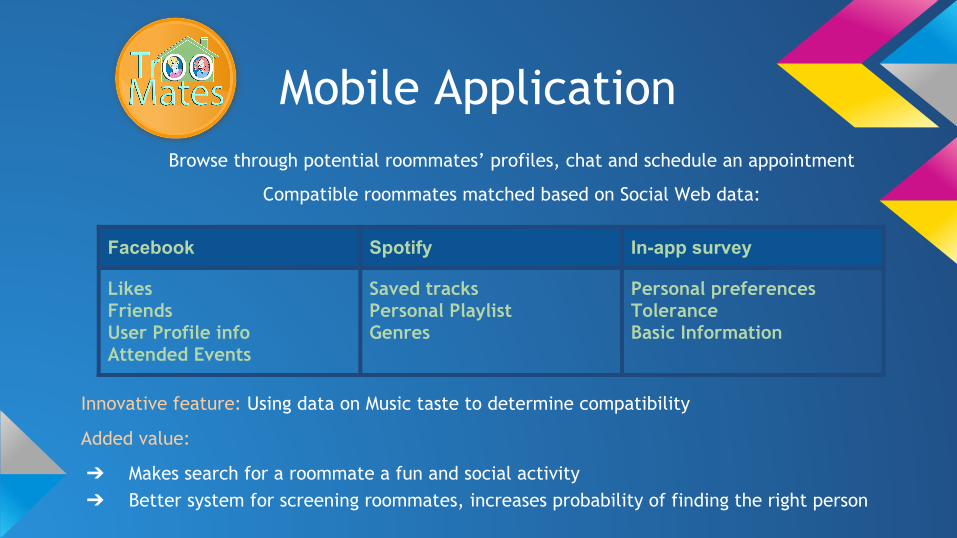
Mobile ApplicationBrowse through potential roommates’ profiles, chat and schedule an appointment
Compatible roommates matched based on Social Web data:
Facebook Spotify In-app survey
LikesFriendsUser Profile infoAttended Events
Saved tracksPersonal PlaylistGenres
Personal preferencesToleranceBasic Information
Innovative feature: Using data on Music taste to determine compatibility
Added value:
➔ Makes search for a roommate a fun and social activity ➔ Better system for screening roommates, increases probability of finding the right person


Data retrieval
Rationale: Wide range of data already available
Motivation: Enhance usability
Scoping: Retrieve user related data (basic info, events, pictures, likes etc) and friendlist
Evaluation: Check for similarity in data of attributes that co-occur in the different sources
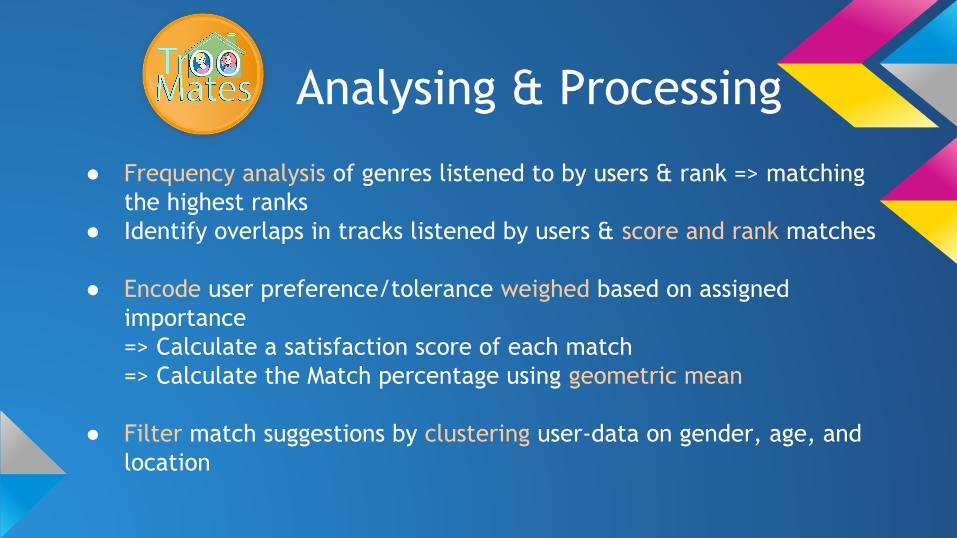
Analysing & Processing
● Frequency analysis of genres listened to by users & rank => matching the highest ranks
● Identify overlaps in tracks listened by users & score and rank matches
● Encode user preference/tolerance weighed based on assigned importance=> Calculate a satisfaction score of each match=> Calculate the Match percentage using geometric mean
● Filter match suggestions by clustering user-data on gender, age, and location
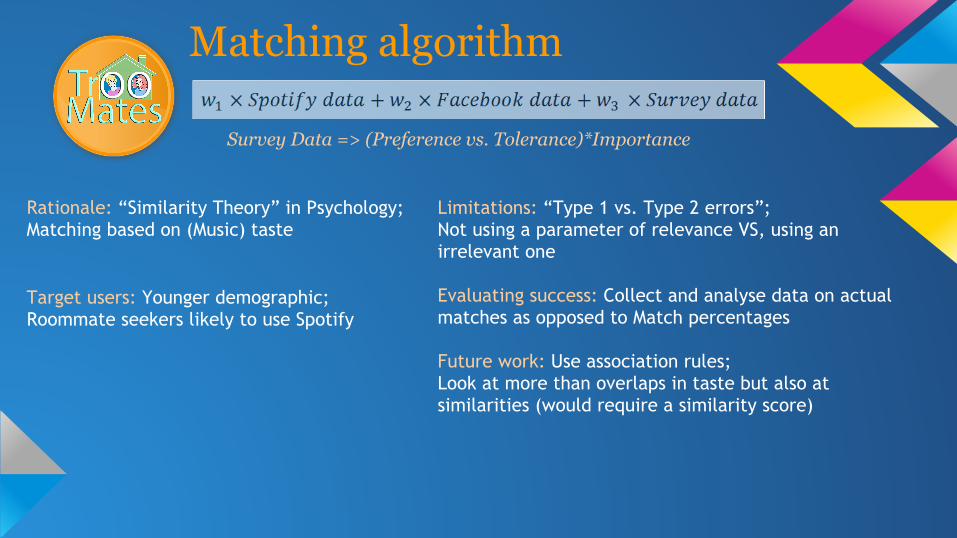
Matching algorithm
Rationale: “Similarity Theory” in Psychology;Matching based on (Music) taste
Target users: Younger demographic;Roommate seekers likely to use Spotify
Survey Data => (Preference vs. Tolerance)*Importance
Limitations: “Type 1 vs. Type 2 errors”;Not using a parameter of relevance VS, using an irrelevant one
Evaluating success: Collect and analyse data on actual matches as opposed to Match percentages
Future work: Use association rules;Look at more than overlaps in taste but also at similarities (would require a similarity score)
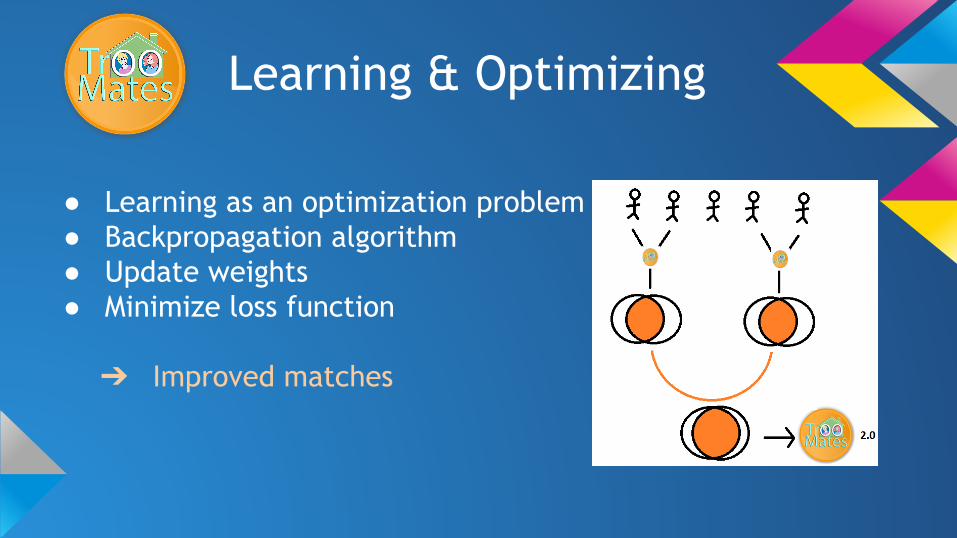
Learning & Optimizing
● Learning as an optimization problem● Backpropagation algorithm● Update weights● Minimize loss function
➔ Improved matches

Thank you for your attention!

Group 4: Galen, Isabelle & Vigo19 March 2015
S

ProblemSmartphones have become a daily requisite, but battery life is not keeping up with our demand.
Crowdsource the locations of the numerous yet hard to find power sockets in public places.
Solution

S
S
S
S
S
S
S
S 2 sockets.Inside Starbucks.Upon entering on your right.Next to a table.In the corner.Close to the floor.
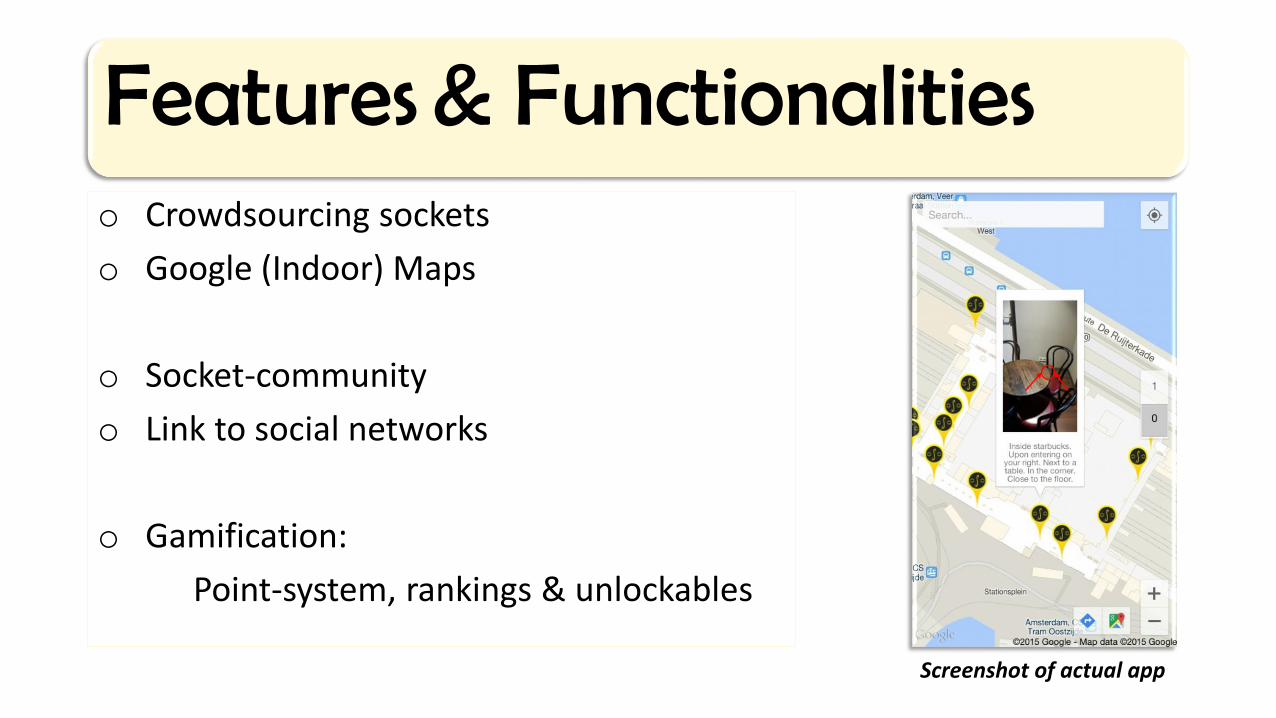
Features & Functionalitieso Crowdsourcing sockets
o Google (Indoor) Maps
o Socket-community
o Link to social networks
o Gamification:
Point-system, rankings & unlockables
Screenshot of actual app

Research: Similar appsTomTom Waze PulsePoint Healthmap
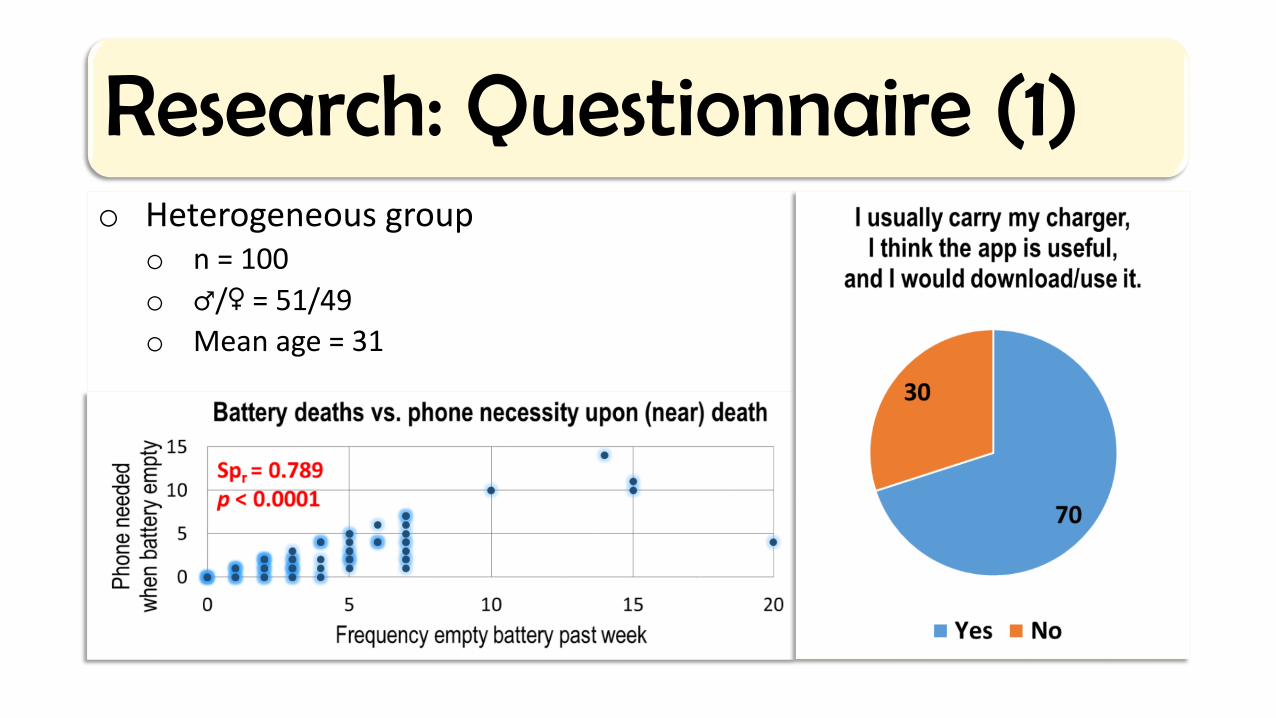
Research: Questionnaire (1)o Heterogeneous group
o n = 100
o ♂/♀ = 51/49
o Mean age = 31
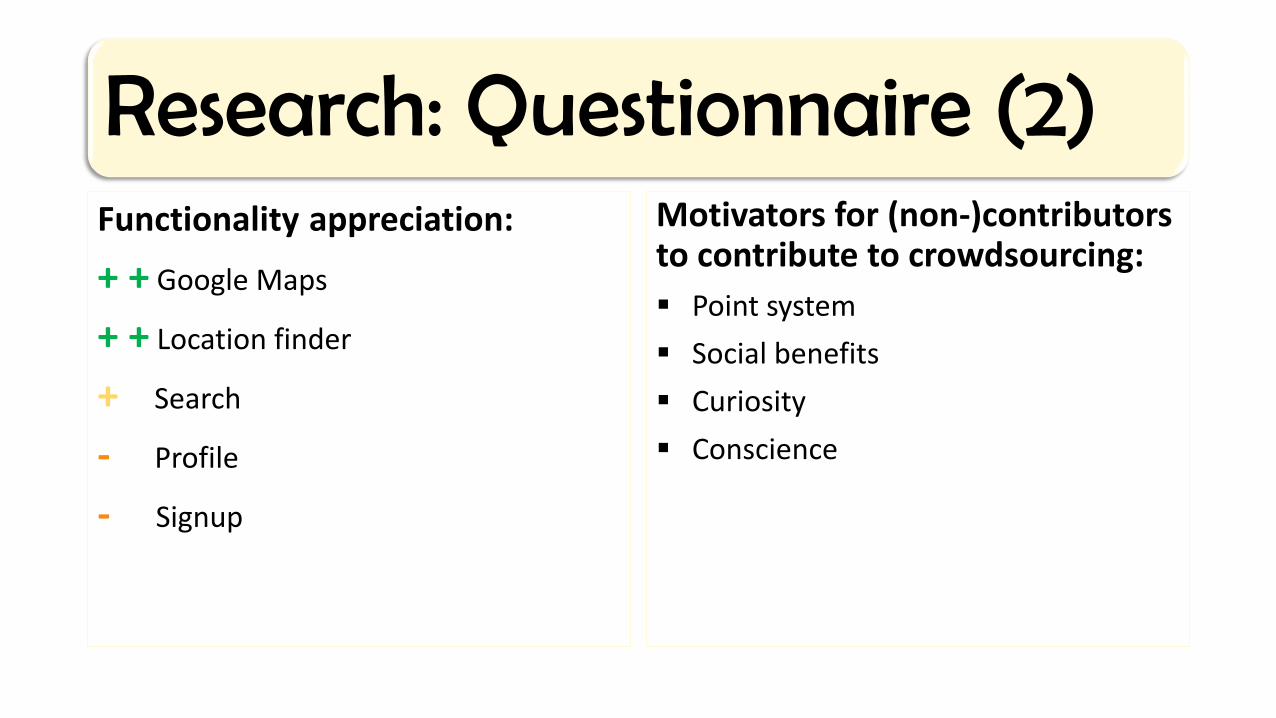
Research: Questionnaire (2)Functionality appreciation:
+ + Google Maps
+ + Location finder
+ Search
- Profile
- Signup
Motivators for (non-)contributors to contribute to crowdsourcing:
Point system
Social benefits
Curiosity
Conscience

Planned data analyses• Summarization: visualize and create report on data
• For the developer as well as the user (in-app)
• Clustering: group and structure the data• Detect if users that make use of the app also contribute to the community
• Association rule learning: show relationships between variables• Track users’ frequent locations and suggest favorite sockets or near sockets

Event ExplorerTSW 2015, Group 6

Problem-statement
● Hard to get overview about local events
● Lack of good recommendation for events
● Facebook often used to search for events
● Not possible to search for events on a map
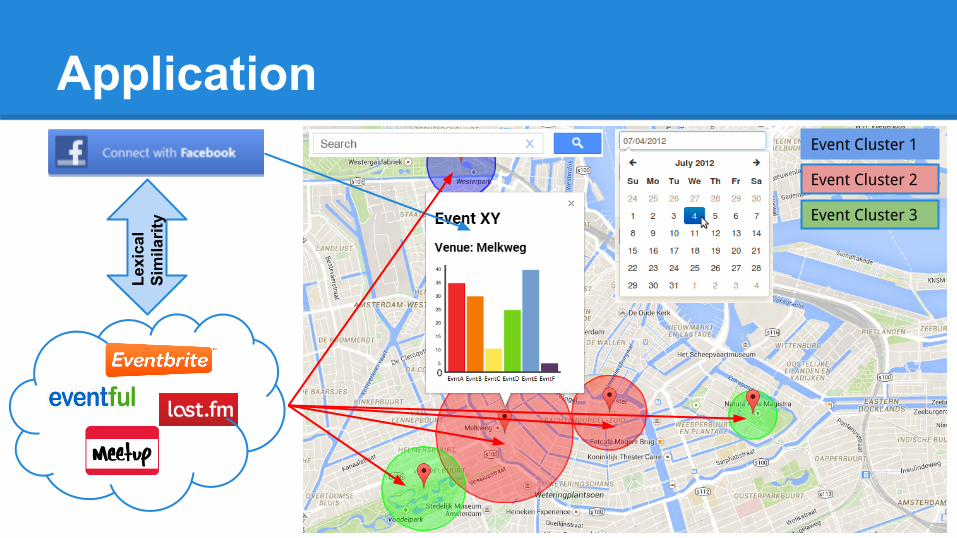
Event Cluster 1
Event Cluster 2
Event Cluster 3
ApplicationLe
xica
l Si
mila
rity

FeaturesFacebook-Login● Rationale: Personalization● Motivation: Find interesting Events● Scoping: Analyze previous Event attendances● Limitation:
○ No additional Profile information○ Change of user taste○ Not the full picture
● Evaluation: Self-Evaluation, Analysis on past Events● Future work: Evaluate facebook likes

FeaturesFind Local Facebook Events● Rationale: Search/Recommendation● Motivation: Missing local search● Scoping:
○ Events which are present on external sources ○ Public Events○ Lexical Similarity Search + Geographic filtering
● Evaluation: Compare Map with manual FB-crawling ● Future Work:
○ Expand the amount of external sources○ Search for events by (facebook) place’s
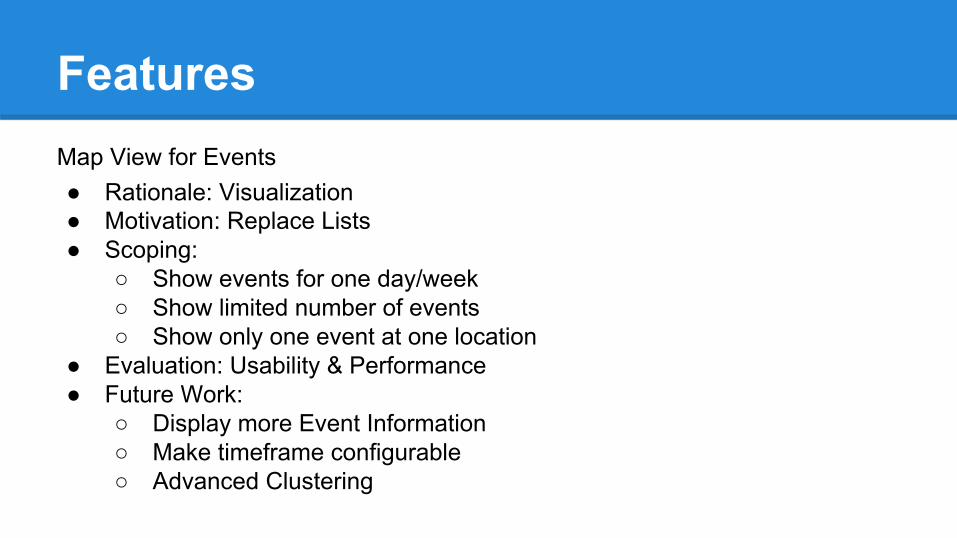
FeaturesMap View for Events● Rationale: Visualization● Motivation: Replace Lists● Scoping:
○ Show events for one day/week○ Show limited number of events○ Show only one event at one location
● Evaluation: Usability & Performance● Future Work:
○ Display more Event Information○ Make timeframe configurable○ Advanced Clustering
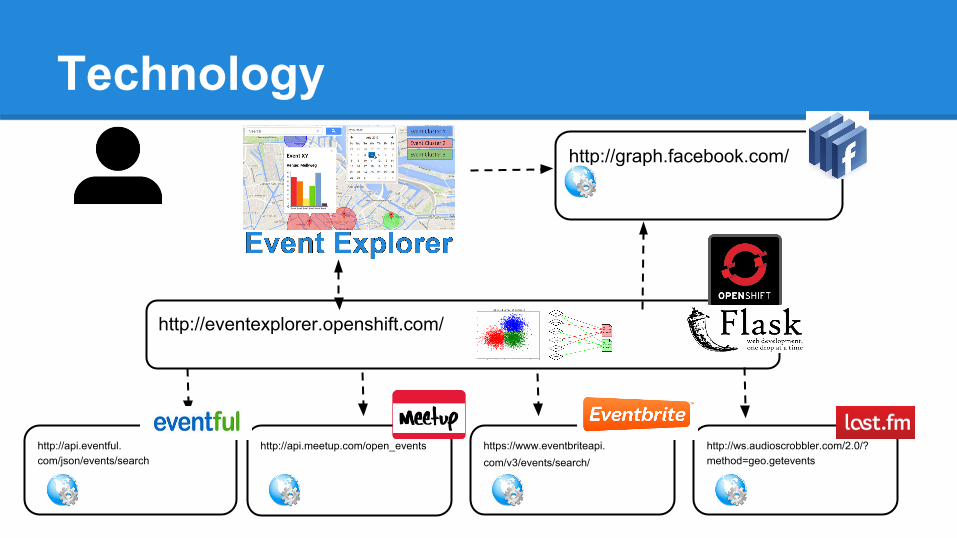
Technology
http://eventexplorer.openshift.com/
http://graph.facebook.com/
http://api.meetup.com/open_eventshttp://api.eventful.com/json/events/search
https://www.eventbriteapi.com/v3/events/search/
http://ws.audioscrobbler.com/2.0/?method=geo.getevents
GuideMeNowYour Social Tourist Guide
Ali Harrak: Front-end Yassin el Aajati: Business Case Abdelilah Mounir: Back-end
Team 8


PROBLEM STATEMENTDestinations compete for tourists in a very competitive environment (Kevin K.F Wong, 2001)
It is observed that major tourist problems are deviation in the arrangements made for their stay, visit, transport and unexpected expenses. (Chockalingam & Ganesh, 2010).


TOURIST INDUSTRY IS VITAL
one in 11 jobs globally 9 % of the world’s economy
World Travel & Tourism Council (WTTC), 2012


API’S

Data Analysis
● Cluster Analysis
● Classification Analysis

WHO MIGHT BE INTERESTED?
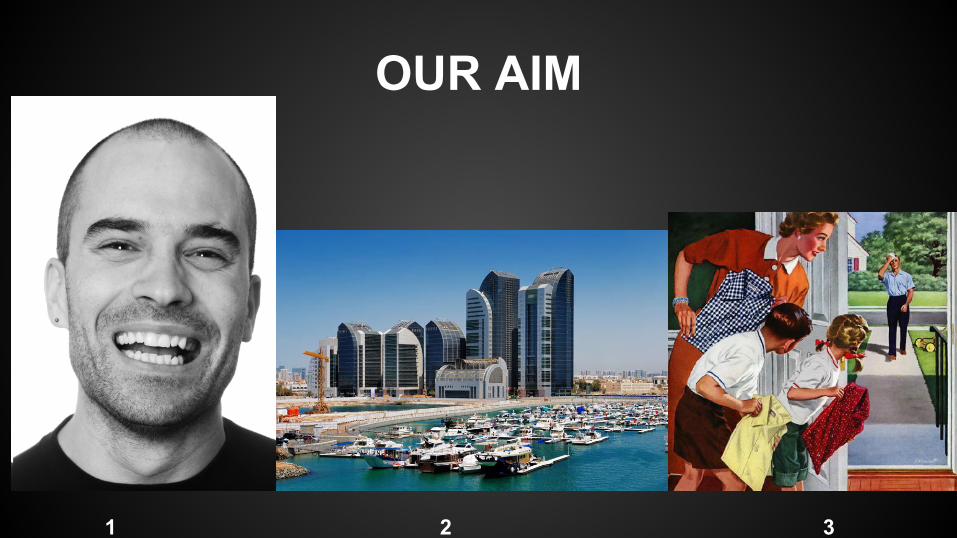
OUR AIM
\
1 2 3
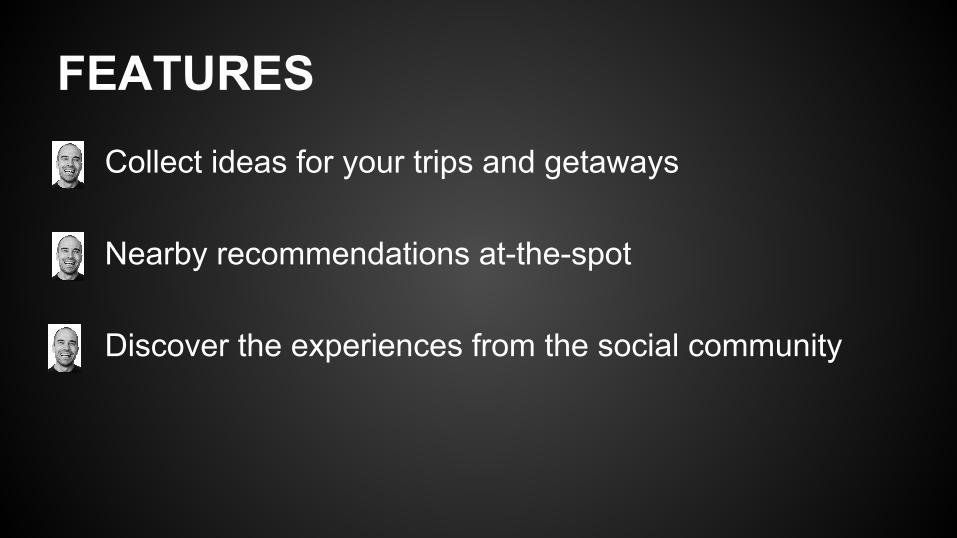
FEATURES Collect ideas for your trips and getaways
● Nearby recommendations at-the-spot
● Discover the experiences from the social community

REFERENCES Ap, J., & Wong, K. K. (2001). Case study on tour guiding: Professionalism, issues and problems. Tourism Management, 22(5), 551-563.
Ganesh, A. A., & Chockalingam, M. (2010). Problems encountered by tourists. Business and Economic Horizons, (03), 68-72.

QUESTIONS

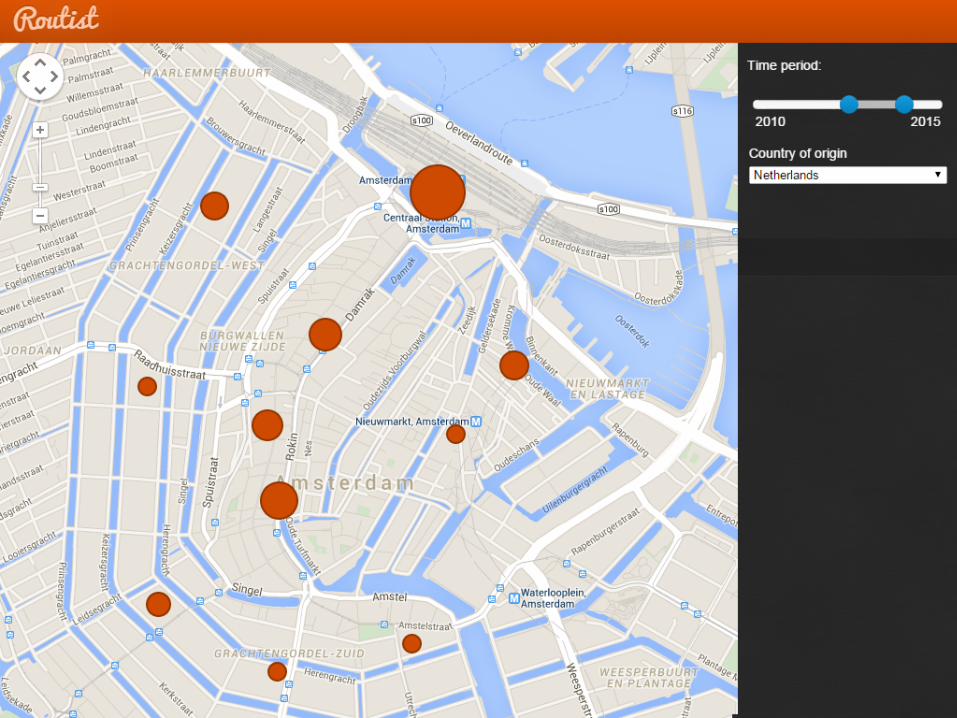
Routist
Group 9Bas Sijtsma, Hayo Bart & Stefan Paap
March 19th, 2015
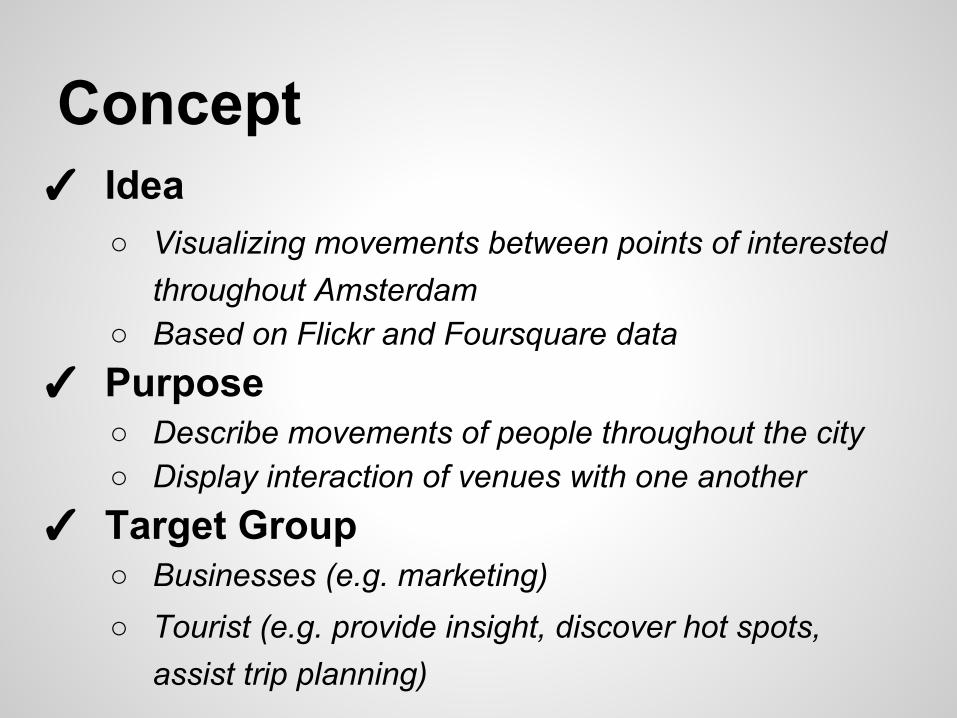
✓ Idea○ Visualizing movements between points of interested
throughout Amsterdam○ Based on Flickr and Foursquare data
✓ Purpose○ Describe movements of people throughout the city○ Display interaction of venues with one another
✓ Target Group○ Businesses (e.g. marketing)○ Tourist (e.g. provide insight, discover hot spots,
assist trip planning)
Concept

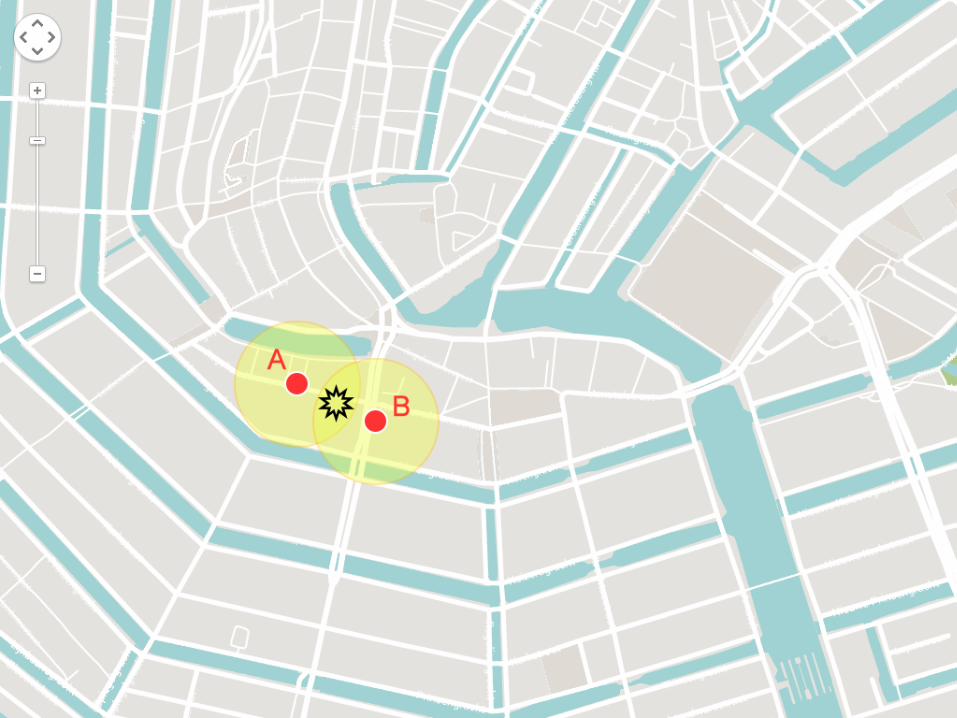
Visualisation✓ Venue exploration
✓ Movement exploration
✓ Filtering○ On time period○ On tourist nationality

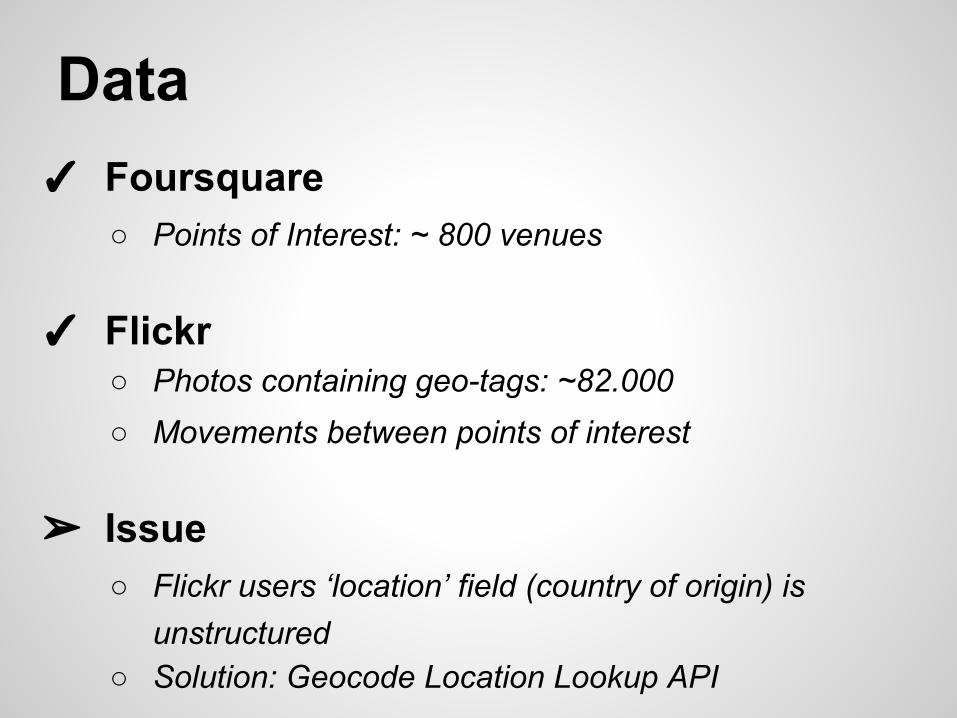
Data✓ Foursquare
○ Points of Interest: ~ 800 venues
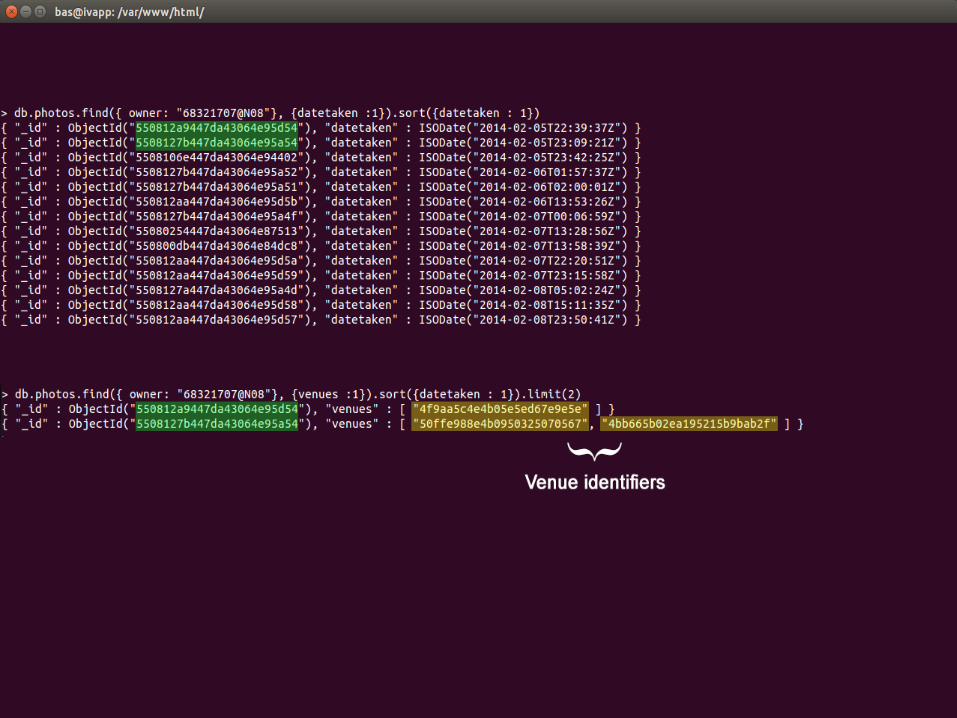
✓ Flickr○ Photos containing geo-tags: ~82.000○ Movements between points of interest
➢ Issue○ Flickr users ‘location’ field (country of origin) is
unstructured○ Solution: Geocode Location Lookup API

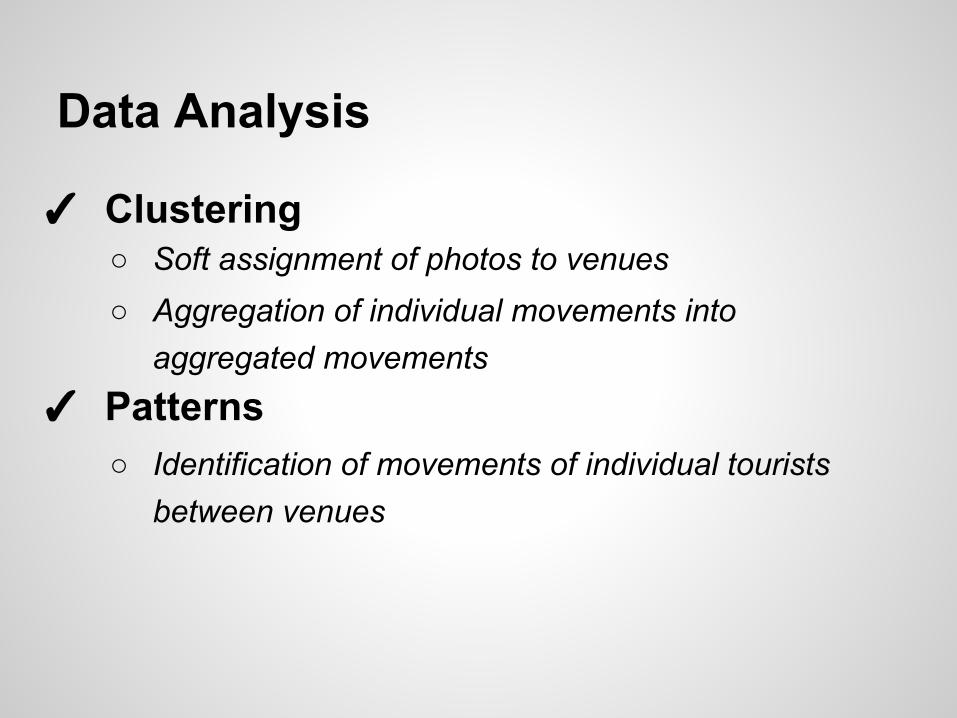
Data Analysis
✓ Clustering○ Soft assignment of photos to venues○ Aggregation of individual movements into
aggregated movements✓ Patterns
○ Identification of movements of individual tourists between venues


Group Effort
✓ Bas○ Back-end development; data processing
✓ Hayo & Stefan○ Front-end development; visualizations in d3

TripReco!
Martin Altmann Sebastian Hoffmann
Hsu-Young Ho

Agenda!• Introduc*on • Model of TripReco • Demo • Discussion – Limita*on – Future feature

About TripReco!• TripReco aims to help users to find the popular places
• Using the friends´ photos which shared on thier Facebook and Instagram
• TripReco displays the overview in the whole map (which Facebook & Instagram do not do)
§ Find the paFerns of different genders
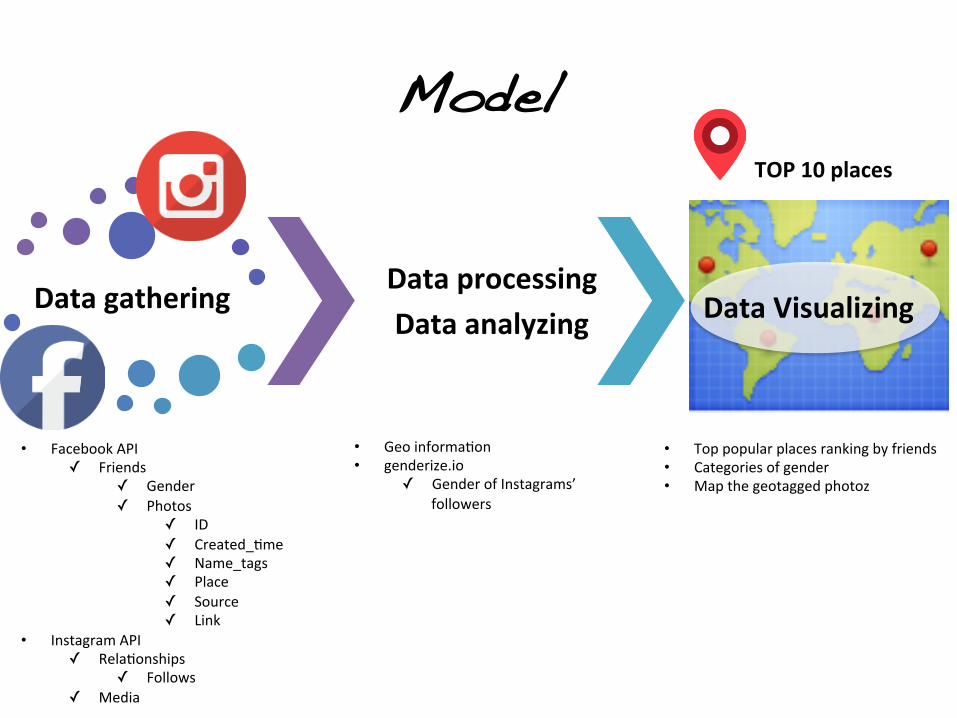
Model!
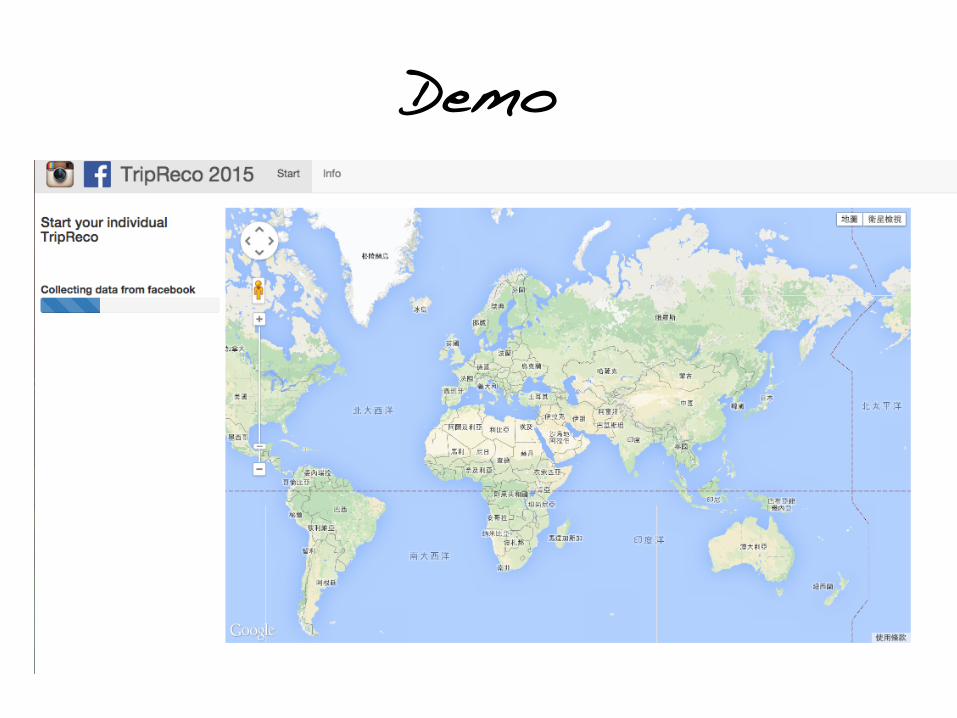
Data processing Data analyzing
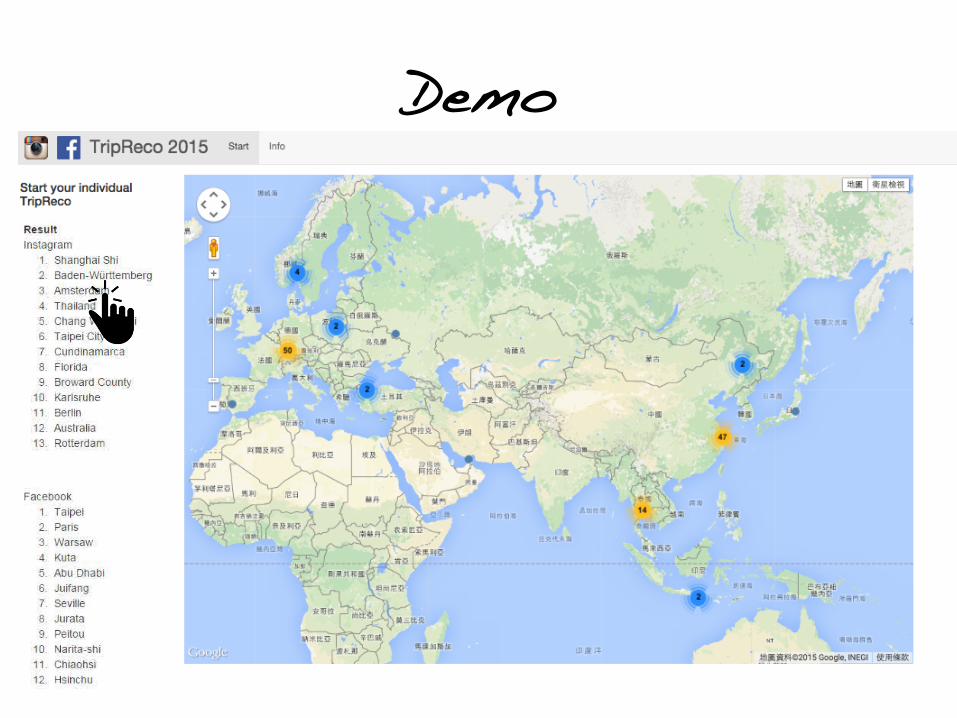
TOP 10 places
Data Visualizing Data gathering
• Facebook API ✓ Friends
✓ Gender ✓ Photos
✓ ID ✓ Created_*me ✓ Name_tags ✓ Place ✓ Source ✓ Link
• Instagram API ✓ Rela*onships
✓ Follows ✓ Media
• Geo informa*on • genderize.io
✓ Gender of Instagrams’ followers
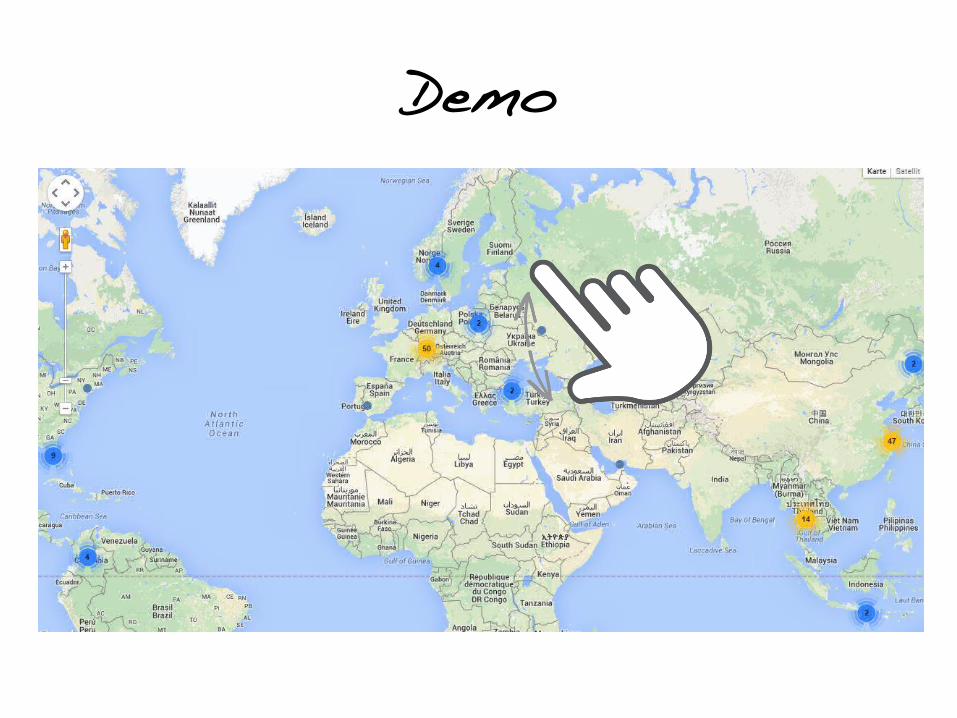
• Top popular places ranking by friends • Categories of gender • Map the geotagged photoz

Model!• Facebook API
✓ Friends ✓ Gender ✓ Photos
✓ ID ✓ Created_*me ✓ Name_tags ✓ Place ✓ Source ✓ Link
• Instagram API ✓ Rela*onships
✓ Follows ✓ Media

Model!
• Geo informaAon
• genderize.io ✓ Gender of Instagrams’
followers

Model!
• Top popular places ranking by friends
• Map the geotagged photos on the map
• Categories of gender
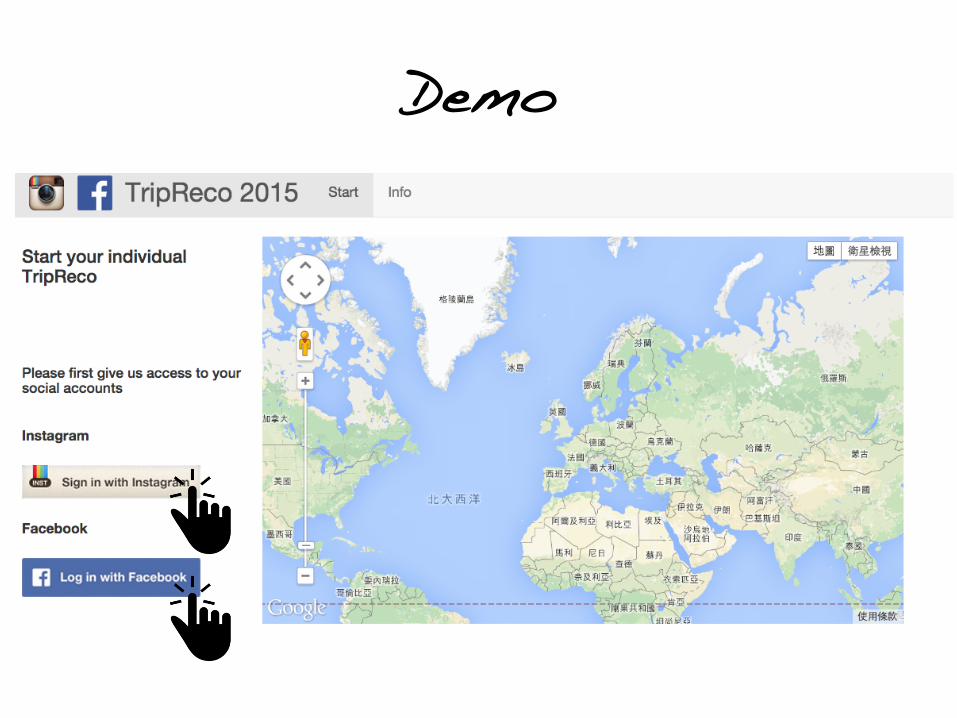
Demo!

Demo!
Demo!
Demo!
Demo!
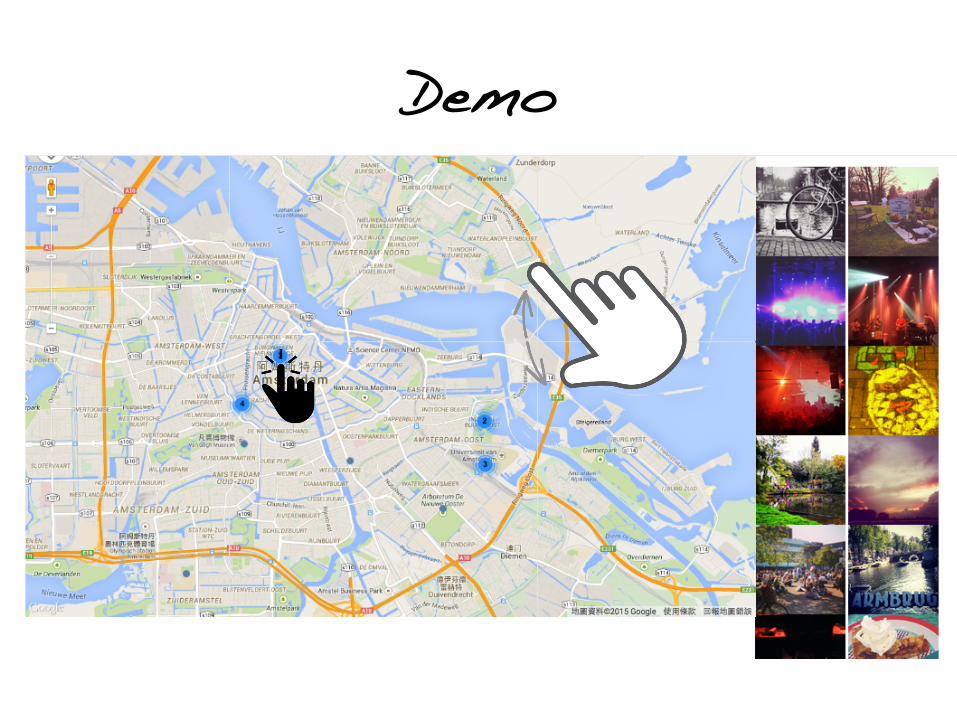
Demo!
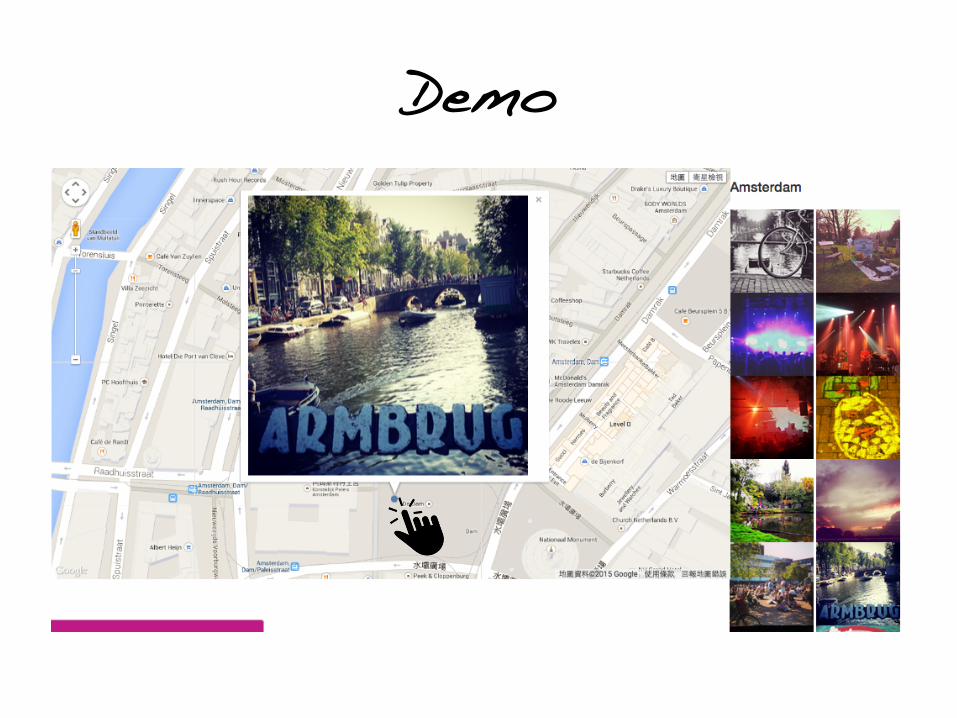
Demo!
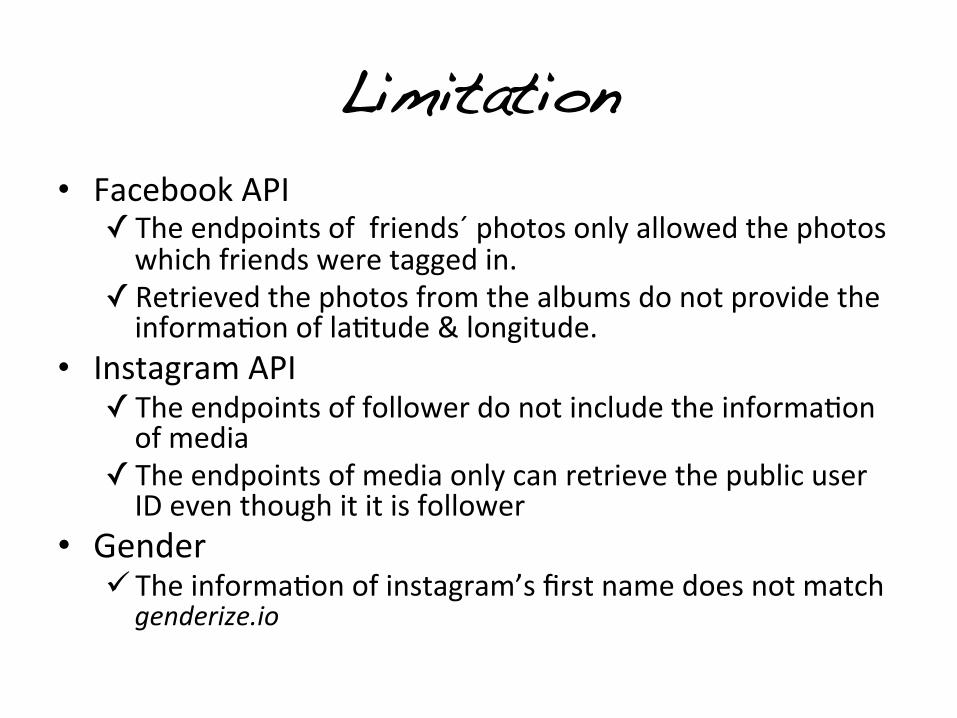
Limitation!• Facebook API ✓ The endpoints of friends´ photos only allowed the photos which friends were tagged in.
✓ Retrieved the photos from the albums do not provide the informa*on of la*tude & longitude.
• Instagram API ✓ The endpoints of follower do not include the informa*on of media
✓ The endpoints of media only can retrieve the public user ID even though it it is follower
• Gender ü The informa*on of instagram’s first name does not match genderize.io

Demo video!

Work!• Mar*n Altmann
– Data analysis – Web applica*on
• Sebas*an Hoffmann – Data collec*on
• Hsu-‐Young Ho – Data collec*on – Slides
The Social MuseumJohan AssinkMarc JacobsNicky van Oorschot
Team 11
Problem
- Museum Guestbook- Overview of museums in NL
- Combination of both problems result in:
The Social Museum

Solution● Museums overview sort by county.● Additional information for each museum.● Tweets as guestbook notes.● Slider that shows popularity over time.● Museum recommendations.● Analyse popularity and social Phenomena.
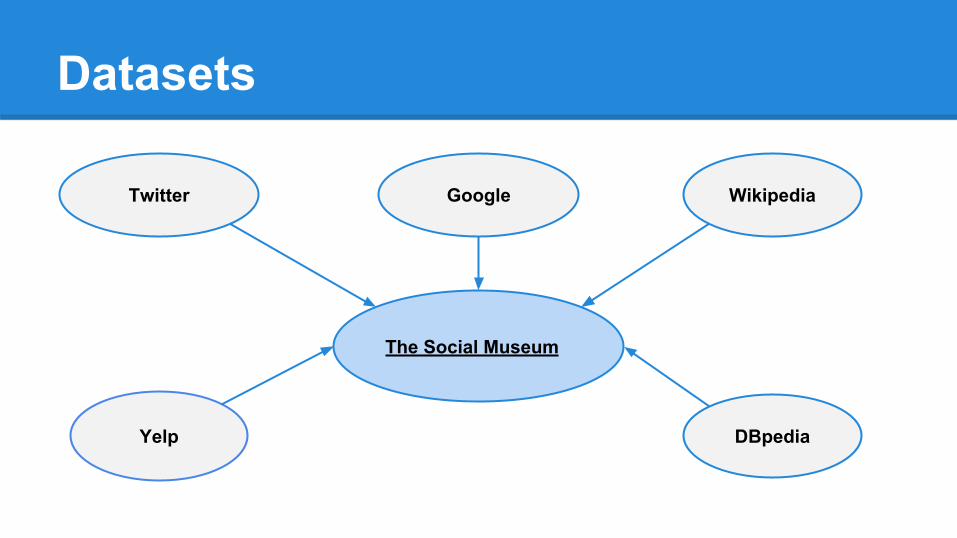
Datasets
The Social Museum
DBpedia
WikipediaTwitter
Yelp

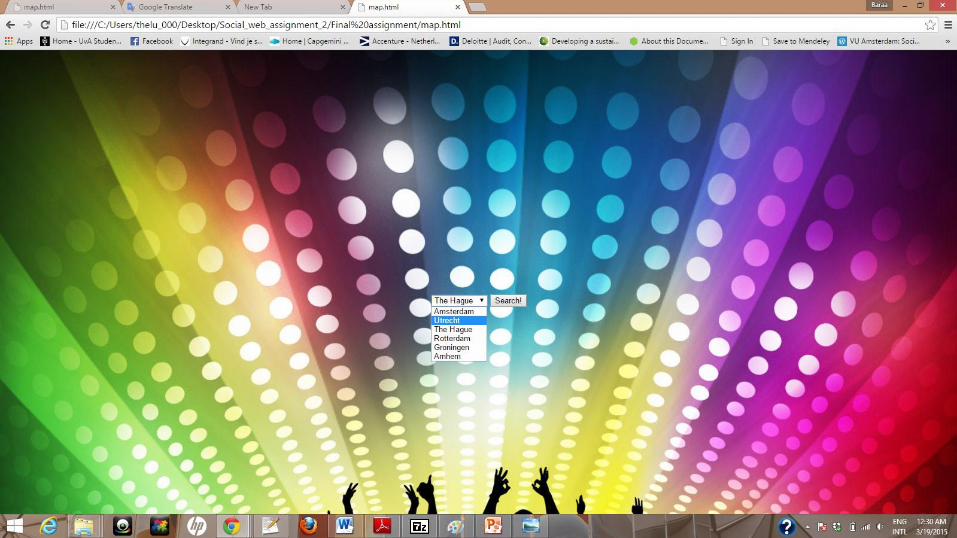
Demo time!
https://www.youtube.com/watch?v=BuKDCQXyooI&feature=youtu.be
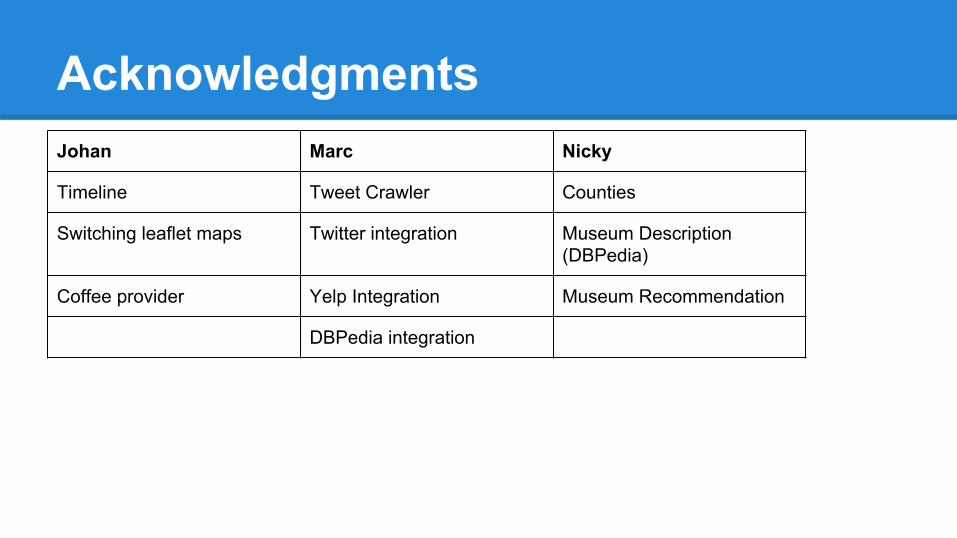
AcknowledgmentsJohan Marc Nicky
Timeline Tweet Crawler Counties
Switching leaflet maps Twitter integration Museum Description (DBPedia)
Coffee provider Yelp Integration Museum Recommendation
DBPedia integration

Social Web
Group 12Baraa Alnawakil
Amir Hossein ZadehIoannis Markopoulos

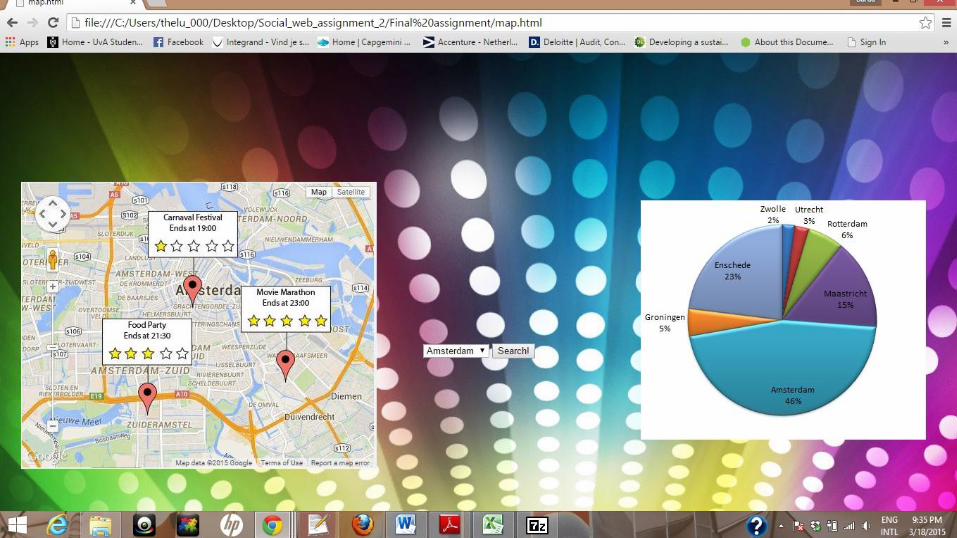
Goals- Help users find real-time events based on location of their preferences - Provide information about events to help users decide on which
events to go to
Real-time events finder app

● Facebook API○ Event Name○ Description○ End time○ Place○ attendees
● Twitter API○ tweets about the event
Data Used

● Ranking Algorithm based on tweet texts analysis.○ categorise tweet words in 5 groups ( very good, good , normal, bad, very bad).○ assign weight measure for each group.○ calculate the frequency of words in each group.○ calculate the rank based on frequency and weight.
● Classification based on location of attendees○ classify locations based on the cities in which the attendees currently live.○ find number of attendees per city and calculate percentage.
Type of data analysis

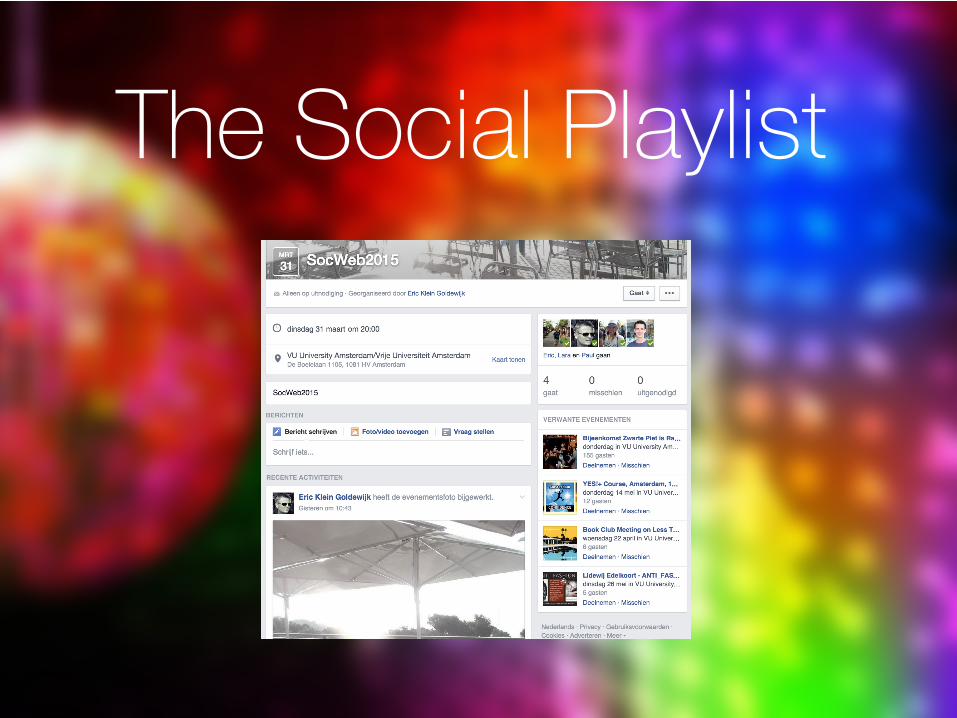
The Social Playlist
Group 14 Eric, Peter, Lara & Paul
Group 14The Social Playlist
Eric, Peter, Lara & Paul
+
The Social Playlist
Group 14 Eric, Peter, Lara & Paul
The Social Playlist

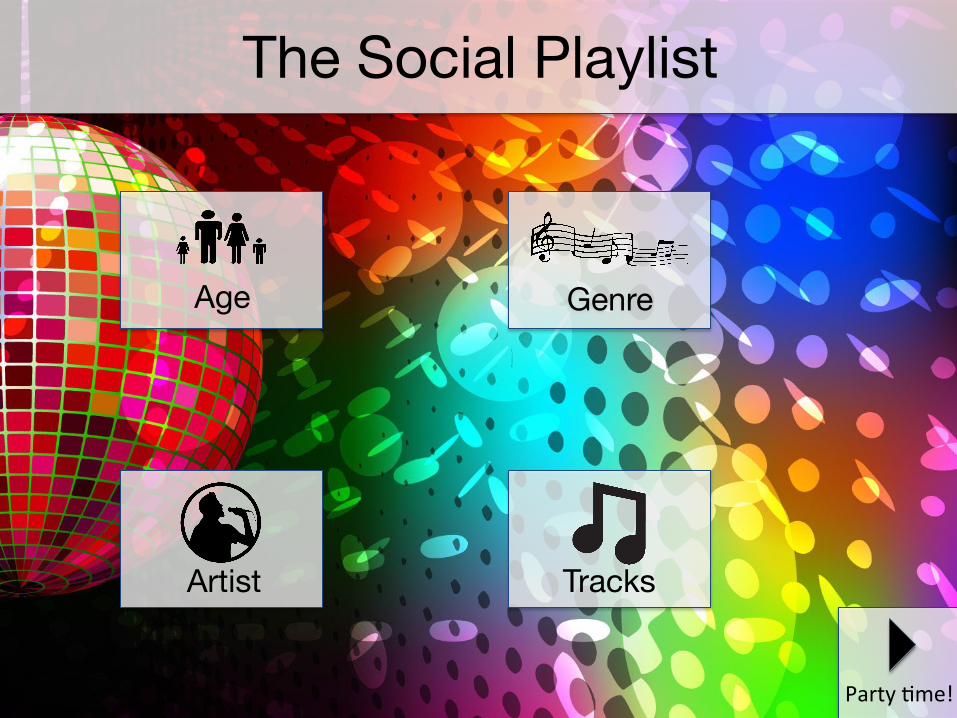
The Social Playlist
Party 9me!
Genre Age
Artist Tracks
Event: SocWeb2015

Party 9me! Home
Age
Unknown 1
Till 16 0
16 9ll 18 0
18 9ll 25 1
25 9ll 30 1
30 9ll 40 0
40 and older 1
The Social Playlist
Party 9me!
Genre Age
Artist Tracks
The Social Playlist
Party 9me! Home
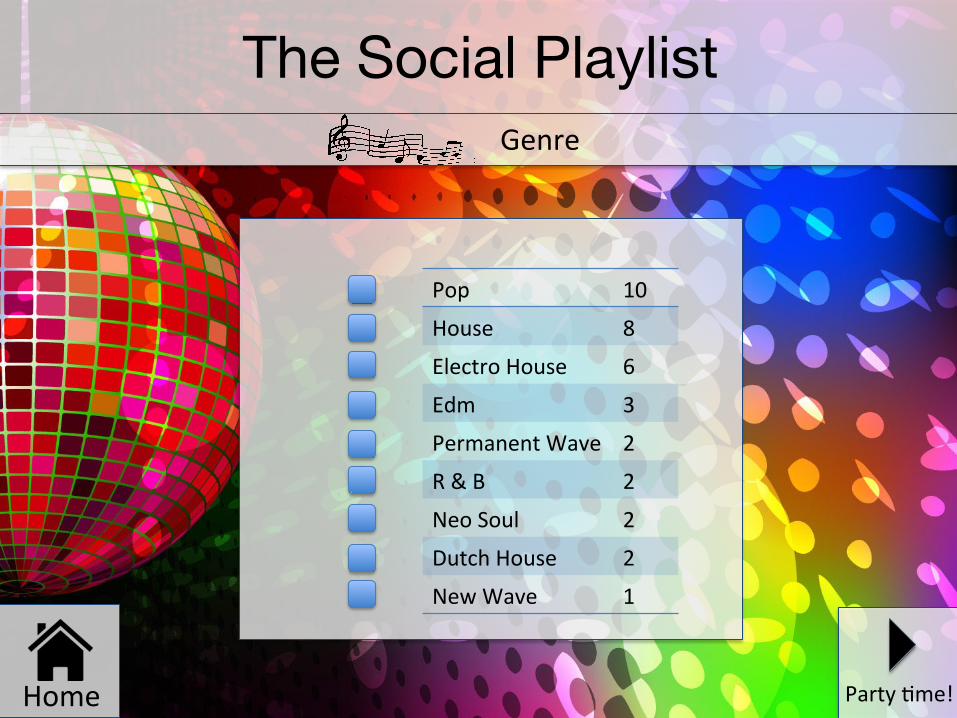
Genre
Pop 10
House 8
Electro House 6
Edm 3
Permanent Wave 2
R & B 2
Neo Soul 2
Dutch House 2
New Wave 1
The Social Playlist

Party 9me!
Genre Age
Artist Tracks
The Social Playlist
Party 9me! Home
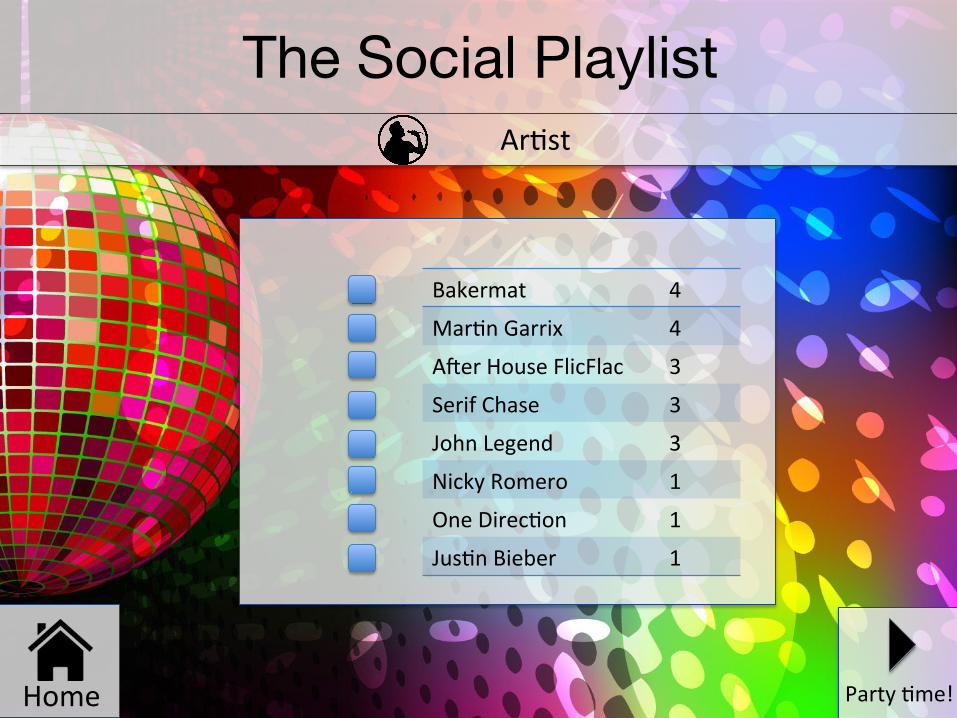
Ar9st
Bakermat 4
Mar9n Garrix 4
ATer House FlicFlac 3
Serif Chase 3
John Legend 3
Nicky Romero 1
One Direc9on 1
Jus9n Bieber 1
The Social Playlist

Party 9me!
Genre Age
Artist Tracks
The Social Playlist
Party 9me! Home
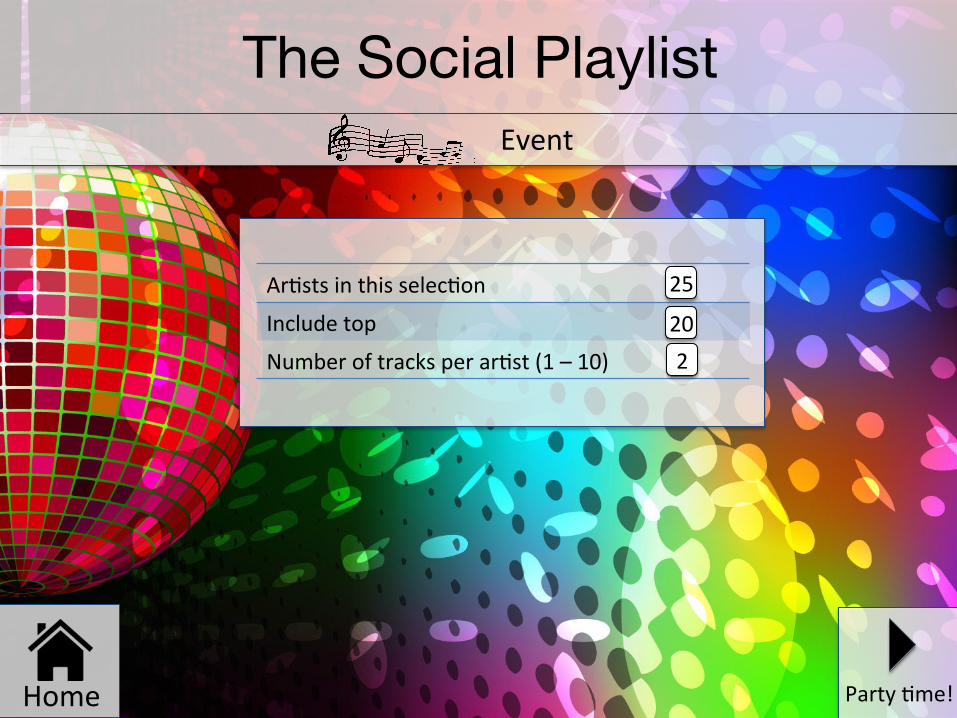
Event
Ar9sts in this selec9on
Include top
Number of tracks per ar9st (1 – 10)
25
20 2
The Social Playlist

Party 9me!
Genre Age
Artist Tracks
The Social Playlist
The Social Playlist
Group 14 Eric, Peter, Lara & Paul
The Social PlaylistGroup 14
Features: • Select age group • Select genre • Select artists • Select tracks and create playlist

TrendngGambling on the current trends on Twitter
Florian Golemo Marjeta Markovic Kevin Wezeman
19-03-2015

Idea
Twitter Trends + Stock Market + Game
(think binary option trading)

10 twitter trends
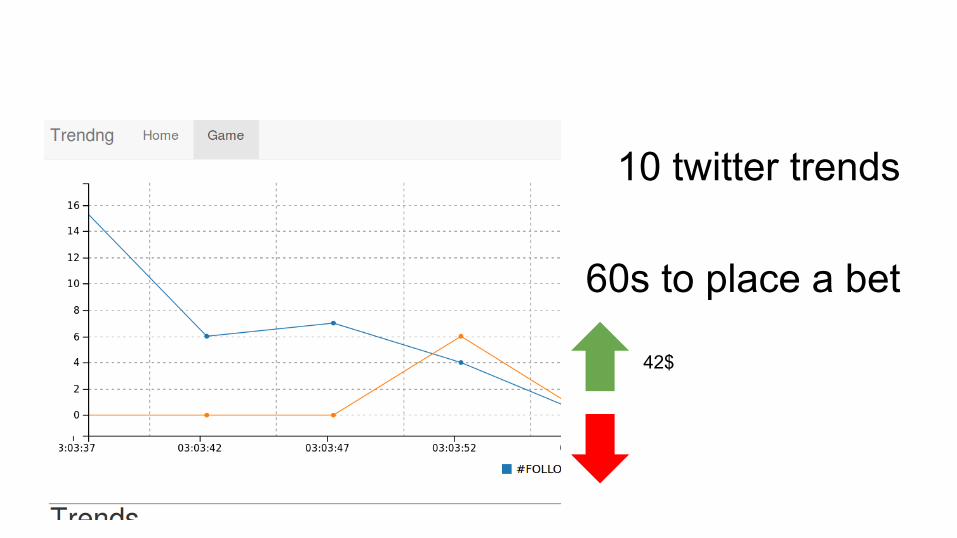
10 twitter trends
60s to place a bet
42$

10 twitter trends
60s to place a bet
then cashout& next round

Idea - Incentive (Moneh moneh)
● now: just virtual money
● future: bitcoins?
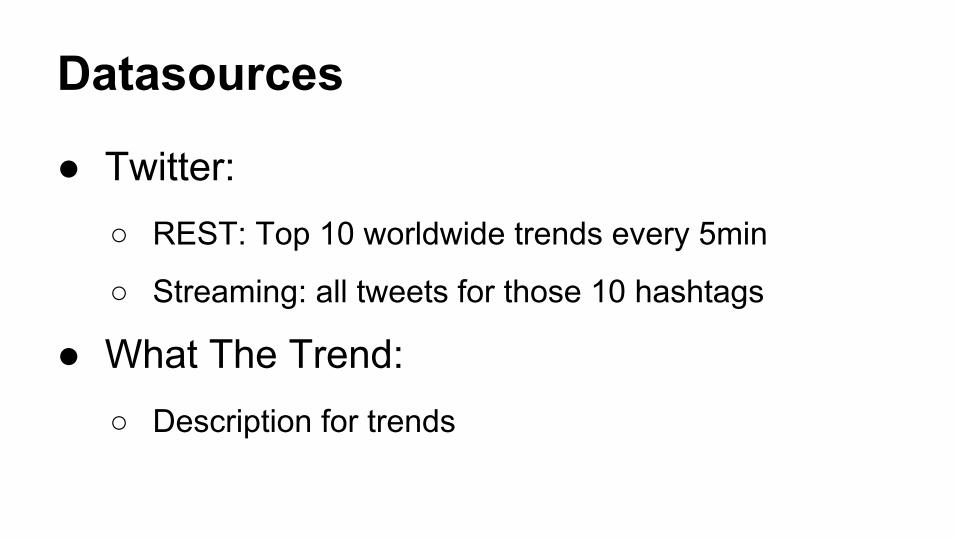
Datasources
● Twitter:○ REST: Top 10 worldwide trends every 5min
○ Streaming: all tweets for those 10 hashtags
● What The Trend:○ Description for trends

The Interaction
● Every minute 1 bet
● Up/down
● Higher payout for higher risk
● Tweet link for each hashtag
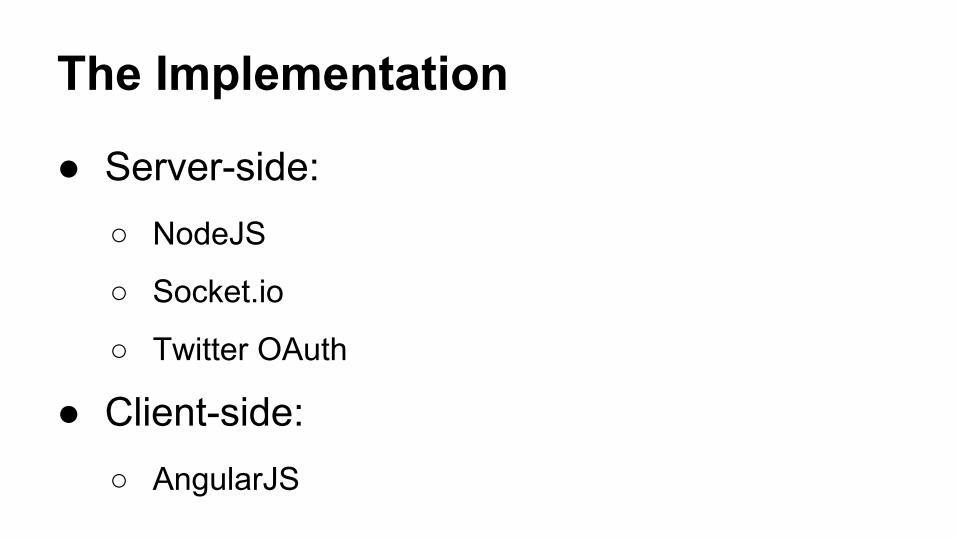
The Implementation
● Server-side:○ NodeJS
○ Socket.io
○ Twitter OAuth
● Client-side:○ AngularJS
Extra Ideas
● add map, chose regional trends

Who does what
● The game: Florian & Marjeta
● The report: Marjeta & Kevin

Team 16
Erik Lubbers
Christian Heymans
Juan Manuel Bedregal
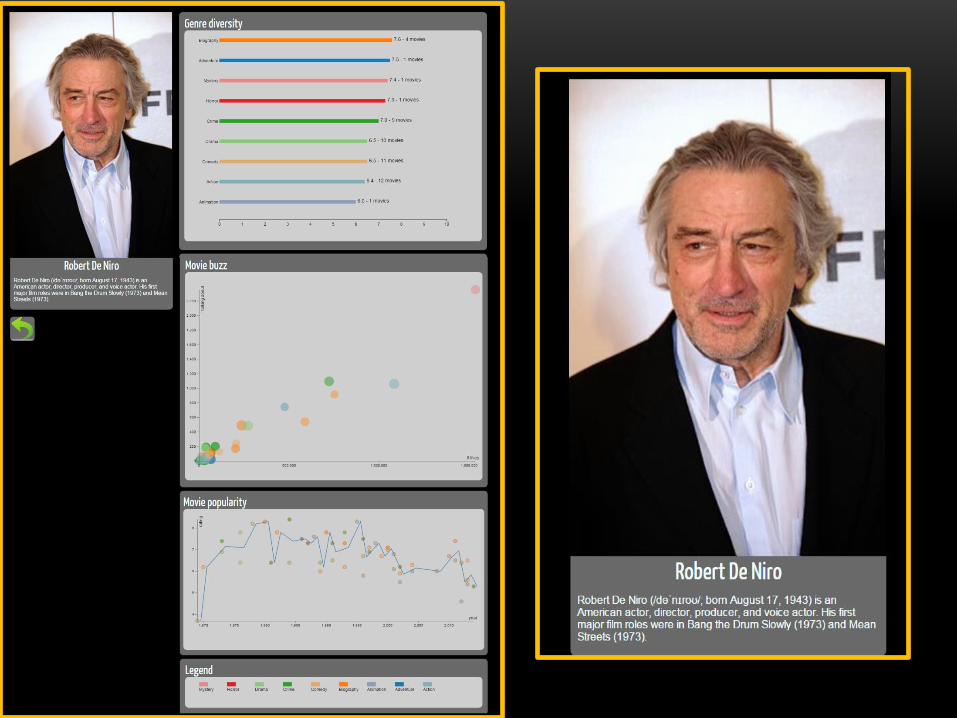
FAN FAVORITE
ACTORS
The Social Web - 2015
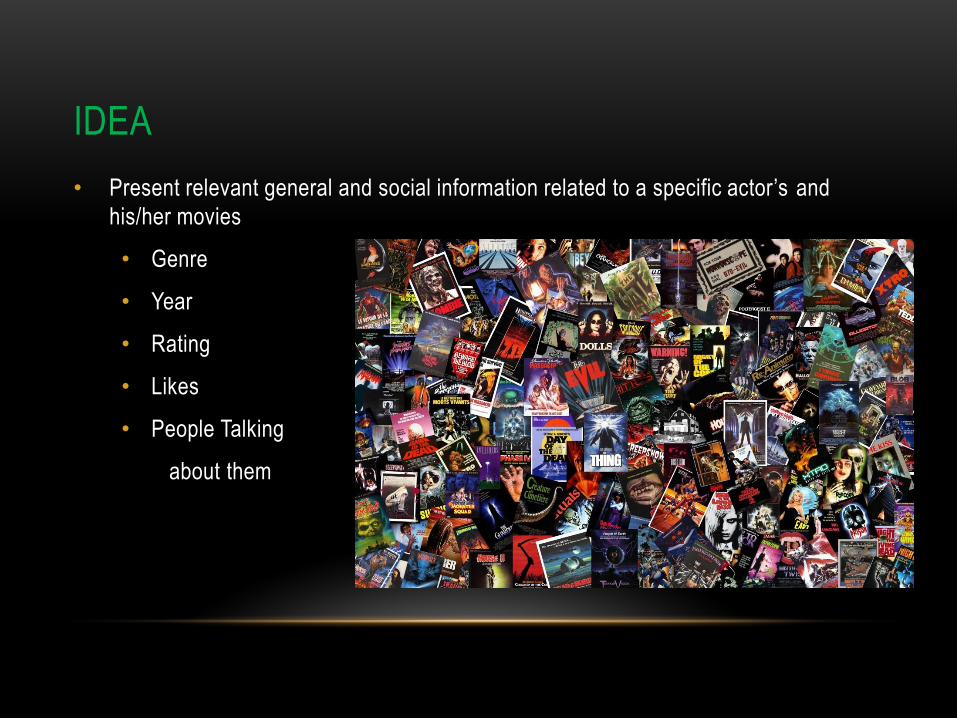
IDEA
• Present relevant general and social information related to a specific actor‟s and
his/her movies
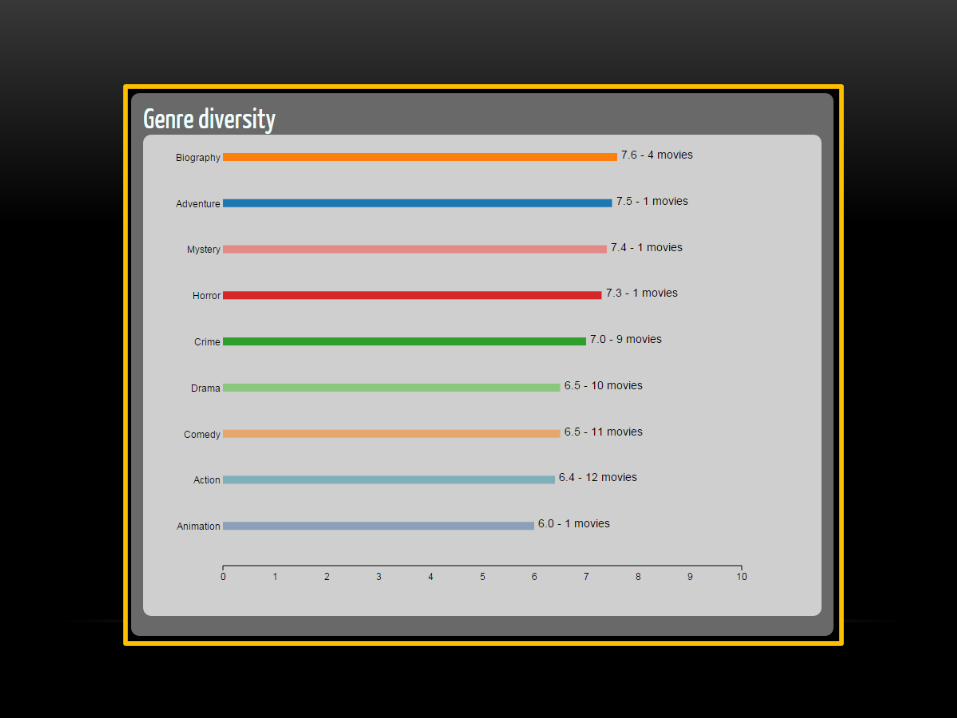
• Genre
• Year
• Rating
• Likes
• People Talking
about them
TARGET USER
• Anyone interested in viewing the social
information related to the movies of a specific
actor
• Anyone interested in viewing a movie from a
specific actor.

USE
• Navigate through the movies of a specific
actor, explore movies with similar:
rating/point in time/likes/people talking
about
• The information and visualizations provided
by the application, can be used to help the
user choose a movie from an actor
DATA SOURCES
• ranker.com API
• (top 250 voted actors)
• dbpedia.org API
• (actor information and movie list)
• facebook API
• (likes and people talking about it)
• omdb API
• (IMDB rating and genre of the movies)
HOW IT WORKS 1/2
1. Retrieve the actor from our Database and list it on the applications searchbox, ranker.com
2. Search for the actor in dbpedia and retrieve:
• photo
• summary
• movie list
3. Query Facebook
• query movies => Facebook return list of pages
• Clean and Filter Data: search for „movie‟ category, query Facebook for more information, retrieve actor list and compare
• get likes and people talking about the movies

HOW IT WORKS 2/2
4. Query OMDB
• query movies => IMDB return list of movies
• Clean and Filter Data: search list of movies for actor list and compare
• get first genre and rating
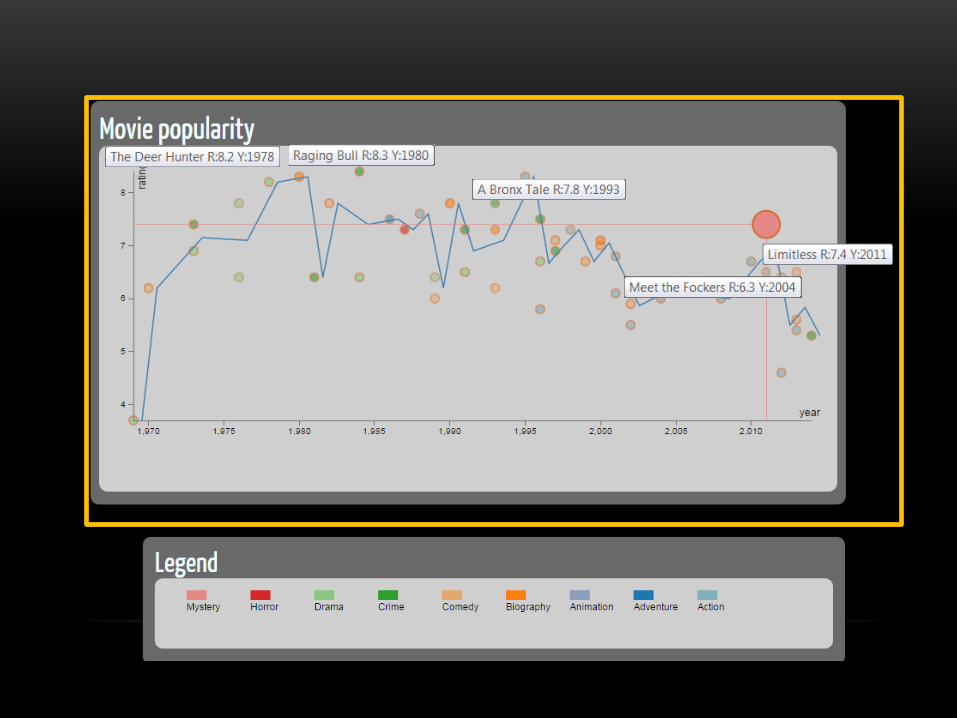
5. Create a new dataset with the summarized information:
• Movie rating X Years X Genre
• Genre X Rating X Number of movies
• Movies X Likes X People talking X Rating X Genre
6. Draw the visualizations
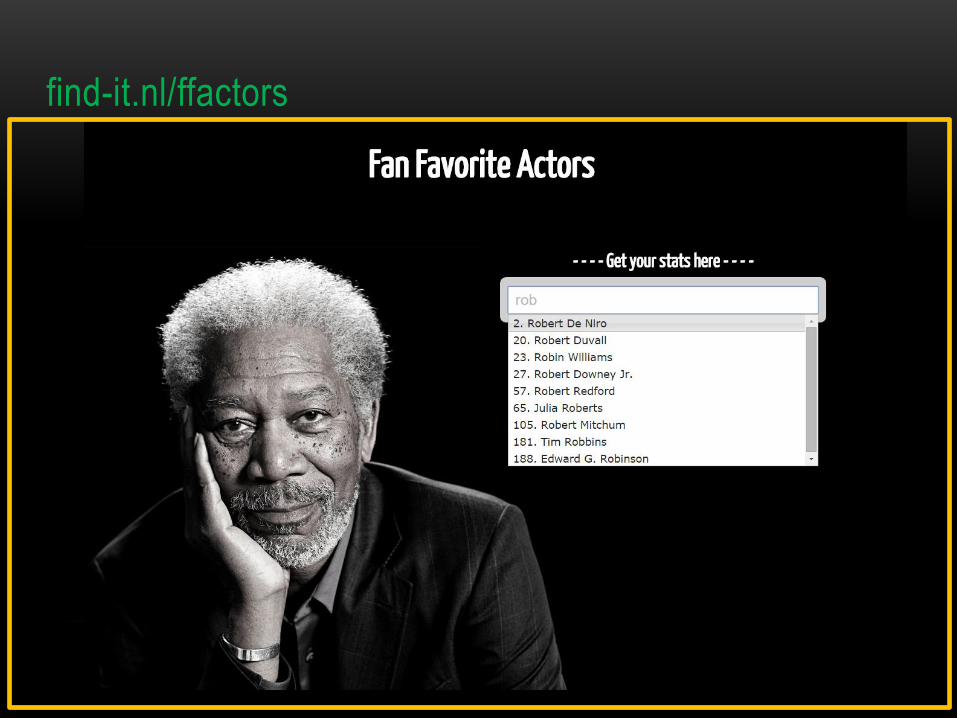
find-it.nl/ffactors


LIMITATIONS
• Inconsistency of the data
• Different spelling of Movies
• Incomplete information
• Missing: category, cast info, additional
information
• This affected the overall reliability of the
results

INDIVIDUAL WORK
• CHRISTIAN
• Overall Design
• Styling of the application
• Integration and coding of the Facebook and OMDB api‟s
• ERIK
• Overall Design
• Finding and integrating the ranker actor list
• Integration and coding of the DBPedia querying
• Tuning the complete project to work as a whole
• JUAN
• Overall Design
• Prepare the summarized data for the Visualizations
• Design and Code the Visualizations

CONCLUSIONS
• It is feasible to gather social Information from different sources, and analyze in
order to create a bigger understanding of a particular subject.
• Important to define first the “problem to solve” and then search for the Data
Sources.
• Difficulty to Mine information from Social API‟s
• Inconsistency and Incompleteness of Information

THANK YOU
QUESTIONS ?
visit us @:
find-it.nl/ffactors
#Tweebay
Group 17: Wojciech Sidor, Janusz Kukla, Elinesofie Dolhain

Added value
• Connect buyers / sellers on Twitter • Opportunity to compare via eBay
• Search by ratio
2
Demo
3
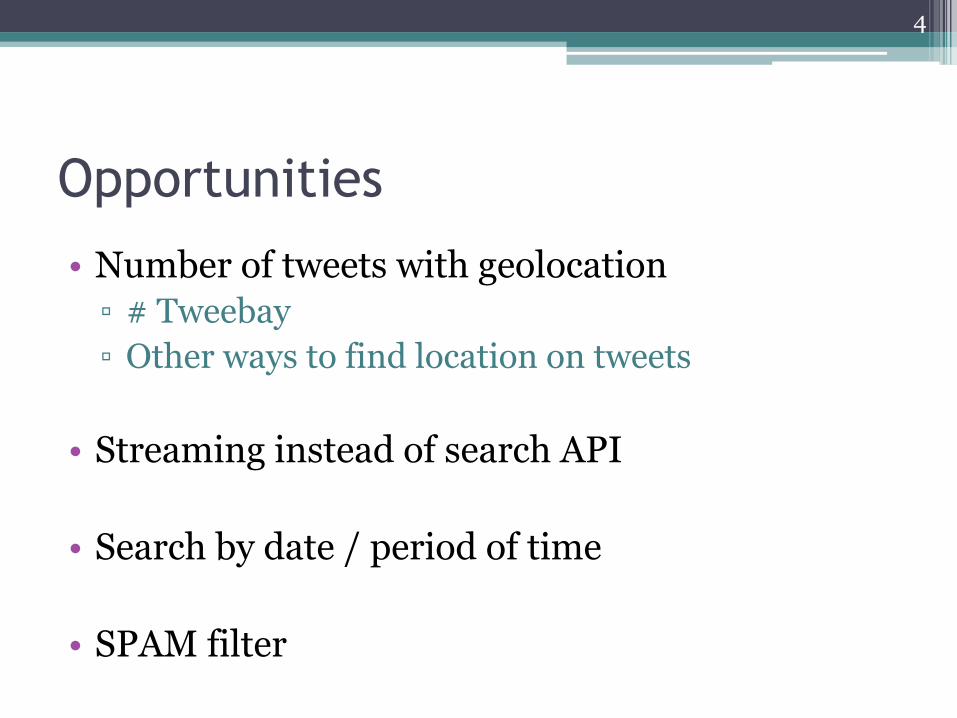
Opportunities
• Number of tweets with geolocation ▫ # Tweebay ▫ Other ways to find location on tweets
• Streaming instead of search API • Search by date / period of time • SPAM filter
4
Individual slide (1) Wojciech
• Free eBay
• Geodata – not only a threat
• Twitter is omnipotent
5
Individual slide (2) Elinesofie
• Connect users via geolocation (real-time update) for selling / buying products
• Easy to sell home-made products
• #Tweebay as evaluation
• Improvements on user evaluation
6
Individual slide (3) Janusz
• Pre-attentive human analysis of the data
• Harder to draw any conclusions from the raw data
• The possibility to add more data in order to help users to get in touch makes a new type of society – Internet society
7

Group 18

Meet
In
Middle
Alsjeblieft
Social Web 2015
Anthony Nwosisi
Aron de Vries
Roberto Floris
Group 18
19 March 2015

Application Introduction
• Humans are social beings
• Socializing involves meeting
• Meeting could be very hectic
• Friends, family or colleagues might be reluctant to travel
• MIMA proposes a solution – the Dutch Solution
• MIMA is based on shared distance between two points
• The application is using the Google Maps Javascript API

Application works with: • Full address• A postcode• City• Country• Objects
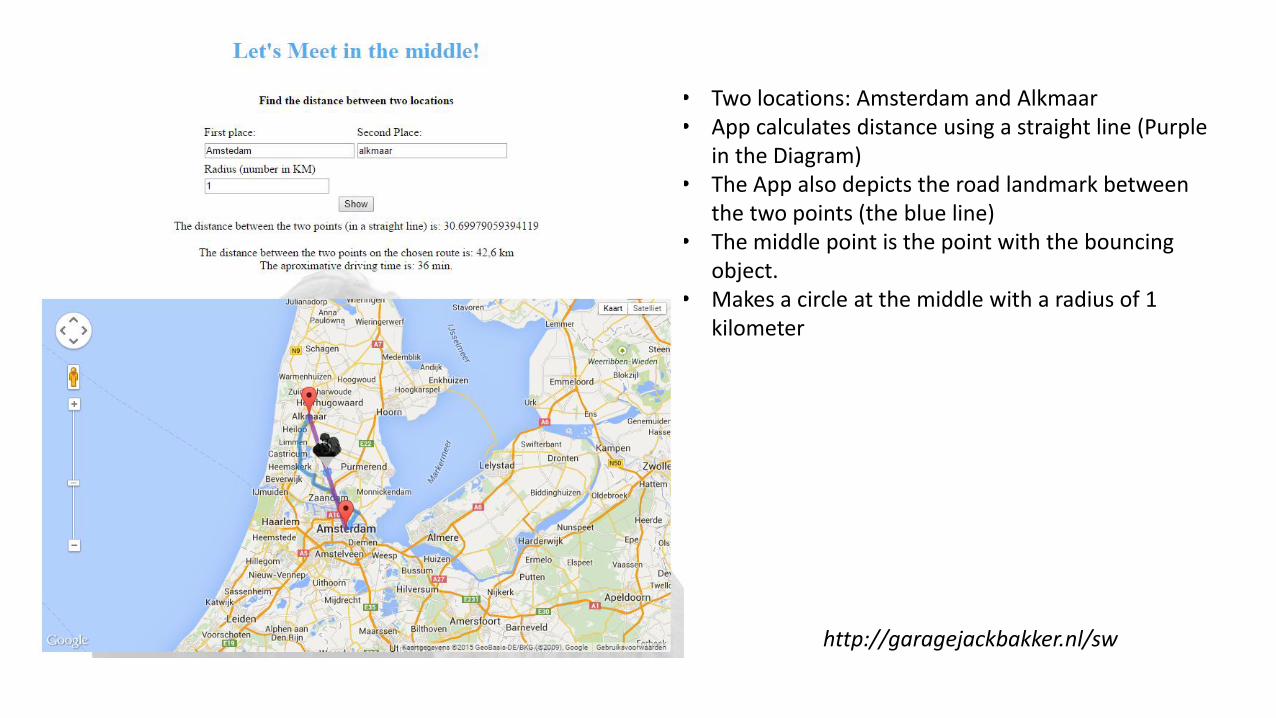
• Two locations: Amsterdam and Alkmaar• App calculates distance using a straight line (Purple
in the Diagram)• The App also depicts the road landmark between
the two points (the blue line)• The middle point is the point with the bouncing
object.• Makes a circle at the middle with a radius of 1
kilometer
http://garagejackbakker.nl/sw

Read A Movie
A Book & Movie Recommendation Application
Image from : http://www.fanpop.com/clubs/reading/images/27819134/title/read-book-photo Group 19
Idea
• Recommend books based on the movies and books that users and their Facebook friends like + Goodreads ratings
• Recommend movies based on the movies and books that users and their Fecebook friends like + Goodreads ratings
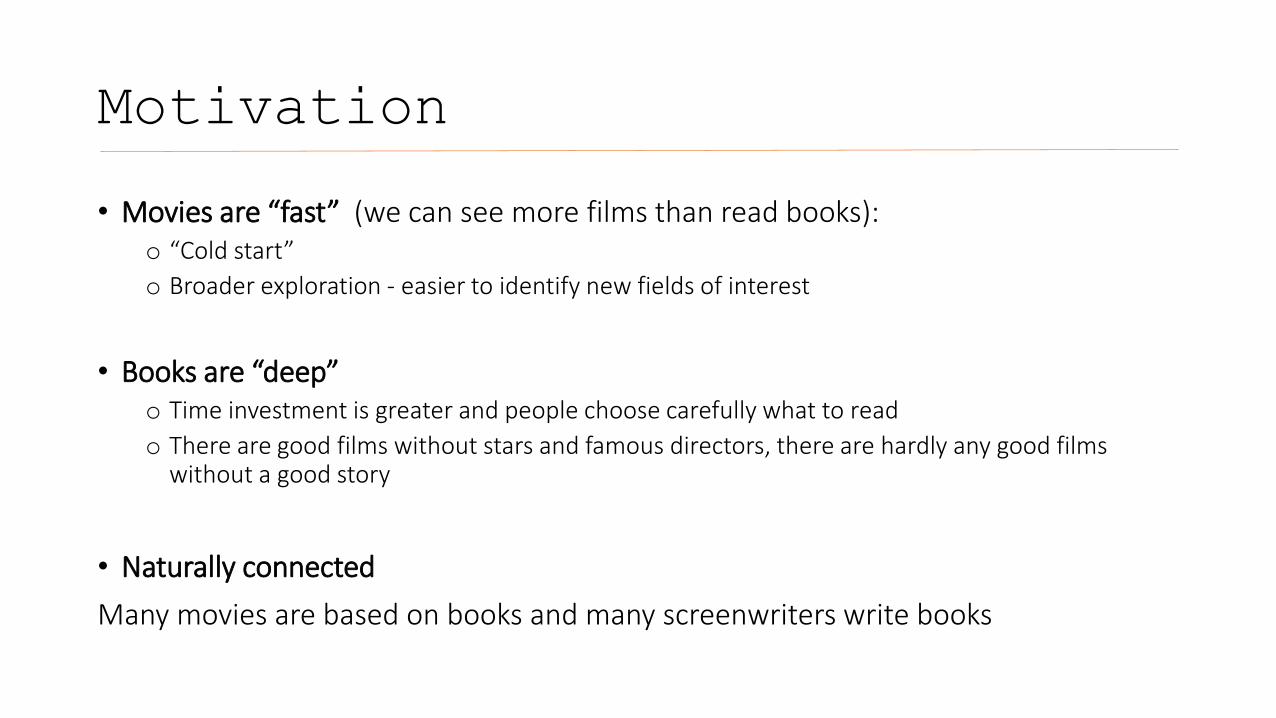
Motivation
• Movies are “fast” (we can see more films than read books):o “Cold start”
o Broader exploration - easier to identify new fields of interest
• Books are “deep”o Time investment is greater and people choose carefully what to read
o There are good films without stars and famous directors, there are hardly any good films without a good story
• Naturally connected
Many movies are based on books and many screenwriters write books
Resources
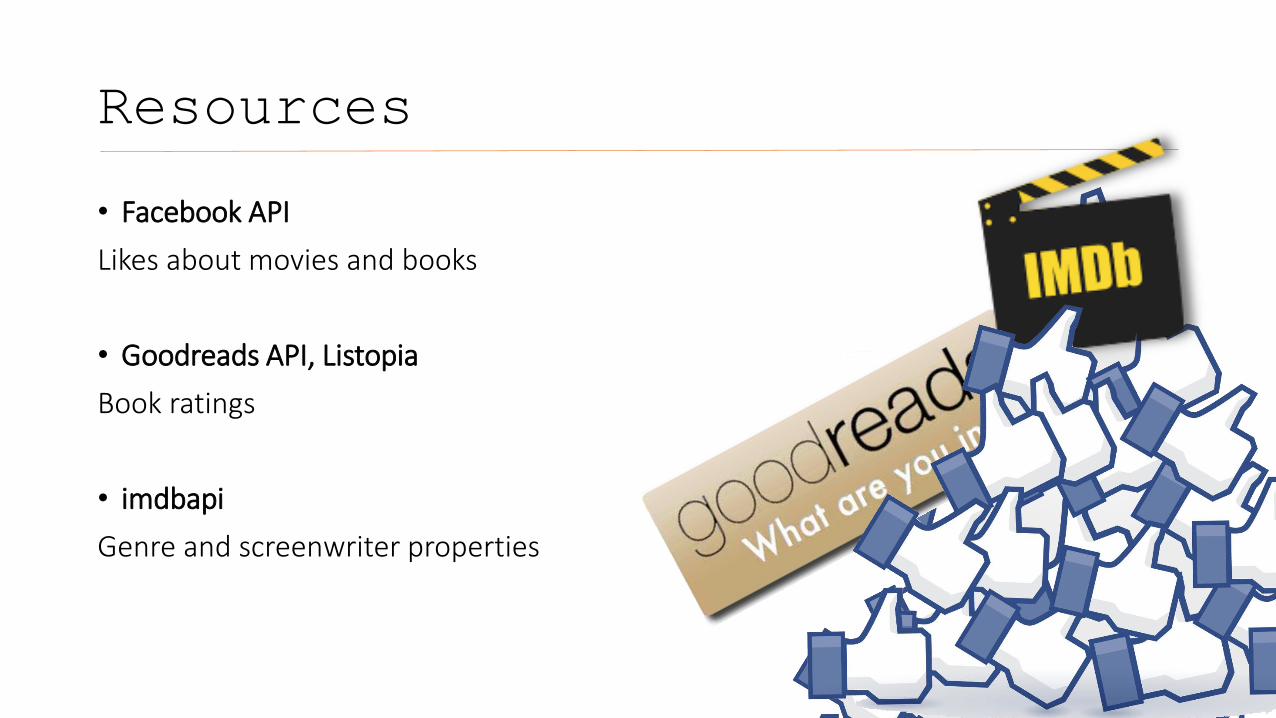
• Facebook API
Likes about movies and books
• Goodreads API, Listopia
Book ratings
• imdbapi
Genre and screenwriter properties

Under Construction Issues
• Privacy - not possible to harvest friends likes without Facebook’s explicit permission
• Incompatibility - Goodreads API works only with XML format (not even DOM)
• Listopia - blocked
• Only one way queries allowed genre => author
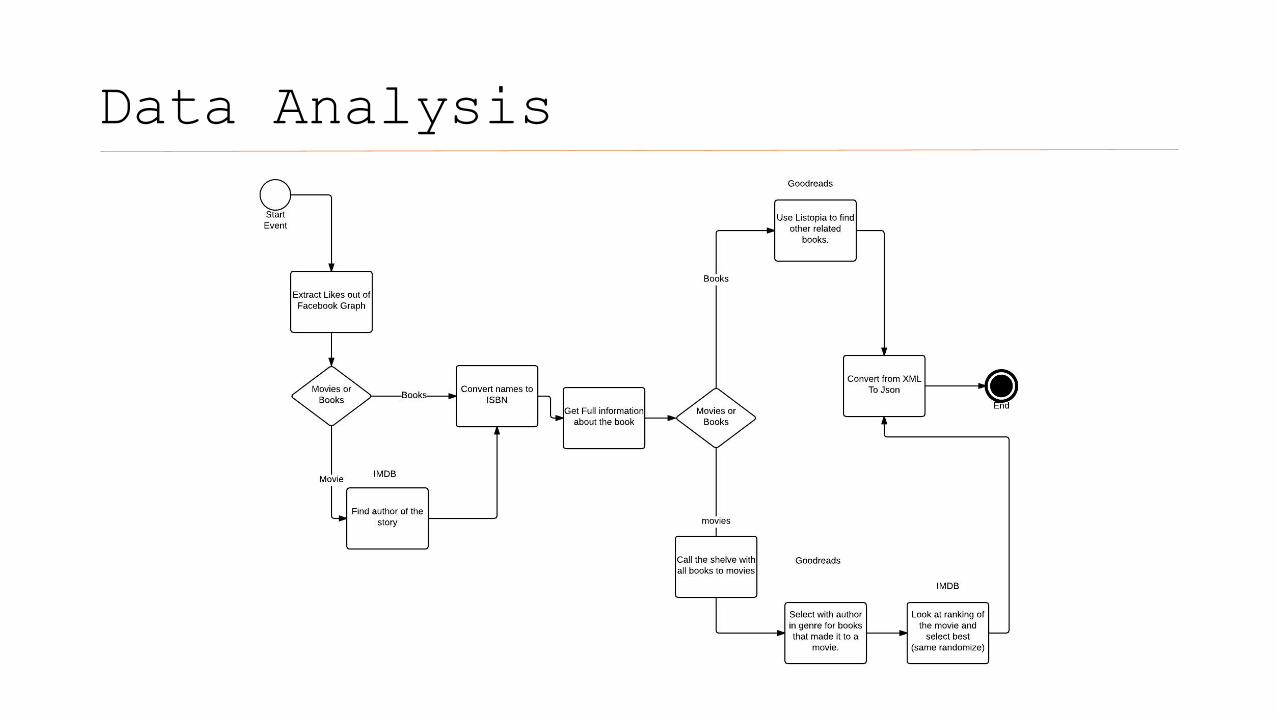
Data Analysis

Book Ratings Similarity

Demo
https://www.youtube.com/watch?v=SgLTt2V2kcg&feature=youtu.be

Who did what
• Sander – development
• Aneta – concept and research
• Sergio – XML to JSON parser development

1
Company Proprietary and Confidential Copyright Info Goes Here Just Like This
Hay fever application
Group 20Sietse HuismanDavid Lopez MejiaGert‐Jan de Graaf
Vrije Universiteit – the social web
2
Company Proprietary and Confidential Copyright Info Goes Here Just Like This
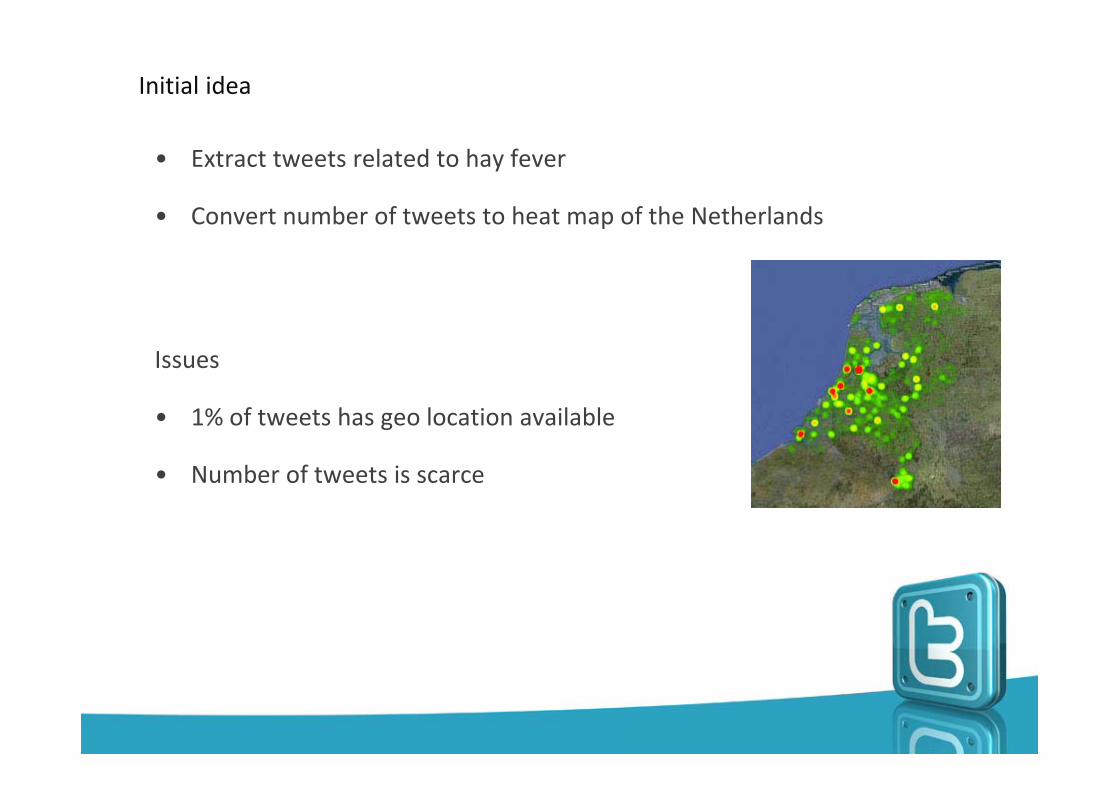
• Extract tweets related to hay fever
• Convert number of tweets to heat map of the Netherlands
Issues
• 1% of tweets has geo location available
• Number of tweets is scarce
Initial idea
3
Company Proprietary and Confidential Copyright Info Goes Here Just Like This
Improved idea - HooikoortsBot
• Flow– Extract hay fever tweets with key word extraction– Use sentiment analysis
• Positive• Negative
– Tweet back to the person “Solution / Preparation”– Data visualization

4
Company Proprietary and Confidential Copyright Info Goes Here Just Like This
Data analysis – key word extraction
• Alchemyapi
5
Company Proprietary and Confidential Copyright Info Goes Here Just Like This
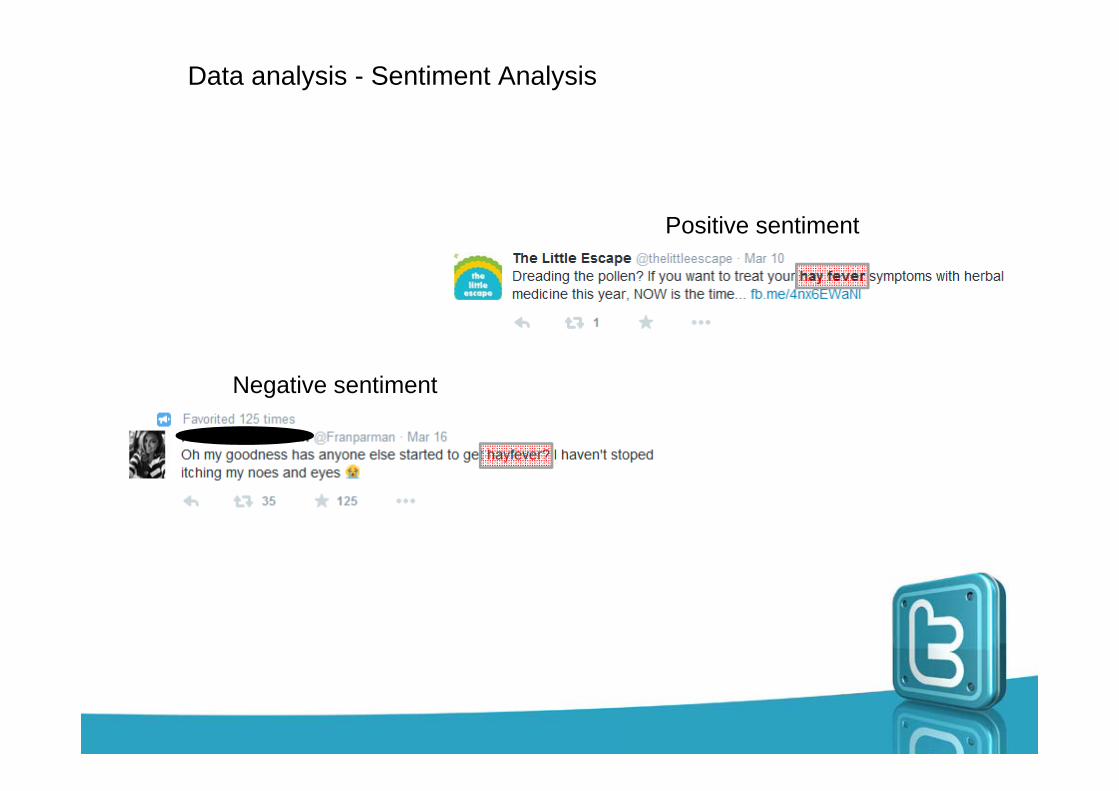
Data analysis - Sentiment Analysis
Positive sentiment
Negative sentiment
6
Company Proprietary and Confidential Copyright Info Goes Here Just Like This
Presenting the HooikoortsBot!

7
Company Proprietary and Confidential Copyright Info Goes Here Just Like This
Example

8
Company Proprietary and Confidential Copyright Info Goes Here Just Like This
Visualization
Sentiment of tweets
Positive Neutral Negative
02468
101214
runny nose itchy eyes dry throat clogged ears groggyness
Symptoms described by users with sentiment analysis
Positive Neurtal Negative
9
Company Proprietary and Confidential Copyright Info Goes Here Just Like This
Future work
• Heat map• Connect twitter users with similar
symptoms

Linked movie location
Group 21:Fleur, Elmar & Arnold
Planning● Introduction - the initial idea● Our application
○ The idea○ Screenshots
● Acknowledgements● Conclusion● Questions
Introduction - the initial idea● Movies from the Facebook API
○ Description & Actor from DBpedia
● Maybe add:○ Recommendations based on genre + director○ Film location from Linkedmdb plotted on Google
maps with Sgvizler
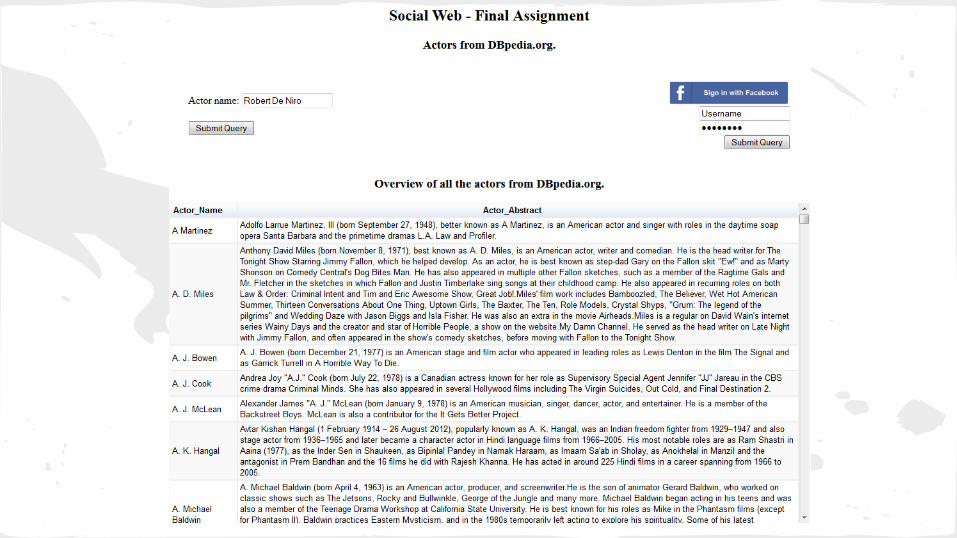
Our application - the idea● Lookup actor information
○ DBpedia + Sgvizler on HTML/PHP
● Film information from Assignment 3 is used
● Login with facebook


AcknowledgementsArnold: Presentation, Application, DocumentationElmar: Documentation, ApplicationFleur: Presentation, Documentation
Conclusion● Linkedmdb is buggy and the right
information was difficult to retrieve.
● We are not developers, so building an application was hard.

MovieVisVisualization of opinions and sentiment of movie reviews
Group 22: Adriatik BedjetiBoris de GrootEdgar Weidema
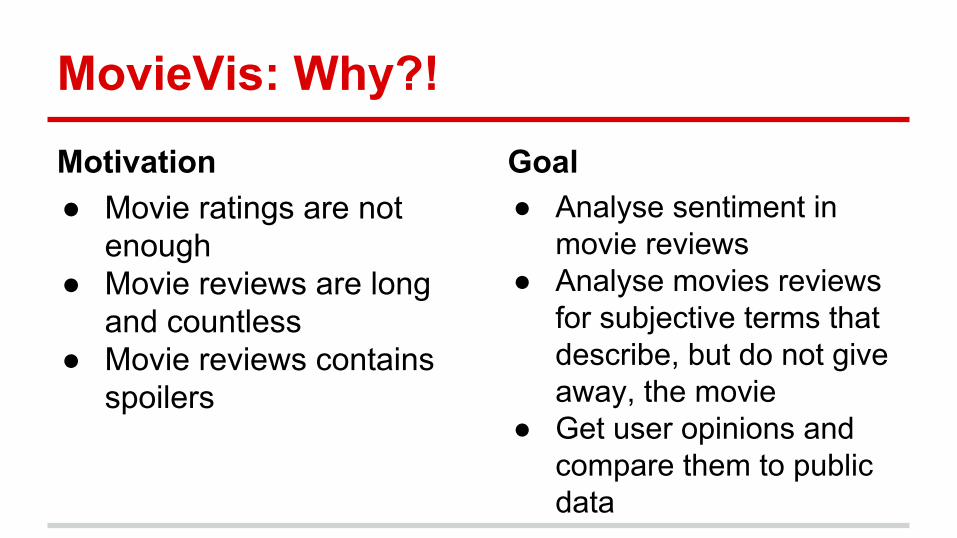
MovieVis: Why?!Motivation● Movie ratings are not
enough● Movie reviews are long
and countless● Movie reviews contains
spoilers
Goal● Analyse sentiment in
movie reviews● Analyse movies reviews
for subjective terms that describe, but do not give away, the movie
● Get user opinions and compare them to public data
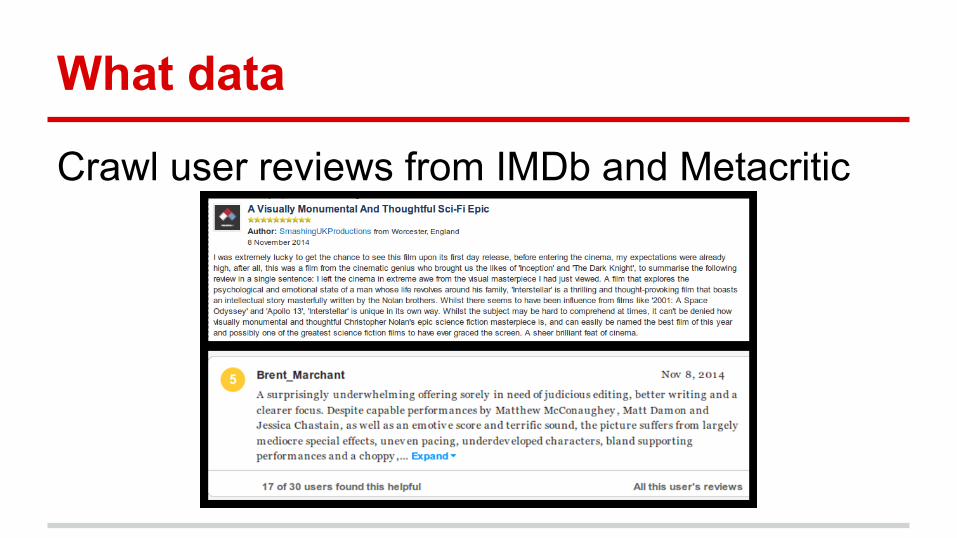
What data
Crawl user reviews from IMDb and Metacritic
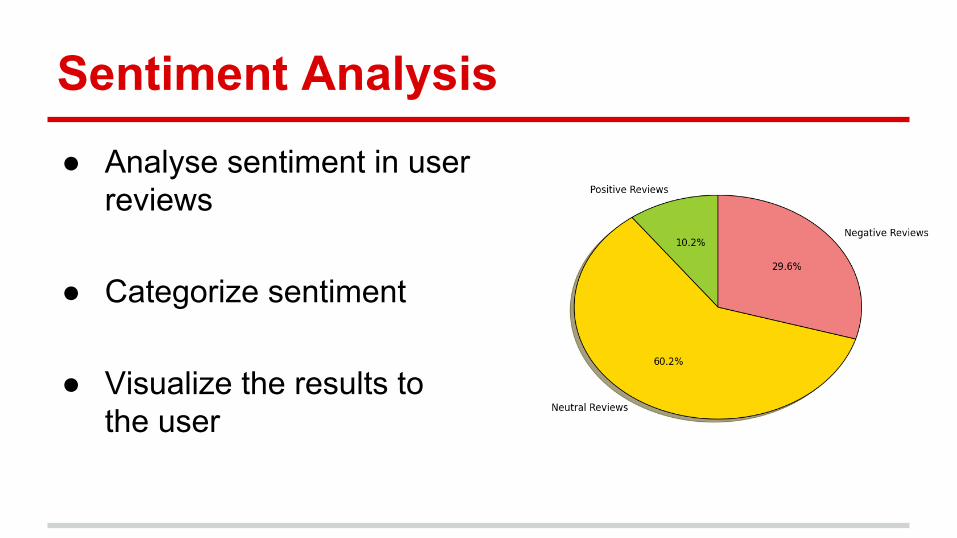
Sentiment Analysis● Analyse sentiment in user
reviews
● Categorize sentiment
● Visualize the results to the user
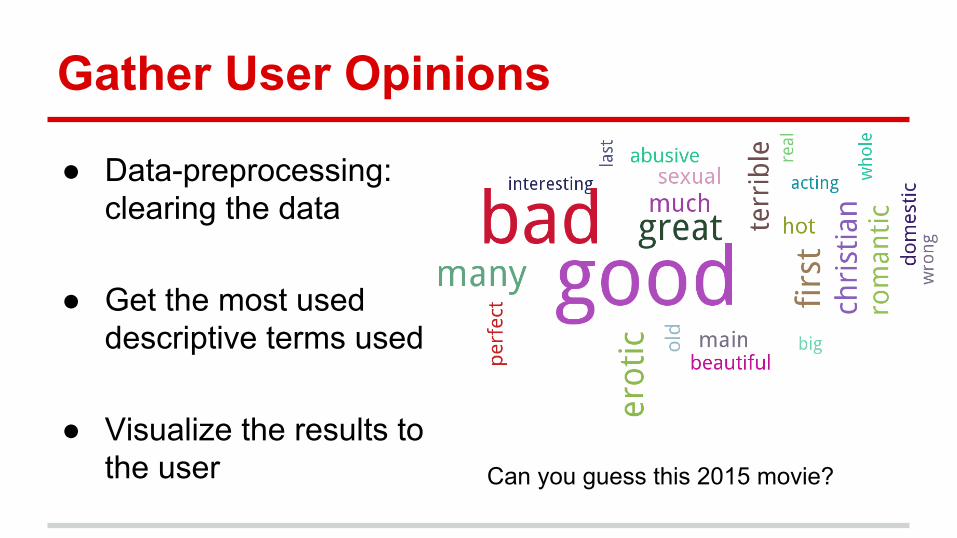
Gather User Opinions
● Data-preprocessing: clearing the data
● Get the most used descriptive terms used
● Visualize the results to the user Can you guess this 2015 movie?


Individual Work● Adriatik: Project idea, visual design, theoretical
background● Boris: Sentiment analysis & User opinion programming● Edgar: IMDB Crawling, MetaCritic Crawling, Data
preprocessing

Duration of trending topics
Group 23Felicia Hotie
Mark van der LaanMarc Went

Introduction
Aim: Gain insight in topic trending between different social media platforms and a historic social media source
Find answers to quenstions like:Are trending topics of shorter relevance in comparison to 20 years ago?

Clustered by social media source
● The Digital City (1995)

Approach
● How it works:
- Retrieve posts from the 3 sources with a search query- Sort by date- Count frequency of posts per date- Visualise in graph
● Clustered by topic (query) and social media source

Interface
● Mine data using the Reddit API and Python● Mine data from DDS using a self created parser● Mine data from Twitter, first prototype is manual labor● Interface created with HTML5● Graph plotted with JavaScript

Screenshots

Evaluation / improvements
● Limitations:- Reddit API allows only 100 search results
● Future work:- Add more data to compare. E.g. compare word frequencies per topic and
source- Add more social media sources

Group 24

RoasTV David
Carlo
Priscilla

The app
! Its a forum that shows info of a TV show, where people can give their opinions about it
! To see a discussion you must have an opinion toward the particular TV show
! People get more points when they make more posts, and when they become more influencial

Data ! Create an RDF store using Tomcat
! Storing all the stuctured used inthe application for future reference
! Data sources ! DBpedia
! Information about TV show for reference
! Twitter ! Positive and negative tweets related to the show

Analysis ! Co-occurrence of words on posts
! Influences Patterns ! Track users attitude towards the different shows ! Track general opinion and discussion intensity ! Track general opinion on Twitter periodically
! *Possible in another social network
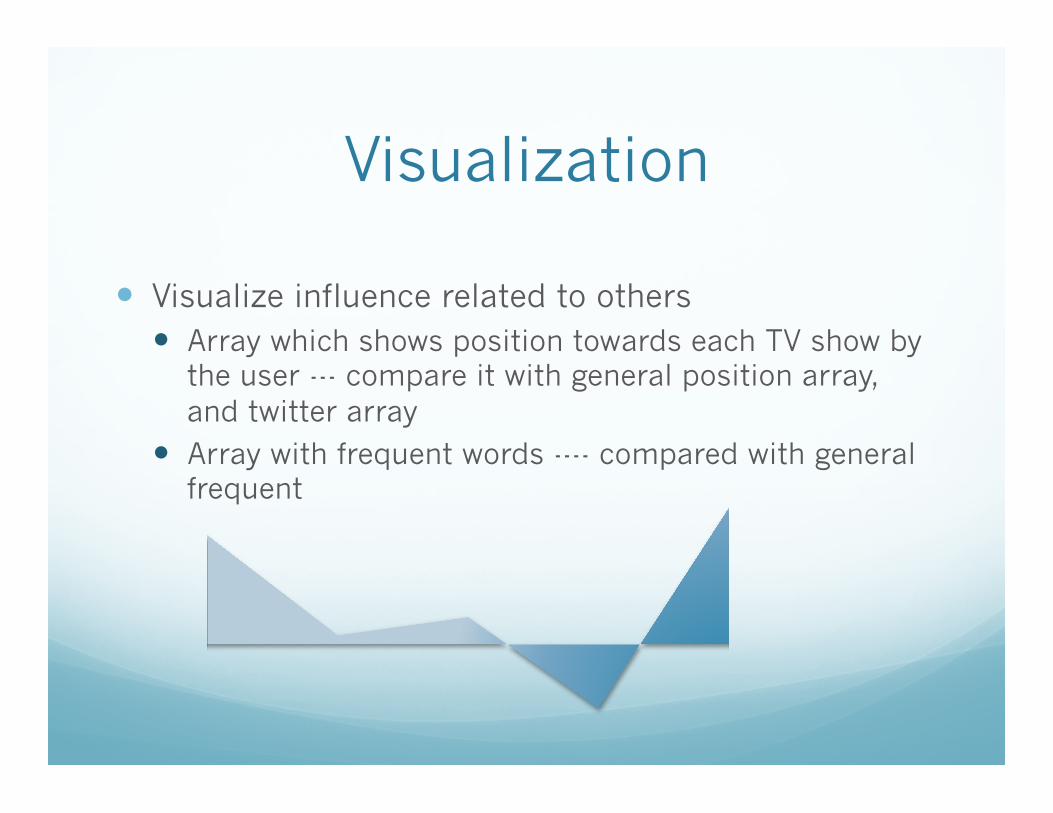
Visualization
! Visualize influence related to others ! Array which shows position towards each TV show by
the user --- compare it with general position array, and twitter array
! Array with frequent words ---- compared with general frequent
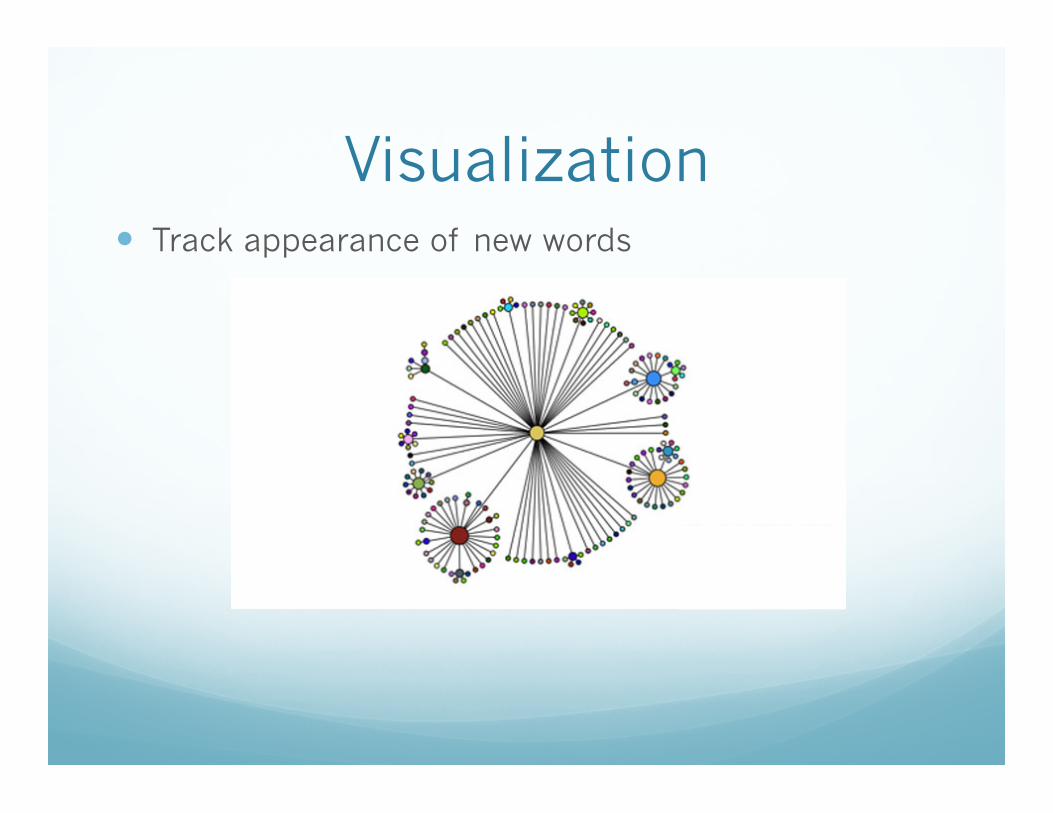
! Track appearance of new words
Visualization

Group 26 Recommendation App
Emmanouil Pavlidakis
eps780
Jaideep Khandelwal
jkl650
Andreas Manios
ams620
Course: Social Web 2015
Group : 26
1

What is our app? It is a Facebook Application.
Its purpose to provide personalized recommendations for movies based on the similarity score.
Differences between our application and other movie recommendation sites.
The rating for each movie is unique for a particular user and that ratingwill be based on his preferences and his personal profile.
The recommended movies will be a selection of movies based on the similarity score of two or more users.
The user can register and login with his Facebook account.
At the registration the app asks for permissions and it imports some personal information and the movies he has liked.
After the registration the user is asked to select genre/s .
Based on the genre he/she has selected and the movies from FB, a list of movies is displayed to him. This list contains :
1. Movies that the user likes in his FB account.
2. The most popular and highly rated movies that belong to the genres that he/she has selected.
Finally, the user is asked to rate this list of movies.
2

What is the similarity score? From these information (movies ratings) a personal profile has been created for each user.
By the use of it the App is able to calculate the similarity score between users.
After the registration and the creation of the Personal profile, the user is always able to rate new movies that he/she sees in his timeline.
As a result the similarity score becomes more accurate.
The similarity score is a percentage that displays, in which degree the user that has logged-in, has similar or identical preferences in movies with
other users.
It is calculated based on the movies that users has rated.
And it will be different for each user or for a pair of users .
E.g. if user_a has similarity score 80% with user_b, user_b may have 60% similarity score with user_a.
In the case that the similarity score of the logged-in user is 0 (worst case), the system recommends to that user the most popular movies based
on the selection of genre.
As a result the user has more involvement with the system.
3

Social Aspect The logged-in user :
1. Sees a list of the users based on high similarity score.
He/she is able to follow those users, see their profile and create one way relationship.
Also, the logged-in user is able to see the movies that these users has ratted.
2. Following users.
The logged-in user is able to follow other users.
As a result the user :
Can get notifications if these users rate a new movie.
Can send them messages.
Can ask them for recommendations.
3. Get Recommendations about new movies that other users has rated.
These recommendations will be based on the users that the logged-in user has high
similarity score.
4
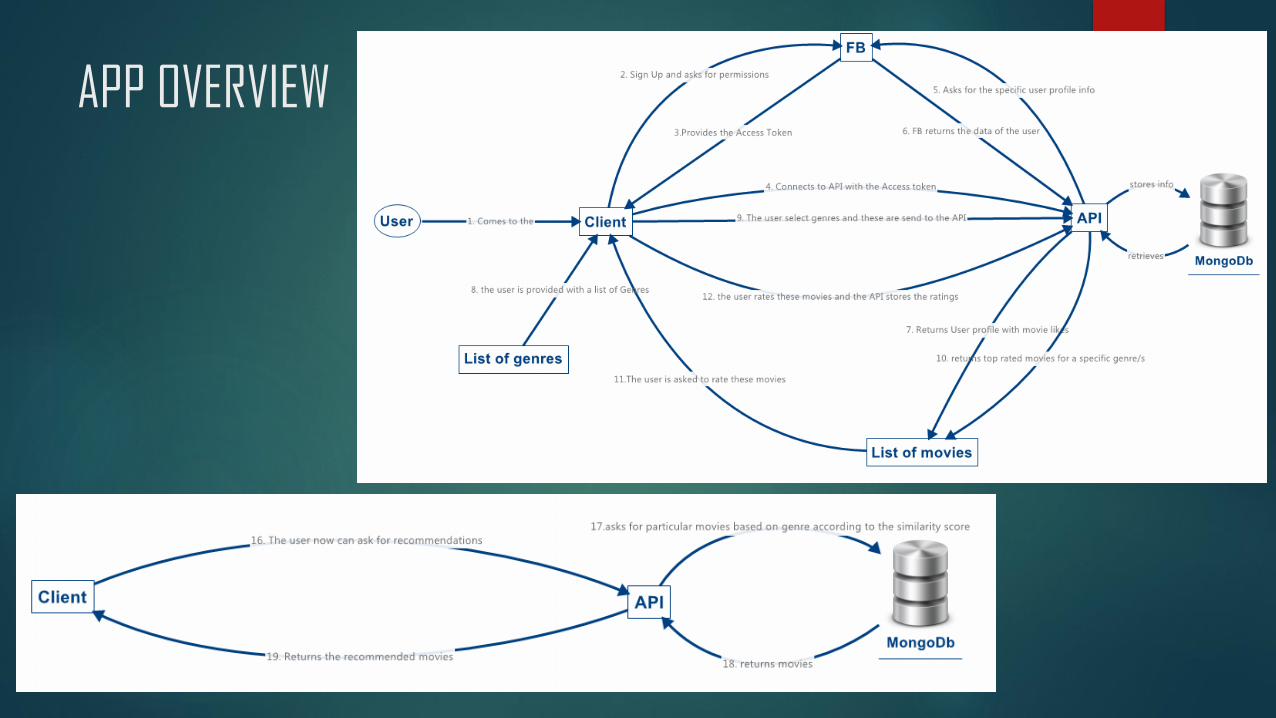
APP OVERVIEW 5

Screen Casts of the App 1/2 6
Login and Registration by FB account
The user after the registration selects genres
The user is asked to rate movies based on the genres that he has selected
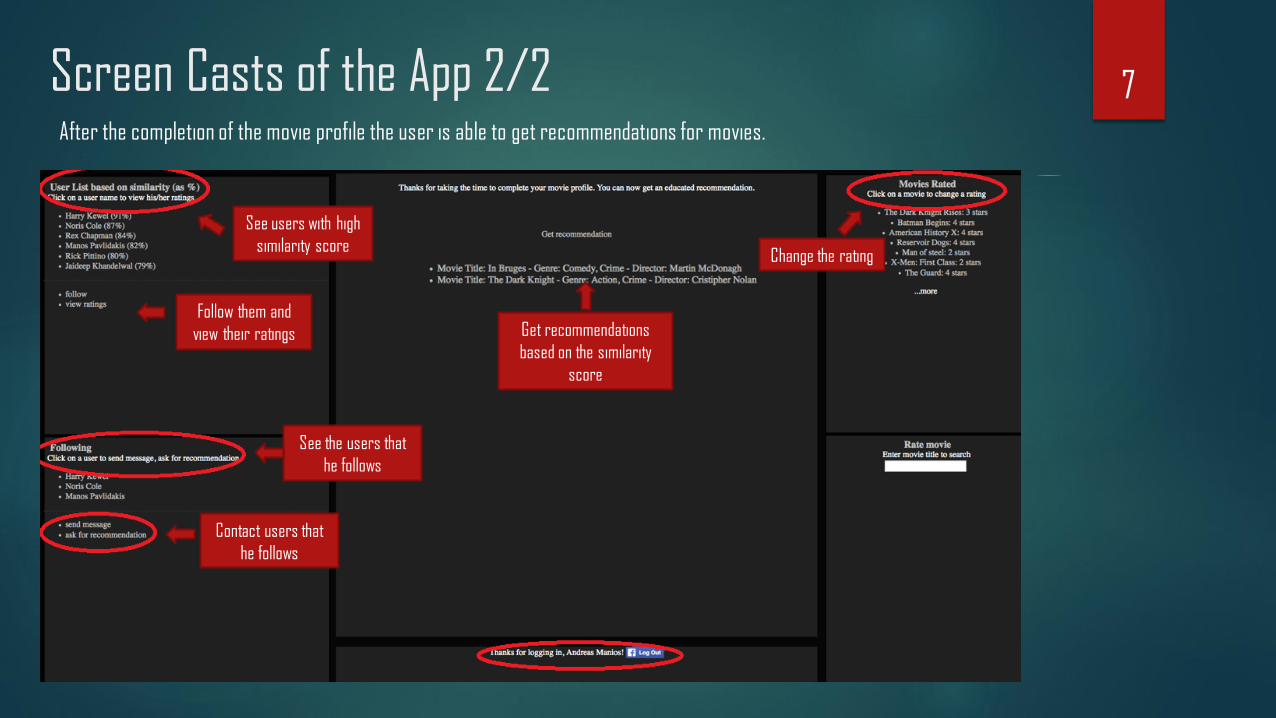
7Screen Casts of the App 2/2After the completion of the movie profile the user is able to get recommendations for movies.
See users with high
similarity score
Follow them and
view their ratings Get recommendations
based on the similarity
score
Change the rating
See the users that
he follows
Contact users that
he follows

Individual Work Andreas Manios
Front End
Emmanouil Pavlidakis
The theoretical part of the report and the creation of the graphs.
Jaideep Khandelwal
Back End
Links
Back end code : https://github.com/jdk2588/socialweb
Application Link : http://dessad.altervista.org/yars/main.html
8

COMPARING USAGE OF TAGS PER COUNTRY IN A SPECIFIC TIME PERIOD
Group 27: Annelore Franke, Daniel Gallo, Lars Rouvoet and Reza Mahmood KhalesiThe Social Web 2015

COMPARING USAGE OF TAGS PER COUNTRY IN A SPECIFIC TIME PERIOD
#happy
worldwide
period of time
1) Location Clustering:
Hashtag behaviour by
country
2) Hashtag behavior
worldwide over time analysis
#happy
#sad
The Netherlands
#galaxy
#iphone
#Bavaria
#Heineken
3) Comparisons between
hashtags by country
period of time

Web InterfaceUser
Twitter API
Web Framework
APPLICATION ARCHITECTURE
… and other sources
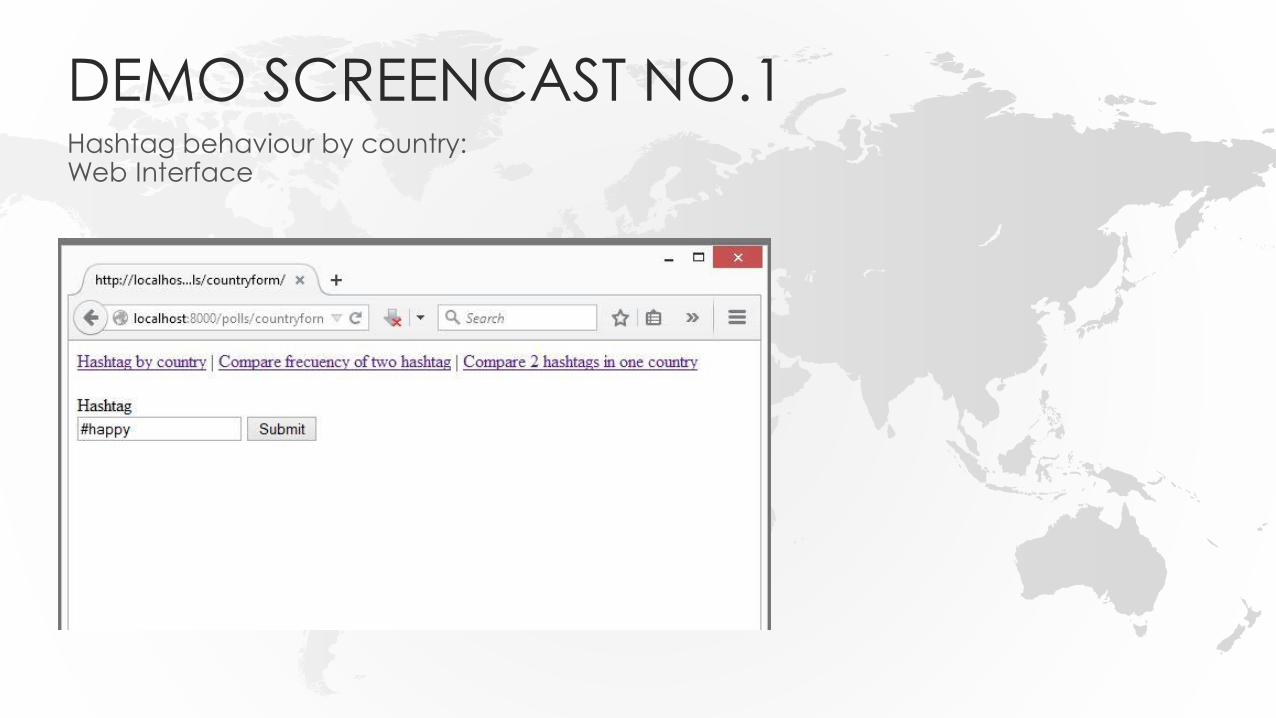
DEMO SCREENCAST NO.1Hashtag behaviour by country:Web Interface
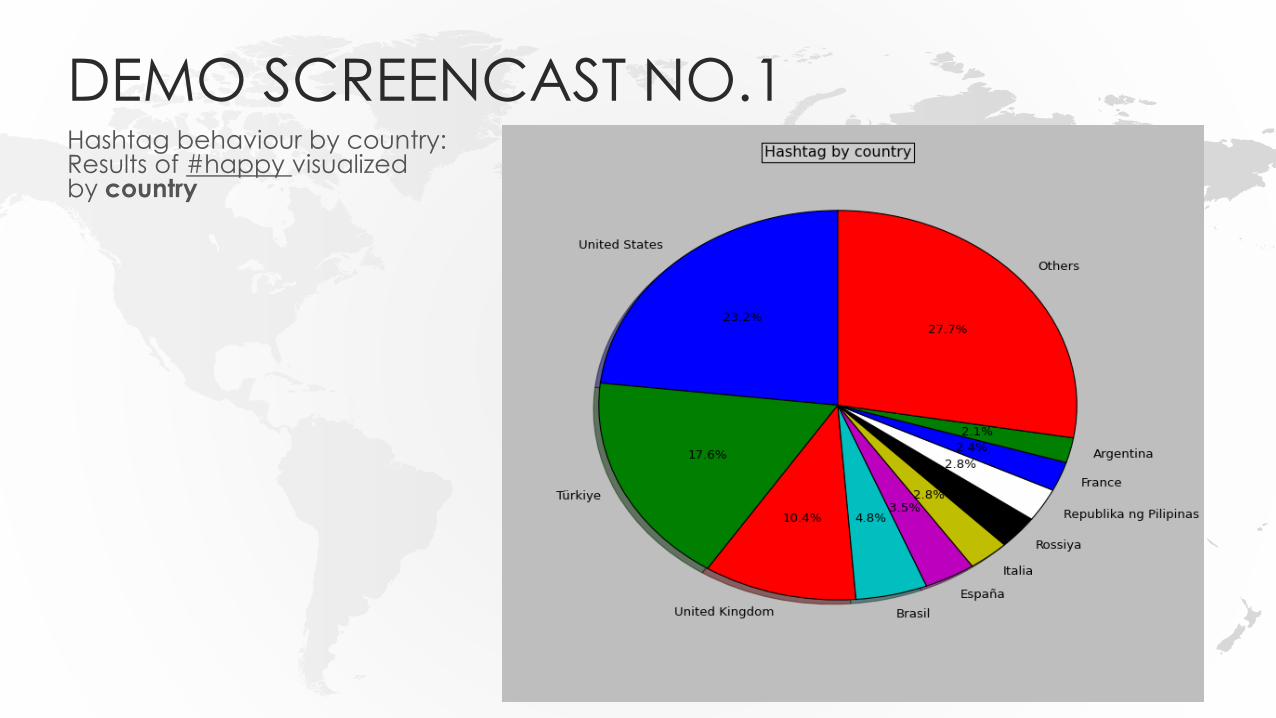
DEMO SCREENCAST NO.1Hashtag behaviour by country:Results of #happy visualizedby country

DEMO SCREENCAST NO.2Comparison of 2 hashtags worldwide:Web Interface
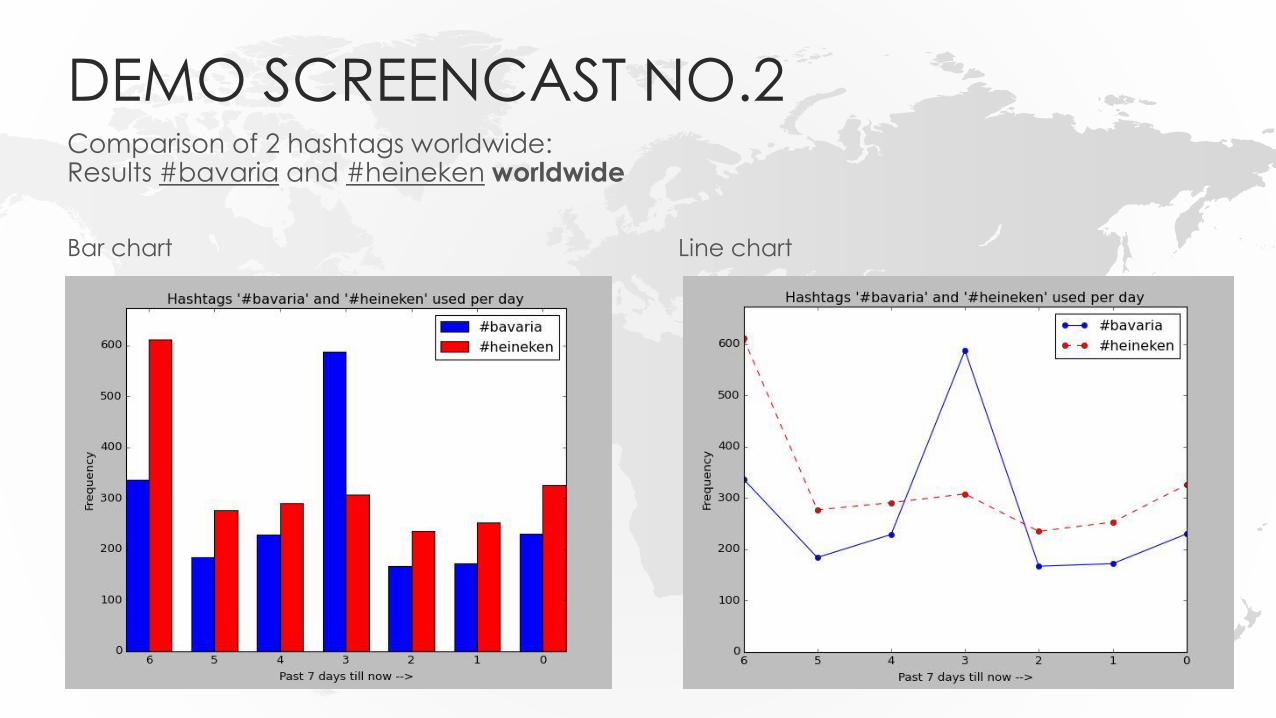
DEMO SCREENCAST NO.2Comparison of 2 hashtags worldwide:Results #bavaria and #heineken worldwide
Bar chart Line chart

DEMO SCREENCAST NO.3Comparison of 2 hashtags in a specific country:Web Interface

DEMO SCREENCAST NO.3Comparison of 2 hashtags in a specific country:Results of ‘happy’ and ‘sad’ in The Netherlands
Bar chart Line chart

THANK YOU FOR LISTENINGARE THERE ANY QUESTIONS?
Group 27: Annelore Franke, Daniel Gallo, Lars Rouvoet and Reza Mahmood KhalesiThe Social Web 2015

Social Web @VU���2015
Final Student PresentationsLecturer: Lora Aroyo
The Network InstituteVU University Amsterdam