Embed Size (px)
Citation preview

AN EVALUATION OF THE EFFECTIVENESS OF CYBER CHARTER SCHOOL SCIENCE PROGRAMS FOR HIGH
SCHOOL STUDENTS IN PENNSYLVANIA
DENNIS C. WILSON
Introduction
• Pennsylvania is a pioneer in cyber charter schools
• Oldest school opened in 1998
• Second only to Ohio in number of students enrolled (~35,000).
Background on Cyber Charter Schools
• Act 22 of 1997 – PA’s Charter School Law
• Act 88 of 2002 – Put Cyber Charter Schools under PA DOE.
• 16 Cyber Charters have been issued
• 14 still in operation.

Literature Review
• Very few studies have been done the effectiveness of online learning.
• First adopters were large research universities.
• Virginia Tech Cyberschool – 1994.

No Child Left Behind
• Triggered an explosion of charter schools.
• 2009 – More than 5,000 charter schools nationwide.
• Little evidence that they perform better than traditional schools.

U. S. Department of Education Meta-Study: 2010
• Searched literature between 1998-2006.
• Found 99 studies comparing face-to-face learning with online or blended learning.
• Only 9 involved K-12 students.
• Rest were secondary education.
Of the Nine K-12 Studies
• Some studies showed a positive result for online learning.
• Others found no difference.
• Examined: Interactivity, individualization, reflection, online simulation.
• Little conclusive evidence.

Matthew Vick - 2012
• University of Wisconsin-Whitewater.
• Surveyed science curricula at a cyber charter school.
• Compared them to Bloom’s Taxonomy.
• Looked at whether they used virtual or at home lab projects.
Limitations to Vick’s Study
• Looked at only one school.
• Did not assess outcomes.
National Education Policy Center
• 2013 Report
• Sharply criticized cyber charter schools
• Found students at PA cyber charter schools performed significantly lower in reading and math than brick-and-mortar charter schools.

National Education Policy Center
• Typical charter school student: African-American and economically disadvantaged.
• Typical cyber charter school student: White and not economically disadvantaged.

National Education Policy Center
• Underrepresented at cyber charter schools:– Minorities– Economically disadvantaged– Disabled/special needs– English language learners

Method
• PSSA 11th Grade Science Proficiency Examination
• Academic years from 08-09 through 11-12
• Compared to statewide results

12 Cyber Charter Schools in operation
• Two excluded – Had less than 20 students take the exam
• One only operating for 1 year prior.
• Leaving 10 for comparison.
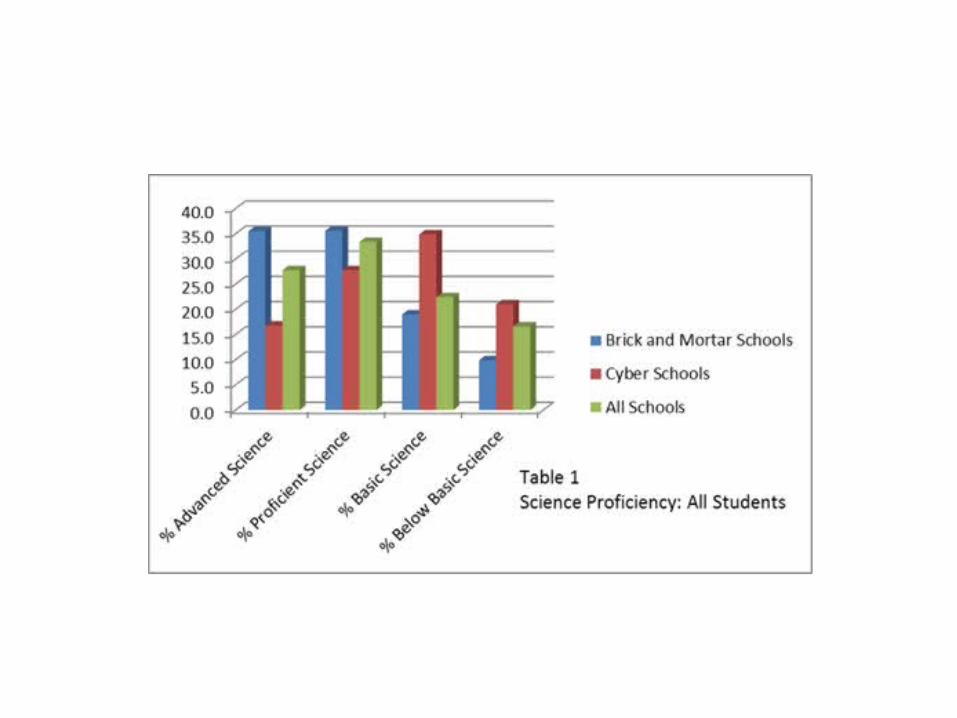
Overall 2011-2012 Academic Year

Categories Not Examined• Insufficient Numbers at Cyber Charter Schools:
⁻ Asian Students
⁻ Multi-ethnic Students
⁻ Native American Students
⁻ English Language Learners (ELL)
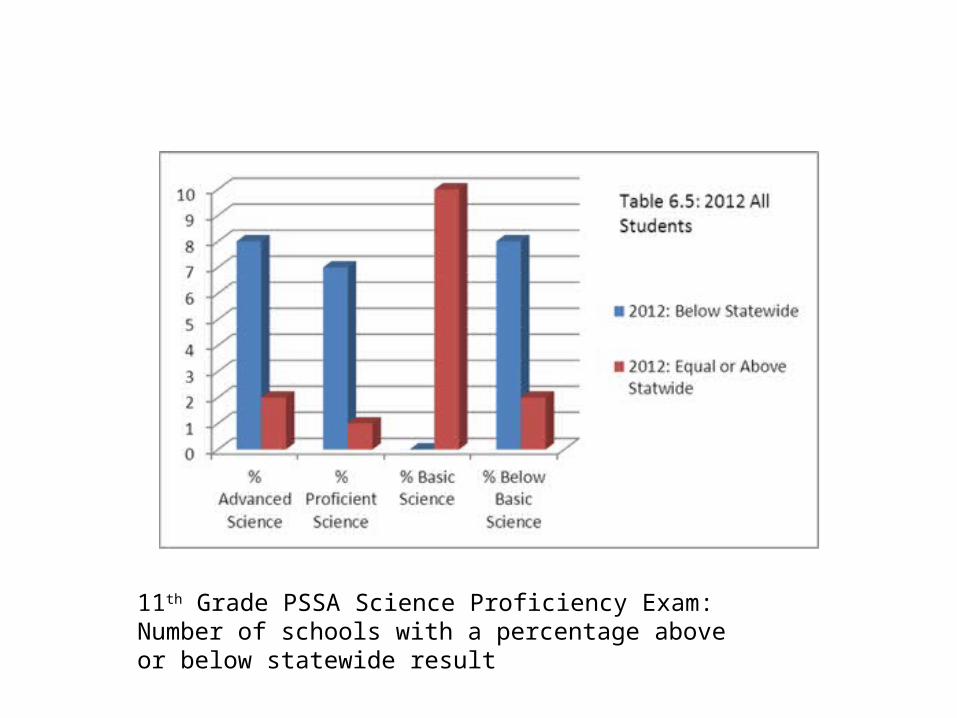
All Students
11th Grade PSSA Science Proficiency Exam: Number of schools with a percentage above or below statewide result

African-American Students• In any given year, only 3-5 schools had 10 or
more African-American students taking the exam.
• 2008: African-Americans were 5% of 11th grade cyber charter school students.
• 2012: Rose to 11%
• First time matched statewide percentage.
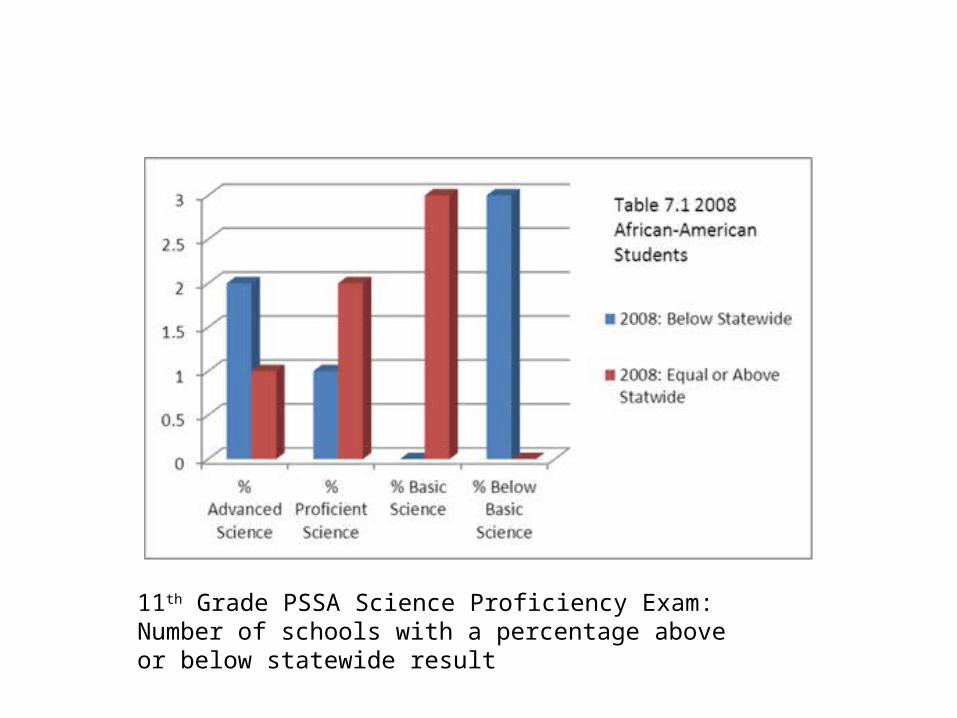
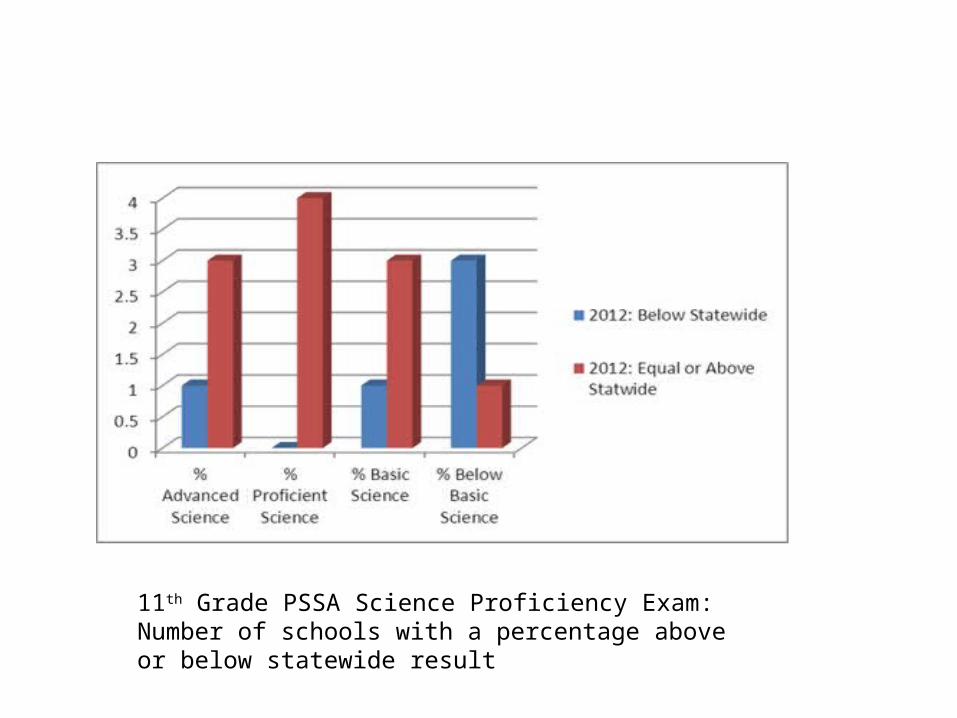
African-American Students
11th Grade PSSA Science Proficiency Exam: Number of schools with a percentage above or below statewide result

African-American Students
11th Grade PSSA Science Proficiency Exam: Number of schools with a percentage above or below statewide result

Hispanic Students• 2008-2010 less than 20 Hispanic students took
the 11th grade exam.
• All were attending PA Cyber.
• 2011: Jumped 42 students at 3 three schools.
• 2012: 108 at 4 schools.

Hispanic Students
11th Grade PSSA Science Proficiency Exam: Number of schools with a percentage above or below statewide result
Hispanic Students
11th Grade PSSA Science Proficiency Exam: Number of schools with a percentage above or below statewide result

Caucasian Students
• Largest group
• Overwhelming majority
• Did Poorly overall.
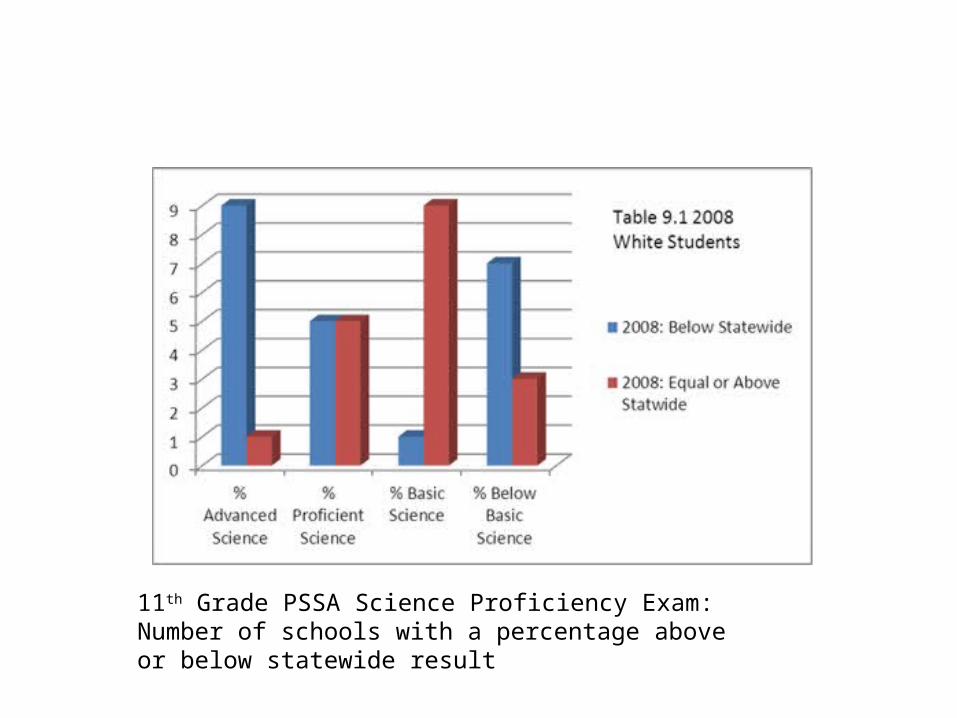
Caucasian Students
11th Grade PSSA Science Proficiency Exam: Number of schools with a percentage above or below statewide result

Caucasian Students
11th Grade PSSA Science Proficiency Exam: Number of schools with a percentage above or below statewide result

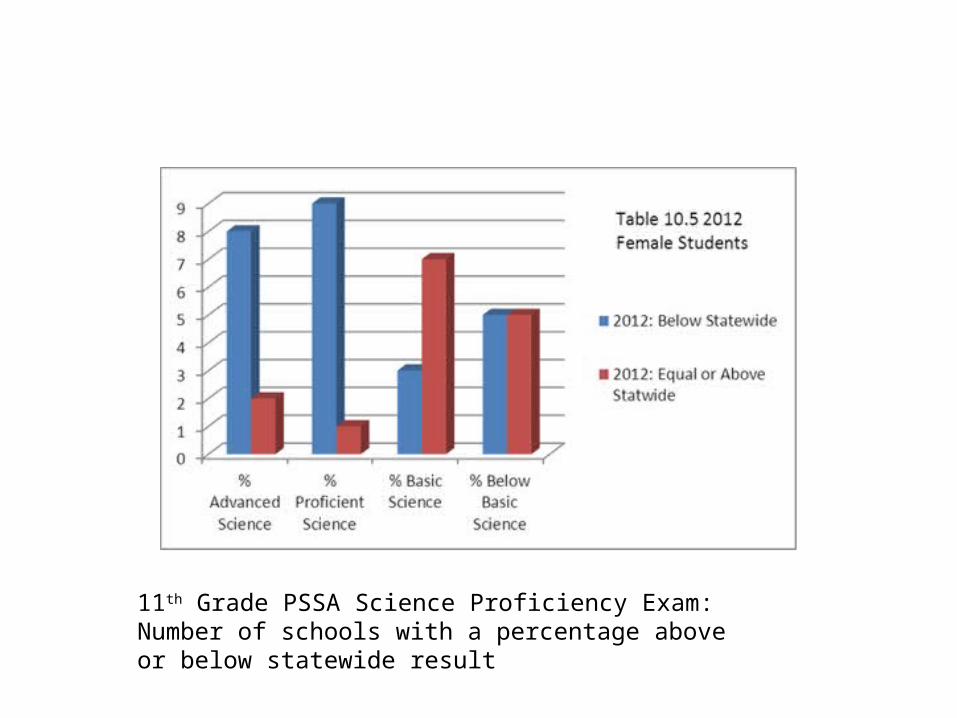
Female Students
11th Grade PSSA Science Proficiency Exam: Number of schools with a percentage above or below statewide result
Female Students
11th Grade PSSA Science Proficiency Exam: Number of schools with a percentage above or below statewide result

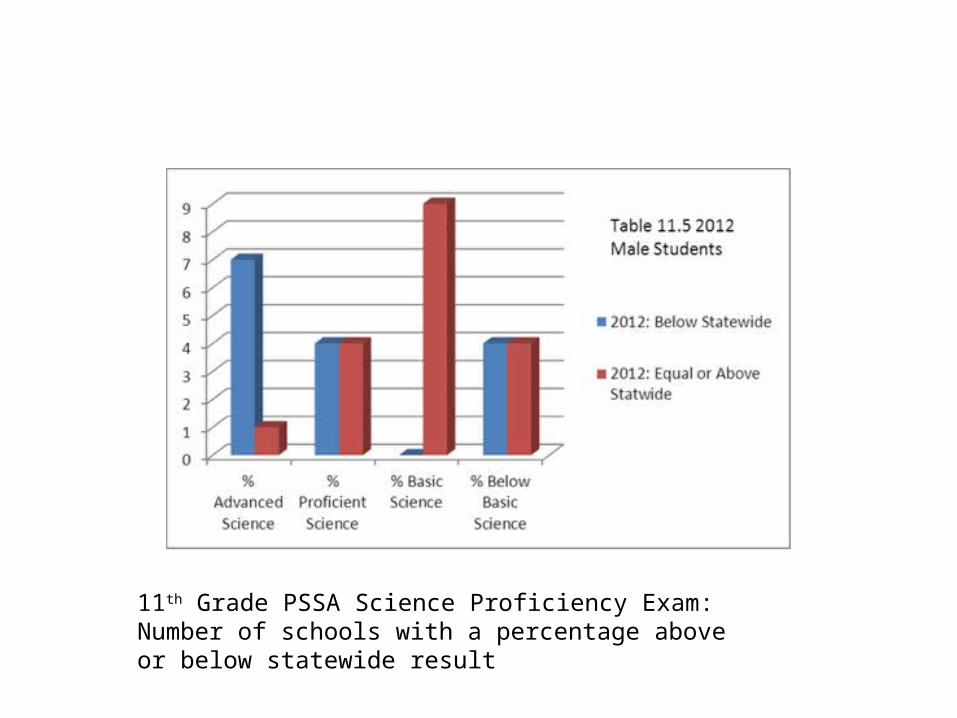
Male Students
11th Grade PSSA Science Proficiency Exam: Number of schools with a percentage above or below statewide result
Male Students
11th Grade PSSA Science Proficiency Exam: Number of schools with a percentage above or below statewide result
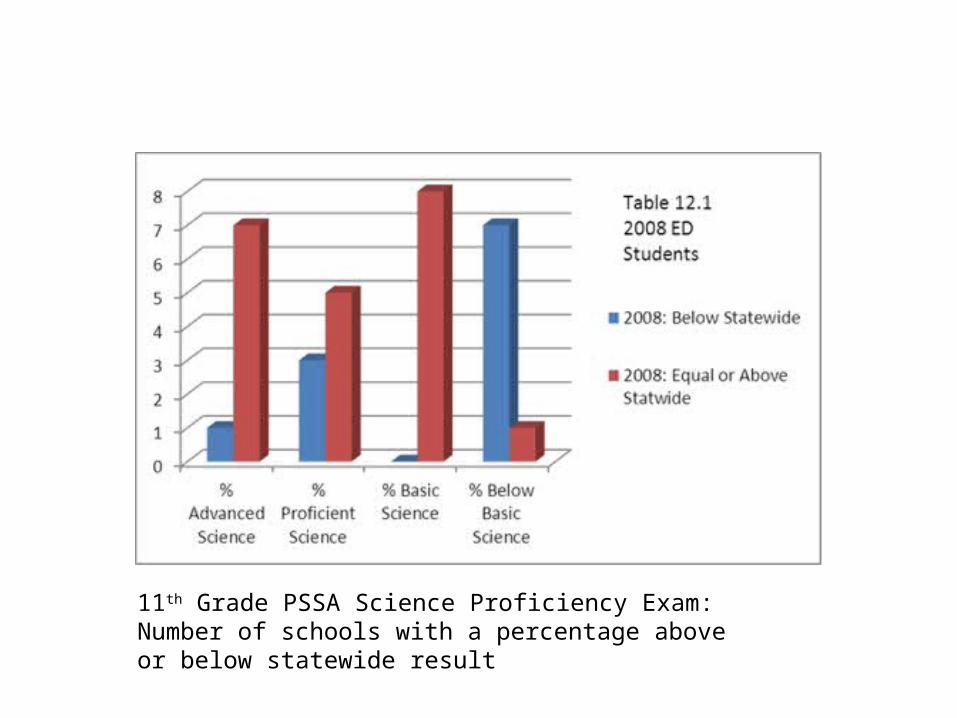
Economically Disadvantaged Students
11th Grade PSSA Science Proficiency Exam: Number of schools with a percentage above or below statewide result
Economically Disadvantaged Students
11th Grade PSSA Science Proficiency Exam: Number of schools with a percentage above or below statewide result

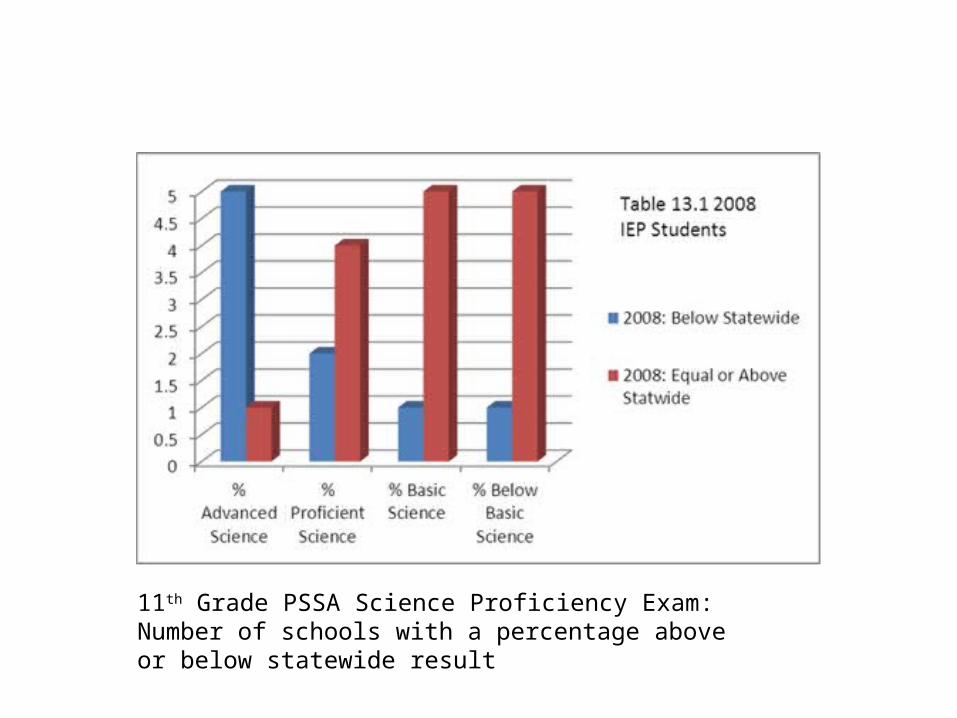
Individualized Education Program Students
11th Grade PSSA Science Proficiency Exam: Number of schools with a percentage above or below statewide result
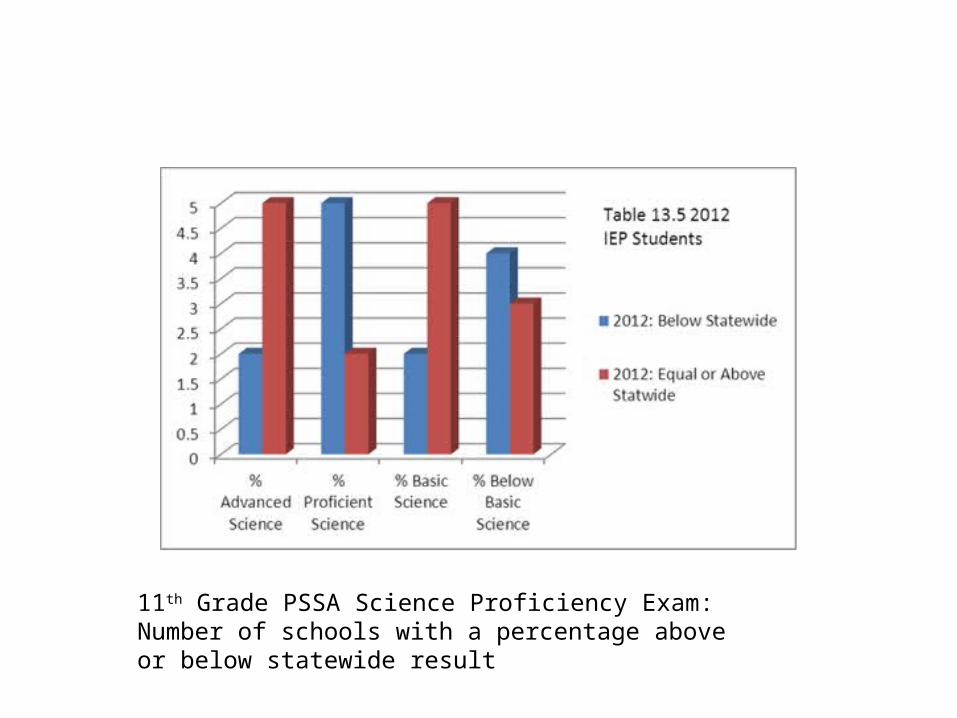
Individualized Education Program Students
11th Grade PSSA Science Proficiency Exam: Number of schools with a percentage above or below statewide result

Cyber Charter School Profiles• Ten Schools
• Five Years of Data
• Looking for improvement or Decline
• Proficient = Advanced + Proficient
• Also looked at graduation rates and AYP

21st Century Cyber Charter School
• Five Year Average Proficient or Advanced Percentage: 48.1%
• Statewide Five Year Average: 39.6%• Graduation Rate: 66%• Statewide Graduation Rate: 83%• AYP Status: Warning• Years of Operation: 12

21st Century Cyber Charter School

Commonwealth Connections
• Five Year Average Proficient or Advanced Percentage: 27.3%
• Statewide Five Year Average: 39.6% • Graduation Rate: 83%• Statewide Graduation Rate: 83%• AYP Status: Second Year Correction Action II• Years of Operation: 10

Commonwealth Connections
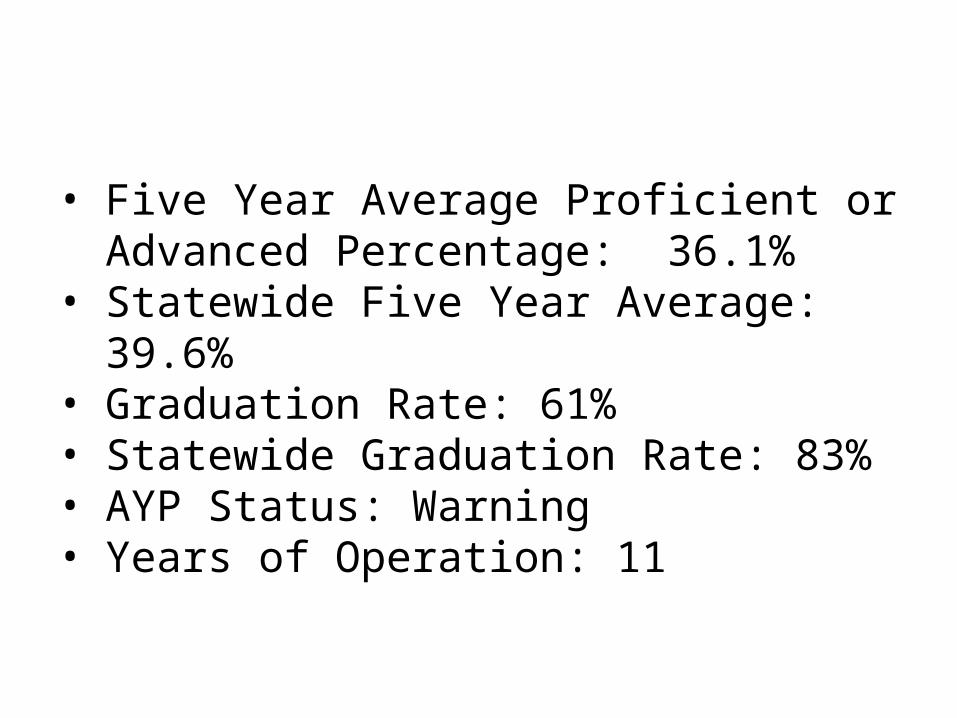
PA Cyber
• Five Year Average Proficient or Advanced Percentage: 36.1%
• Statewide Five Year Average: 39.6%• Graduation Rate: 61%• Statewide Graduation Rate: 83%• AYP Status: Warning• Years of Operation: 11

PA Cyber

Agora CS
• Five Year Average Proficient or Advanced Percentage: 20.0%
• Statewide Five Year Average: 39.6%• Graduation Rate: 49%• Statewide Graduation Rate: 83%• AYP Status: Third Year Correction Action II• Years of Operation: 8

Agora CS

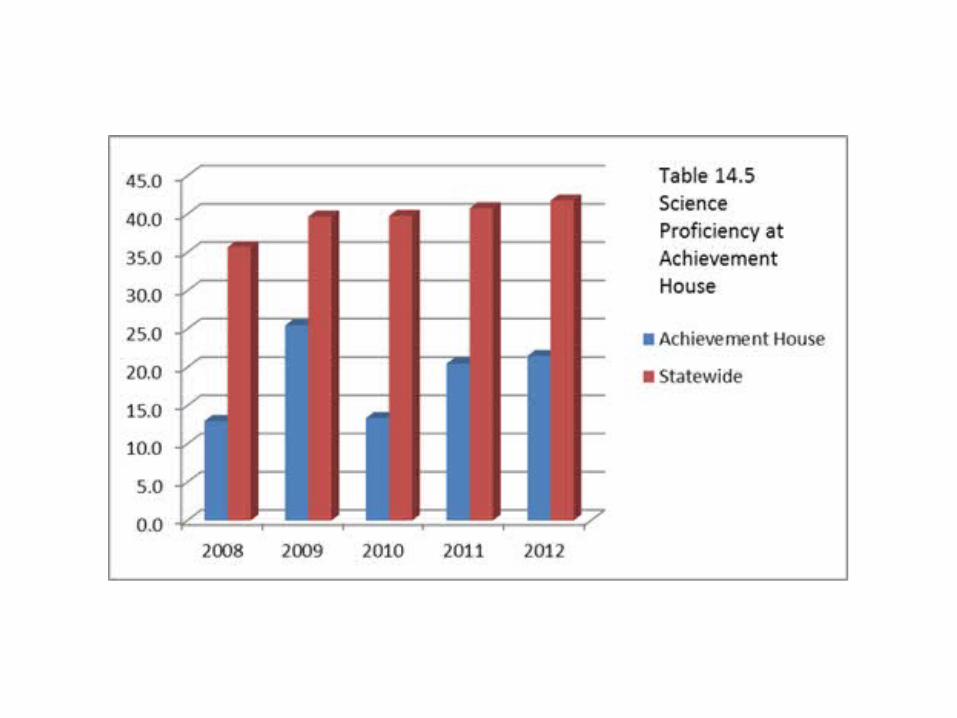
Achievement House
• Five Year Average Proficient or Advanced Percentage: 18.8%
• Statewide Five Year Average: 39.6%• Graduation Rate: 33%• Statewide Graduation Rate: 83%• AYP Status: Second Year Correction Action II• Years of Operation: 9
Achievement House
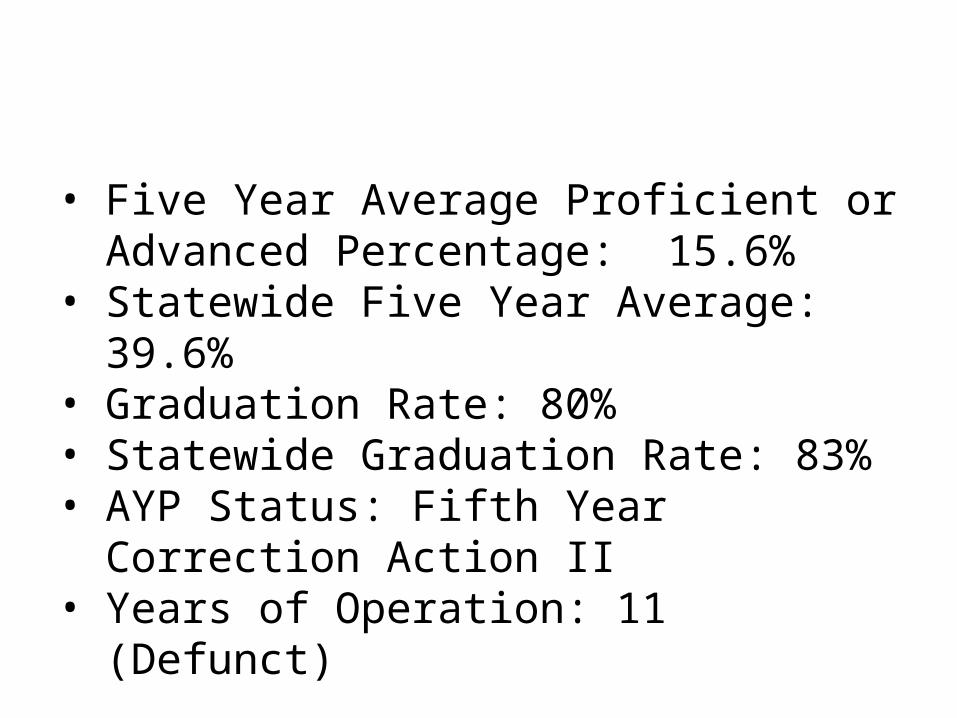
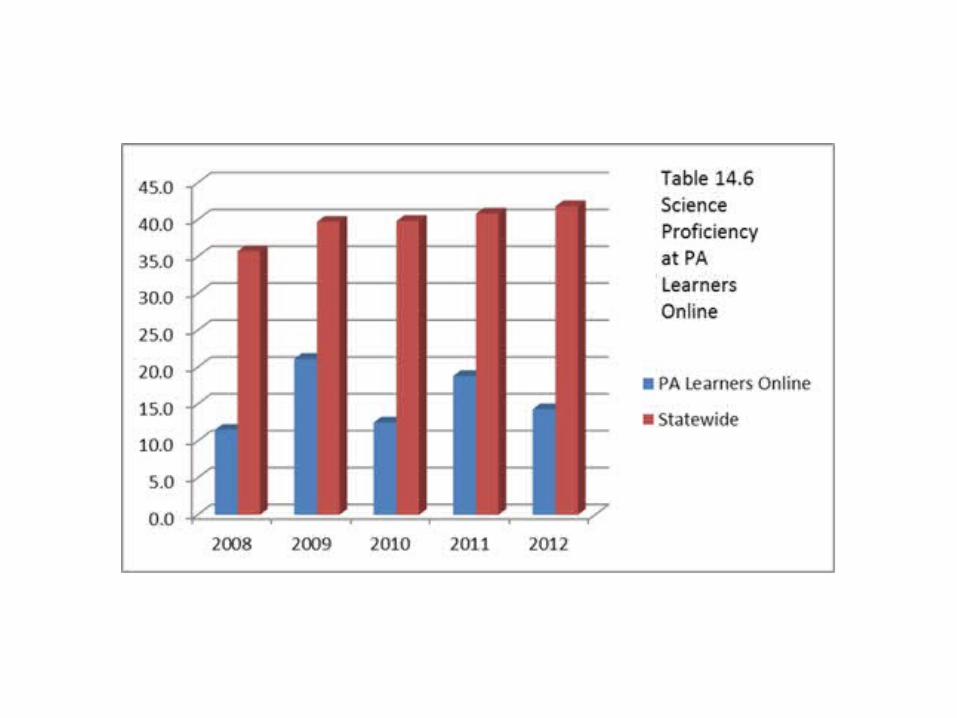
STREAM Academy/PA Learners Online
• Five Year Average Proficient or Advanced Percentage: 15.6%
• Statewide Five Year Average: 39.6%• Graduation Rate: 80%• Statewide Graduation Rate: 83%• AYP Status: Fifth Year Correction Action II• Years of Operation: 11 (Defunct)
STREAM Academy/PA Learners Online
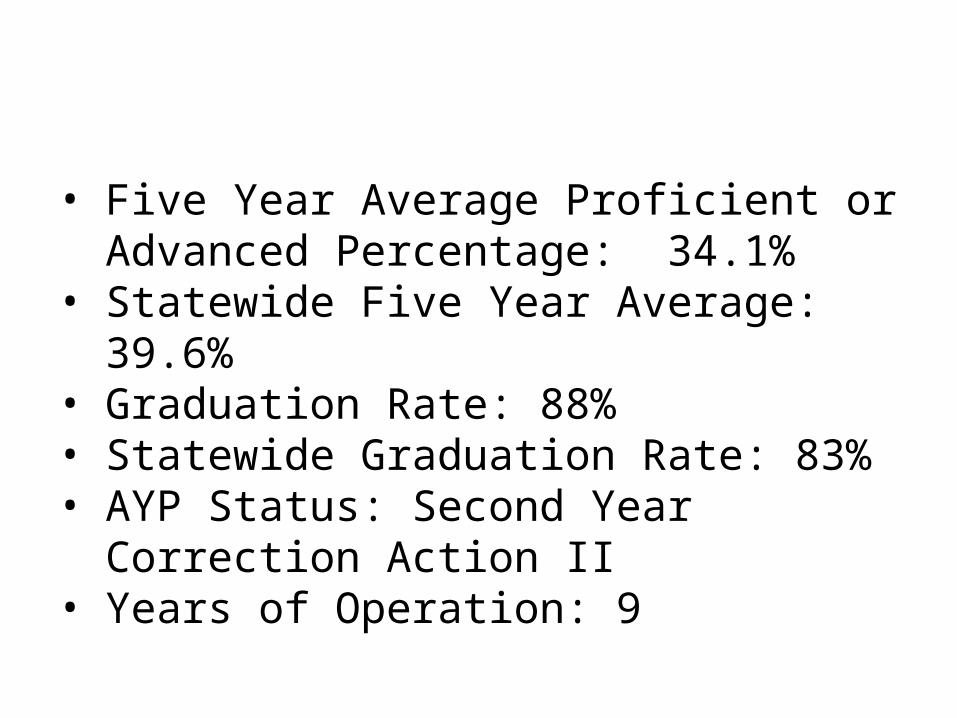
PA Leadership CCS
• Five Year Average Proficient or Advanced Percentage: 34.1%
• Statewide Five Year Average: 39.6%• Graduation Rate: 88%• Statewide Graduation Rate: 83%• AYP Status: Second Year Correction Action II• Years of Operation: 9

PA Leadership CS
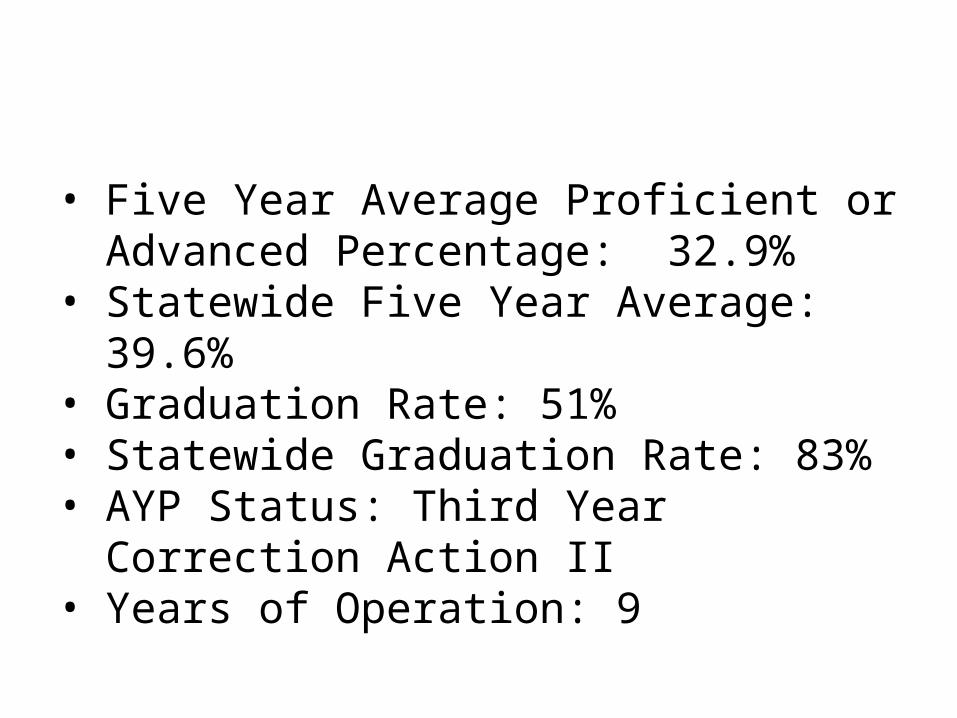
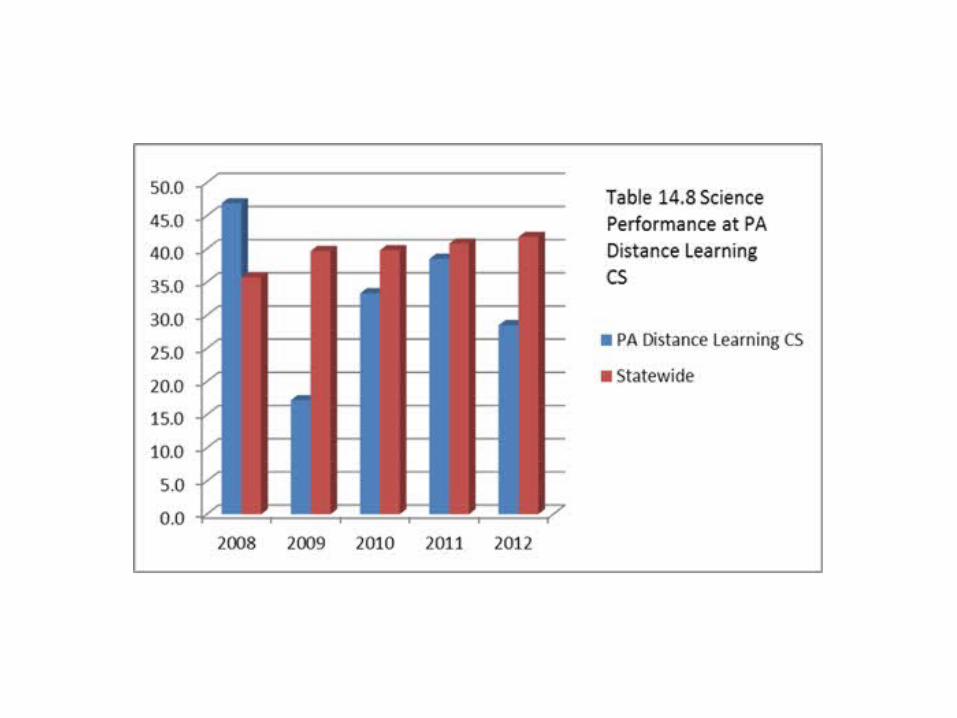
PA Distance Learning
• Five Year Average Proficient or Advanced Percentage: 32.9%
• Statewide Five Year Average: 39.6%• Graduation Rate: 51%• Statewide Graduation Rate: 83%• AYP Status: Third Year Correction Action II• Years of Operation: 9
PA Distance Learning

SusQ-Cyber Charter
• Five Year Average Proficient or Advanced Percentage: 22.8%
• Statewide Five Year Average: 39.6%• Graduation Rate: 32%• Statewide Graduation Rate: 83%• AYP Status: Fourth Year Correction Action II• Years of Operation: 15

SusQ-Cyber Charter
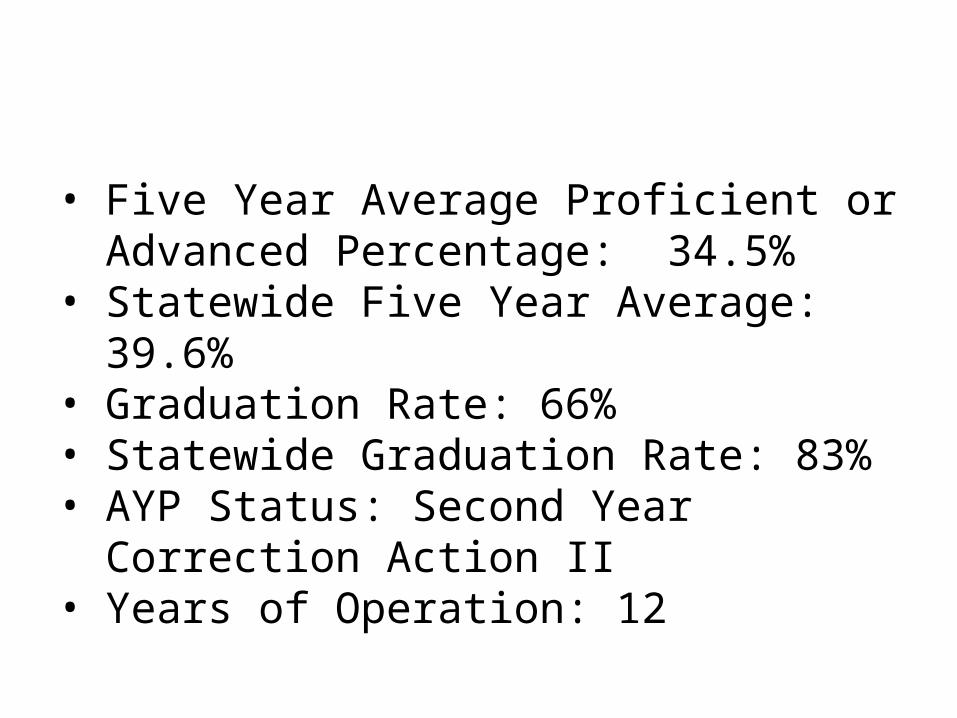
PA Virtual CS
• Five Year Average Proficient or Advanced Percentage: 34.5%
• Statewide Five Year Average: 39.6%• Graduation Rate: 66%• Statewide Graduation Rate: 83%• AYP Status: Second Year Correction Action II• Years of Operation: 12

PA Virtual CS

Graduation Rates
School Management Years of Operation Graduation Rate
Five Year 11th Grade Science
Proficiency Average
21st Century Cyber Charter School IU/Districts 12 66% 48.1%
PA Cyber Non-profit/District 11 61% 36.1%
PA Virtual Non-profit/District* 12 66% 34.5%
PA Leadership Cyber Charter School Non-profit 9 88% 34.1%
PA Distance Learning Non-profit 9 51% 32.9%
Commonwealth Connections Private, for-profit 10 83% 27.3%
SusQ-Cyber Charter School IU/School Districts 15 32% 22.8%
Agora CS Private, for-profit 8 49% 20.0%
Achievement House Non-profit 9 33% 18.8%
STREAM Academy (Defunct) IU/Districts 11 80% 15.6%

PA Virtual vs. Agora
• Both use the same curricula (K12, Inc.) • Agora is also managed by K12• PA Virtual is not• PA Virtual’s Five Year Average Proficient or
Advanced Percentage: 34.5%• Agora’s Five Year Average Proficient or
Advanced Percentage: 20.0%
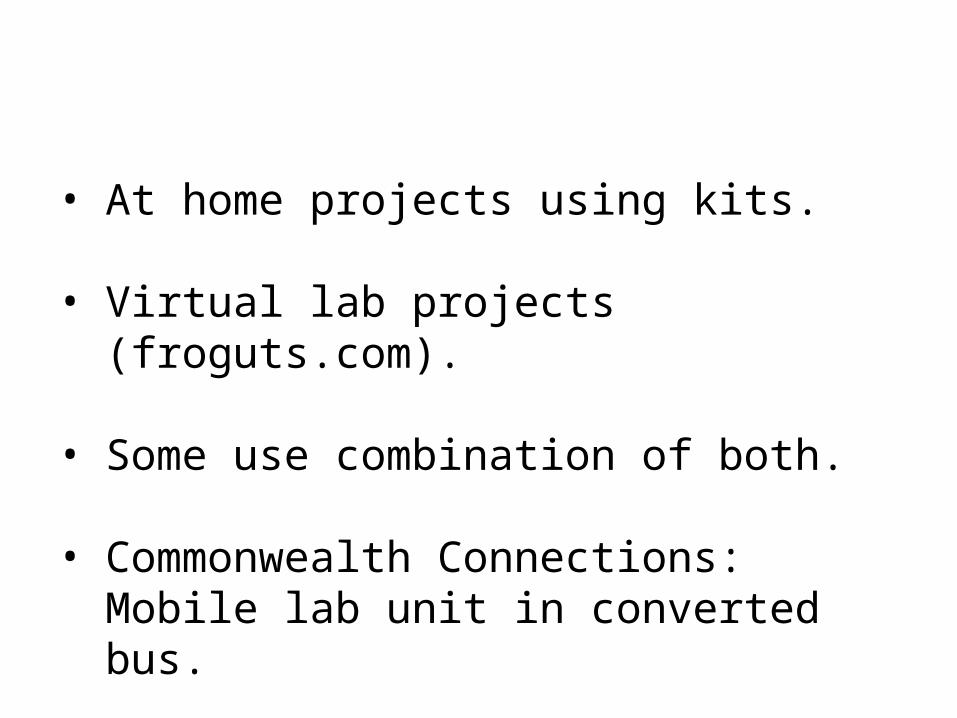
Laboratory Projects at Cyber Charter Schools
• At home projects using kits.
• Virtual lab projects (froguts.com).
• Some use combination of both.
• Commonwealth Connections: Mobile lab unit in converted bus.
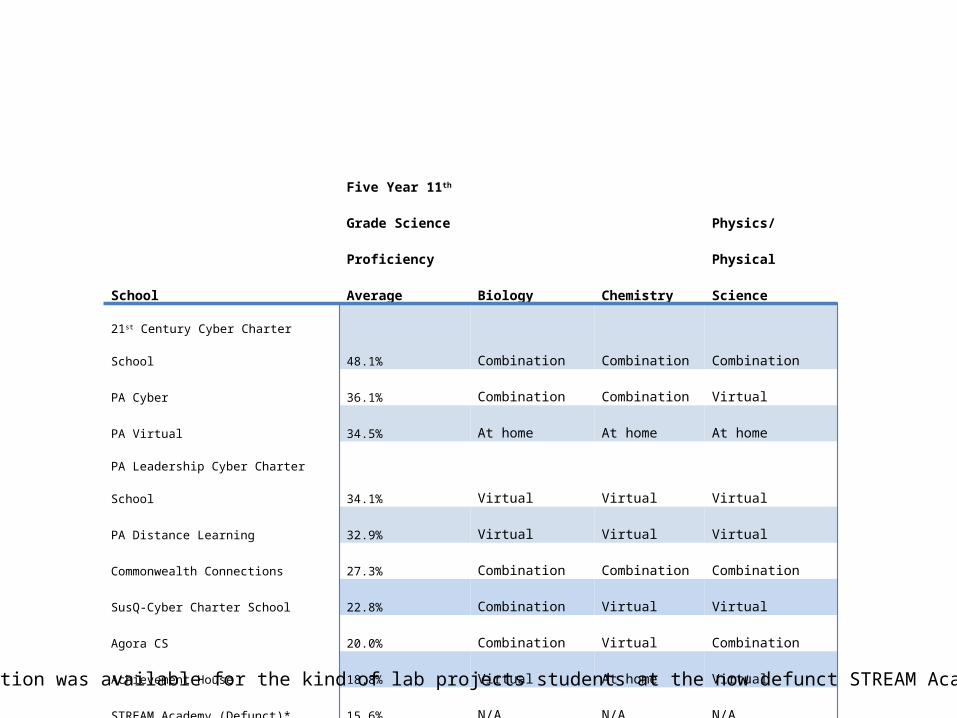
Laboratory Projects at Cyber Charter Schools
School
Five Year 11th
Grade Science
Proficiency
Average Biology Chemistry
Physics/Physical
Science
21st Century Cyber Charter School 48.1% Combination Combination Combination
PA Cyber 36.1% Combination Combination Virtual
PA Virtual 34.5% At home At home At home
PA Leadership Cyber Charter School 34.1% Virtual Virtual Virtual
PA Distance Learning 32.9% Virtual Virtual Virtual
Commonwealth Connections 27.3% Combination Combination Combination
SusQ-Cyber Charter School 22.8% Combination Virtual Virtual
Agora CS 20.0% Combination Virtual Combination
Achievement House 18.8% Virtual At home Virtual
STREAM Academy (Defunct)* 15.6% N/A N/A N/A
*No information was available for the kind of lab projects students at the now defunct STREAM Academy performed.

The Bottom Four: STREAM Academy
• The STREAM Academy was closed due to financial difficulties and a lack of sufficient enrollment .
• Little information was available about the curriculum.
The Bottom Four: Achievement House
• Worst performer among schools still in operation.
• Depends on parents to act as learning coach.
• Offers little training beyond orientation.
• Depends on parents offering peer support.

The Bottom Four: Agora
• Run by K12.
• July 2012: CEO indicted for fraud
• $6.5 million in taxpayer’s money
• Only recently started a learning coach program.
The Bottom Four: SusQ-Cyber
• No formalized learning coach program.
• Did not offer a physics course.
The Top Four: 21st Century
• Only one to consistently beat the statewide 11th grad science PSSA percentage.
• Teacher designed curricula.
• Learning coach is a trained teacher.
The Top Four: PA Cyber
• Varied curriculum
• Multiple learning methods (synchronous and asynchronous)
• Offers science seminars.
• Trained learning coaches for students falling behind.
The Top Four: PA Virtual
• Parents are the learning coach
• Strong support through “Diamond Model”
• Partners with science museums
• Uses K12 curriculum

The Top Four: PA Leadership
• Parents are the learning coach
• Provides technical training and support
• Teaching-designed course content

Common Factors in Top Four• A varied curriculum that combines both at
home and virtual lab projects.
• Curricula that are designed by the teacher instead of relying on “canned” curricula.
• Training and support for a learning coach, whether that coach is a teacher or a parent or guardian.

Conclusions• In general, PA’s Cyber Charter Schools are
lagging brick-and-mortar schools in science.
• Minority and ED students underrepresented in this exam.
• Little evidence that cyber schools are an adequate substitute for traditional schools.
• Stronger financial oversight is needed.

Areas for Further Study• Effects of Student Motivation.
• Whether for-profit EMOs are effective.
• Effective training for teachers and learning coaches.
• Virtual labs vs. Hands on labs.
• Comparing PA’s cyber charter schools to those in other states.

Questions?