Embed Size (px)
Citation preview

Open Innovation in small firms: Positive step or costly mistake?
Jim Love (ERC and Aston University)
Stephen Roper (ERC and Warwick University)
Priit Vahter (ERC and University of Tartu)
ESRC project: ‘The Dynamics of Open Innovation’
Some research questions in the project
• RQ1: How does open innovation contribute to innovation and business performance?
• RQ2: Are there dynamic economies in firms' effective implementation of open innovation?
• RQ3: How has the level (and profile) of adoption of open innovation changed through time?
• RQ4: Are there externalities from open innovation?
• RQ5: What are the dynamics of the limits to open innovation?
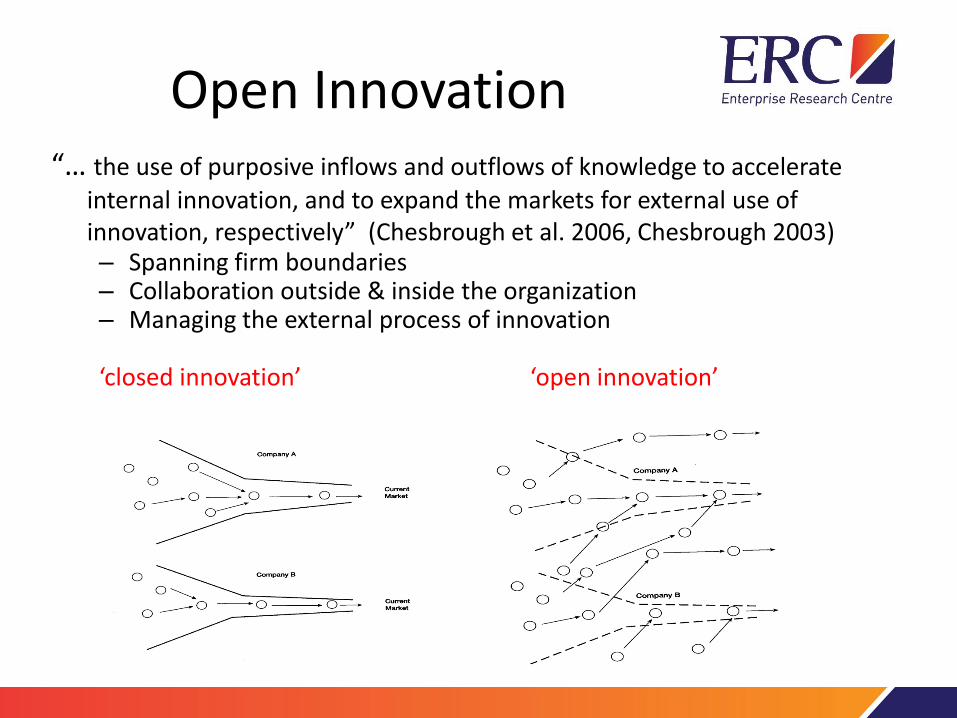
Open Innovation “… the use of purposive inflows and outflows of knowledge to accelerate
internal innovation, and to expand the markets for external use of innovation, respectively” (Chesbrough et al. 2006, Chesbrough 2003) – Spanning firm boundaries – Collaboration outside & inside the organization – Managing the external process of innovation ‘closed innovation’ ‘open innovation’
• ‘Measurement is one of the most significant factors in successful innovation. Ironically, in many organisations, it is one of the least attended to’. Davila et al.(2006, p. 178)
• A useful measure (or two!)
– The percentage of sales coming from products newly introduced in the last three years (Narrow)
– The percentage of sales coming from products newly introduced or improved over the last three years (Wide)
Measuring innovation (outputs)
• No single measure of ‘openness’
• Some work looks at number of information sources in innovation
• Our work concentrates on breadth of links with external organisations
– customers
– Suppliers
– Competitors
– JVs
– Consultants
– Universities and labs etc
Open Innovation – how do you measure it?
Benefits of openness
External innovation linkages have various benefits: • drawing in ideas outside the firm
• searching the technological environment in a systematic fashion,
permitting access to improved technology developed elsewhere
• stimulating creativity, reducing risk, accelerating or upgrading the quality of the innovations
• complements own R&D – makes your own R&D more effective
Downsides too…..
• Cost involved – mainly management time (searching for partners, developing relationships)
• capacity of management to process many competing sources of information, since the span of attention of any individual is limited
• IPR concerns
Drawbacks of openness
Reasons why the effects of openness may be smaller for small firms
• Shortage of abilities that are needed:
i) to build organizational structures for identification of useful external knowledge;
ii) to absorb externally developed ideas and technologies (e.g.less likely to do R&D)
• May be unattractive partners for larger firms, so hard to find partners
Small firms and openness
Small firms and openness
Reasons why the effects of openness may be larger for small firms
• They have more to gain!
Lower extent of own knowledge resources/linkages/R&D:
also means that the marginal benefit of adding a new (type) of external linkage may be larger for small firms
• Flexibility and speed of decision making
Irish Innovation Panel (IIP) • Provides information on the innovation, technology adoption, networking
and performance of manufacturing plants throughout Ireland and Northern Ireland over the period 1991-2008
• 5 waves are used here: 1994-2008 • Present study uses 2nd, 3rd, 4th, 5th and 6th waves
• Each survey covers the innovation activities of manufacturing plants over a
three year period, data include small plants (L<50) • Information on eight ‘open innovation’ links
(customers, suppliers, competitors, joint ventures, consultants, universities, industry operated laboratories, and government operated laboratories)
Our data
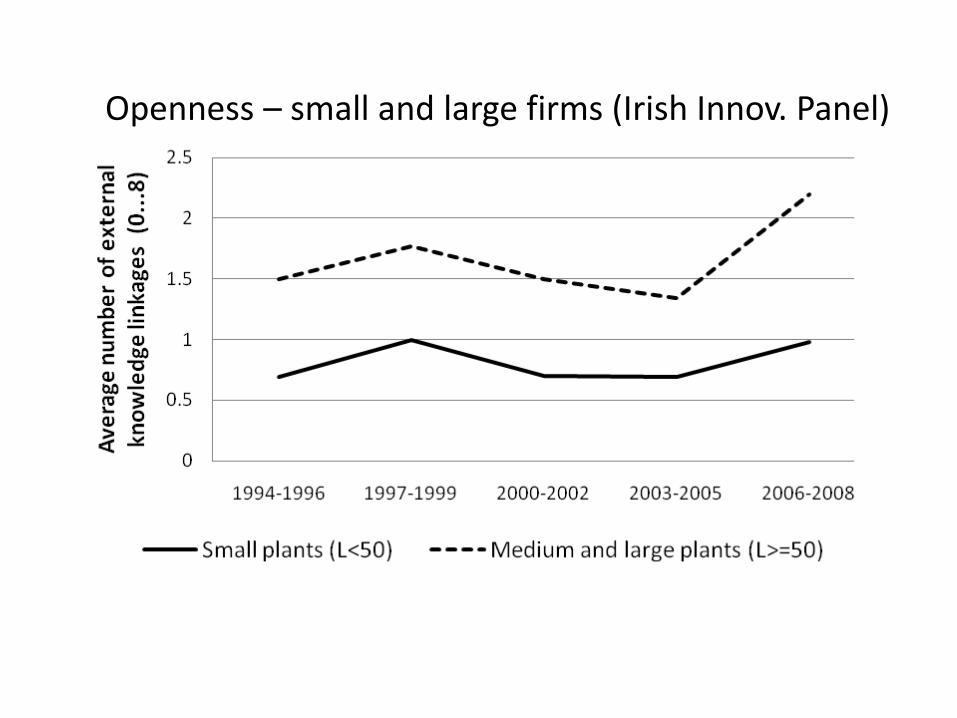
Openness – small and large firms (Irish Innov. Panel)
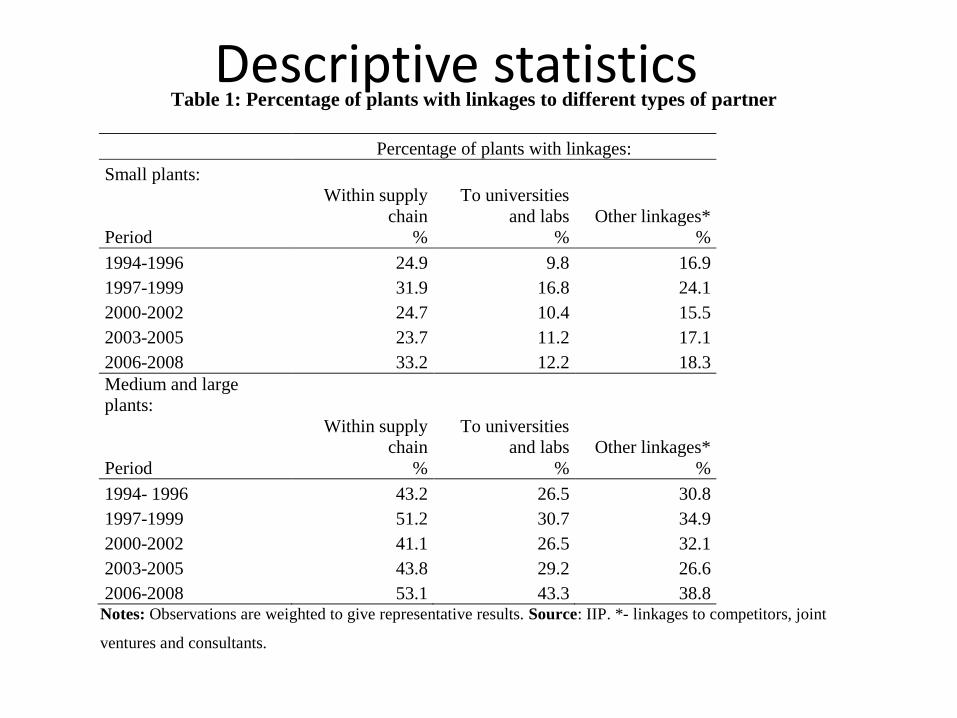
Descriptive statistics Table 1: Percentage of plants with linkages to different types of partner
Percentage of plants with linkages:
Small plants:
Period
Within supply
chain
%
To universities
and labs
%
Other linkages*
%
1994-1996 24.9 9.8 16.9
1997-1999 31.9 16.8 24.1
2000-2002 24.7 10.4 15.5
2003-2005 23.7 11.2 17.1
2006-2008 33.2 12.2 18.3
Medium and large
plants:
Period
Within supply
chain
%
To universities
and labs
%
Other linkages*
%
1994- 1996 43.2 26.5 30.8
1997-1999 51.2 30.7 34.9
2000-2002 41.1 26.5 32.1
2003-2005 43.8 29.2 26.6
2006-2008 53.1 43.3 38.8 Notes: Observations are weighted to give representative results. Source: IIP. *- linkages to competitors, joint
ventures and consultants.
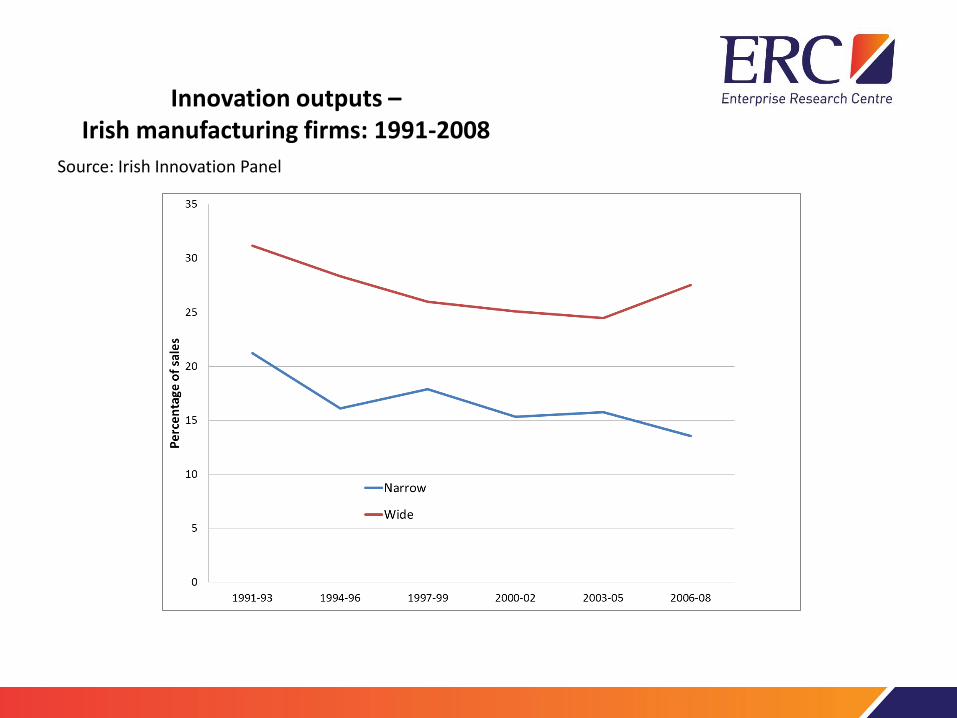
Innovation outputs – Irish manufacturing firms: 1991-2008
Source: Irish Innovation Panel
• Look at how ‘breadth of openness’ affects innovation (broad
measure)….
• After allowing for other things that affect innovation
– Firm size and sector
– Internal R&D
– Age of firm
– Part of a group or MNC
– Employee skills etc etc
Our Findings
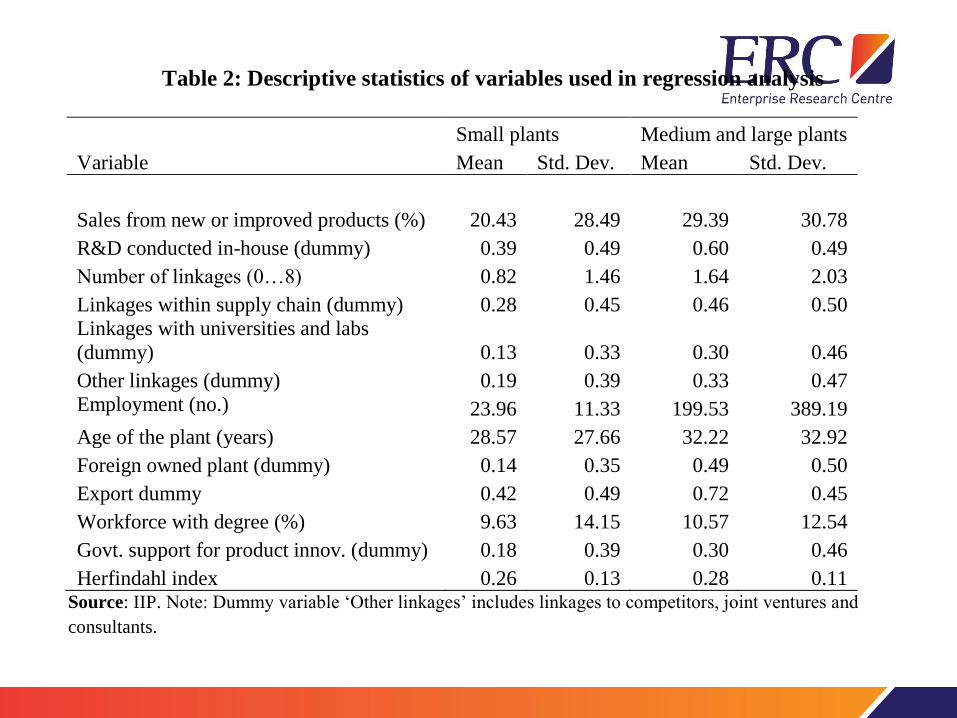
Table 2: Descriptive statistics of variables used in regression analysis
Small plants Medium and large plants
Variable Mean Std. Dev. Mean Std. Dev.
Sales from new or improved products (%) 20.43 28.49 29.39 30.78
R&D conducted in-house (dummy) 0.39 0.49 0.60 0.49
Number of linkages (0…8) 0.82 1.46 1.64 2.03
Linkages within supply chain (dummy) 0.28 0.45 0.46 0.50
Linkages with universities and labs
(dummy) 0.13 0.33 0.30 0.46
Other linkages (dummy) 0.19 0.39 0.33 0.47
Employment (no.) 23.96 11.33 199.53 389.19
Age of the plant (years) 28.57 27.66 32.22 32.92
Foreign owned plant (dummy) 0.14 0.35 0.49 0.50
Export dummy 0.42 0.49 0.72 0.45
Workforce with degree (%) 9.63 14.15 10.57 12.54
Govt. support for product innov. (dummy) 0.18 0.39 0.30 0.46
Herfindahl index 0.26 0.13 0.28 0.11 Source: IIP. Note: Dummy variable ‘Other linkages’ includes linkages to competitors, joint ventures and
consultants.
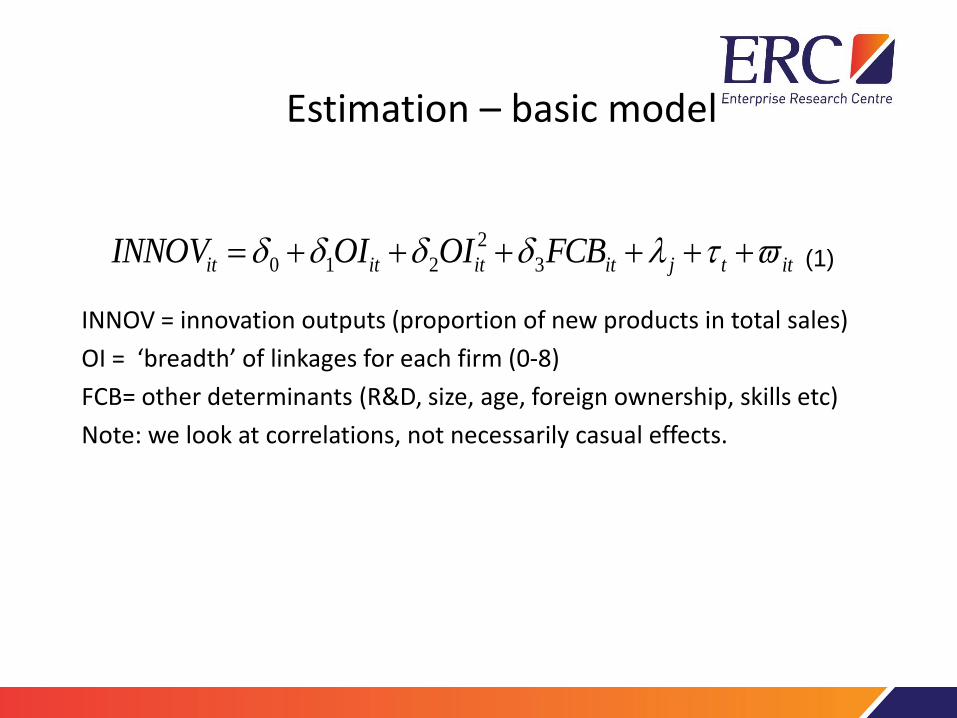
Estimation – basic model
INNOV = innovation outputs (proportion of new products in total sales)
OI = ‘breadth’ of linkages for each firm (0-8)
FCB= other determinants (R&D, size, age, foreign ownership, skills etc)
Note: we look at correlations, not necessarily casual effects.
ittjitititit FCBOIOIINNOV 3
2
210 (1)
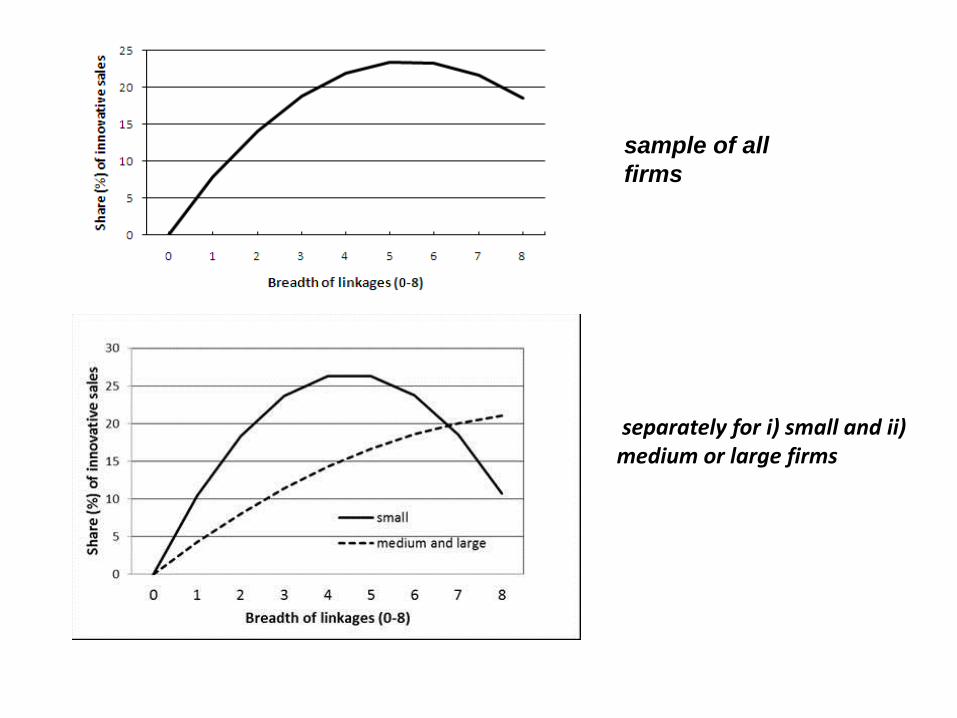
separately for i) small and ii) medium or large firms
sample of all
firms
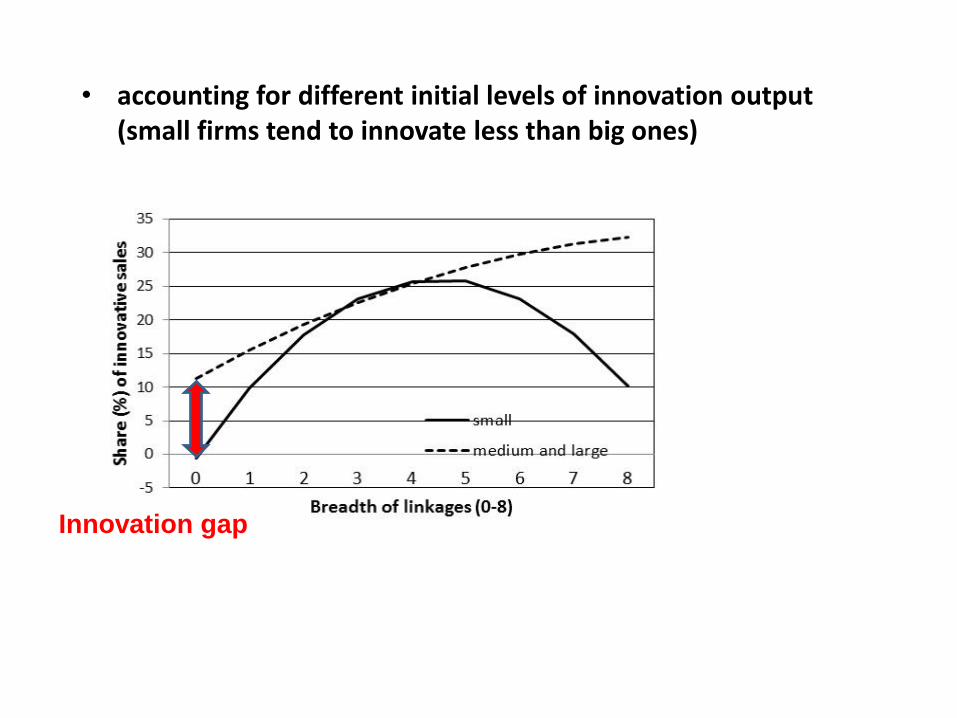
• accounting for different initial levels of innovation output (small firms tend to innovate less than big ones)
Innovation gap
• Small Irish establishments have significantly lower levels of ‘open innovation’ than larger ones.
• BUT having larger variety of knowledge linkages (‘breadth’ of openness) is associated with stronger improvement of innovation performance for small firms than for large firms
• So ‘open innovation’ can help close the ‘innovation gap’ for SMEs
• BUT Small establishments reach their limit to benefiting from variety of external linkages earlier than large firms.
• Also, harder for small firms to form external linkages
Key points to take away
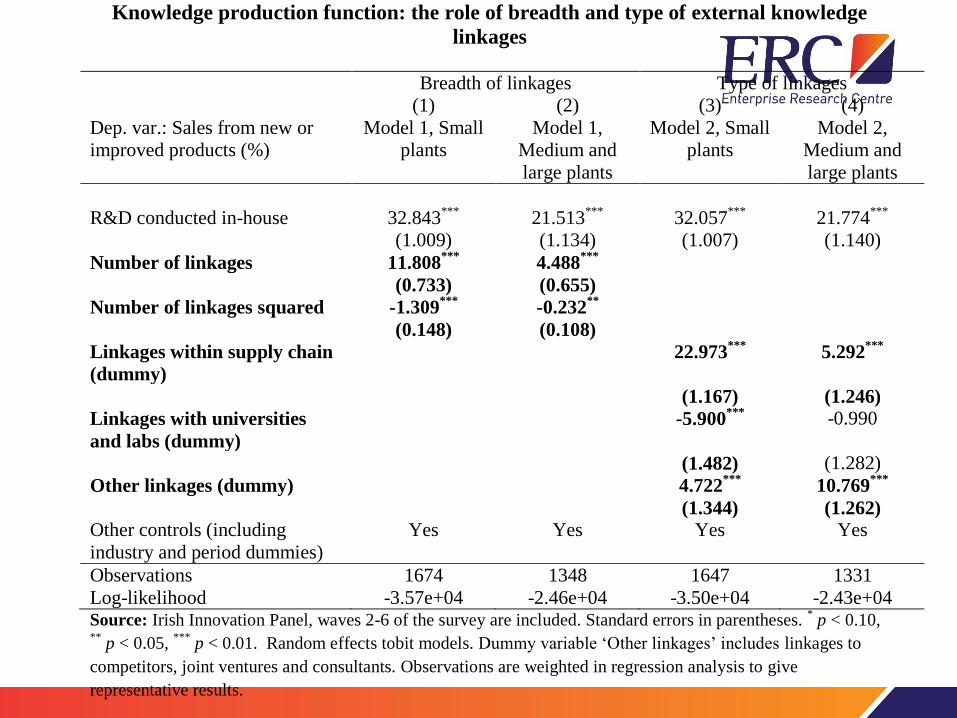
Knowledge production function: the role of breadth and type of external knowledge
linkages
Breadth of linkages Type of linkages
(1) (2) (3) (4)
Dep. var.: Sales from new or
improved products (%)
Model 1, Small
plants
Model 1,
Medium and
large plants
Model 2, Small
plants
Model 2,
Medium and
large plants
R&D conducted in-house 32.843***
21.513***
32.057***
21.774***
(1.009) (1.134) (1.007) (1.140)
Number of linkages 11.808***
4.488***
(0.733) (0.655)
Number of linkages squared -1.309***
-0.232**
(0.148) (0.108)
Linkages within supply chain
(dummy)
22.973***
5.292***
(1.167) (1.246)
Linkages with universities
and labs (dummy)
-5.900***
-0.990
(1.482) (1.282)
Other linkages (dummy) 4.722***
10.769***
(1.344) (1.262)
Other controls (including
industry and period dummies)
Yes Yes Yes Yes
Observations 1674 1348 1647 1331
Log-likelihood -3.57e+04 -2.46e+04 -3.50e+04 -2.43e+04 Source: Irish Innovation Panel, waves 2-6 of the survey are included. Standard errors in parentheses.
* p < 0.10,
** p < 0.05,
*** p < 0.01. Random effects tobit models. Dummy variable ‘Other linkages’ includes linkages to
competitors, joint ventures and consultants. Observations are weighted in regression analysis to give
representative results.


![Openness Agreements: Part Two The Reality of Openness · Presented by © Adoptive Families Association of BC [2016] Openness Agreements: Part Two The Reality of Openness](https://img.pdfslide.us/doc/110x75/5e81797d22c1fb32191241b3/openness-agreements-part-two-the-reality-of-openness-presented-by-adoptive-families.jpg)