Embed Size (px)
Citation preview
1
Egypt's Trade Openness and Balance With Global Markets
Total Merchandise and Services Trade
Source: Central Bank of Egypt 2014.
Total Merchandise Trade
Source: Central Bank of Egypt 2014.
Egypt's Top Trading Partners 2012/2013
in terms of Total Merchandise Trade
Source: Central Bank of Egypt 2014.
Merchandise Trade as % of GDP:
Egypt and some Selected Countries
Source: World Bank 2014 - Data of 2012.
Improvement of Trade Balance Deficit
Source: Central Bank of Egypt 2014.
Trade Balance - Egypt and Selected Countries
Source: The Economist 2014- data of December2013.
25.2 23.9 27.0 25.1 26.011.7 12.6
50.3 49.054.1 58.7 57.5
30.2 28.0
75.5 72.9
81.1 83.7 83.5
41.940.6
0.0
10.0
20.0
30.0
40.0
50.0
60.0
70.0
80.0
90.0
$ Billions
Merchandise Exports Merchandise Imports
Total Merchandise Trade
7.6
6.7
54.6 4.3
3.6 3.5 3.4 3.3 3.22.8 2.8
2.2
0
1
2
3
4
5
6
7
8
$ Billions
287
140
92 9176 68
49 49 47 48 47 46 39 38 32
0
50
100
150
200
250
300
Sin
gap
ore
Mal
aysi
a
Jord
an
Tun
isia
Ger
man
y
Mo
rocc
o
Turk
ey
Ital
y
Ch
ina
Fran
ce UK
Spai
n
Egyp
t
Gre
ece
Arg
enti
na
%
-25.2 -25.1-27.1
-34.1-31.5
-18.5-15.4
-40
-35
-30
-25
-20
-15
-10
-5
0
2008/09 2009/10 2010/11 2011/12 2012/13 H1 2012/13
H1 2013/14
$ Billions37 37
-2-7 -8
-20-14
-9
-31
-97-100
-80
-60
-40
-20
0
20
40
$ Billions
Total merchandise and services trade increased from
110.6 billion dollars to 121.2 billion dollars in 5 years.
Total merchandise trade increased from 75.5
billion dollars to 83.5 billion dollars in 5 years.
35.0 37.0 35.9 36.4 37.719.6 15.8
75.5
72.981.1
84.383.5
41.9 40.6
61.653.3 53.2
45.9 44.6
0
10
20
30
40
50
60
70
0.0
20.0
40.0
60.0
80.0
100.0
120.0
140.0
$ Billions %
Total Services Trade
Total Merchandise Trade
Total Merchandise and Services Trade /GDP %
2
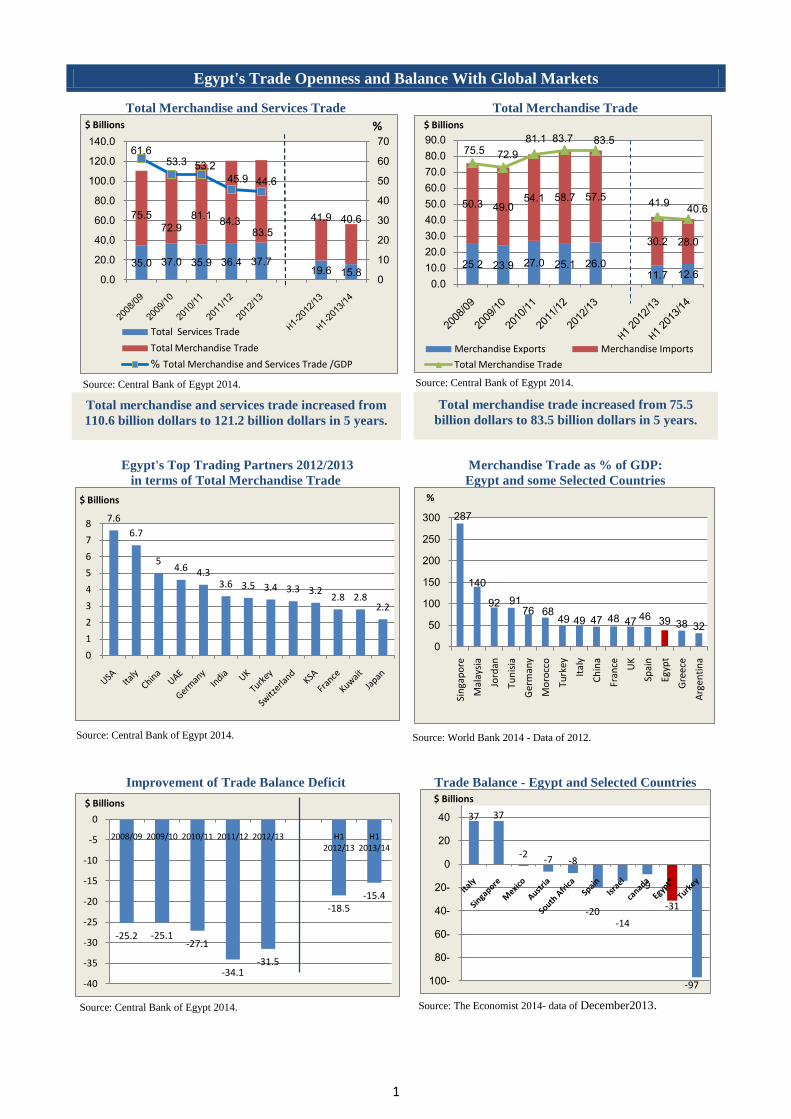
Total Merchandise Trade1
Exports Imports
Non-Petroleum Exports Share to Total Exports
increased to 54% in 2012/2013
Decline in Total Imports by 2.9% in 2012/2013
Industrial Exports constitute about 48%
of Total Exports
Merchandise Imports Feed Production Process
rather than Consumption
EU, Arab and Asian Countries comprise 75% of Egypt's Total
Exports Destinations.
Egypt's Exports to Arab Countries increased from 15% to
20% in 5 years.
Egypt’s Imports from Europe, Asia and Arab Countries
constitute 81% of total Imports.
Egypt Imports from Arab Countries doubled in 5 years.
1 Source: Central Bank of Egypt- 2014.
11 10.3 12.1 13.1 12.04.7 6.0
14.2 13.6 14.9 13.8 14.0
7.0 6.5
25.2 23.927.0
25.1 26.0
11.7 12.6
0
5
10
15
20
25
30
2008/09 2009/10 2010/11 2011/12 2012/13 H1 2012/13
H1 2013/14
$ Billions
Petroleum Exports Non-Petroleum Exports
Total Exports
7.0 5.29.3 11.8 12.5
6.7 5.9
43.3 43.8 44.8 47.4 45.0
23.5 22.1
50.3 49.054.1
58.7 57.5
30.2 28.0
0.0
20.0
40.0
60.0
80.0
2008/09 2009/10 2010/11 2011/12 2012/13 H1
2012/13
H1
2013/14
$ Billions
Petroleum Imports Non-Petroleum Imports
Total Imports
Fuels, Minerals Oil &
Products47%
Raw Maretials5%
Semi-finished Commodities
8%
Finished Commodities
40%
Egyptian Exports, by degree of manufacturing 2012/2013
Fuels, Minerals Oil &
Products16.50%
Raw Materials15%
Intermediate Goods
28%
Investment Goods
17%
Consumer Goods22.50%
Undistributed Commodities
1%
Egyptian Imports, by degree of use 2012/2013
EU37%
Other Europian Countries
7%
Russian Federation
1%USA
14%
Arab Countries
20%
Asian Countries (excluding
Arab Countries)
18%
African Countries (excluding
Arab Countries)
2%
Other Countries &
Regions2%
Geographic Distribution of Egyptian Exports 2012/2013
EU31%
Other European Countries
9%
Russian Federation
3.50%USA7%
Arab Countries
20%
Asian Countries (excluding
Arab Countries)
21%
Other Countries &
Regions9%
Geographic Distribution of Egyptian Imports 2012/2013
In H1 2013/14, Egypt’s Merchandise Exports
increased by 7.5% In H1 2013/14, Egypt’s Merchandise Imports
declined by 7.4%
3
44
67
80
9893
110
131 133
147
44
67.4
80
100
120130
145
2030405060708090
100110120130140150160
2005 2006 2007 2008 2009 2010 2011 2012 2013
L.E
Bill
ion
Actual Exports Represent 102% of Planned Exports in 2013
actual planned
2010: Start of the Plan
2005: establishingExport Councils
2013: End of the Plan
Building Materials22%
Chemicals & Fertilizers
20%Food Industry
13%
Engineering & Electronics
10%
Fresh (Agro) Products
9%
Ready-made Garments
7%
Others19%
Structure of Export Councils as at end of 2013
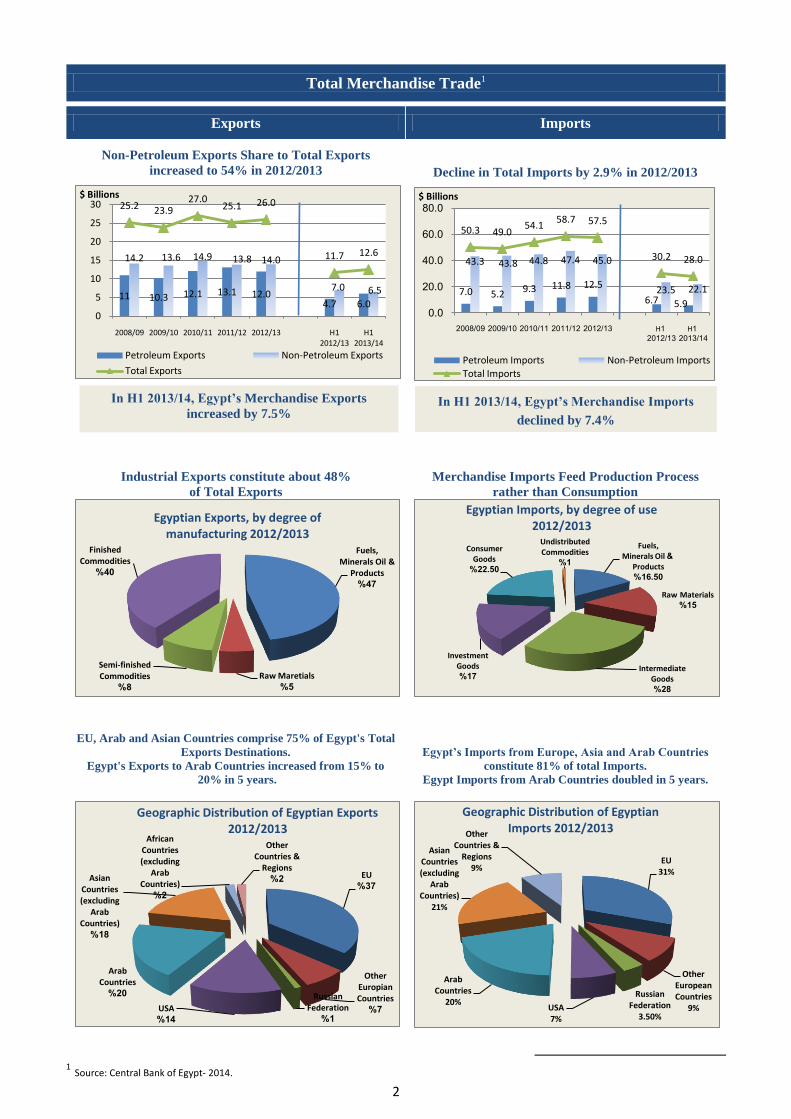
Positive Impact of Export Promotion Strategy (2010-2013)2
2 Source: General Organization for Export and Import Control (GOEIC), Foreign Trade Data Warehouse - 2014.
0.0
20.0
40.035% 60%
81%40% 20%
32% 132% 61% 77% 46% 59% 72%
L.E
Bill
ion
All Export Councils Witnessed Significant Growth Rates
2009 (Start of Export Plan) 2013(End of Export Plan)
Almost 60% increase
in total Councils'
exports by the end of
the Plan (2013)
compared to prior of
the Plan (2009).
Leading Export Councils that exceeded Actual vs. Planned in 2013: Spinning and Weaving Council: 180%, Home -Wear Council: 151%, Food Industry Council: 131%, Building Materials Council: 118%, and Fresh (Agro) Products Council: 108%.
Six Export Councils represent
81% of the Egyptian exports
at end of 2013.
Greater impact of the Plan on some sectors
e.g. Spinning & Weaving, Food
Industry, Pharmaceuticals,
Home-wear, Chemicals &
Fertilizers, and others.
4
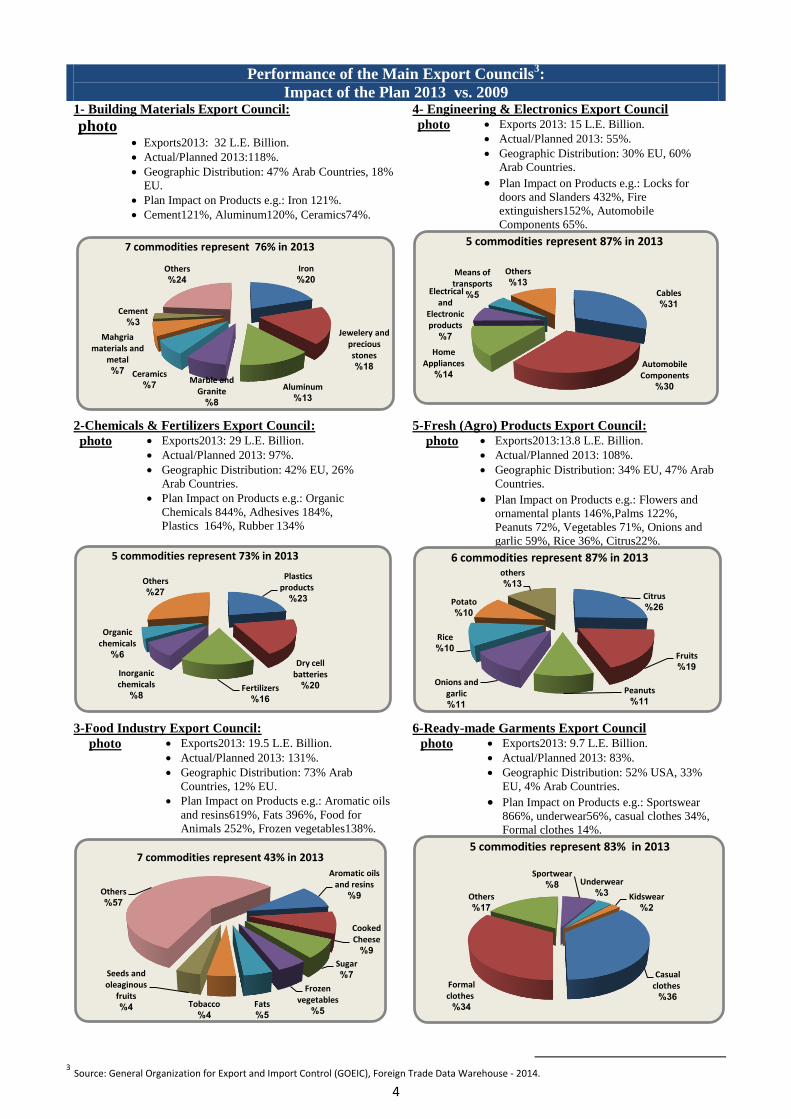
Performance of the Main Export Councils3:
Impact of the Plan 2013 vs. 2009 1- Building Materials Export Council:
photo Exports2013: 32 L.E. Billion.
Actual/Planned 2013:118%.
Geographic Distribution: 47% Arab Countries, 18%
EU.
Plan Impact on Products e.g.: Iron 121%.
Cement121%, Aluminum120%, Ceramics74%.
4- Engineering & Electronics Export Council Exports 2013: 15 L.E. Billion.
Actual/Planned 2013: 55%.
Geographic Distribution: 30% EU, 60%
Arab Countries.
Plan Impact on Products e.g.: Locks for
doors and Slanders 432%, Fire
extinguishers152%, Automobile
Components 65%.
photo
2-Chemicals & Fertilizers Export Council: Exports2013: 29 L.E. Billion.
Actual/Planned 2013: 97%.
Geographic Distribution: 42% EU, 26%
Arab Countries.
Plan Impact on Products e.g.: Organic
Chemicals 844%, Adhesives 184%,
Plastics 164%, Rubber 134%
photo
5-Fresh (Agro) Products Export Council:
photo
Exports2013:13.8 L.E. Billion.
Actual/Planned 2013: 108%.
Geographic Distribution: 34% EU, 47% Arab
Countries.
Plan Impact on Products e.g.: Flowers and
ornamental plants 146%,Palms 122%,
Peanuts 72%, Vegetables 71%, Onions and
garlic 59%, Rice 36%, Citrus22%.
3-Food Industry Export Council:
Exports2013: 19.5 L.E. Billion.
Actual/Planned 2013: 131%.
Geographic Distribution: 73% Arab
Countries, 12% EU.
Plan Impact on Products e.g.: Aromatic oils
and resins619%, Fats 396%, Food for
Animals 252%, Frozen vegetables138%.
photo
6-Ready-made Garments Export Council Exports2013: 9.7 L.E. Billion.
Actual/Planned 2013: 83%.
Geographic Distribution: 52% USA, 33%
EU, 4% Arab Countries.
Plan Impact on Products e.g.: Sportswear
866%, underwear56%, casual clothes 34%,
Formal clothes 14%.
photo
3 Source: General Organization for Export and Import Control (GOEIC), Foreign Trade Data Warehouse - 2014.
Iron20%
Jewelery and precious stones
18%
Aluminum13%
Marble and Granite
8%
Ceramics7%
Mahgria materials and
metal7%
Cement3%
Others24%
7 commodities represent 76% in 2013
Cables31%
Automobile Components
30%
Home Appliances
14%
Electrical and
Electronic products
7%
Means of transports
5%
Others13%
5 commodities represent 87% in 2013
Plastics products
23%
Dry cell batteries
20%Fertilizers16%
Inorganic chemicals
8%
Organic chemicals
6%
Others27%
5 commodities represent 73% in 2013
Citrus26%
Fruits19%
Peanuts11%
Onions and garlic
11%
Rice10%
Potato10%
others13%
6 commodities represent 87% in 2013
Aromatic oils and resins
9%
Cooked Cheese
9%
Sugar7%
Frozen vegetables
5%Fats
5%
Tobacco4%
Seeds and oleaginous
fruits4%
Others57%
7 commodities represent 43% in 2013
Casual clothes
36%
Formal clothes
34%
Others17%
Sportwear8% Underwear
3% Kidswear2%
5 commodities represent 83% in 2013
5
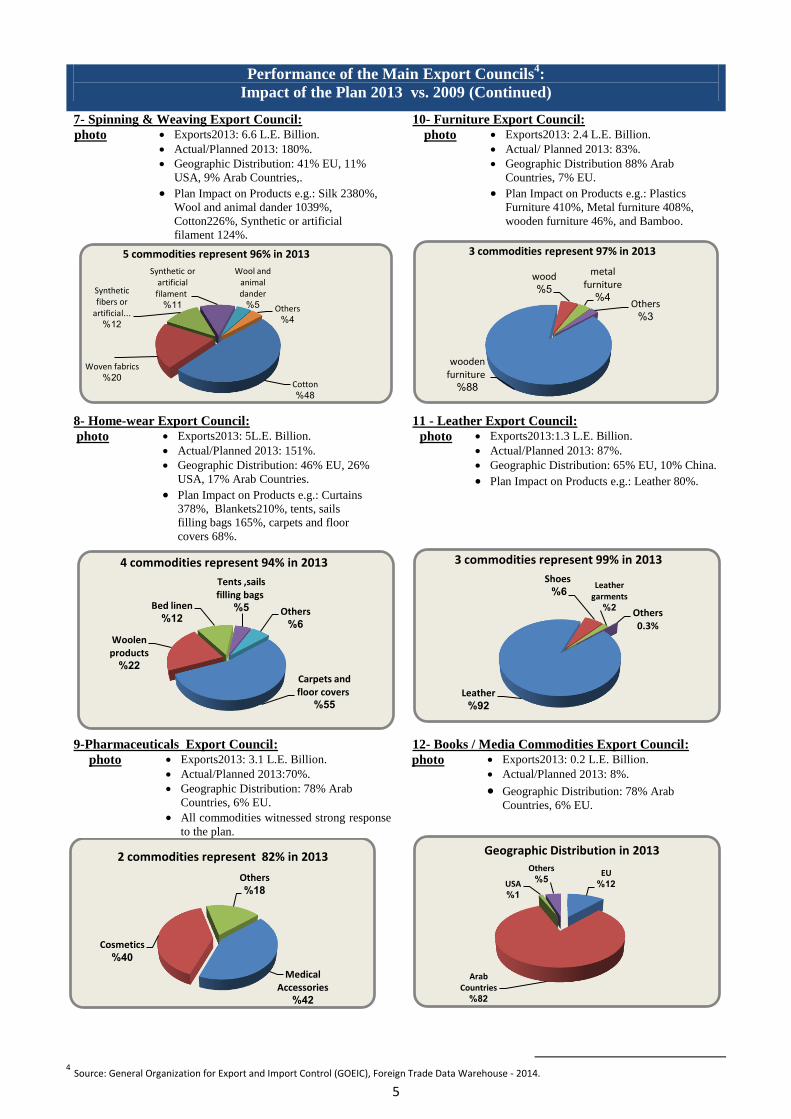
Performance of the Main Export Councils4:
Impact of the Plan 2013 vs. 2009 (Continued)
7- Spinning & Weaving Export Council: Exports2013: 6.6 L.E. Billion.
Actual/Planned 2013: 180%.
Geographic Distribution: 41% EU, 11%
USA, 9% Arab Countries,.
Plan Impact on Products e.g.: Silk 2380%,
Wool and animal dander 1039%,
Cotton226%, Synthetic or artificial
filament 124%.
photo
10- Furniture Export Council: Exports2013: 2.4 L.E. Billion.
Actual/ Planned 2013: 83%.
Geographic Distribution 88% Arab
Countries, 7% EU.
Plan Impact on Products e.g.: Plastics
Furniture 410%, Metal furniture 408%,
wooden furniture 46%, and Bamboo.
photo
8- Home-wear Export Council: Exports2013: 5L.E. Billion.
Actual/Planned 2013: 151%.
Geographic Distribution: 46% EU, 26%
USA, 17% Arab Countries.
Plan Impact on Products e.g.: Curtains
378%, Blankets210%, tents, sails
filling bags 165%, carpets and floor
covers 68%.
photo
11 - Leather Export Council: Exports2013:1.3 L.E. Billion.
Actual/Planned 2013: 87%.
Geographic Distribution: 65% EU, 10% China.
Plan Impact on Products e.g.: Leather 80%.
photo
9-Pharmaceuticals Export Council: Exports2013: 3.1 L.E. Billion.
Actual/Planned 2013:70%.
Geographic Distribution: 78% Arab
Countries, 6% EU.
All commodities witnessed strong response
to the plan.
photo
12- Books / Media Commodities Export Council: Exports2013: 0.2 L.E. Billion.
Actual/Planned 2013: 8%.
Geographic Distribution: 78% Arab
Countries, 6% EU.
photo
4 Source: General Organization for Export and Import Control (GOEIC), Foreign Trade Data Warehouse - 2014.
Cotton48%
Woven fabrics20%
Synthetic fibers or
artificial...12%
Synthetic or artificial filament
11%
Wool and animal dander
5% Others4%
5 commodities represent 96% in 2013
wooden furniture
88%
wood5%
metal furniture
4%Others
3%
3 commodities represent 97% in 2013
Carpets and floor covers
55%
Woolen products
22%
Bed linen12%
Tents ,sails filling bags
5% Others6%
4 commodities represent 94% in 2013
Leather92%
Shoes 6%
Leather garments
2%Others0.3%
3 commodities represent 99% in 2013
Medical Accessories
42%
Cosmetics40%
Others18%
2 commodities represent 82% in 2013EU12%
Arab Countries
82%
USA1%
Others5%
Geographic Distribution in 2013
6
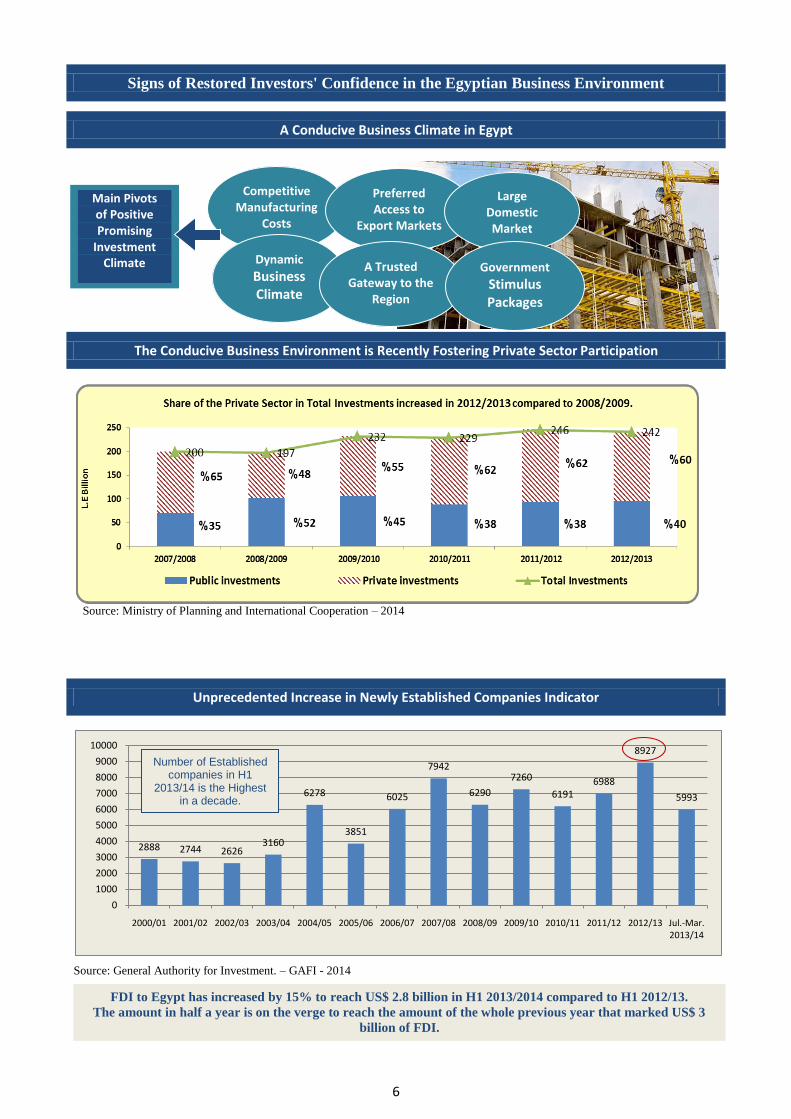
Signs of Restored Investors' Confidence in the Egyptian Business Environment
A Conducive Business Climate in Egypt
The Conducive Business Environment is Recently Fostering Private Sector Participation
Source: Ministry of Planning and International Cooperation – 2014
Unprecedented Increase in Newly Established Companies Indicator
Source: General Authority for Investment. – GAFI - 2014
2888 2744 26263160
6278
3851
6025
7942
6290
7260
61916988
8927
5993
0
1000
2000
3000
4000
5000
6000
7000
8000
9000
10000
2000/01 2001/02 2002/03 2003/04 2004/05 2005/06 2006/07 2007/08 2008/09 2009/10 2010/11 2011/12 2012/13 Jul.-Mar. 2013/14
Main Pivots of Positive Promising
Investment Climate
Competitive Manufacturing
Costs
Preferred Access to
Export Markets
Large Domestic
Market
Dynamic Business Climate
A Trusted Gateway to the
Region
Government Stimulus Packages
Number of Established companies in H1
2013/14 is the Highest in a decade.
FDI to Egypt has increased by 15% to reach US$ 2.8 billion in H1 2013/2014 compared to H1 2012/13.
The amount in half a year is on the verge to reach the amount of the whole previous year that marked US$ 3
billion of FDI.
7
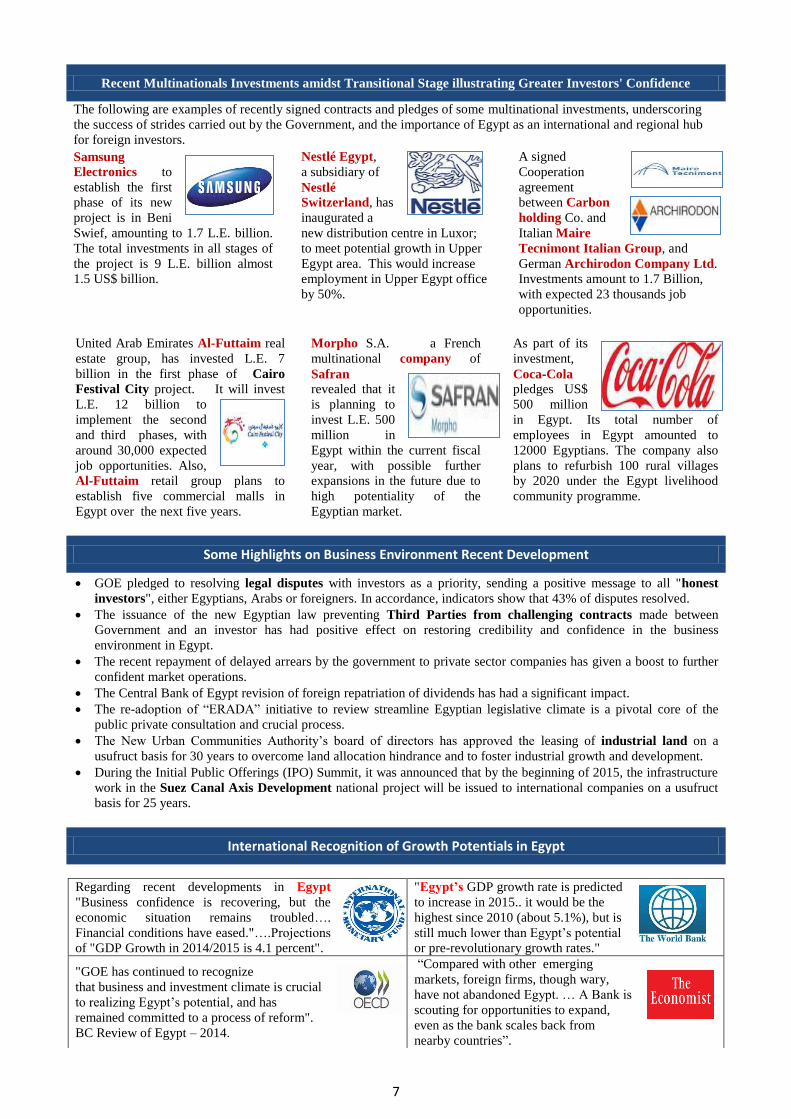
Recent Multinationals Investments amidst Transitional Stage illustrating Greater Investors' Confidence
The following are examples of recently signed contracts and pledges of some multinational investments, underscoring
the success of strides carried out by the Government, and the importance of Egypt as an international and regional hub
for foreign investors.
Samsung
Electronics to
establish the first
phase of its new
project is in Beni
Swief, amounting to 1.7 L.E. billion.
The total investments in all stages of
the project is 9 L.E. billion almost
1.5 US$ billion.
Nestlé Egypt,
a subsidiary of
Nestlé Switzerland, has
inaugurated a
new distribution centre in Luxor;
to meet potential growth in Upper
Egypt area. This would increase
employment in Upper Egypt office
by 50%.
A signed
Cooperation
agreement
between Carbon
holding Co. and
Italian Maire
Tecnimont Italian Group, and
German Archirodon Company Ltd.
Investments amount to 1.7 Billion,
with expected 23 thousands job
opportunities.
United Arab Emirates Al-Futtaim real
estate group, has invested L.E. 7
billion in the first phase of Cairo
Festival City project. It will invest
L.E. 12 billion to
implement the second
and third phases, with
around 30,000 expected
job opportunities. Also,
Al-Futtaim retail group plans to
establish five commercial malls in
Egypt over the next five years.
Morpho S.A. a French
multinational company of
Safran revealed that it
is planning to
invest L.E. 500
million in
Egypt within the current fiscal
year, with possible further
expansions in the future due to
high potentiality of the
Egyptian market.
As part of its
investment,
Coca-Cola pledges US$
500 million
in Egypt. Its total number of
employees in Egypt amounted to
12000 Egyptians. The company also
plans to refurbish 100 rural villages
by 2020 under the Egypt livelihood
community programme.
Some Highlights on Business Environment Recent Development
GOE pledged to resolving legal disputes with investors as a priority, sending a positive message to all "honest
investors", either Egyptians, Arabs or foreigners. In accordance, indicators show that 43% of disputes resolved.
The issuance of the new Egyptian law preventing Third Parties from challenging contracts made between
Government and an investor has had positive effect on restoring credibility and confidence in the business
environment in Egypt.
The recent repayment of delayed arrears by the government to private sector companies has given a boost to further
confident market operations.
The Central Bank of Egypt revision of foreign repatriation of dividends has had a significant impact.
The re-adoption of “ERADA” initiative to review streamline Egyptian legislative climate is a pivotal core of the
public private consultation and crucial process.
The New Urban Communities Authority’s board of directors has approved the leasing of industrial land on a
usufruct basis for 30 years to overcome land allocation hindrance and to foster industrial growth and development.
During the Initial Public Offerings (IPO) Summit, it was announced that by the beginning of 2015, the infrastructure
work in the Suez Canal Axis Development national project will be issued to international companies on a usufruct
basis for 25 years.
International Recognition of Growth Potentials in Egypt
Regarding recent developments in Egypt
"Business confidence is recovering, but the
economic situation remains troubled….
Financial conditions have eased."….Projections
of "GDP Growth in 2014/2015 is 4.1 percent".
"Egypt’s GDP growth rate is predicted
to increase in 2015.. it would be the
highest since 2010 (about 5.1%), but is
still much lower than Egypt’s potential
or pre-revolutionary growth rates."
"GOE has continued to recognize
that business and investment climate is crucial
to realizing Egypt’s potential, and has
remained committed to a process of reform".
BC Review of Egypt – 2014.
“Compared with other emerging
markets, foreign firms, though wary,
have not abandoned Egypt. … A Bank is
scouting for opportunities to expand,
even as the bank scales back from
nearby countries”.
8
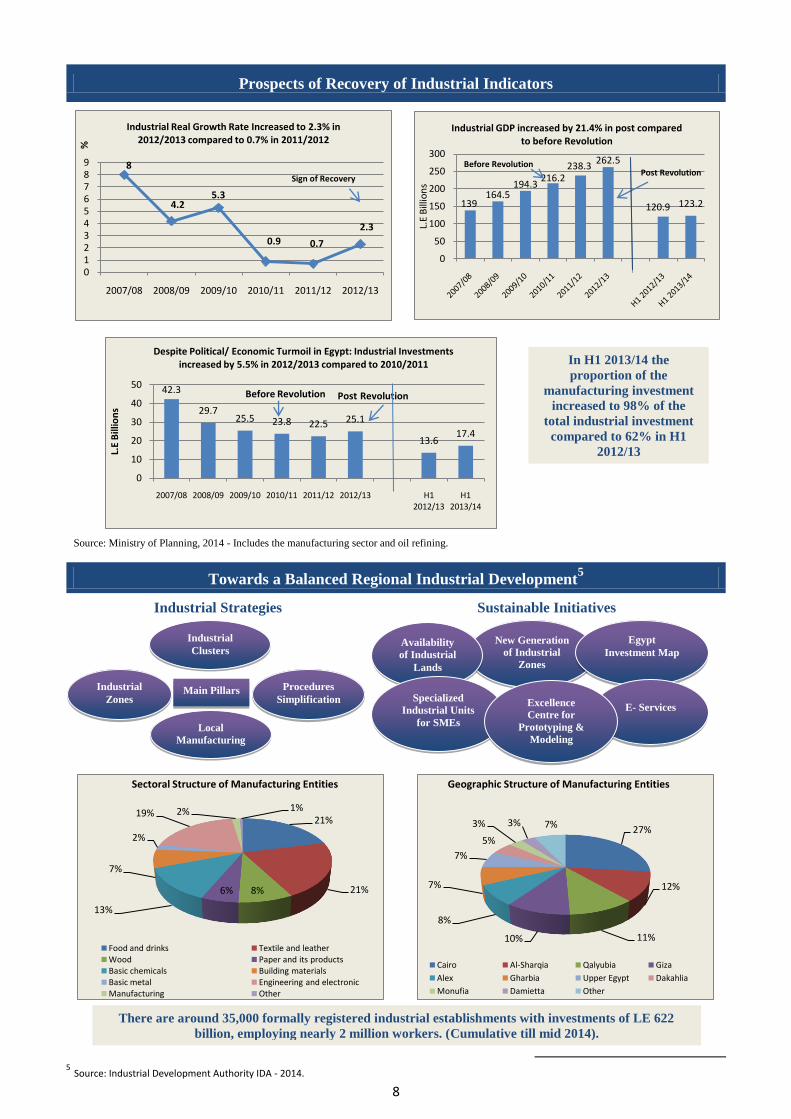
Prospects of Recovery of Industrial Indicators
Source: Ministry of Planning, 2014 - Includes the manufacturing sector and oil refining.
Towards a Balanced Regional Industrial Development5
Industrial Strategies Sustainable Initiatives
5 Source: Industrial Development Authority IDA - 2014.
8
4.25.3
0.9 0.7
2.3
0123456789
2007/08 2008/09 2009/10 2010/11 2011/12 2012/13
%
Industrial Real Growth Rate Increased to 2.3% in 2012/2013 compared to 0.7% in 2011/2012
139164.5
194.3216.2
238.3262.5
120.9 123.2
0
50
100
150
200
250
300
L.E
Bill
ion
s
Industrial GDP increased by 21.4% in post compared to before Revolution
Post RevolutionBefore Revolution
42.3
29.725.5 23.8 22.5 25.1
13.617.4
0
10
20
30
40
50
2007/08 2008/09 2009/10 2010/11 2011/12 2012/13 H1 2012/13
H1 2013/14
L.E
Bill
ion
s
Despite Political/ Economic Turmoil in Egypt: Industrial Investments increased by 5.5% in 2012/2013 compared to 2010/2011
Before Revolution Post Revolution
21%
21%8%6%
13%
7%
2%
19% 2% 1%
Sectoral Structure of Manufacturing Entities
Food and drinks Textile and leatherWood Paper and its productsBasic chemicals Building materialsBasic metal Engineering and electronicManufacturing Other
27%
12%
11%10%
8%
7%
7%
5%
3% 3% 7%
Geographic Structure of Manufacturing Entities
Cairo Al-Sharqia Qalyubia Giza
Alex Gharbia Upper Egypt Dakahlia
Monufia Damietta Other
In H1 2013/14 the
proportion of the
manufacturing investment
increased to 98% of the
total industrial investment
compared to 62% in H1
2012/13
Sign of Recovery
New Generation
of Industrial
Zones
Availability
of Industrial
Lands
Egypt
Investment Map
E- Services
Industrial
Clusters
Specialized
Industrial Units
for SMEs
Excellence
Centre for
Prototyping &
Modeling
Industrial
Zones
Procedures
Simplification
Local
Manufacturing
Main Pillars
There are around 35,000 formally registered industrial establishments with investments of LE 622
billion, employing nearly 2 million workers. (Cumulative till mid 2014).
9
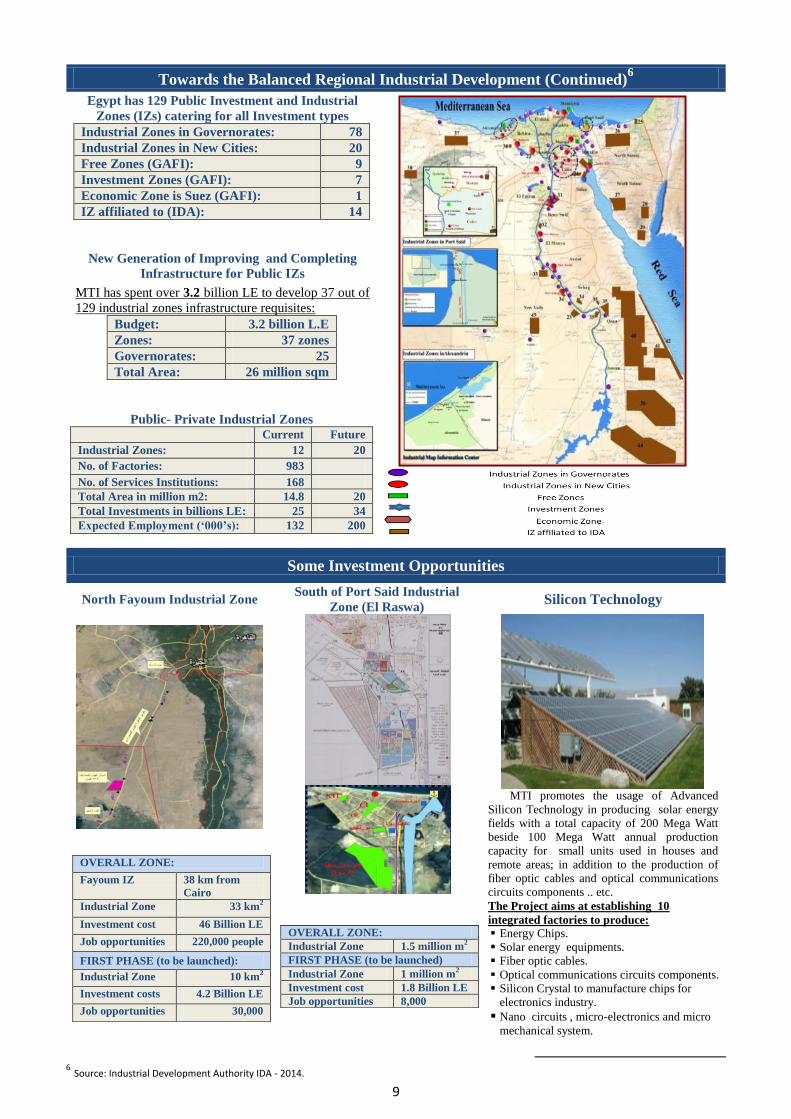
Towards the Balanced Regional Industrial Development (Continued)6
Egypt has 129 Public Investment and Industrial
Zones (IZs) catering for all Investment types
Industrial Zones in Governorates: 78
Industrial Zones in New Cities: 20
Free Zones (GAFI): 9
Investment Zones (GAFI): 7
Economic Zone is Suez (GAFI): 1
IZ affiliated to (IDA): 14
New Generation of Improving and Completing
Infrastructure for Public IZs
MTI has spent over 3.2 billion LE to develop 37 out of
129 industrial zones infrastructure requisites:
Budget: 3.2 billion L.E
Zones: 37 zones
Governorates: 25
Total Area: 26 million sqm
Public- Private Industrial Zones Current Future
Industrial Zones: 12 20
No. of Factories: 983
No. of Services Institutions: 168
Total Area in million m2: 14.8 20
Total Investments in billions LE: 25 34
Expected Employment (‘000’s): 132 200
Some Investment Opportunities
North Fayoum Industrial Zone South of Port Said Industrial
Zone (El Raswa) Silicon Technology
[
OVERALL ZONE:
Fayoum IZ 38 km from
Cairo
Industrial Zone 33 km2
Investment cost 46 Billion LE
Job opportunities 220,000 people
FIRST PHASE (to be launched):
Industrial Zone 10 km2
Investment costs 4.2 Billion LE
Job opportunities 30,000
OVERALL ZONE:
Industrial Zone 1.5 million m2
FIRST PHASE (to be launched)
Industrial Zone 1 million m2
Investment cost 1.8 Billion LE
Job opportunities 8,000
MTI promotes the usage of Advanced
Silicon Technology in producing solar energy
fields with a total capacity of 200 Mega Watt
beside 100 Mega Watt annual production
capacity for small units used in houses and
remote areas; in addition to the production of
fiber optic cables and optical communications
circuits components .. etc.
The Project aims at establishing 10
integrated factories to produce:
Energy Chips.
Solar energy equipments.
Fiber optic cables.
Optical communications circuits components.
Silicon Crystal to manufacture chips for
electronics industry.
Nano circuits , micro-electronics and micro
mechanical system.
6 Source: Industrial Development Authority IDA - 2014.
10
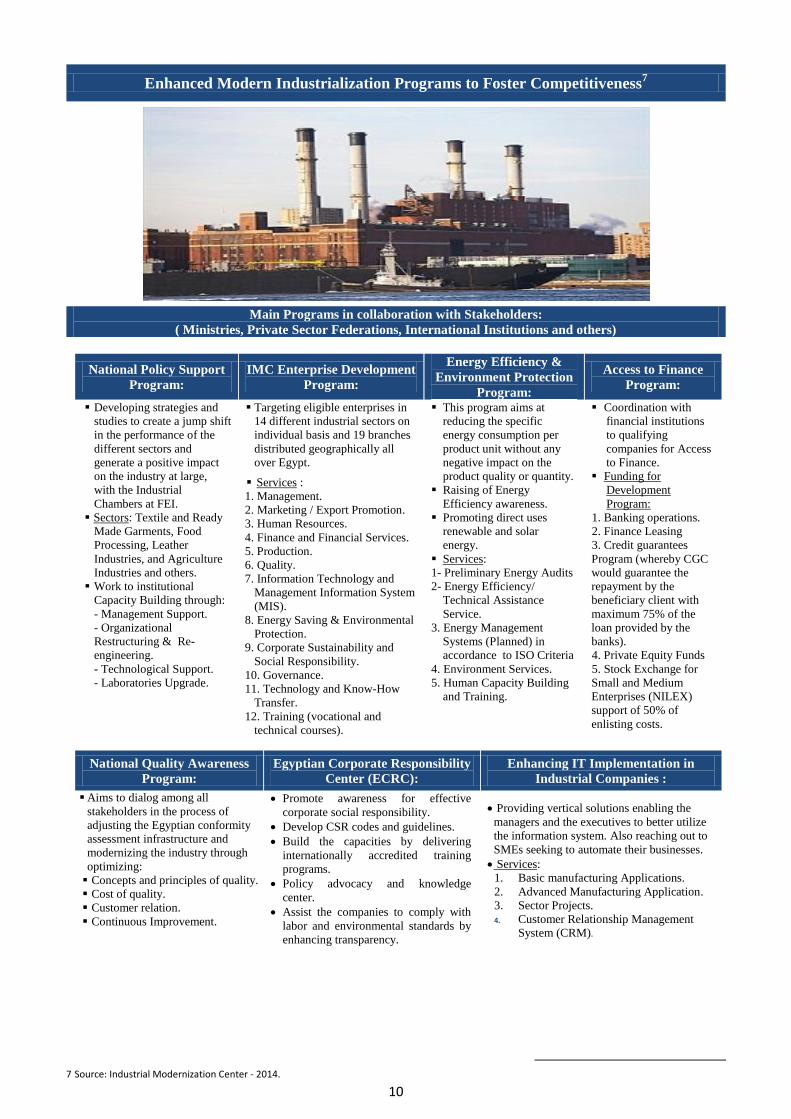
Enhanced Modern Industrialization Programs to Foster Competitiveness7
Main Programs in collaboration with Stakeholders:
( Ministries, Private Sector Federations, International Institutions and others)
National Policy Support
Program:
IMC Enterprise Development
Program:
Energy Efficiency &
Environment Protection
Program:
Access to Finance
Program:
Developing strategies and
studies to create a jump shift
in the performance of the
different sectors and
generate a positive impact
on the industry at large,
with the Industrial
Chambers at FEI.
Sectors: Textile and Ready
Made Garments, Food
Processing, Leather
Industries, and Agriculture
Industries and others.
Work to institutional
Capacity Building through:
- Management Support.
- Organizational
Restructuring & Re-
engineering.
- Technological Support.
- Laboratories Upgrade.
Targeting eligible enterprises in
14 different industrial sectors on
individual basis and 19 branches
distributed geographically all
over Egypt.
Services :
1. Management.
2. Marketing / Export Promotion.
3. Human Resources.
4. Finance and Financial Services.
5. Production.
6. Quality.
7. Information Technology and
Management Information System
(MIS).
8. Energy Saving & Environmental
Protection.
9. Corporate Sustainability and
Social Responsibility.
10. Governance.
11. Technology and Know-How
Transfer.
12. Training (vocational and
technical courses).
This program aims at
reducing the specific
energy consumption per
product unit without any
negative impact on the
product quality or quantity.
Raising of Energy
Efficiency awareness.
Promoting direct uses
renewable and solar
energy.
Services:
1- Preliminary Energy Audits
2- Energy Efficiency/
Technical Assistance
Service.
3. Energy Management
Systems (Planned) in
accordance to ISO Criteria
4. Environment Services.
5. Human Capacity Building
and Training.
Coordination with
financial institutions
to qualifying
companies for Access
to Finance.
Funding for
Development
Program:
1. Banking operations.
2. Finance Leasing
3. Credit guarantees
Program (whereby CGC
would guarantee the
repayment by the
beneficiary client with
maximum 75% of the
loan provided by the
banks).
4. Private Equity Funds
5. Stock Exchange for
Small and Medium
Enterprises (NILEX)
support of 50% of
enlisting costs.
National Quality Awareness
Program:
Egyptian Corporate Responsibility
Center (ECRC):
Enhancing IT Implementation in
Industrial Companies :
Aims to dialog among all
stakeholders in the process of
adjusting the Egyptian conformity
assessment infrastructure and
modernizing the industry through
optimizing:
Concepts and principles of quality.
Cost of quality.
Customer relation.
Continuous Improvement.
Promote awareness for effective
corporate social responsibility.
Develop CSR codes and guidelines.
Build the capacities by delivering
internationally accredited training
programs.
Policy advocacy and knowledge
center.
Assist the companies to comply with
labor and environmental standards by
enhancing transparency.
Providing vertical solutions enabling the
managers and the executives to better utilize
the information system. Also reaching out to
SMEs seeking to automate their businesses.
Services:
1. Basic manufacturing Applications.
2. Advanced Manufacturing Application.
3. Sector Projects.
4. Customer Relationship Management
System (CRM).
7 Source: Industrial Modernization Center - 2014.
11
Main KPIs of Industrial/ Creative Clusters:
Activity Creative Industrial
Artisan 690 142
Cluster 9 6
Workshops' 173 74
55%
20%
14%
8%3%
The Sectoral Structure of Services
Greater Cairo Delta Alexandria Upper Egypt Canal
17%
9%
16%
6%16%
14%
8%
2%4% 4% 4% 0.2%
The Sectoral Structure of Services
Textile Industry Services Food
Furniture Engineering Chemicals
Constructions Leather Agro
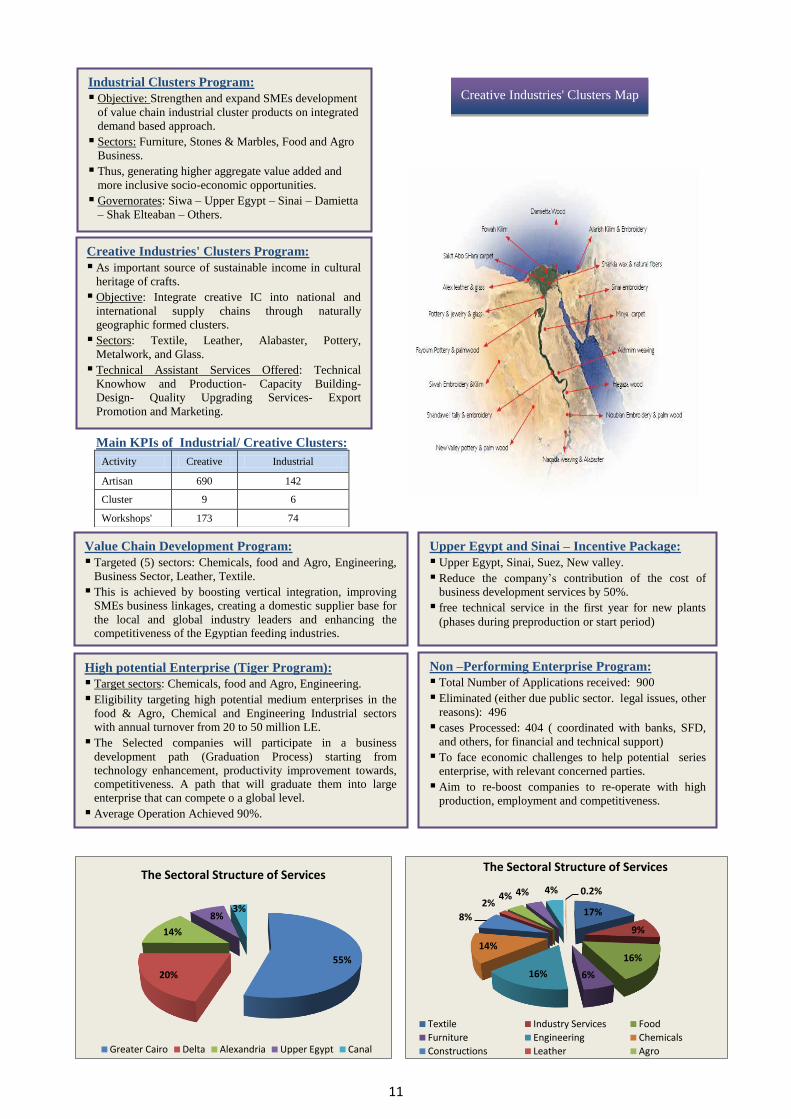
Creative Industries' Clusters Map
Industrial Clusters Program:
Objective: Strengthen and expand SMEs development
of value chain industrial cluster products on integrated
demand based approach.
Sectors: Furniture, Stones & Marbles, Food and Agro
Business.
Thus, generating higher aggregate value added and
more inclusive socio-economic opportunities.
Governorates: Siwa – Upper Egypt – Sinai – Damietta
– Shak Elteaban – Others.
Creative Industries' Clusters Program:
As important source of sustainable income in cultural
heritage of crafts.
Objective: Integrate creative IC into national and
international supply chains through naturally
geographic formed clusters.
Sectors: Textile, Leather, Alabaster, Pottery,
Metalwork, and Glass.
Technical Assistant Services Offered: Technical
Knowhow and Production- Capacity Building-
Design- Quality Upgrading Services- Export
Promotion and Marketing.
Value Chain Development Program: Targeted (5) sectors: Chemicals, food and Agro, Engineering,
Business Sector, Leather, Textile.
This is achieved by boosting vertical integration, improving
SMEs business linkages, creating a domestic supplier base for
the local and global industry leaders and enhancing the
competitiveness of the Egyptian feeding industries.
High potential Enterprise (Tiger Program):
Target sectors: Chemicals, food and Agro, Engineering.
Eligibility targeting high potential medium enterprises in the
food & Agro, Chemical and Engineering Industrial sectors
with annual turnover from 20 to 50 million LE.
The Selected companies will participate in a business
development path (Graduation Process) starting from
technology enhancement, productivity improvement towards,
competitiveness. A path that will graduate them into large
enterprise that can compete o a global level.
Average Operation Achieved 90%.
Upper Egypt and Sinai – Incentive Package:
Upper Egypt, Sinai, Suez, New valley.
Reduce the company’s contribution of the cost of
business development services by 50%.
free technical service in the first year for new plants
(phases during preproduction or start period)
Non –Performing Enterprise Program:
Total Number of Applications received: 900
Eliminated (either due public sector. legal issues, other
reasons): 496
cases Processed: 404 ( coordinated with banks, SFD,
and others, for financial and technical support)
To face economic challenges to help potential series
enterprise, with relevant concerned parties.
Aim to re-boost companies to re-operate with high
production, employment and competitiveness.
12
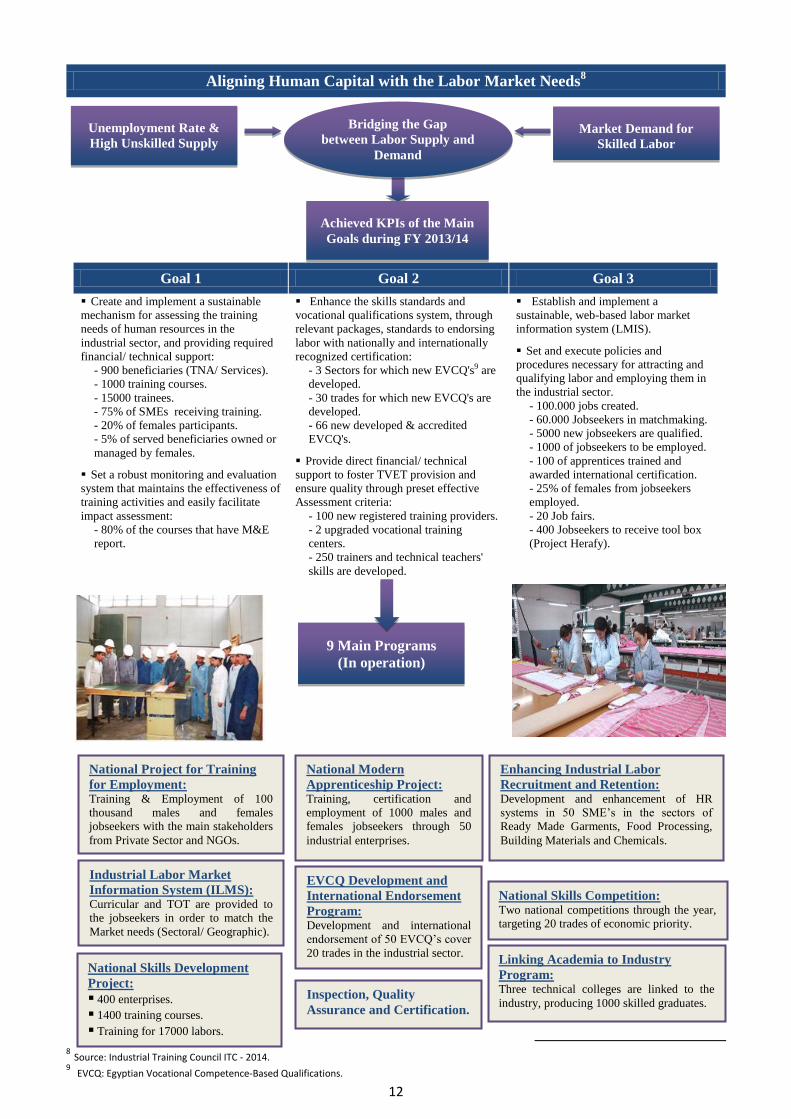
Aligning Human Capital with the Labor Market Needs8
Goal 1 Goal 2 Goal 3
Create and implement a sustainable
mechanism for assessing the training
needs of human resources in the
industrial sector, and providing required
financial/ technical support:
- 900 beneficiaries (TNA/ Services).
- 1000 training courses.
- 15000 trainees.
- 75% of SMEs receiving training.
- 20% of females participants.
- 5% of served beneficiaries owned or
managed by females.
Set a robust monitoring and evaluation
system that maintains the effectiveness of
training activities and easily facilitate
impact assessment:
- 80% of the courses that have M&E
report.
Enhance the skills standards and
vocational qualifications system, through
relevant packages, standards to endorsing
labor with nationally and internationally
recognized certification:
- 3 Sectors for which new EVCQ's9 are
developed.
- 30 trades for which new EVCQ's are
developed.
- 66 new developed & accredited
EVCQ's.
Provide direct financial/ technical
support to foster TVET provision and
ensure quality through preset effective
Assessment criteria:
- 100 new registered training providers.
- 2 upgraded vocational training
centers.
- 250 trainers and technical teachers'
skills are developed.
Establish and implement a
sustainable, web-based labor market
information system (LMIS).
Set and execute policies and
procedures necessary for attracting and
qualifying labor and employing them in
the industrial sector.
- 100.000 jobs created.
- 60.000 Jobseekers in matchmaking.
- 5000 new jobseekers are qualified.
- 1000 of jobseekers to be employed.
- 100 of apprentices trained and
awarded international certification.
- 25% of females from jobseekers
employed.
- 20 Job fairs.
- 400 Jobseekers to receive tool box
(Project Herafy).
8 Source: Industrial Training Council ITC - 2014.
9 EVCQ: Egyptian Vocational Competence-Based Qualifications.
Achieved KPIs of the Main
Goals during FY 2013/14
Unemployment Rate &
High Unskilled Supply
Market Demand for
Skilled Labor
9 Main Programs
(In operation)
National Modern
Apprenticeship Project: Training, certification and
employment of 1000 males and
females jobseekers through 50
industrial enterprises.
National Project for Training
for Employment: Training & Employment of 100
thousand males and females
jobseekers with the main stakeholders
from Private Sector and NGOs.
Industrial Labor Market
Information System (ILMS): Curricular and TOT are provided to
the jobseekers in order to match the
Market needs (Sectoral/ Geographic).
National Skills Development
Project:
400 enterprises.
1400 training courses.
Training for 17000 labors.
EVCQ Development and
International Endorsement
Program: Development and international
endorsement of 50 EVCQ’s cover
20 trades in the industrial sector.
Inspection, Quality
Assurance and Certification.
Enhancing Industrial Labor
Recruitment and Retention: Development and enhancement of HR
systems in 50 SME’s in the sectors of
Ready Made Garments, Food Processing,
Building Materials and Chemicals.
National Skills Competition: Two national competitions through the year,
targeting 20 trades of economic priority.
Linking Academia to Industry
Program: Three technical colleges are linked to the
industry, producing 1000 skilled graduates.
Bridging the Gap
between Labor Supply and
Demand
13
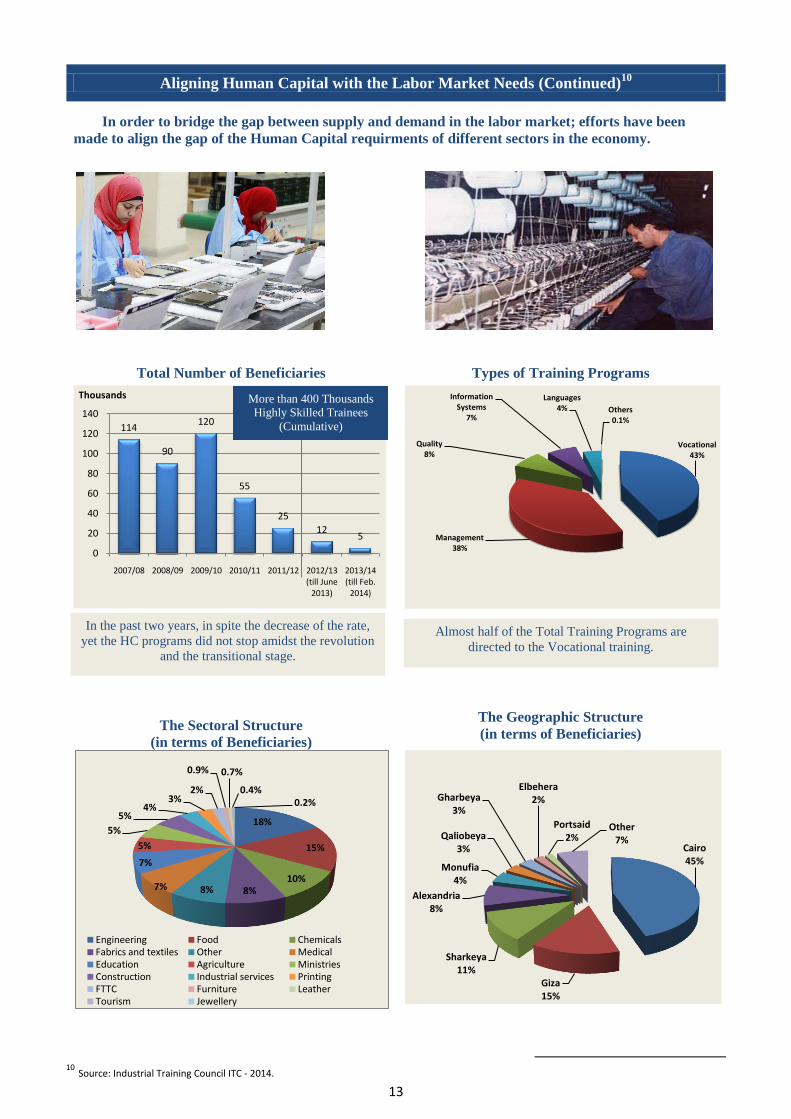
Aligning Human Capital with the Labor Market Needs (Continued)10
In order to bridge the gap between supply and demand in the labor market; efforts have been
made to align the gap of the Human Capital requirments of different sectors in the economy.
Total Number of Beneficiaries Types of Training Programs
The Sectoral Structure
(in terms of Beneficiaries)
The Geographic Structure
(in terms of Beneficiaries)
10
Source: Industrial Training Council ITC - 2014.
114
90
120
55
25
125
0
20
40
60
80
100
120
140
2007/08 2008/09 2009/10 2010/11 2011/12 2012/13 (till June
2013)
2013/14 (till Feb.
2014)
Thousands
Vocational 43%
Management38%
Quality 8%
Information Systems
7%
Languages 4% Others
0.1%
18%
15%
10%8%8%7%
7%
5%
5%
5%4%
3%2%
0.9% 0.7%
0.4%0.2%
Engineering Food Chemicals Fabrics and textiles Other Medical Education Agriculture Ministries Construction Industrial services PrintingFTTC Furniture Leather Tourism Jewellery
Cairo45%
Giza15%
Sharkeya11%
Alexandria8%
Monufia4%
Qaliobeya3%
Gharbeya3%
Elbehera2%
Portsaid2%
Other7%
Almost half of the Total Training Programs are
directed to the Vocational training.
In the past two years, in spite the decrease of the rate,
yet the HC programs did not stop amidst the revolution
and the transitional stage.
More than 400 Thousands
Highly Skilled Trainees
(Cumulative)