Embed Size (px)
Citation preview

Openness and innovation performance: are small firms different?
1
PAGE TITLE HERE
Openness and innovation performance: are small firms different?
Priit Vahter, James H Love and Stephen Roper ERC Research Paper No.12 November 2013

Openness and innovation performance: are small firms different?
2
Openness and innovation performance: are small firms
different?
Priit Vahter1, James H Love1 and Stephen Roper2
1 Birmingham Business School, University of Birmingham Birmingham, B15 2TT, UK
[email protected]; [email protected]
2 Centre for Small and Medium-Sized Enterprises Warwick Business School, University of Warwick
Coventry, CV4 7AL, UK [email protected]
This paper is published by the independent Enterprise Research Centre. The Enterprise Research Centre is a partnership between Warwick Business School, Aston Business School, Imperial College Business School, Strathclyde Business School, Birmingham Business School and De Montfort University. ERC is funded by the Economic and Social Research Council (ESRC); the Department for Business, Innovation & Skills (BIS); the Technology Strategy Board (TSB); and, through the British Bankers Association (BBA), by the Royal Bank of Scotland PLC; Bank of Scotland; HSBC Bank PLC; Barclays Bank PLC and Lloyds TSB Bank PLC. The support of the funders is acknowledged. The views expressed are those of the authors and do not necessarily represent the views of the funders.

Openness and innovation performance: are small firms different?
3
Abstract
Traditionally, literature on open innovation has concentrated on analysis of
larger firms. We explore whether and how the benefits of openness in
innovation are different for small firms (less than 50 employees) compared
to medium and large ones. Using panel data over a long time period (1994-
2008) from Irish manufacturing plants, we find that small plants have on
average significantly lower levels of openness, a pattern which has not
changed significantly since the early 1990s. However, the effect of
‘breadth’ of openness (i.e. variety of innovation linkages) on innovation
performance is stronger for small firms than for larger firms. For small firms
(with 10-49 employees) external linkages account for around 40 per cent of
innovative sales compared to around 25 per cent in larger firms. Small
plants also reach the limits to benefitting from openness at lower levels of
breadth of openness than larger firms. Our results suggest that small firms
can gain significantly from adopting an open innovation strategy, but for
such firms appropriate partner choice is a particularly important issue.
Keywords: Open innovation; SMEs; boundary-spanning linkages; learning
effects; Ireland
Acknowledgements
The research in this paper was funded by the ESRC under award RES-
062-23-2767.

Openness and innovation performance: are small firms different?
4
Contents
Abstract ............................................................................................ 3
1. Introduction ................................................................................. 5
2. Literature Review and Hypotheses ........................................... 7
3. Data and Methods ..................................................................... 10
4. Results ....................................................................................... 14
5. Conclusions .............................................................................. 17
References ..................................................................................... 29

Openness and innovation performance: are small firms different?
5
1. Introduction
Since the seminal work of Chesborough (2003), the research literature on
the benefits and determinants of open innovation has grown rapidly. In a
recent review of the open innovation literature, for example, Dahlander and
Gann (2010) identify over 150 related papers with an emphasis on case-
studies of multinationals such as Procter & Gamble (Dodgson et al.2006),
sectoral studies (e.g. Su et al. 2010 on biotechnology), and broadly-based
national econometric studies (Laursen and Salter 2006, Leiponen and
Helfat 2010, Love et al. 2011). Few of the studies reviewed by Dahlander
and Gann (2010) consider specifically the potential benefits of open
innovation to small firms or SMEs despite there being plausible reasons to
expect the effects and role of open innovation to be different for smaller
firms. It has long been acknowledged, for example, that there are marked
differences in the scope and focus of the innovation strategies of smaller
and larger firms (Acs and Audretsch 1990). Specifically with regard to
open innovation, Chesbrough (2010) also suggests that open innovation
poses particular challenges for SMEs because of their relative lack of
capacity to both seek and absorb external knowledge. Despite these
difficulties, recent empirical evidence suggests that some SMEs do
purposively engage in open innovation (Brunswicker and Vanhaverbeke
2011), and that the prevalence of open innovation among SMEs has
increased in recent years (van der Vrande et al. 2009).
Our contribution here is to explore whether the innovation benefits of
openness are different for smaller and larger firms. Specifically, we
concentrate on the benefits for firms’ innovation performance of openness
in knowledge exploration, and consider whether the breadth of firms’
innovation linkages have different implications for innovation performance
in smaller and larger firms. For example, do larger firms benefit more from
more extensive networks of innovation partners due to their greater
absorptive capacity? Or, are more extensive innovation networks a greater
advantage to smaller firms given their weaker internal resources and
therefore greater need to access external knowledge? To measure the

Openness and innovation performance: are small firms different?
6
‘breadth’ of firms’ innovation linkages we follow Laursen and Salter (2006)
in using a count of firms’ different types of innovation partner. Our analysis
is based on an unbalanced panel of Irish manufacturing plants that covers
five successive three-year surveys, over the period 1994 to 2008. The
longitudinal aspect of this data is a significant advantage over other cross-
sectional data sources which have been used to investigate the innovation
benefits of openness (Laursen and Salter 2006). Panel data models
confirm the existence of an inverted U-shaped relationship between the
‘breadth’ of external innovation linkages and innovation performance for
both larger and smaller plants (Laursen and Salter, 2006; Love et al.,
2011). Significant differences emerge, however, in the profile of innovation
benefits which small and larger plants can derive from any given breadth of
external innovation linkages. In particular, as search breath initially
increases, each increment to breadth contributes more to innovation
performance in smaller plants. At the same time, however, the maximum
innovation benefit which small plants can derive from external innovation
linkages is smaller for small plants, and occurs at lower breadth than that
for larger plants. In other words, small plants experience the limits to
openness at lower levels of breadth than larger plants. Our results have
implications for innovation strategy in smaller and larger plants and shed
new light on the benefits of openness in innovation across the population of
innovating firms.
The remainder of the paper is structured as follows. Section 2 reviews
recent evidence on the relationship between openness and innovation
performance and develops hypotheses related to the nature and breadth of
firms’ innovation linkages Section 3 describes our data taken from the Irish
Innovation Panel and outlines the estimation methods we adopt. Section 4
presents the results of our econometric analysis focussing on the contrasts
between smaller and larger firms and Section 5 concludes with a
discussion of the strategic and policy implications.

Openness and innovation performance: are small firms different?
7
2. Literature Review and Hypotheses
Our key concern here is the relationship between openness and innovation
performance. For example, Powell (1998) stresses the potential value of
openness in stimulating creativity, reducing risk in the innovation process,
accelerating or upgrading the quality of the innovations made, and
signalling the quality of firms’ innovation activities. External innovation
linkages may also increase firms’ access to technology developed
elsewhere (Mowery, 1990; Niosi, 1999) and their ability to appropriate the
returns from innovation (Gemser and Wijnberg, 1995). Moreover, having
more extensive networks of linkages or more different types of linkages is
likely to increase the probability of obtaining useful knowledge from outside
of the firm (Leiponen and Helfat 2010). Empirical evidence also points to
the conclusion that knowledge gained from alternative sources tends to be
complementary and also complementary with firms’ internal knowledge in
shaping innovation performance (Roper et al. 2008) 1. Having more
external linkages may therefore both increase the probability of obtaining
valuable knowledge and maximise potential knowledge complementarities.
Openness in innovation also has some potential disadvantages. For
example, there may be difficulties with managing and protecting intellectual
property rights in relationships with partners. Having a larger number or
variety of types of innovation partner may also lead to problems with the
management and monitoring of these relationships (Simon 1947,
Audretsch et al., 1996; Sieg et al. 2007) and the simultaneous absorption
of knowledge from a number of different sources. These disadvantages are
likely to increase as firms’ number of linkages increases with the potential
for the firm to reach a ‘saturation level’ where the innovation benefits of
external linkages are maximised. Beyond that level, the addition of another
innovation linkage will result in diminishing the innovation performance of
1 R&D can be seen also as a proxy of absorptive capacity of firms (Cohen and
Levinthal 1989). Own R&D may enhance firms ability to benefit from other knowledge sources. For example, in Rosenberg’s (1990) view firm’s own research capability is seen as indispensable for monitoring and evaluating research that is performed elsewhere.

Openness and innovation performance: are small firms different?
8
the firm as the attention of managers is diluted between large numbers of
different knowledge sources. Koput (1997) and Laursen and Salter (2006)
reflect this in their notion of ‘over-searching’.
The balance between the positive effects of firms’ external innovation
linkages and the potential for over-searching led Laursen and Salter
(2006), Leiponen and Helfat (2010) and Love et al. (2011) to expect an
inverted U-shaped relationship between the breadth or number of
innovation linkages and innovation performance, an expectation confirmed
by their empirical analyses. Thus we too expect to find that:
Hypothesis 1: Innovation performance has an inverted U-shaped
relationship with a plant’s breadth (number) of external innovation linkages.
This does not of course suggest that the shape of the relationship between
the breadth of plants’ innovation linkages and performance will be the
same for small and larger plants. Indeed, there are sound reasons to
expect that the relationship may be very different. Small firms may, for
example, face particular difficulties in implementing open innovation due to
their shortage of the abilities that are needed: i) to build organizational
structures and for identification of useful external knowledge; and ii) to
absorb externally developed ideas and technologies, even if they were
already initially copied or transferred from outside the firm. Also, the low
level of knowledge resources at SMEs means that they may be unattractive
co-operation partners for others, further reducing the chances of building
‘openness’ (Chesbrough 2010). This is perhaps reflected in recent
empirical evidence which suggests that small producers adopt open
innovation practices significantly less than medium sized ones (van de
Vrande et al. 2009).
It is tempting to infer from these arguments that smaller firms will benefit
less from open innovation. However, the relative benefits of increasing
openness for small and large firms may be much more subtle than this and
there are good reasons to think that the innovation benefits of openness
may actually be stronger for small firms – at least up to some limit. Weaker

Openness and innovation performance: are small firms different?
9
internal knowledge resources and ability to invest in in-house knowledge
creation potentially make external sourcing of knowledge especially
important for small firms. As small firms start, on average, with lower
overall levels of knowledge resources, adding more or new types of
innovation linkages is likely to have a larger proportionate effect on small
firms. For small firms the search for knowledge created elsewhere may
also be a more viable way of acquiring new knowledge than in-house
generation due to the costs and risks involved in R&D activity. Developing
linkages to customers or suppliers, for example, is unlikely to involve the
same fixed costs as conducting in-house R&D. SMEs might also benefit
more from external linkages because of behavioural advantages related to
flexibility and speed of decision making (Vossen, 1998; Acs and Audretsch
1987). Due to this and their ability to specialize to narrow market segments
that are unattractive to larger firms, SMEs may be better at quickly adopting
the ideas and suggestions by lead users into the product development
phase (Chesbrough 2010).
Thus there are reasons why the benefits of each additional linkage may be
greater for smaller firms. However, the limits to openness also come into
play here. As Hypothesis 1 suggests, the returns to increased openness
are likely to become negative at some point as managerial cognitive limits
are reached and the diseconomies of ‘over-searching’ are encountered
(Koput 1997; Laursen and Salter 2006). Due to their smaller top
management teams and therefore lower capacity to organise and manage
larger sets of external linkages, we expect this limit to be reached more
quickly among small firms. In other words, while the innovation
performance of smaller firms may benefit more from the addition of an
additional external linkage, smaller firms will also reach the limits of any
additional benefits earlier than larger firms. This leads to two further
hypotheses:
Hypothesis 2: The initial marginal benefit to innovation performance of
each additional innovation linkage will be greater in small firms.

Openness and innovation performance: are small firms different?
10
Hypothesis 3: The maximum benefit to innovation performance of firms’
external innovation linkages will be reached at a lower number of
innovation linkages by small firms.
3. Data and Methods
Our empirical analysis is based on data from the Irish Innovation Panel
(IIP) covering the period 1994 to 2008. The IIP provides information on the
innovation activities of manufacturing plants in Ireland and Northern Ireland
and comprises five plant-level surveys2. These were conducted every three
years using similar survey questionnaires with common questions, and
capture the same indicators of open innovation during this period. The
initial IIP survey used here was conducted between November 1996 and
March 1997. It covered plants’ innovation indicators for the 1994-96 period,
and had a response rate of 32.9 per cent (Roper and Hewitt-Dundas,
1998). The next IIP survey covered the 1997-99 period and reached a
response rate of 32.8 per cent. The survey covering the 2000 to 2002
period achieved an overall response rate of 34.1 per cent. Subsequent
surveys covering the 2003 to 2005 and 2006 to 2008 periods achieved
response rates of 28.7 per cent and 38 per cent respectively. We note that
the resulting panel is unbalanced, both due to the foundation and closure of
plants and survey non-response.
Our focus here is on firms’ responses to a question asked in each of the
different waves of the IIP: Over the last three years did you have links with
other companies or organisations as part of your product or process
development? Plants that confirmed having linkages were then asked to
indicate which types of external partners they had during the 3-year period
covered by the survey. Eight partner types of external linkages were
outlined in the survey questionnaire: linkages to customers, suppliers,
competitors, joint ventures, consultants, universities, industry operated
laboratories, and government operated laboratories. Figure 1 shows how
2 The IIP dataset is at plant level. However, most of the observations are single
plant firms. Overall, 58 per cent of all observations in the IIP are from single plant firms: among small plants this figure is significantly higher at 77 per cent.

Openness and innovation performance: are small firms different?
11
the average number or breadth of linkages has changed through time for
small plants (with 10-49 employees) and larger plants. On average, over
the whole sample period, small plants have an average of 0.82 external
linkages, half that of larger plants (1.64, Table 1)3. There is little evidence in
our Irish dataset supporting the idea of a ‘paradigm shift’ towards open
innovation among small or larger plants such as that found in the
Netherlands by van de Vrande et al. (2009) (Figure 1).
Not surprisingly perhaps, the most common external partners in plants’
innovation activity were customers and suppliers (Table 2). Links to
universities, labs, competitors and other partners are much less common.
This regularity holds for both small and larger plants. Small plants in
particular, have significantly fewer supply chain linkages to customers and
suppliers than larger plants. For example in the 2006 to 2008 period, 33
per cent of small plants and 53 per cent of larger plants had supply chain
linkages. Notably, the gap between small and large plants is even larger in
terms of links to universities and laboratories and linkages to competitors
and others knowledge sources (Table 2).
Our econometric analysis is based on estimation of the innovation
production function with innovation linkages included among the
explanatory variables (Crépon et al. 1998; Laursen and Salter, 2006; Love
et al., 2011). The innovation production function is estimated separately for
small and medium/large plants. Our econometric model is similar to the one
used in Laursen and Salter (2006) based on UK data and Love et al.
(2011) based on the full sample of the IIP dataset. As the dependent
variable in the innovation production function we use a common innovation
output indicator – the proportion of plants’ sales (at the end of each three-
year reference period) derived from products that were either newly
introduced or improved during the previous three years. This variable
reflects plant’s ability to introduce new or improved products to the market
and their subsequent commercial success. On average, 20 per cent of the
3 The difference between the mean values of linkages for small and larger firms is
highly significant (t=13.89).

Openness and innovation performance: are small firms different?
12
sales of small plants were from newly introduced or improved products
compared to 29 per cent for larger firms (Table 1).
We estimate the innovation production function separately for small and
larger plants. Let INNOVit be an innovation output indicator (for plant i at
survey period t), and FCBit a vector of plant level control variables and OIit
represent plants’ breadth or number of innovation linkages. The innovation
production function with sector specific ( j ) and time effects ( t ) can then
be written:
ittjitititit FCBOIOIINNOV 3
2
210 . (1)
Here, i denotes the plant, t period (IIP wave), and j sector, it is an
idiosyncratic error term. Hypothesis 1 implies that δ1>0 and δ2<0, for both
sets of plants. Hypothesis 2 implies that the innovation benefits of external
linkages will be greater for small firms. We can test this hypothesis based
on a comparison of δ1 and δ2 in the innovation production functions for
smaller and larger firms. It also proves helpful to plot these relationships
highlighting contrasts in the shape and turning point of the relationship
between the number of linkages and innovation performance as anticipated
in Hypothesis 3.
Our choice of estimation approach for Equation (1) reflects the form of our
dependent variable; the share of new or improved products in sales can
take values between 0 and 100. Therefore we use a panel tobit model and
in each equation a set of sector indicators at the 2- digit level and a series
of time dummies. We also include in each model a set of controls for other
plant characteristics which have been found in many previous studies to
affect innovation outputs. One of the most important innovation inputs is an
indicator whether or not plants are under-taking in-house R&D (Crépon et
al. 1998, Griliches 1995; Oerlemans et al. 1998). This is also an indicator
of absorptive capacity (Cohen and Levinthal 1990). In our sample, in-house
R&D was performed by 29 per cent of small plants and 60 per cent of
larger plants (Table 1). We also include variables intended to reflect the

Openness and innovation performance: are small firms different?
13
strength of plants’ internal knowledge base – multinationality and the age
and scale of the plant (Klette and Johansen, 1998). A multinationality
dummy is incorprated as a control variable because links between plants
within a multinational are a potentially important channel for international
knowledge transfer (Dunning 1988, Lipsey 2002). On one hand,
multinational firms may be more able to reap the benefits of open
innovation than domestic firms due to access to knowledge resources
within the firm. Multinationality may also reflect the higher absorptive
capacity of the plant. Additionally, we include the share of each plant’s
employees which have a degree level qualification, an indicator of labour
quality (Freel 2005) and potentially also absorptive capacity. Models also
include a dummy variable to indicate whether or not plants had received
public support for their innovation activity (Hewitt-Dundas and Roper 2009).
The Herfindahl index is also included as a broad proxy for sectoral
competition (at the 2-digit level).
Finally, before turning to our empirical results it is important to acknowledge
the potential for survey-based studies such as ours to suffer from common
method variance or bias (CMB). CMB is the variance due to the general
measurement methods rather than due to the measured key explanatory
variables themselves (Podsakoff et al. 2003, Sharma et al. 2010, etc) and
may lead to biased estimates of the effects of key variables of interest in
survey-based studies (Sharma et al. 2010). Three aspects of our analysis
reduce the potential for CMB: first, our analysis is based on a series of
surveys rather than a single survey; second, we estimate a relatively
complicated innovation production function with the dependent variable
measured at the end of the period and key explanatory variables reflecting
plants’ innovation activities during the previous three years; third, the
answer scales of our dependent variable and key explanatory variables are
very different. Formally, we have checked for CMB using the Harmon’s
one factor test (Podsakoff and Organ 1986) and the marker variable
technique (e.g. Malhotra et al. 2006, Lindell and Whitney 2001). Harmon’s
one factor test is regularly used in the literature, for example, in a related
study to ours by Leiponen and Helfat (2010). Harmon's one-factor test

Openness and innovation performance: are small firms different?
14
consists of running a factor analysis of all key variables in the model. If the
first unrotated factor accounts for a relatively small share of the total
variance (not more than 50 per cent), the implication is usually that CMB is
not likely to be a significant problem. Harmon’s one factor test suggests in
our data this single factor explains only about 27 per cent of the total
variation of the main variables in our model.
Some authors have argued, however, that this test may be insufficient to
test for the presence of CMB (Podsakoff et al. 2003). Therefore we have
also implemented the marker variable technique (Lindell and Whithey
2001, Sharma et al. 2010). This approach is based on comparison of
pairwise correlations in the case of key variables in the dataset. In this
technique, a ‘marker variable’ is sometimes identified as a variable that is
theoretically unrelated to at least one variable in the study. Alternatively,
where such a marker variable cannot be identified a priori, the variable with
the lowest correlation with other variables is chosen as the ‘marker’
(Sharma et al. 2010). In this last case, the smallest positive correlation in
the correlation matrix of variables used in the study is considered as a
proxy for CMB. Based on both alternatives of the marker variable
technique, there appears to be no reason to suspect significant CMB in our
analysis.4
4. Results
The results of estimating equation (1) are shown in Table 3. There is
supporting evidence for Hypothesis 1, i.e. there is strong evidence of an
inverted U-shaped relationship between openness and innovation outputs
for both small and larger firms (Laursen and Salter, 2006; Leiponen and
4 One marker variable we tried was the indicator of government support to exports.
The lowest correlation of this variable with the ones in Model 1 or 2 was with age of the plant (0.0049). (There were several other variables with similar low correlation with government support to exports.) Taking this correlation as a measure of the CMB and subtracting it from the other pairwise correlations (as outlined in more detail in Sharma et al. 2010) does not significantly affect the correlations between the variables used in our regression analysis, in Equation 1 or 2. Also, other marker variables that we tried yield similar result. Thus, CMB is not an important problem here.

Openness and innovation performance: are small firms different?
15
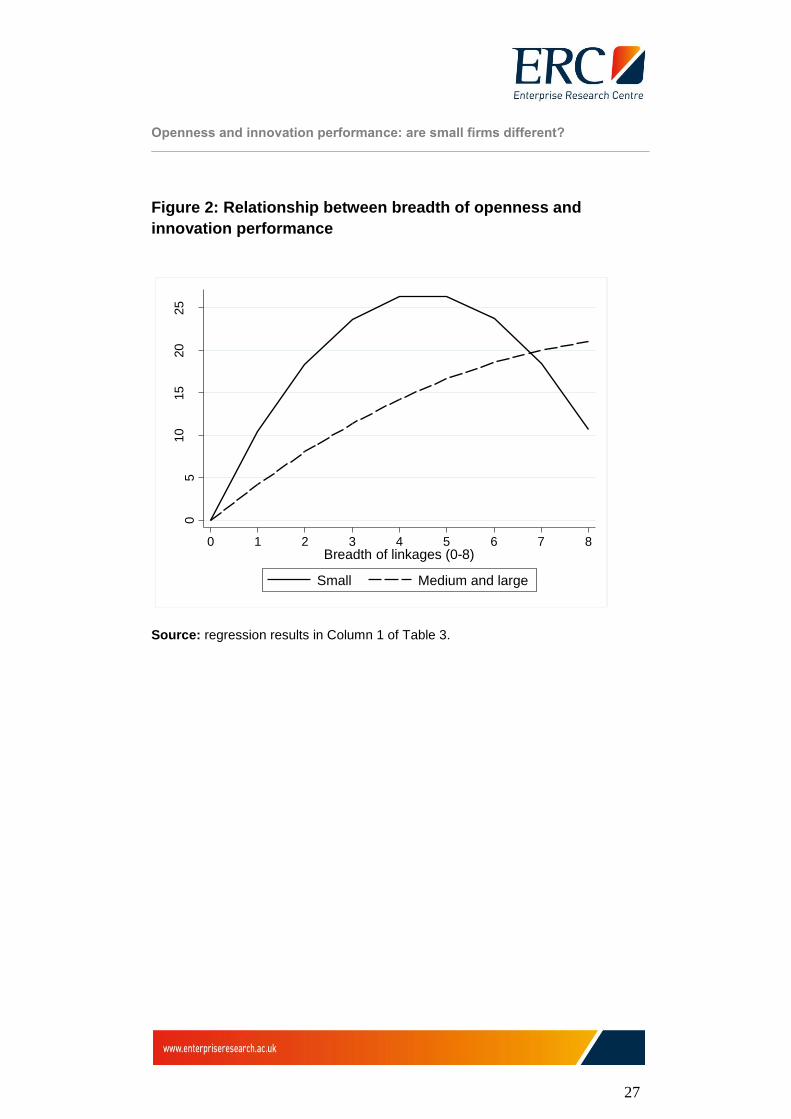
Helfat, 2010; Love et al. 2011). In Figure 2 the coefficients on the number
of linkages and its square in Table 3 (Models 1 and 2) are used to plot the
relationship between breadth of openness and innovation performance. It is
evident that among small plants the innovation benefits of openness is
greater than that for larger plants reflecting the larger coefficient on breadth
in the estimated model for small plants. However, as almost all small plants
have fewer than six types of external linkage the effect of breadth of open
innovation on innovation performance is, in effect, stronger for almost all
small plants. This provides very strong support for Hypothesis 2.
Hypotheses 3 posited that the maximum innovation benefits of openness
would be reached earlier in the case of small plants. This is indeed the
case, as shown in Figure 2. The turning point of the openness-innovation
performance relationship for small plants occurs at about four types of
external linkage: adding additional linkages beyond this point is associated
with lower innovation output. By contrast for larger firms increasing breadth
of linkages continues to be associated with greater innovation output, albeit
at a decreasing rate. This tends to support the view that governing many
different types of linkages requires significant co-ordination capacity,
precisely the kind of resources and co-ordination abilities which may be
lacking in smaller firms.
One issue with Figure 2 is that it does not account for the different starting
point in terms of level of innovation performance of small and larger plants
which may reflect, for example, their different levels of internal knowledge
resources. This is taken into account in Figure 3 where we combine
equation coefficients (from Table 3) with average values of each
explanatory variable other than breadth to define average predicted levels
of innovation performance. Here the underlying relationships between
breadth of linkages and innovation output remains unchanged, but we
show the level of share of new or modified products in sales that is attained
for an average firm in both groups (i.e. the level of innovation output
attained given all the other regression coefficients and average values of
explanatory variables). The results of our regression analysis, combined

Openness and innovation performance: are small firms different?
16
with information about mean values of the control variables in each group,
show that the level of innovation output of the average small plant is lower
than the level of the average large plants as long as the number of different
types of innovation linkages is less than 3 or above 4. If small plants have 3
or 4 different types of linkages they attain, on average, the same level of
innovation output as larger plants. This reinforces the message of
Hypothesis 2 that – within limits – small firms can make up for a lack of
other internal innovation resources by developing external linkages with
innovation partners.
Finally, as a robustness check, we use the McDonald and Moffitt (1980)
decomposition to divide the effects of breadth of linkages in Column (1)
and (2) of Table 3 into two components. First, the marginal effect on the
probability of having positive innovation output (i.e. propensity to innovate).
Second, the marginal effect on the expected value of innovation output
conditional on the plant engaging in innovation. The results confirm that the
marginal effects of the breadth of innovation linkages both on the
probability that a plant will engage in innovation and on innovation intensity
among innovators is higher among small plants (Table 4). This suggests
that the benefit of adding an additional external linkage is greater for small
firms both in terms of its effect on their propensity to innovate and in terms
of increasing their level of innovation outputs once over the innovator
hurdle. The effect on the uncensored part of the distribution of innovation
performance (i.e. the ‘intensity’ effect) accounts for 32 per cent of the total
effect on innovation performance of small plants. The corresponding figure
for large and medium sized plants amounted to 42 per cent. This shows
clearly that the effect on the propensity to innovate is proportionally more
important for small plants.
The control variables used in the tobit models largely take the expected
signs but also suggest some significant differences between the
determinants of innovation performance in small and larger plants. For
example, R&D is an important input in the innovation production function
for both small and larger plants but has a significantly greater effect on

Openness and innovation performance: are small firms different?
17
innovation performance in smaller firms5. Similarly, exposure to export
markets (χ2=3.06, ρ=0.002) and having a more highly qualified workforce
(χ2=2.43, ρ=0.015) both have a proportionately greater effect on innovation
performance in smaller rather than larger plants (Love et al; 2010; Freel,
2005). Other factors such as external ownership (χ2=0.02, ρ=0.987) and
receiving public support (χ2=0.95, ρ=0.340) for innovation also have
positive effects on innovation performance, effects which are similar in
scale for small and larger plants (Hewitt-Dundas and Roper, 2009).
Interestingly, sectoral concentration as measured by the Herfindahl index is
only significant for larger firms where, somewhat contrary to expectations, it
has a positive rather than negative sign. This suggests that for larger firms,
at least, higher levels of sectoral competition necessitate, or perhaps
encourage, higher levels of innovative activity as Baumol (2002) suggests.
5. Conclusions
This paper investigates how the role of openness in the innovation process
differs between small and larger plants. Specifically, we examine the role of
breadth of external linkages and its link to innovation performance. There
are plausible reasons to expect that small firms will be less open, and also
to expect that they will benefit more from each additional linkage but also
reach the limits of that beneficial effect at a lower level of ‘openness’ than
larger firms. However, there is very little direct evidence on whether and
how this differential effect operates in practice.
Based on an econometric analysis of Irish plant-level panel data from 1994
to 2008 our results - which generally accord with a priori reasoning -
suggest that open innovation works very differently in small firms. First,
small firms are consistently less open in terms of their number of external
linkages than larger firms and this is consistent over the 1994 to 2008
period. Second, as expected, we find an inverted U-shaped relationship
between the extent (‘breadth’) of openness and firms’ innovation
5 Comparing Models 1 and 2 in Table 3, for example, a test of the equality of the
coefficients on in-house R&D in the two models suggests a χ2=5.80, ρ< 0.000.

Openness and innovation performance: are small firms different?
18
performance, both for small and larger firms (Figure 2). Third, small firms
gain more from each additional linkage type than do larger firms. Fourth,
small firms reach their limit to benefitting from openness earlier than larger
firms. Taking the last two findings together suggest that larger firms are
able to continue benefitting from increased linkage breadth (albeit at a
decreasing rate) beyond the limit at which increased breadth has started to
have negative effects for small firms (Figures 2 and 3).
Perhaps the most important conclusion from these findings is that
openness is proportionately more important to innovation in smaller plants.
On average, small firms have 0.8 external innovation linkages (Table 1)
which contribute around 8 percentage points to innovative sales (Figure 2).
This accounts for around 40 per cent of the average level of innovative
sales of smaller firms (20.4 per cent, Table 1). For larger firms, which have
an average of around 1.6 external innovation linkages (Table 1), those
linkages account for around 7 percentage points or around a quarter of
average innovative sales by larger plants. So, where they are able to take
advantage of external linkages, small firms often have more to gain than
their larger counterparts. Our findings therefore underline the importance
of paying attention to the heterogeneity of effects of open innovation across
different types of plants. Average effects based on all plants in
manufacturing industry clearly hide large variations across different groups
of plants.
While it is tempting to draw immediate conclusions on innovation strategy
for small firms or indeed SME policy from these results, caution must be
exercised in suggesting the benefits of external linkages for smaller firms.
Our findings certainly suggest that small firms may well have a bigger
incentive than hitherto imagined to develop innovation linkages with
external partners. However, partnering involves two parties: as
Chesbrough (2010) points out, small firms may often be unattractive (or
unnoticed) co-operation partners for other enterprises, especially large
ones. This may mean that the costs involved in seeking and finding a
suitable partner may well be beyond the means of many small firms. We

Openness and innovation performance: are small firms different?
19
also know little about the costs involved in developing such relationships,
an area which provides a potentially valuable focus for future research. In
addition, it should be borne in mind that developing such linkages is very
much a minority sport among small firms: the average number of linkages
for small firms in our sample is less than one, with only 21 per cent of small
firms having three or more types of linkage. Nevertheless, the potential
benefits of increased breadth are great: as indicated in Figure 3, for our
sample an average small firm with no innovation linkages has a level of
innovation intensity approximately 12 percentage points below that of an
average firm with more than 50 employees. By the time both firms have
reached three types of external linkage, this gap has completely closed,
suggesting that external boundary-spanning linkages can be an effective
strategy for small firms to boost markedly their level of innovativeness.
In strategic terms our results suggests the value of open innovation
strategies for small firms involving, perhaps, up to four types of external
partner. The limited resources available within small firms for managing
and developing these external relationships, however, suggests the
importance of the careful selection of the most appropriate or beneficial
innovation partners. Criteria for partner selection will of course vary,
reflecting the internal capabilities of each small firm and their innovation
ambitions (Jeon et al., 2011). In policy terms, however, this suggests the
potential importance of partnership brokering intermediaries which might
encourage small firms to adopt more open innovation strategies and help
to identify potential innovation partners (Cantner et al., 2011). Recent
examples of such initiatives would be the innovation voucher schemes
developed in a range of European and other OECD countries (Bakhshi et
al., 2011). A key design feature of such schemes has been efficient
brokerage or processes to match SMEs with appropriate knowledge or
service providers. The extent of such activity has varied widely, however,
depending on the specific target group of SMEs. In the early Dutch
innovation voucher schemes the administering agency’s brokering activity
was limited to the compilation of a list of eligible partners with SMEs then
required to select their own partner. Similar approaches have been

Openness and innovation performance: are small firms different?
20
adopted in the Irish innovation voucher scheme and the UK Creative
Credits programme. An alternative approach involving more active
brokering activity has been adopted in some regional UK programmes with
SMEs actively supported in identifying potential innovation partners
(Bakhshi et al., 2011). Perhaps the key point here is that where SMEs are
inexperienced in working with external innovation partners they are likely to
need more support in selecting partners and then developing their external
relationships.
Our results provide support for the value of such initiatives in terms of the
innovation benefits they can generate. Two limitations of our analysis
suggest the need for some caution in drawing more specific policy
implications. First, while our analysis does provide an indication of the
benefits of openness for small and larger firms, a more complete picture
would also require an assessment of the costs of developing new linkages
and how these costs differ between smaller and larger firms. For example,
while the resource cost of developing a new linkage may be similar in
smaller and larger firms, the opportunity cost may be markedly greater in
small firms. This may offset some or all of the higher level of innovation
benefits in smaller firms. As far as we are aware there is no specific
evidence comparing the relative costs and benefits of innovation linkages
in larger and smaller firms but for a group of Belgian firms Faems et al.
(2010) do demonstrate that the costs of developing technology alliances
can actually outweigh their (indirect) benefits on firm performance.
Investigating more specifically the costs and benefits of openness for small
and larger firms is a potentially interesting and useful theme for future
research. A second limitation of our analysis, which restricts its direct
policy application, is the broad nature of our measure of the breadth of
plants’ portfolio of innovation linkages. This implicitly makes a number of
assumptions: that each type of linkage is of equal innovation value, that
this value remains the same through time, and that the relative innovation
value of each type of linkage is the same for larger and smaller firms. Each
of these assumptions suggests the value of further research to develop
more realistic weighting structures for different types of linkages which can

Openness and innovation performance: are small firms different?
21
provide a better indication of the innovation value of openness and
therefore the value of alternative types of policy interventions.

Openness and innovation performance: are small firms different?
22
Table 1: Descriptive statistics of variables used in regression analysis
Small plants Medium and large plants
Variable Mean Std. Dev. Mean Std. Dev.
Sales from new or improved products (%) 20.43 28.49 29.39 30.78 R&D conducted in-house (dummy) 0.39 0.49 0.60 0.49
Number of linkages (0…8) 0.82 1.46 1.64 2.03 Linkages within supply chain (dummy) 0.28 0.45 0.46 0.50 Linkages with universities and labs (dummy) 0.13 0.33 0.30 0.46
Other linkages (dummy) 0.19 0.39 0.33 0.47 Employment (no.) 23.96 11.33 199.53 389.19
Age of the plant (years) 28.57 27.66 32.22 32.92
Foreign owned plant (dummy) 0.14 0.35 0.49 0.50
Export dummy 0.42 0.49 0.72 0.45
Workforce with degree (%) 9.63 14.15 10.57 12.54 Govt. support for product innov. (dummy) 0.18 0.39 0.30 0.46
Herfindahl index 0.26 0.13 0.28 0.11
Number of observations 2170 1672
Source: IIP. Note: Dummy variable ‘Other linkages’ includes linkages to
competitors, joint ventures and consultants.

Openness and innovation performance: are small firms different?
23
Table 2: Percentage of plants with linkages to different types of partner
Percentage of plants with linkages:
Small plants:
Period
Within supply chain
%
To universities and labs
% Other linkages*
%
1994-1996 24.9 9.8 16.9
1997-1999 31.9 16.8 24.1
2000-2002 24.7 10.4 15.5
2003-2005 23.7 11.2 17.1
2006-2008 33.2 12.2 18.3
Medium and large plants:
Period
Within supply chain
%
To universities and labs
% Other linkages*
%
1994- 1996 43.2 26.5 30.8
1997-1999 51.2 30.7 34.9
2000-2002 41.1 26.5 32.1
2003-2005 43.8 29.2 26.6
2006-2008 53.1 43.3 38.8
Notes: Observations are weighted to give representative results.
Source: IIP. *- linkages to competitors, joint ventures and consultants.

Openness and innovation performance: are small firms different?
24
Table 3: Knowledge production function: the role of breadth and type of external innovation linkages
Breadth of linkages (1) (2) Dep. var.: Sales from new or improved products (%)
Model 1, Small plants
Model 1, Medium and large plants
R&D conducted in-house 32.843
*** 21.513
***
(1.009) (1.134) Number of linkages 11.808
*** 4.488
***
(0.733) (0.655) Number of linkages squared -1.309
*** -0.232
**
(0.148) (0.108) Supply chain linkages (dummy) University/lab linkages (dummy) Other linkages (dummy) Employment (no.) 0.406
** 0.010
***
(0.182) (0.003) Employment (no.) squared -0.009
*** -0.000
*
(0.003) (0.000) Plant age (years) -0.102
*** -0.115
***
(0.018) (0.017) Foreign owned plant 5.892
*** 5.259
***
(1.324) (1.127) Export dummy 6.732
*** 1.929
(0.991) (1.267) Workforce with degree (%) 0.284
*** 0.138
***
(0.036) (0.044) Govt. support for product innov. 7.717
*** 5.142
***
(1.178) (1.131) Herfindahl index 8.861 20.734
**
(6.504) (8.401) Constant -22.794
*** -11.360
***
(3.400) (3.297) Industry dummies Yes Yes Period dummies Yes Yes
Observations 1674 1348 Log-likelihood -3.57e+04 -2.46e+04
Source: Irish Innovation Panel, waves 2-6 of the survey are included. Standard
errors in parentheses. * p < 0.10,
** p < 0.05,
*** p < 0.01. Random effects tobit
models. Dummy variable ‘Other linkages’ includes linkages to competitors, joint
ventures and consultants. Observations are weighted in regression analysis to
give representative results.

Openness and innovation performance: are small firms different?
25
Table 4: McDonald and Moffitt (1980) decomposition of the
effects of breadth of linkages in tobit model in Table 3
Marginal effects at sample means on innovation
performance
Marginal effects on the expected
value of innovation performance
conditional on having innovation
output
Marginal effects on the
probability of having
innovation output
Small plants:
Number of linkages 3.564*** 0.082***
Number of linkages
squared
-0.403*** -0.009***
Medium and Large plants:
Number of linkages 1.806*** 0.029***
Number of linkages
squared
-0.086** -0.001**
Source: Irish Innovation Panel, waves 2-6 of the survey are included. * p < 0.10,
**
p < 0.05, ***
p < 0.01. Marginal effects are calculated based on model in Equation
1, as estimated with tobit model in Columns 1 and 2 of Table 3.

Openness and innovation performance: are small firms different?
26
Figure 1: Average number of knowledge linkages
Notes: Observations are weighted to give representative results. Small plants are
defined as plants with less than 50 employees.
Source: IIP
Openness and innovation performance: are small firms different?
27
Figure 2: Relationship between breadth of openness and
innovation performance
Source: regression results in Column 1 of Table 3.
05
10
15
20
25
Sh
are
(%
) o
f in
no
va
tive
sa
les
0 1 2 3 4 5 6 7 8Breadth of linkages (0-8)
Small Medium and large

Openness and innovation performance: are small firms different?
28
Figure 3: Level of innovation performance reached on average
for different levels of breadth of openness: accounting for
different initial levels of innovation output.
Source: regression results in Column 1 of Table 3. (Starting point for small plants:
-0.56, for larger plants 11.22)
01
02
03
0
Sh
are
(%
) o
f in
no
va
tive
sa
les
0 1 2 3 4 5 6 7 8Breadth of linkages (0-8)
Small Medium and large

Openness and innovation performance: are small firms different?
29
References
Acs, Z. and Audretsch, D. (1987). Innovation, market structure and firm
size. Review of Economics and Statistics, 71: 567–574.
Acs, Z.J. and Audretsch, D. (1990). Innovation and Small Firms.MIT Press,
Cambridge, MA.
Audretsch, D. B., Menkveld, A. J. and Thurik, A. R. (1996) ‘The Decision
Between Internal and External R&D’, Journal of Institutional and
Theoretical Economics, 152, 517–30.
Bakhshi, H., Edwards, J., Roper, S., Scully, J. & Shaw, D. (2011). Bridging
the divide: Using innovation vouchers to link SMEs and creative service
providers – first results from a UK mixed-methods evaluation. In: EUNIP
(ed.) Evaluating innovation policy, methods and applications. Florence.
Baumol, W. J. 2002. The free market innovation machine, Princeton
Princeton University Press.
Bougrain, F. and Haudeville, B. (2002) Innovation, collaboration and SMEs
internal research capacities, Research Policy. 31, pp. 735–747.
Brunswicker, S. and Vanhaverbeke, W. (2011). Beyond Open Innovation in
Large Enterprises: How Do Small and Medium-Sized Enterprises (SMEs)
Open Up to External Innovation Sources? Available at SSRN:
http://ssrn.com/abstract=1925185
Cantner, U., Meder, A. & Wolf, T. (2011). Success and failure of firms'
innovation co-operations: The role of intermediaries and reciprocity. Papers
in Regional Science, 90, 312-.
Chesbrough, H.W. (2003) Open Innovation: The New Imperative for
Creating and Profiting from Technology. Cambridge, MA: Harvard Business
School Publishing.

Openness and innovation performance: are small firms different?
30
Chesbrough, H.W. (2010). Open Innovation: A Key to Achieving
Socioeconomic Evolution. How Smaller Companies Can Benefit from Open
Innovation. Japan Economic Foundation, mimeo.
Cohen, W.M. and Levinthal, D.A. (1989). Innovation and learning: the two
faces of R&D. The Economic Journal, 99, 569–596.
Crépon, B., Duguet, E., and J. Mairesse (1998). Research, Innovation and
Productivity: An econometric analysis at the firm level. Economics of
Inovation and New Technology, 7, 115–158.
Dahlander L. and Gann D. M. (2010). How open is innovation? Research
Policy 39, 699–709.
Dodgson, M., Gann, D. and Salter, A. (2006). The role of technology in the
shift towards open innovation: the case of Procter & Gamble. R&D
Management, 36, 333–346.
Dunning, J.H. (1988), The Eclectic Paradigm of International Production: A
Restatement and Some Possible Extensions. Journal of International
Business Studies, 19, 1–31.
Faems, D., de Visser, M., Andries, P. & Van Looy, B. 2010. Technology
Alliance Portfolios and Financial Performance: Value-Enhancing and Cost-
Increasing Effects of Open Innovation. Journal of Product Innovation
Management, 27, 785–796.
Freel, M S. (2005). Patterns of innovation and skills in small firms.
Technovation 25,123–134.
Griliches, Z. (1995). R&D and Productivity: Econometric Results and
Measurement Issues. Edited by P. Stoneman, Handbook of the Economics
of Innovation and Technological Change. Oxford: Blackwell.

Openness and innovation performance: are small firms different?
31
Helfat C.E. and Eisenhardt K. M. (2004). Inter-temporal economies of
scope, organizational modularity, and the dynamics of diversification,
Strategic management Journal, 25, 1217–1232.
Hewitt-Dundas, N., and S. Roper. (2009). Output Additionality of Public
Support for Innovation: Evidence for Irish Manufacturing Plants. European
Planning Studies 18, 107122.
Hewitt-Dundas, N, and S. Roper. (2008). Ireland’s Innovation
Performance: 1991-2005. Quarterly Economic Commentary, ESRI, Dublin.
(Summer 2008):46-68
Hipp, C. (2000). Information flows and knowledge creation in knowledge-
intensive business services: scheme for a conceptualization. In: J.S.
Metcalfe & I. Miles, (Eds) Innovation Systems in the Service Economy.
Measurement and Case Study Analysis, pp. 149–167 (Boston: Kluwer
Academic Publishers).
Jeon, J., Lee, C. & Park, Y. 2011. How to Use Patent Information to Search
Potential Technology Partners in Open Innovation. Journal of Intellectual
Property Rights, 16, 385–393.
Klette, T. J, and F Johansen. (1998). Accumulation of R&D Capital and
Dynamic Firm Performance: a not-so-Fixed Effect Model. Annales de
Economie et de Statistique 49-50, 389–419.
Koput KW. (1997). A chaotic model of innovative search: some answers,
many questions. Organization Science, 8, 528–542.
Laursen, K, and A Salter (2006). Open for Innovation: The role of openness
in explaining innovation performance among UK manufacturing firms.
Strategic Management Journal 27, 131–150.
Leiponen A. and Helfat C. E. (2010). Innovation objectives, knowledge
sources, and the benefits of breadth. Strategic Management Journal, 31,
224–236.

Openness and innovation performance: are small firms different?
32
Lichtenthaler, U. (2008). Open innovation in practice: an analysis of
strategic approaches to technology transactions. IEEE Transactions on
Engineering Management, 55 1 , 148–157.
Lindell, M.K., and Whitney, D.J. (2001). Accounting for Common Method
Variance in Cross-sectional Research Designs, Journal of Applied
Psychology, 86, 114–121.
Lipsey, R. E. (2002). Home and Host Country Effects of FDI. NBER
Working Papers 9293, National Bureau of Economic Research, Inc.
Love, J. H., and S. Roper (2001). Networking and Innovation Success:
evidence for UK, German and Irish manufacturing plants. Research Policy,
30, 643–661.
Love J. H., Roper S. and Vahter P. (2011). Learning from Open Innovation.
CSME Working Paper No. 112, Warwick Business School.
Love J. H., Roper S. and Hewitt-Dundas N. (2010). Service Innovation,
Embeddedness and Business Performance: Evidence from Northern
Ireland. Regional Studies, 44, 983–1004.
McDonald, J. F. and Moffitt R. A. (1980) The Uses of Tobit Analysis.
Review of Economics and Statistics, 62, 318–321.
Malhotra, N.K., Kim, S.S., and Patil, A. (2006). Common method variance
in IS research: A comparison of alternative approaches and a reanalysis of
past research. Management Science, 52, 1865–1883.
Oerlemans, L., M. Meeus, and F. Boekema (1998). Do networks matter for
innovation? The usefulness of the economic network approach in analysing
innovation. Tijdschrift voor Economische en Sociale Gcografie 89, 298–
309.
Podsakoff, P. M., and D. W. Organ. 1986. Self-reports in organizational
research: Problems and prospects. Journal of Management, 12, 531–544.

Openness and innovation performance: are small firms different?
33
Podsakoff P.M., MacKenzie, S.B., Lee, J.Y. and Podsakoff, N.P. 2003.
Common Method Biases in Behavioral Research: A Critical Review of the
Literature and Recommended Remedies. Journal of Applied Psychology,
88, 879–903.
Powell, W.W. (1998). Learning from collaboration: knowledge and networks
in the biotechnology and pharmaceutical industries, California Management
Review, 40, 228–240.
Roper, S. and N. Hewitt-Dundas (1998). Innovation, Networks and the
Diffusion of Manufacturing Best Practice: A Comparison of Northern Ireland
and the Republic of Ireland. Belfast: NIERC.
Roper S., Du J. and Love J. H. (2007). The Limits of Open Innovation:
Openness and (quasi-) markets in the organization of innovation, Research
Paper 0713, Aston Business School. Birmingham.
Sharma, R., Yetton, P. and Crawford, J. (2010) A critique of the marker
variable technique: the effect of alternative marker variable criteria, 18th
European Conference on Information Systems.
Sieg, J.H., M.W. Wallin and G. von Krogh (2010). Managerial challenges in
open innovation: a study of innovation intermediation in the chemical
industry. R&D Management, 40, 281–291. |
Su,Y. F.Wu, and W. Vanhaverbeke (2010). How Small Firms Can Benefit
From Open Innovation ? - Evidence From Taiwanese Biotechnology
Firms. DRUID 2010 paper.
van de Vrande, V, J.P.J. de Jong, W. Vanhaverbeke and M. de Rochemont
(2009). Open innovation in SMEs: trends, motives and management
challenges. Technovation, 29 (6-7), 423–437.
von Hippel, E. (1988). The Sources of Innovation. Oxford University Press,
New York.

Openness and innovation performance: are small firms different?
34
Vossen, R. W. 1998. Relative Strengths and Weaknesses of Small Firms in
Innovation. International Small Business Journal, 16, 88–95.
1

Openness and innovation performance: are small firms different?
35
Centre Manager Enterprise Research Centre
Aston Business School Birmingham, B1 7ET
Centre Manager Enterprise Research Centre
Warwick Business School Coventry, CV4 7AL
The Enterprise Research Centre is an independent research centre funded by the Economic and Social Research Council (ESRC); the Department for Business,
Innovation & Skills (BIS); the Technology Strategy Board (TSB); and, through the British Bankers Association (BBA), by the Royal Bank of Scotland PLC; Bank of Scotland PLC;
HSBC Bank PLC; Barclays Bank PLC and Lloyds TSB Bank PLC.