Embed Size (px)
Citation preview
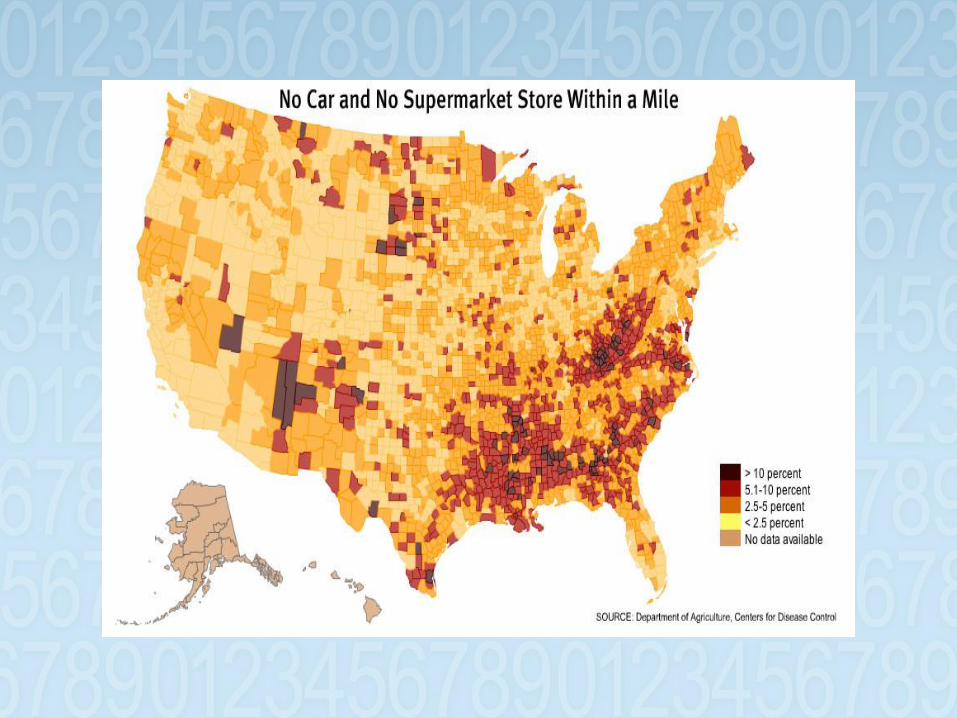
Disruptive Demographics and North Carolina’s
Education Challenges
May 2015
James H. Johnson, Jr.
Frank Hawkins Kenan Institute of Private Enterprise Kenan-Flagler Business School
University of North Carolina at Chapel Hill
OVERVIEW
•Demographic Trends
•Challenges & Opportunities
•Discussion
what
May 2015
CENSUS 2010 will REVEAL
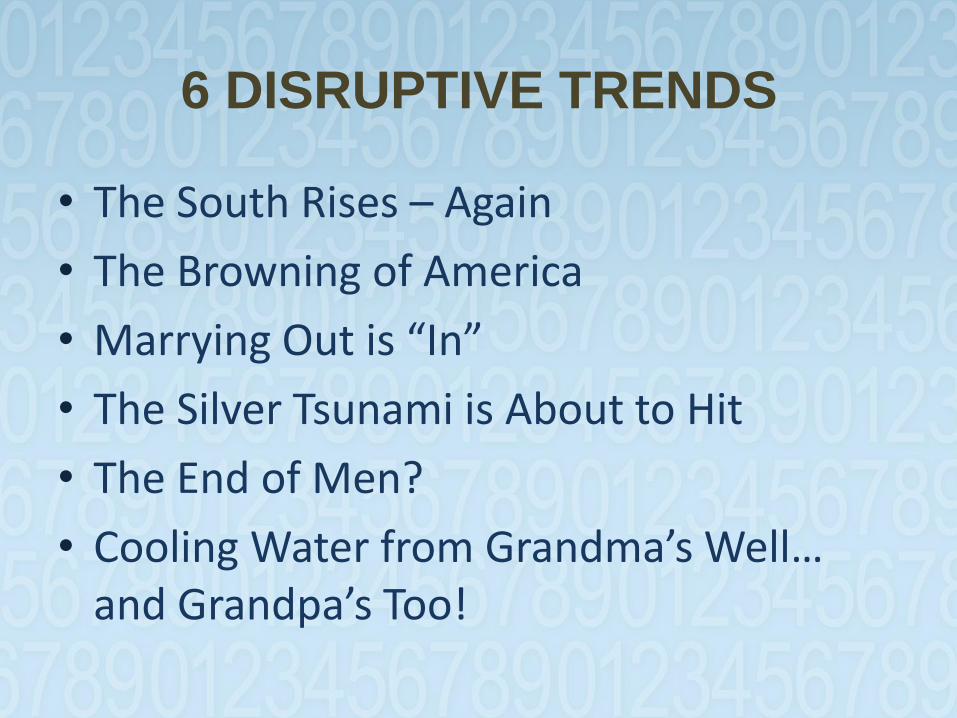
6 DISRUPTIVE TRENDS
• The South Rises – Again
• The Browning of America
• Marrying Out is “In”
• The Silver Tsunami is About to Hit
• The End of Men?
• Cooling Water from Grandma’s Well… and Grandpa’s Too!
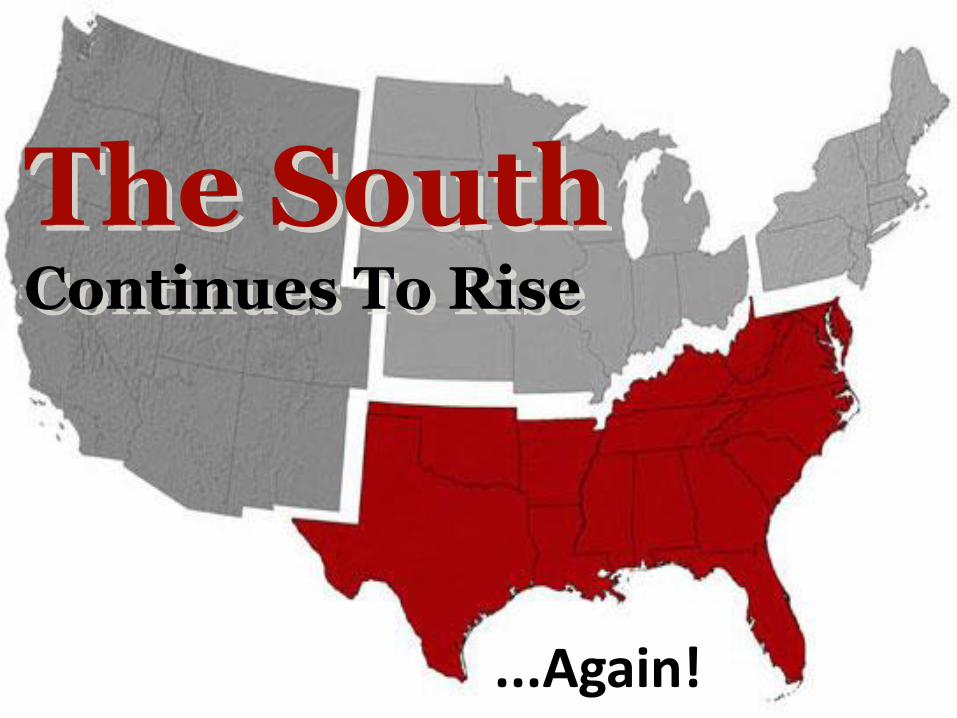
The South Continues To Rise
...Again!
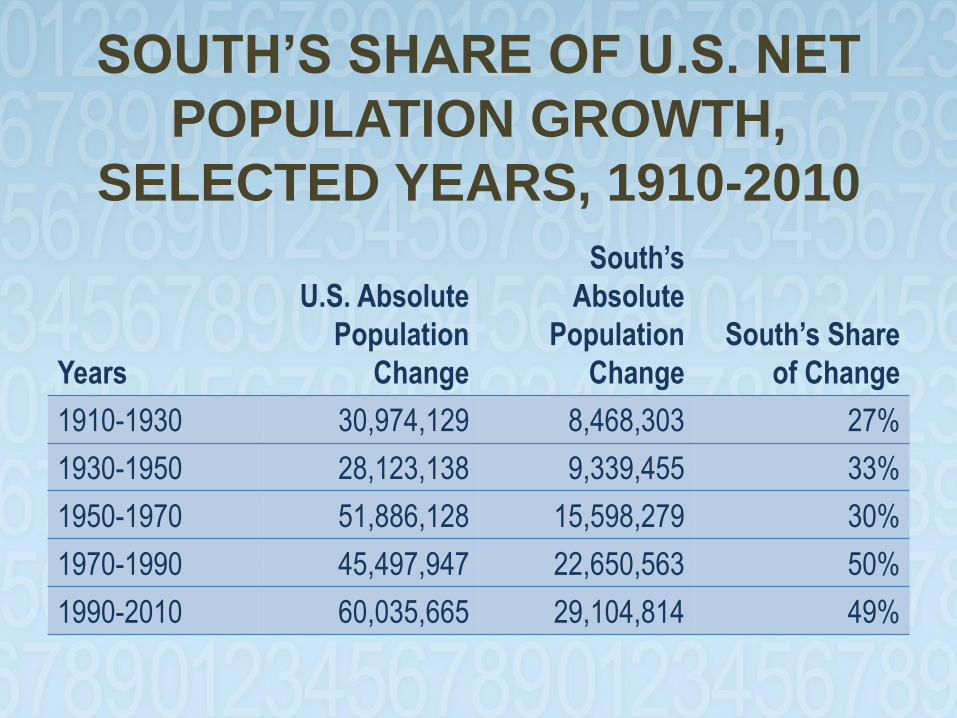
SOUTH’S SHARE OF U.S. NET
POPULATION GROWTH,
SELECTED YEARS, 1910-2010
Years
U.S. Absolute
Population
Change
South’s
Absolute
Population
Change
South’s Share
of Change
1910-1930 30,974,129 8,468,303 27%
1930-1950 28,123,138 9,339,455 33%
1950-1970 51,886,128 15,598,279 30%
1970-1990 45,497,947 22,650,563 50%
1990-2010 60,035,665 29,104,814 49%
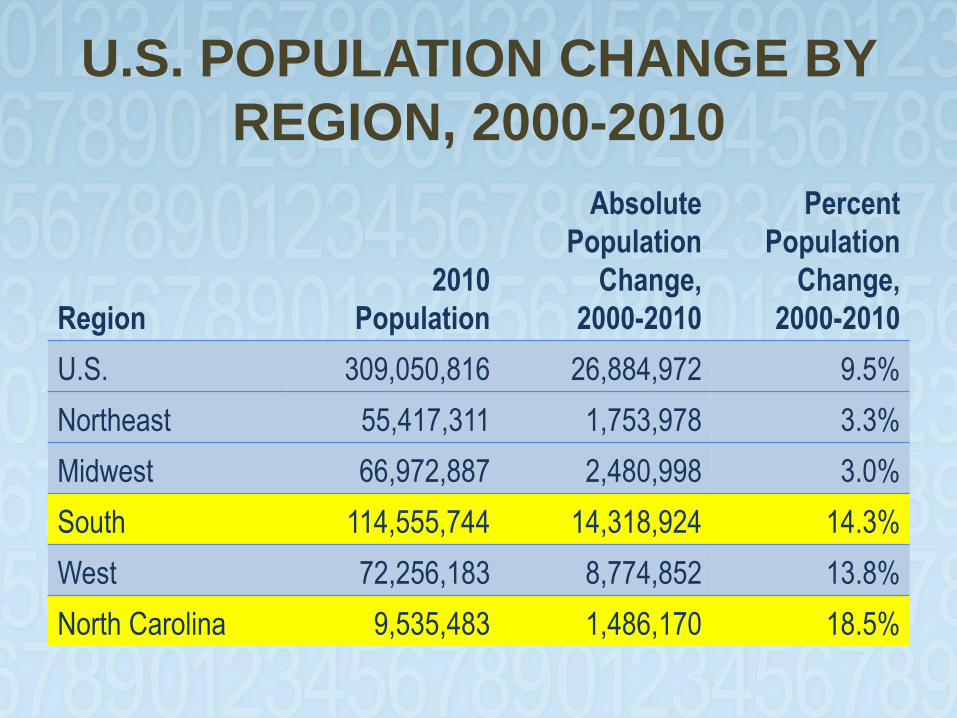
U.S. POPULATION CHANGE BY
REGION, 2000-2010
Region
2010
Population
Absolute
Population
Change,
2000-2010
Percent
Population
Change,
2000-2010
U.S. 309,050,816 26,884,972 9.5%
Northeast 55,417,311 1,753,978 3.3%
Midwest 66,972,887 2,480,998 3.0%
South 114,555,744 14,318,924 14.3%
West 72,256,183 8,774,852 13.8%
North Carolina 9,535,483 1,486,170 18.5%
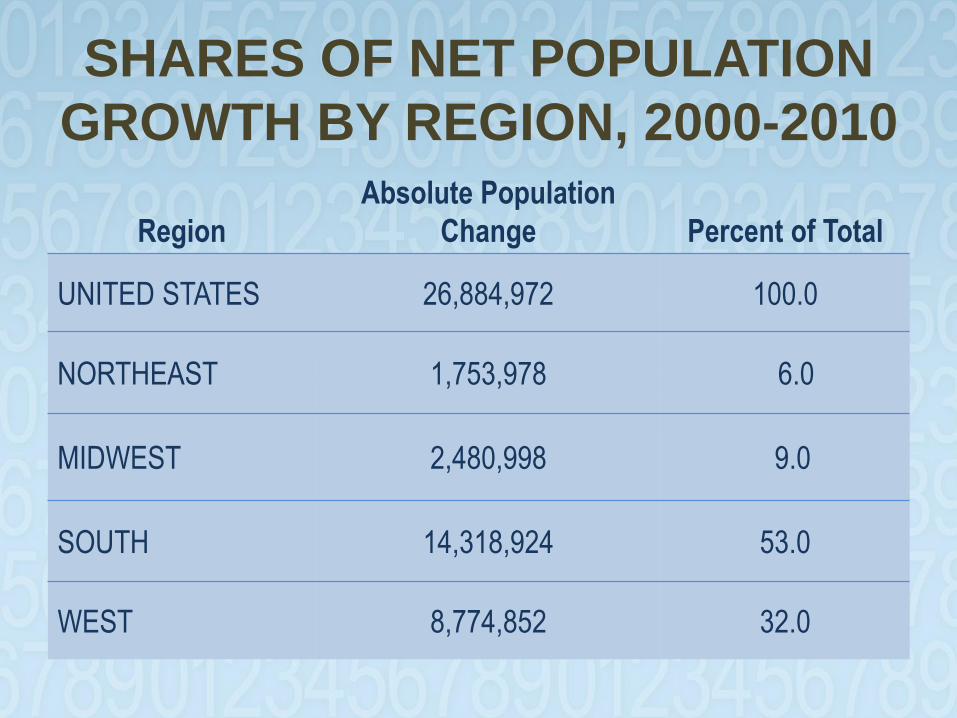
SHARES OF NET POPULATION
GROWTH BY REGION, 2000-2010
Region
Absolute Population
Change Percent of Total
UNITED STATES 26,884,972 100.0
NORTHEAST 1,753,978 6.0
MIDWEST 2,480,998 9.0
SOUTH 14,318,924 53.0
WEST 8,774,852 32.0
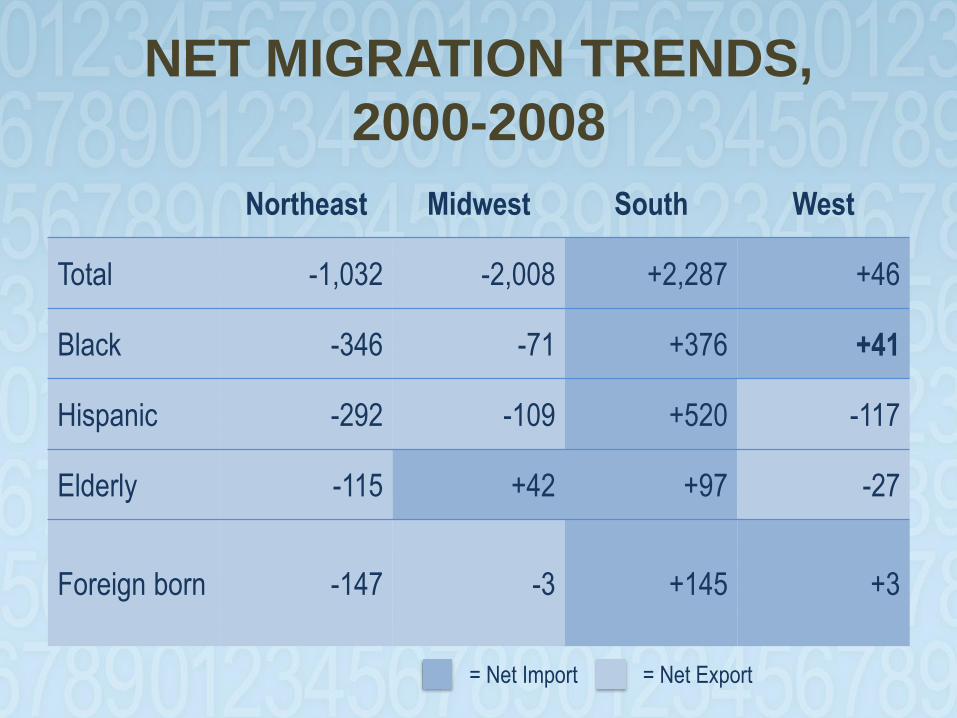
NET MIGRATION TRENDS,
2000-2008
Northeast Midwest South West
Total -1,032 -2,008 +2,287 +46
Black -346 -71 +376 +41
Hispanic -292 -109 +520 -117
Elderly -115 +42 +97 -27
Foreign born -147 -3 +145 +3
= Net Import = Net Export
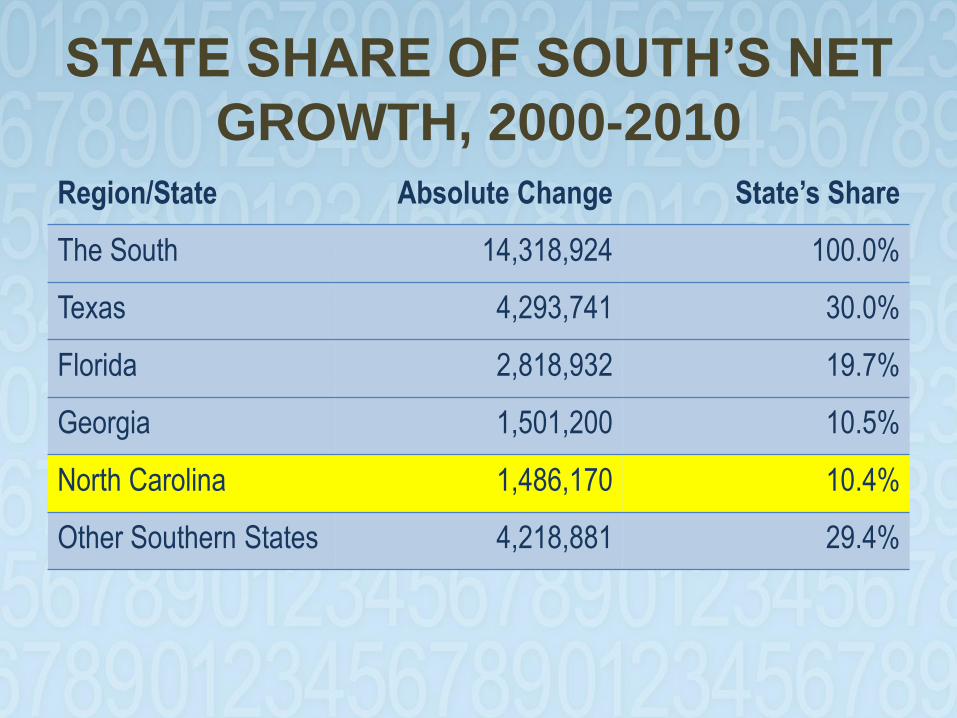
STATE SHARE OF SOUTH’S NET
GROWTH, 2000-2010
Region/State Absolute Change State’s Share
The South 14,318,924 100.0%
Texas 4,293,741 30.0%
Florida 2,818,932 19.7%
Georgia 1,501,200 10.5%
North Carolina 1,486,170 10.4%
Other Southern States 4,218,881 29.4%
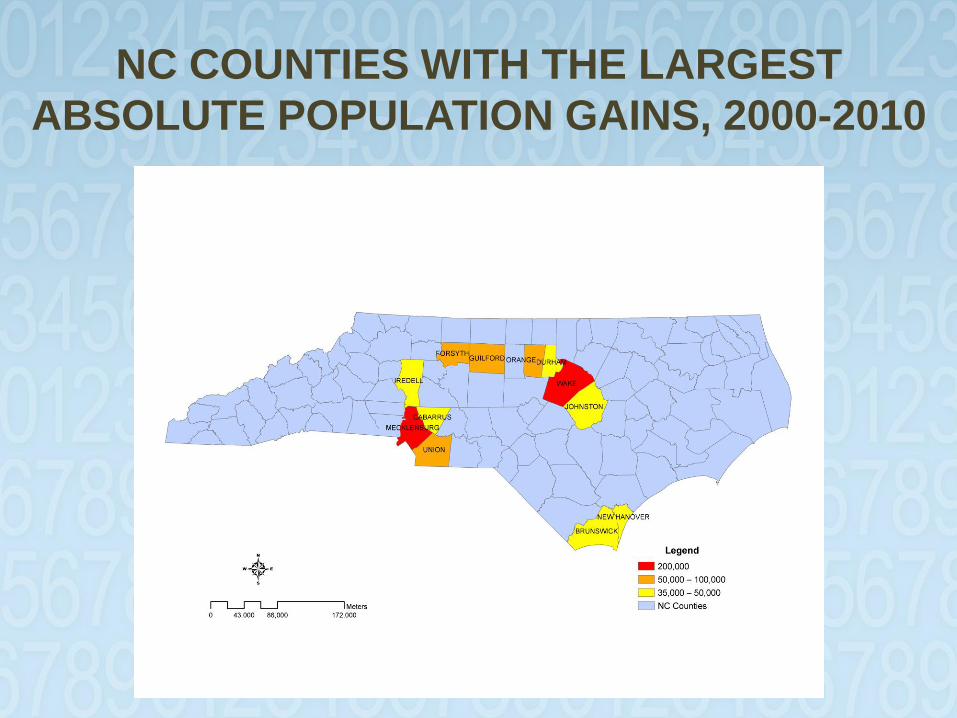
NC COUNTIES WITH THE LARGEST
ABSOLUTE POPULATION GAINS, 2000-2010
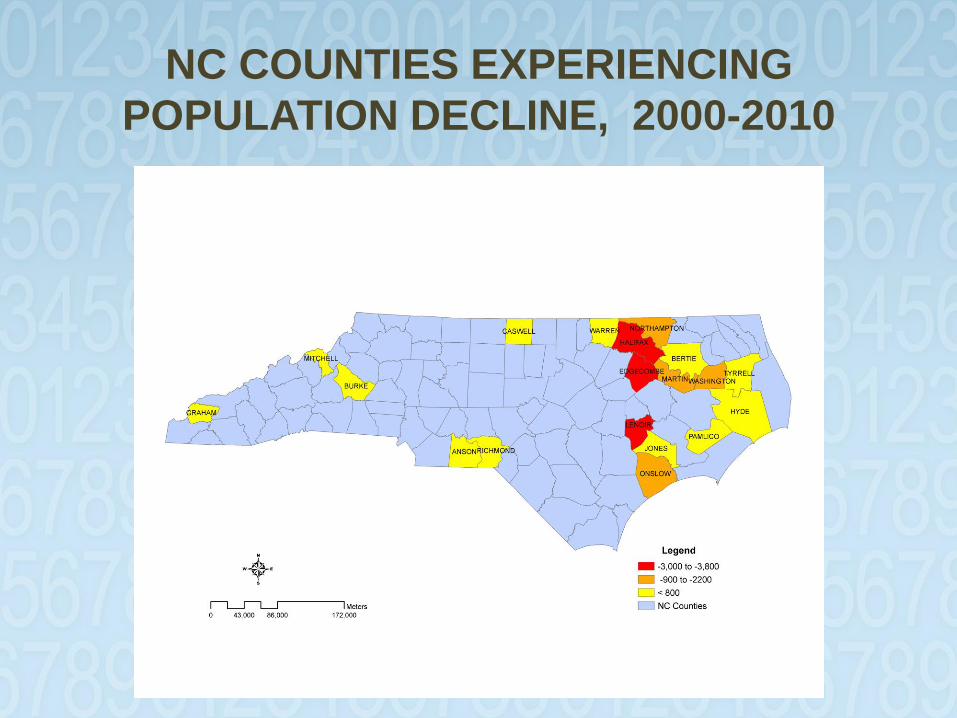
NC COUNTIES EXPERIENCING
POPULATION DECLINE, 2000-2010
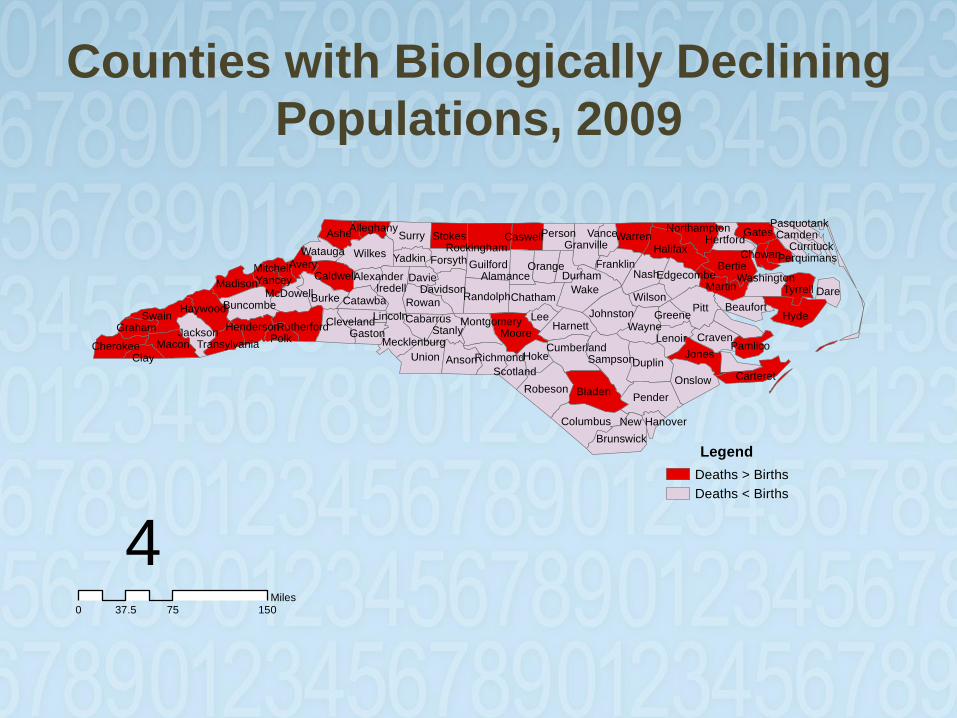
Counties with Biologically Declining
Populations, 2009
Legend
Deaths > Births
Deaths < Births
40 75 15037.5
Miles
Pitt
Wake
Bladen
Duplin
Hyde
BertieWilkes
Pender
Moore
Union
Nash
Robeson
Surry
Onslow
Columbus
Burke
Ashe
Anson
Guilford
Harnett
Brunswick
Chatham
Macon
Rowan
Stokes Gates
ForsythYadkinHalifax
Sampson
Iredell
Swain Johnston
Randolph
Wayne
Jones
Martin
Hoke
Lee
LenoirStanly
Craven
WarrenGranville
Tyrrell
Franklin
Buncombe
Davidson
Haywood
Person
Jackson
Dare
Carteret
Caswell
Beaufort
Caldwell
Cumberland
Wilson
Madison
Orange
RutherfordPolk Gaston
Cherokee
Rockingham
Davie
Catawba
Richmond
Hertford
McDowell
Cleveland
NorthamptonVance
Clay
Avery
Mecklenburg
Alamance
Lincoln
EdgecombeYancey
Montgomery
Pamlico
Cabarrus
Durham
GrahamGreene
Watauga
Scotland
Henderson
Washington
Transylvania
Mitchell
Camden
Alexander
Currituck
Alleghany
ChowanPerquimans
Pasquotank
New Hanover
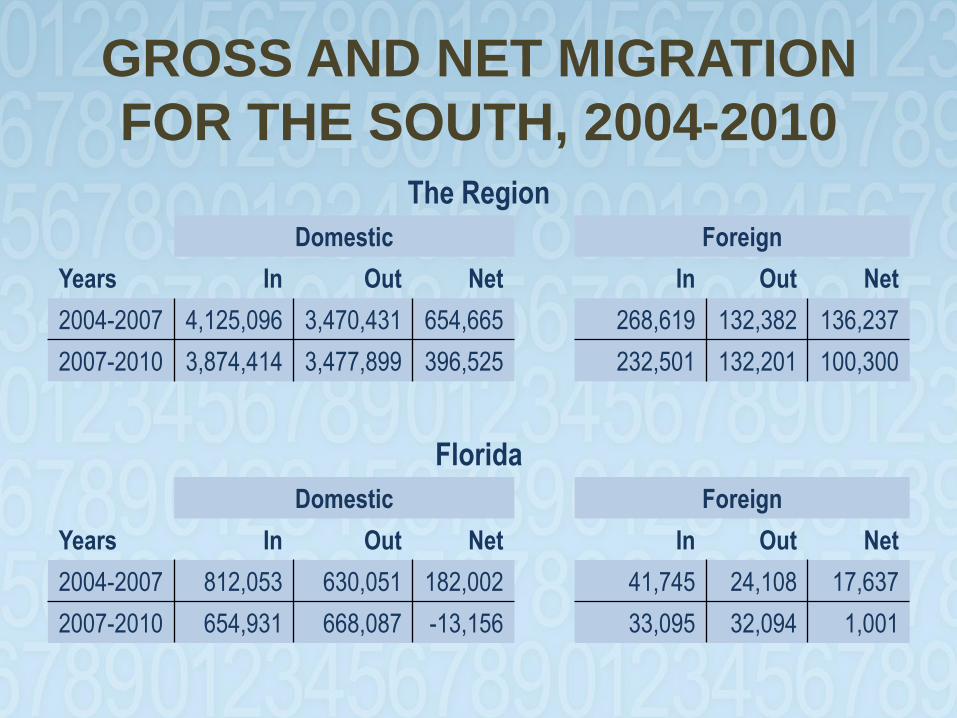
GROSS AND NET MIGRATION
FOR THE SOUTH, 2004-2010
The Region
Domestic Foreign
Years In Out Net In Out Net
2004-2007 4,125,096 3,470,431 654,665 268,619 132,382 136,237
2007-2010 3,874,414 3,477,899 396,525 232,501 132,201 100,300
Florida
Domestic Foreign
Years In Out Net In Out Net
2004-2007 812,053 630,051 182,002 41,745 24,108 17,637
2007-2010 654,931 668,087 -13,156 33,095 32,094 1,001
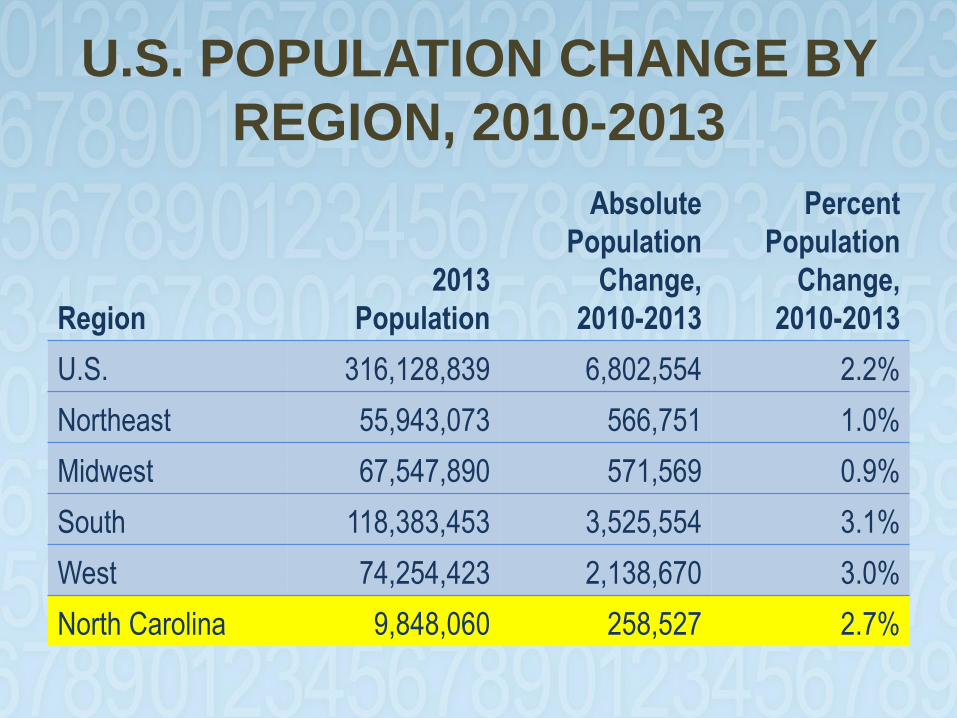
U.S. POPULATION CHANGE BY
REGION, 2010-2013
Region
2013
Population
Absolute
Population
Change,
2010-2013
Percent
Population
Change,
2010-2013
U.S. 316,128,839 6,802,554 2.2%
Northeast 55,943,073 566,751 1.0%
Midwest 67,547,890 571,569 0.9%
South 118,383,453 3,525,554 3.1%
West 74,254,423 2,138,670 3.0%
North Carolina 9,848,060 258,527 2.7%

SHARES OF NET POPULATION
GROWTH BY REGION, 2010-2013
Region
Absolute Population
Change Percent of Total
UNITED STATES 6,802,554 100.0
NORTHEAST 566,751 8.3
MIDWEST 571,569 8.4
SOUTH 3,525,554 51.8
WEST 2,138,670 31.4
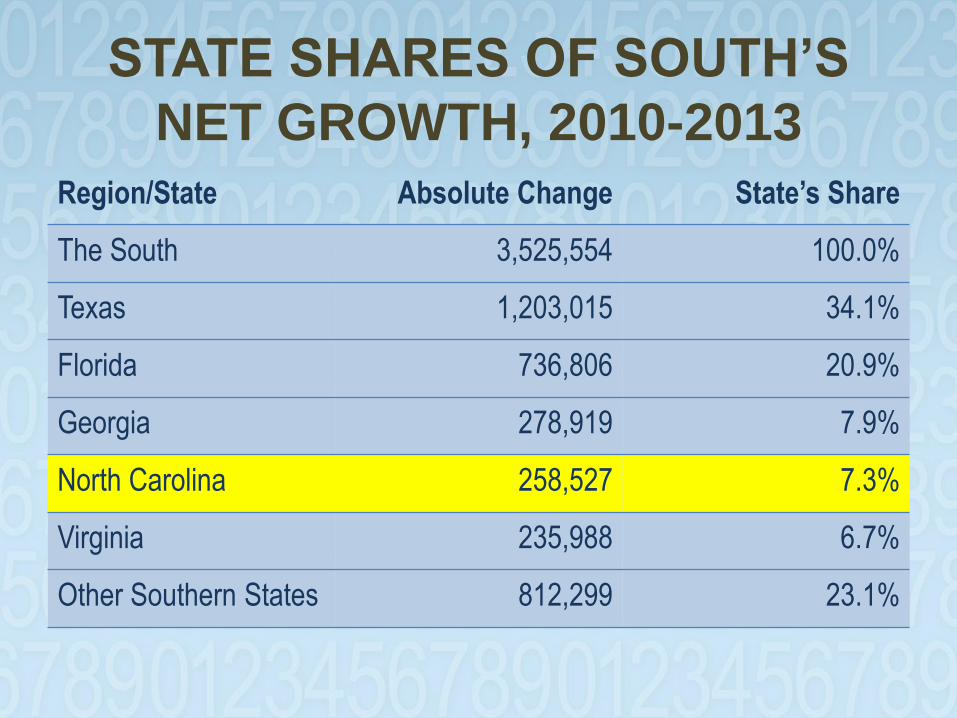
STATE SHARES OF SOUTH’S
NET GROWTH, 2010-2013
Region/State Absolute Change State’s Share
The South 3,525,554 100.0%
Texas 1,203,015 34.1%
Florida 736,806 20.9%
Georgia 278,919 7.9%
North Carolina 258,527 7.3%
Virginia 235,988 6.7%
Other Southern States 812,299 23.1%
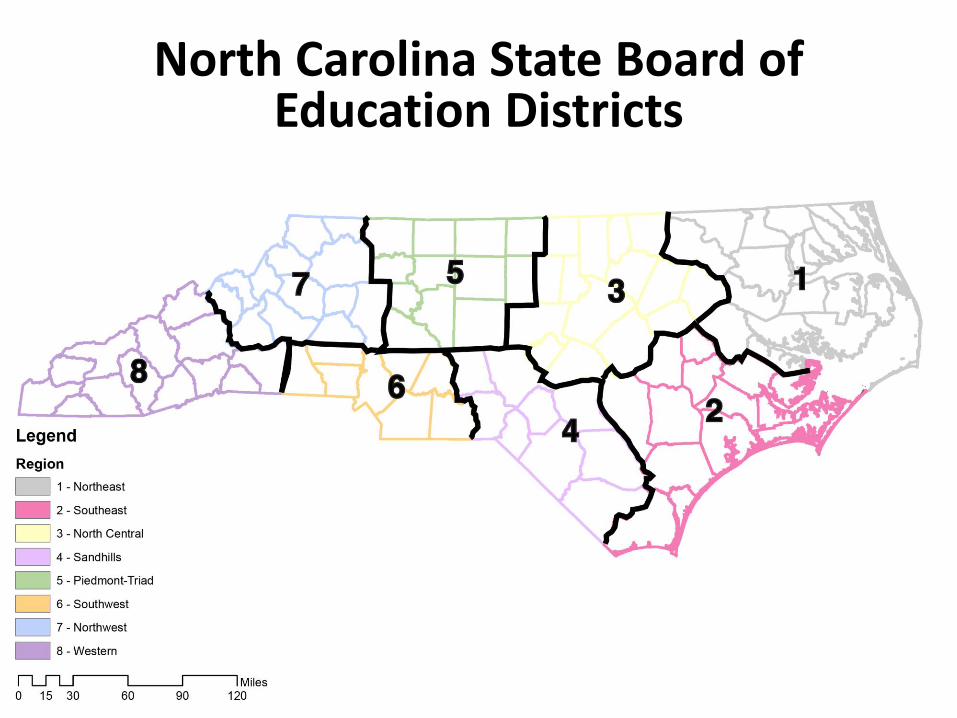
North Carolina State Board of Education Districts
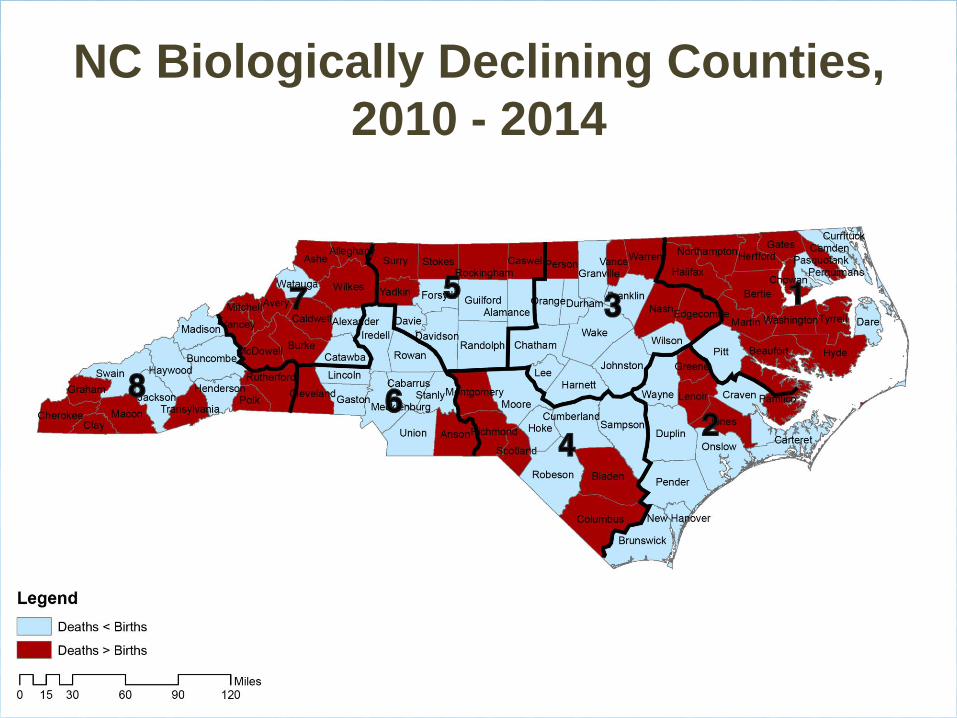
NC Biologically Declining Counties,
2010 - 2014
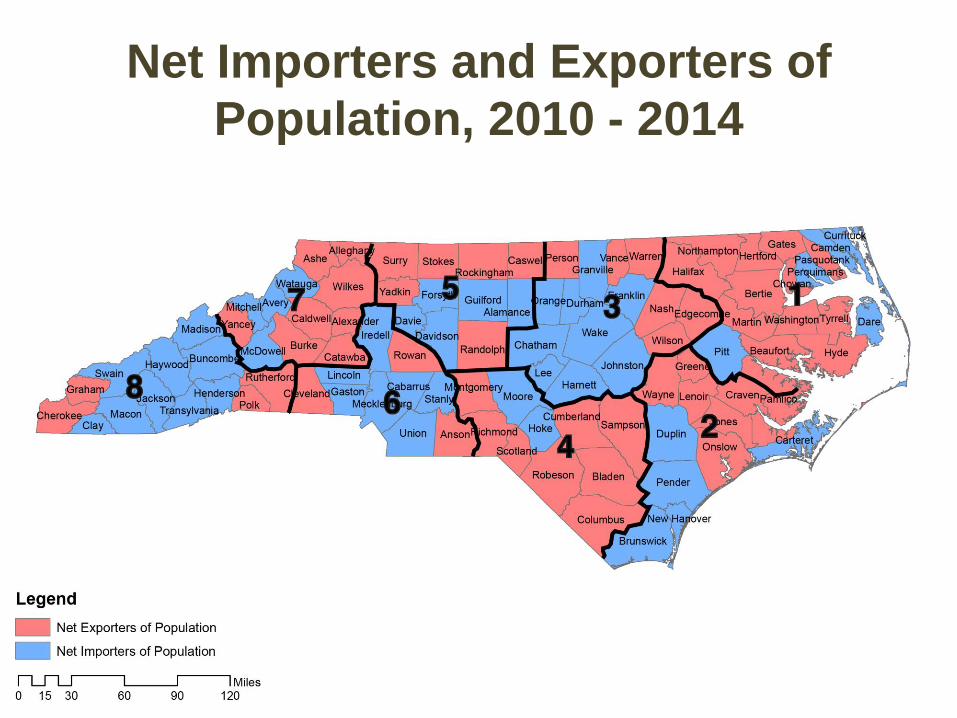
Net Importers and Exporters of
Population, 2010 - 2014
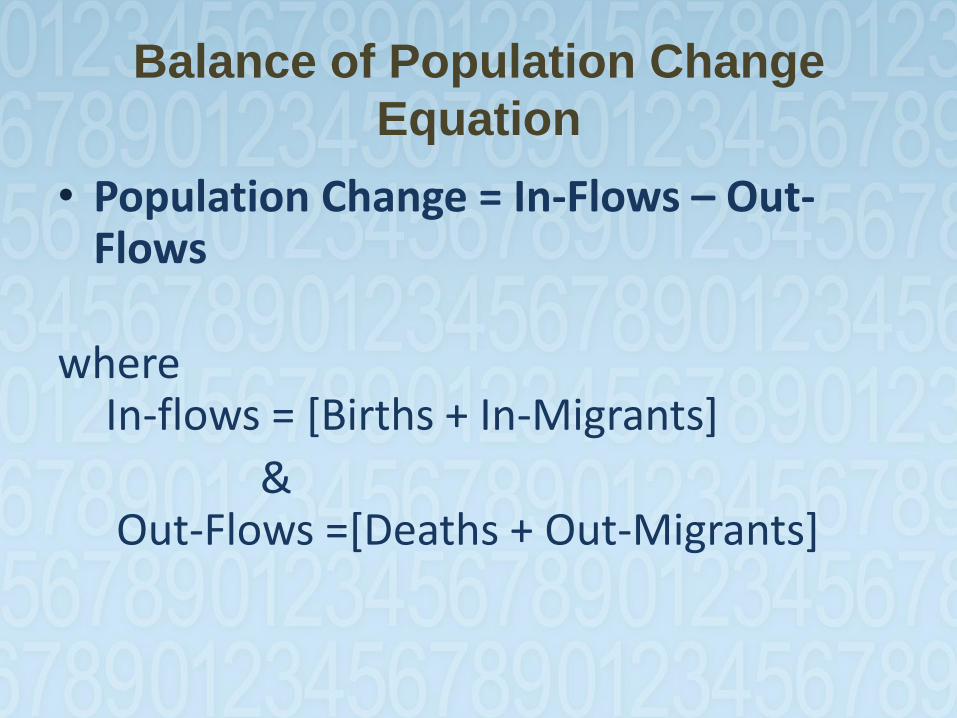
Balance of Population Change
Equation
• Population Change = In-Flows – Out-Flows
where In-flows = [Births + In-Migrants]
& Out-Flows =[Deaths + Out-Migrants]
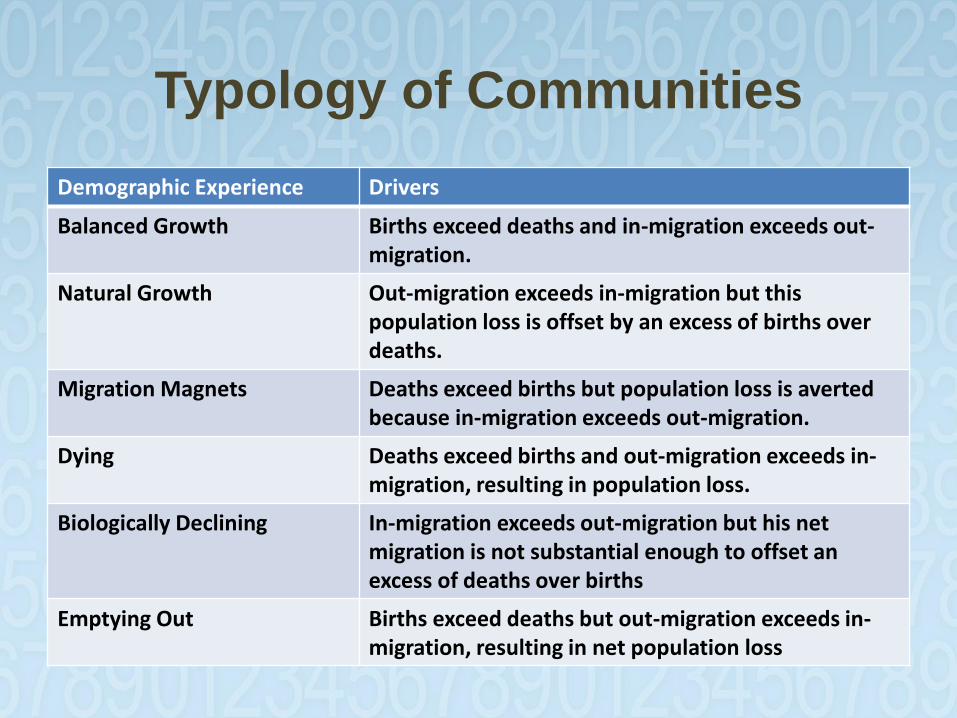
Typology of Communities
Demographic Experience Drivers
Balanced Growth Births exceed deaths and in-migration exceeds out-migration.
Natural Growth Out-migration exceeds in-migration but this population loss is offset by an excess of births over deaths.
Migration Magnets Deaths exceed births but population loss is averted because in-migration exceeds out-migration.
Dying Deaths exceed births and out-migration exceeds in-migration, resulting in population loss.
Biologically Declining In-migration exceeds out-migration but his net migration is not substantial enough to offset an excess of deaths over births
Emptying Out Births exceed deaths but out-migration exceeds in-migration, resulting in net population loss
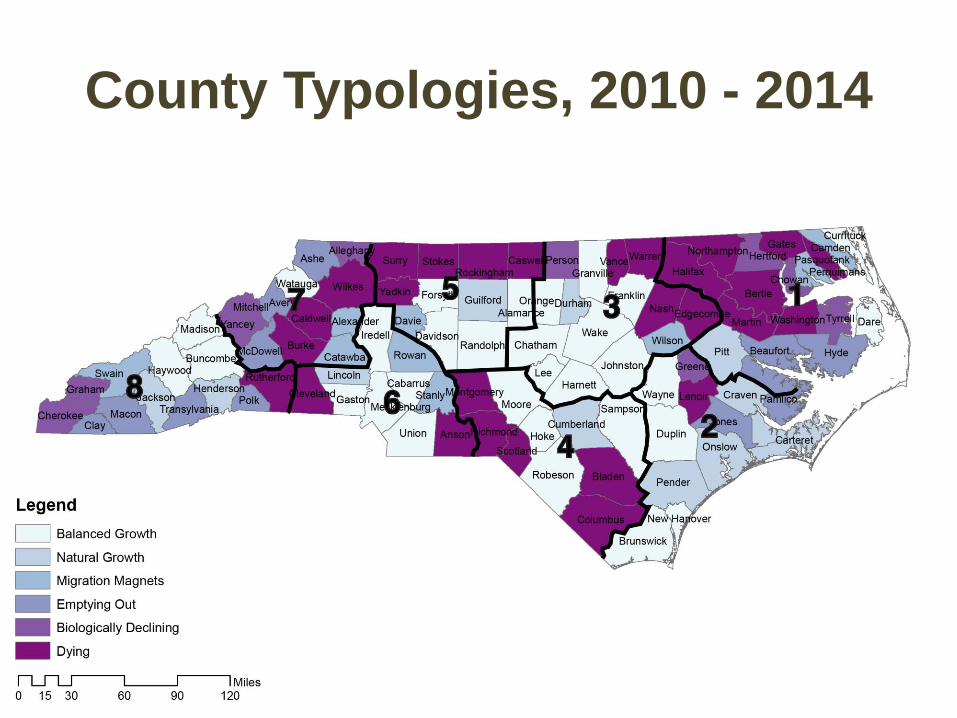
County Typologies, 2010 - 2014
THE “BROWNING”
OF AMERICA
May 2015 25
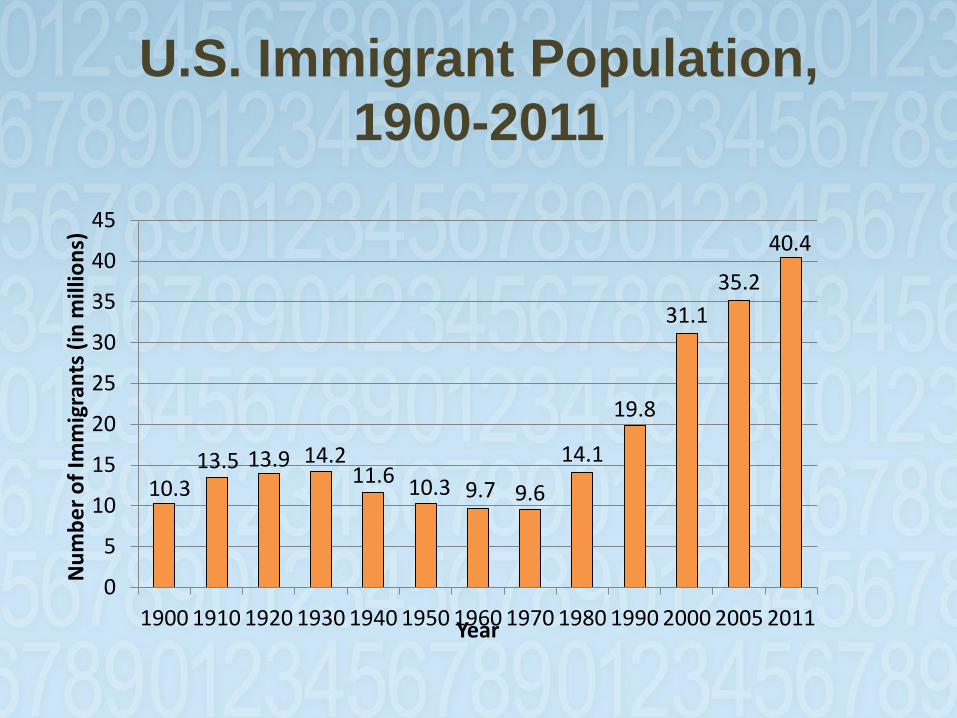
U.S. Immigrant Population,
1900-2011
10.3 13.5 13.9 14.2
11.6 10.3 9.7 9.6
14.1
19.8
31.1
35.2
40.4
0
5
10
15
20
25
30
35
40
45
1900 1910 1920 1930 1940 1950 1960 1970 1980 1990 2000 2005 2011
Nu
mb
er
of
Imm
igra
nts
(in
mill
ion
s)
Year
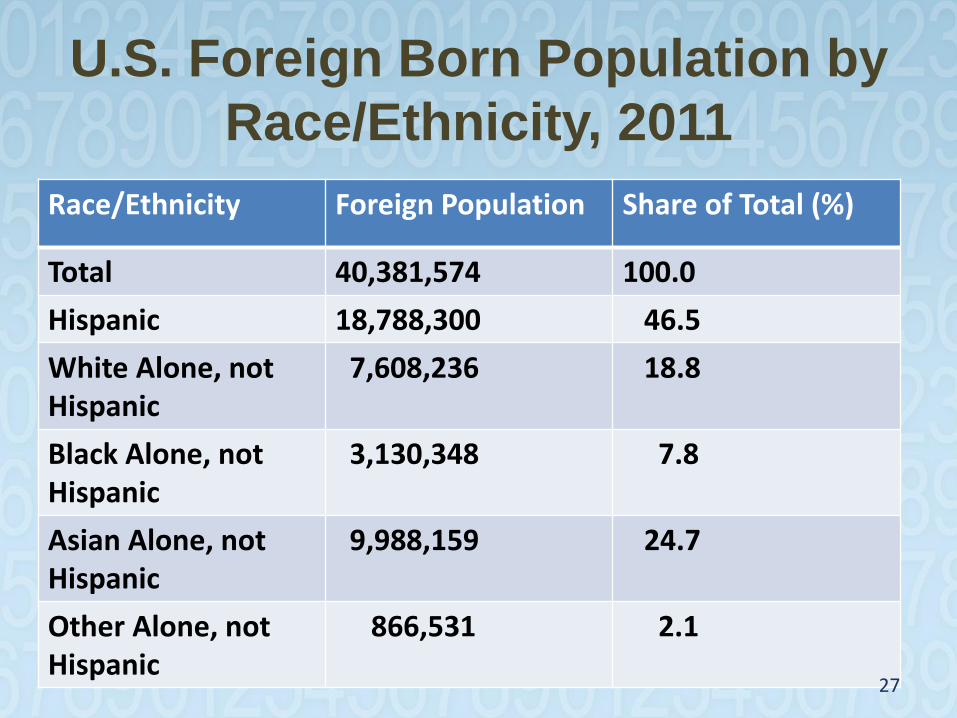
U.S. Foreign Born Population by
Race/Ethnicity, 2011
Race/Ethnicity Foreign Population Share of Total (%)
Total 40,381,574 100.0
Hispanic 18,788,300 46.5
White Alone, not Hispanic
7,608,236 18.8
Black Alone, not Hispanic
3,130,348 7.8
Asian Alone, not Hispanic
9,988,159 24.7
Other Alone, not Hispanic
866,531 2.1
27
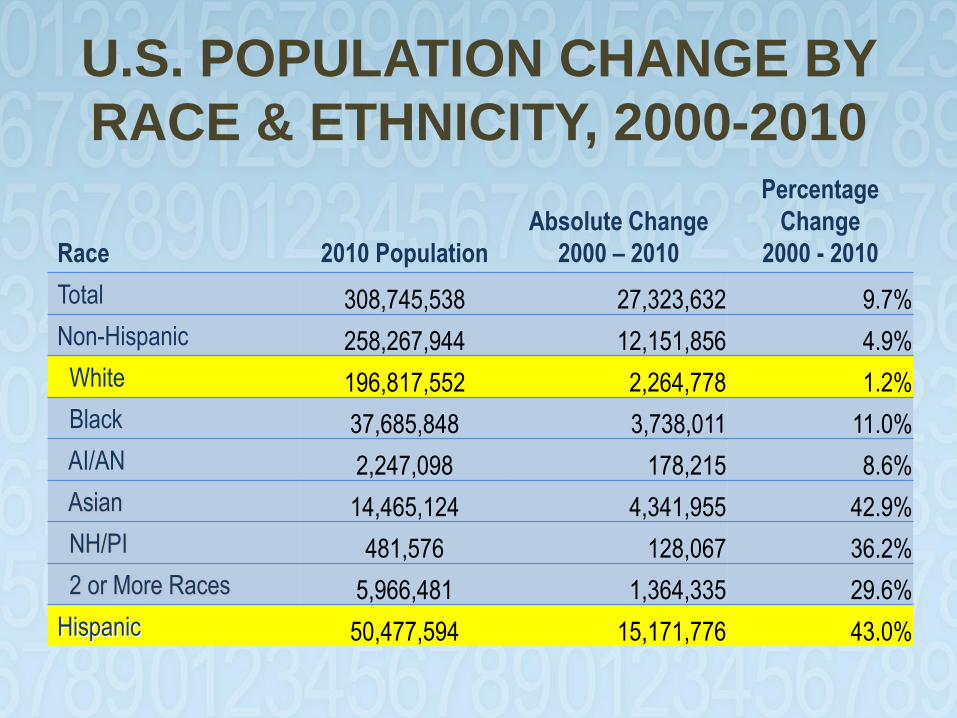
U.S. POPULATION CHANGE BY
RACE & ETHNICITY, 2000-2010
Race 2010 Population
Absolute Change
2000 – 2010
Percentage
Change
2000 - 2010
Total 308,745,538 27,323,632 9.7%
Non-Hispanic 258,267,944 12,151,856 4.9%
White 196,817,552 2,264,778 1.2%
Black 37,685,848 3,738,011 11.0%
AI/AN 2,247,098 178,215 8.6%
Asian 14,465,124 4,341,955 42.9%
NH/PI 481,576 128,067 36.2%
2 or More Races 5,966,481 1,364,335 29.6%
Hispanic 50,477,594 15,171,776 43.0%
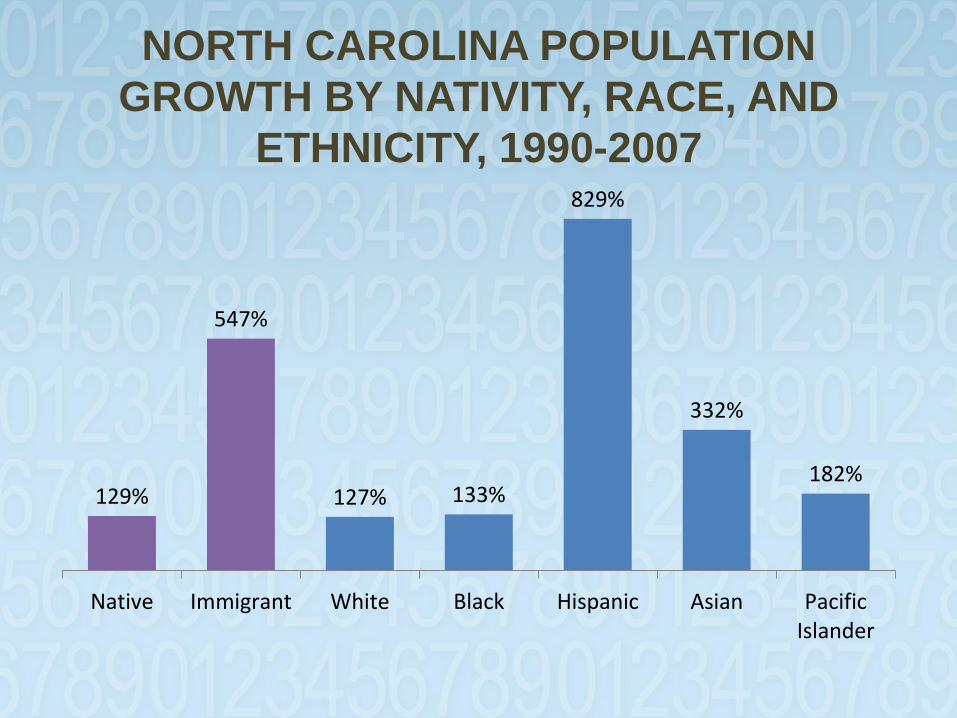
NORTH CAROLINA POPULATION
GROWTH BY NATIVITY, RACE, AND
ETHNICITY, 1990-2007
129%
547%
127% 133%
829%
332%
182%
Native Immigrant White Black Hispanic Asian PacificIslander
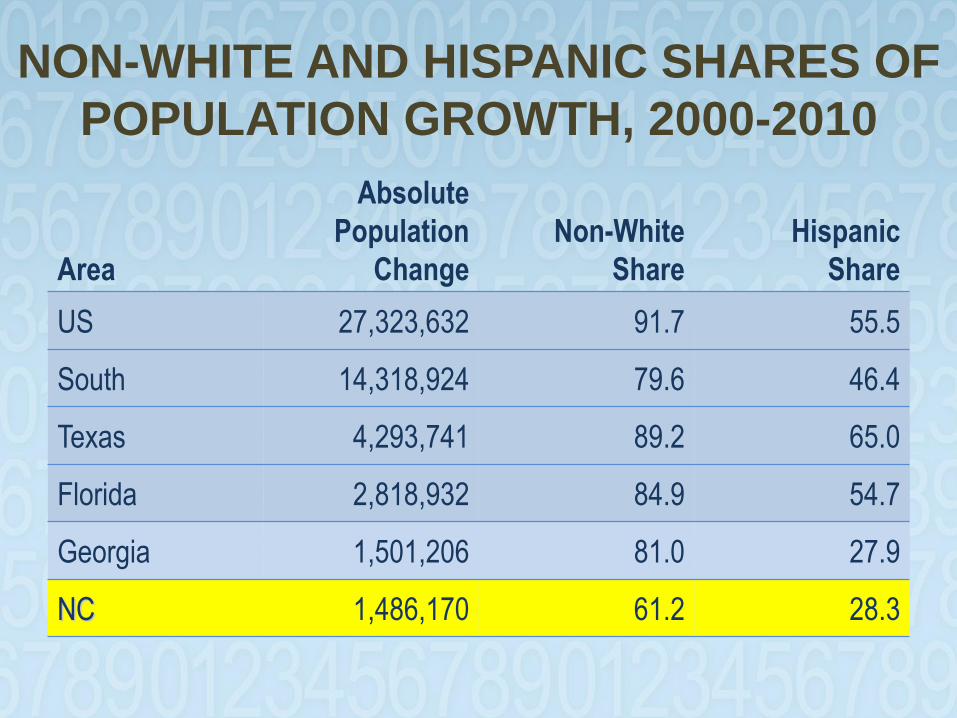
NON-WHITE AND HISPANIC SHARES OF
POPULATION GROWTH, 2000-2010
Area
Absolute
Population
Change
Non-White
Share
Hispanic
Share
US 27,323,632 91.7 55.5
South 14,318,924 79.6 46.4
Texas 4,293,741 89.2 65.0
Florida 2,818,932 84.9 54.7
Georgia 1,501,206 81.0 27.9
NC 1,486,170 61.2 28.3
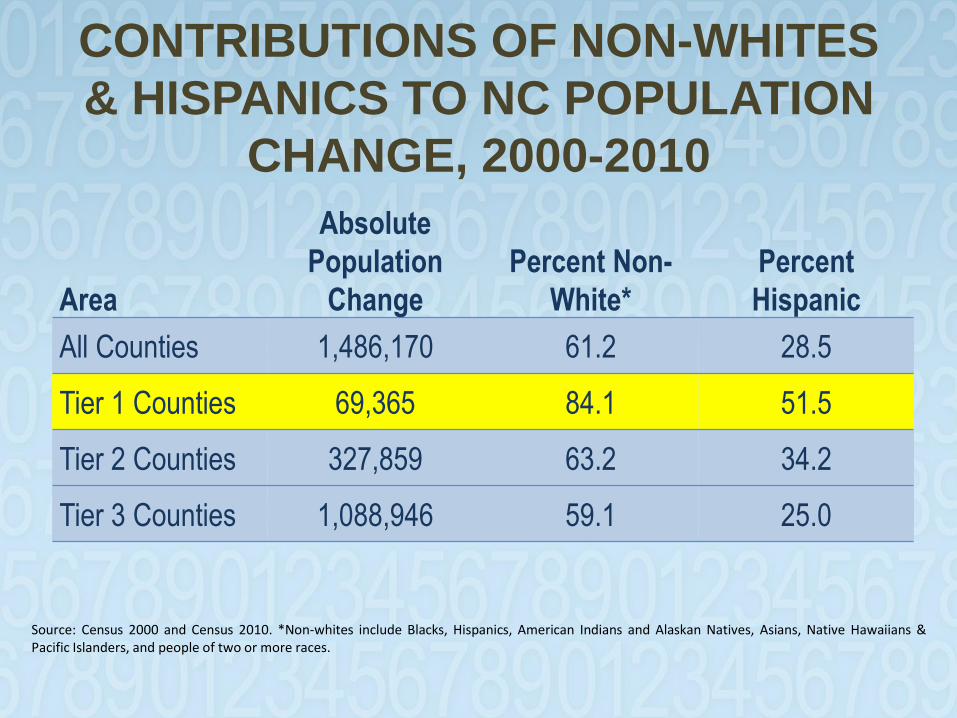
CONTRIBUTIONS OF NON-WHITES
& HISPANICS TO NC POPULATION
CHANGE, 2000-2010
Area
Absolute
Population
Change
Percent Non-
White*
Percent
Hispanic
All Counties 1,486,170 61.2 28.5
Tier 1 Counties 69,365 84.1 51.5
Tier 2 Counties 327,859 63.2 34.2
Tier 3 Counties 1,088,946 59.1 25.0
Source: Census 2000 and Census 2010. *Non-whites include Blacks, Hispanics, American Indians and Alaskan Natives, Asians, Native Hawaiians & Pacific Islanders, and people of two or more races.

is “In”
Marrying Out
May 2015 33
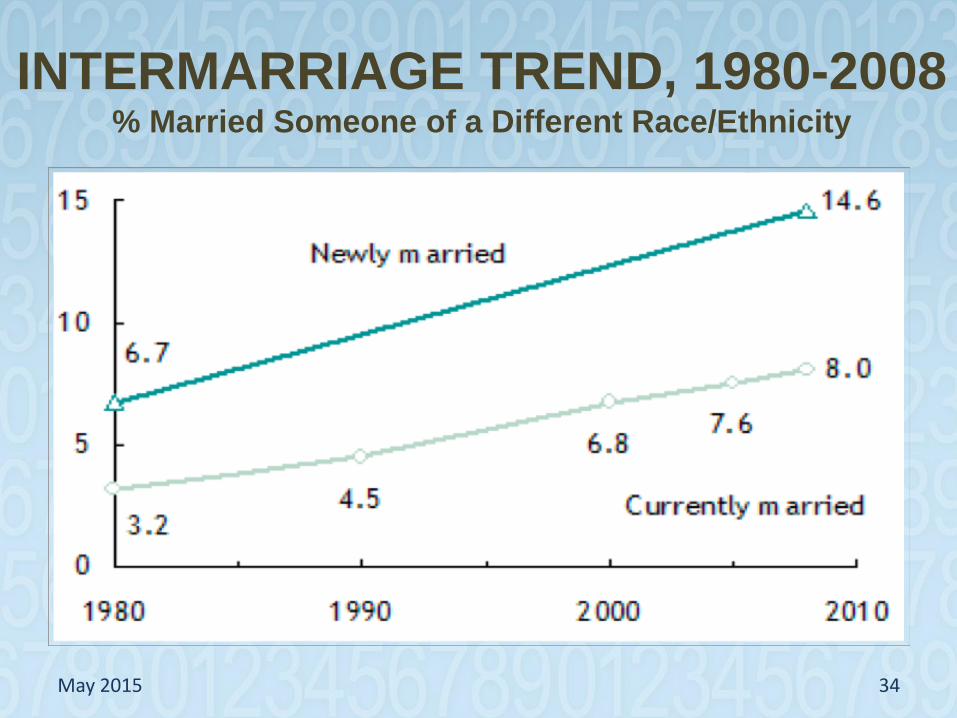
INTERMARRIAGE TREND, 1980-2008 % Married Someone of a Different Race/Ethnicity
May 2015 34
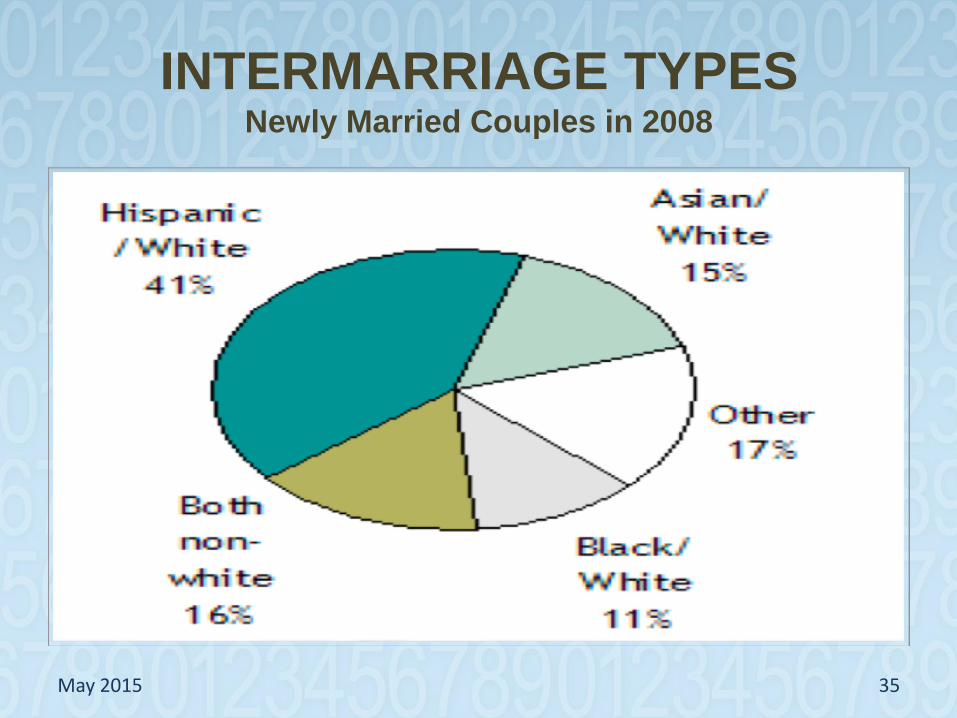
INTERMARRIAGE TYPES Newly Married Couples in 2008
May 2015 35
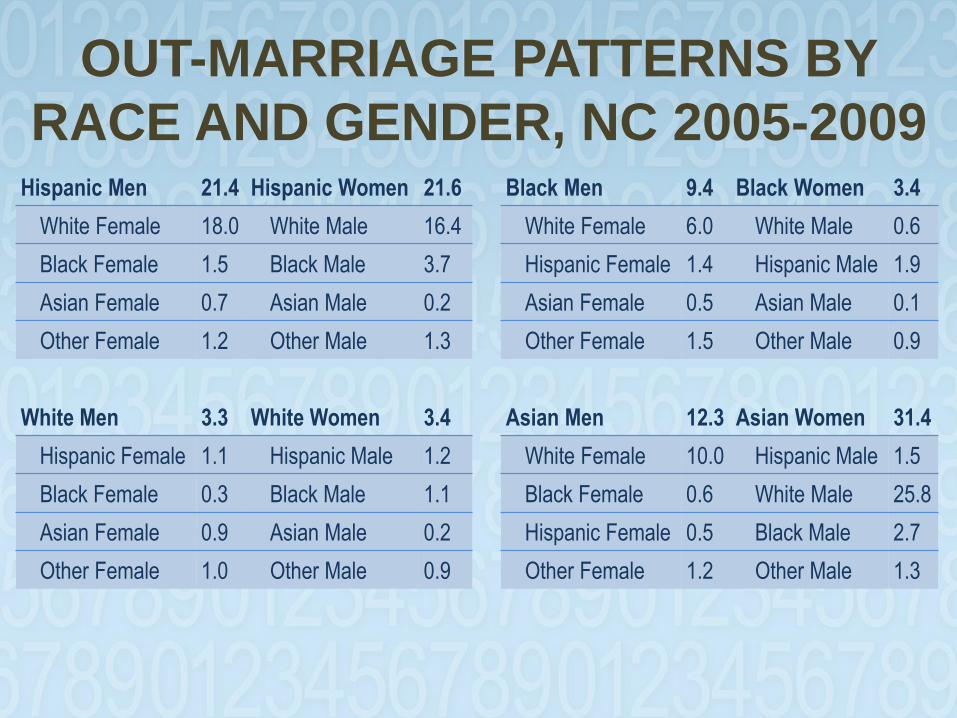
OUT-MARRIAGE PATTERNS BY
RACE AND GENDER, NC 2005-2009 Hispanic Men 21.4 Hispanic Women 21.6 Black Men 9.4 Black Women 3.4
White Female 18.0 White Male 16.4 White Female 6.0 White Male 0.6
Black Female 1.5 Black Male 3.7 Hispanic Female 1.4 Hispanic Male 1.9
Asian Female 0.7 Asian Male 0.2 Asian Female 0.5 Asian Male 0.1
Other Female 1.2 Other Male 1.3 Other Female 1.5 Other Male 0.9
White Men 3.3 White Women 3.4 Asian Men 12.3 Asian Women 31.4
Hispanic Female 1.1 Hispanic Male 1.2 White Female 10.0 Hispanic Male 1.5
Black Female 0.3 Black Male 1.1 Black Female 0.6 White Male 25.8
Asian Female 0.9 Asian Male 0.2 Hispanic Female 0.5 Black Male 2.7
Other Female 1.0 Other Male 0.9 Other Female 1.2 Other Male 1.3
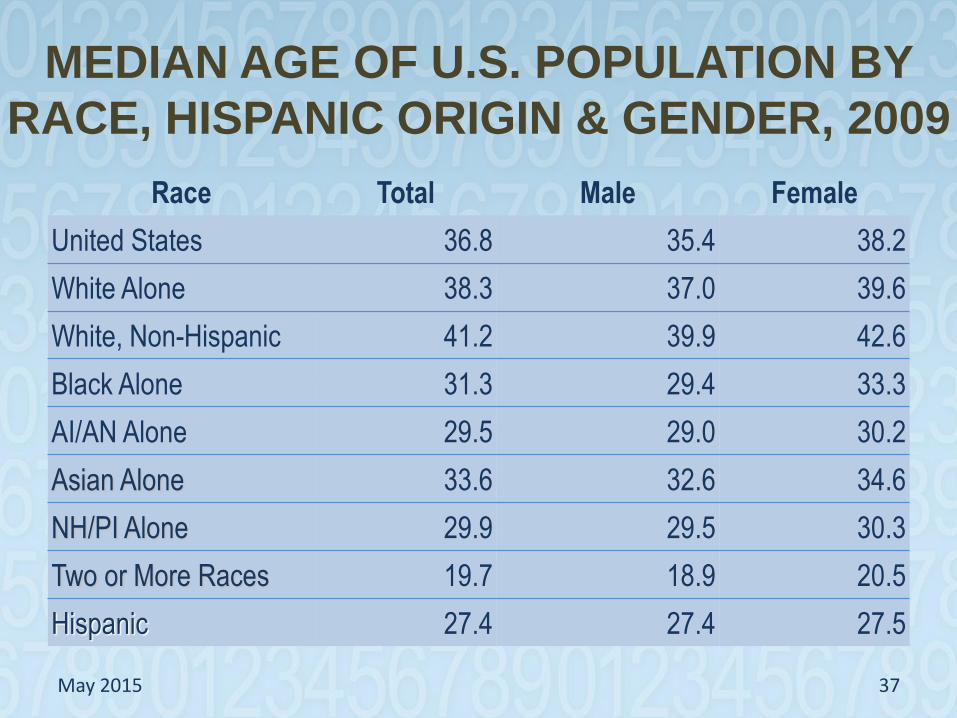
MEDIAN AGE OF U.S. POPULATION BY
RACE, HISPANIC ORIGIN & GENDER, 2009
Race Total Male Female
United States 36.8 35.4 38.2
White Alone 38.3 37.0 39.6
White, Non-Hispanic 41.2 39.9 42.6
Black Alone 31.3 29.4 33.3
AI/AN Alone 29.5 29.0 30.2
Asian Alone 33.6 32.6 34.6
NH/PI Alone 29.9 29.5 30.3
Two or More Races 19.7 18.9 20.5
Hispanic 27.4 27.4 27.5
May 2015 37
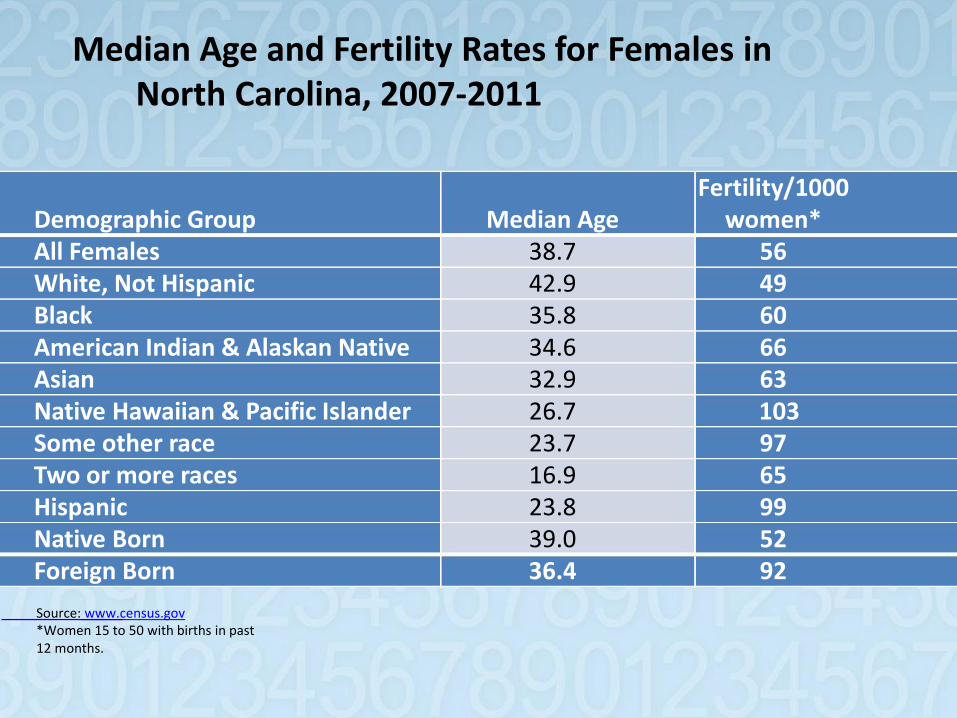
Median Age and Fertility Rates for Females in North Carolina, 2007-2011
Demographic Group All Females White, Not Hispanic Black American Indian & Alaskan Native Asian Native Hawaiian & Pacific Islander Some other race Two or more races Hispanic Native Born Foreign Born
Source: www.census.gov *Women 15 to 50 with births in past 12 months.
Median Age 38.7 42.9 35.8 34.6 32.9 26.7 23.7 16.9 23.8 39.0 36.4
Fertility/1000 women*
56 49 60 66 63
103 97 65 99 52 92
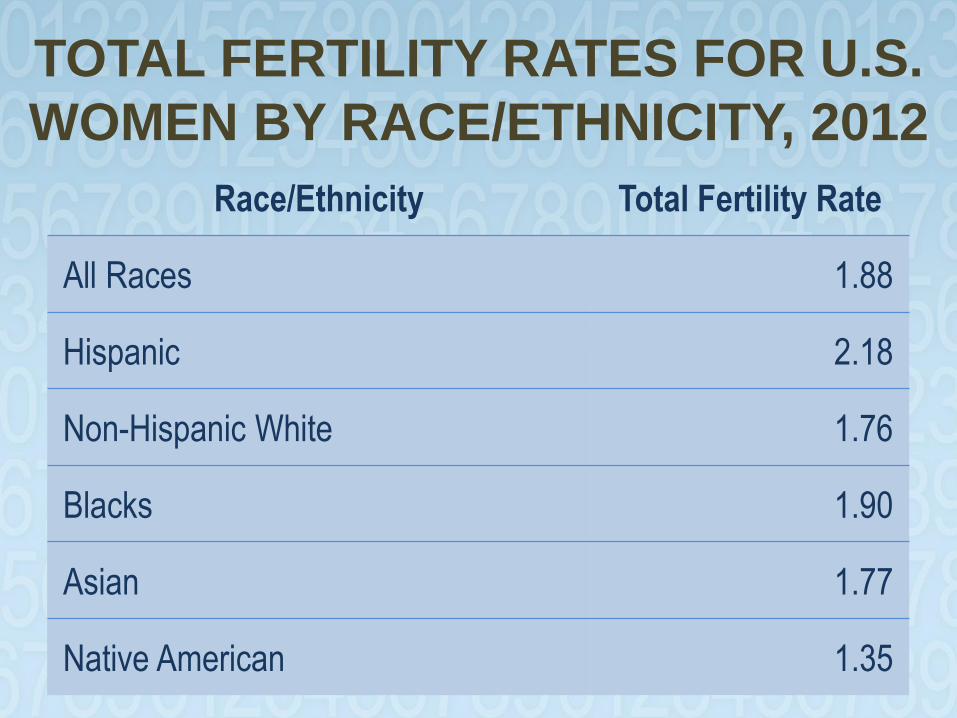
TOTAL FERTILITY RATES FOR U.S.
WOMEN BY RACE/ETHNICITY, 2012
Race/Ethnicity Total Fertility Rate
All Races 1.88
Hispanic 2.18
Non-Hispanic White 1.76
Blacks 1.90
Asian 1.77
Native American 1.35
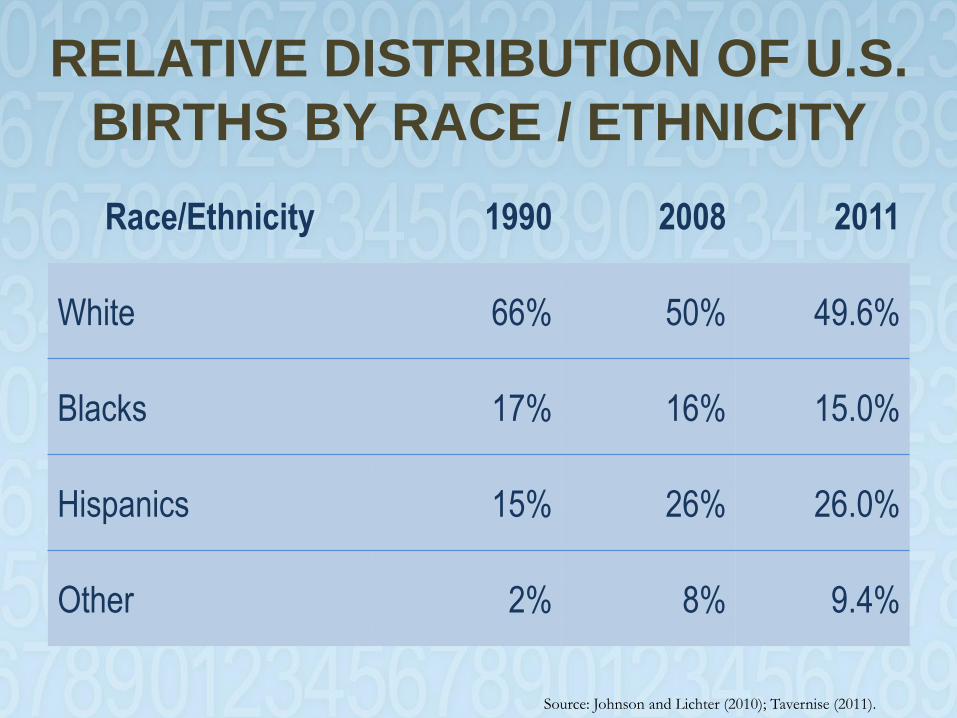
RELATIVE DISTRIBUTION OF U.S.
BIRTHS BY RACE / ETHNICITY
Race/Ethnicity 1990 2008 2011
White 66% 50% 49.6%
Blacks 17% 16% 15.0%
Hispanics 15% 26% 26.0%
Other 2% 8% 9.4%
Source: Johnson and Lichter (2010); Tavernise (2011).
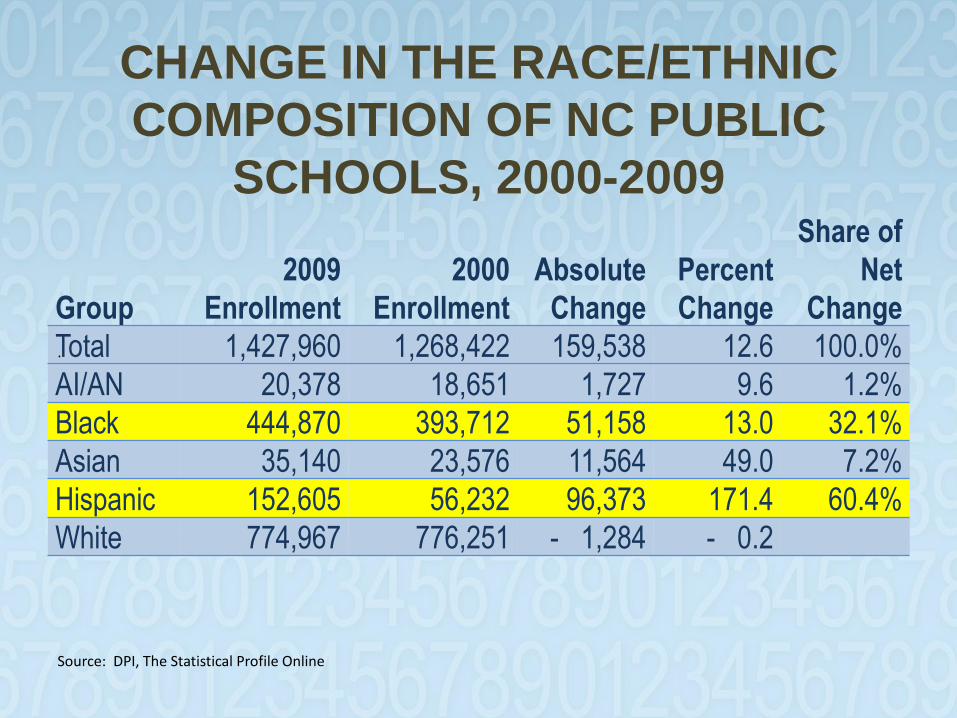
CHANGE IN THE RACE/ETHNIC
COMPOSITION OF NC PUBLIC
SCHOOLS, 2000-2009
Group
2009
Enrollment
2000
Enrollment
Absolute
Change
Percent
Change
Share of
Net
Change
Total 1,427,960 1,268,422 159,538 12.6 100.0%
AI/AN 20,378 18,651 1,727 9.6 1.2%
Black 444,870 393,712 51,158 13.0 32.1%
Asian 35,140 23,576 11,564 49.0 7.2%
Hispanic 152,605 56,232 96,373 171.4 60.4%
White 774,967 776,251 - 1,284 - 0.2
.
Source: DPI, The Statistical Profile Online
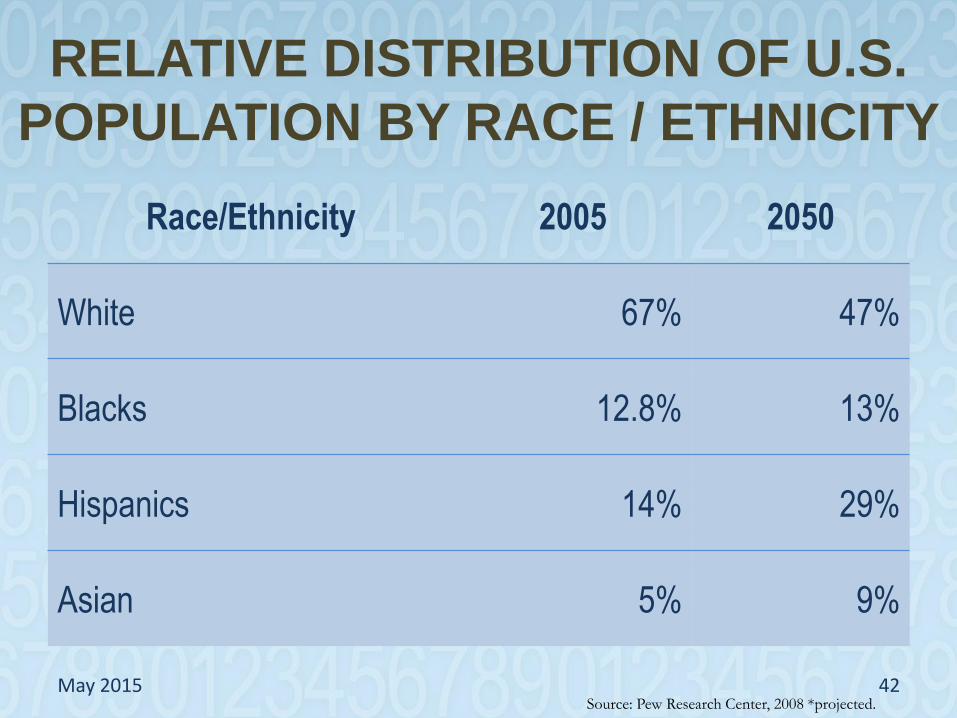
RELATIVE DISTRIBUTION OF U.S.
POPULATION BY RACE / ETHNICITY
Race/Ethnicity 2005 2050
White 67% 47%
Blacks 12.8% 13%
Hispanics 14% 29%
Asian 5% 9%
May 2015 42 Source: Pew Research Center, 2008 *projected.

THE SILVER TSUNAMI
May 2015 43
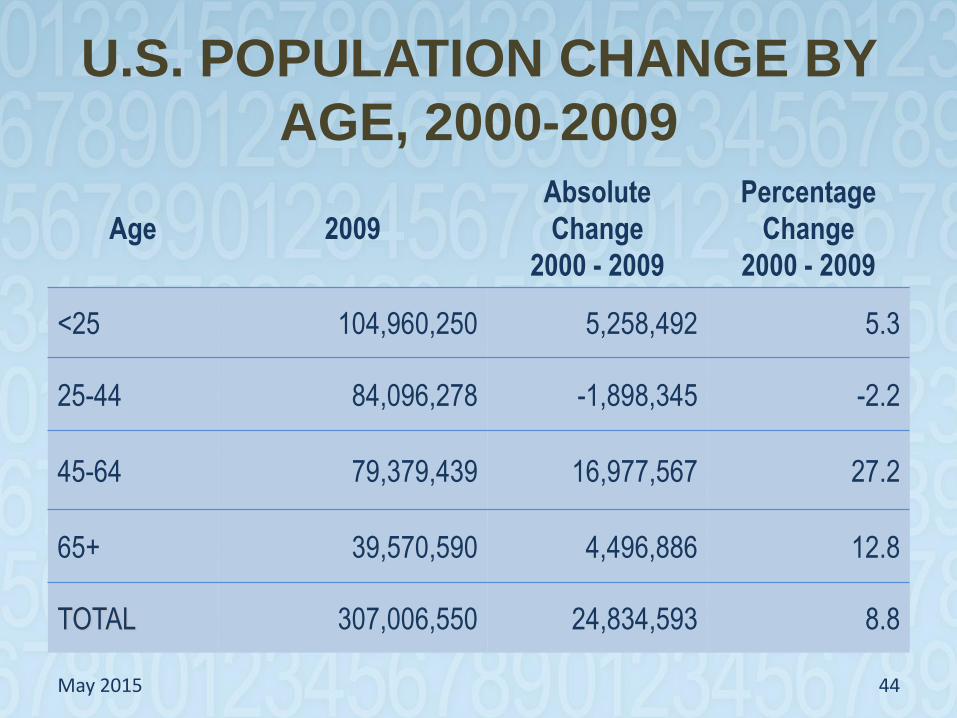
U.S. POPULATION CHANGE BY
AGE, 2000-2009
Age 2009
Absolute
Change
2000 - 2009
Percentage
Change
2000 - 2009
<25 104,960,250 5,258,492 5.3
25-44 84,096,278 -1,898,345 -2.2
45-64 79,379,439 16,977,567 27.2
65+ 39,570,590 4,496,886 12.8
TOTAL 307,006,550 24,834,593 8.8
May 2015 44
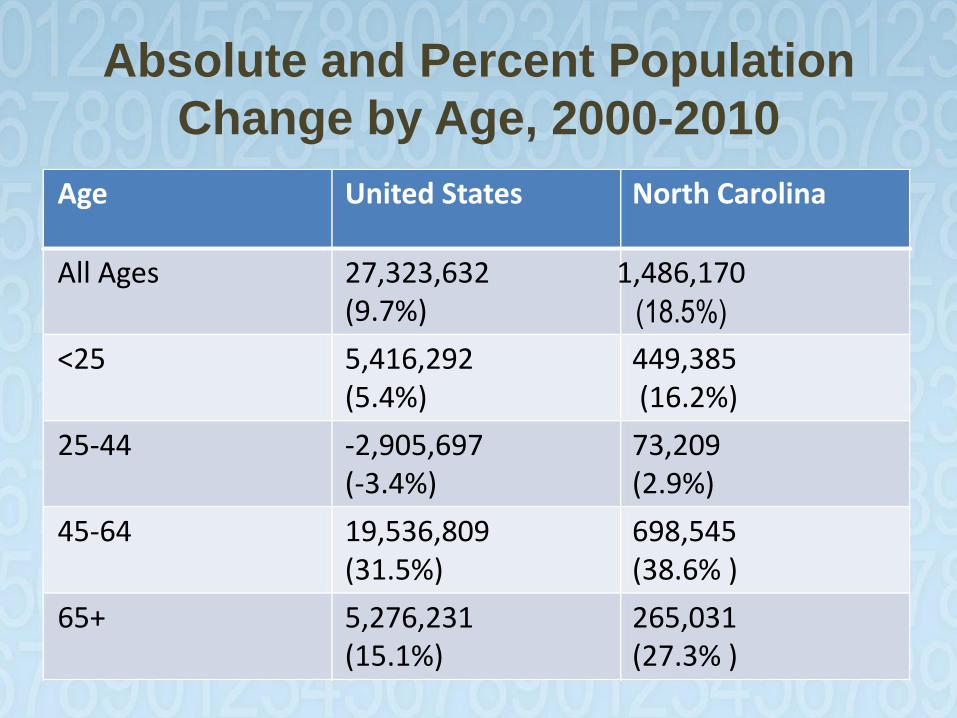
Absolute and Percent Population
Change by Age, 2000-2010
Age
All Ages
<25
United States
27,323,632 (9.7%)
5,416,292 (5.4%)
North Carolina
1,486,170 (18.5%)
449,385 (16.2%)
25-44
45-64
65+
-2,905,697 (-3.4%)
19,536,809 (31.5%)
5,276,231 (15.1%)
73,209 (2.9%)
698,545 (38.6% )
265,031 (27.3% )
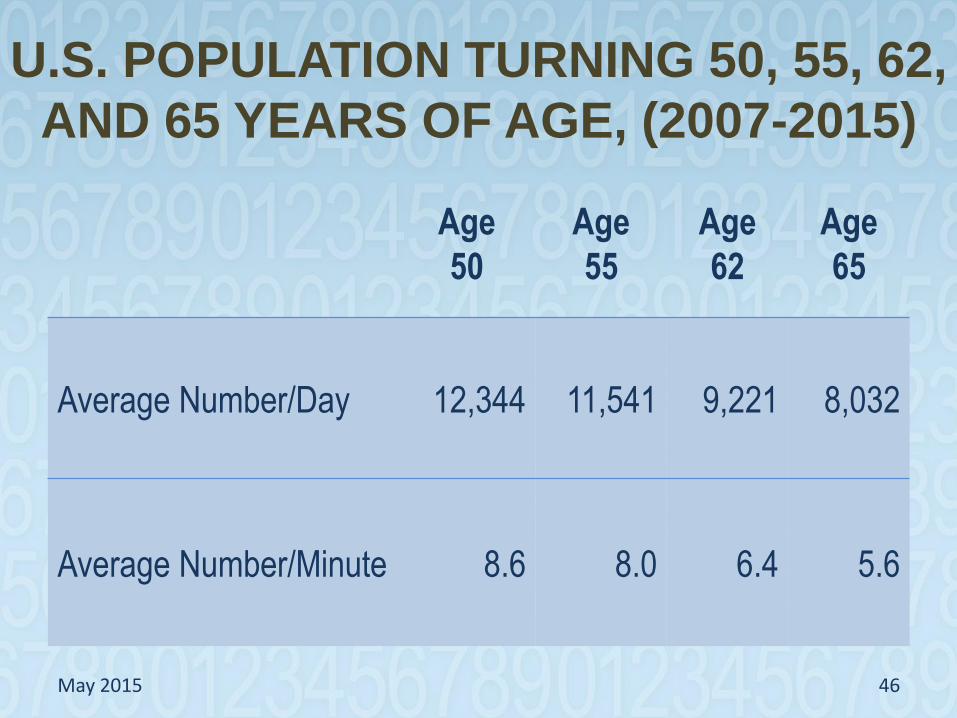
U.S. POPULATION TURNING 50, 55, 62,
AND 65 YEARS OF AGE, (2007-2015)
Age
50
Age
55
Age
62
Age
65
Average Number/Day 12,344 11,541 9,221 8,032
Average Number/Minute 8.6 8.0 6.4 5.6
May 2015 46
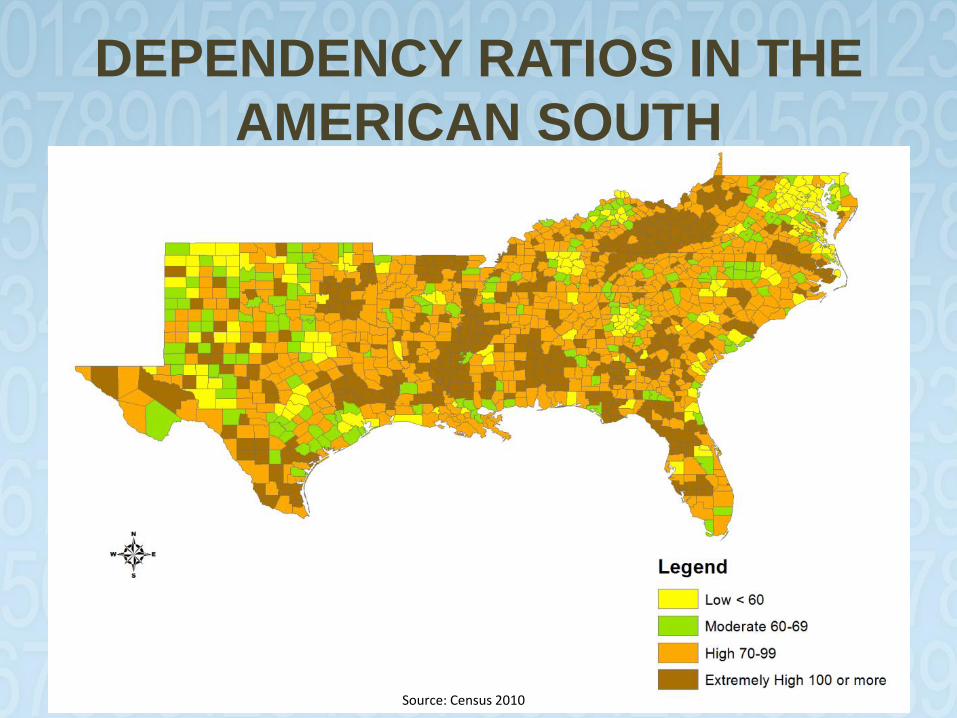
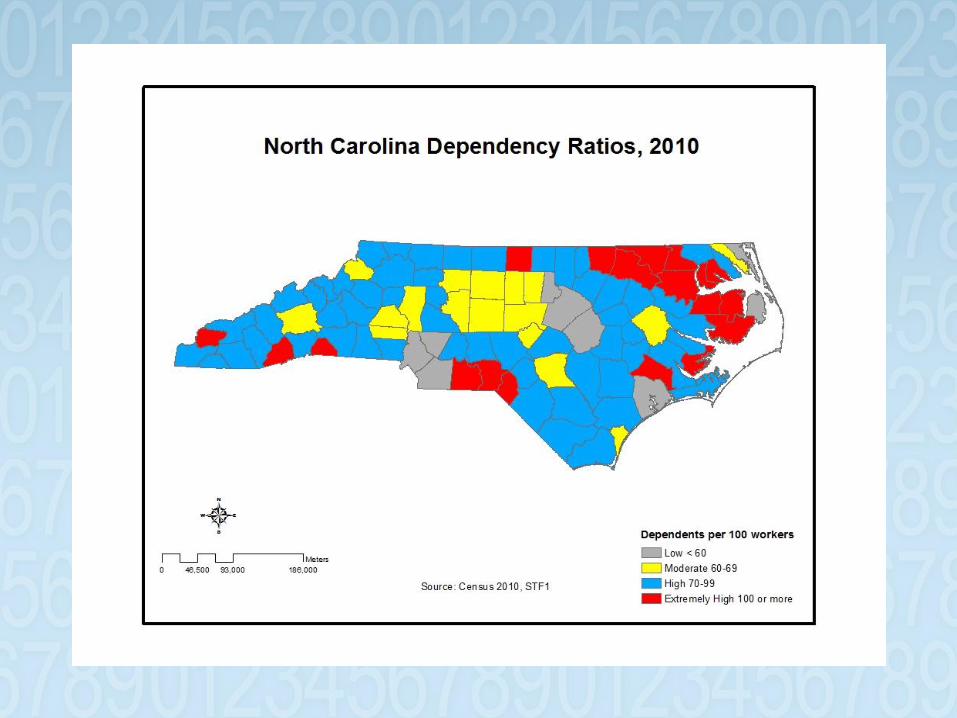
DEPENDENCY RATIOS IN THE
AMERICAN SOUTH
Source: Census 2010
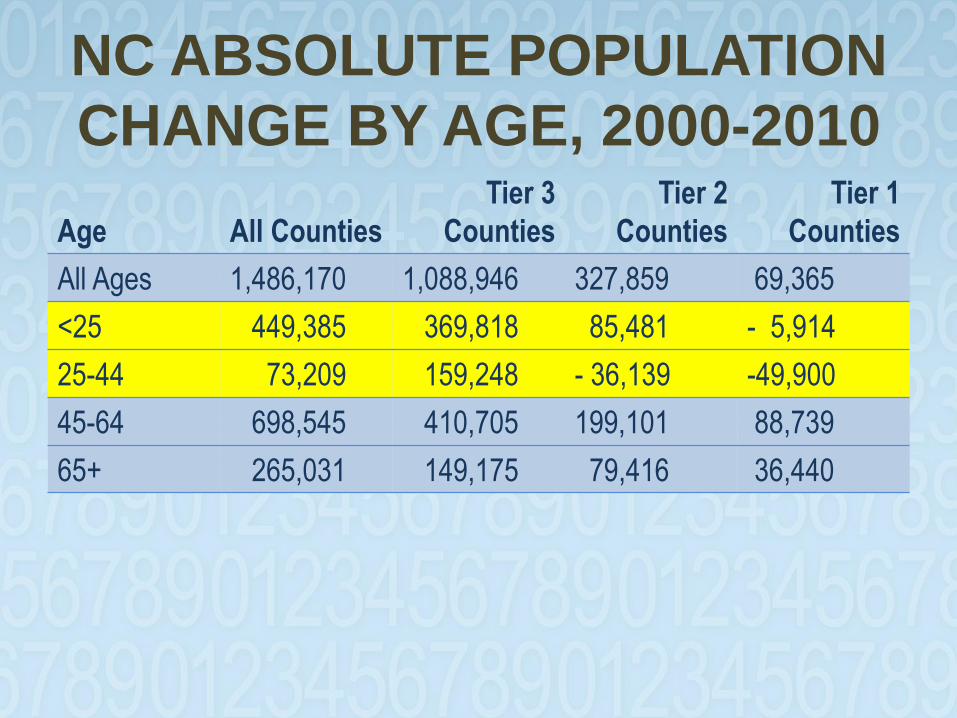
NC ABSOLUTE POPULATION
CHANGE BY AGE, 2000-2010
Age All Counties
Tier 3
Counties
Tier 2
Counties
Tier 1
Counties
All Ages 1,486,170 1,088,946 327,859 69,365
<25 449,385 369,818 85,481 - 5,914
25-44 73,209 159,248 - 36,139 -49,900
45-64 698,545 410,705 199,101 88,739
65+ 265,031 149,175 79,416 36,440
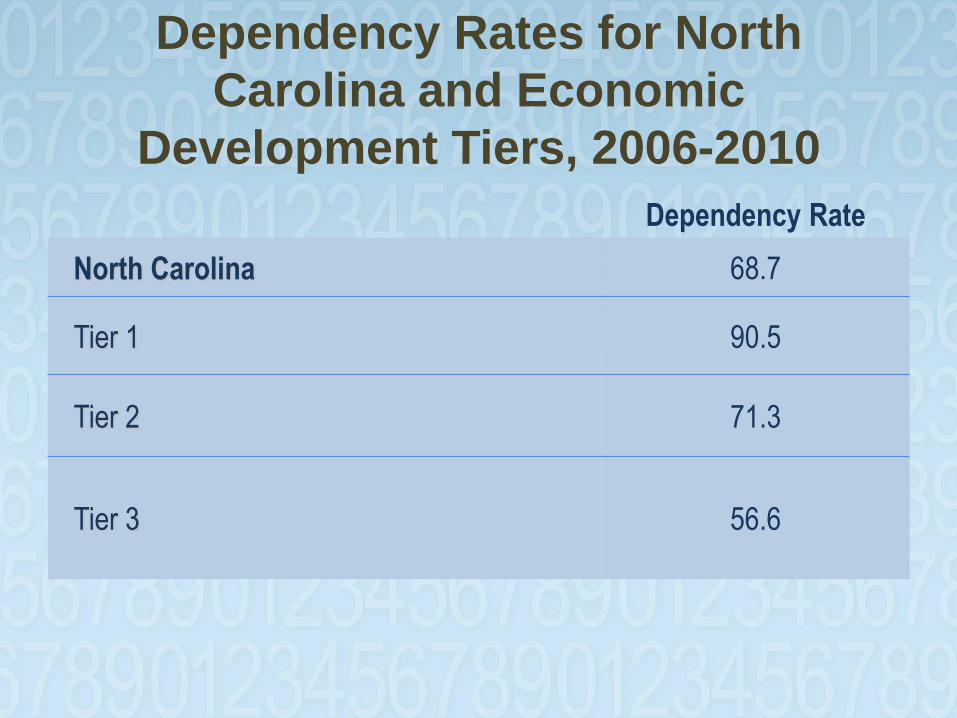
Dependency Rates for North
Carolina and Economic
Development Tiers, 2006-2010
Dependency Rate
North Carolina 68.7
Tier 1 90.5
Tier 2 71.3
Tier 3 56.6

COOLING WATERS FROM
GRANDMA’S WELL
And Grandpa’s Too!
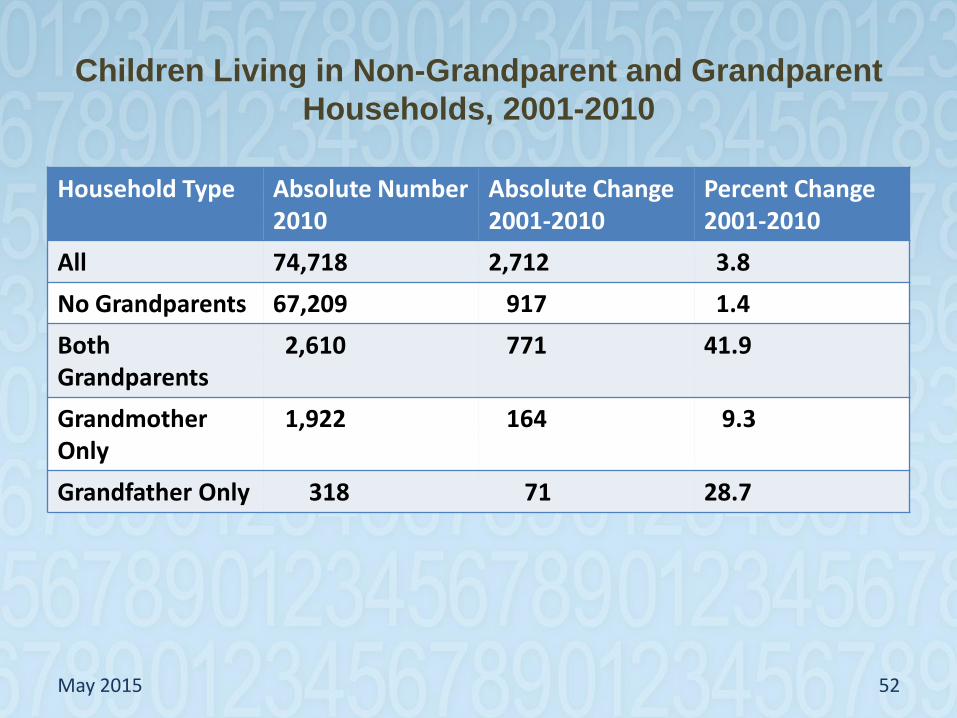
Children Living in Non-Grandparent and Grandparent
Households, 2001-2010
Household Type Absolute Number 2010
Absolute Change 2001-2010
Percent Change 2001-2010
All 74,718 2,712 3.8
No Grandparents 67,209 917 1.4
Both Grandparents
2,610 771 41.9
Grandmother Only
1,922 164 9.3
Grandfather Only 318 71 28.7
May 2015 52
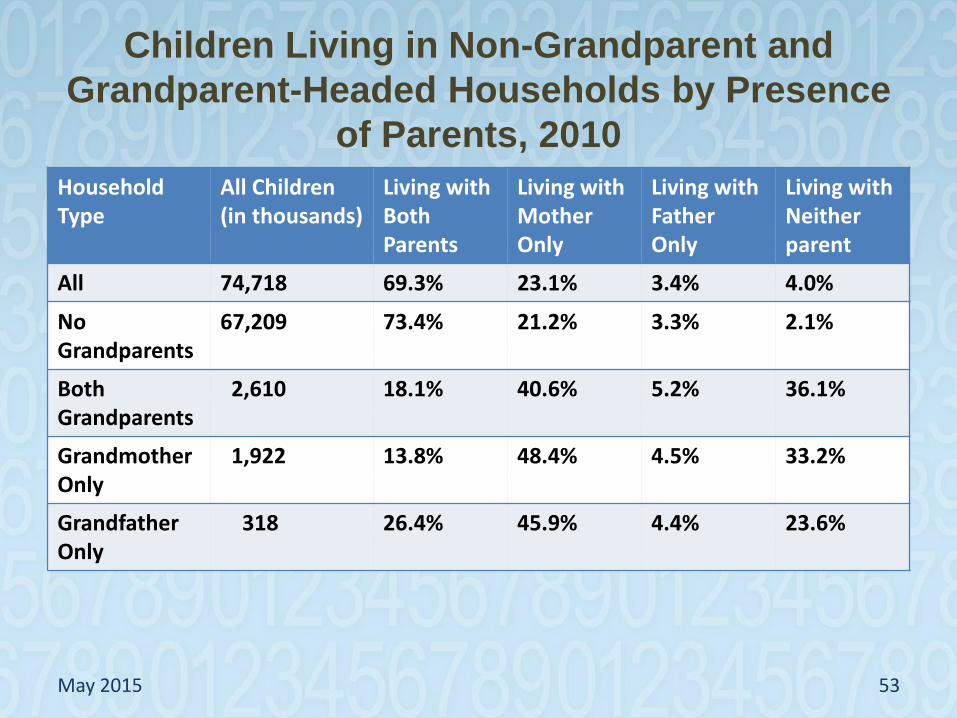
Children Living in Non-Grandparent and
Grandparent-Headed Households by Presence
of Parents, 2010
Household Type
All Children (in thousands)
Living with Both Parents
Living with Mother Only
Living with Father Only
Living with Neither parent
All 74,718 69.3% 23.1% 3.4% 4.0%
No Grandparents
67,209 73.4% 21.2% 3.3% 2.1%
Both Grandparents
2,610 18.1% 40.6% 5.2% 36.1%
Grandmother Only
1,922 13.8% 48.4% 4.5% 33.2%
Grandfather Only
318 26.4% 45.9% 4.4% 23.6%
May 2015 53
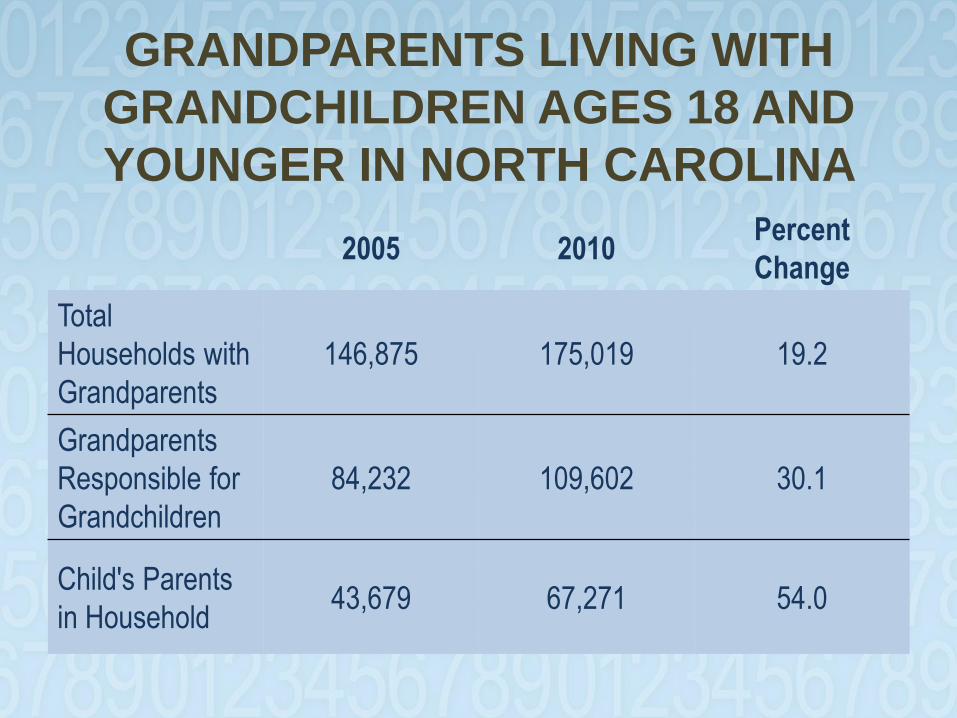
GRANDPARENTS LIVING WITH
GRANDCHILDREN AGES 18 AND
YOUNGER IN NORTH CAROLINA
2005 2010 Percent
Change
Total
Households with
Grandparents
146,875 175,019 19.2
Grandparents
Responsible for
Grandchildren
84,232 109,602 30.1
Child's Parents
in Household 43,679 67,271 54.0

The End of Men?
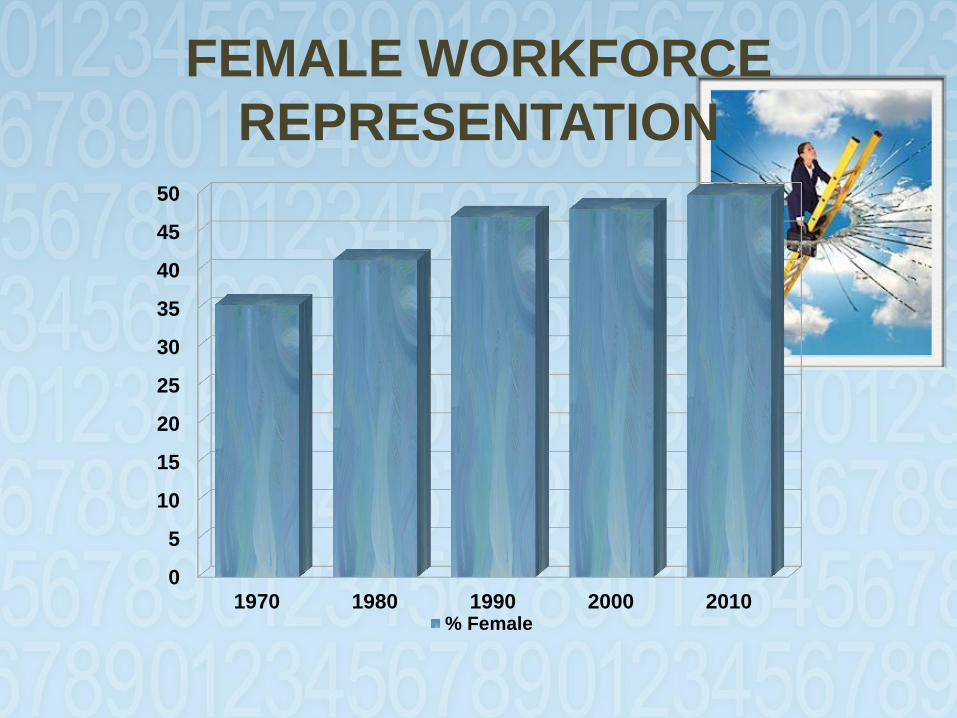
FEMALE WORKFORCE
REPRESENTATION
0
5
10
15
20
25
30
35
40
45
50
1970 1980 1990 2000 2010% Female
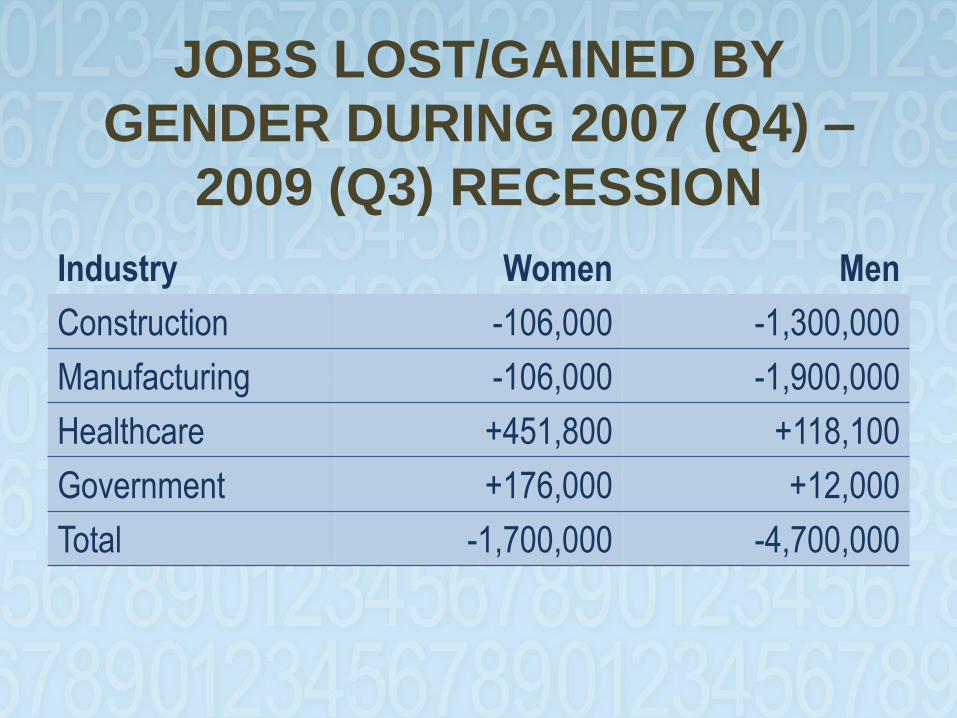
JOBS LOST/GAINED BY
GENDER DURING 2007 (Q4) –
2009 (Q3) RECESSION
Industry Women Men
Construction -106,000 -1,300,000
Manufacturing -106,000 -1,900,000
Healthcare +451,800 +118,100
Government +176,000 +12,000
Total -1,700,000 -4,700,000
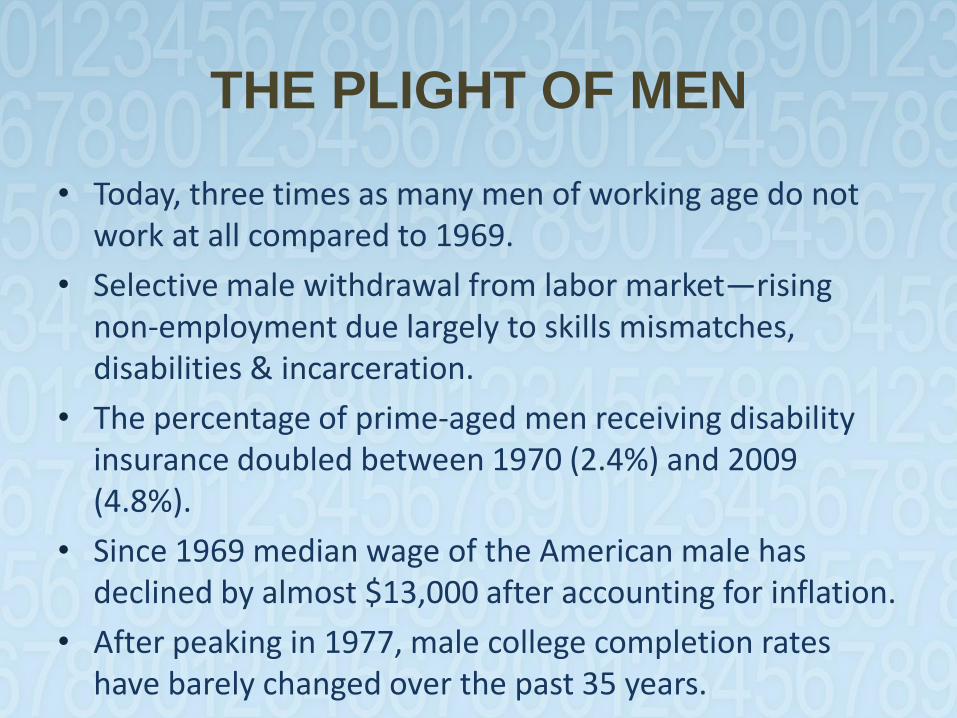
THE PLIGHT OF MEN
• Today, three times as many men of working age do not work at all compared to 1969.
• Selective male withdrawal from labor market—rising non-employment due largely to skills mismatches, disabilities & incarceration.
• The percentage of prime-aged men receiving disability insurance doubled between 1970 (2.4%) and 2009 (4.8%).
• Since 1969 median wage of the American male has declined by almost $13,000 after accounting for inflation.
• After peaking in 1977, male college completion rates have barely changed over the past 35 years.
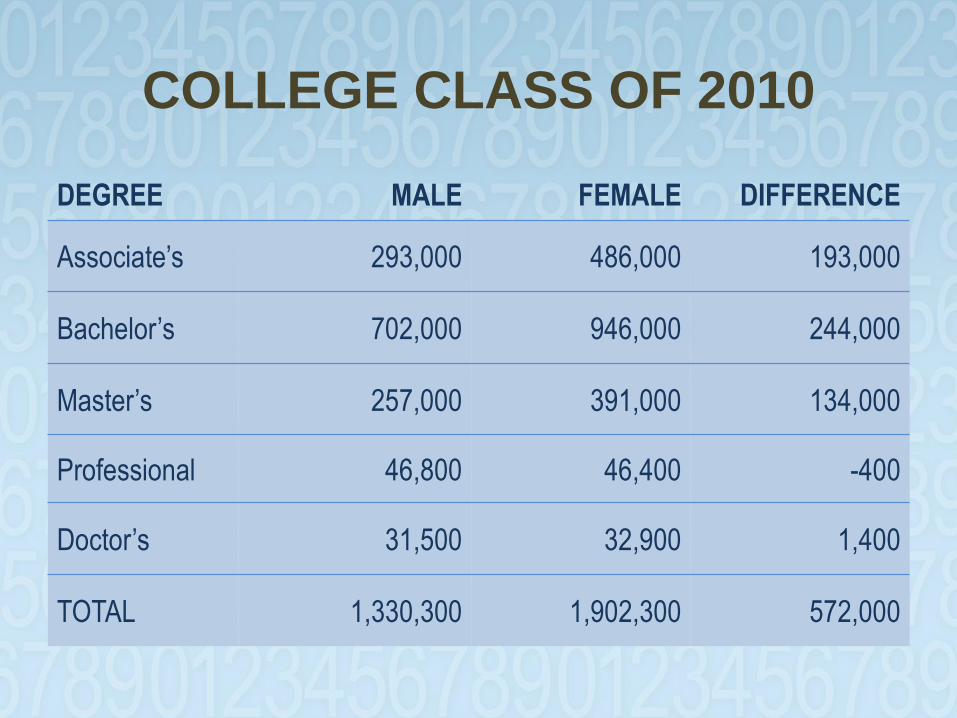
COLLEGE CLASS OF 2010
DEGREE MALE FEMALE DIFFERENCE
Associate’s 293,000 486,000 193,000
Bachelor’s 702,000 946,000 244,000
Master’s 257,000 391,000 134,000
Professional 46,800 46,400 -400
Doctor’s 31,500 32,900 1,400
TOTAL 1,330,300 1,902,300 572,000
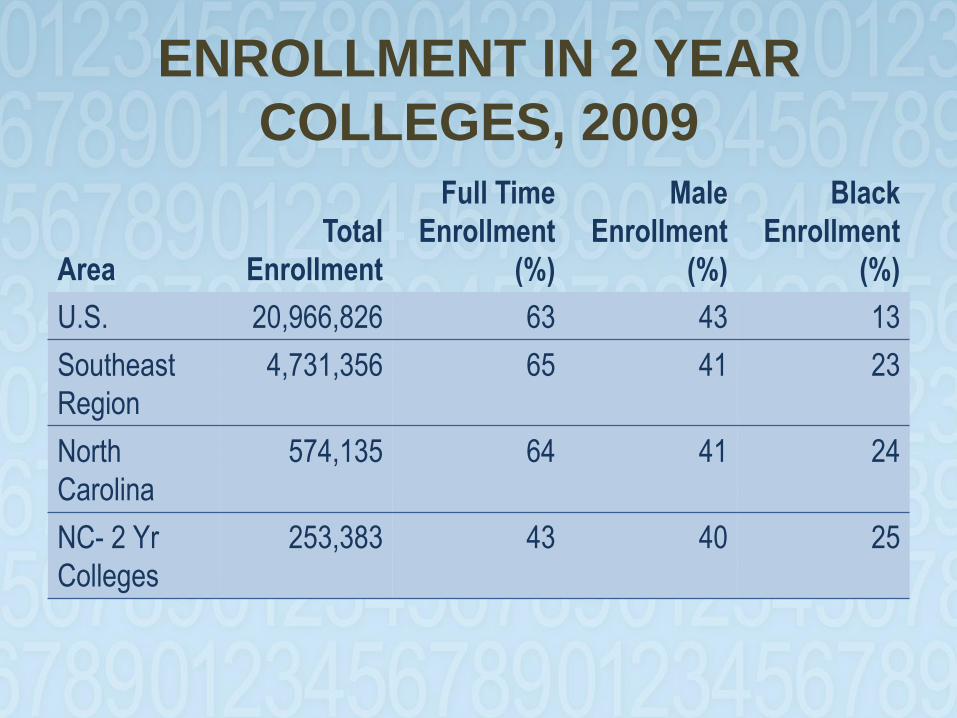
ENROLLMENT IN 2 YEAR
COLLEGES, 2009
Area
Total
Enrollment
Full Time
Enrollment
(%)
Male
Enrollment
(%)
Black
Enrollment
(%)
U.S. 20,966,826 63 43 13
Southeast
Region
4,731,356 65 41 23
North
Carolina
574,135 64 41 24
NC- 2 Yr
Colleges
253,383 43 40 25
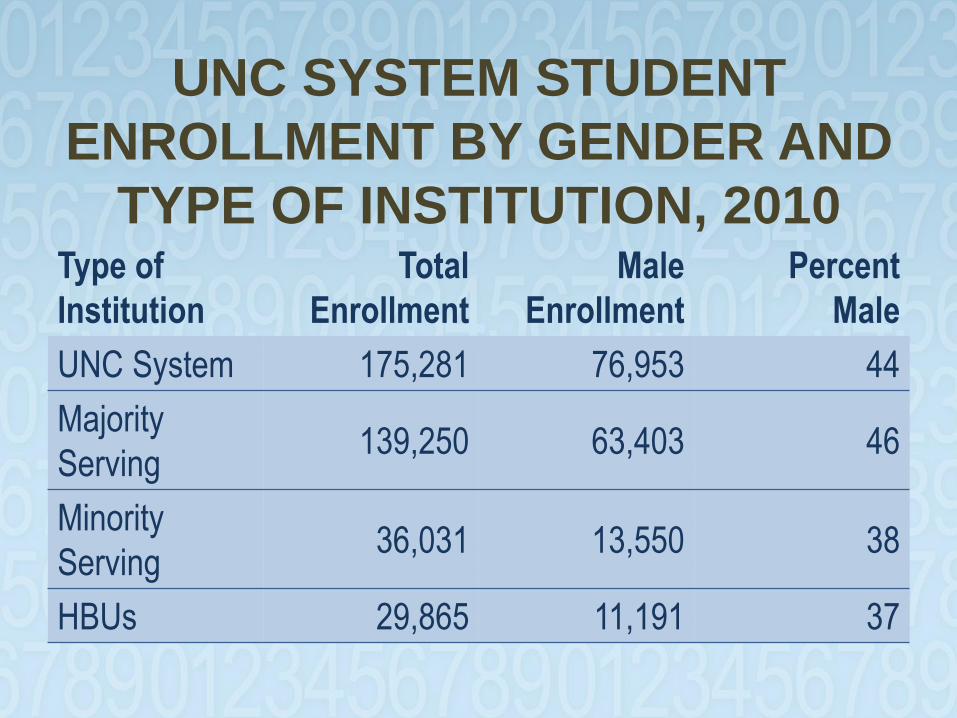
UNC SYSTEM STUDENT
ENROLLMENT BY GENDER AND
TYPE OF INSTITUTION, 2010 Type of
Institution
Total
Enrollment
Male
Enrollment
Percent
Male
UNC System 175,281 76,953 44
Majority
Serving 139,250 63,403 46
Minority
Serving 36,031 13,550 38
HBUs 29,865 11,191 37
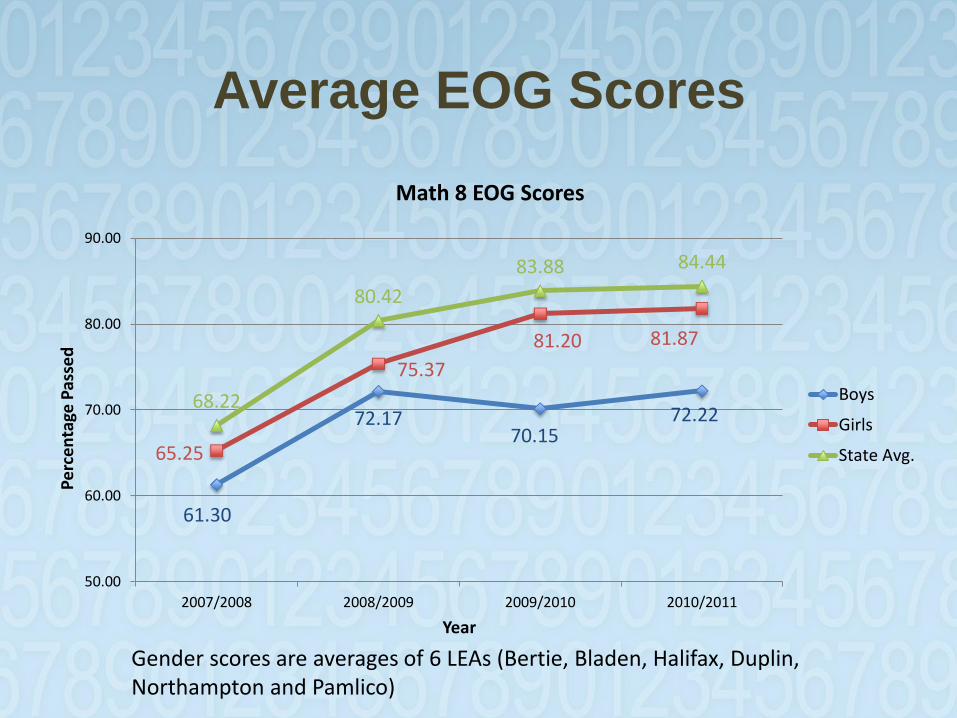
Average EOG Scores
Gender scores are averages of 6 LEAs (Bertie, Bladen, Halifax, Duplin, Northampton and Pamlico)
61.30
72.17 70.15
72.22
65.25
75.37
81.20 81.87
68.22
80.42
83.88 84.44
50.00
60.00
70.00
80.00
90.00
2007/2008 2008/2009 2009/2010 2010/2011
Pe
rce
nta
ge P
asse
d
Year
Math 8 EOG Scores
Boys
Girls
State Avg.
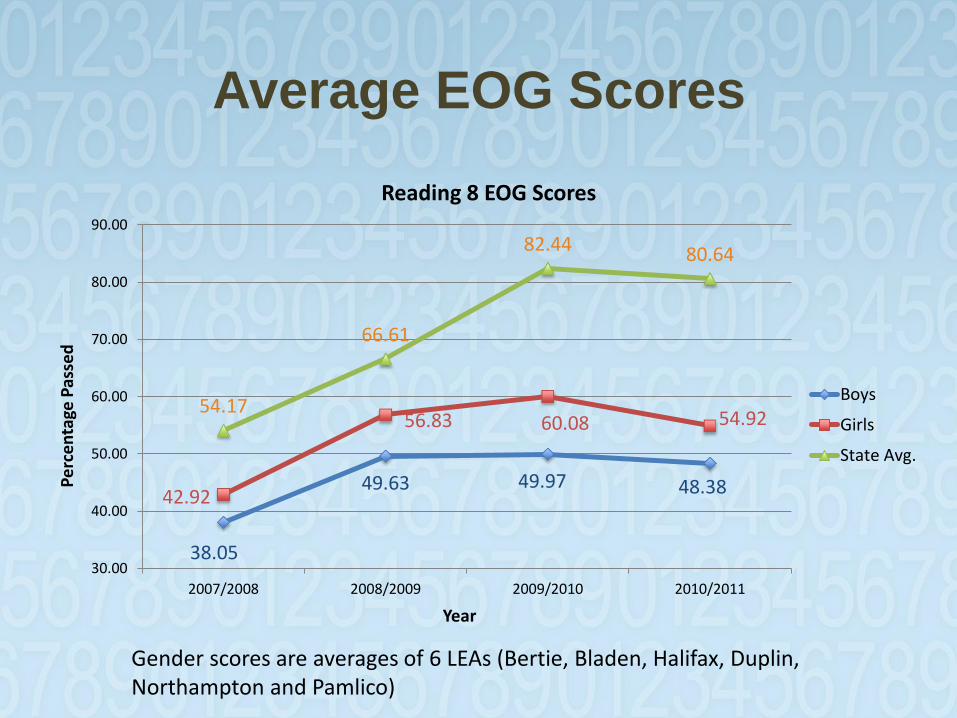
Average EOG Scores
Gender scores are averages of 6 LEAs (Bertie, Bladen, Halifax, Duplin, Northampton and Pamlico)
38.05
49.63 49.97 48.38 42.92
56.83 60.08 54.92 54.17
66.61
82.44 80.64
30.00
40.00
50.00
60.00
70.00
80.00
90.00
2007/2008 2008/2009 2009/2010 2010/2011
Pe
rce
nta
ge P
asse
d
Year
Reading 8 EOG Scores
Boys
Girls
State Avg.
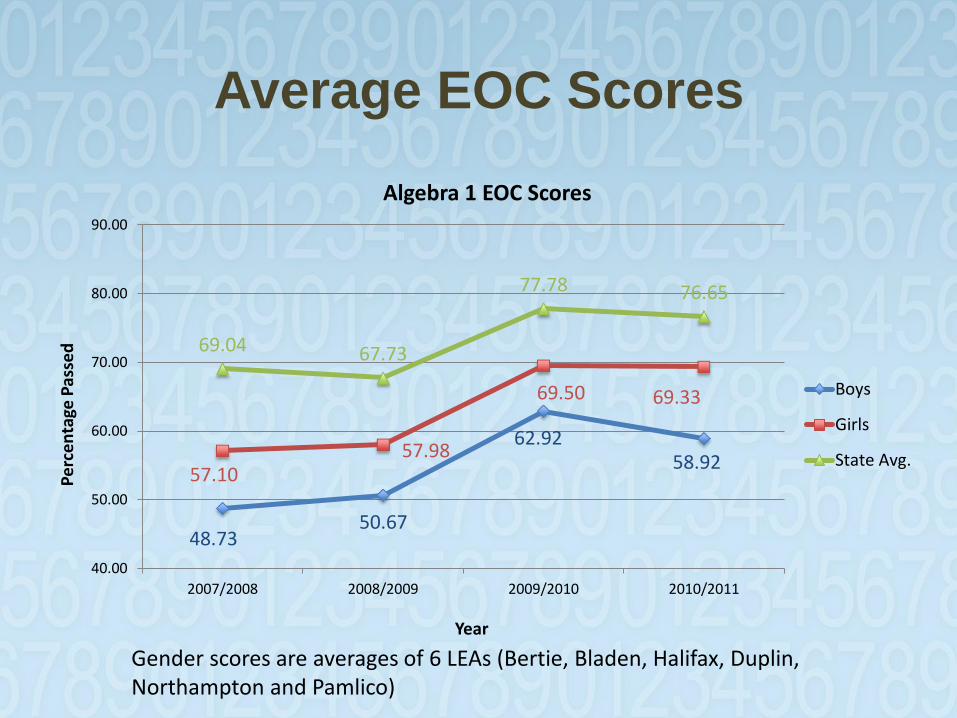
Average EOC Scores
Gender scores are averages of 6 LEAs (Bertie, Bladen, Halifax, Duplin, Northampton and Pamlico)
48.73 50.67
62.92 58.92
57.10 57.98
69.50 69.33
69.04 67.73
77.78 76.65
40.00
50.00
60.00
70.00
80.00
90.00
2007/2008 2008/2009 2009/2010 2010/2011
Pe
rce
nta
ge P
asse
d
Year
Algebra 1 EOC Scores
Boys
Girls
State Avg.
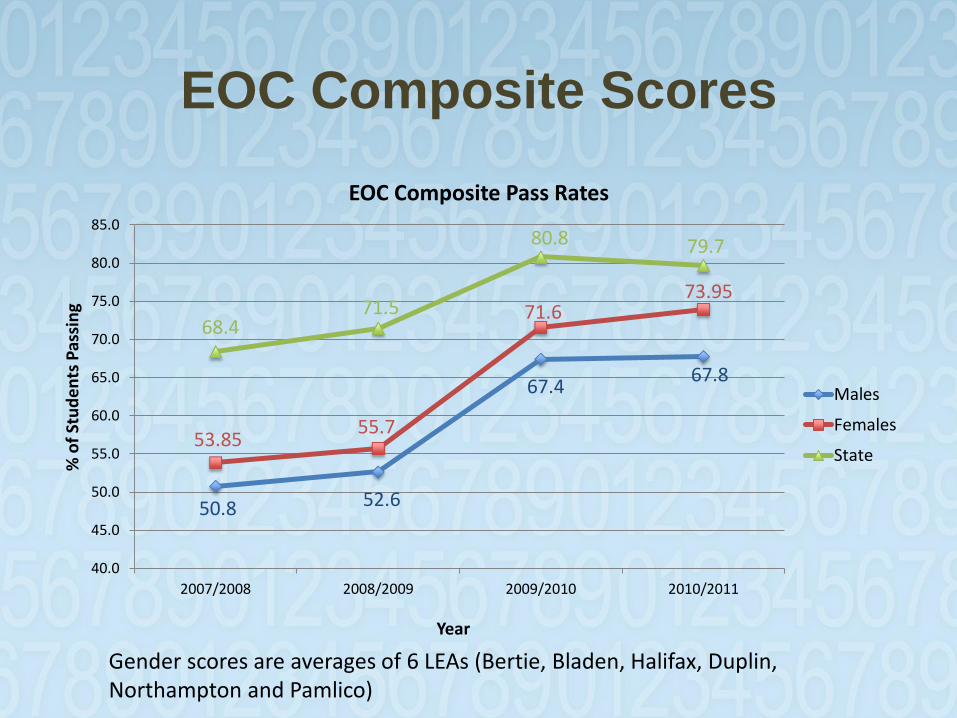
EOC Composite Scores
50.8 52.6
67.4 67.8
53.85 55.7
71.6 73.95
68.4 71.5
80.8 79.7
40.0
45.0
50.0
55.0
60.0
65.0
70.0
75.0
80.0
85.0
2007/2008 2008/2009 2009/2010 2010/2011
% o
f St
ud
en
ts P
assi
ng
Year
EOC Composite Pass Rates
Males
Females
State
Gender scores are averages of 6 LEAs (Bertie, Bladen, Halifax, Duplin, Northampton and Pamlico)
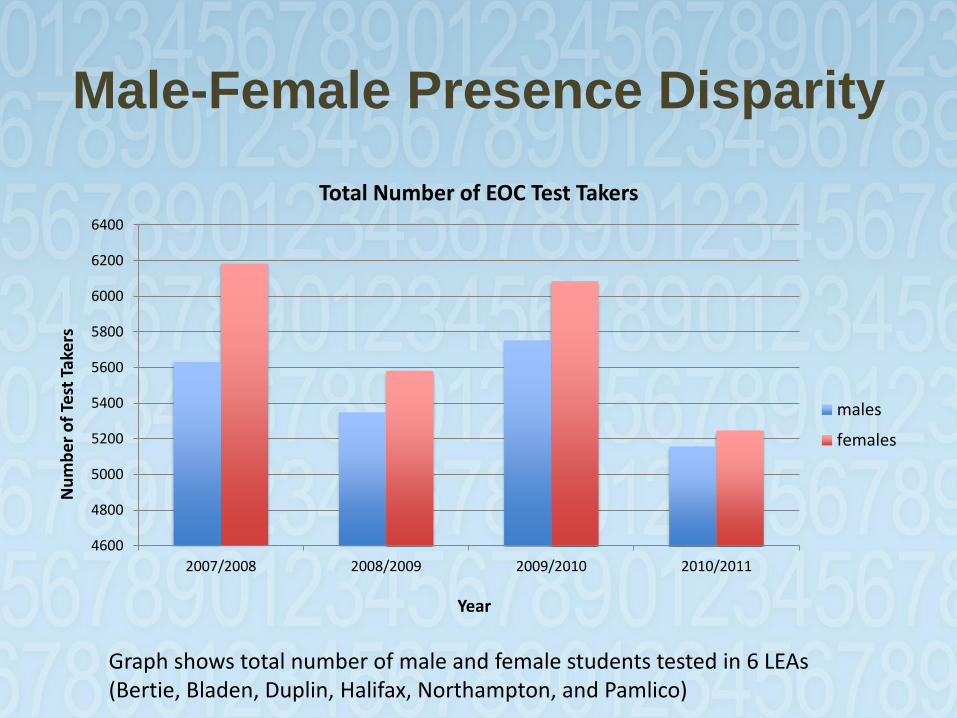
Male-Female Presence Disparity
4600
4800
5000
5200
5400
5600
5800
6000
6200
6400
2007/2008 2008/2009 2009/2010 2010/2011
Nu
mb
er
of
Test
Tak
ers
Year
Total Number of EOC Test Takers
males
females
Graph shows total number of male and female students tested in 6 LEAs (Bertie, Bladen, Duplin, Halifax, Northampton, and Pamlico)
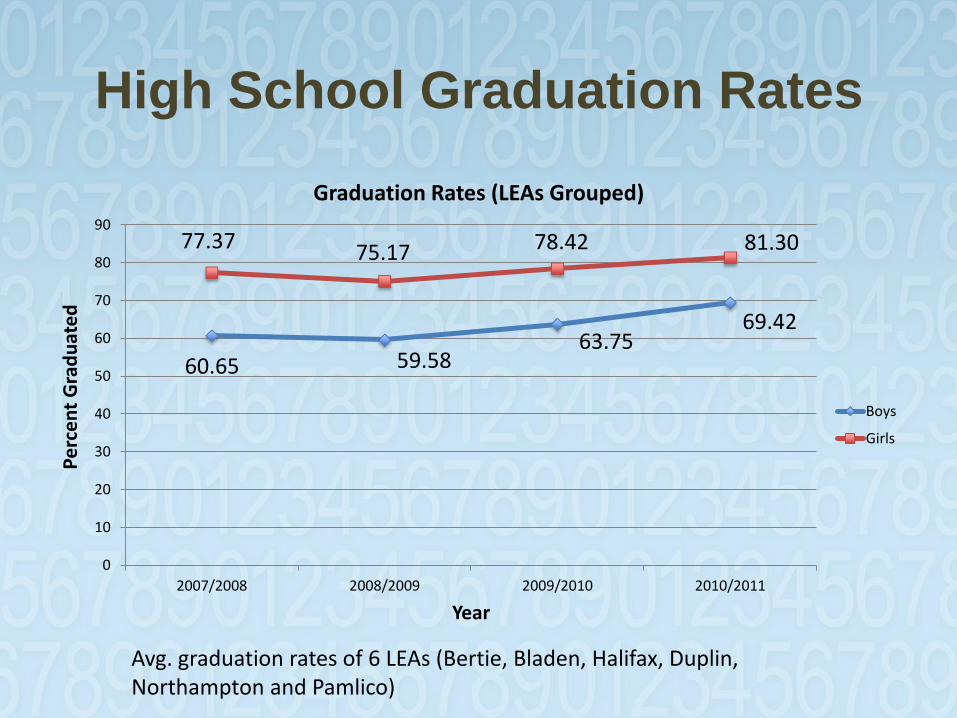
High School Graduation Rates
60.65 59.58 63.75
69.42
77.37 75.17 78.42 81.30
0
10
20
30
40
50
60
70
80
90
2007/2008 2008/2009 2009/2010 2010/2011
Pe
rce
nt
Gra
du
ate
d
Year
Graduation Rates (LEAs Grouped)
Boys
Girls
Avg. graduation rates of 6 LEAs (Bertie, Bladen, Halifax, Duplin, Northampton and Pamlico)
The Minority Male
Challenge
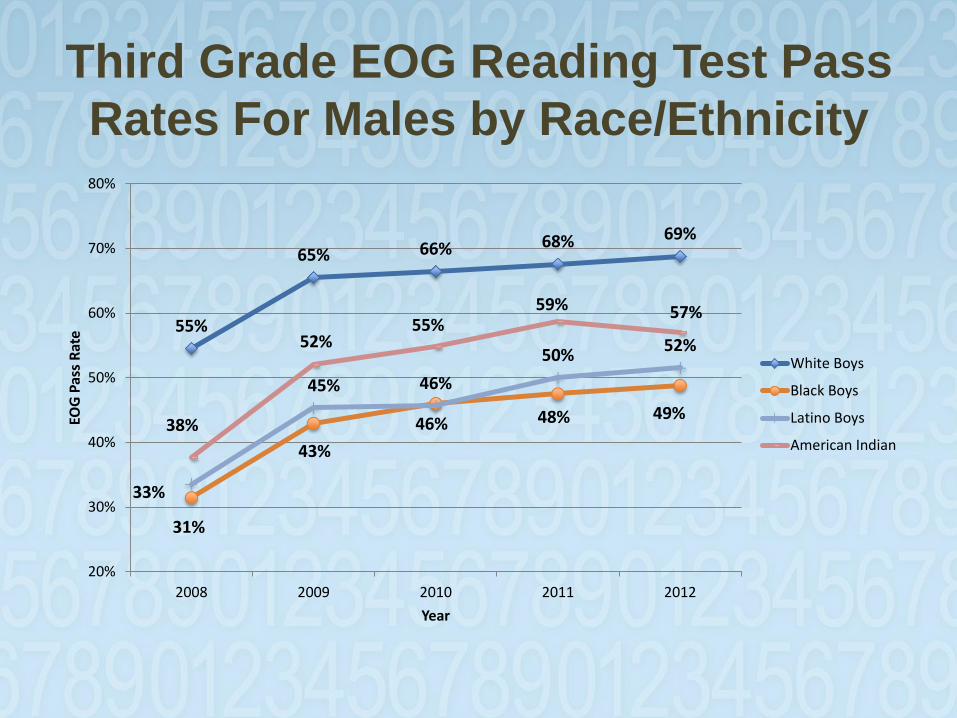
Third Grade EOG Reading Test Pass
Rates For Males by Race/Ethnicity
55%
65% 66% 68% 69%
31%
43%
46% 48% 49%
33%
45% 46%
50% 52%
38%
52% 55%
59% 57%
20%
30%
40%
50%
60%
70%
80%
2008 2009 2010 2011 2012
EOG
Pas
s R
ate
Year
White Boys
Black Boys
Latino Boys
American Indian
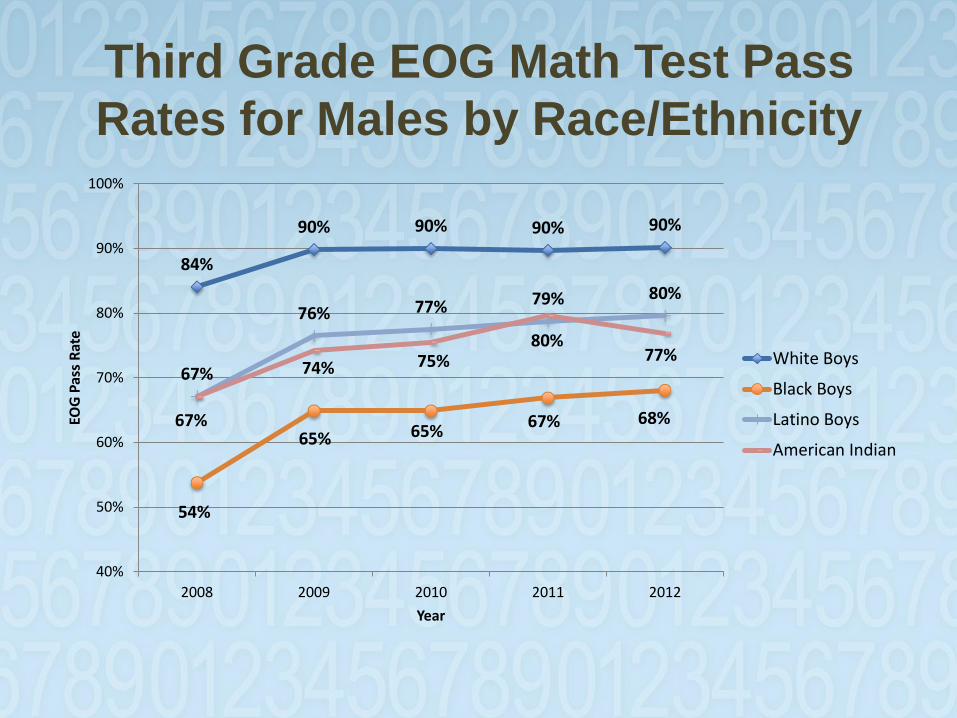
Third Grade EOG Math Test Pass
Rates for Males by Race/Ethnicity
84%
90% 90% 90% 90%
54%
65% 65% 67% 68%
67%
76% 77% 79% 80%
67%
74% 75% 80%
77%
40%
50%
60%
70%
80%
90%
100%
2008 2009 2010 2011 2012
EOG
Pas
s R
ate
Year
White Boys
Black Boys
Latino Boys
American Indian
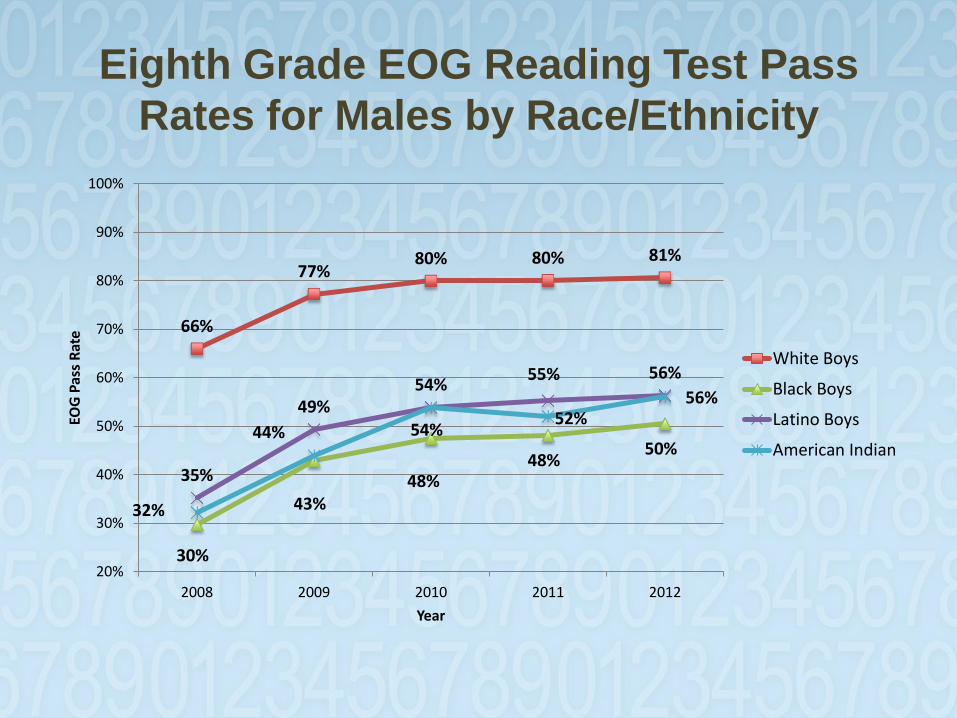
Eighth Grade EOG Reading Test Pass
Rates for Males by Race/Ethnicity
66%
77% 80% 80% 81%
30%
43% 48%
48% 50%
35%
49% 54%
55% 56%
32%
44% 54% 52%
56%
20%
30%
40%
50%
60%
70%
80%
90%
100%
2008 2009 2010 2011 2012
EOG
Pas
s R
ate
Year
White Boys
Black Boys
Latino Boys
American Indian
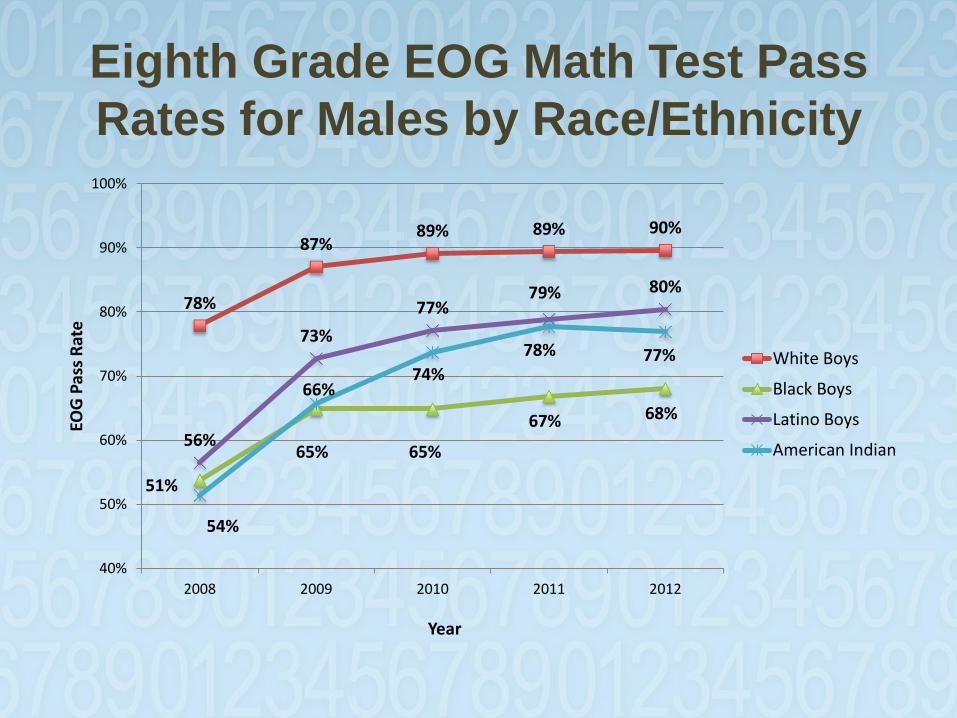
Eighth Grade EOG Math Test Pass
Rates for Males by Race/Ethnicity
78%
87% 89% 89% 90%
54%
65% 65%
67% 68%
56%
73%
77% 79% 80%
51%
66% 74%
78% 77%
40%
50%
60%
70%
80%
90%
100%
2008 2009 2010 2011 2012
EOG
Pas
s R
ate
Year
White Boys
Black Boys
Latino Boys
American Indian

...but Challenges Abound
DIVERSITY RULES
September 2012 73

The Triple Whammy of
Geographical Disadvantage
The Human Capital Challenge
Racial Typology of U.S. Counties
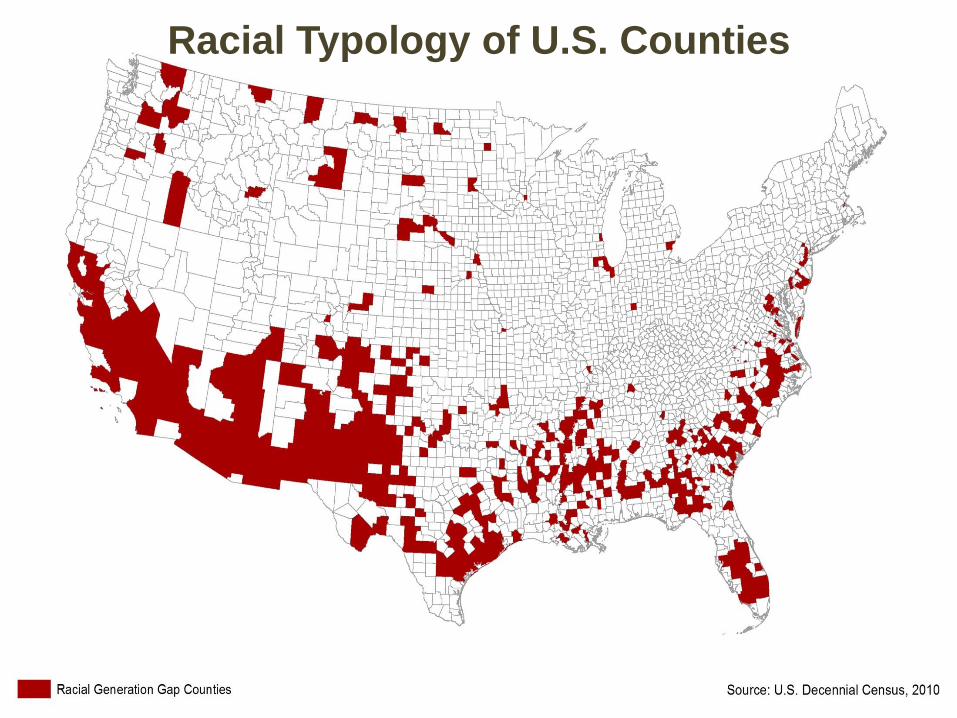
Racial Typology of U.S. Counties
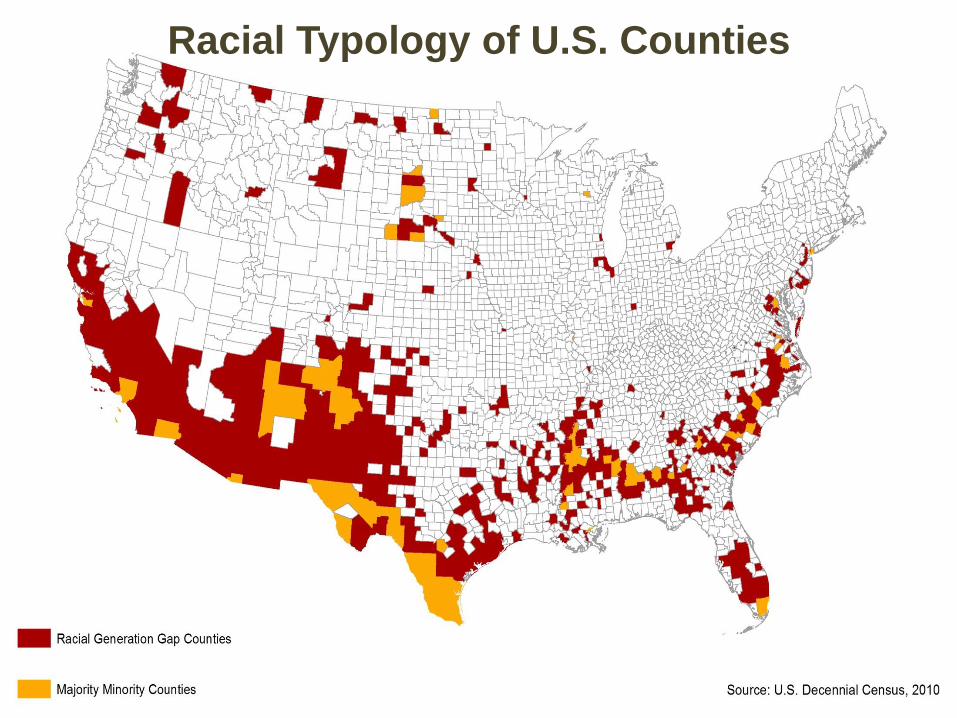
Racial Typology of U.S. Counties
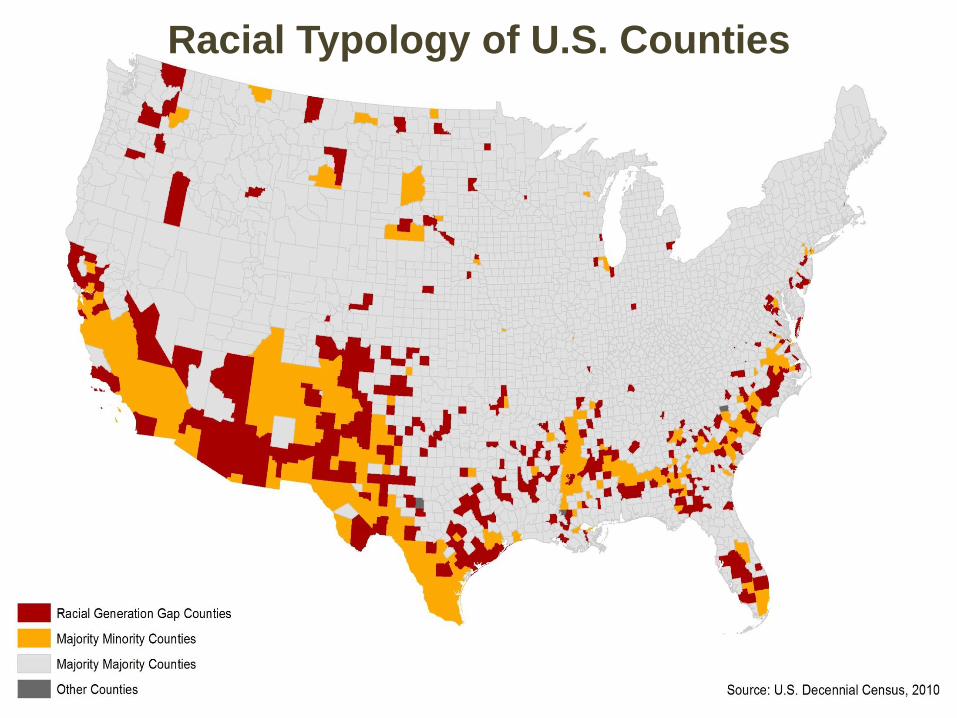
Racial Typology of U.S. Counties
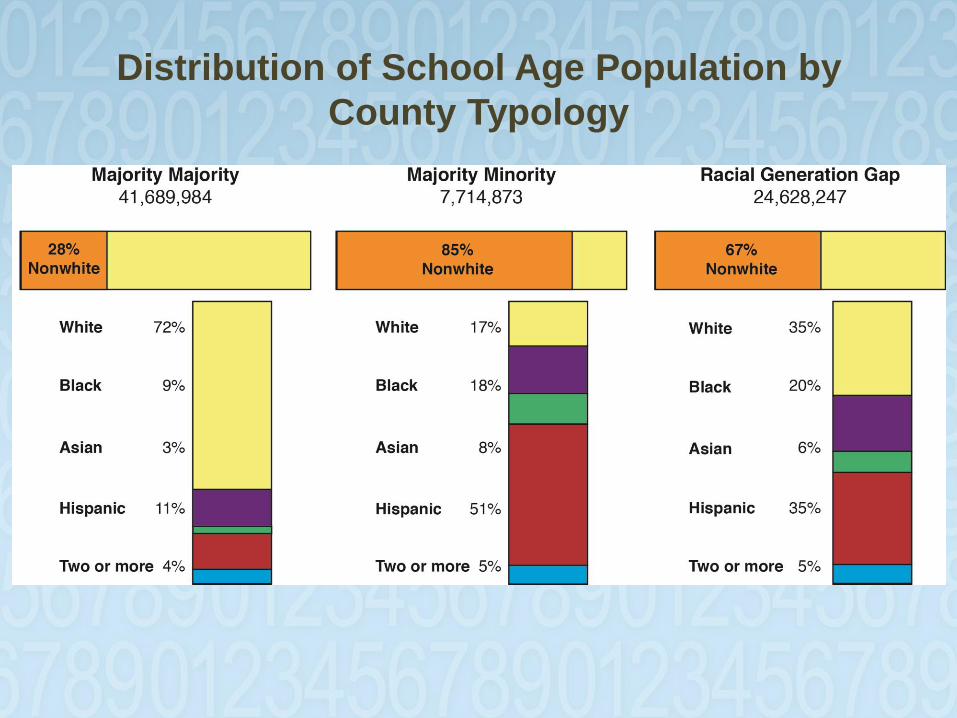
Distribution of School Age Population by
County Typology
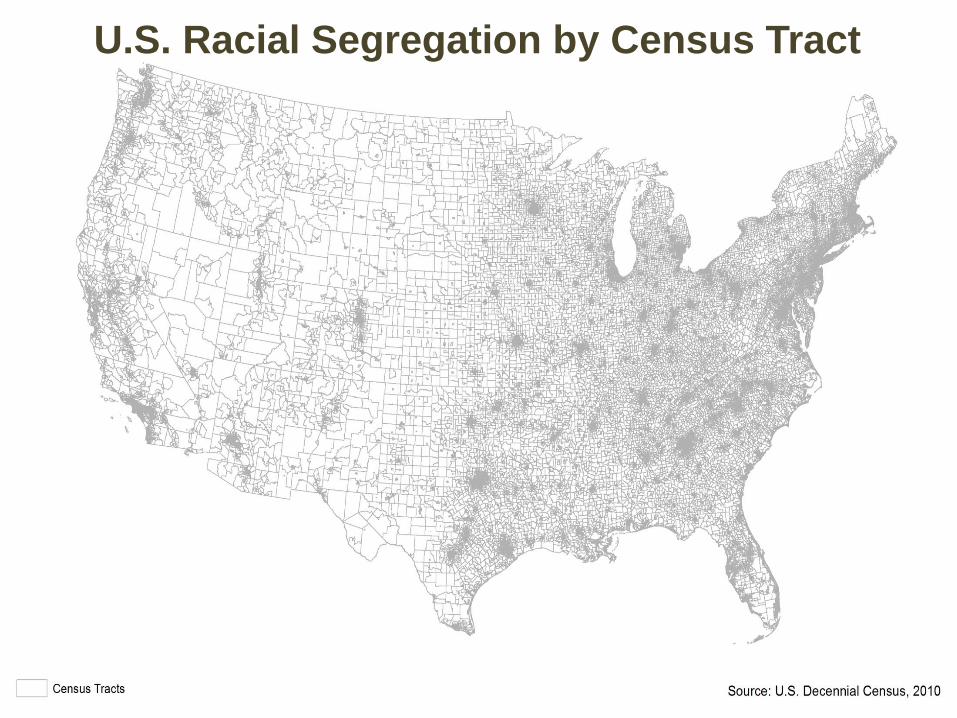
U.S. Racial Segregation by Census Tract
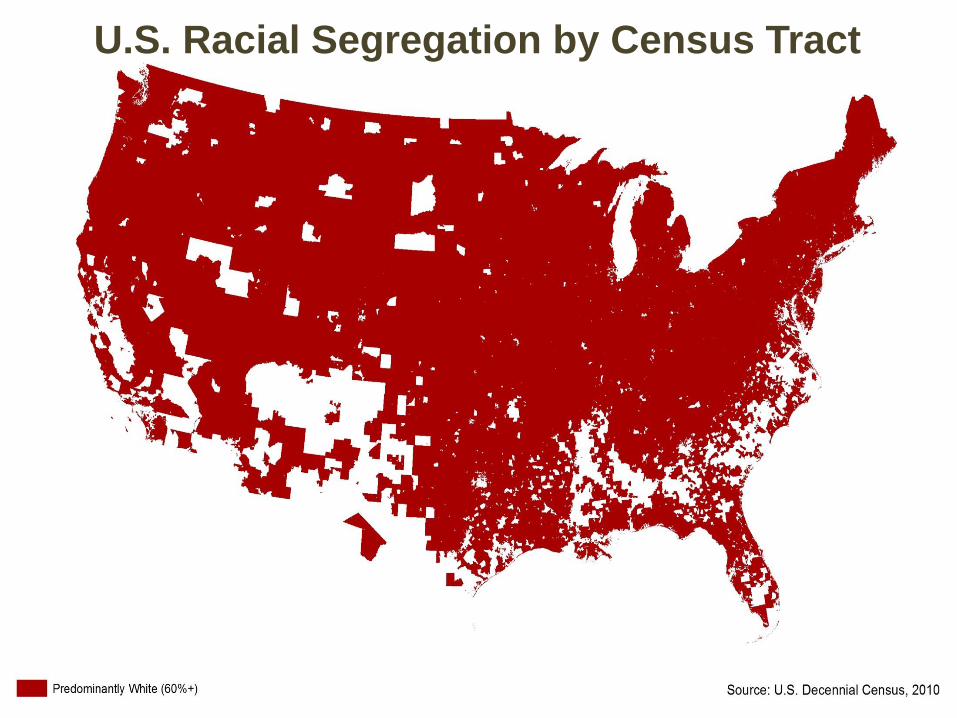
U.S. Racial Segregation by Census Tract
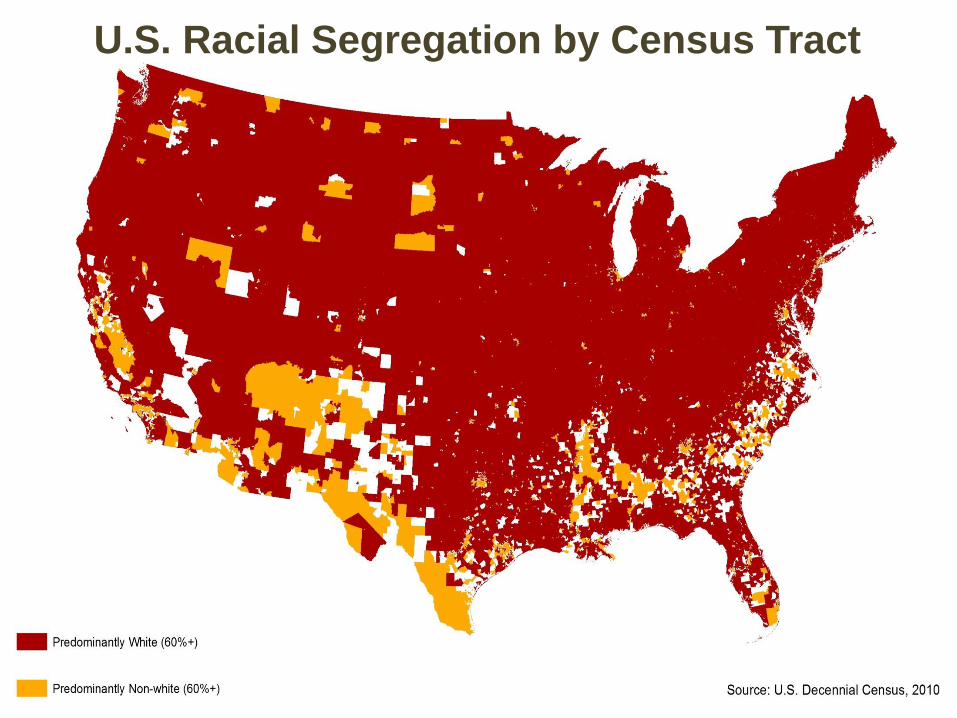
U.S. Racial Segregation by Census Tract
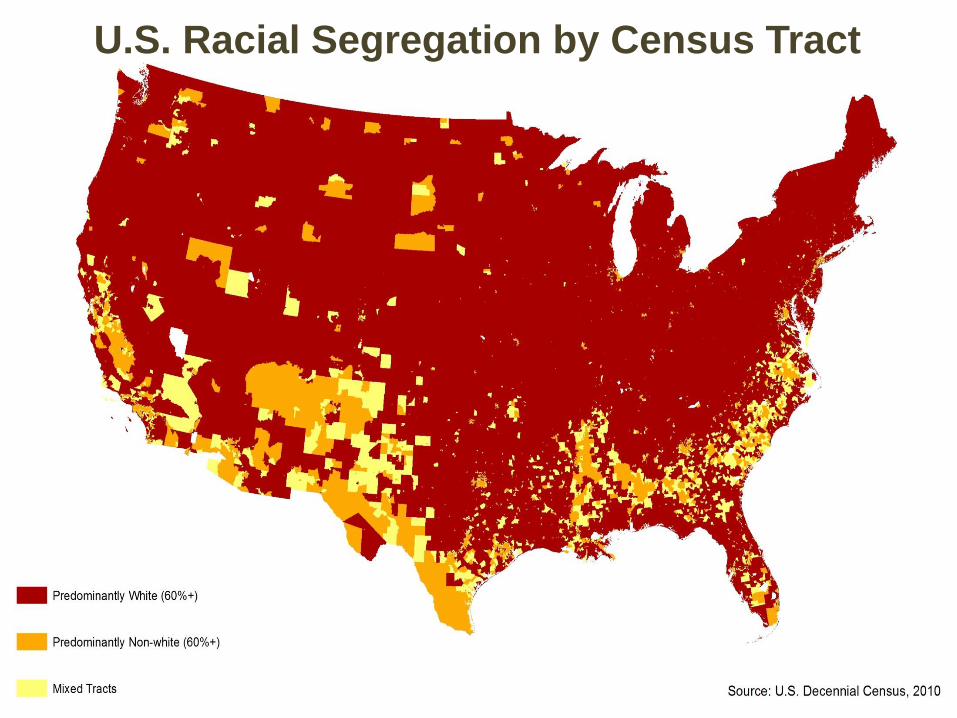
U.S. Racial Segregation by Census Tract
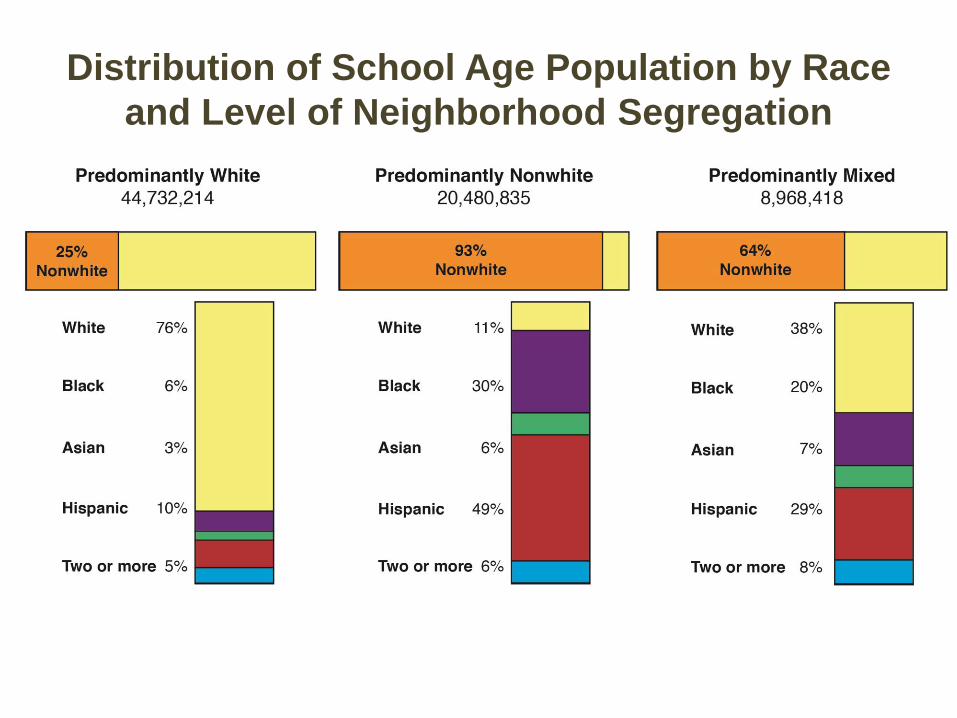
Distribution of School Age Population by Race
and Level of Neighborhood Segregation
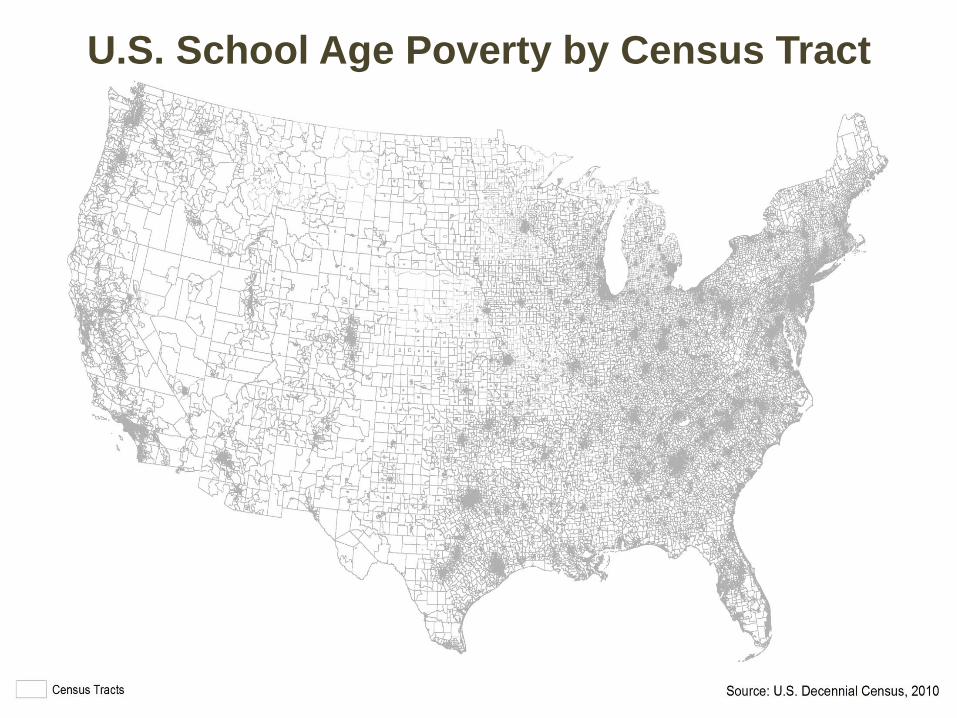
U.S. School Age Poverty by Census Tract
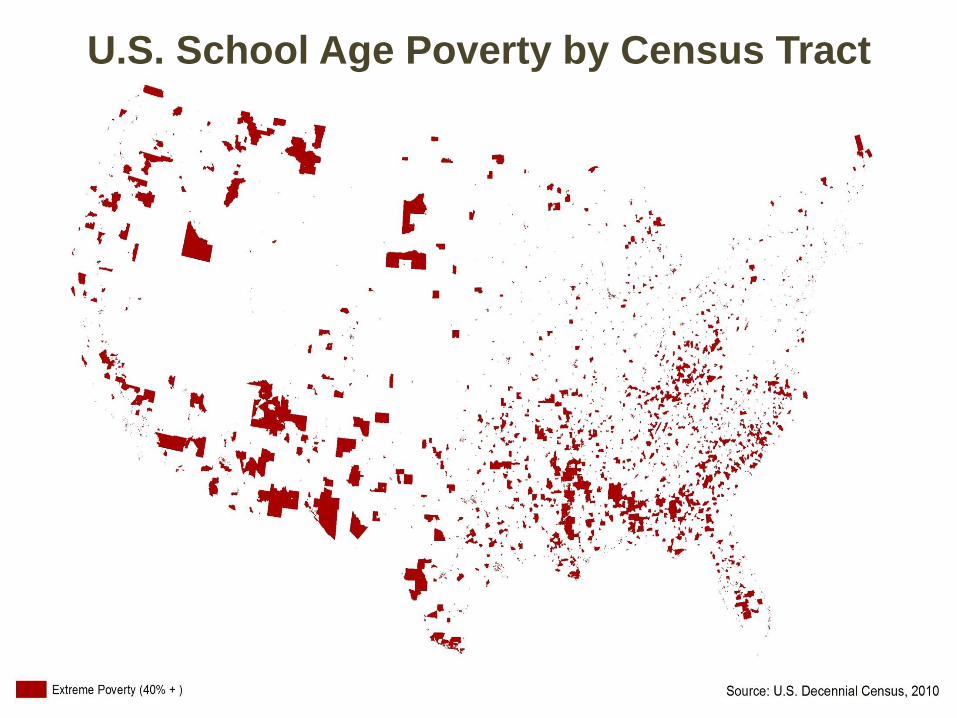
U.S. School Age Poverty by Census Tract
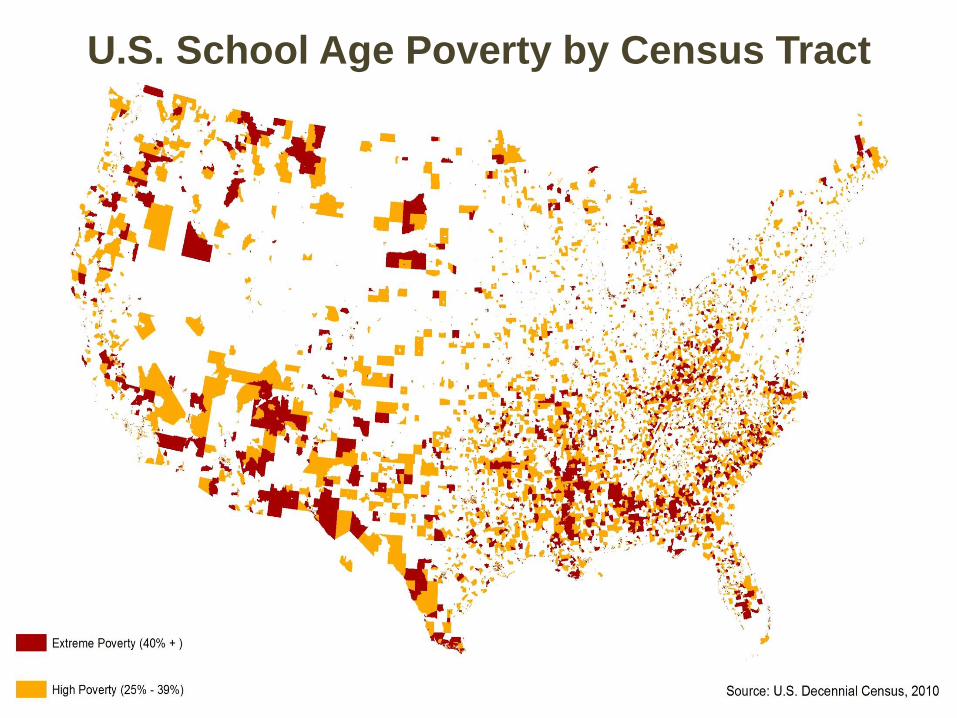
U.S. School Age Poverty by Census Tract
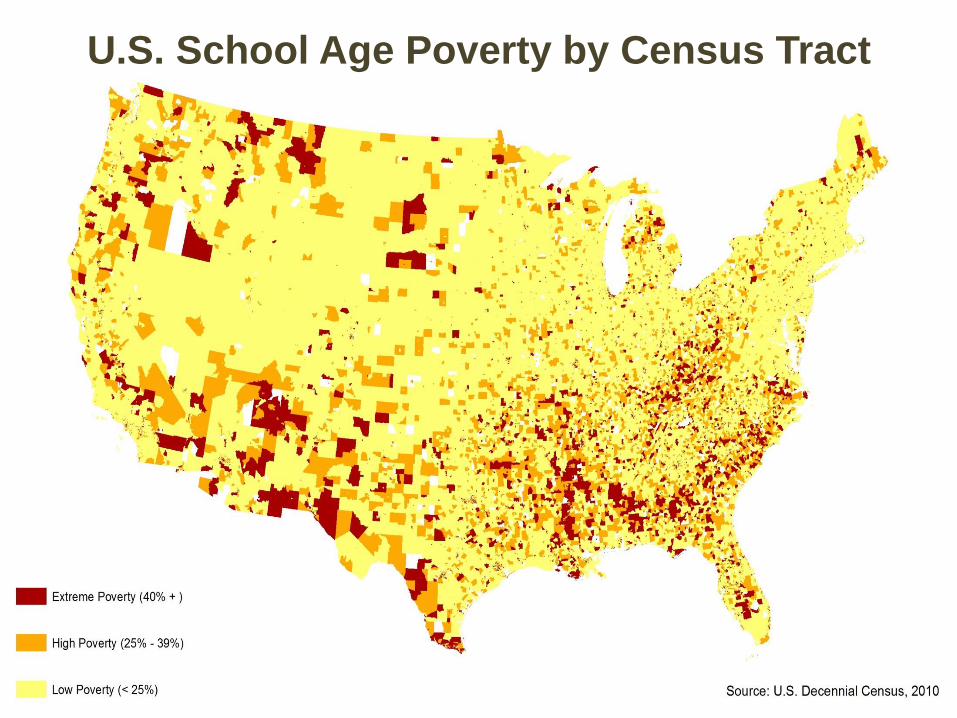
U.S. School Age Poverty by Census Tract
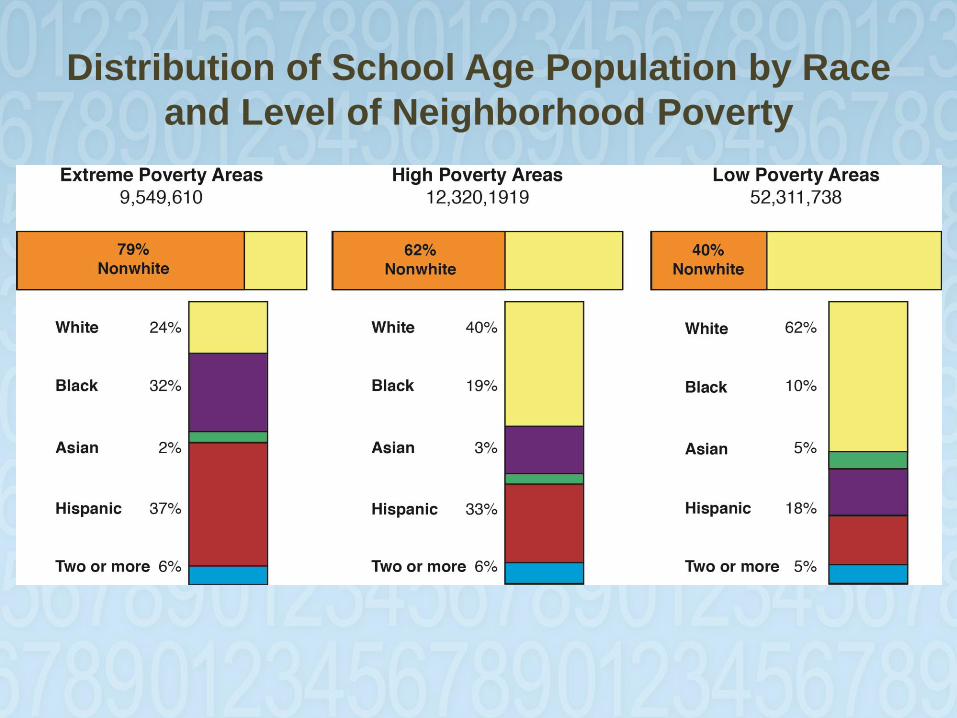
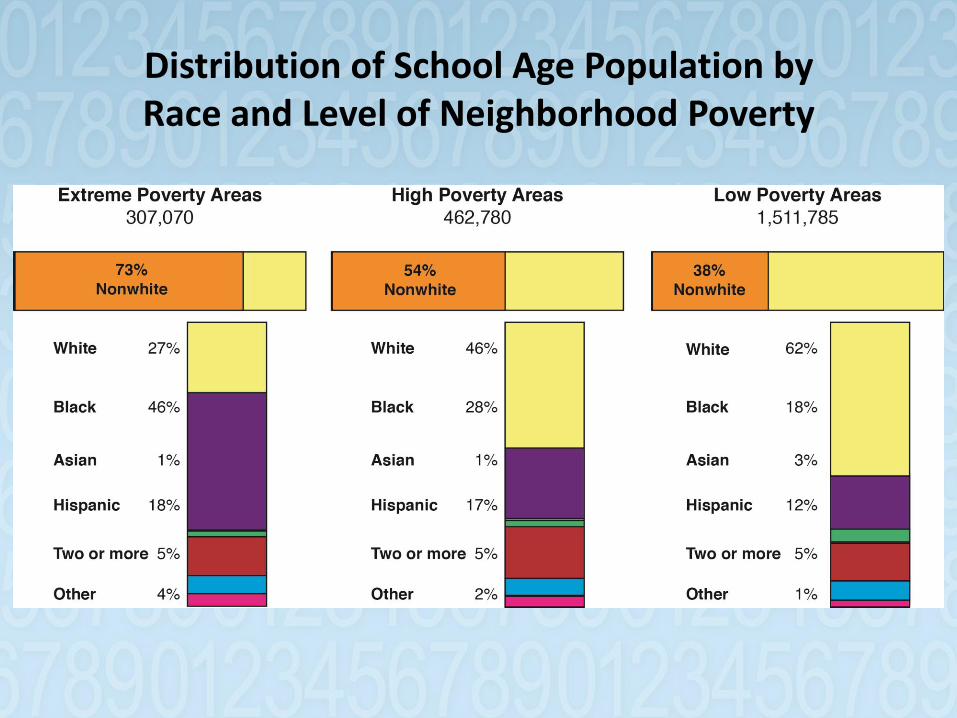
Distribution of School Age Population by Race
and Level of Neighborhood Poverty
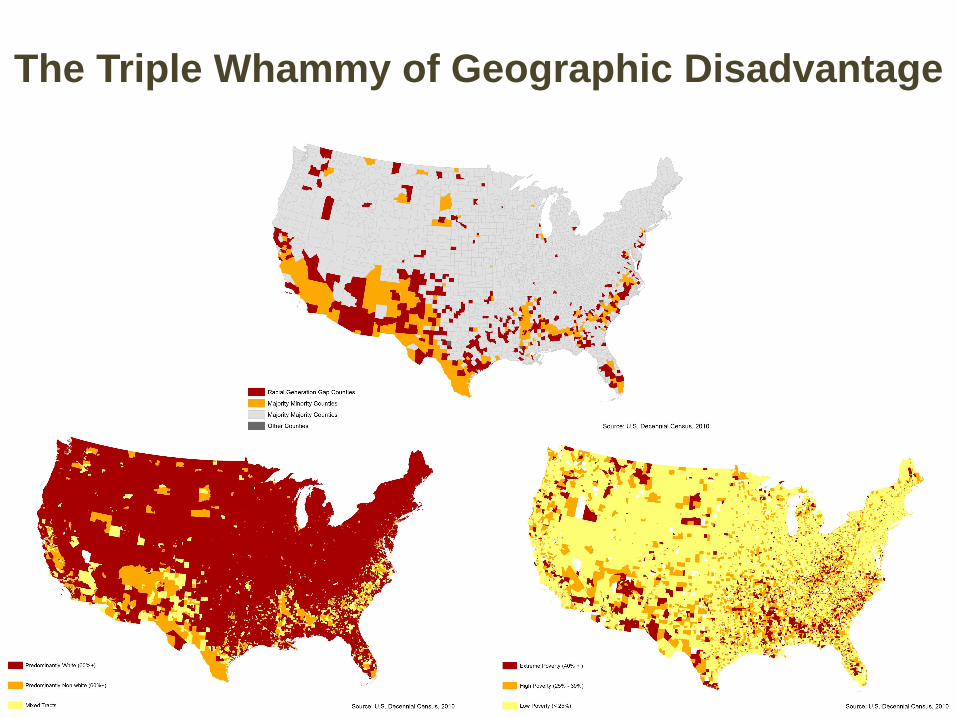
The Triple Whammy of Geographic Disadvantage
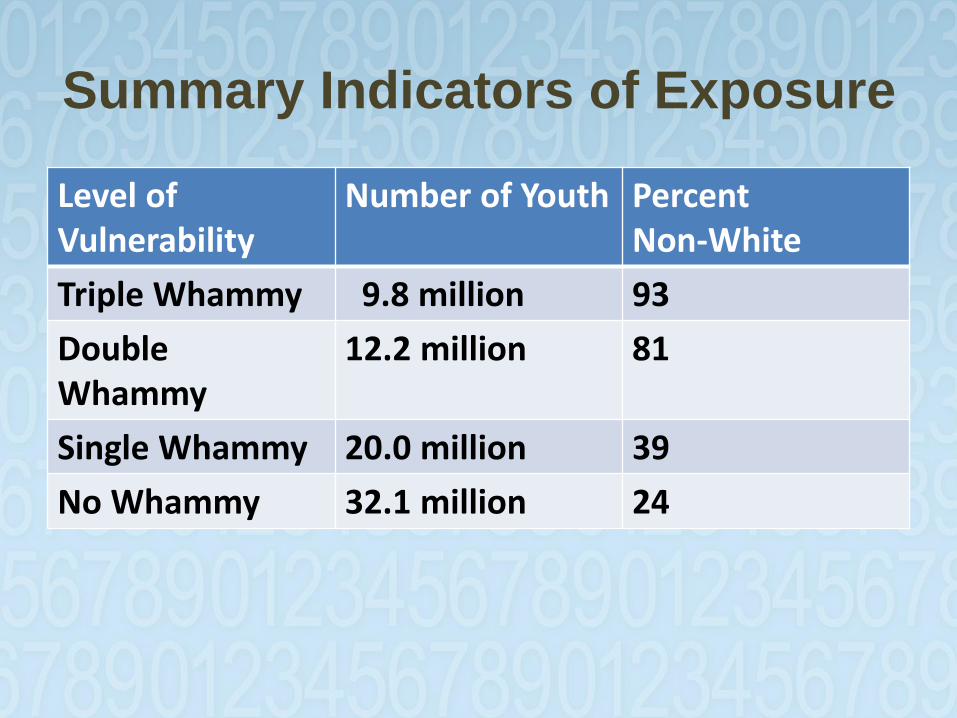
Summary Indicators of Exposure
Level of Vulnerability
Number of Youth Percent Non-White
Triple Whammy 9.8 million 93
Double Whammy
12.2 million 81
Single Whammy 20.0 million 39
No Whammy 32.1 million 24

NC’s Triple Whammy of
Geographical Disadvantage
The Human Capital Challenge
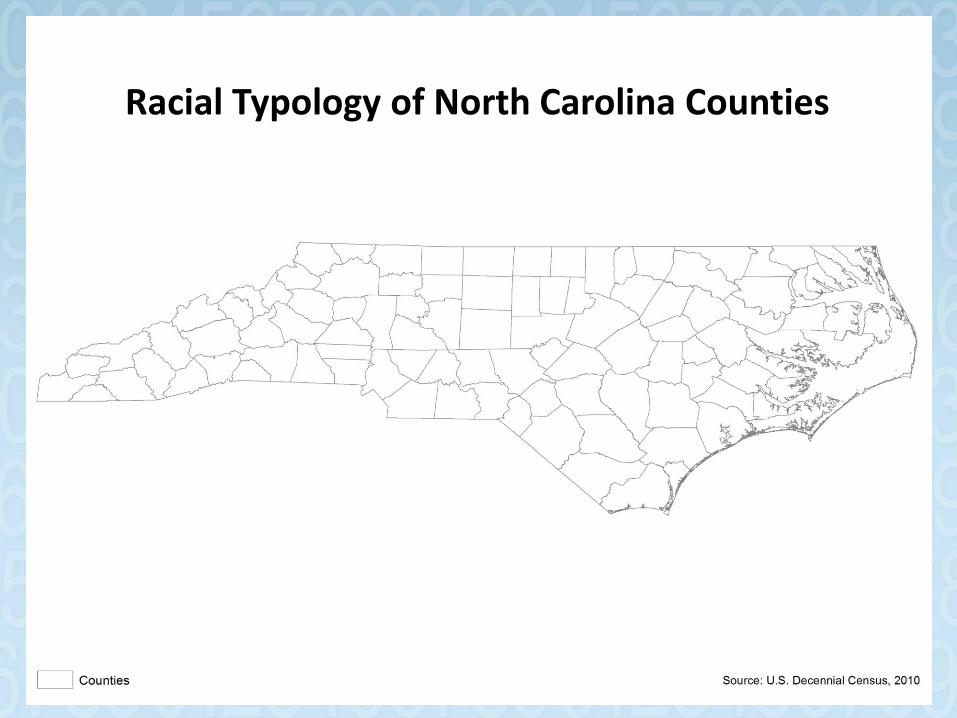
Racial Typology of North Carolina Counties
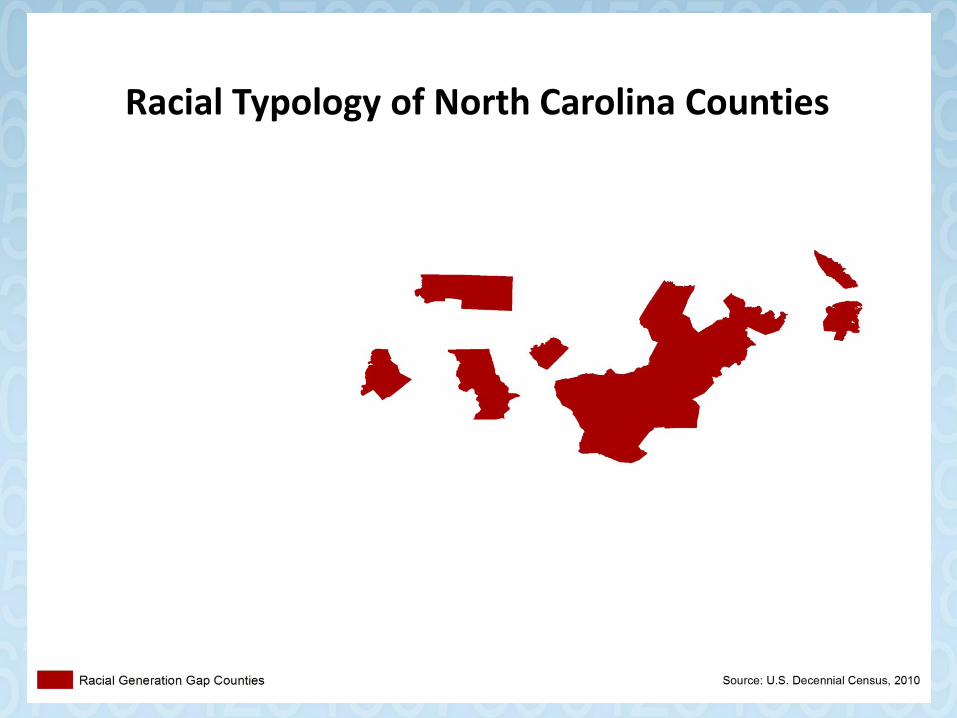
Racial Typology of North Carolina Counties
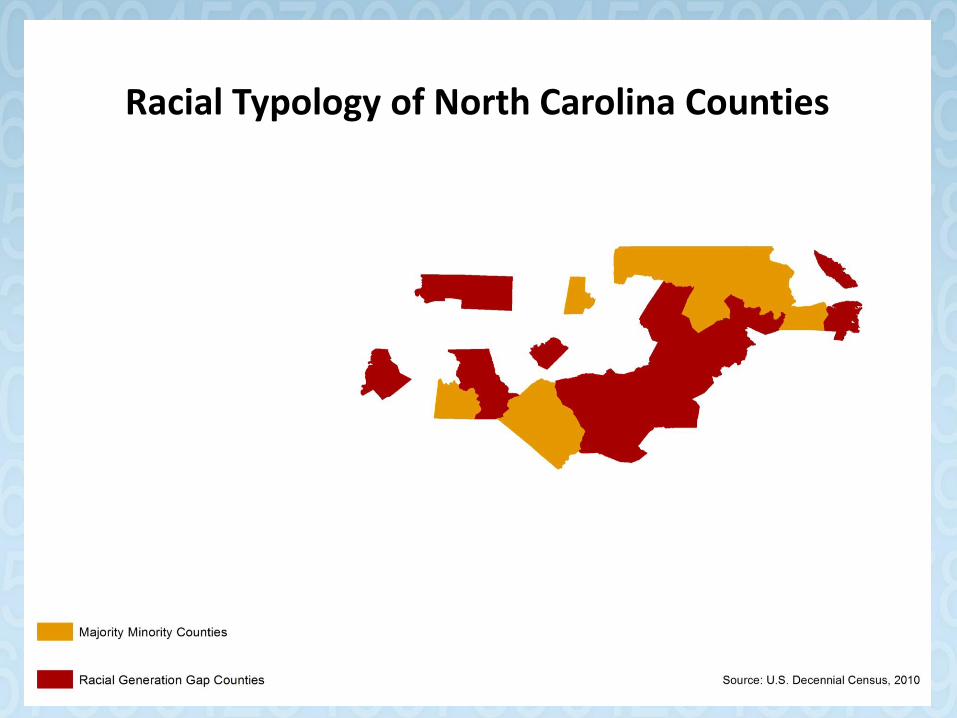
Racial Typology of North Carolina Counties
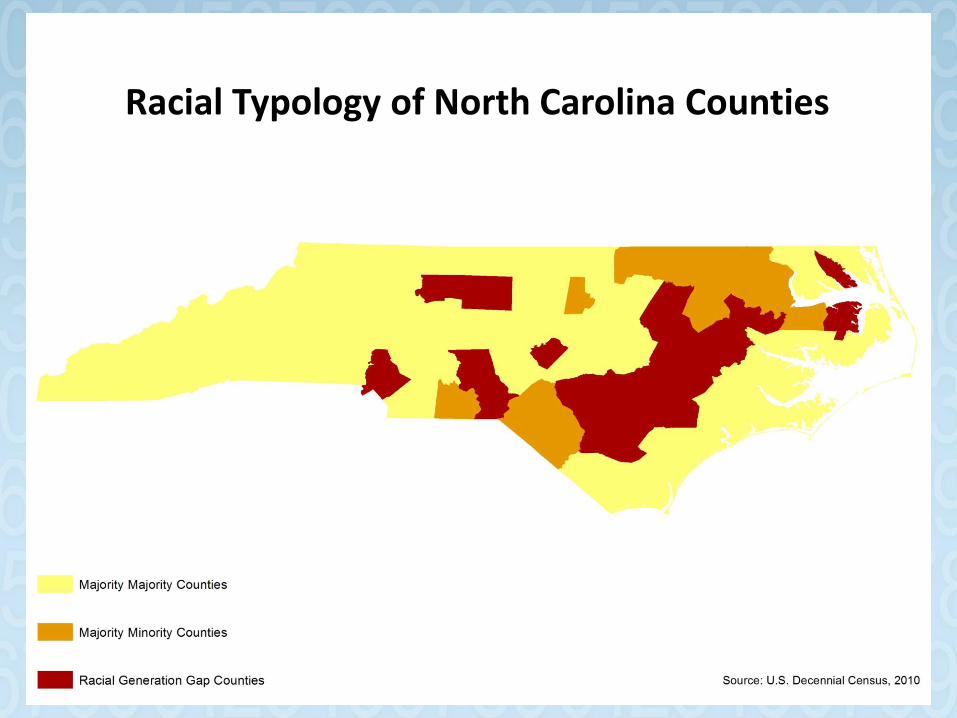
Racial Typology of North Carolina Counties
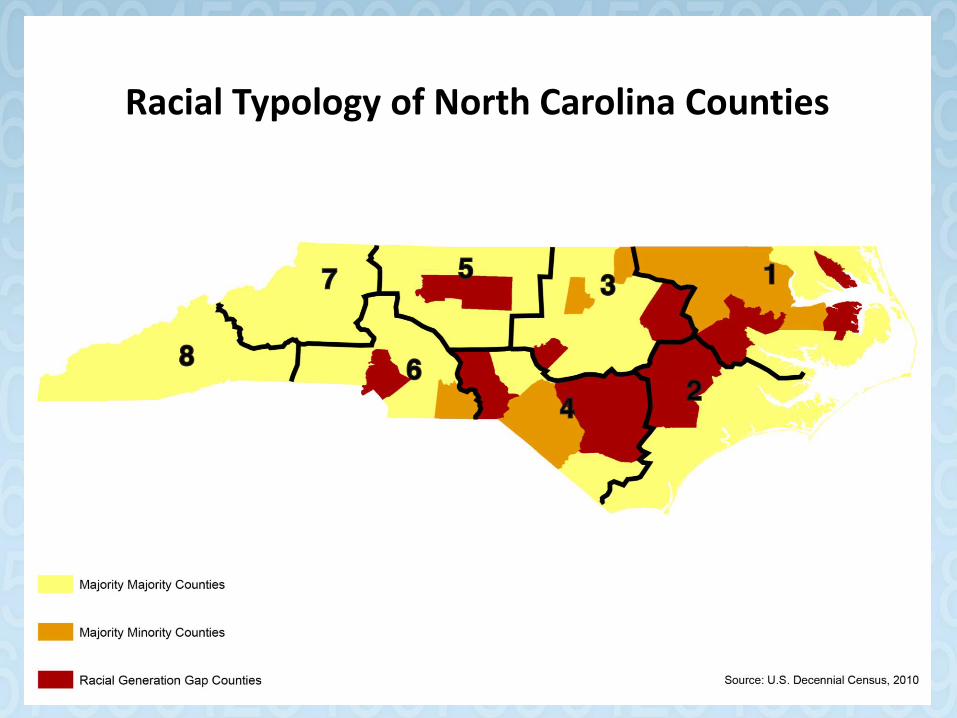
Racial Typology of North Carolina Counties
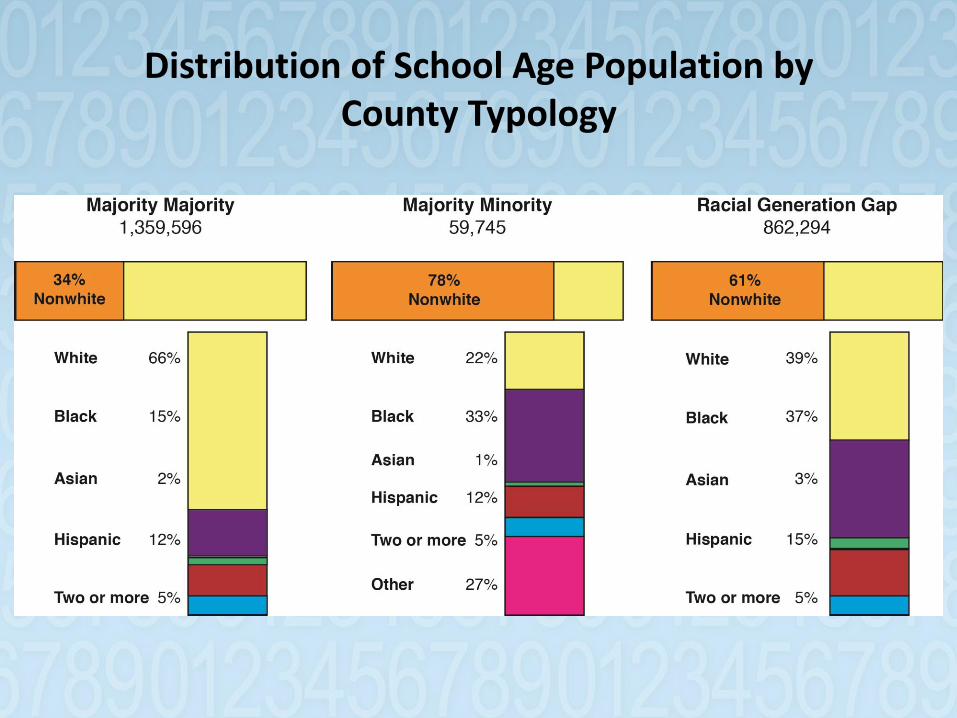
Distribution of School Age Population by County Typology
North Carolina Racial Segregation by Census Tract
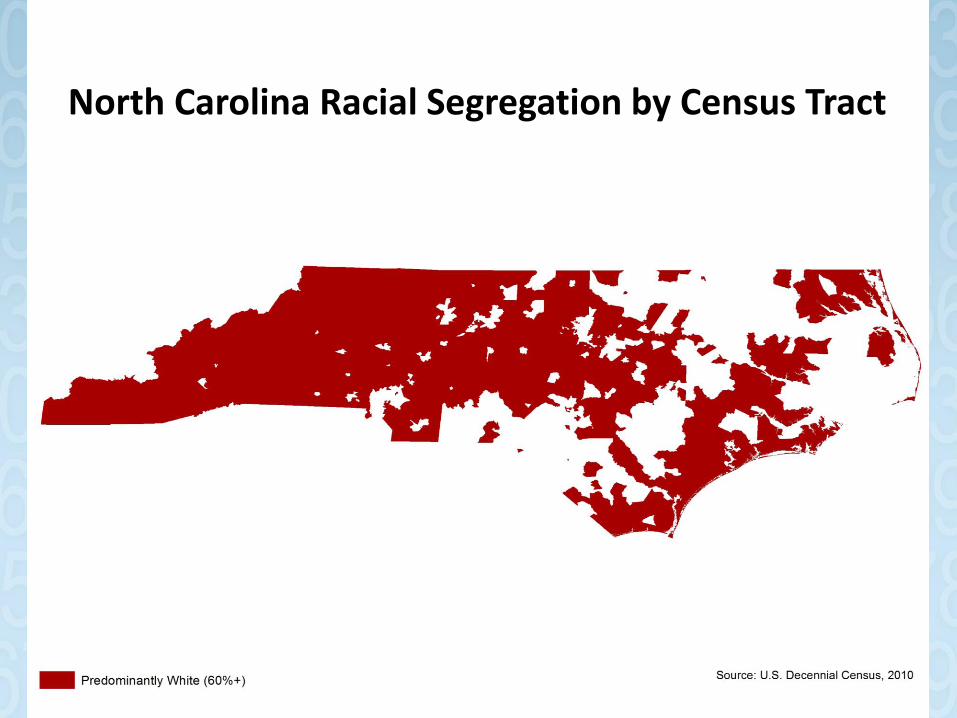
North Carolina Racial Segregation by Census Tract
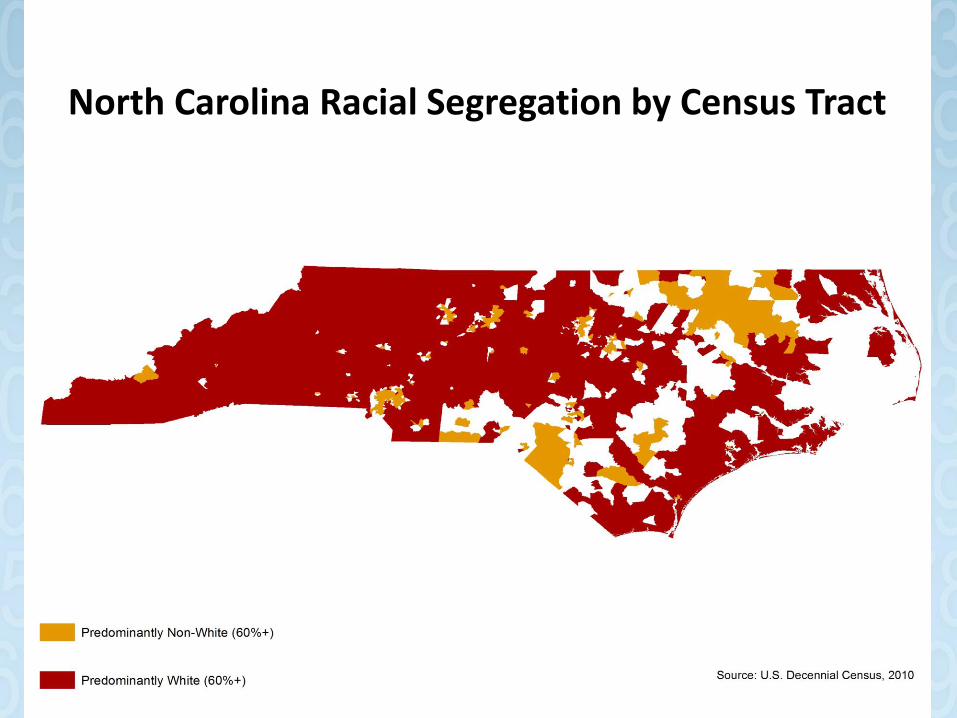
North Carolina Racial Segregation by Census Tract
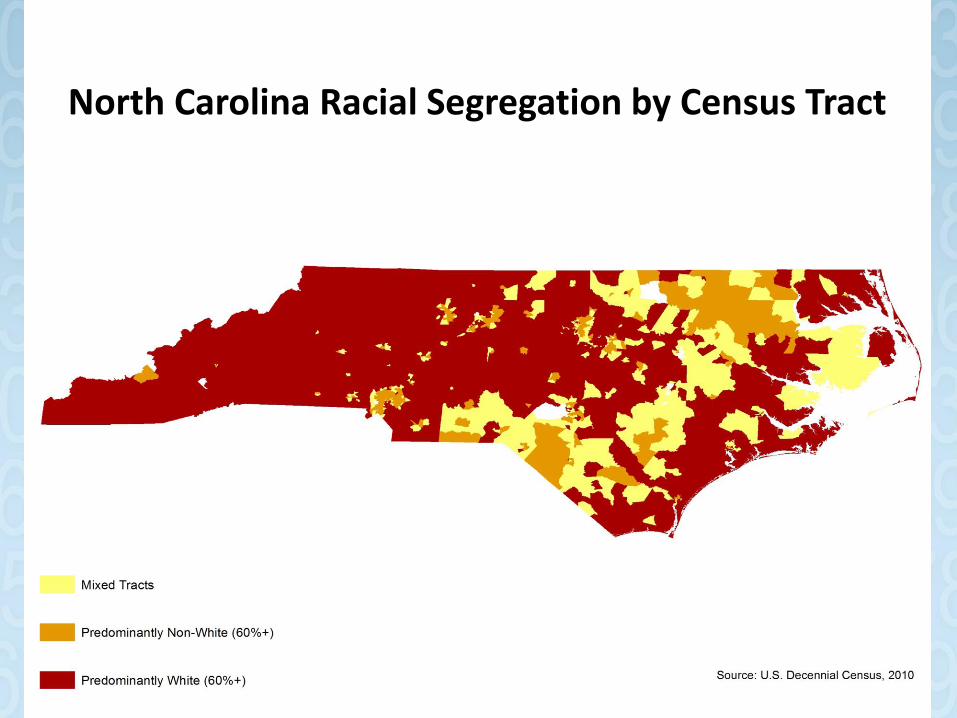
North Carolina Racial Segregation by Census Tract
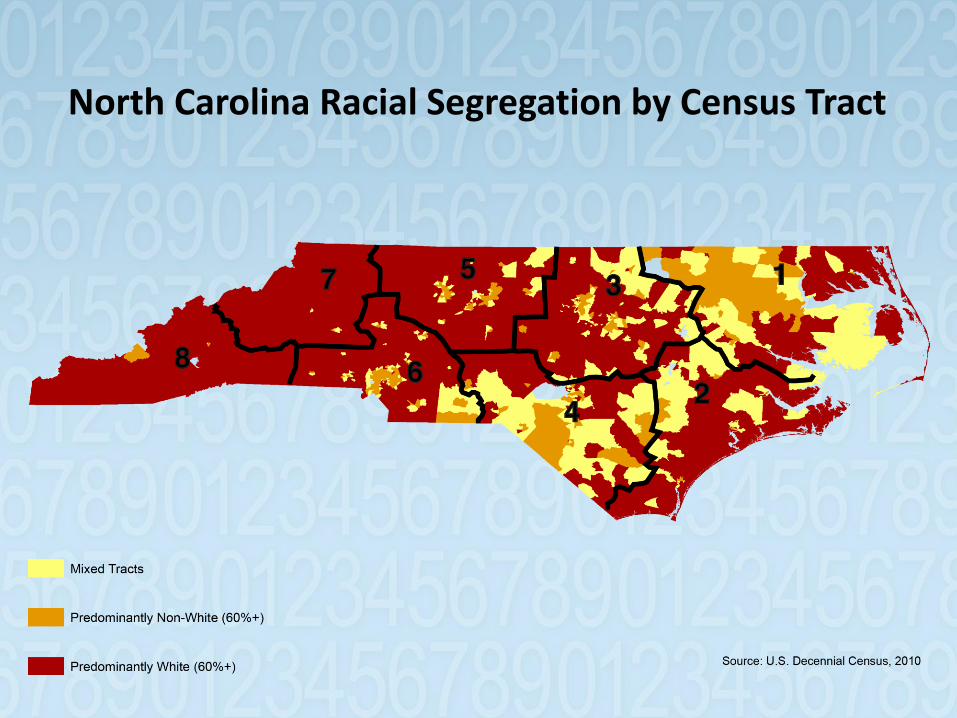
North Carolina Racial Segregation by Census Tract
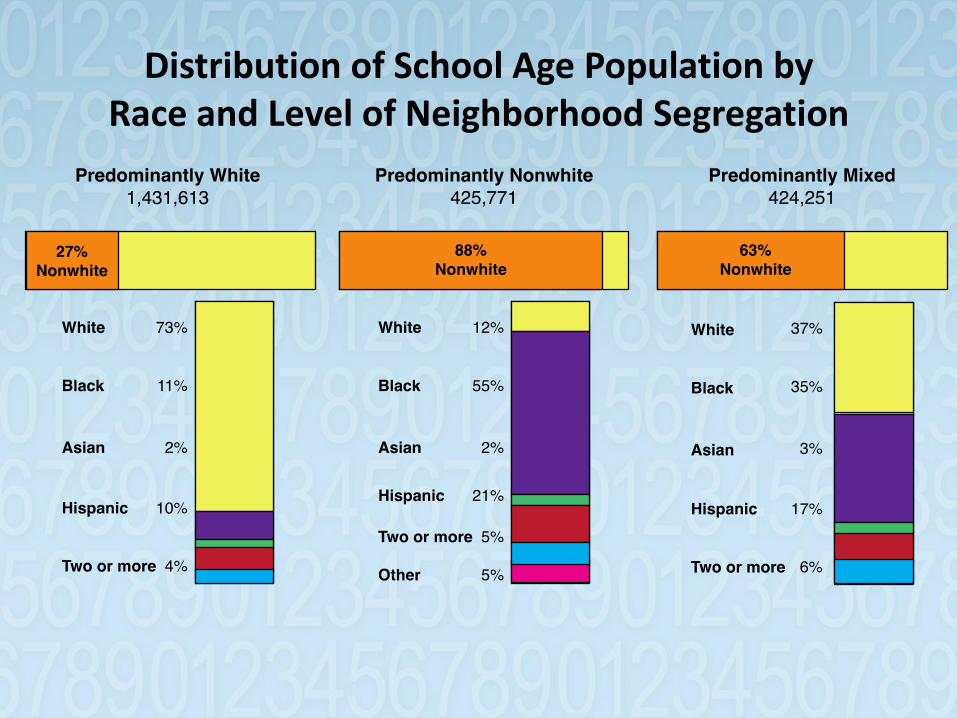
Distribution of School Age Population by Race and Level of Neighborhood Segregation
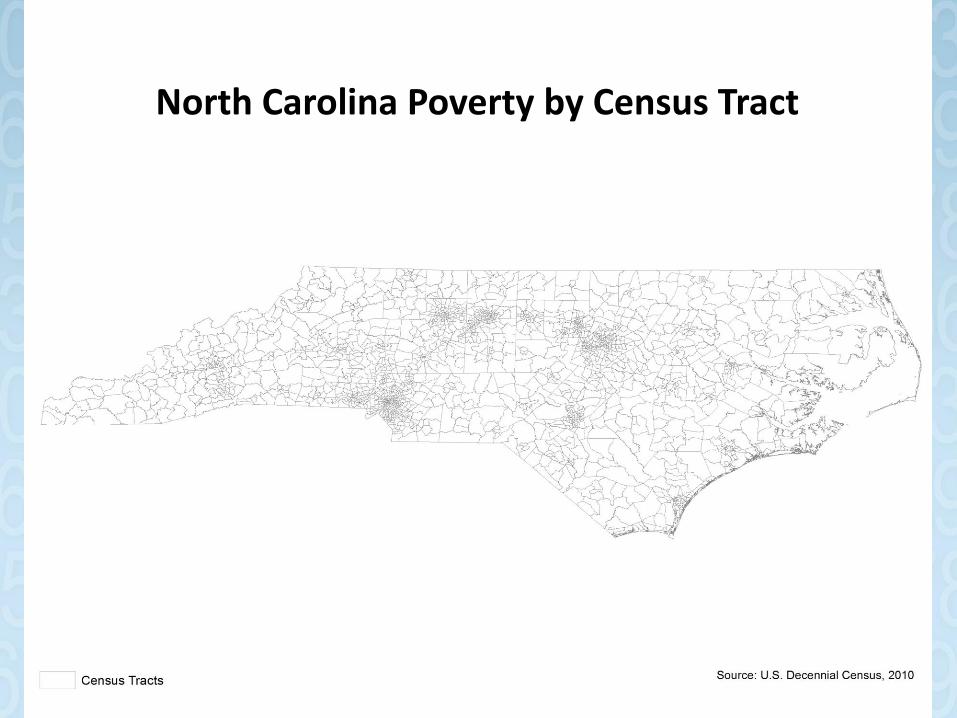
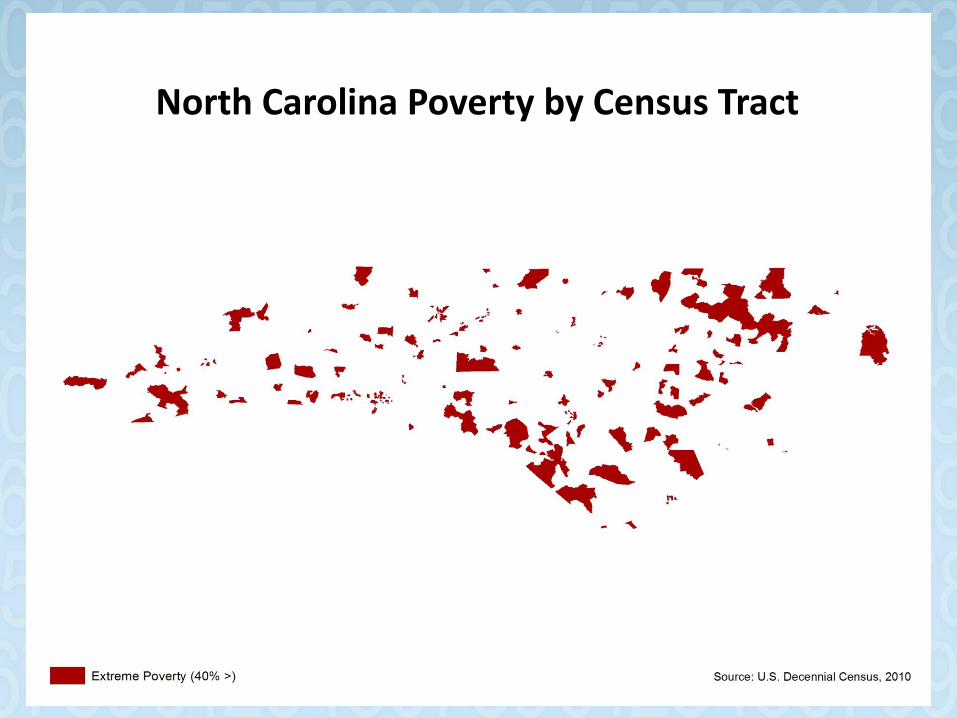
North Carolina Poverty by Census Tract
North Carolina Poverty by Census Tract
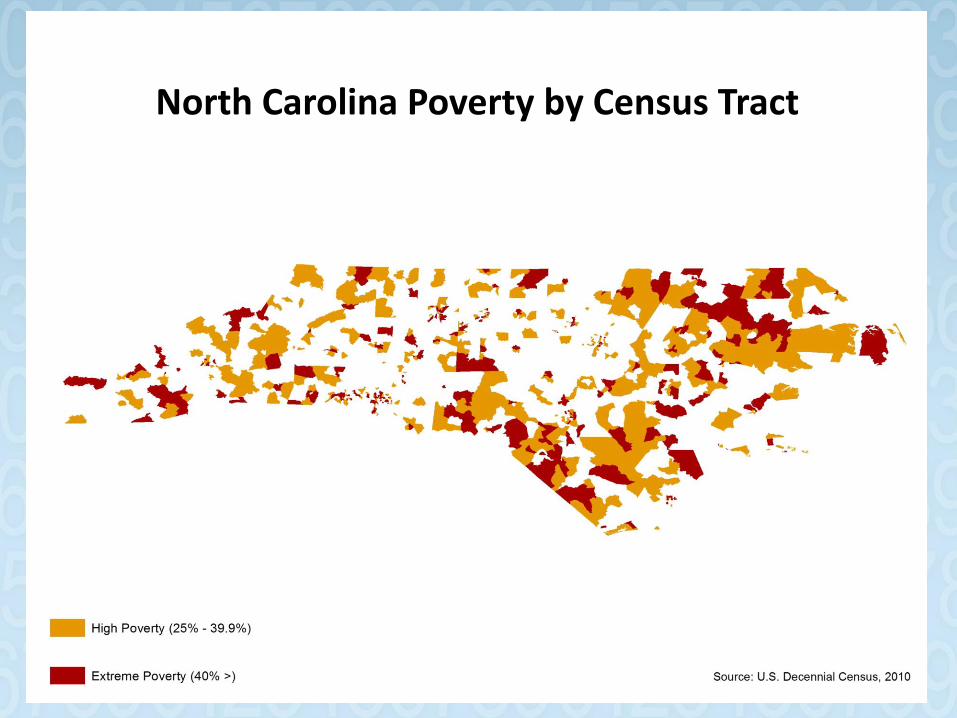
North Carolina Poverty by Census Tract
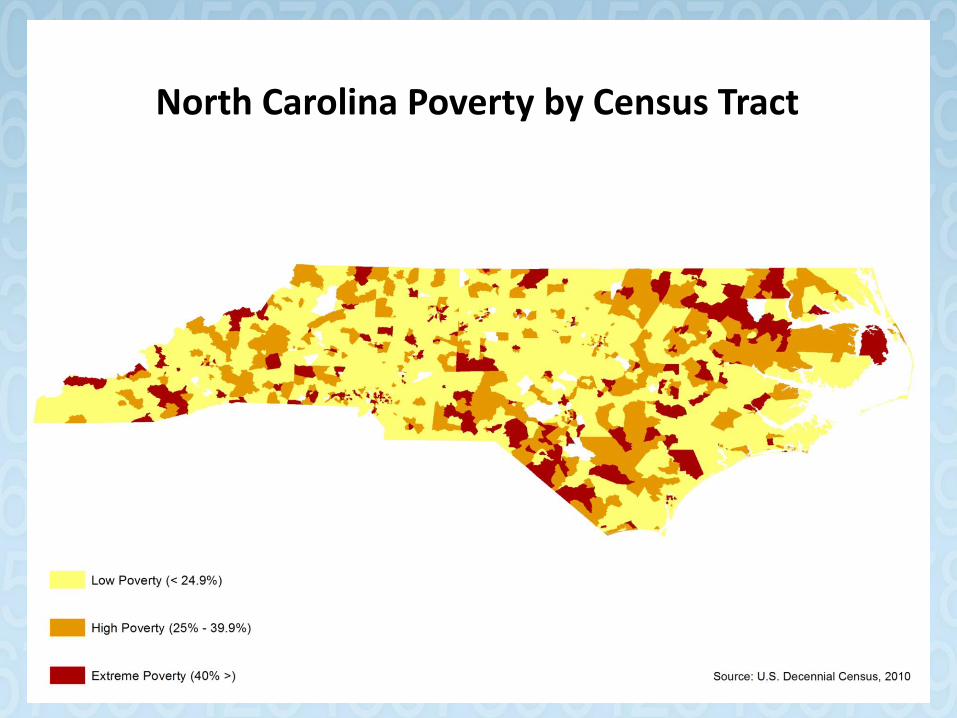
North Carolina Poverty by Census Tract
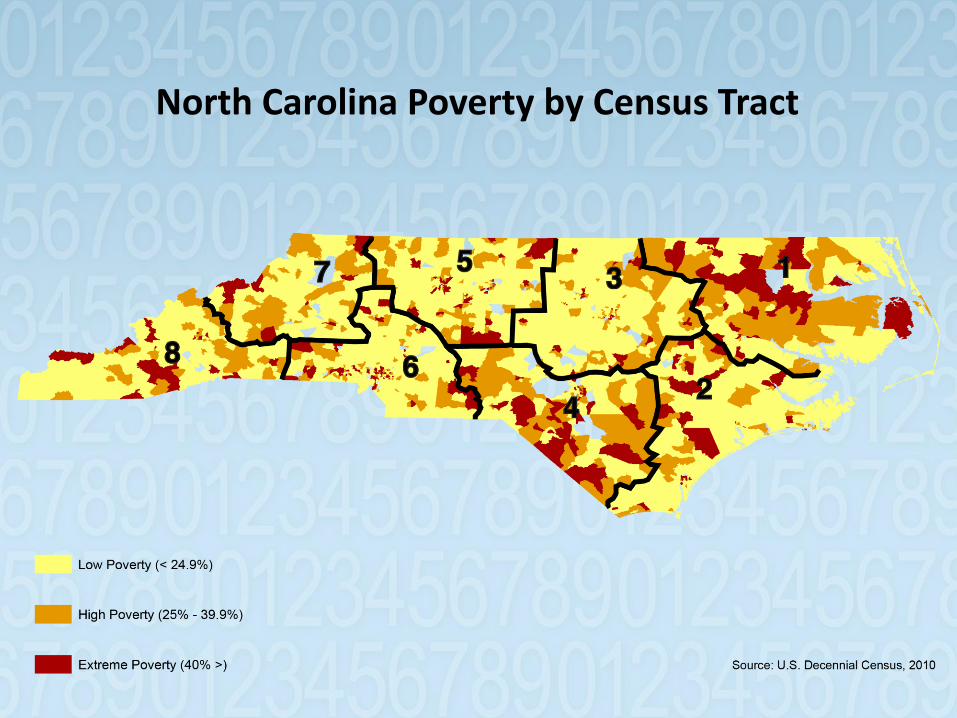
North Carolina Poverty by Census Tract
Distribution of School Age Population by Race and Level of Neighborhood Poverty
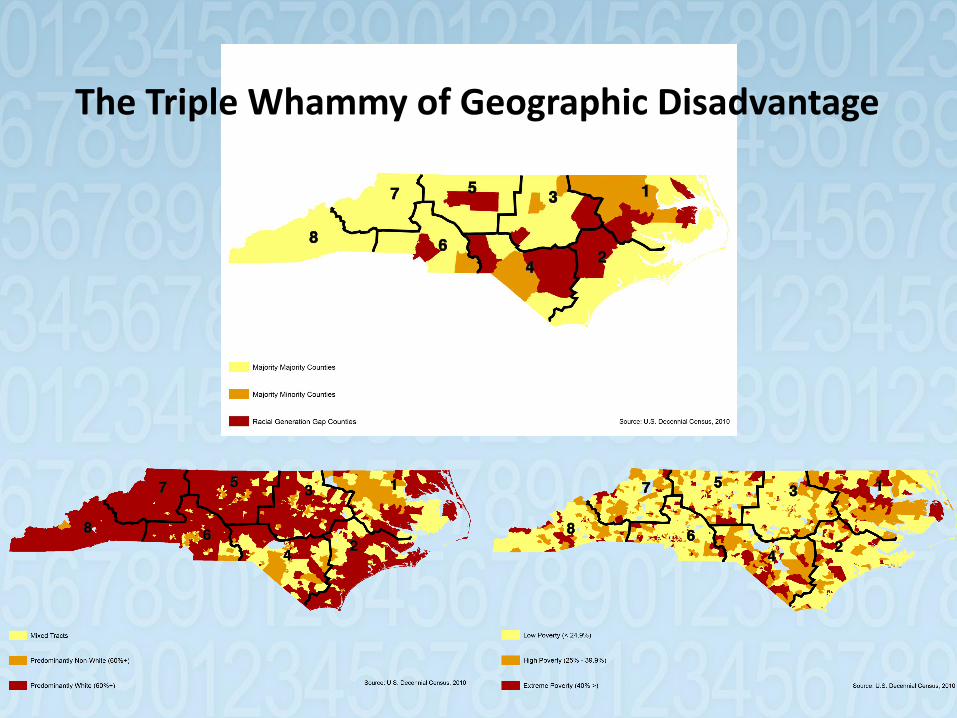
The Triple Whammy of Geographic Disadvantage
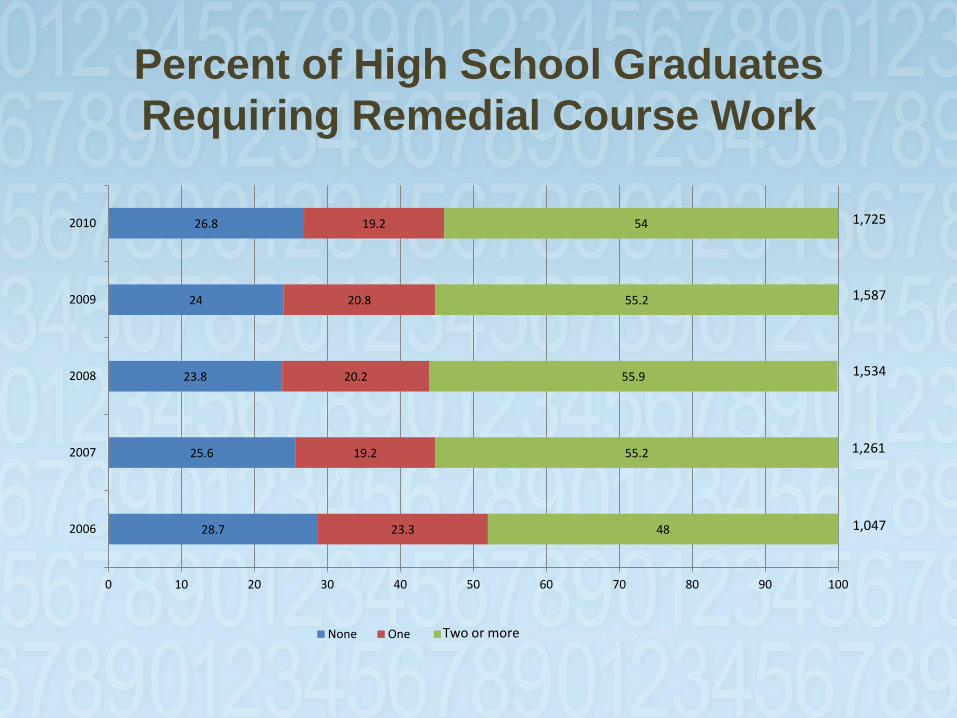
Percent of High School Graduates
Requiring Remedial Course Work
28.7
25.6
23.8
24
26.8
23.3
19.2
20.2
20.8
19.2
48
55.2
55.9
55.2
54
0 10 20 30 40 50 60 70 80 90 100
2006
2007
2008
2009
2010
None One Two or MoreHS GradsPercent of HS Grads
1,047
1,725
1,587
1,534
1,261
Two or more

...but insufficient
Education is Necessary
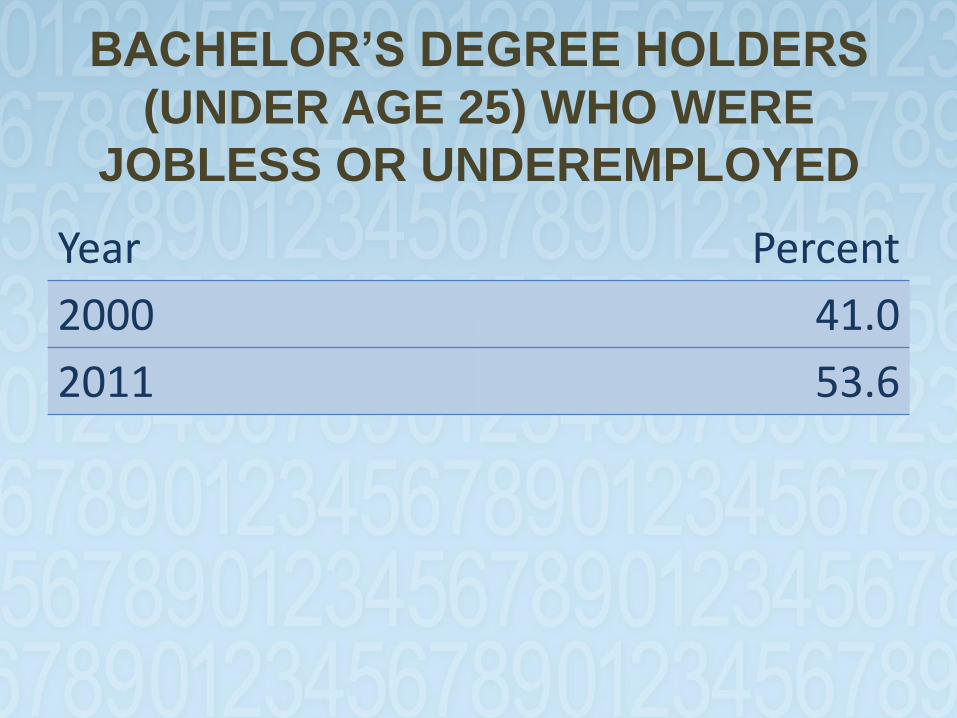
BACHELOR’S DEGREE HOLDERS
(UNDER AGE 25) WHO WERE
JOBLESS OR UNDEREMPLOYED
Year Percent
2000 41.0
2011 53.6
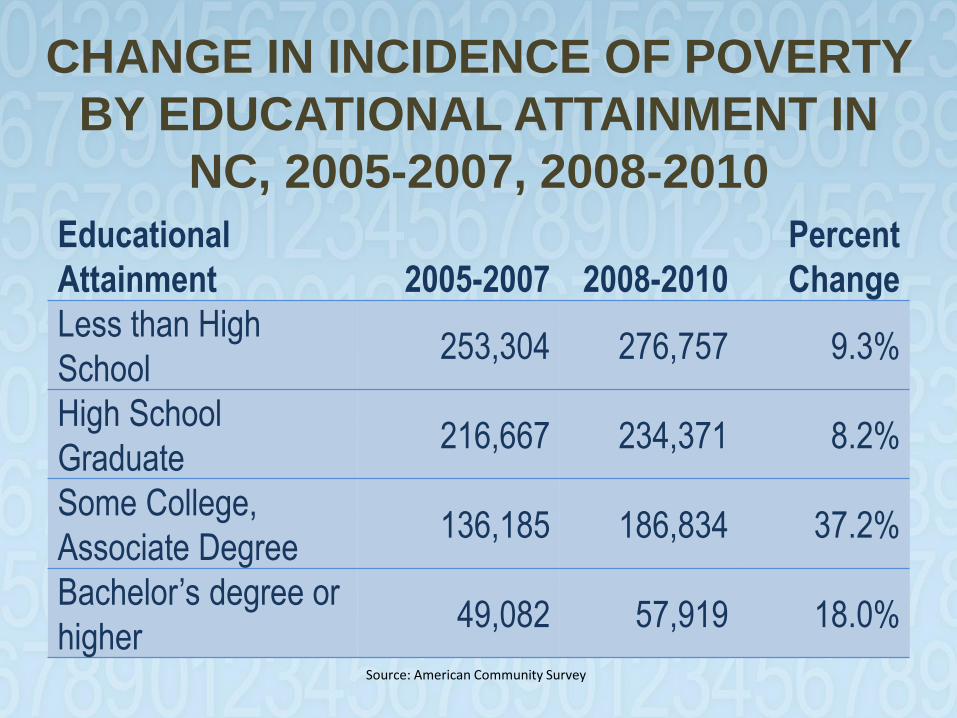
CHANGE IN INCIDENCE OF POVERTY
BY EDUCATIONAL ATTAINMENT IN
NC, 2005-2007, 2008-2010
Educational
Attainment 2005-2007 2008-2010
Percent
Change
Less than High
School 253,304 276,757 9.3%
High School
Graduate 216,667 234,371 8.2%
Some College,
Associate Degree 136,185 186,834 37.2%
Bachelor’s degree or
higher 49,082 57,919 18.0%
Source: American Community Survey
THE COMPETITIVE TOOL KIT
• Analytical Reasoning
• Entrepreneurial Acumen
• Contextual Intelligence
• Soft Skills/Cultural Elasticity
• Agility and Flexibility
Responding to the
Crisis
Leveraging the Power of Collective Ambition!
Collective Ambition
• Supersedes individual goals and aspirations.
• Takes into account the key elements required to achieve and sustain excellence at the organizational & community levels.
• Provides a framework that paves the way for successful organizational & community change.
October 2012
FOUNDATIONS OF COLLECTIVE
AMBITION
• Collaborative Engagement (glue)
• Disciplined Execution of Strategy (grease)
Collaborative Engagement
• Making sure everybody is on the bus, in the right seat, headed in the right direction.
• Convincing aging empty nesters that they do have a dog in the K-12 education fight.
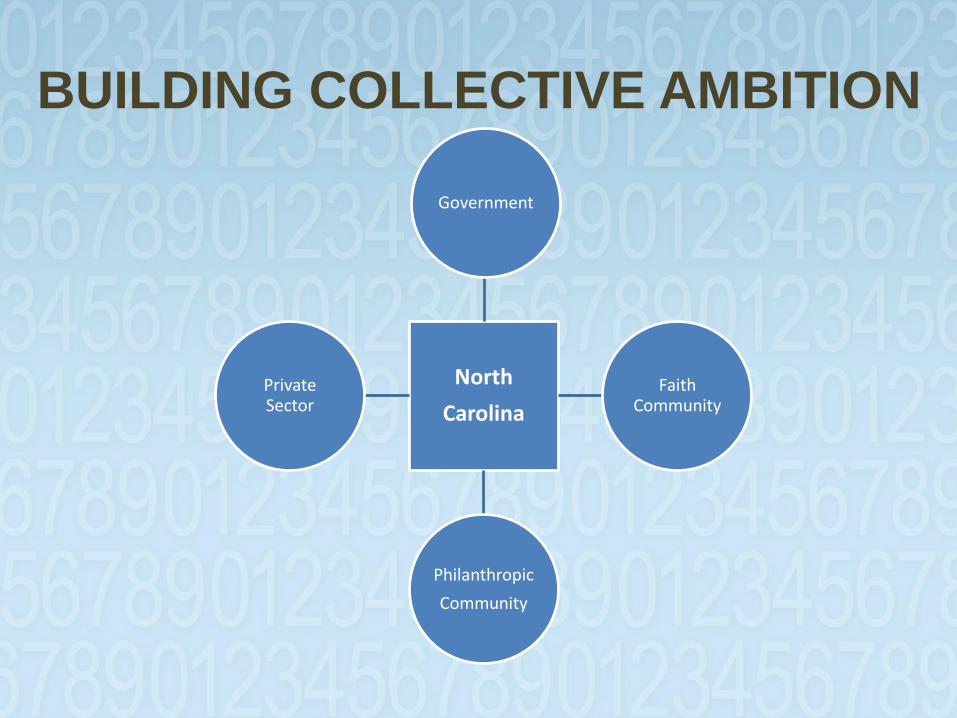
BUILDING COLLECTIVE AMBITION
North
Carolina
Government
Faith Community
Philanthropic
Community
Private Sector
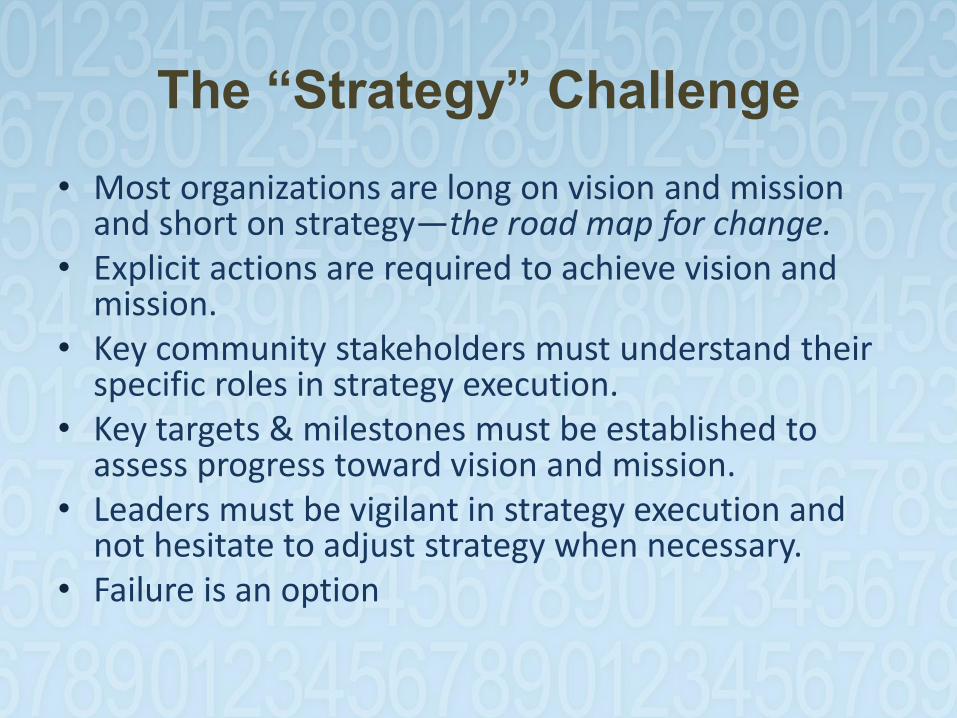
The “Strategy” Challenge
• Most organizations are long on vision and mission and short on strategy—the road map for change.
• Explicit actions are required to achieve vision and mission.
• Key community stakeholders must understand their specific roles in strategy execution.
• Key targets & milestones must be established to assess progress toward vision and mission.
• Leaders must be vigilant in strategy execution and not hesitate to adjust strategy when necessary.
• Failure is an option

Postscript
• We must view solving The Triple Whammy of Geographic Disadvantage conundrum as a form of enlightened self-interest—a strategic imperative for our communities and our nation in the hyper-competitive global economy of the 21st century.
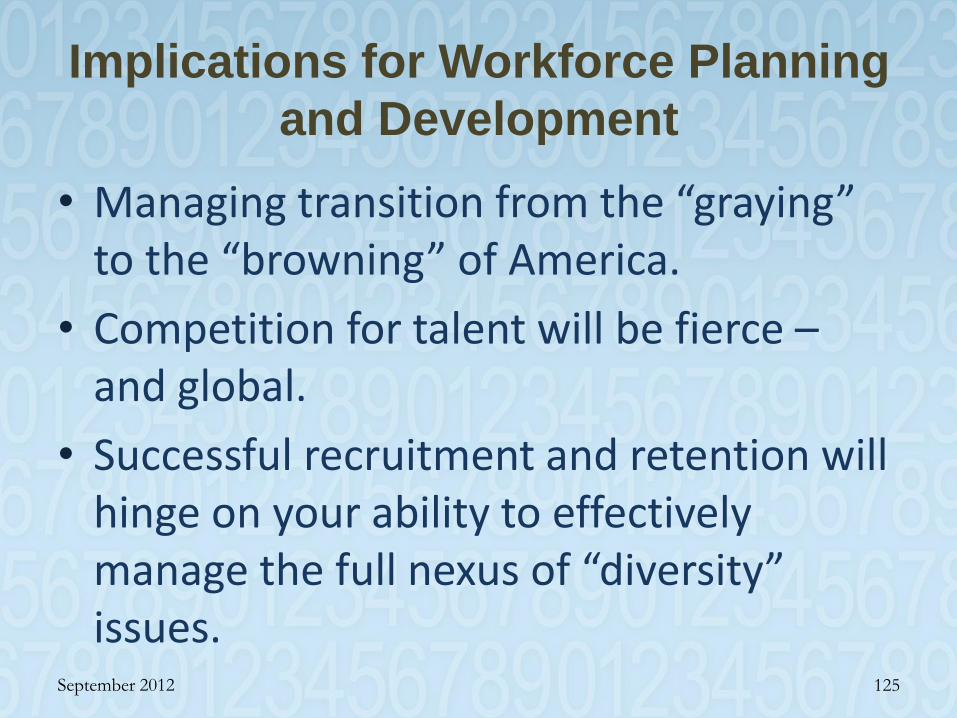
Implications for Workforce Planning
and Development
• Managing transition from the “graying” to the “browning” of America.
• Competition for talent will be fierce – and global.
• Successful recruitment and retention will hinge on your ability to effectively manage the full nexus of “diversity” issues.
September 2012 125
MOVING FORWARD
• Higher Education must become more actively engaged in K-12 Education.
• Improve Male Education Outcomes
• Embrace immigrants
• Education and business must establish stronger ties to ensure that students graduate with the requisite skills to compete in an ever-changing global economy.
• Prepare students for the freelance economy.
• Augment efforts to recruit plants with a human capital recruitment strategy (particularly to attract the NC born and bred).