Embed Size (px)
Citation preview
GINO SA: DISTRIBUTION CHANNEL STRATEGY
A DETAILED CASE ANALYSIS
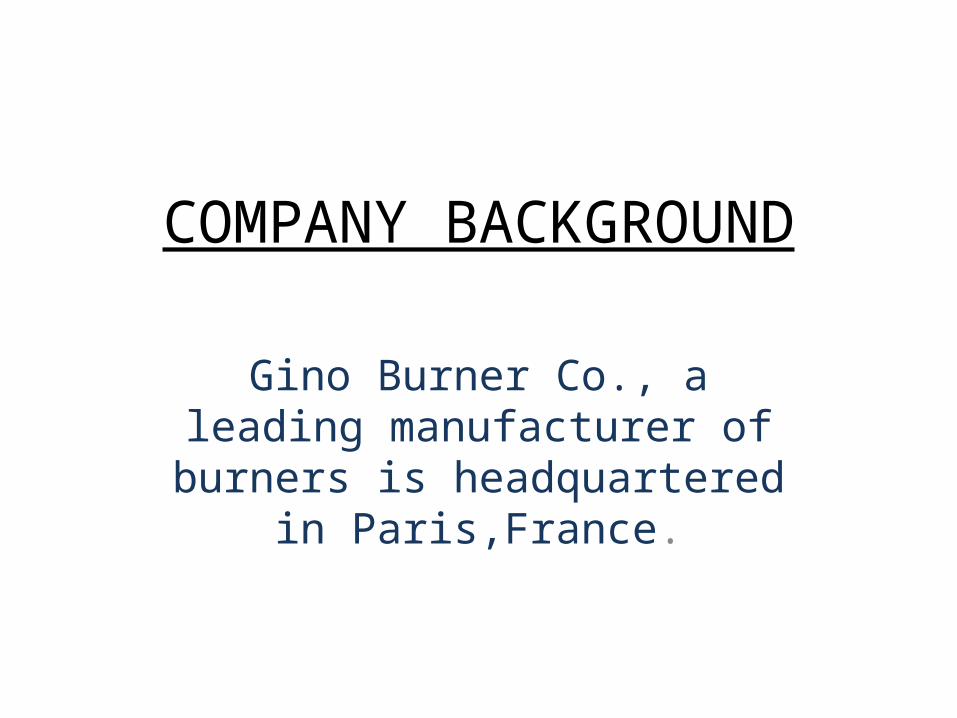
COMPANY BACKGROUND
Gino Burner Co., a leading manufacturer of burners is
headquartered in Paris,France.
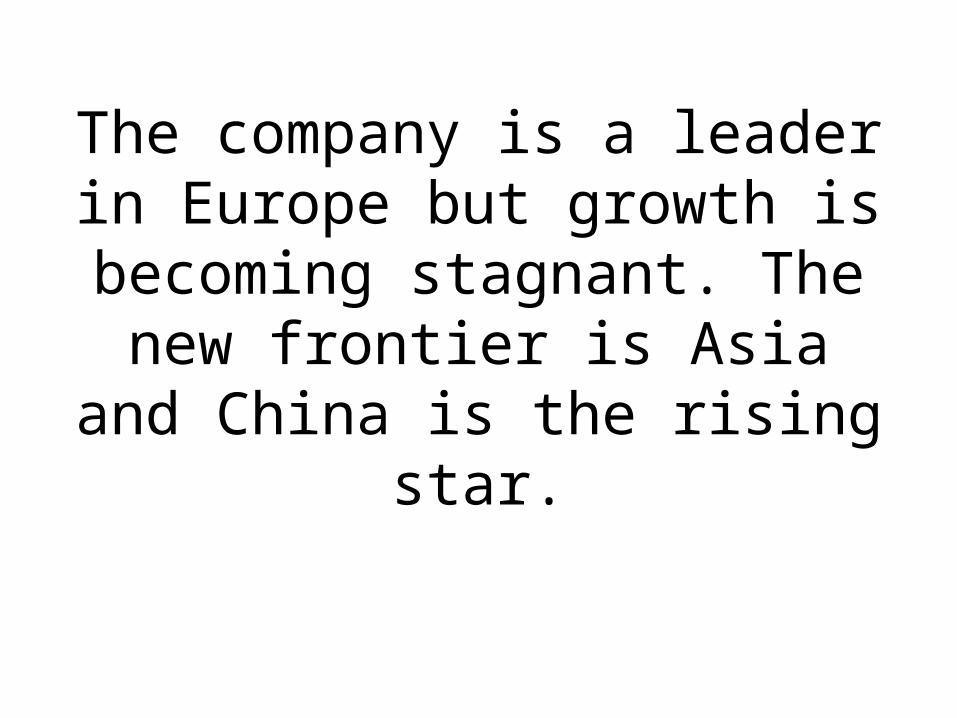
The company is a leader in Europe but growth is becoming stagnant. The new frontier is Asia and China
is the rising star.
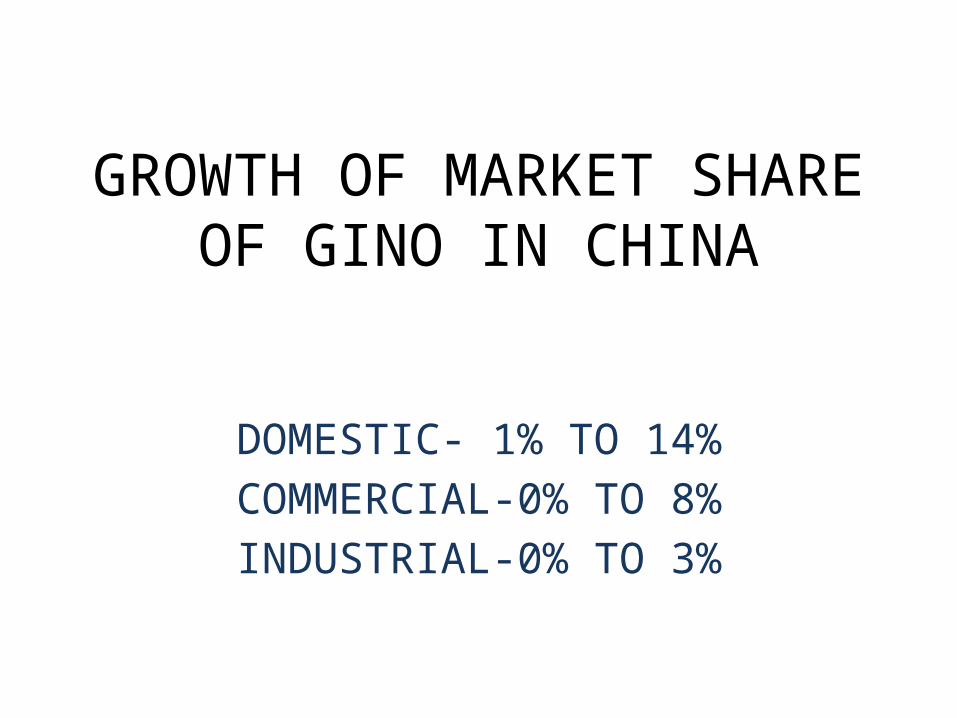
GROWTH OF MARKET SHARE OF GINO IN CHINA
DOMESTIC- 1% TO 14%COMMERCIAL-0% TO 8%INDUSTRIAL-0% TO 3%

PEOPLE INVOLVED
1)DAVID ZHOU- CHINA MARKETING MANAGER OF GINO
2)JEAN-MICHEL PIERRE- ASIA PACIFIC AREA MANAGER OF GINO
3)HENRY GONG- GENERAL MANAGER OF JINGHUA

SWOT ANALYSIS
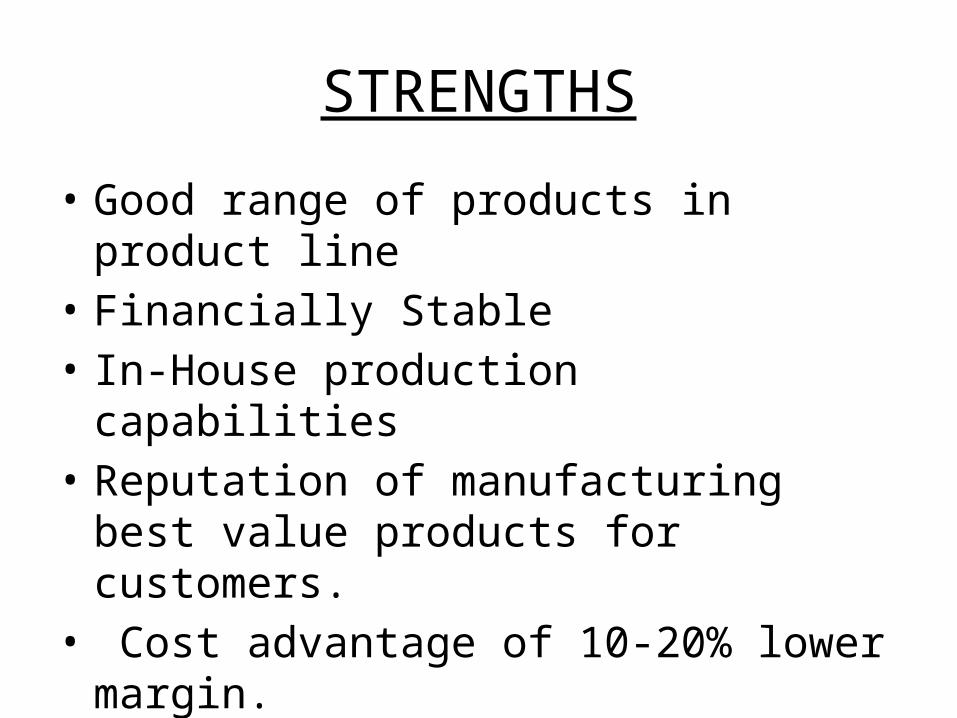
STRENGTHS
• Good range of products in product line• Financially Stable• In-House production capabilities• Reputation of manufacturing best value
products for customers.• Cost advantage of 10-20% lower margin.
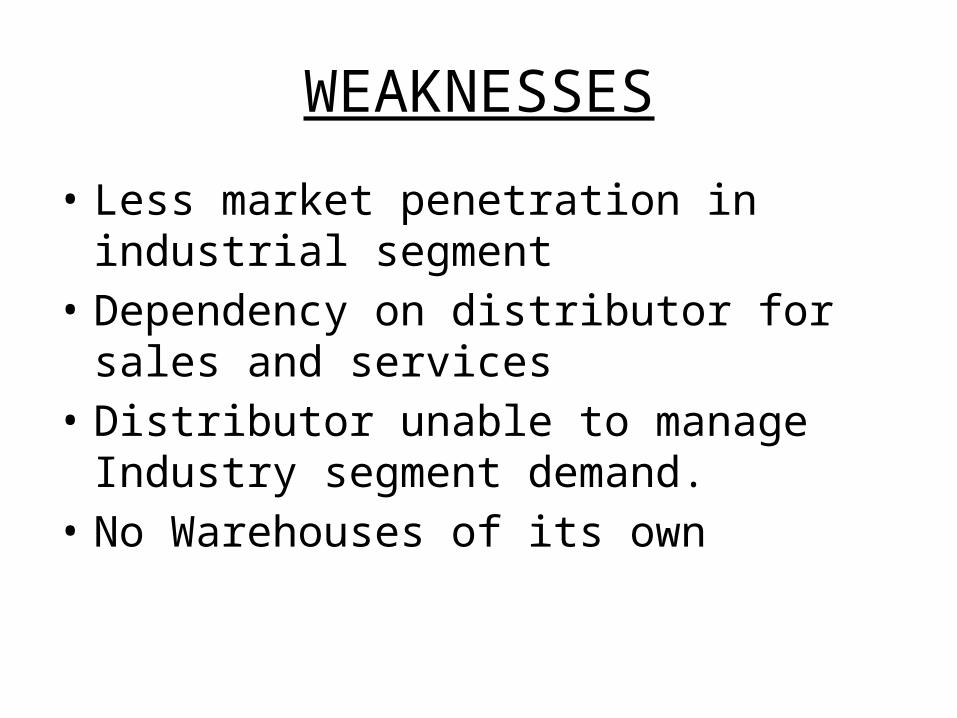
WEAKNESSES
• Less market penetration in industrial segment• Dependency on distributor for sales and
services• Distributor unable to manage Industry
segment demand.• No Warehouses of its own
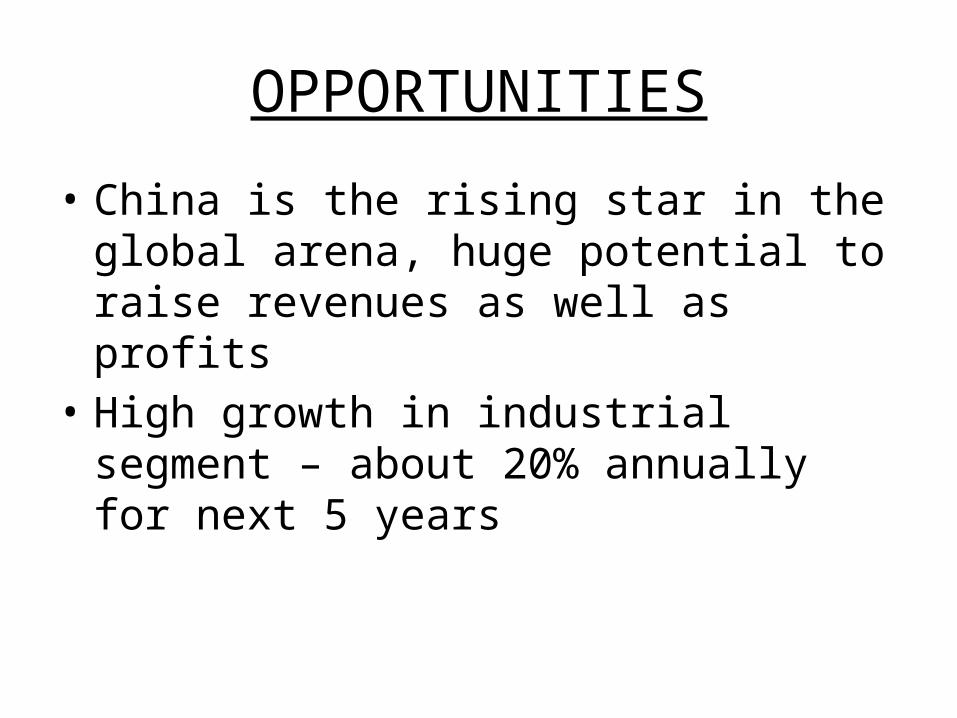
OPPORTUNITIES
• China is the rising star in the global arena, huge potential to raise revenues as well as profits
• High growth in industrial segment – about 20% annually for next 5 years
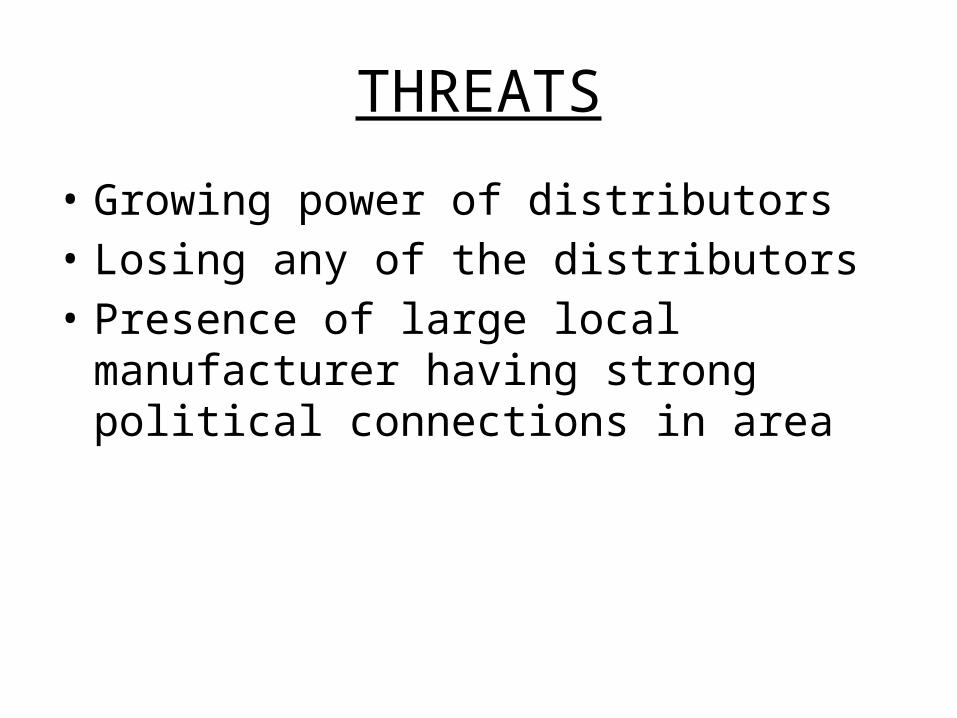
THREATS
• Growing power of distributors• Losing any of the distributors• Presence of large local manufacturer having
strong political connections in area
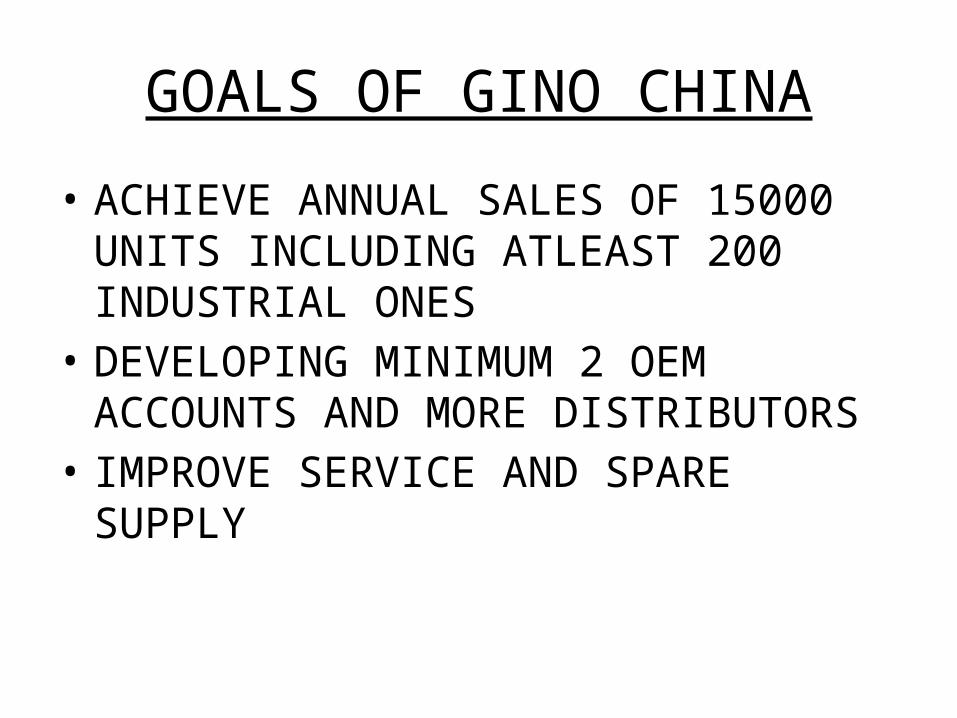
GOALS OF GINO CHINA
• ACHIEVE ANNUAL SALES OF 15000 UNITS INCLUDING ATLEAST 200 INDUSTRIAL ONES
• DEVELOPING MINIMUM 2 OEM ACCOUNTS AND MORE DISTRIBUTORS
• IMPROVE SERVICE AND SPARE SUPPLY
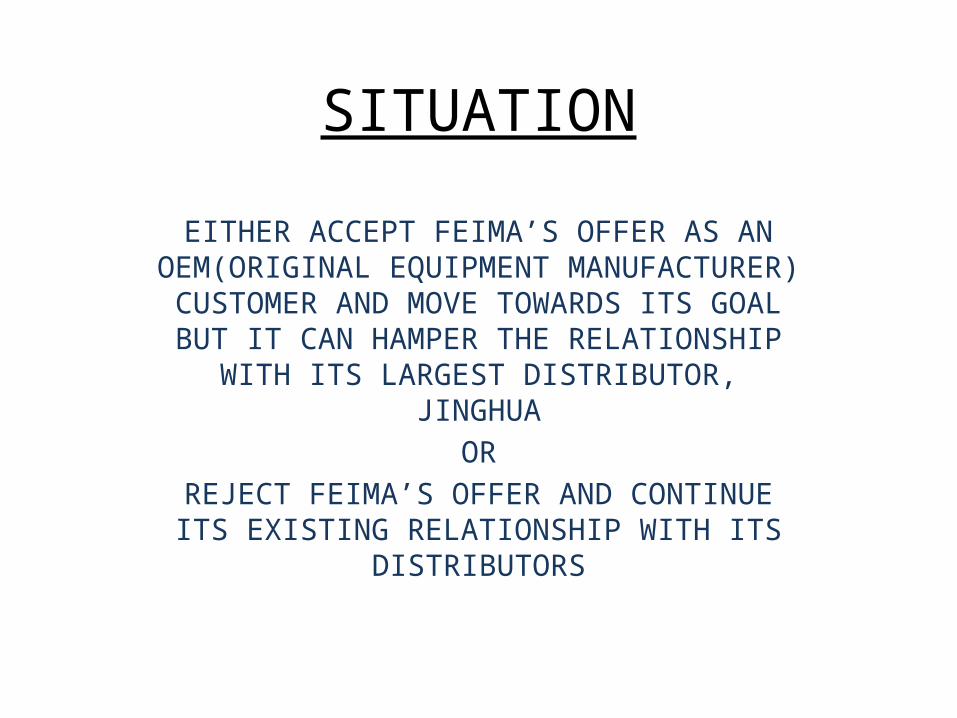
SITUATION
EITHER ACCEPT FEIMA’S OFFER AS AN OEM(ORIGINAL EQUIPMENT MANUFACTURER)
CUSTOMER AND MOVE TOWARDS ITS GOAL BUT IT CAN HAMPER THE RELATIONSHIP WITH
ITS LARGEST DISTRIBUTOR, JINGHUAOR
REJECT FEIMA’S OFFER AND CONTINUE ITS EXISTING RELATIONSHIP WITH ITS
DISTRIBUTORS
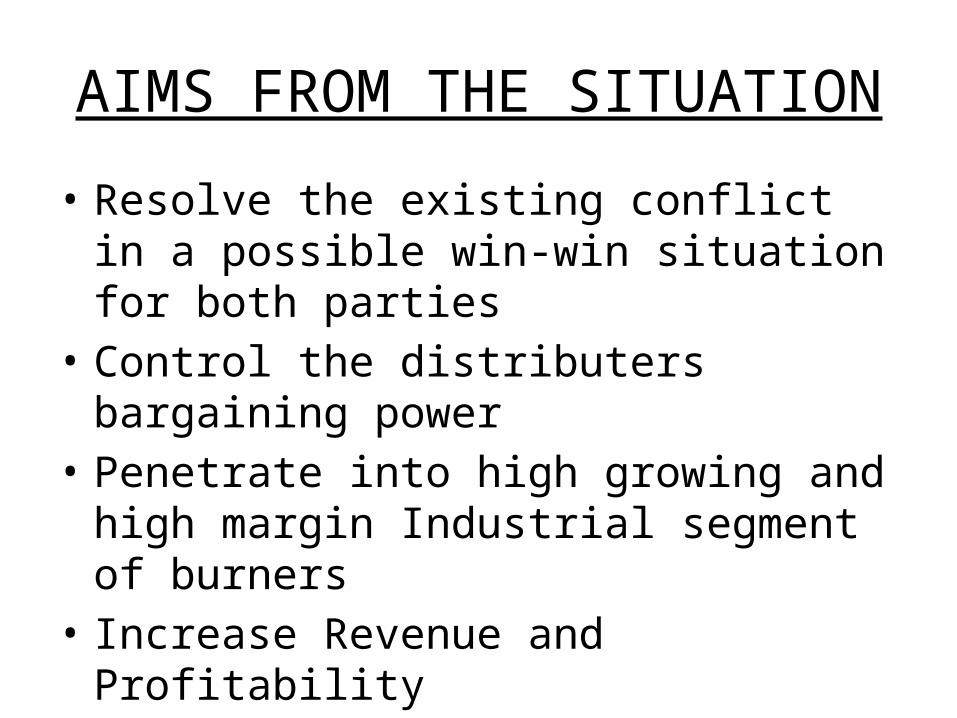
AIMS FROM THE SITUATION
• Resolve the existing conflict in a possible win-win situation for both parties
• Control the distributers bargaining power • Penetrate into high growing and high margin
Industrial segment of burners• Increase Revenue and Profitability

HOW TO SALVAGE THE SITUATION?
WE CONSIDER 2 ALTERNATIVES
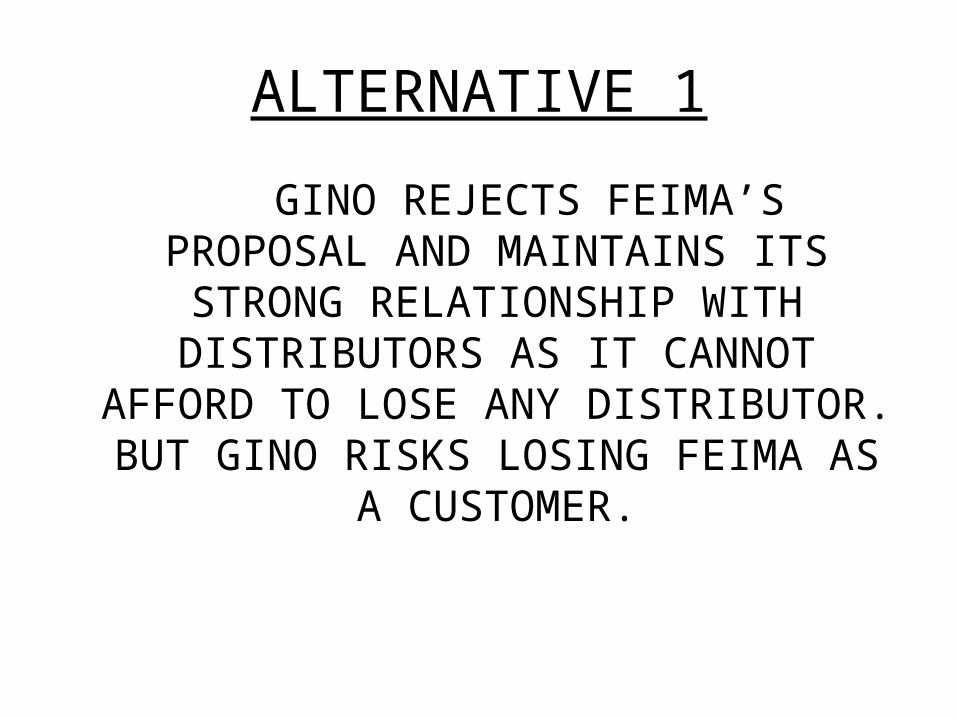
ALTERNATIVE 1
GINO REJECTS FEIMA’S PROPOSAL AND MAINTAINS ITS STRONG RELATIONSHIP WITH
DISTRIBUTORS AS IT CANNOT AFFORD TO LOSE ANY DISTRIBUTOR. BUT GINO RISKS
LOSING FEIMA AS A CUSTOMER.

ALTERNATIVE 2
GINO SIGNS OEM CONTRACT WITH FEIMA FOR INDUSTRIAL SEGMENT ONLY WITH 10% ADDITIONAL MARGIN AND PUSH JINGHUA
FOR 10% DISCOUNT ON FEIMA’S COMMERCIAL AND DOMESTIC BURNERS.
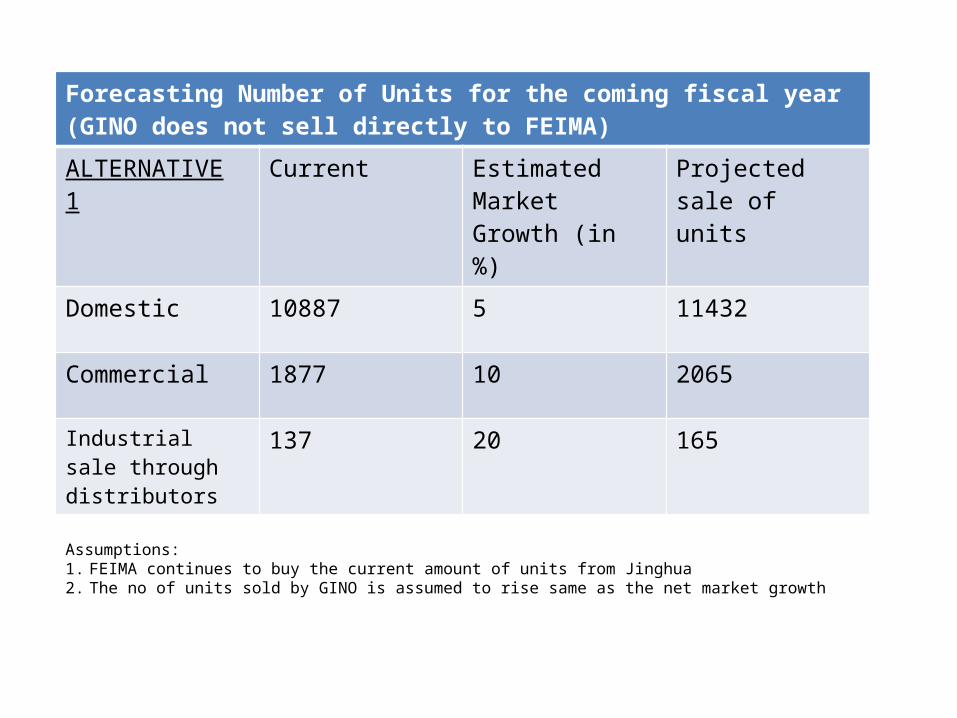
Forecasting Number of Units for the coming fiscal year (GINO does not sell directly to FEIMA)
ALTERNATIVE 1 Current Estimated Market Growth (in %)
Projected sale of units
Domestic 10887 5 11432
Commercial 1877 10 2065
Industrial sale through distributors
137 20 165
Assumptions: 1. FEIMA continues to buy the current amount of units from Jinghua 2. The no of units sold by GINO is assumed to rise same as the net market growth
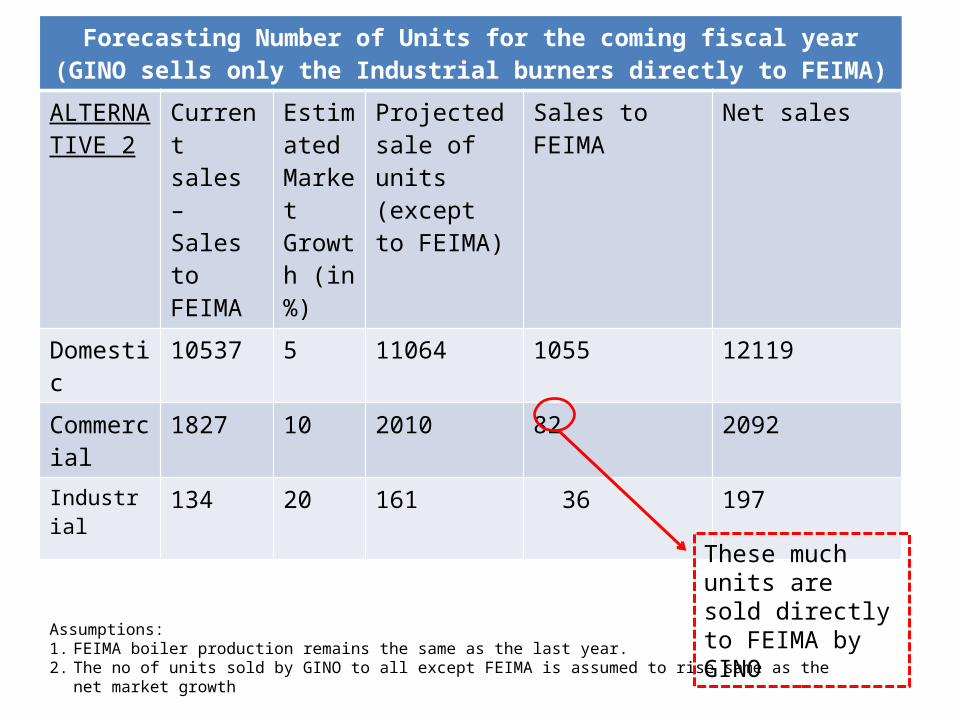
Forecasting Number of Units for the coming fiscal year (GINO sells only the Industrial burners directly to FEIMA)
ALTERNATIVE 2
Current sales – Sales to FEIMA
Estimated Market Growth (in %)
Projected sale of units (except to FEIMA)
Sales to FEIMA Net sales
Domestic 10537 5 11064 1055 12119
Commercial
1827 10 2010 82 2092
Industrial 134 20 161 36 197
Assumptions: 1. FEIMA boiler production remains the same as the last year.2. The no of units sold by GINO to all except FEIMA is assumed to rise same as the net market growth
These much units are sold directly to FEIMA by GINO

FINANCIAL ANALYSIS OF ALTERNATIVE 1
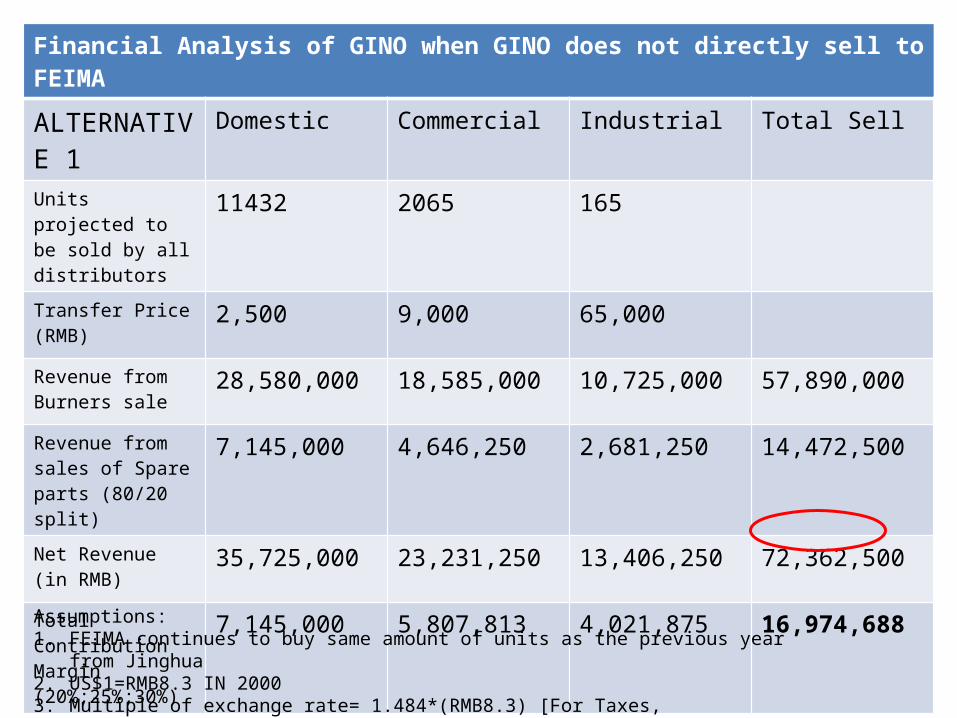
Financial Analysis of GINO when GINO does not directly sell to FEIMA
ALTERNATIVE 1
Domestic Commercial Industrial Total Sell
Units projected to be sold by all distributors
11432 2065 165
Transfer Price (RMB) 2,500 9,000 65,000
Revenue from Burners sale
28,580,000 18,585,000 10,725,000 57,890,000
Revenue from sales of Spare parts (80/20 split)
7,145,000 4,646,250 2,681,250 14,472,500
Net Revenue (in RMB)
35,725,000 23,231,250 13,406,250 72,362,500
Total Contribution Margin (20%;25%;30%)
7,145,000 5,807,813 4,021,875 16,974,688
Assumptions:1. FEIMA continues to buy same amount of units as the previous year from Jinghua2. US$1=RMB8.3 IN 20003. Multiple of exchange rate= 1.484*(RMB8.3) [For Taxes, Transportation,Shipping ,Insurance etc.]

FINANCIAL ANALYSIS OF ALTERNATIVE 2
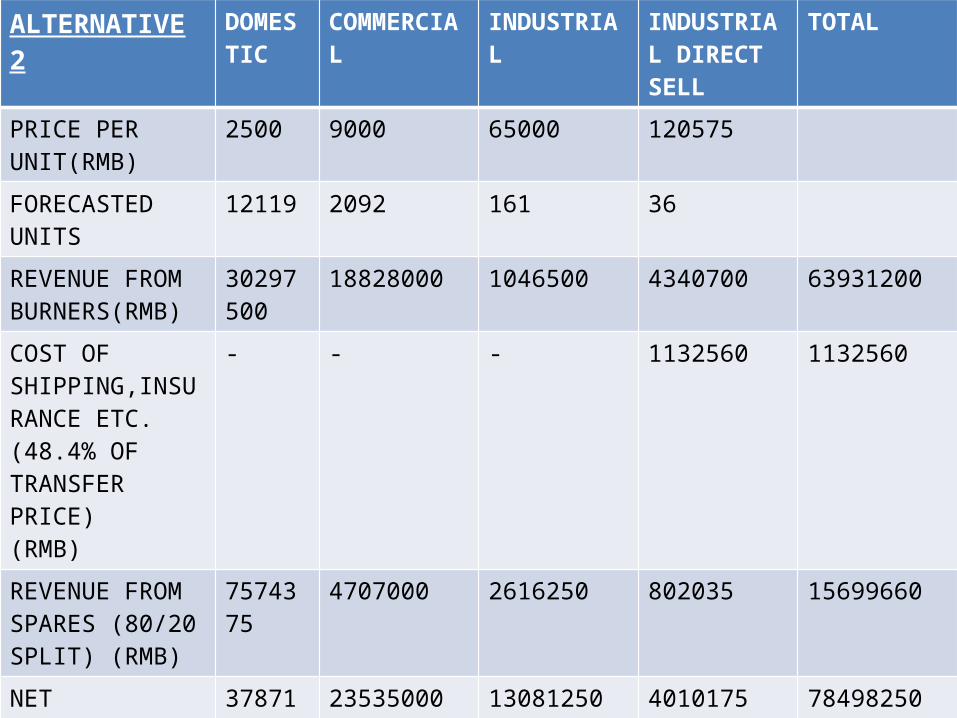
ALTERNATIVE 2 DOMESTIC
COMMERCIAL INDUSTRIAL INDUSTRIAL DIRECT SELL
TOTAL
PRICE PER UNIT(RMB)
2500 9000 65000 120575
FORECASTED UNITS 12119 2092 161 36
REVENUE FROM BURNERS(RMB)
30297500
18828000 1046500 4340700 63931200
COST OF SHIPPING,INSURANCE ETC.(48.4% OF TRANSFER PRICE)(RMB)
- - - 1132560 1132560
REVENUE FROM SPARES (80/20 SPLIT) (RMB)
7574375
4707000 2616250 802035 15699660
NET REVENUE(RMB)
37871825
23535000 13081250 4010175 78498250
CONTRIBUTION MARGIN(20%,25%,30%,30%) (RMB)
7574375
5883750 3924375 1203052.5 18585552.5
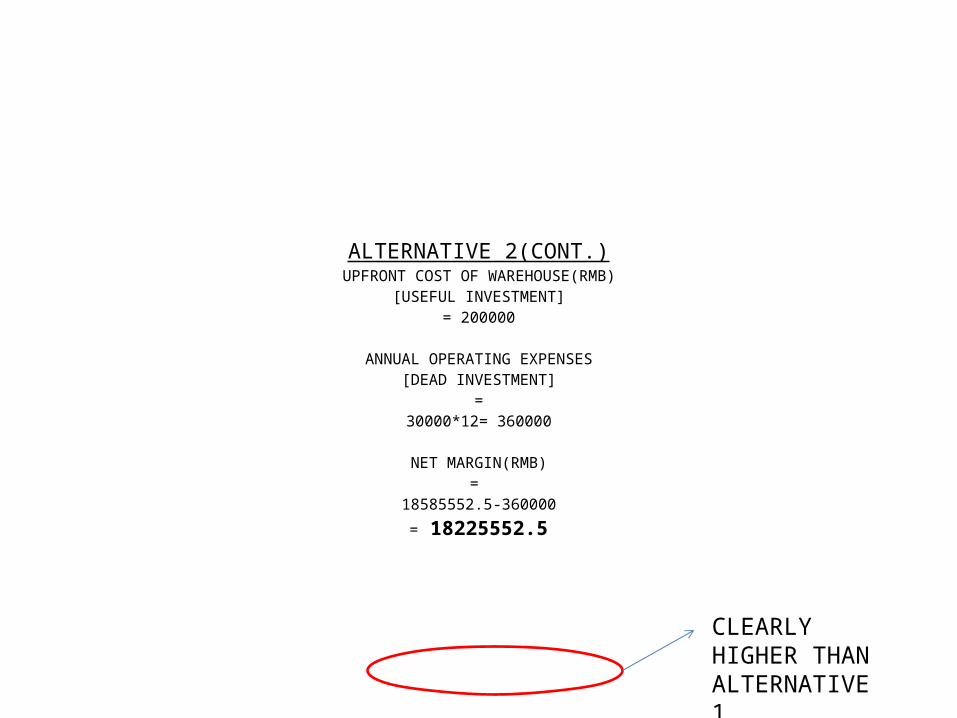
ALTERNATIVE 2(CONT.)UPFRONT COST OF WAREHOUSE(RMB)
[USEFUL INVESTMENT]= 200000
ANNUAL OPERATING EXPENSES[DEAD INVESTMENT]
=30000*12= 360000
NET MARGIN(RMB)=
18585552.5-360000= 18225552.5
CLEARLY HIGHER THAN ALTERNATIVE 1

COMPARATIVE FINANCIAL ANALYSIS OF JINGHUA

ALTERNATIVE 1
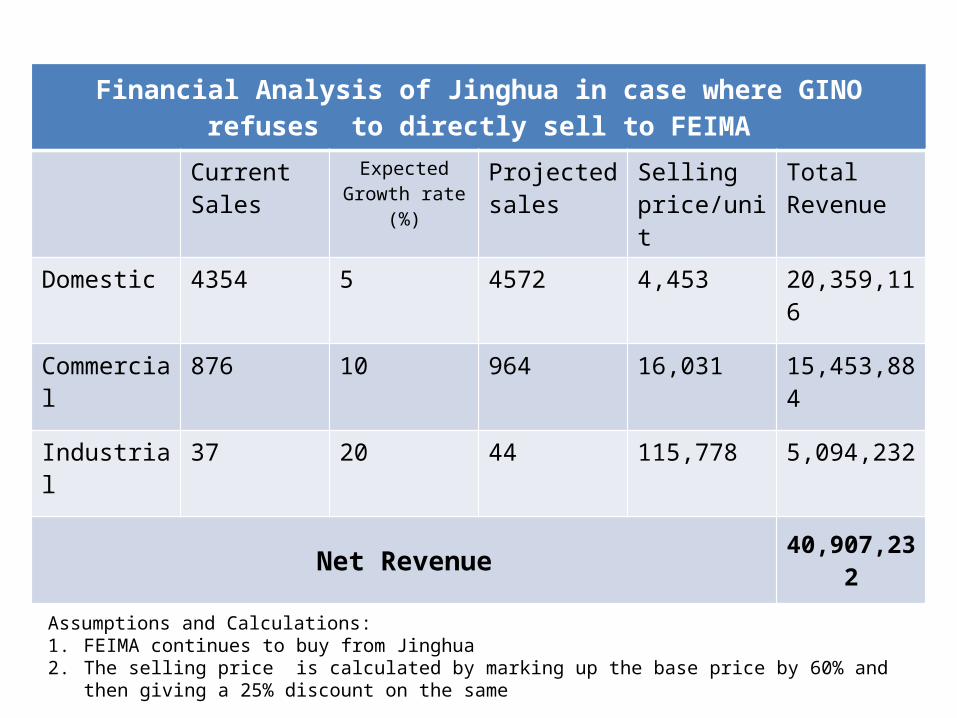
Financial Analysis of Jinghua in case where GINO refuses to directly sell to FEIMA
Current Sales Expected Growth rate (%)
Projected sales
Selling price/unit
Total Revenue
Domestic 4354 5 4572 4,453 20,359,116
Commercial 876 10 964 16,031 15,453,884
Industrial 37 20 44 115,778 5,094,232
Net Revenue 40,907,232
Assumptions and Calculations:1. FEIMA continues to buy from Jinghua 2. The selling price is calculated by marking up the base price by 60% and then giving a 25% discount on the
same

ALTERNATIVE 2
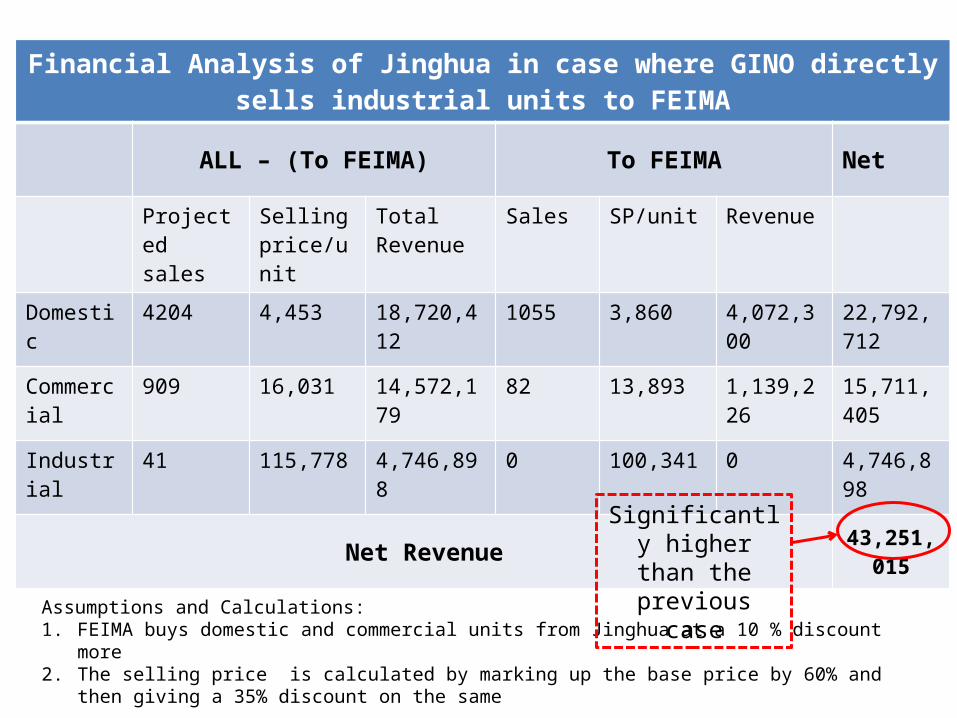
Financial Analysis of Jinghua in case where GINO directly sells industrial units to FEIMA
ALL – (To FEIMA) To FEIMA Net
Projected sales
Selling price/unit
Total Revenue
Sales SP/unit Revenue
Domestic 4204 4,453 18,720,412 1055 3,860 4,072,300 22,792,712
Commercial
909 16,031 14,572,179 82 13,893 1,139,226 15,711,405
Industrial 41 115,778 4,746,898 0 100,341 0 4,746,898
Net Revenue 43,251,015
Assumptions and Calculations:1. FEIMA buys domestic and commercial units from Jinghua at a 10 % discount more2. The selling price is calculated by marking up the base price by 60% and then giving a 35% discount on the
same
Significantly higher than the previous case
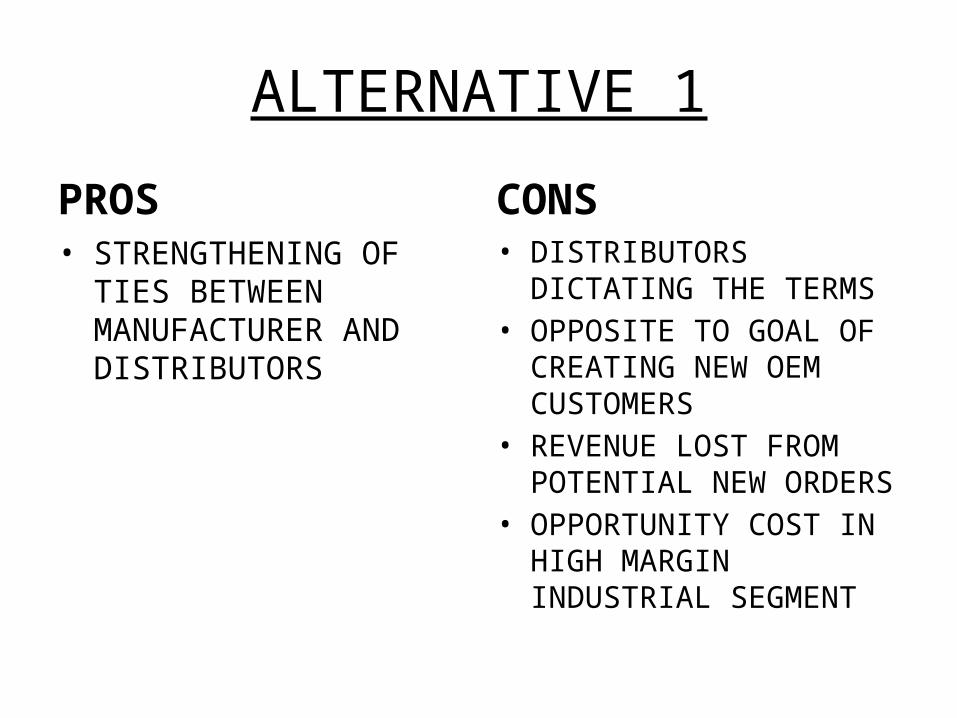
ALTERNATIVE 1
PROS• STRENGTHENING OF TIES
BETWEEN MANUFACTURER AND DISTRIBUTORS
CONS• DISTRIBUTORS DICTATING
THE TERMS• OPPOSITE TO GOAL OF
CREATING NEW OEM CUSTOMERS
• REVENUE LOST FROM POTENTIAL NEW ORDERS
• OPPORTUNITY COST IN HIGH MARGIN INDUSTRIAL SEGMENT
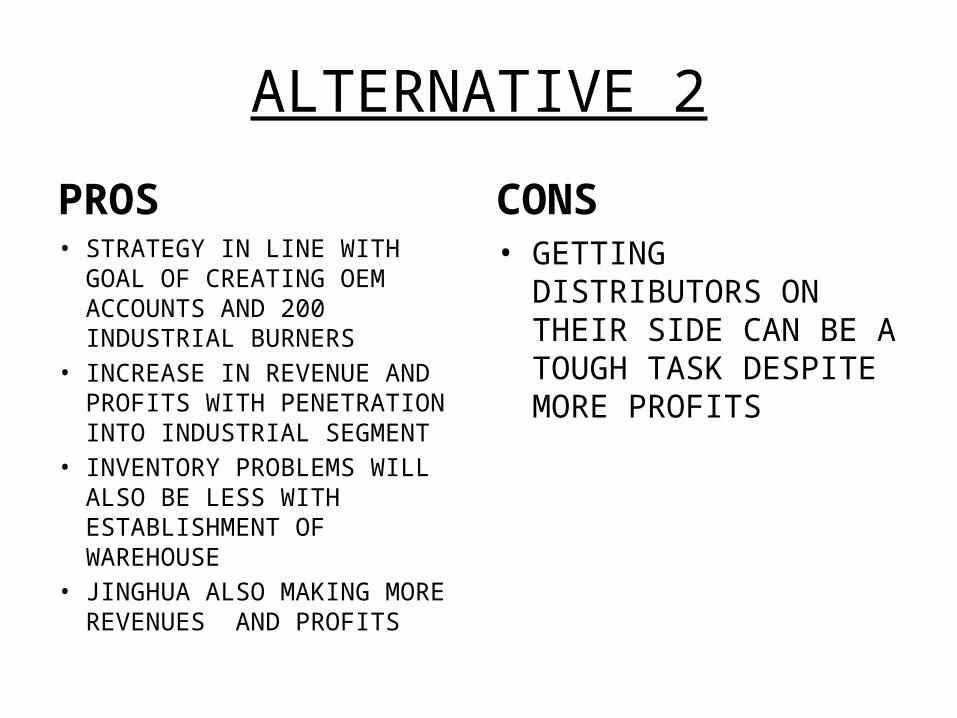
ALTERNATIVE 2
PROS• STRATEGY IN LINE WITH GOAL
OF CREATING OEM ACCOUNTS AND 200 INDUSTRIAL BURNERS
• INCREASE IN REVENUE AND PROFITS WITH PENETRATION INTO INDUSTRIAL SEGMENT
• INVENTORY PROBLEMS WILL ALSO BE LESS WITH ESTABLISHMENT OF WAREHOUSE
• JINGHUA ALSO MAKING MORE REVENUES AND PROFITS
CONS• GETTING DISTRIBUTORS ON
THEIR SIDE CAN BE A TOUGH TASK DESPITE MORE PROFITS
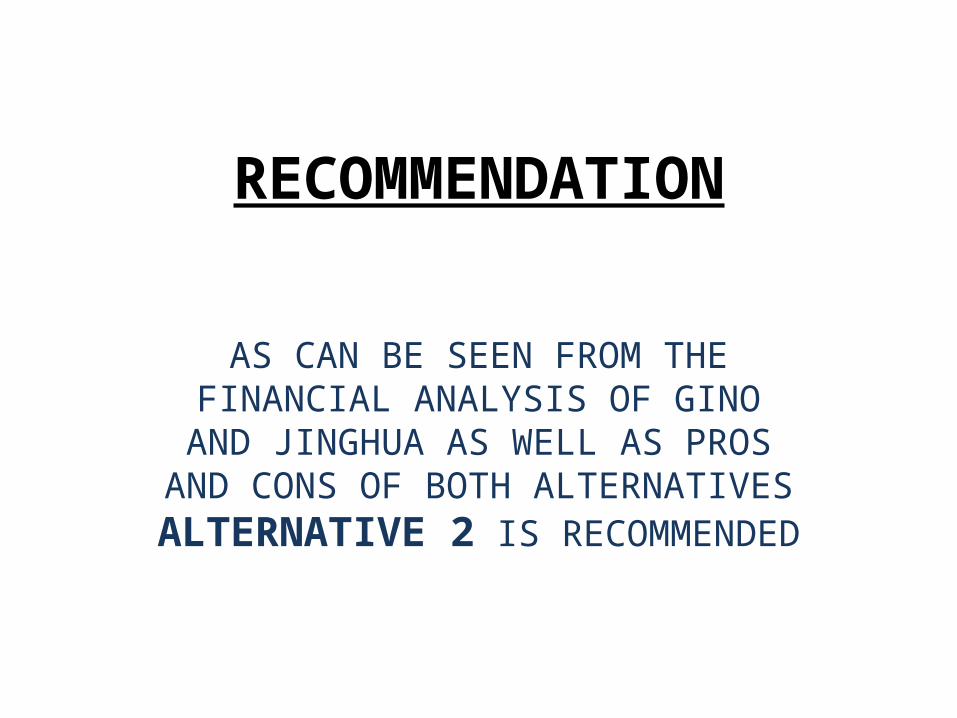
RECOMMENDATION
AS CAN BE SEEN FROM THE FINANCIAL ANALYSIS OF GINO AND
JINGHUA AS WELL AS PROS AND CONS OF BOTH ALTERNATIVES
ALTERNATIVE 2 IS RECOMMENDED

THESE SLIDES WERE CREATED BY AMOD BANSAL,THAPAR UNIVERSITY
AS PART OF AN INTERNSHIP DONE UNDER THE GUIDANCE OF
PROF. SAMEER MATHUR,IIM LUCKNOW(www.iiminternship.com)

THANK YOU