Embed Size (px)
Citation preview
• It is a class of techniques used to classify cases into groups that are -
• relatively homogeneous within themselves and• heterogeneous between each other• Homogeneity (similarity) and heterogeneity (dissimilarity) are measured on the basis of a defined set of variables
• These groups are called clusters.
03/02/15 Cluster analysis for market segmentation
• The nature of Cluster Analysis is data exploration that conducted in repetitive fashion. Clusterization is not a single grouping, but the process of getting well interpretable groups of objects under consideration.
03/02/15 Cluster analysis for market segmentation
–Market segmentation is one of the most fundamental strategic marketing concepts:
•grouping people (with the willingness, purchasing power, and the authority to buy) according to their similarity in several dimensions related to a product under consideration.
–Markets can be segmented based on:•Demographics•Psychographics•Geographics•Product Benefits•Behavioral Segmentation
03/02/15 Cluster analysis for market segmentation
•Cluster analysis is especially useful for market segmentation.
•Segmenting a market means dividing its potential consumers into separate sub-sets where•Consumers in the same group are similar with respect to a given set of characteristics•Consumers belonging to different groups are dissimilar with respect to the same set of characteristics
•This allows one to calibrate the marketing mix differently according to the target consumer group.
03/02/15 Cluster analysis for market segmentation
• Help marketers discover distinct groups in their customer bases, and then use this knowledge to develop targeted marketing programs
• The underlying definition of cluster analysis procedures mimic the goals of market segmentation: - to identify groups of respondents that minimizes differences among members of the same group • highly internally homogeneous groups
- while maximizing differences between different groups• highly externally heterogeneous groups
• Market Segmentation solution depends onvariables used to segment the marketmethod used to arrive at a certain segmentation
03/02/15 Cluster analysis for market segmentation
• Product characteristics and the identification of new product opportunities.
• Clustering of similar brands or products according to their characteristics allow one to identify competitors, potential market opportunities and available niches
• Data reduction• Factor analysis and principal component analysis allow to reduce the number of variables. • Cluster analysis allows to reduce the number of observations, by grouping them into
homogeneous clusters.
• Maps profiling simultaneously consumers and products, market opportunities and preferences as in preference or perceptual mappings.
03/02/15 Cluster analysis for market segmentation
• Select a distance measure• Select a clustering algorithm• Define the distance between two clusters• Determine the number of clusters• Validate the analysis
03/02/15 Cluster analysis for market segmentation
• To measure similarity between two observations a distance measure is needed
• With a single variable, similarity is straightforward• Example: income – two individuals are similar if their income level is similar
and the level of dissimilarity increases as the income gap increases
• Multiple variables require an aggregate distance measure• Many characteristics (e.g. income, age, consumption habits, family
composition, owning a car, education level, job…), it becomes more difficult to define similarity with a single value
• The most known measure of distance is the Euclidean distance, which is the concept we use in everyday life for spatial coordinates.
03/02/15 Cluster analysis for market segmentation
• Other distance measures: Chebychev, Minkowski, Mahalanobis
• An alternative approach: use correlation measures, where correlations are not between variables, but between observations.
• Each observation is characterized by a set of measurements (one for each variable) and bi-variate correlations can be computed between two observations.
03/02/15 Cluster analysis for market segmentation
• Hierarchical procedures• Agglomerative (start from n clusters to get to 1 cluster)• Divisive (start from 1 cluster to get to n clusters)
• Non hierarchical procedures• K-means clustering
03/02/15 Cluster analysis for market segmentation
• Agglomerative:• Each of the n observations constitutes a separate cluster• The two clusters that are more similar according to same distance rule are
aggregated, so that in step 1 there are n-1 clusters• In the second step another cluster is formed (n-2 clusters), by nesting the two clusters
that are more similar, and so on• There is a merging in each step until all observations end up in a single cluster in the
final step.
• Divisive• All observations are initially assumed to belong to a single cluster• The most dissimilar observation is extracted to form a separate cluster• In step 1 there will be 2 clusters, in the second step three clusters and so on, until the
final step will produce as many clusters as the number of observations.
• The number of clusters determines the stopping rule for the algorithms
03/02/15 Cluster analysis for market segmentation
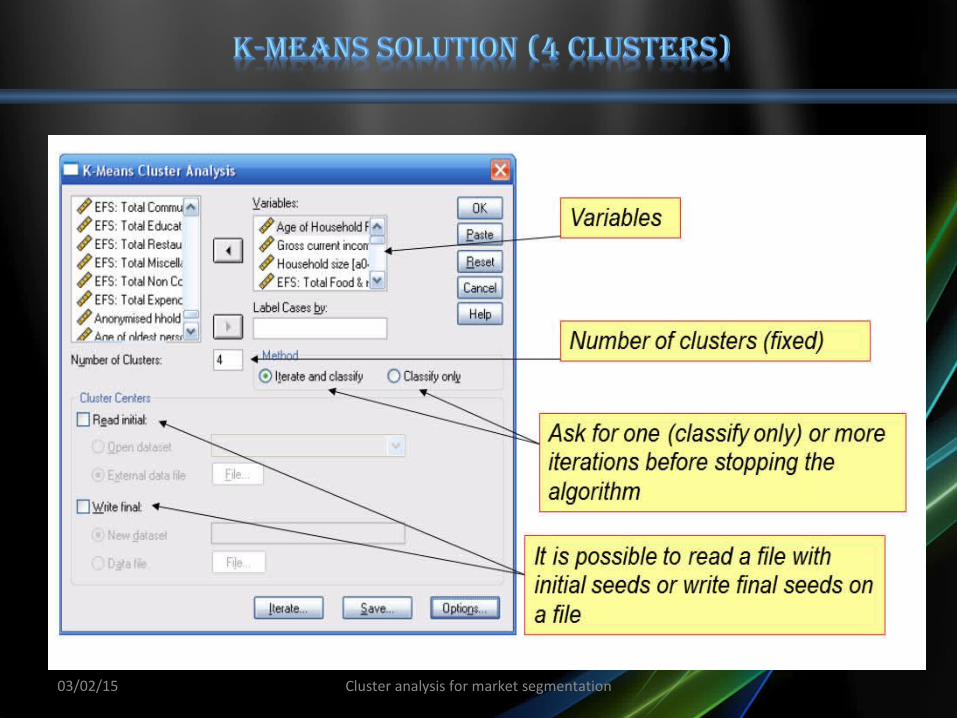
• These algorithms do not follow a hierarchy and produce a single partition • Knowledge of the number of clusters (c) is required• In the first step, initial cluster centres (the seeds) are determined for each of
the c clusters, either by the researcher or by the software (usually the first c observation or observations are chosen randomly)
• Each iteration allocates observations to each of the c clusters, based on their distance from the cluster centres
• Cluster centres are computed again and observations may be reallocated to the nearest cluster in the next iteration
• When no observations can be reallocated or a stopping rule is met, the process stops
03/02/15 Cluster analysis for market segmentation
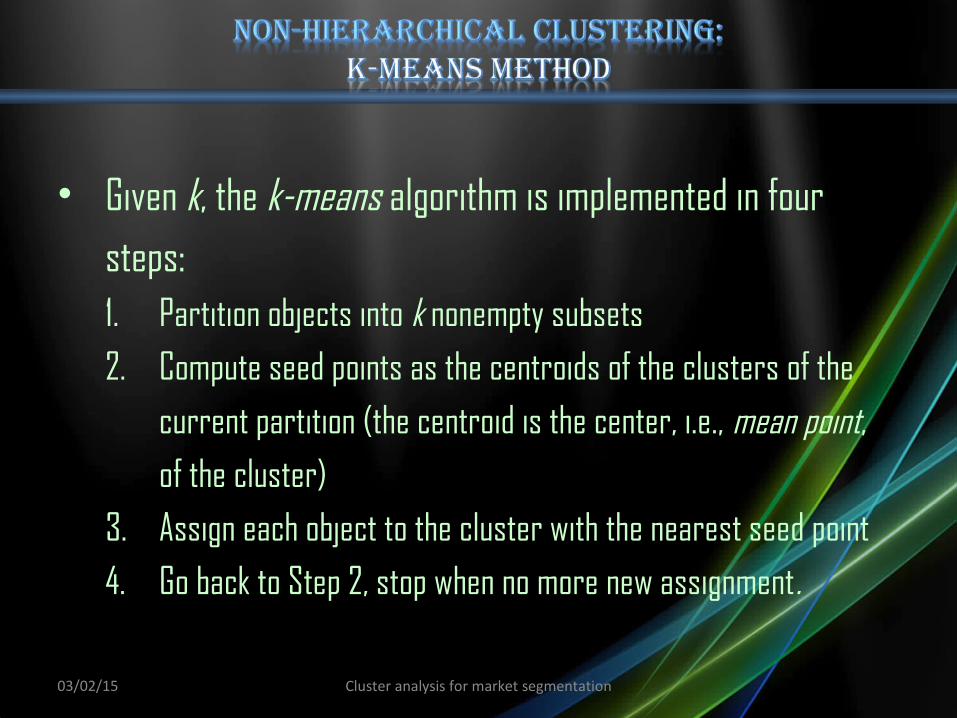
• Given k, the k-means algorithm is implemented in four
steps:1. Partition objects into k nonempty subsets
2. Compute seed points as the centroids of the clusters of the
current partition (the centroid is the center, i.e., mean point, of the cluster)
3. Assign each object to the cluster with the nearest seed point
4. Go back to Step 2, stop when no more new assignment.
03/02/15 Cluster analysis for market segmentation
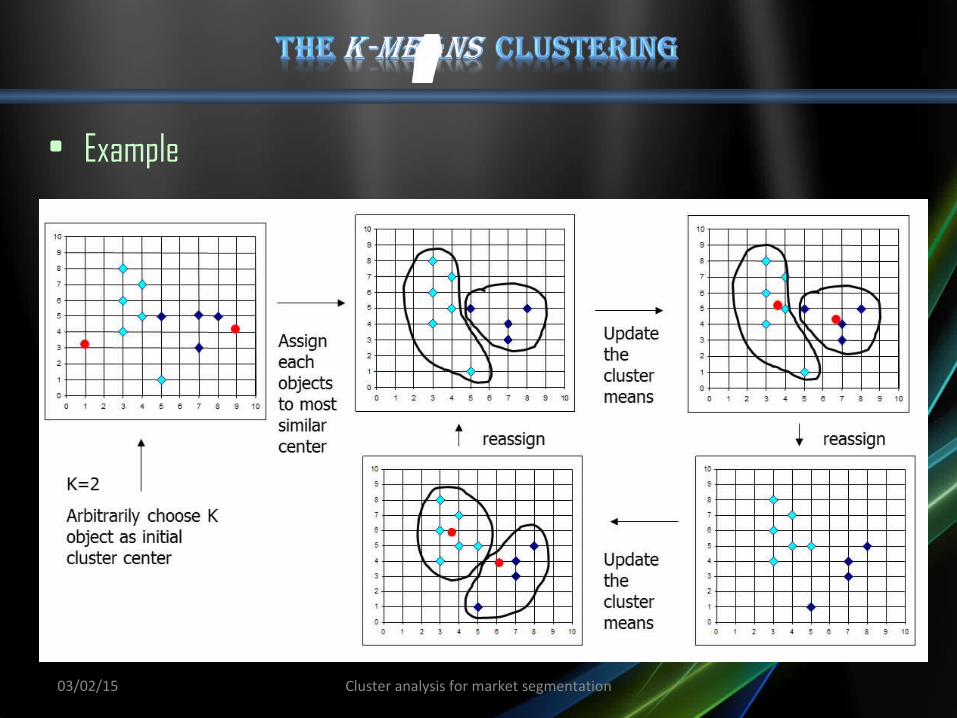
• Example
03/02/15 Cluster analysis for market segmentation
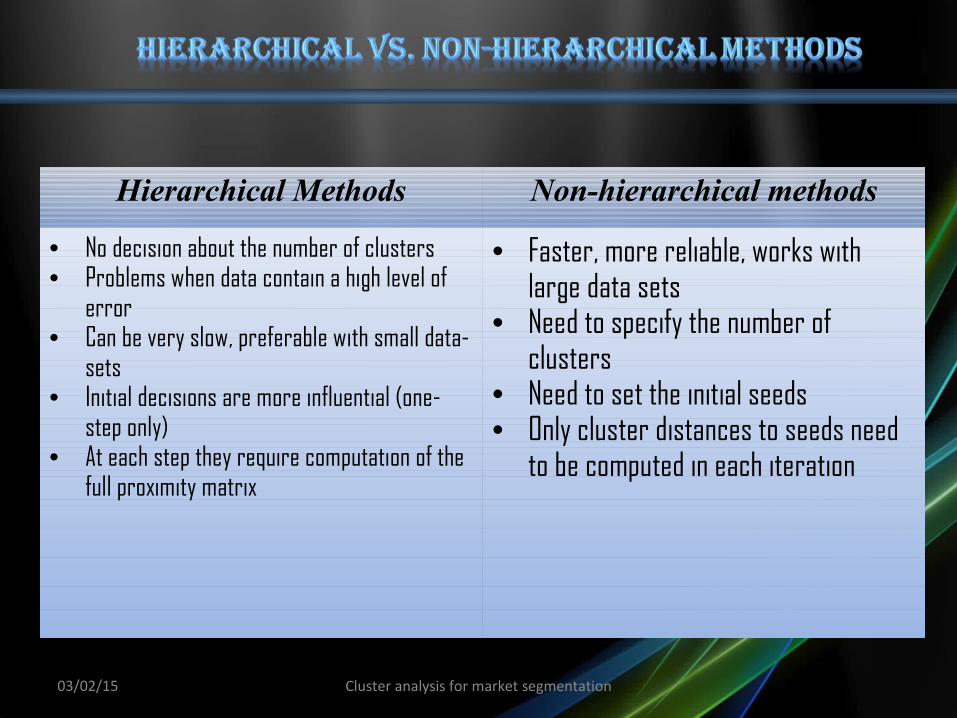
Hierarchical Methods Non-hierarchical methods
• No decision about the number of clusters• Problems when data contain a high level of
error• Can be very slow, preferable with small data-
sets• Initial decisions are more influential (one-
step only)• At each step they require computation of the
full proximity matrix
• Faster, more reliable, works with large data sets
• Need to specify the number of clusters
• Need to set the initial seeds • Only cluster distances to seeds need
to be computed in each iteration
03/02/15 Cluster analysis for market segmentation
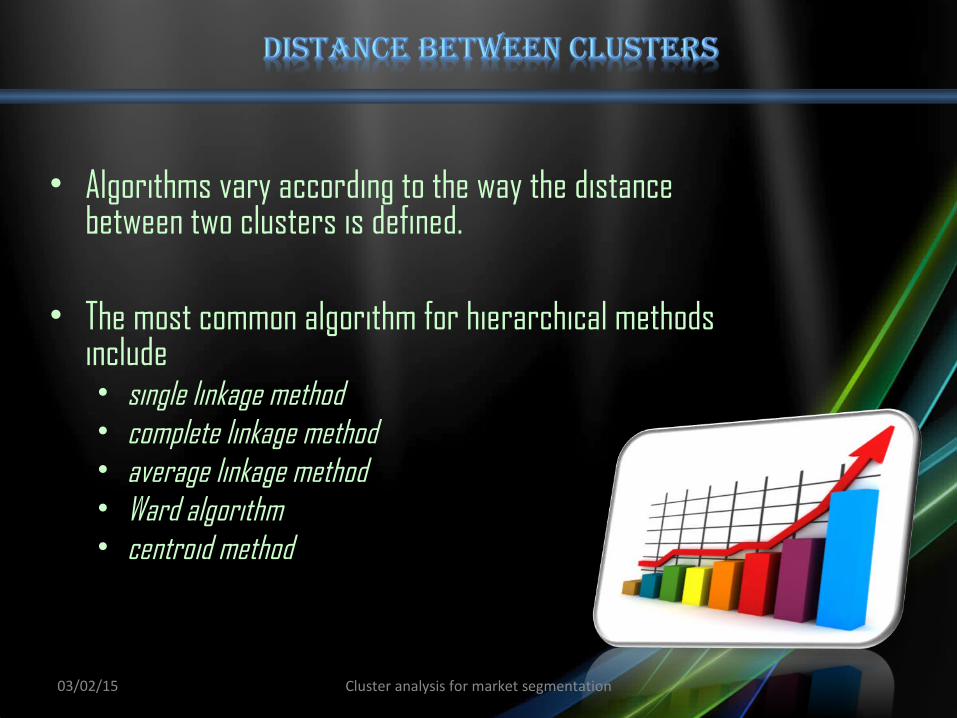
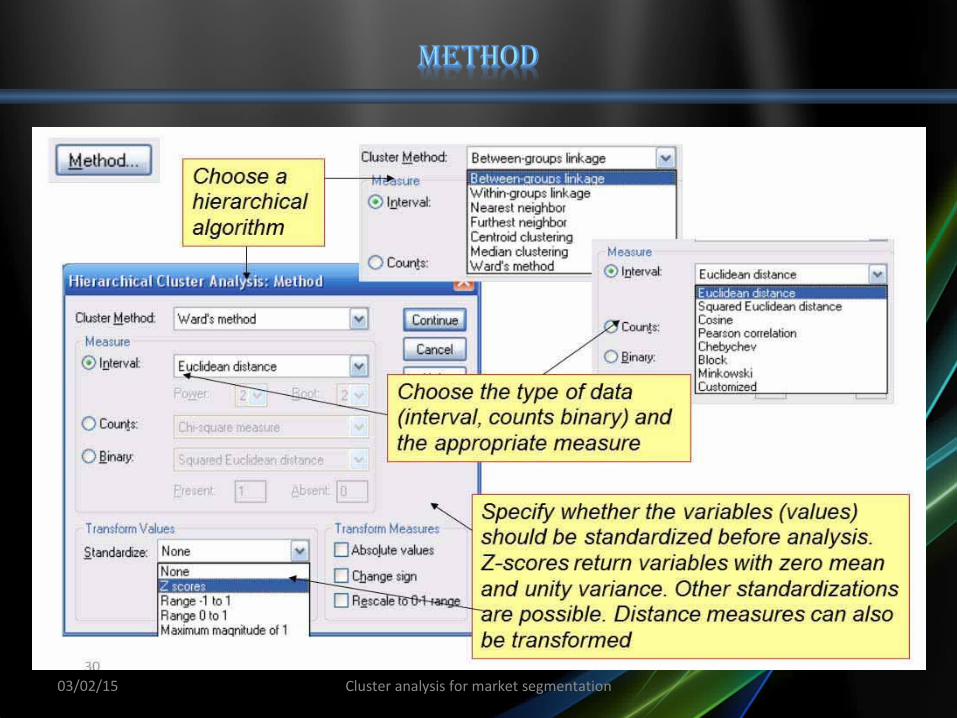
• Algorithms vary according to the way the distance between two clusters is defined.
• The most common algorithm for hierarchical methods include• single linkage method• complete linkage method• average linkage method• Ward algorithm• centroid method
03/02/15 Cluster analysis for market segmentation
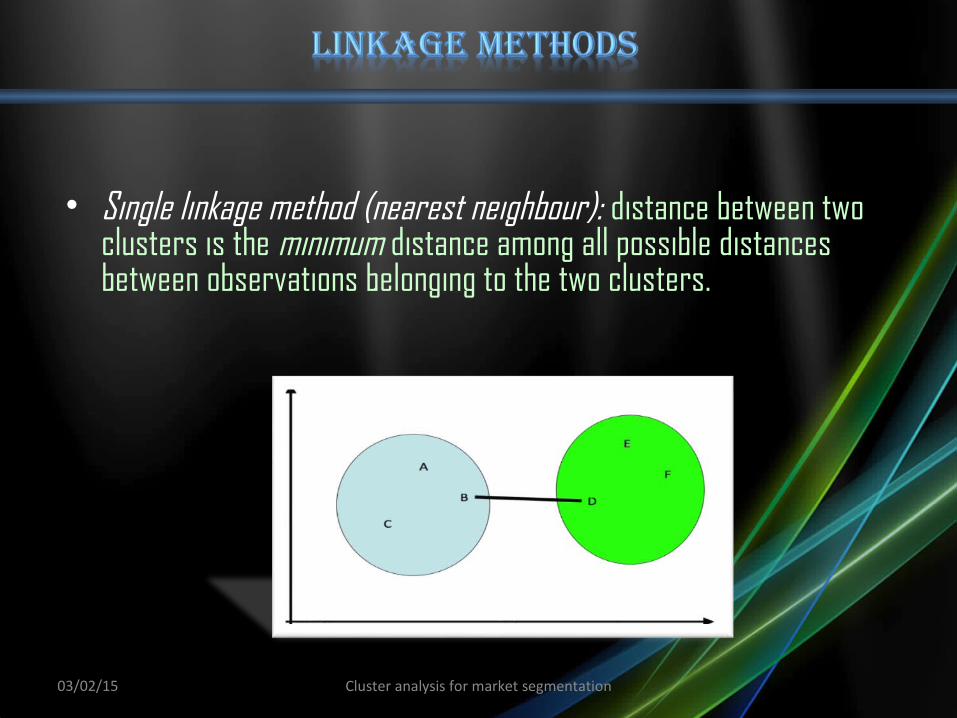
• Single linkage method (nearest neighbour): distance between two clusters is the minimum distance among all possible distances between observations belonging to the two clusters.
03/02/15 Cluster analysis for market segmentation
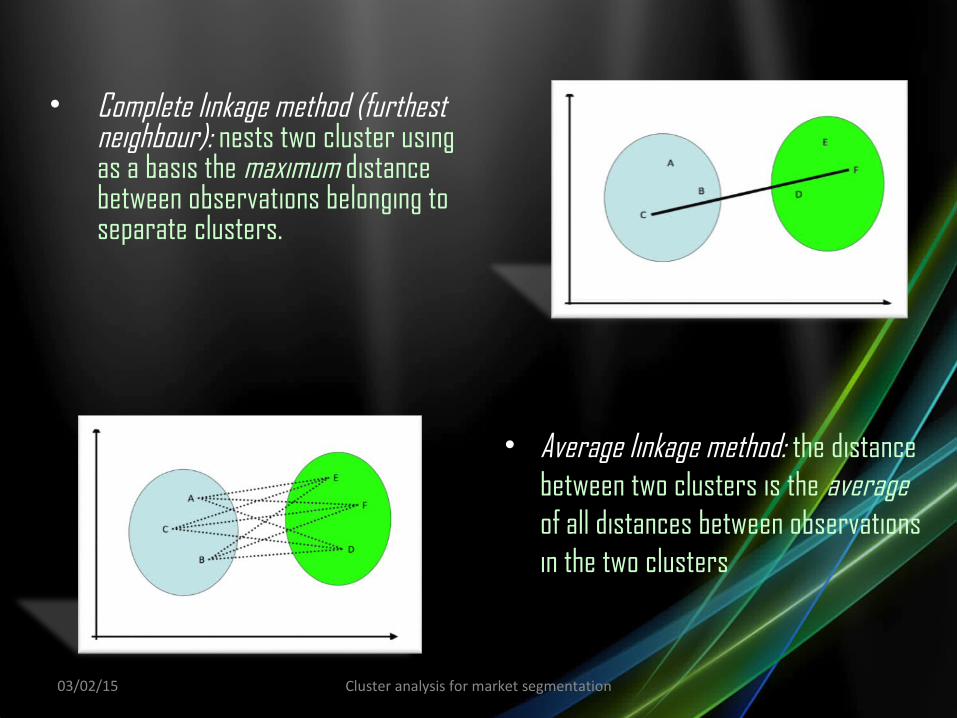
• Complete linkage method (furthest neighbour): nests two cluster using as a basis the maximum distance between observations belonging to separate clusters.
• Average linkage method: the distance between two clusters is the average of all distances between observations in the two clusters
03/02/15 Cluster analysis for market segmentation
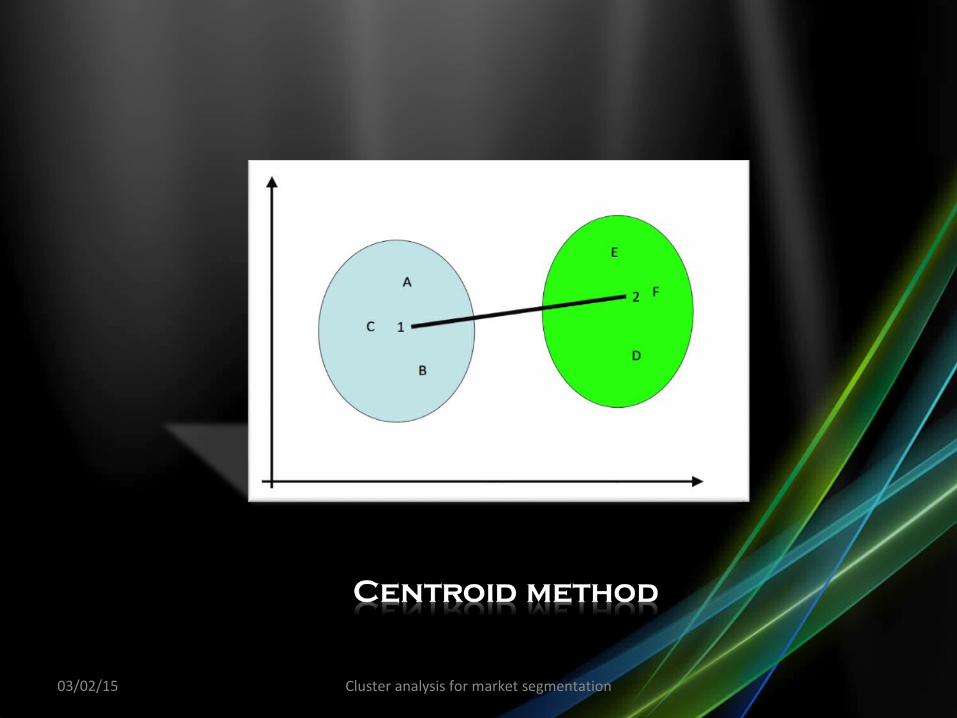
• The distance between two clusters is the distance between the two centroids,
• Centroids are the cluster averages for each of the variables• each cluster is defined by a single set of coordinates, the averages of the
coordinates of all individual observations belonging to that cluster
• Difference between the centroid and the average linkage method• Centroid: computes the average of the co-ordinates of the observations
belonging to an individual cluster • Average linkage: computes the average of the distances between two
separate clusters.
03/02/15 Cluster analysis for market segmentation
03/02/15 Cluster analysis for market segmentation
1. First perform a hierarchical method to define the number of clusters2. Then use the k-means procedure to actually form the clusters
The reallocation problem
• Rigidity of hierarchical methods: once a unit is classified into a cluster, it cannot be moved to other clusters in subsequent steps
• The k-means method allows a reclassification of all units in each iteration. • If some uncertainty about the number of clusters remains after running the hierarchical
method, one may also run several k-means clustering procedures and apply the previously
discussed statistical tests to choose the best partition.
03/02/15 Cluster analysis for market segmentation
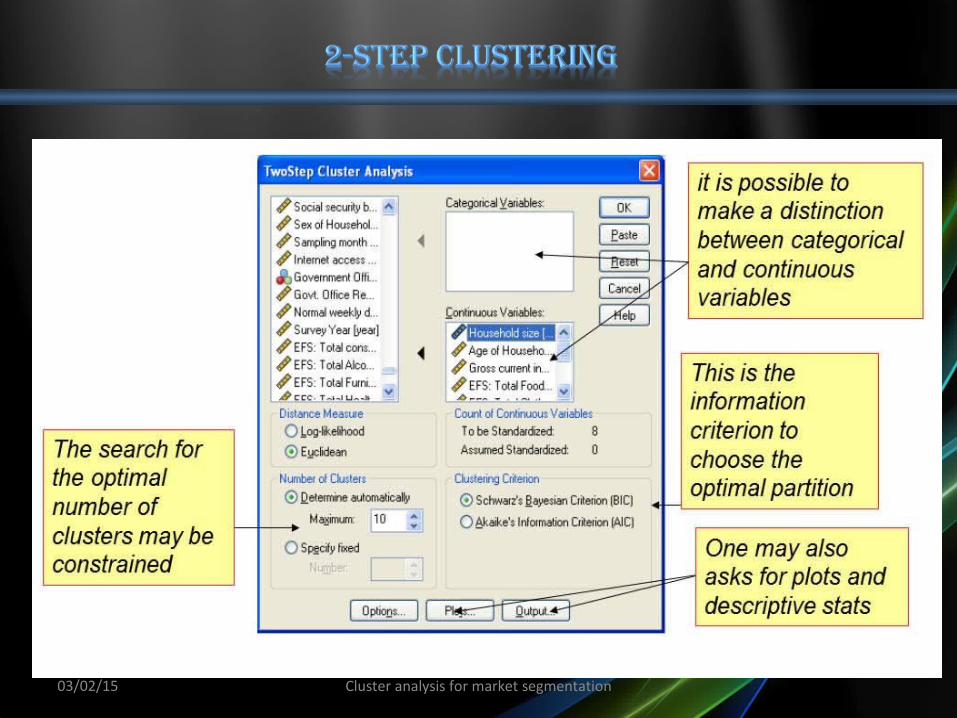
• The observations are preliminarily aggregated into clusters using an hybrid hierarchical procedure named cluster feature tree.
• This first step produces a number of pre-clusters, which is higher than the final number of clusters, but much smaller than the number of observations.
• In the second step, a hierarchical method is used to classify the pre-clusters, obtaining the final classification.
• During this second clustering step, it is possible to determine the number of clusters.
The user can either fix the number of clusters or let the algorithm search for the best one according to information criteria which are also based on goodness-of-fit measures
03/02/15 Cluster analysis for market segmentation
03/02/15 Cluster analysis for market segmentation
03/02/15 Cluster analysis for market segmentation
03/02/15 Cluster analysis for market segmentation
03/02/15 Cluster analysis for market segmentation
03/02/15 Cluster analysis for market segmentation
• It might seem that cluster analysis is too sensitive to the researcher’s choice.
• This is partly due to the relatively small data-set and possibly to correlation between variables
• However, all outputs point out to a segment with older and poorer household and another with younger and larger households, with high expenditures.
• By intensifying the search and adjusting some of the properties, cluster analysis does help identifying homogeneous groups.
• “Moral”: cluster analysis needs to be adequately validated and it may be risky to run a single cluster analysis and take the results as truly informative, especially in presence of outliers.
03/02/15 Cluster analysis for market segmentation
03/02/15 Cluster analysis for market segmentation
Sara DolnicarUniversity of Wollongong,
03/02/15 Cluster analysis for market segmentation
03/02/15 Cluster analysis for market segmentation
03/02/15 Cluster analysis for market segmentation
03/02/15 Cluster analysis for market segmentation
03/02/15 Cluster analysis for market segmentation
Leonard Kaufman and Peter Rousseeuw (2005), Finding Groups in Data: An Introduction to Cluster Analysis, Wiley Series in Probability and Statistics, 337 p.
Mark Aldenderfer and Roger Blashfield (1984), Cluster Analysis (Quantitative Applications in the Social Sciences), SAGE Publications, Inc., 90 p.
Brian Everitt, Sabine Landau and Morven Leese (2001) Cluster Analysis, Oxford University Press, 248 p.
Marketing Segmentation (http://www.beckmanmarketing8e.nelson.com/ppt/chapter03.pps. )
03/02/15 Cluster analysis for market segmentation

03/02/15 Cluster analysis for market segmentation

03/02/15 Cluster analysis for market segmentation