Embed Size (px)
Citation preview

IN DEGREE PROJECT COMPUTER SCIENCE AND ENGINEERING,SECOND CYCLE, 30 CREDITS
, STOCKHOLM SWEDEN 2017
Market Segmentation with Cluster Analysis based on Video Streaming Data
AMBJÖRN KARLSSON
KTH ROYAL INSTITUTE OF TECHNOLOGYSCHOOL OF COMPUTER SCIENCE AND COMMUNICATION
Market Segmentation with Cluster Analysis based onVideo Streaming Data
AMBJORN KARLSSON
Master’s thesis at the School of Computer Science and Communication,30 credits
KTHSupervisor: Dr Pawel HermanExaminor: Prof. Danica Kragic
17 september 2017
Market Segmentation with Cluster Analysis based on VideoStreaming Data
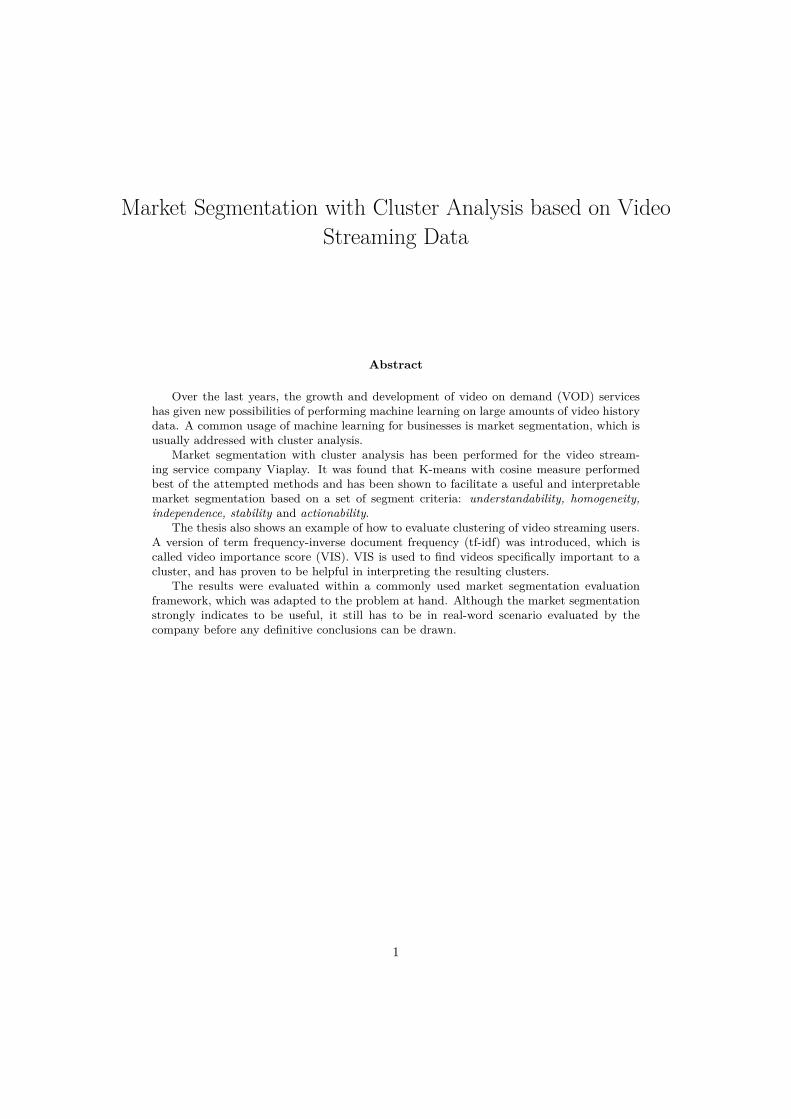
Abstract
Over the last years, the growth and development of video on demand (VOD) serviceshas given new possibilities of performing machine learning on large amounts of video historydata. A common usage of machine learning for businesses is market segmentation, which isusually addressed with cluster analysis.
Market segmentation with cluster analysis has been performed for the video stream-ing service company Viaplay. It was found that K-means with cosine measure performedbest of the attempted methods and has been shown to facilitate a useful and interpretablemarket segmentation based on a set of segment criteria: understandability, homogeneity,independence, stability and actionability.
The thesis also shows an example of how to evaluate clustering of video streaming users.A version of term frequency-inverse document frequency (tf-idf) was introduced, which iscalled video importance score (VIS). VIS is used to find videos specifically important to acluster, and has proven to be helpful in interpreting the resulting clusters.
The results were evaluated within a commonly used market segmentation evaluationframework, which was adapted to the problem at hand. Although the market segmentationstrongly indicates to be useful, it still has to be in real-word scenario evaluated by thecompany before any definitive conclusions can be drawn.
1
Marknadssegmentering med klustringsalgoritmer pa datafran streaming av filmer och TV-serier.
Sammanfattning
De senaste arens tillvaxt av video on demand-tjanster (VOD) har gett goda mojligheteratt tillampa maskininlarning pa stora mangder anvandardata over startade filmer och TV-serier. Ett vanligt anvandningsomrade for maskininlarning hos foretag ar marknadsseg-mentering, som da oftast genomfors med klustringsalgoritmer.
I foreliggande arbete har denna typ av marknadssegmentering genomforts i samarbetemed streamingforetaget Viaplay. Av de tillampade metoderna visade sig K-means medcosine-distance bast som avstandsmatt, och en anvandbar marknadssegmentering kundeskapas. Segmenteringens funktionalitet utvarderades utifran fem kriterier: begriplighet,homogenitet bland segmenten, oberoende mellan segmenten, stabilitet over tid och kapacitetatt generera beslutsunderlag.
Masteruppsatsen visar hur effektivt det gar att utvardera anvandarkluster hos en stream-ingtjanst. En variant av term frequency-inverse document frequency (tf-idf) skapades, ochfick benamningen video importance score (VIS). VIS anvandes for att hitta filmer och TV-serier som ar viktiga for ett segment och visade sig vara nodvandig for att begriplighetskri-teriet skulle uppnas.
Resultaten utvarderades med ett vanligt anvant utvarderingsramverk for marknadsseg-mentering, vilket anpassades till det specifika problemet. Rapporten visar att det ar troligtatt marknadssegmenteringen ar anvandbar, men for att helt bevisa detta maste den imple-menteras och utvarderas i praktiken.

AcknowledgementsFirst of all, I would like to thank Viaplay for giving me the opportunity to work with themon this Master’s thesis. A special thanks Fredrik, Cedric, Love and Kim at Viaplay’s analyticsteam for continuous feedback and interesting problem related discussions. I also want to thankmy supervisor Dr Pawel Herman, for his guidance and expertise throughout the work with thisthesis. Lastly, I would like to thank my family for their support during my studies.
List of Tables1 Example of a user-item matrix with customers and users and binary entries. . . . 112 Most viewed videos and videos with the highest VIS for a hypothetical cluster. . 123 User-to-center (u-to-c), center-to-center (c-to-c), and min c-to-c (the distance of
the two closest clusters) cosine distances for different clustering methods and set-tings. . . . . . . . . . . . . . . . . . . . . . . . . . . . . . . . . . . . . . . . . . . 16
4 The mean percentage of top 10 most popular videos watched by users (standarddeviation is given in brackets). Column one shows how many percent, on average,of the users in the test set that have seen the top 10 videos of the assigned cluster.Column two shows the average percentage of videos watched from top 10 mostpopular videos of other clusters (that the user is not assigned to). . . . . . . . . . 17
5 Genres for the top 8 VIS videos of each cluster when clustering with K-means into5 clusters. . . . . . . . . . . . . . . . . . . . . . . . . . . . . . . . . . . . . . . . . 18
6 Genres for the top 8 VIS videos of each cluster when clustering with K-means into6 clusters. . . . . . . . . . . . . . . . . . . . . . . . . . . . . . . . . . . . . . . . . 18
7 Genres for the top 8 VIS videos of each cluster when clustering with K-means into7 clusters. . . . . . . . . . . . . . . . . . . . . . . . . . . . . . . . . . . . . . . . . 19
8 Genres for the top 8 VIS videos of each cluster when clustering with K-means into8 clusters. . . . . . . . . . . . . . . . . . . . . . . . . . . . . . . . . . . . . . . . . 19
9 Genres for the top 8 VIS videos of each cluster when clustering with K-means into5 clusters. . . . . . . . . . . . . . . . . . . . . . . . . . . . . . . . . . . . . . . . . 20
10 Genres for the top VIS videos of the clustering with K-medoids into 5 clusters . . 2011 Genres for the top 8 VIS videos of each cluster when clustering with K-means into
5 clusters, only using data older than one year. . . . . . . . . . . . . . . . . . . . 2212 Genres for the top 8 VIS videos of each cluster when clustering with K-means into
5 clusters using only data from the last year. . . . . . . . . . . . . . . . . . . . . 2313 Genres for the top 8 VIS videos of each cluster when clustering with K-means into
5 clusters. . . . . . . . . . . . . . . . . . . . . . . . . . . . . . . . . . . . . . . . . 23
ii

List of Figures1 Examples of variables for segmentation bases categorised as general/product-
specific and observable/unobservable. . . . . . . . . . . . . . . . . . . . . . . . . . 52 Example of K-means clustering . . . . . . . . . . . . . . . . . . . . . . . . . . . . 73 Example of DBSCAN clustering . . . . . . . . . . . . . . . . . . . . . . . . . . . 74 NPS and 1 standard deviation error bar when clustering with K-means into 5
clusters. Each line comes from users belonging to the same cluster, where theNPS is calculated for users that answered within each time period. All datapoints consist of survey answers from at least 1000 respondents. Each time periodconsists of answers collected over the period of 3 months and each tick in they-axis corresponds to 5 in NPS. . . . . . . . . . . . . . . . . . . . . . . . . . . . . 22
iii
Contents
1 Introduction 11.1 Research question . . . . . . . . . . . . . . . . . . . . . . . . . . . . . . . . . . . . 21.2 Scope and objectives . . . . . . . . . . . . . . . . . . . . . . . . . . . . . . . . . . 2
2 Background 42.1 Market segmentation . . . . . . . . . . . . . . . . . . . . . . . . . . . . . . . . . . 42.2 Cluster analysis . . . . . . . . . . . . . . . . . . . . . . . . . . . . . . . . . . . . . 5
2.2.1 K-means . . . . . . . . . . . . . . . . . . . . . . . . . . . . . . . . . . . . . 52.2.2 DBSCAN . . . . . . . . . . . . . . . . . . . . . . . . . . . . . . . . . . . . 7
2.3 Collaborating company . . . . . . . . . . . . . . . . . . . . . . . . . . . . . . . . . 82.4 Related work . . . . . . . . . . . . . . . . . . . . . . . . . . . . . . . . . . . . . . 8
2.4.1 Similar Market segmentation attempts . . . . . . . . . . . . . . . . . . . . 82.4.2 State-of-the-art unsupervised methods for data driven market segmentation 92.4.3 Analysis of common research methodology for data driven market segmen-
tation . . . . . . . . . . . . . . . . . . . . . . . . . . . . . . . . . . . . . . 92.4.4 Collaborative Filtering . . . . . . . . . . . . . . . . . . . . . . . . . . . . . 10
3 Method 113.1 Dataset and representation . . . . . . . . . . . . . . . . . . . . . . . . . . . . . . 113.2 Video Importance Score (VIS) . . . . . . . . . . . . . . . . . . . . . . . . . . . . 113.3 Clustering algorithms . . . . . . . . . . . . . . . . . . . . . . . . . . . . . . . . . 123.4 Cluster evaluation . . . . . . . . . . . . . . . . . . . . . . . . . . . . . . . . . . . 13
3.4.1 Understandability . . . . . . . . . . . . . . . . . . . . . . . . . . . . . . . 133.4.2 Homogeneity and Independence . . . . . . . . . . . . . . . . . . . . . . . . 133.4.3 Actionability . . . . . . . . . . . . . . . . . . . . . . . . . . . . . . . . . . 143.4.4 Stability . . . . . . . . . . . . . . . . . . . . . . . . . . . . . . . . . . . . . 15
4 Result 164.1 Homogeneity and Independence . . . . . . . . . . . . . . . . . . . . . . . . . . . . 164.2 Understandability . . . . . . . . . . . . . . . . . . . . . . . . . . . . . . . . . . . 17
4.2.1 Spherical K-means . . . . . . . . . . . . . . . . . . . . . . . . . . . . . . . 174.2.2 K-means . . . . . . . . . . . . . . . . . . . . . . . . . . . . . . . . . . . . . 194.2.3 Spherical K-medoids . . . . . . . . . . . . . . . . . . . . . . . . . . . . . . 204.2.4 DBSCAN and hierarchical clustering . . . . . . . . . . . . . . . . . . . . . 20
4.3 Actionability . . . . . . . . . . . . . . . . . . . . . . . . . . . . . . . . . . . . . . 214.4 Stability . . . . . . . . . . . . . . . . . . . . . . . . . . . . . . . . . . . . . . . . . 22
5 Discussion 245.1 Market segmentation criteria . . . . . . . . . . . . . . . . . . . . . . . . . . . . . 245.2 Clustering methods comparison . . . . . . . . . . . . . . . . . . . . . . . . . . . . 245.3 Evaluation of thesis objectives . . . . . . . . . . . . . . . . . . . . . . . . . . . . . 255.4 Possible improvements and future work . . . . . . . . . . . . . . . . . . . . . . . 275.5 Ethics and sustainability . . . . . . . . . . . . . . . . . . . . . . . . . . . . . . . . 27
6 Conclusion 29
References 33
1 IntroductionThe use of machine learning has for a long time been an important part in business areas likefinance, telecom, marketing and retail and is continuously becoming more important in almostany business area [5]. One of the tasks that machine learning can be used to address is marketsegmentation, which has been one of the most researched marketing areas since its birth inthe 50’s[35, Chapter 1]. Companies that have managed to adapt their offering to one or moresegments of the markets have gained an advantage over the alternatives of mass marketing ormass producing [35]. As companies collect more data and more detailed data about customers,the advantages of targeting specific groups of homogeneous users compared to using a massmarketing approach will continue to grow.
Market segmentation is the process of dividing customers into coherent subgroups. Segment-ing customers can, for example, be used in product differentiation [9], segmentation, target-ing, positioning (STP) approach [22] or most importantly in customer relationship management(CRM) [16]. CRM is an essential part of any customer centric business and can be defined as ”thestrategy for building, managing and strengthening loyal and long-lasting customer relationships”[34]. Within CRM specifically, market segmentation plays an important role the customer iden-tification step, where it can be used to divide the customer basis into smaller groups of similarcustomers [23].
Market segmentation is most commonly performed with cluster analysis [10] [26]. The mostcommonly used cluster analysis methods for markets segmentation have been K-means andWard’s minimum variance method [10]. As historically K-means is such a common methodwith proven usability in almost any field, it is considered the standard approach when it comesto clustering. However, in the last couple of decades numerous methods for clustering have beenattempted, such as support vector clustering [15], self organizing feature maps [[16] [19] [18] [1]],genetic clustering algorithms [33] and artificial neural networks (ANN) [14].
Market segmentation can be performed with different segmentation bases, which are a set ofinput variables that the segmentation is based on. These variables can be categorized as generalor product specific [35]. General variables are variables that can be applied to any domain, e.g.demographic or lifestyle. Product specific variables on the other hand are more directed towardsbehavioral and domain specific variables such as purchase behavior or product usage. The choiceof segmentation basis will have a large effect on which market segments are found. When relyingon a particular set of variables as input for the market segmentation, the assumption is madethat similarities in these variables will correspond to similarities in the response to marketingefforts or product usage.
General variables are most commonly used as they are intuitive and easy to implement [33].However, Tsai et al [33] point out the risks of relying on such variables. Firstly, the assumptionthat customers with similar demographics and lifestyles will have similar purchasing behaviourmay not be true. Secondly, these variables may vary over time and thus be less useful. In theirresearch the purchase behavior is used as input variables. The authors demonstrate that it givesmore homogeneous purchasing patterns in the clusters than using demographic variables.
In this thesis the segmentation is based solely on behavioural variables; the segmentation wasperformed on information about video streams started by users. To the best of my knowledge,market segmentation based on video streams has not been attempted before. One of the benefitsby using only variables on customer’s behavior as a segmentation basis, is that resulting clustercan be found that are homogeneous in how the product is used, and thus easy to target. If,for example, a cluster that corresponds to watching a specific genre, the content of a marketingcampaign could be adapted after this information. This is different from clustering based ondemographic variables, where clusters could be found that are homogeneous with respect to
1
demographics but not homogeneous with respect to watched videos.To be able to distinct cluster specific preferences from interests in overall very popular videos,
a normalizing metric called video importance score (VIS) was introduced. VIS for a video andcluster indicate the importance of the video for the cluster. The score is calculated by normalizingthe popularity of a video within a cluster by the overall video popularity in the service. By sortingthe videos after the VIS, the most important videos for a cluster can be found.
1.1 Research questionThe key research question to be addressed in this thesis is whether a useful market segmentationcan be effectively performed on data of video streams started by users. In order to address it,usefulness criteria have to be first adopted.
Wedel and Kamakura [35] summarized six criteria, that frequently have been put forwardas indicators of effectiveness and profitability of marketing strategies. These are: identifiability,substantiality, accessibility, stability, responsiveness and actionability. The thesis proposes toreformulate and adopt these criteria to the young domain of video streaming. They can beinterpreted as follows:
• understandability - it can be understood what kind of users that are in each cluster, so thatthe users can be targeted properly.
• homogeneity - the users of the same cluster should be similar.
• independence - the users from different clusters behave differently.
• stability - the clustering is stable over time.
• actionability - the ability to provide guidance for decisions.
To capture the relevance of a market segmentation to the company, the usefulness criteriawere created in the discussion with the company. Structured data of started video streams forover 38 000 users and over 2000 different videos were made available. This enables investigationif based exclusively on the information about what users have watched is enough to captureclusters that fulfill the above mentioned criteria and thus can also be used in marketing efforts.
The use of such criteria also comes with the task of quantifying the results, which is challengingwhen there is no ground truth solution to the problem. The combined qualitative and quantitativeapproach was adopted to determine the level of criteria fulfillment. This approach helps inensuring that the clusters can be interpreted and understood by any relevant stakeholder of acompany.
1.2 Scope and objectivesThe research in this thesis is not aimed at method comparison so just a few selected unsupervisedlearning approaches are validated without particular emphasis on parameter tuning. The thesis isintended to investigate the possibility of clustering based on the customer behaviour of watchingmovies and series and identify a suitable evaluation framework.
The main objectives of this work are:
• To use unsupervised learning in order to create a market segmentation based on solelystarted streams by users.
• To find a way to adopt the success criteria for market segmentation for the video streamingservice domain, and evaluate the segmentation both quantitatively and qualitatively.
2

• To introduce a metric to normalize overall video popularity, in order to be able to findspecific video preferences within the clusters.
• To provide recommendation to the collaborating company on how to use cluster analysisfor market segmentation.
3
2 Background
2.1 Market segmentationThe concept of market segmentation was formally introduced by Smith [30]. He states thatmarket segmentation ”consist of viewing a heterogeneous market (one characterized by divergentdemand) as a number of smaller homogeneous markets in response to differing product pref-erences among important market segments”. With this way of looking at the video streamingmarket, the streaming users can be seen as a heterogeneous market, that can be separated intosmaller homogeneous groups depending on their video preferences (demand preferences).
There are no true labels for the segmentation of a set of users, which makes it difficult toevaluate the success of a segmentation. Wedel and Kamakura [35] have summarized 6 commoncriteria to determine the effectiveness and profitability of a segmentation:
• identifiability, meaning the ability to identify customers from each segment based on easilymeasurable variables.
• substantiality, which means that the segments should be large enough so that it is profitablefor the company to target. How small groups can be and still be profitable to target dependshighly on what kind of company is considered.
• accessibility is the ability for the company to reach the targeted segments.
• responsiveness means that each segment should respond uniquely to marketing efforts.
• stability - the segments should be stable and not change in behaviour or compositionover time, at least for a time period long enough to be able to identify the segments andimplement a segmented marketing strategy.
• actionability, which is the ability to provide guidance for decisions.
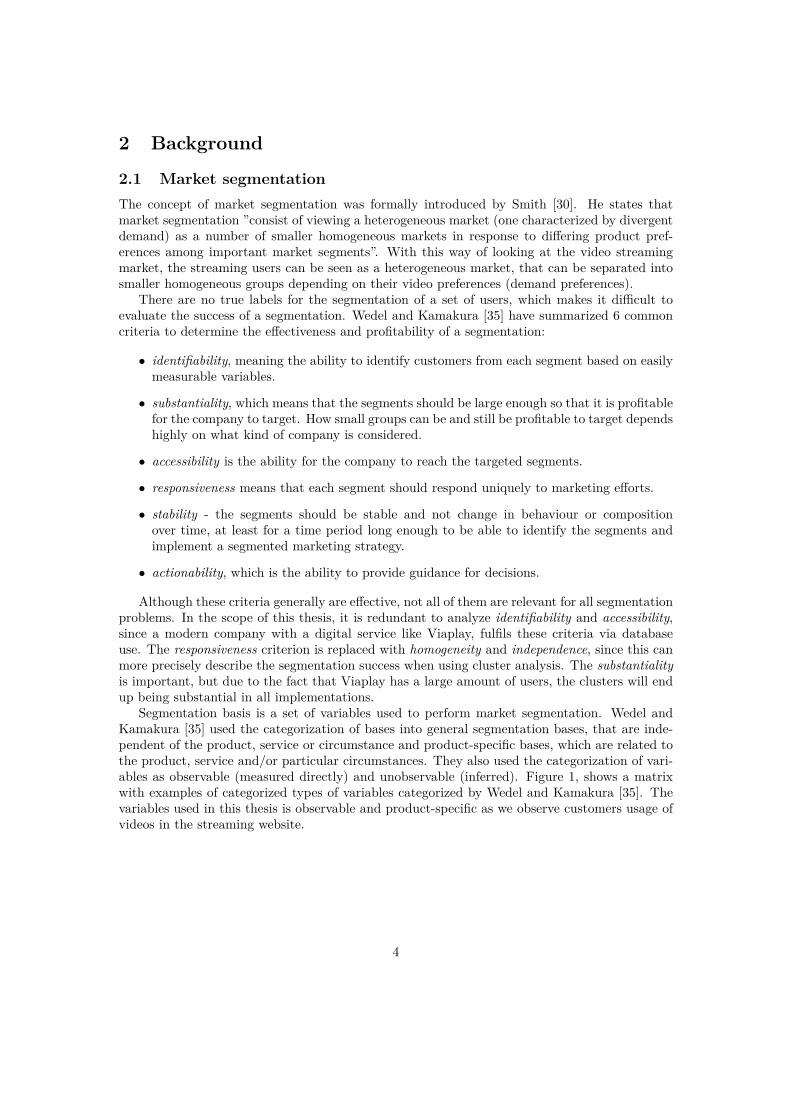
Although these criteria generally are effective, not all of them are relevant for all segmentationproblems. In the scope of this thesis, it is redundant to analyze identifiability and accessibility,since a modern company with a digital service like Viaplay, fulfils these criteria via databaseuse. The responsiveness criterion is replaced with homogeneity and independence, since this canmore precisely describe the segmentation success when using cluster analysis. The substantialityis important, but due to the fact that Viaplay has a large amount of users, the clusters will endup being substantial in all implementations.
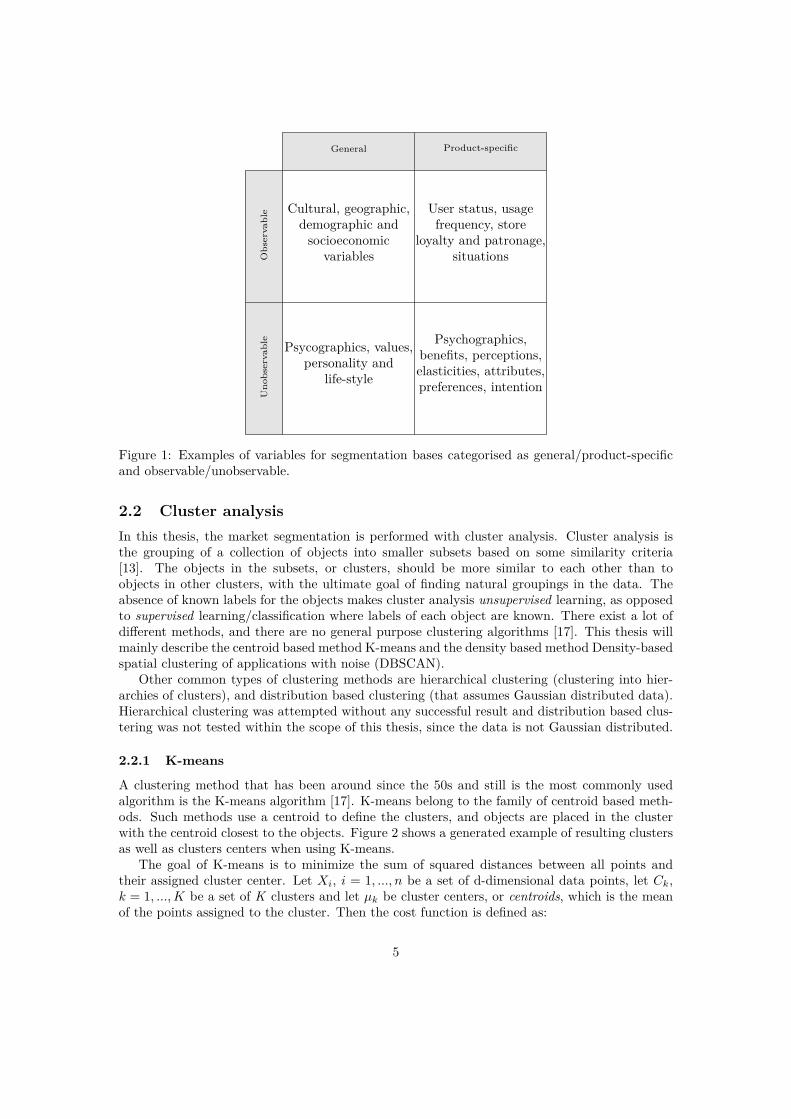
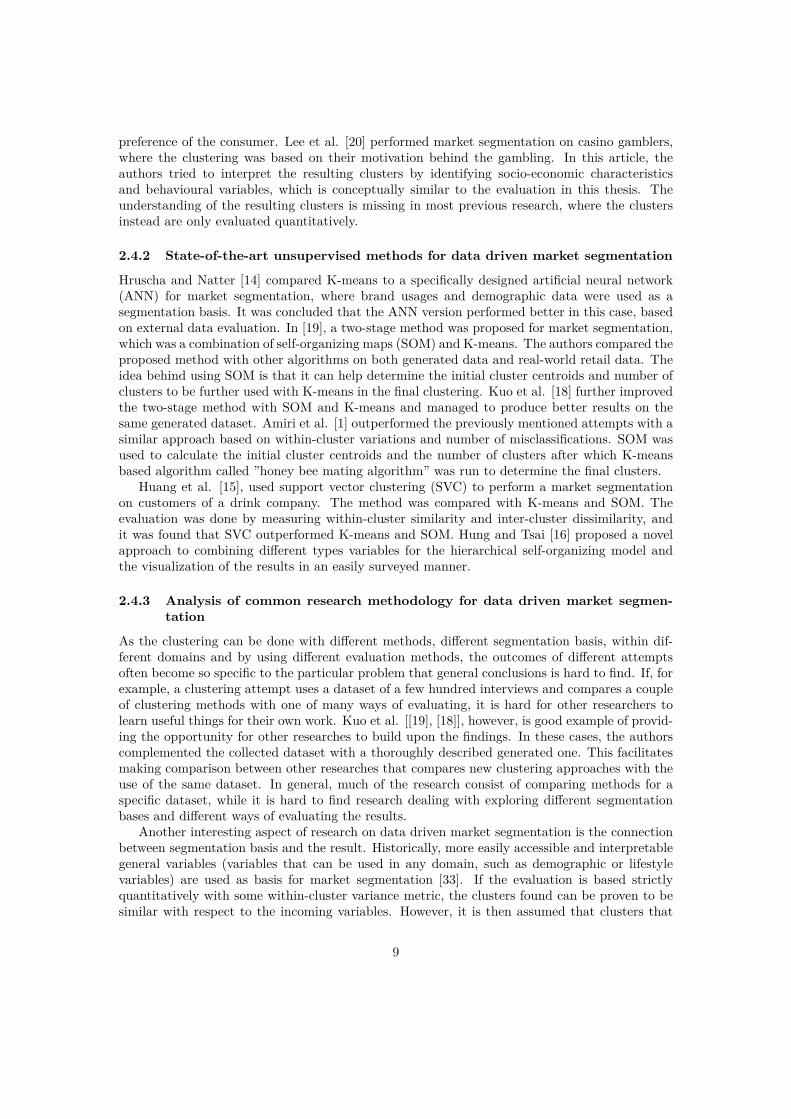
Segmentation basis is a set of variables used to perform market segmentation. Wedel andKamakura [35] used the categorization of bases into general segmentation bases, that are inde-pendent of the product, service or circumstance and product-specific bases, which are related tothe product, service and/or particular circumstances. They also used the categorization of vari-ables as observable (measured directly) and unobservable (inferred). Figure 1, shows a matrixwith examples of categorized types of variables categorized by Wedel and Kamakura [35]. Thevariables used in this thesis is observable and product-specific as we observe customers usage ofvideos in the streaming website.
4
General Product-specific
Obs
erva
ble
Uno
bser
vabl
e
Cultural, geographic,demographic and
socioeconomicvariables
User status, usagefrequency, store
loyalty and patronage,situations
Psycographics, values,personality and
life-style
Psychographics,benefits, perceptions,elasticities, attributes,preferences, intention
Figure 1: Examples of variables for segmentation bases categorised as general/product-specificand observable/unobservable.
2.2 Cluster analysisIn this thesis, the market segmentation is performed with cluster analysis. Cluster analysis isthe grouping of a collection of objects into smaller subsets based on some similarity criteria[13]. The objects in the subsets, or clusters, should be more similar to each other than toobjects in other clusters, with the ultimate goal of finding natural groupings in the data. Theabsence of known labels for the objects makes cluster analysis unsupervised learning, as opposedto supervised learning/classification where labels of each object are known. There exist a lot ofdifferent methods, and there are no general purpose clustering algorithms [17]. This thesis willmainly describe the centroid based method K-means and the density based method Density-basedspatial clustering of applications with noise (DBSCAN).
Other common types of clustering methods are hierarchical clustering (clustering into hier-archies of clusters), and distribution based clustering (that assumes Gaussian distributed data).Hierarchical clustering was attempted without any successful result and distribution based clus-tering was not tested within the scope of this thesis, since the data is not Gaussian distributed.
2.2.1 K-means
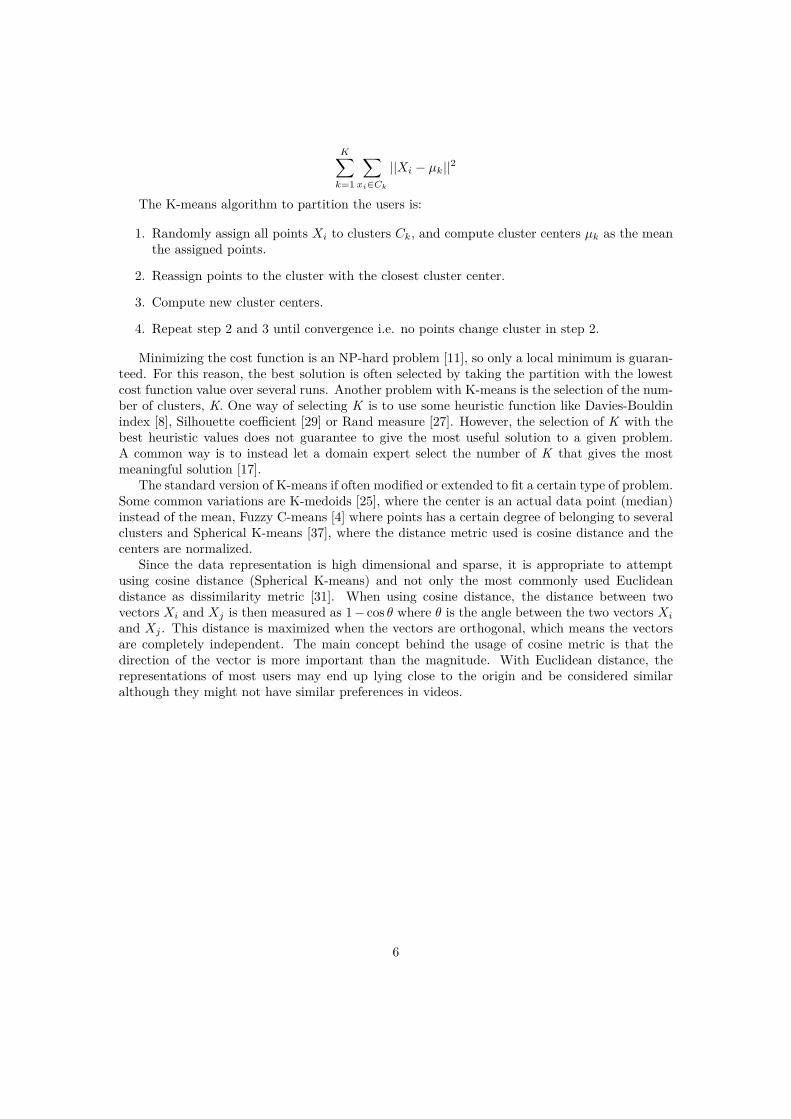
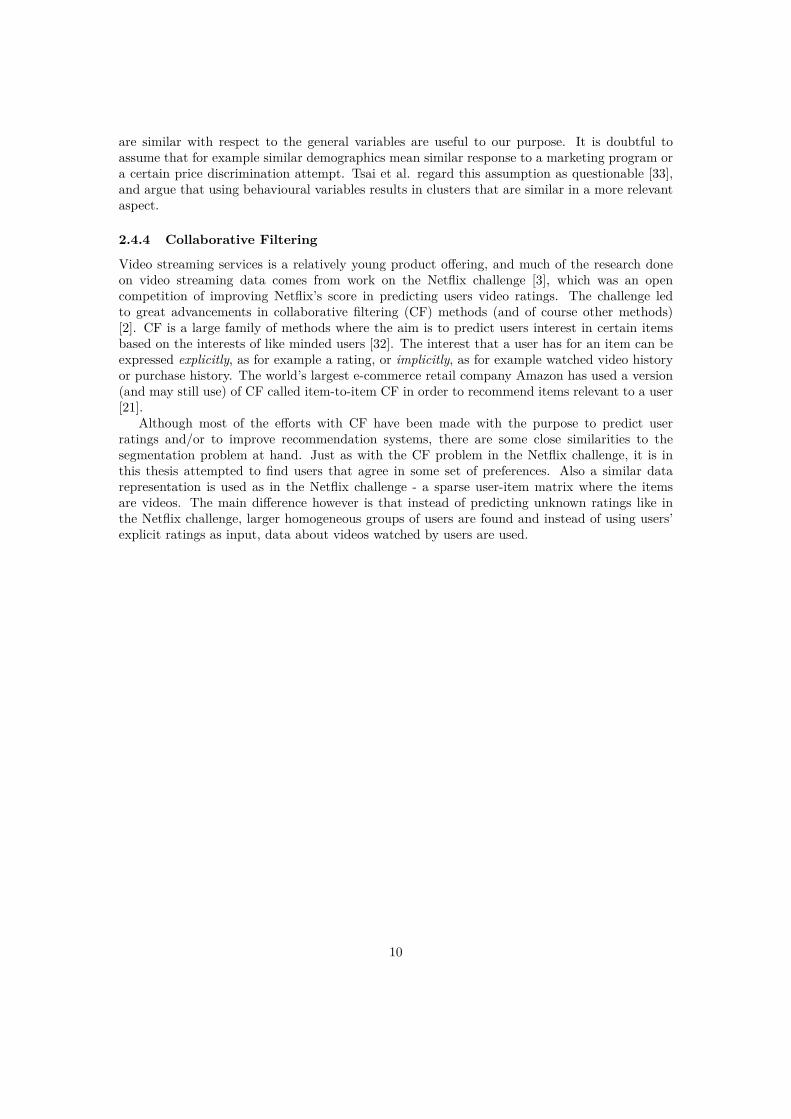
A clustering method that has been around since the 50s and still is the most commonly usedalgorithm is the K-means algorithm [17]. K-means belong to the family of centroid based meth-ods. Such methods use a centroid to define the clusters, and objects are placed in the clusterwith the centroid closest to the objects. Figure 2 shows a generated example of resulting clustersas well as clusters centers when using K-means.
The goal of K-means is to minimize the sum of squared distances between all points andtheir assigned cluster center. Let Xi, i = 1, ..., n be a set of d-dimensional data points, let Ck,k = 1, ...,K be a set of K clusters and let µk be cluster centers, or centroids, which is the meanof the points assigned to the cluster. Then the cost function is defined as:
5
K∑k=1
∑xi∈Ck
||Xi − µk||2
The K-means algorithm to partition the users is:
1. Randomly assign all points Xi to clusters Ck, and compute cluster centers µk as the meanthe assigned points.
2. Reassign points to the cluster with the closest cluster center.
3. Compute new cluster centers.
4. Repeat step 2 and 3 until convergence i.e. no points change cluster in step 2.
Minimizing the cost function is an NP-hard problem [11], so only a local minimum is guaran-teed. For this reason, the best solution is often selected by taking the partition with the lowestcost function value over several runs. Another problem with K-means is the selection of the num-ber of clusters, K. One way of selecting K is to use some heuristic function like Davies-Bouldinindex [8], Silhouette coefficient [29] or Rand measure [27]. However, the selection of K with thebest heuristic values does not guarantee to give the most useful solution to a given problem.A common way is to instead let a domain expert select the number of K that gives the mostmeaningful solution [17].
The standard version of K-means if often modified or extended to fit a certain type of problem.Some common variations are K-medoids [25], where the center is an actual data point (median)instead of the mean, Fuzzy C-means [4] where points has a certain degree of belonging to severalclusters and Spherical K-means [37], where the distance metric used is cosine distance and thecenters are normalized.
Since the data representation is high dimensional and sparse, it is appropriate to attemptusing cosine distance (Spherical K-means) and not only the most commonly used Euclideandistance as dissimilarity metric [31]. When using cosine distance, the distance between twovectors Xi and Xj is then measured as 1− cos θ where θ is the angle between the two vectors Xi
and Xj . This distance is maximized when the vectors are orthogonal, which means the vectorsare completely independent. The main concept behind the usage of cosine metric is that thedirection of the vector is more important than the magnitude. With Euclidean distance, therepresentations of most users may end up lying close to the origin and be considered similaralthough they might not have similar preferences in videos.
6
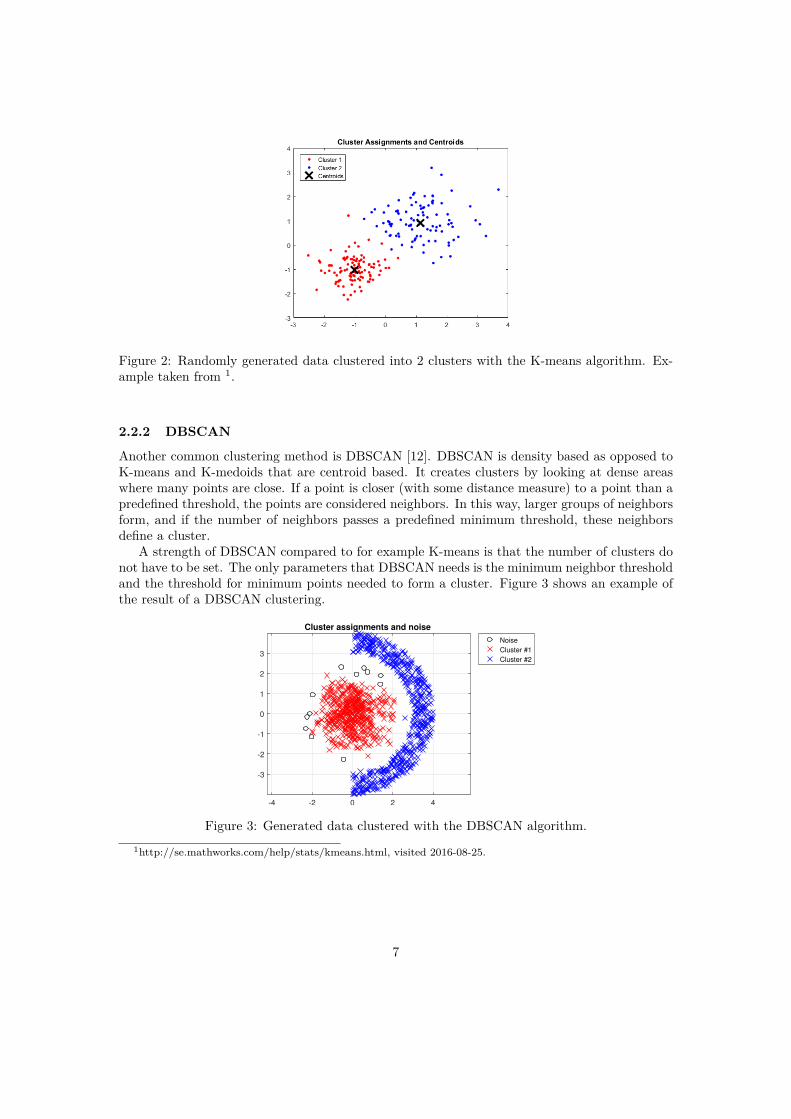
Figure 2: Randomly generated data clustered into 2 clusters with the K-means algorithm. Ex-ample taken from 1.
2.2.2 DBSCAN
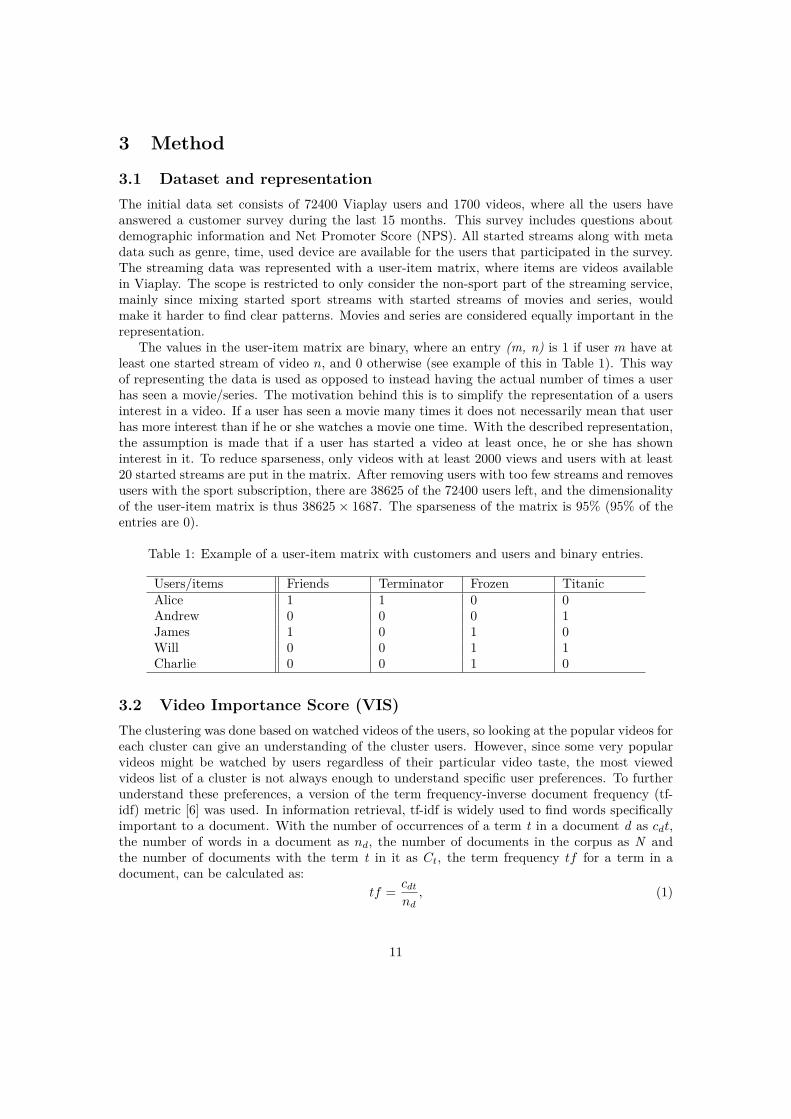
Another common clustering method is DBSCAN [12]. DBSCAN is density based as opposed toK-means and K-medoids that are centroid based. It creates clusters by looking at dense areaswhere many points are close. If a point is closer (with some distance measure) to a point than apredefined threshold, the points are considered neighbors. In this way, larger groups of neighborsform, and if the number of neighbors passes a predefined minimum threshold, these neighborsdefine a cluster.
A strength of DBSCAN compared to for example K-means is that the number of clusters donot have to be set. The only parameters that DBSCAN needs is the minimum neighbor thresholdand the threshold for minimum points needed to form a cluster. Figure 3 shows an example ofthe result of a DBSCAN clustering.
-4 -2 0 2 4
-3
-2
-1
0
1
2
3
Cluster assignments and noise
Noise
Cluster #1
Cluster #2
Figure 3: Generated data clustered with the DBSCAN algorithm.1http://se.mathworks.com/help/stats/kmeans.html, visited 2016-08-25.
7
2.3 Collaborating companyViaplay is a streaming service of Swedish media company MTG, with customers mainly inthe Nordic countries such as Sweden, Norway, Finland and Denmark. The service providesstreaming of movies, shows, series and various sport events. Viaplay offers two different maintypes of services: Viaplay and Viaplay Sport. The ordinary Viaplay service provides streamingof a broad range of series, shows and movies and it is from this part of the service data has beenmade available.
Both the service and the customer base of Viaplay have changed over the last years, whichmeans older data may not be relevant. For this reason, only data from the last year is used inthe market segmentation. For a streaming service provider, the customers are quite active, soone year worth of started streams is expected to be sufficient to identify individual preferences.
2.4 Related workCluster analysis for market segmentation has been researched and widely used in countless appli-cations within many differente business areas and with many different clustering methods. Punjand Stewart [26] compiled a list of 20 examples of when cluster analysis had been used for marketsegmentation. Dolnicar [10] more recently did a study of how market segmentation with clusteranalysis is generally conducted and what weaknesses earlier attempts commonly have. Of the243 articles included in that study, the average sample size is 698 with a maximum of 20 000. Theaverage number of variables is 11.5 with a maximum of 66. In this thesis, a data set with samplesize of over 38 000 with over 1700 variables was used, which in comparison to earlier attemptsis extremely high both in sample size and number of variables. Dolnicar citeresearchstats foundthat there is no correlation between the sample size and the number of variables used. This isproblematic as much of the research has a small sample size with a high number of variables. Theclustering algorithm will always give a result regardless of sample size, but the more variablesthat is used, the higher sample size is needed to find natural groupings.
Furthermore, Dolnicar [10] found Ward’s minimum variance method and K-means to be themost commonly used clustering methods reported in the literature. There is no single algorithmthat is fit for any problem, so it is up to the researcher to make sure that the chosen methods issuitable for the segmentation task.
As measure of similarity, Euclidean distance was used in 96% of the cases. Euclidean distanceis often adequate but has weaknesses when it comes to ordinal data. If Euclidean distance is usedwith categorical data, it is assumed equal distance for the intervals between categories, which is adoubtful assumption [10]. Strehl et al. [31] pointed out that cosine distance is more appropriatethan Euclidean distance when the data is sparse.
2.4.1 Similar Market segmentation attempts
Ozer [24] perfomed cluster analysis with fuzzy clustering on data from customer surveys aboutmusic interests and attitudes towards an online music community. The conclusion was that thereexist homogeneous groups of the potential customers of such a service. Although the article isover a decade old and a lot has happened on the internet since then, the finding of homogeneousgroups relate to the work in this thesis where clusters are found based on interest in videos.Tsai et al. [33] used a genetic clustering algorithm in order to perform market segmentation.The clustering was done based on purchase behaviour, with the assumption that similaritiesin purchase behaviours corresponds to a homogeneous response to marketing programs. Usingpurchase behaviour as a segmentation basis is somewhat comparable to data about users watchedvideo streams as basis - each started video stream can be seen as consumption based on the
8
preference of the consumer. Lee et al. [20] performed market segmentation on casino gamblers,where the clustering was based on their motivation behind the gambling. In this article, theauthors tried to interpret the resulting clusters by identifying socio-economic characteristicsand behavioural variables, which is conceptually similar to the evaluation in this thesis. Theunderstanding of the resulting clusters is missing in most previous research, where the clustersinstead are only evaluated quantitatively.
2.4.2 State-of-the-art unsupervised methods for data driven market segmentation
Hruscha and Natter [14] compared K-means to a specifically designed artificial neural network(ANN) for market segmentation, where brand usages and demographic data were used as asegmentation basis. It was concluded that the ANN version performed better in this case, basedon external data evaluation. In [19], a two-stage method was proposed for market segmentation,which was a combination of self-organizing maps (SOM) and K-means. The authors compared theproposed method with other algorithms on both generated data and real-world retail data. Theidea behind using SOM is that it can help determine the initial cluster centroids and number ofclusters to be further used with K-means in the final clustering. Kuo et al. [18] further improvedthe two-stage method with SOM and K-means and managed to produce better results on thesame generated dataset. Amiri et al. [1] outperformed the previously mentioned attempts with asimilar approach based on within-cluster variations and number of misclassifications. SOM wasused to calculate the initial cluster centroids and the number of clusters after which K-meansbased algorithm called ”honey bee mating algorithm” was run to determine the final clusters.
Huang et al. [15], used support vector clustering (SVC) to perform a market segmentationon customers of a drink company. The method was compared with K-means and SOM. Theevaluation was done by measuring within-cluster similarity and inter-cluster dissimilarity, andit was found that SVC outperformed K-means and SOM. Hung and Tsai [16] proposed a novelapproach to combining different types variables for the hierarchical self-organizing model andthe visualization of the results in an easily surveyed manner.
2.4.3 Analysis of common research methodology for data driven market segmen-tation
As the clustering can be done with different methods, different segmentation basis, within dif-ferent domains and by using different evaluation methods, the outcomes of different attemptsoften become so specific to the particular problem that general conclusions is hard to find. If, forexample, a clustering attempt uses a dataset of a few hundred interviews and compares a coupleof clustering methods with one of many ways of evaluating, it is hard for other researchers tolearn useful things for their own work. Kuo et al. [[19], [18]], however, is good example of provid-ing the opportunity for other researches to build upon the findings. In these cases, the authorscomplemented the collected dataset with a thoroughly described generated one. This facilitatesmaking comparison between other researches that compares new clustering approaches with theuse of the same dataset. In general, much of the research consist of comparing methods for aspecific dataset, while it is hard to find research dealing with exploring different segmentationbases and different ways of evaluating the results.
Another interesting aspect of research on data driven market segmentation is the connectionbetween segmentation basis and the result. Historically, more easily accessible and interpretablegeneral variables (variables that can be used in any domain, such as demographic or lifestylevariables) are used as basis for market segmentation [33]. If the evaluation is based strictlyquantitatively with some within-cluster variance metric, the clusters found can be proven to besimilar with respect to the incoming variables. However, it is then assumed that clusters that
9
are similar with respect to the general variables are useful to our purpose. It is doubtful toassume that for example similar demographics mean similar response to a marketing program ora certain price discrimination attempt. Tsai et al. regard this assumption as questionable [33],and argue that using behavioural variables results in clusters that are similar in a more relevantaspect.
2.4.4 Collaborative Filtering
Video streaming services is a relatively young product offering, and much of the research doneon video streaming data comes from work on the Netflix challenge [3], which was an opencompetition of improving Netflix’s score in predicting users video ratings. The challenge ledto great advancements in collaborative filtering (CF) methods (and of course other methods)[2]. CF is a large family of methods where the aim is to predict users interest in certain itemsbased on the interests of like minded users [32]. The interest that a user has for an item can beexpressed explicitly, as for example a rating, or implicitly, as for example watched video historyor purchase history. The world’s largest e-commerce retail company Amazon has used a version(and may still use) of CF called item-to-item CF in order to recommend items relevant to a user[21].
Although most of the efforts with CF have been made with the purpose to predict userratings and/or to improve recommendation systems, there are some close similarities to thesegmentation problem at hand. Just as with the CF problem in the Netflix challenge, it is inthis thesis attempted to find users that agree in some set of preferences. Also a similar datarepresentation is used as in the Netflix challenge - a sparse user-item matrix where the itemsare videos. The main difference however is that instead of predicting unknown ratings like inthe Netflix challenge, larger homogeneous groups of users are found and instead of using users’explicit ratings as input, data about videos watched by users are used.
10
3 Method
3.1 Dataset and representationThe initial data set consists of 72400 Viaplay users and 1700 videos, where all the users haveanswered a customer survey during the last 15 months. This survey includes questions aboutdemographic information and Net Promoter Score (NPS). All started streams along with metadata such as genre, time, used device are available for the users that participated in the survey.The streaming data was represented with a user-item matrix, where items are videos availablein Viaplay. The scope is restricted to only consider the non-sport part of the streaming service,mainly since mixing started sport streams with started streams of movies and series, wouldmake it harder to find clear patterns. Movies and series are considered equally important in therepresentation.
The values in the user-item matrix are binary, where an entry (m, n) is 1 if user m have atleast one started stream of video n, and 0 otherwise (see example of this in Table 1). This wayof representing the data is used as opposed to instead having the actual number of times a userhas seen a movie/series. The motivation behind this is to simplify the representation of a usersinterest in a video. If a user has seen a movie many times it does not necessarily mean that userhas more interest than if he or she watches a movie one time. With the described representation,the assumption is made that if a user has started a video at least once, he or she has showninterest in it. To reduce sparseness, only videos with at least 2000 views and users with at least20 started streams are put in the matrix. After removing users with too few streams and removesusers with the sport subscription, there are 38625 of the 72400 users left, and the dimensionalityof the user-item matrix is thus 38625 × 1687. The sparseness of the matrix is 95% (95% of theentries are 0).
Table 1: Example of a user-item matrix with customers and users and binary entries.
Users/items Friends Terminator Frozen TitanicAlice 1 1 0 0Andrew 0 0 0 1James 1 0 1 0Will 0 0 1 1Charlie 0 0 1 0
3.2 Video Importance Score (VIS)The clustering was done based on watched videos of the users, so looking at the popular videos foreach cluster can give an understanding of the cluster users. However, since some very popularvideos might be watched by users regardless of their particular video taste, the most viewedvideos list of a cluster is not always enough to understand specific user preferences. To furtherunderstand these preferences, a version of the term frequency-inverse document frequency (tf-idf) metric [6] was used. In information retrieval, tf-idf is widely used to find words specificallyimportant to a document. With the number of occurrences of a term t in a document d as cdt,the number of words in a document as nd, the number of documents in the corpus as N andthe number of documents with the term t in it as Ct, the term frequency tf for a term in adocument, can be calculated as:
tf = cdt
nd, (1)
11
the inverse document frequency (IDF) can be calculated as:
idf = log(NCt
) (2)
And finally the tf-idf then is calculated as
tf − idf = tf × idf = cd
nd× log(N
Ct) (3)
In this thesis, the same concept was used to find videos specifically important to a cluster.Let Mc be the number of users in a cluster, N be the number of total users, wvc be the number ofusers within a cluster that have seen a video and twv be the total number of users that has seena video. In this thesis the video importance score (VIS) for a video v in a cluster c is proposedas:
V ISvc = wvc
Mc× log( N
twv) (4)
The wvc
Mcfactor will be higher the more popular a video is within a cluster. On the other hand,
the log( N
twV)-factor will be lower the more popular a video is overall. The motivation of taking
the logarithm here is simply because of the fact that it has been proven to be sound in the tf-idfmetric.
The highest VIS within a cluster is achieved by videos that are popular within the cluster,but not very popular in general. If a video was to, for example, be seen by all users, the secondfactor would be 0, meaning that the video is not specifically important for any cluster.
Table 2 shows, for a set of famous videos with made up watching frequencies, how videopopularity within the cluster and video popularity overall affects the VIS. Let the cluster have3000 users out of a total of 18000 users, i.e. M = 3000 and N = 18000. ”Titanic” and ”TheHangover” are the most popular videos of this cluster. These videos are however also verypopular overall (see column tw) and will have many views in other clusters as well. ”How to beSingle” and ”Trainwreck” are also popular in this cluster, almost a third of the clusters usershas seen them. These videos are not that popular overall; only around 7% of all the users haveseen them. As a result of this, these videos have higher values in the log( N
twV)-factor and thus
also higher VIS than ”Titanic” and ”The Hangover”. The movie ”Her” is also overrepresented inthis cluster, but has too few views to get a high score. Without logarithming N
twV, ”Her” would
have obtained the highest VIS.
Table 2: Most viewed videos and videos with the highest VIS for a hypothetical cluster.
Video w twwvc
Mclog(
N
twv) VIS
Titanic 1320 6721 0,44 0,43 0,19The Hangover 1200 6595 0,4 0,44 0,17How to be Single 890 1301 0,297 1,14 0,34Trainwreck 725 1421 0,241 1,10 0,27Her 17 22 0,006 2,91 0,017
3.3 Clustering algorithmsThree different centroid based methods were used for cluster analysis: K-means, Spherical K-medoids with cosine distance and spherical K-means (K-means with cosine distance). DBSCAN
12
with cosine distance and a standard Matlab implementation of agglomerate hierarchical clustering2 with cosine distance was attempted without any successful results.
Since the data is high dimensional and sparse, it is appropriate to attempt to use cosinedistance as a dissimilarity measure instead of just the common Euclidean distance [31]. Thecosine distance d between two vectors xi and xj is measured as
d = 1− cosθ = 1− xi · xj
|xi||xj |(5)
where θ is the angle between the two vectors. The main concept behind the usage of cosinedistance is that the direction of the vector is more important than the magnitude. With Euclideandistance as dissimilarity metric, the vector representation of many users could potentially lie closenear the origin and be considered similar, although the users may not have similar preferencesin videos.
3.4 Cluster evaluationThe cluster evaluation was done with respect to the criteria mentioned in subsection 1.1: under-standability, homogeneity, independence, stability and actionability, that was decided on uponconversions with the company to best fit the problem.
3.4.1 Understandability
If the company wants to target users from a certain segment, they need to understand what kindsof users belonging to a cluster. To understand the video taste of users belonging to each of theclusters, the genres of the videos with the highest VIS was identified. These genres should be thesame or similar for a cluster to be understandable. If a cluster is easily labeled after the videogenre/genres represented in the top VIS videos in the cluster, it is understandable. Clusterscould for example be labeled ’romantic comedies’, ’action/thriller’ or ’children’ for example. Thevideo genres are based on the genres classified by Internet Movie Database (IMDb) 3 .
3.4.2 Homogeneity and Independence
To examine homogeneity and independence of the clusters, the cosine distance between thevector representations of the centers and samples was observed. Homogeneity in a cluster is thedegree to which the members of the clusters are similar. Homogeneity for a clustering resultwas measured as the average cosine distance between all users in all clusters and their respectiveassigned cluster centroid, and is referred to as average user-to-centroid (u-to-c) cosine distance.Let Xi, i = 1, ..., n be the vector representations of all the users, let Ck, k = 1, ...,K be the setof K resulting clusters and let µk be cluster centroids. Then the average user-to-centroid cosinedistance is calculated as:
average u–to–c = 1n
n∑i=1
∑xi∈Ck
(1− xi · µk
|xi||µk|)
The independence of the resulting clusters instead is the degree to which the users of a clusterare not similar to users from other clusters. For a cluster result, this is measured as the averagecosine distance between clusters’ centroids and is referred to as average centroid-to-centroid cosine
2http://se.mathworks.com/help/stats/linkage.html, visited 2016-08-29.3IMDB.com, A database of movies, actors, production crew etc, with over 25 million registered users
13
distance. Longer average centroid-to-centroid distance for a clustering imply more independence.The average centroid-to-centroid distance was calculated as:
average c–to–c = 1K ∗ (K − 1)
K∑i=1
K∑j=1
(1− µi · µj
|µi||µj |), i 6= j
In an attempt to understand agreement/disagreement in video preferences, watching frequen-cies of the most popular videos of the cluster that each user was assigned to was observed. Thesevideos was excluded in the cluster assignment process, and the users that the interest are mea-sured for was not part of the creation of the clusters. The popular video interest was measuredin the following way:
1. Randomly divide the users into a train set (85%) and a test set (15%) and train clustercentroids with the train set.
2. Assign the users in the test set to the best matching cluster.
3. For the users in the test set, identify how many of the top 10 titles they have seen from(a) the top list of the assigned cluster, (b) the top list of other clusters (c) the overall mostwatched videos in the service (to compare with)
4. Repeat this procedure 5 times for all users and calculate the average values and standarddeviation.
While the first described average c-to-c and average u-to-c cosine distances were used to eval-uate the independence and homogeneity, the frequencies of which users watch clusters’ popularvideos can strengthen and/or provide interpretability to the result. The more videos the usershave watched from the assigned clusters’ top list, the more homogeneity among the users assignedto the clusters. On the other hand, the fewer of the videos of other clusters’ top lists users haveseen, the more independent are the clusters. For example, if the users watch the most popularvideos of the assigned cluster considerably more than the videos that are overall most popular inthe service, it shows that users assigned to the same cluster share some common characteristics.On the other hand, if users do not watch videos that are popular in the assigned cluster morethan the most popular videos overall, it may be hard to conclude what distinguishes the prefer-ences of the users in different clusters. The most popular videos in clusters are not considered inthe process of making cluster assignments for the test set users, so it is not guaranteed that usershave watched the most popular videos of the assigned cluster more than other popular videos.
3.4.3 Actionability
Actionability is the ability to provide guidance for decisions, which is hard to evaluate withoutthe segmentation being used by the company in practice. Mainly, the clustering can help thecompany in targeting a preferred subset of the customers. For example, they can adapt themarketing of videos after what kind of taste the users of the respective clusters in general have,identify tendencies in churn rate in different clusters in order to prevent it or simply identifysegments especially important to the business and adapt the offering to improve the experienceof that group.
In an attempt to show potential actionability of the cluster results, the segmentation’s abilityof finding homogeneous groups with higher/lower Net Promotor Score (NPS) [28] was evaluated.NPS correlates with satisfied customers, which is valuable for Viaplay to learn. NPS is a popularevaluation method which Viaplay uses, where the customers is asked how likely it is that he or
14
she would recommend the company to a friend or colleague. Based on the customers responsein the scale 0-10, they are classified as detractors (0-6), passively satisfied (7-8) or promoters(9-10). Let the number of detractors be d, the number of promoters be a and the total numberof respondents be N . The NPS score is then simply calculated as the difference between thepercentage of detractors and the percentage of promoters:
NPS = 100(a− bN
) −100 ≤ NPS ≤ 100 (6)
The main concept of this measure is that customer loyalty correlates highly with growth, anda customer is loyal if he or she responds at least 9 to the question. Customers responding a 6 orlower to the question is less likely to be loyal and give value to the company.
The NPS is continuously measured by the company through voluntary customer surveys.The survey responses are from different dates, so changes in the service over time have to beconsidered. For this reason, the NPS for each cluster was categorized into 3-month long timeperiods, which is long enough to ensure a sufficient number of respondents (around 1000 for eachcluster and time period). Identifying specific customer groups with significantly higher or lowerNPS than other clusters can be of great value for a company, since this can help in understandingweaknesses and strengths of specific areas of the service.
3.4.4 Stability
The stability part of the evaluation consisted in identifying pattern changes in the data overtime. If the patterns changes significantly, old data might not be relevant when segmenting theusers. Also, if the data are very unstable, there will not be enough time for the company todevelop ways to target the segments. The Viaplay service changes over time - some videos areremoved and some videos are added and different videos are advertised, which means that videohistory is dependent on when the user was exploiting the service. There is also a constant changeof customer base - the service might grow, the company might target a certain segment withmarketing effort etc. Changes in the customer base will lead to changes in the distribution ofthe segments and new types of segments may form.
The vector representations of users will be different in the old and new data since the vectordepends on what videos that are available in the service. Because of this, similarity of old andnew data centroids cannot be compared using any distance metric like cosine metric. Instead,clustering was performed with old and new data respectively, after which genres of the top VISvideos’ were compared. The new data consisted of all started streams within the last year, whileold data includes started streams before the last year. Stability was then evaluated by observingif all the resulting clusters with the new data that have the same or almost the same genresrepresented in the top VIS videos as when clustering with the old data.
15
4 ResultThis section presents the results of performing the market segmentation with respects to theusefulness criteria mentioned in the research question in 1.1.
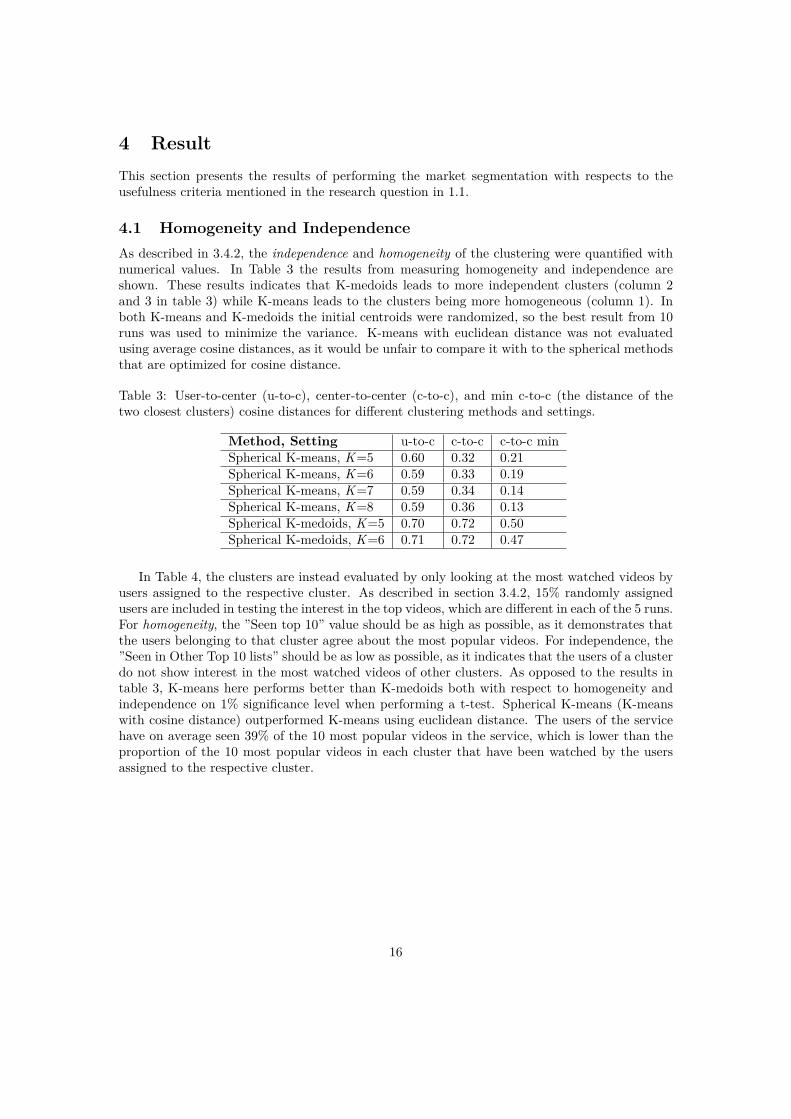
4.1 Homogeneity and IndependenceAs described in 3.4.2, the independence and homogeneity of the clustering were quantified withnumerical values. In Table 3 the results from measuring homogeneity and independence areshown. These results indicates that K-medoids leads to more independent clusters (column 2and 3 in table 3) while K-means leads to the clusters being more homogeneous (column 1). Inboth K-means and K-medoids the initial centroids were randomized, so the best result from 10runs was used to minimize the variance. K-means with euclidean distance was not evaluatedusing average cosine distances, as it would be unfair to compare it with to the spherical methodsthat are optimized for cosine distance.
Table 3: User-to-center (u-to-c), center-to-center (c-to-c), and min c-to-c (the distance of thetwo closest clusters) cosine distances for different clustering methods and settings.
Method, Setting u-to-c c-to-c c-to-c minSpherical K-means, K=5 0.60 0.32 0.21Spherical K-means, K=6 0.59 0.33 0.19Spherical K-means, K=7 0.59 0.34 0.14Spherical K-means, K=8 0.59 0.36 0.13Spherical K-medoids, K=5 0.70 0.72 0.50Spherical K-medoids, K=6 0.71 0.72 0.47
In Table 4, the clusters are instead evaluated by only looking at the most watched videos byusers assigned to the respective cluster. As described in section 3.4.2, 15% randomly assignedusers are included in testing the interest in the top videos, which are different in each of the 5 runs.For homogeneity, the ”Seen top 10” value should be as high as possible, as it demonstrates thatthe users belonging to that cluster agree about the most popular videos. For independence, the”Seen in Other Top 10 lists” should be as low as possible, as it indicates that the users of a clusterdo not show interest in the most watched videos of other clusters. As opposed to the results intable 3, K-means here performs better than K-medoids both with respect to homogeneity andindependence on 1% significance level when performing a t-test. Spherical K-means (K-meanswith cosine distance) outperformed K-means using euclidean distance. The users of the servicehave on average seen 39% of the 10 most popular videos in the service, which is lower than theproportion of the 10 most popular videos in each cluster that have been watched by the usersassigned to the respective cluster.
16
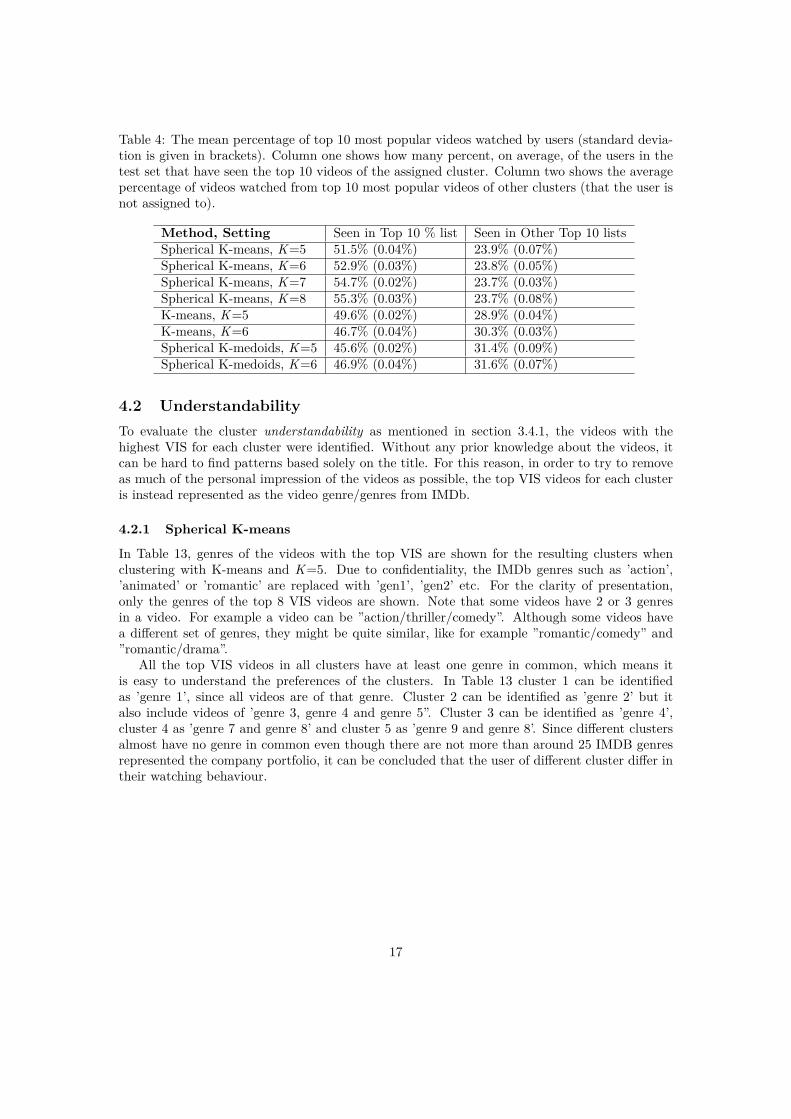
Table 4: The mean percentage of top 10 most popular videos watched by users (standard devia-tion is given in brackets). Column one shows how many percent, on average, of the users in thetest set that have seen the top 10 videos of the assigned cluster. Column two shows the averagepercentage of videos watched from top 10 most popular videos of other clusters (that the user isnot assigned to).
Method, Setting Seen in Top 10 % list Seen in Other Top 10 listsSpherical K-means, K=5 51.5% (0.04%) 23.9% (0.07%)Spherical K-means, K=6 52.9% (0.03%) 23.8% (0.05%)Spherical K-means, K=7 54.7% (0.02%) 23.7% (0.03%)Spherical K-means, K=8 55.3% (0.03%) 23.7% (0.08%)K-means, K=5 49.6% (0.02%) 28.9% (0.04%)K-means, K=6 46.7% (0.04%) 30.3% (0.03%)Spherical K-medoids, K=5 45.6% (0.02%) 31.4% (0.09%)Spherical K-medoids, K=6 46.9% (0.04%) 31.6% (0.07%)
4.2 UnderstandabilityTo evaluate the cluster understandability as mentioned in section 3.4.1, the videos with thehighest VIS for each cluster were identified. Without any prior knowledge about the videos, itcan be hard to find patterns based solely on the title. For this reason, in order to try to removeas much of the personal impression of the videos as possible, the top VIS videos for each clusteris instead represented as the video genre/genres from IMDb.
4.2.1 Spherical K-means
In Table 13, genres of the videos with the top VIS are shown for the resulting clusters whenclustering with K-means and K=5. Due to confidentiality, the IMDb genres such as ’action’,’animated’ or ’romantic’ are replaced with ’gen1’, ’gen2’ etc. For the clarity of presentation,only the genres of the top 8 VIS videos are shown. Note that some videos have 2 or 3 genresin a video. For example a video can be ”action/thriller/comedy”. Although some videos havea different set of genres, they might be quite similar, like for example ”romantic/comedy” and”romantic/drama”.
All the top VIS videos in all clusters have at least one genre in common, which means itis easy to understand the preferences of the clusters. In Table 13 cluster 1 can be identifiedas ’genre 1’, since all videos are of that genre. Cluster 2 can be identified as ’genre 2’ but italso include videos of ’genre 3, genre 4 and genre 5”. Cluster 3 can be identified as ’genre 4’,cluster 4 as ’genre 7 and genre 8’ and cluster 5 as ’genre 9 and genre 8’. Since different clustersalmost have no genre in common even though there are not more than around 25 IMDB genresrepresented the company portfolio, it can be concluded that the user of different cluster differ intheir watching behaviour.
17
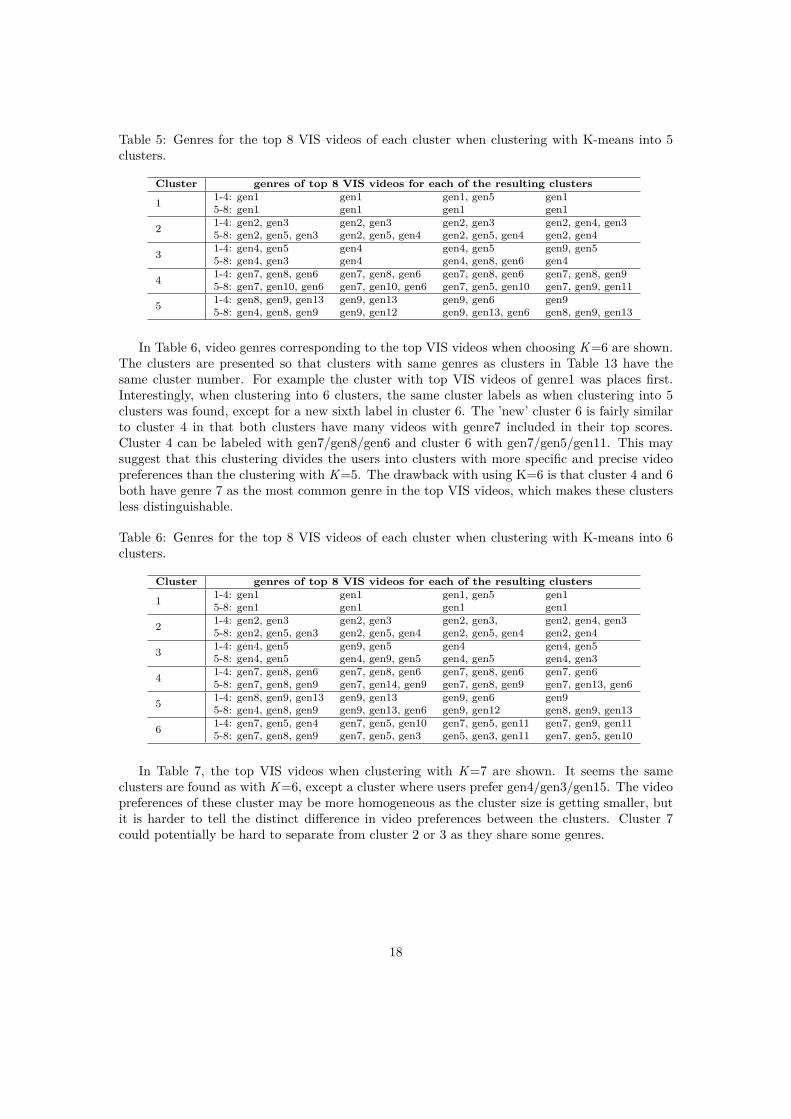
Table 5: Genres for the top 8 VIS videos of each cluster when clustering with K-means into 5clusters.
Cluster genres of top 8 VIS videos for each of the resulting clusters
1 1-4: gen1 gen1 gen1, gen5 gen15-8: gen1 gen1 gen1 gen1
2 1-4: gen2, gen3 gen2, gen3 gen2, gen3 gen2, gen4, gen35-8: gen2, gen5, gen3 gen2, gen5, gen4 gen2, gen5, gen4 gen2, gen4
3 1-4: gen4, gen5 gen4 gen4, gen5 gen9, gen55-8: gen4, gen3 gen4 gen4, gen8, gen6 gen4
4 1-4: gen7, gen8, gen6 gen7, gen8, gen6 gen7, gen8, gen6 gen7, gen8, gen95-8: gen7, gen10, gen6 gen7, gen10, gen6 gen7, gen5, gen10 gen7, gen9, gen11
5 1-4: gen8, gen9, gen13 gen9, gen13 gen9, gen6 gen95-8: gen4, gen8, gen9 gen9, gen12 gen9, gen13, gen6 gen8, gen9, gen13
In Table 6, video genres corresponding to the top VIS videos when choosing K=6 are shown.The clusters are presented so that clusters with same genres as clusters in Table 13 have thesame cluster number. For example the cluster with top VIS videos of genre1 was places first.Interestingly, when clustering into 6 clusters, the same cluster labels as when clustering into 5clusters was found, except for a new sixth label in cluster 6. The ’new’ cluster 6 is fairly similarto cluster 4 in that both clusters have many videos with genre7 included in their top scores.Cluster 4 can be labeled with gen7/gen8/gen6 and cluster 6 with gen7/gen5/gen11. This maysuggest that this clustering divides the users into clusters with more specific and precise videopreferences than the clustering with K=5. The drawback with using K=6 is that cluster 4 and 6both have genre 7 as the most common genre in the top VIS videos, which makes these clustersless distinguishable.
Table 6: Genres for the top 8 VIS videos of each cluster when clustering with K-means into 6clusters.
Cluster genres of top 8 VIS videos for each of the resulting clusters
1 1-4: gen1 gen1 gen1, gen5 gen15-8: gen1 gen1 gen1 gen1
2 1-4: gen2, gen3 gen2, gen3 gen2, gen3, gen2, gen4, gen35-8: gen2, gen5, gen3 gen2, gen5, gen4 gen2, gen5, gen4 gen2, gen4
3 1-4: gen4, gen5 gen9, gen5 gen4 gen4, gen55-8: gen4, gen5 gen4, gen9, gen5 gen4, gen5 gen4, gen3
4 1-4: gen7, gen8, gen6 gen7, gen8, gen6 gen7, gen8, gen6 gen7, gen65-8: gen7, gen8, gen9 gen7, gen14, gen9 gen7, gen8, gen9 gen7, gen13, gen6
5 1-4: gen8, gen9, gen13 gen9, gen13 gen9, gen6 gen95-8: gen4, gen8, gen9 gen9, gen13, gen6 gen9, gen12 gen8, gen9, gen13
6 1-4: gen7, gen5, gen4 gen7, gen5, gen10 gen7, gen5, gen11 gen7, gen9, gen115-8: gen7, gen8, gen9 gen7, gen5, gen3 gen5, gen3, gen11 gen7, gen5, gen10
In Table 7, the top VIS videos when clustering with K=7 are shown. It seems the sameclusters are found as with K=6, except a cluster where users prefer gen4/gen3/gen15. The videopreferences of these cluster may be more homogeneous as the cluster size is getting smaller, butit is harder to tell the distinct difference in video preferences between the clusters. Cluster 7could potentially be hard to separate from cluster 2 or 3 as they share some genres.
18
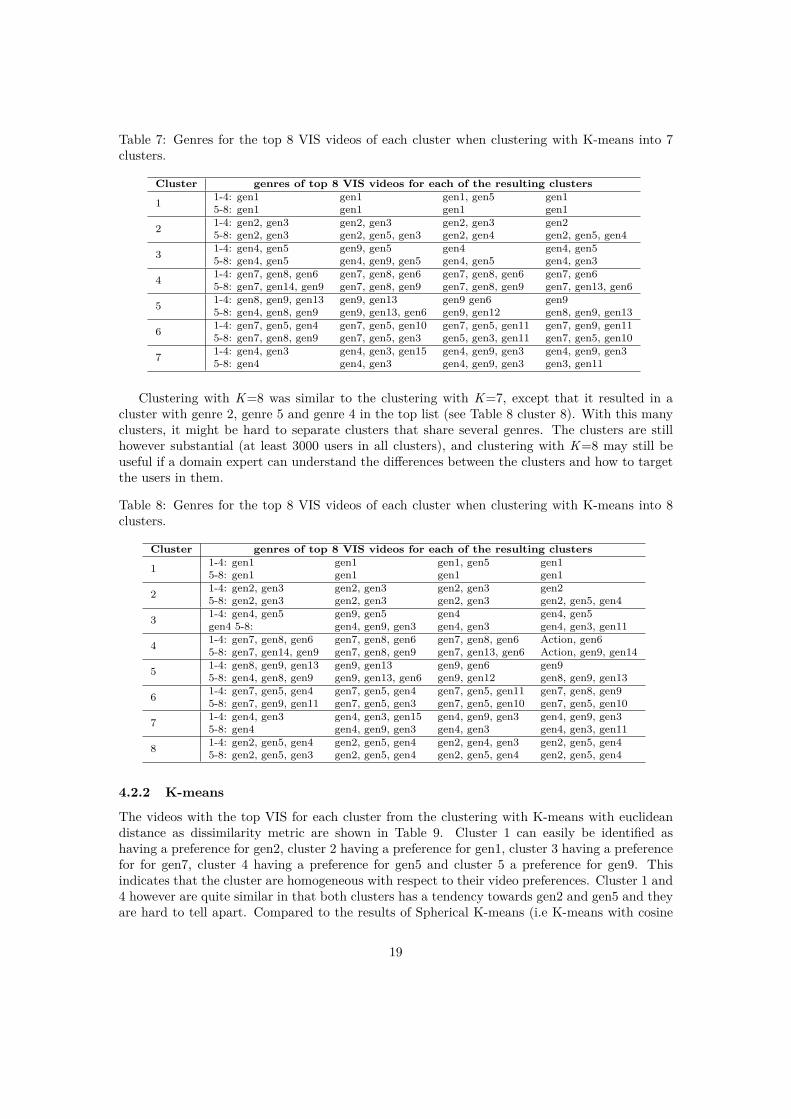
Table 7: Genres for the top 8 VIS videos of each cluster when clustering with K-means into 7clusters.
Cluster genres of top 8 VIS videos for each of the resulting clusters
1 1-4: gen1 gen1 gen1, gen5 gen15-8: gen1 gen1 gen1 gen1
2 1-4: gen2, gen3 gen2, gen3 gen2, gen3 gen25-8: gen2, gen3 gen2, gen5, gen3 gen2, gen4 gen2, gen5, gen4
3 1-4: gen4, gen5 gen9, gen5 gen4 gen4, gen55-8: gen4, gen5 gen4, gen9, gen5 gen4, gen5 gen4, gen3
4 1-4: gen7, gen8, gen6 gen7, gen8, gen6 gen7, gen8, gen6 gen7, gen65-8: gen7, gen14, gen9 gen7, gen8, gen9 gen7, gen8, gen9 gen7, gen13, gen6
5 1-4: gen8, gen9, gen13 gen9, gen13 gen9 gen6 gen95-8: gen4, gen8, gen9 gen9, gen13, gen6 gen9, gen12 gen8, gen9, gen13
6 1-4: gen7, gen5, gen4 gen7, gen5, gen10 gen7, gen5, gen11 gen7, gen9, gen115-8: gen7, gen8, gen9 gen7, gen5, gen3 gen5, gen3, gen11 gen7, gen5, gen10
7 1-4: gen4, gen3 gen4, gen3, gen15 gen4, gen9, gen3 gen4, gen9, gen35-8: gen4 gen4, gen3 gen4, gen9, gen3 gen3, gen11
Clustering with K=8 was similar to the clustering with K=7, except that it resulted in acluster with genre 2, genre 5 and genre 4 in the top list (see Table 8 cluster 8). With this manyclusters, it might be hard to separate clusters that share several genres. The clusters are stillhowever substantial (at least 3000 users in all clusters), and clustering with K=8 may still beuseful if a domain expert can understand the differences between the clusters and how to targetthe users in them.
Table 8: Genres for the top 8 VIS videos of each cluster when clustering with K-means into 8clusters.
Cluster genres of top 8 VIS videos for each of the resulting clusters
1 1-4: gen1 gen1 gen1, gen5 gen15-8: gen1 gen1 gen1 gen1
2 1-4: gen2, gen3 gen2, gen3 gen2, gen3 gen25-8: gen2, gen3 gen2, gen3 gen2, gen3 gen2, gen5, gen4
3 1-4: gen4, gen5 gen9, gen5 gen4 gen4, gen5gen4 5-8: gen4, gen9, gen3 gen4, gen3 gen4, gen3, gen11
4 1-4: gen7, gen8, gen6 gen7, gen8, gen6 gen7, gen8, gen6 Action, gen65-8: gen7, gen14, gen9 gen7, gen8, gen9 gen7, gen13, gen6 Action, gen9, gen14
5 1-4: gen8, gen9, gen13 gen9, gen13 gen9, gen6 gen95-8: gen4, gen8, gen9 gen9, gen13, gen6 gen9, gen12 gen8, gen9, gen13
6 1-4: gen7, gen5, gen4 gen7, gen5, gen4 gen7, gen5, gen11 gen7, gen8, gen95-8: gen7, gen9, gen11 gen7, gen5, gen3 gen7, gen5, gen10 gen7, gen5, gen10
7 1-4: gen4, gen3 gen4, gen3, gen15 gen4, gen9, gen3 gen4, gen9, gen35-8: gen4 gen4, gen9, gen3 gen4, gen3 gen4, gen3, gen11
8 1-4: gen2, gen5, gen4 gen2, gen5, gen4 gen2, gen4, gen3 gen2, gen5, gen45-8: gen2, gen5, gen3 gen2, gen5, gen4 gen2, gen5, gen4 gen2, gen5, gen4
4.2.2 K-means
The videos with the top VIS for each cluster from the clustering with K-means with euclideandistance as dissimilarity metric are shown in Table 9. Cluster 1 can easily be identified ashaving a preference for gen2, cluster 2 having a preference for gen1, cluster 3 having a preferencefor for gen7, cluster 4 having a preference for gen5 and cluster 5 a preference for gen9. Thisindicates that the cluster are homogeneous with respect to their video preferences. Cluster 1 and4 however are quite similar in that both clusters has a tendency towards gen2 and gen5 and theyare hard to tell apart. Compared to the results of Spherical K-means (i.e K-means with cosine
19
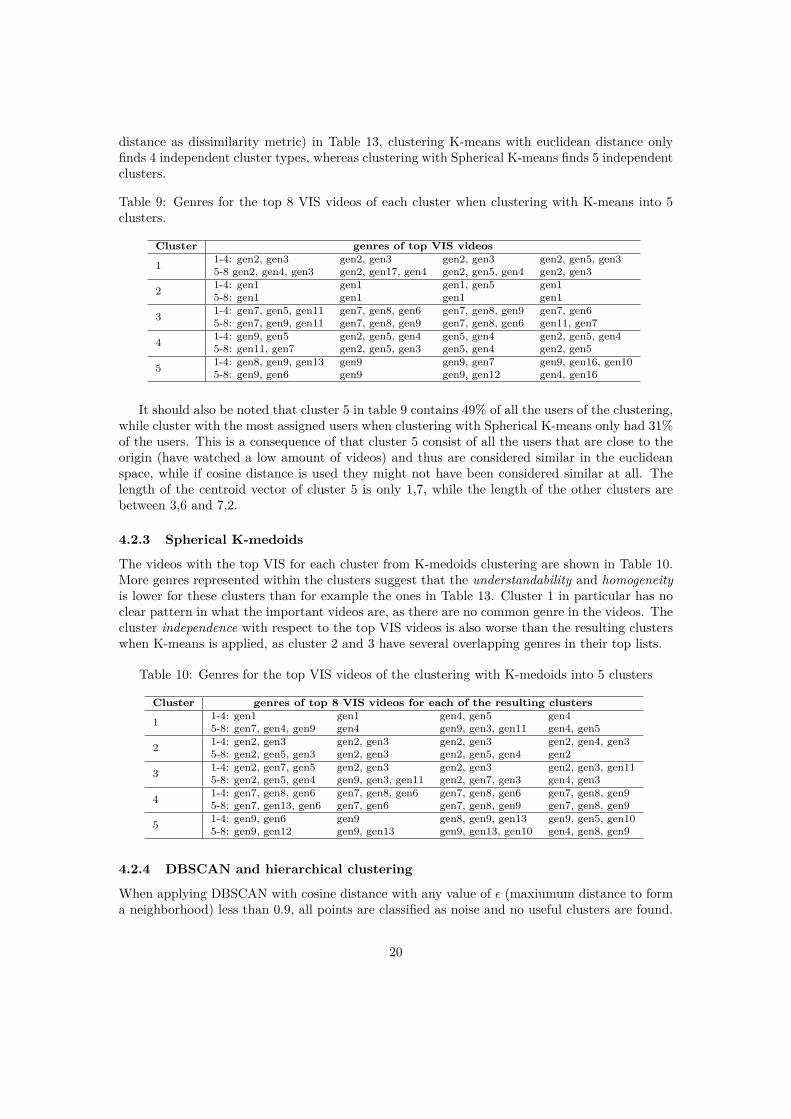
distance as dissimilarity metric) in Table 13, clustering K-means with euclidean distance onlyfinds 4 independent cluster types, whereas clustering with Spherical K-means finds 5 independentclusters.
Table 9: Genres for the top 8 VIS videos of each cluster when clustering with K-means into 5clusters.
Cluster genres of top VIS videos
1 1-4: gen2, gen3 gen2, gen3 gen2, gen3 gen2, gen5, gen35-8 gen2, gen4, gen3 gen2, gen17, gen4 gen2, gen5, gen4 gen2, gen3
2 1-4: gen1 gen1 gen1, gen5 gen15-8: gen1 gen1 gen1 gen1
3 1-4: gen7, gen5, gen11 gen7, gen8, gen6 gen7, gen8, gen9 gen7, gen65-8: gen7, gen9, gen11 gen7, gen8, gen9 gen7, gen8, gen6 gen11, gen7
4 1-4: gen9, gen5 gen2, gen5, gen4 gen5, gen4 gen2, gen5, gen45-8: gen11, gen7 gen2, gen5, gen3 gen5, gen4 gen2, gen5
5 1-4: gen8, gen9, gen13 gen9 gen9, gen7 gen9, gen16, gen105-8: gen9, gen6 gen9 gen9, gen12 gen4, gen16
It should also be noted that cluster 5 in table 9 contains 49% of all the users of the clustering,while cluster with the most assigned users when clustering with Spherical K-means only had 31%of the users. This is a consequence of that cluster 5 consist of all the users that are close to theorigin (have watched a low amount of videos) and thus are considered similar in the euclideanspace, while if cosine distance is used they might not have been considered similar at all. Thelength of the centroid vector of cluster 5 is only 1,7, while the length of the other clusters arebetween 3,6 and 7,2.
4.2.3 Spherical K-medoids
The videos with the top VIS for each cluster from K-medoids clustering are shown in Table 10.More genres represented within the clusters suggest that the understandability and homogeneityis lower for these clusters than for example the ones in Table 13. Cluster 1 in particular has noclear pattern in what the important videos are, as there are no common genre in the videos. Thecluster independence with respect to the top VIS videos is also worse than the resulting clusterswhen K-means is applied, as cluster 2 and 3 have several overlapping genres in their top lists.
Table 10: Genres for the top VIS videos of the clustering with K-medoids into 5 clusters
Cluster genres of top 8 VIS videos for each of the resulting clusters
1 1-4: gen1 gen1 gen4, gen5 gen45-8: gen7, gen4, gen9 gen4 gen9, gen3, gen11 gen4, gen5
2 1-4: gen2, gen3 gen2, gen3 gen2, gen3 gen2, gen4, gen35-8: gen2, gen5, gen3 gen2, gen3 gen2, gen5, gen4 gen2
3 1-4: gen2, gen7, gen5 gen2, gen3 gen2, gen3 gen2, gen3, gen115-8: gen2, gen5, gen4 gen9, gen3, gen11 gen2, gen7, gen3 gen4, gen3
4 1-4: gen7, gen8, gen6 gen7, gen8, gen6 gen7, gen8, gen6 gen7, gen8, gen95-8: gen7, gen13, gen6 gen7, gen6 gen7, gen8, gen9 gen7, gen8, gen9
5 1-4: gen9, gen6 gen9 gen8, gen9, gen13 gen9, gen5, gen105-8: gen9, gen12 gen9, gen13 gen9, gen13, gen10 gen4, gen8, gen9
4.2.4 DBSCAN and hierarchical clustering
When applying DBSCAN with cosine distance with any value of ε (maxiumum distance to forma neighborhood) less than 0.9, all points are classified as noise and no useful clusters are found.
20
This is explained by the fact that the average user-to-user cosine distance in this data set is 0.89,which is almost orthogonal. When raising the noise threshold step-by-step (to around 0.9), allpoints are assigned to the same cluster, which is explained by points being too evenly spreadout in the high dimensional space for the algorithm to find clear natural groupings. Hierarchicalclustering with cosine distance was attempted without any successful results. This algorithm alsodepends on u-to-u distance, and may because of this have similar problems as DBSCAN. Sincethere are many other types of hierarchical clustering techniques, hierarchical clustering cannotbe ruled out as being useful for this type of problem.
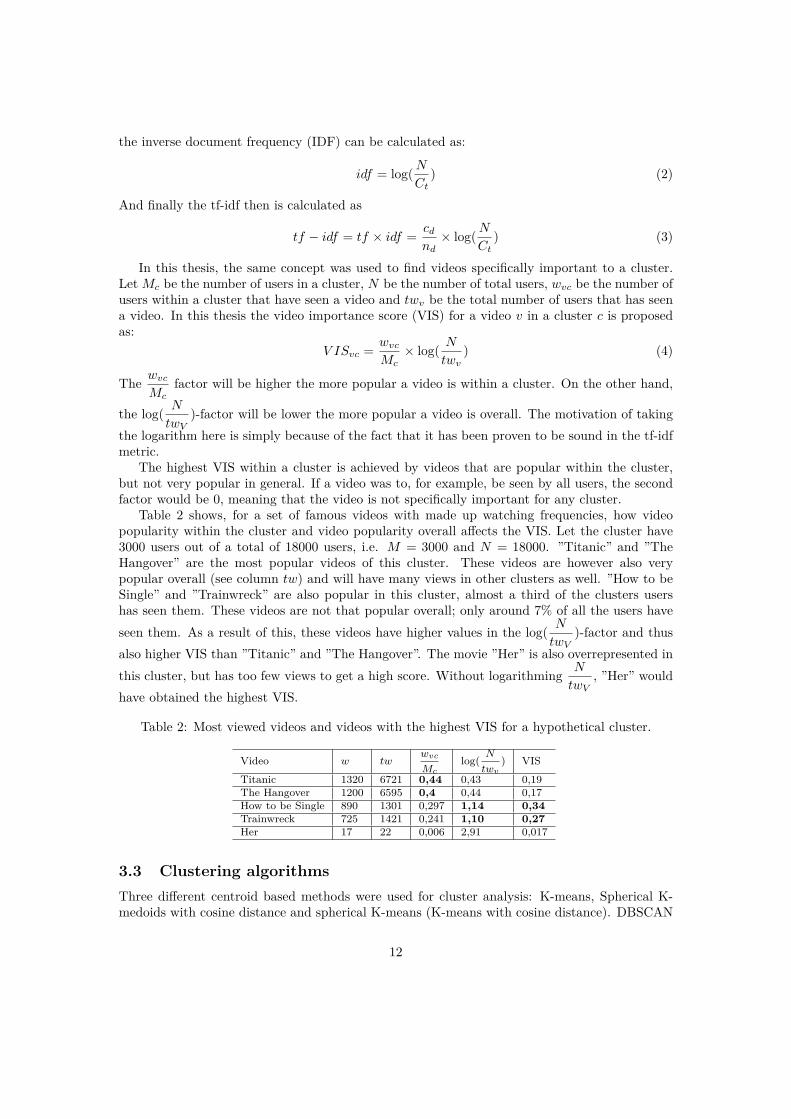
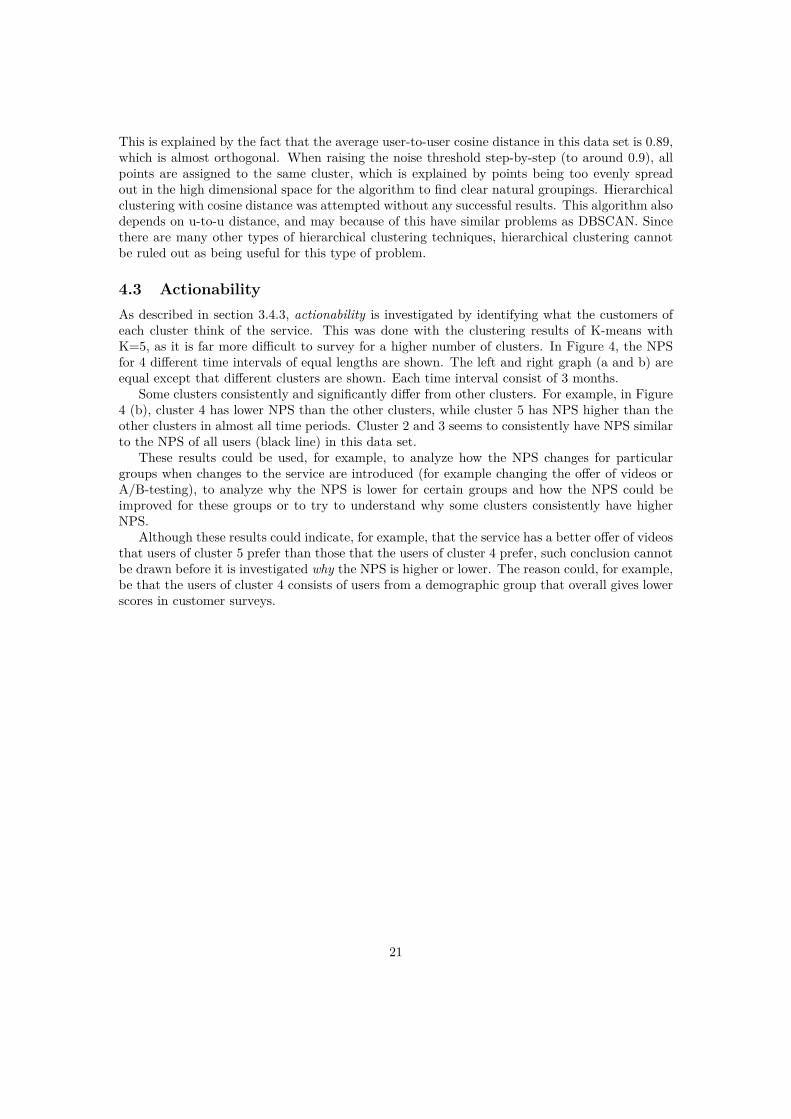
4.3 ActionabilityAs described in section 3.4.3, actionability is investigated by identifying what the customers ofeach cluster think of the service. This was done with the clustering results of K-means withK=5, as it is far more difficult to survey for a higher number of clusters. In Figure 4, the NPSfor 4 different time intervals of equal lengths are shown. The left and right graph (a and b) areequal except that different clusters are shown. Each time interval consist of 3 months.
Some clusters consistently and significantly differ from other clusters. For example, in Figure4 (b), cluster 4 has lower NPS than the other clusters, while cluster 5 has NPS higher than theother clusters in almost all time periods. Cluster 2 and 3 seems to consistently have NPS similarto the NPS of all users (black line) in this data set.
These results could be used, for example, to analyze how the NPS changes for particulargroups when changes to the service are introduced (for example changing the offer of videos orA/B-testing), to analyze why the NPS is lower for certain groups and how the NPS could beimproved for these groups or to try to understand why some clusters consistently have higherNPS.
Although these results could indicate, for example, that the service has a better offer of videosthat users of cluster 5 prefer than those that the users of cluster 4 prefer, such conclusion cannotbe drawn before it is investigated why the NPS is higher or lower. The reason could, for example,be that the users of cluster 4 consists of users from a demographic group that overall gives lowerscores in customer surveys.
21
1 2 3 4 5
Time period
NP
S
All users
Cluster 1
Cluster 2
Cluster 3
Cluster 4
Cluster 5
Figure 4: NPS and 1 standard deviation error bar when clustering with K-means into 5 clusters.Each line comes from users belonging to the same cluster, where the NPS is calculated for usersthat answered within each time period. All data points consist of survey answers from at least1000 respondents. Each time period consists of answers collected over the period of 3 monthsand each tick in the y-axis corresponds to 5 in NPS.
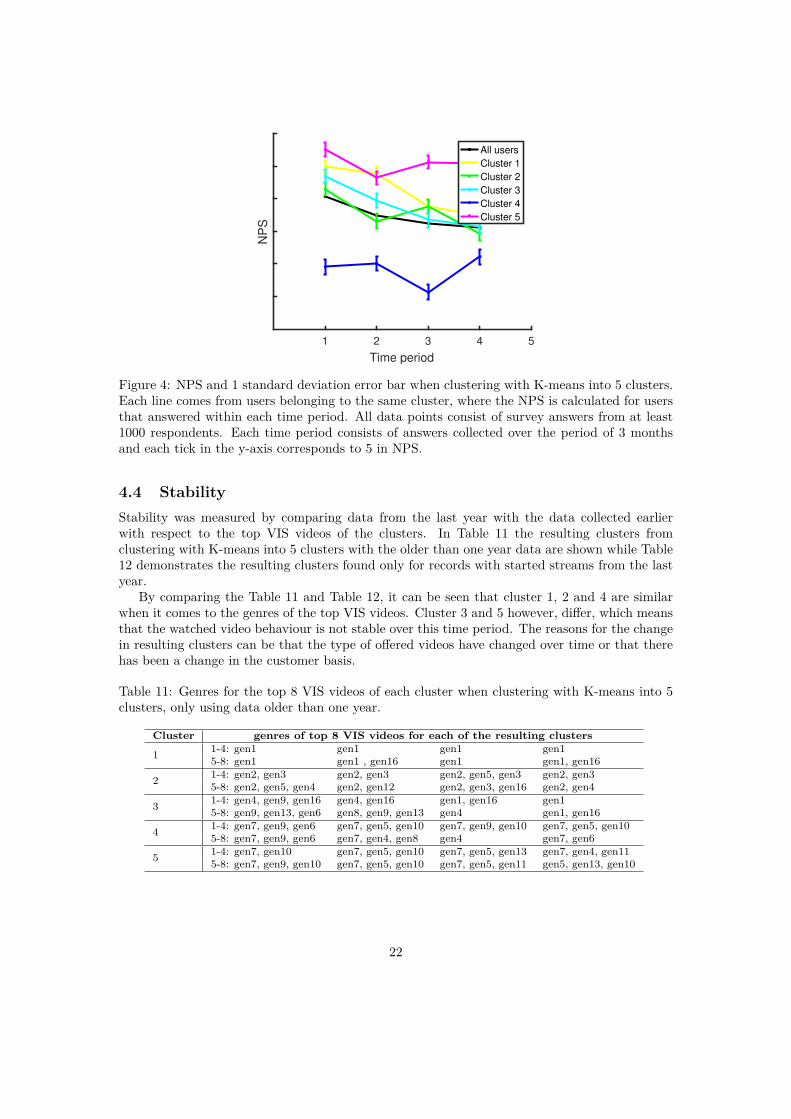
4.4 StabilityStability was measured by comparing data from the last year with the data collected earlierwith respect to the top VIS videos of the clusters. In Table 11 the resulting clusters fromclustering with K-means into 5 clusters with the older than one year data are shown while Table12 demonstrates the resulting clusters found only for records with started streams from the lastyear.
By comparing the Table 11 and Table 12, it can be seen that cluster 1, 2 and 4 are similarwhen it comes to the genres of the top VIS videos. Cluster 3 and 5 however, differ, which meansthat the watched video behaviour is not stable over this time period. The reasons for the changein resulting clusters can be that the type of offered videos have changed over time or that therehas been a change in the customer basis.
Table 11: Genres for the top 8 VIS videos of each cluster when clustering with K-means into 5clusters, only using data older than one year.
Cluster genres of top 8 VIS videos for each of the resulting clusters
1 1-4: gen1 gen1 gen1 gen15-8: gen1 gen1 , gen16 gen1 gen1, gen16
2 1-4: gen2, gen3 gen2, gen3 gen2, gen5, gen3 gen2, gen35-8: gen2, gen5, gen4 gen2, gen12 gen2, gen3, gen16 gen2, gen4
3 1-4: gen4, gen9, gen16 gen4, gen16 gen1, gen16 gen15-8: gen9, gen13, gen6 gen8, gen9, gen13 gen4 gen1, gen16
4 1-4: gen7, gen9, gen6 gen7, gen5, gen10 gen7, gen9, gen10 gen7, gen5, gen105-8: gen7, gen9, gen6 gen7, gen4, gen8 gen4 gen7, gen6
5 1-4: gen7, gen10 gen7, gen5, gen10 gen7, gen5, gen13 gen7, gen4, gen115-8: gen7, gen9, gen10 gen7, gen5, gen10 gen7, gen5, gen11 gen5, gen13, gen10
22
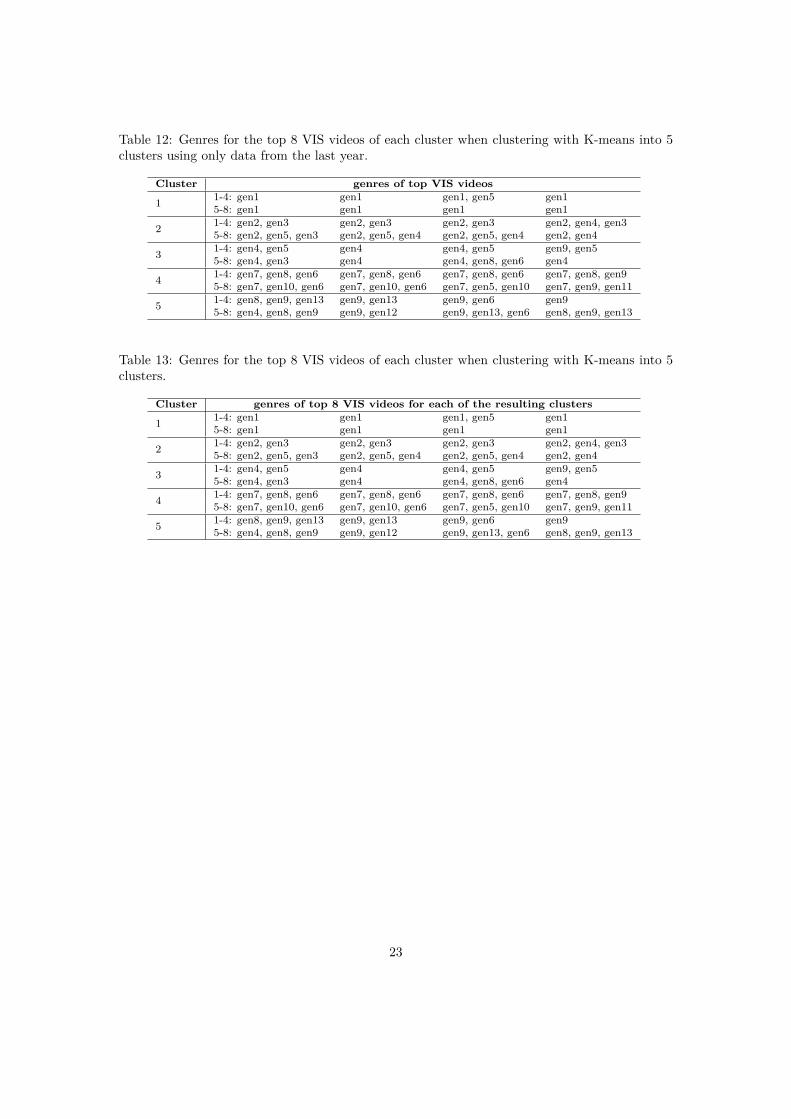
Table 12: Genres for the top 8 VIS videos of each cluster when clustering with K-means into 5clusters using only data from the last year.
Cluster genres of top VIS videos
1 1-4: gen1 gen1 gen1, gen5 gen15-8: gen1 gen1 gen1 gen1
2 1-4: gen2, gen3 gen2, gen3 gen2, gen3 gen2, gen4, gen35-8: gen2, gen5, gen3 gen2, gen5, gen4 gen2, gen5, gen4 gen2, gen4
3 1-4: gen4, gen5 gen4 gen4, gen5 gen9, gen55-8: gen4, gen3 gen4 gen4, gen8, gen6 gen4
4 1-4: gen7, gen8, gen6 gen7, gen8, gen6 gen7, gen8, gen6 gen7, gen8, gen95-8: gen7, gen10, gen6 gen7, gen10, gen6 gen7, gen5, gen10 gen7, gen9, gen11
5 1-4: gen8, gen9, gen13 gen9, gen13 gen9, gen6 gen95-8: gen4, gen8, gen9 gen9, gen12 gen9, gen13, gen6 gen8, gen9, gen13
Table 13: Genres for the top 8 VIS videos of each cluster when clustering with K-means into 5clusters.
Cluster genres of top 8 VIS videos for each of the resulting clusters
1 1-4: gen1 gen1 gen1, gen5 gen15-8: gen1 gen1 gen1 gen1
2 1-4: gen2, gen3 gen2, gen3 gen2, gen3 gen2, gen4, gen35-8: gen2, gen5, gen3 gen2, gen5, gen4 gen2, gen5, gen4 gen2, gen4
3 1-4: gen4, gen5 gen4 gen4, gen5 gen9, gen55-8: gen4, gen3 gen4 gen4, gen8, gen6 gen4
4 1-4: gen7, gen8, gen6 gen7, gen8, gen6 gen7, gen8, gen6 gen7, gen8, gen95-8: gen7, gen10, gen6 gen7, gen10, gen6 gen7, gen5, gen10 gen7, gen9, gen11
5 1-4: gen8, gen9, gen13 gen9, gen13 gen9, gen6 gen95-8: gen4, gen8, gen9 gen9, gen12 gen9, gen13, gen6 gen8, gen9, gen13
23
5 Discussion
5.1 Market segmentation criteriaThe main purpose of the thesis was to examine the feasibility of conducting market segmentationon video streaming data, which provides useful information for the company. This was evaluatedwith a set of evaluation criteria.
The numerical quantifiers of homogeneity and independence were hard to compare to earlierattempts as Euclidean distance has generally been used unlike in my study where cosine distancewas employed. However, the top VIS videos for the clustering results when using K-means showthat the clusters are homogeneous and independent with respect to the over-represented videos(videos with the highest VIS) of each clusters. In table 4 the average share of watched popularvideos of the assigned cluster as well as watched videos of other clusters are presented. Whenclustering the customers using spherical K-means, customers in average had seen over 50% ofthe most popular videos in the assigned cluster. This number is high considering that usersin average had seen only 39% of the most popular videos overall - this clearly indicates thatcustomers have more preference towards popular videos in the assigned cluster than videos thatin average are the most popular. The customers had in average only seen around 24% of thetop 10 most watched videos of other clusters, which shows that the users have more preferencetowards videos popular among users in the assigned cluster than users in other clusters.
As seen in Tables 6-9, the genres of the top VIS videos in the respective resulting clusterswere almost the same. It can be asserted that the resulting clustering gives clusters with highunderstandability, as it is known what video genres are important in each cluster. This alsoindicates that the clusters have homogeneity with respect to the top VIS video genres. The factthat the genres also differ between different cluster shows that the clusters are independent withrespect to the top VIS video genres.
The actionability results in section 4.3 demonstrated that the NPS of different clusters differover the entire period. The NPS for different clusters shows promise to be useful for the company’sanalytical work - it can for example for all users see which cluster they get assigned to, which iscorrelated to what they think of the service. Furthermore, the NPS of different clusters can beanalysed when major changes are introduced to the service.
When comparing the characteristics extracted from the last year with those obtained fromthe earlier data, it could be concluded that the segments were not stable in that time period.It implies that the company needs to act reasonably fast in their attempts to target specificsegments, and also continuously update the segments. More work has to be done to properlyassess this criterion.
5.2 Clustering methods comparisonOf the reviewed research on market segmentation with unsupervised approaches, the evaluationhas in all cases relied on quantitative results. In this thesis, the evaluation is instead done partlyqualitatively, with the purpose to provide interpretable results that are aligned with company’sobjectives such as customer satisfaction and customer retention.
From the average cosine distance measures in table 3, it can be seen that the resulting clusterswhen using K-means have lower u-to-c and lower c-to-c, indicating that the users are less spreadwithin the clusters and that cluster centers are closer. When looking at agreement upon the toptitles in table 4, K-means has higher percentage of seen popular videos of the cluster , which werewas assigned to and lower percentage seen of popular videos of the other clusters (that a userwas not assigned to) than K-medoids. Both methods produce cluster results where the users of
24
the respective clusters watch more of the popular videos of the assigned cluster than the mostpopular videos overall. Using cosine distance as dissimilarity metric worked better than usingeuclidean for this data set, as using euclidean distance leads to a cluster with customers that havevery few started streams and thus are close to the origin. Furthermore, K-means proved to givean understandable market segmentation as it produced clusters that each had 1-2 genres thatwere far the most popular ones amongst the most over represented videos (in terms of numberof views), while K-medoids did not in as a convincing way.
The only difference between K-medoids and K-means is that K-medoids uses a member foreach cluster as centroid while K-means uses the average of the points in a cluster. The averagecosine distance for the data is around 0.9 (maximum is 1), which might explain why an averageof data points works better as centroid than an actual point. The relatively long cosine distancesare also likely the reason for the failure of DBSCAN, which was discussed in section 4.2.4.
5.3 Evaluation of thesis objectivesThe fulfillment of the thesis objectives stated in section 1.2 is examined as follows.
• Objective 1. To use unsupervised learning in order to create a market segmentation basedon solely started streams by users.
By using Spherical K-means, well separated clusters of users with similar interests were identi-fied. Test set users (that was not part of the cluster creation), which were assigned to clusters,watched considerably more of the popular videos in the cluster than popular videos in the service.Tsai et al. [33] came to a similar conclusion - that behavioural variables could find homogeneousclusters. The conclusion was that based on the purchase behaviour, clusters with similar purchas-ing patterns could be formed. When homogeneous clusters are found using solely behaviouralvariables the benefit is that marketing efforts can be optimized based on the learnings of thosesame behaviours. In the case of this thesis, the collaborating company can analyze the clusterby the most over-represented video genres within the cluster (i.e the highest VIS). If this usersegment is considered important for the company, the offering of that genre can be expanded, theservice can be personalized for these customers or videos that are popular amongst the customersassigned to that cluster could be promoted.
Furthermore, the method used in this thesis for creating a segmentation basis and clusterthe users can potentially be used in other domains where behavioural data is explored. If forexample, we wanted to cluster the users of an online retailer, we could create a matrix withusers and products, where each entry is 1 if that product has been purchased by that customer.After clustering the users, a version of the VIS score can be used to identify products specificallyimportant to each cluster. A strength with this approach to performing and evaluating datadriven market segmentation is that it is easy to implement and that it gives interpretable results.
Many of the earlier attempts of data driven market segmentation ([1,14,18,19]) were focusedon finding new methods for clustering, and they concluded for some dataset that within-clustervariance is lower with the newly proposed methods. In this thesis however the main objective isinstead to understand the possibilities of using the video streams as a segmentation basis.
• Objective 2. Find a way to adopt the success criteria for market segmentation for thevideo streaming service domain, and evaluate the segmentation both quantitatively andqualitatively.
The success criteria were adopted so that it was possible to individually assess different aspectsof clustering. This helped in giving more insights into clusters than just using the commonly
25
used within-cluster variance. One of the challenges when using a set of criteria is how theyshould be measured - qualitatively to optimize for practical usefulness and interpretability orquantitatively to optimize for objective ways of comparing results. In the end, a combinationof the approaches was used, which made the evaluation less coherent but more interpretable forcompany stakeholders. The understandability was only evaluated using qualitative approaches,as this criterion helps in identifying and understanding what characterizes the clusters, which ishard to quantify.
• Objective 3. Introduce a metric to normalize overall video popularity, in order to qualita-tively be able to find specific video preferences within the clusters.
The defining and applying of VIS showed promise to help in understanding clustering results.Videos specifically important to a cluster were found by sorting videos after VIS in descendingorder. If the videos instead were to be sorted by the number of views in each cluster, some videoswould show up in the top list of all clusters, which would not help in understanding differencesbetween the clusters. A version of this score could possibly help out in evaluating clusteringbased on other similar kind of data. For example, a similar formula could potentially be appliedto find songs specifically important to a cluster when clustering users of music streaming data.
Using videos’ genres when looking at top lists for clusters proved to give insights about theclusters that would otherwise be hard to find. Since there are so many different videos offeredby the service, it is infeasible for someone analyzing the results to know much about each of thevideos. Also, when simply representing the videos as the respective IMDb genre, it is less likelythat the analyzing persons knowledge about videos will affect the evaluation.
• Objective 4. Provide recommendation to the collaborating company on how to use clusteranalysis for market segmentation.
The company can rely on the proposed approach in their customer relationship managementwork. Clustering the users is expected to identify the natural segments that the service consistsof. The following can be suggested:
1. Watched video streams from the last year can be extracted, as it was found that thesegments are not stable over a longer period.
2. Features described in the methods part can then be created based on the extracted data.
3. A clustering algorithm can then be applied with the created features as input. One way todo it is to start with spherical K-means, and to try with different values of K.
4. The resulting clusters can then be analyzed by observing the top VIS scores for each cluster,to identify the specific preferences represented. The clusters could then be further analyzedby looking at NPS, churn rate, profitability, demographics or other relevant data.
5. When a successful clustering is found, a strategy can be created to target one or moreclusters. This could be developing a new product, creating a targeted marketing advertise-ment or expanding the offering of a video genre that a customers of segment has showninterest in. Targeting a market segment will give more effect compared to a mass marketingapproach.
Even if a customer segmentation is not used directly to target a subset of customers it willbe useful for a company in understanding the customers their needs better.
26
5.4 Possible improvements and future workThe connection between segmentation basis and the resulting cluster is an interesting area thatcan be explored more. For example, it would be interesting if complete demographic data for theusers in the explored data set was available, so that so that comparing the behavioural variablesto the demographics variables would be viable. The current research is focused on improving theclustering algorithms for market segmentation and not on the important task of obtaining newinsights of how to create a good segmentation basis.
Evaluating clusters is generally hard and often involves a subjective perspective. Quantitativemeasures (like within cluster variance) do not always guarantee that a given clustering is suitablefor the company or interpretable in the eyes of a domain expert. In this case, the clustering wasevaluated within a framework of a set of usefulness criteria. A potential improvement in theevaluation process would be if the company actually relied on the clustering to see if it could beused to successfully improve any company goals.
In the thesis the profitability was not considered when analyzing the customers. Often thereason for a market segmentation is simply finding and understanding the most important cus-tomers. Having data on churn-rates and lifetime value for the customers could have improvedthe analysis greatly.
The stability criterion could have been more thoroughly investigated by dividing the data inshorter time periods and study the changes in the natural groupings. This could have helped inevaluating if there were any stable segments or segments that disappeared/formed over time.
The fact that many accounts are shared among several people implies that the video prefer-ences are less predictable. An interesting comparison could be made where the clustering is doneonly on households with one person to see if it can find even clearer patterns in the clusters.
In the evaluation, the top 8 VIS videos of each cluster were mainly used. Examining andvisualizing, for example, top 100 highest VIS videos of each cluster instead could have given amore complete picture of the clusters. This could be done with some graphical representationwhere different genres have different colors and all the top VIS videos are plotted for each clusteras a multi-colored bar.
The evaluation criteria for the understandability and homogeneity were somewhat overlap-ping in the sense that when users assigned to a cluster watch similar videos it indicates bothhomogeneity and understandability. The actionability criterion had the weakness of being diffi-cult to quantify in a more intuitive way. Finding criteria that are uncorrelated and have a clearquantifiable metric could potentially improve similar studies.
In the early phase of the project, more time should have been spent on studying previouswork rather than exploring data and trying out different models. Learning more from previousresearch on the current state-of-the-art would have helped in avoiding unnecessary sidetracksand redundant work. For example, much time was spent on working with criteria of a goodsegmentation after which previous work in that exact topic was found that was later used.Another learned lesson is that tests and evaluation should be written before models are built.This helps in both in the testing to be efficient and in order to keep the analysis objective.
5.5 Ethics and sustainabilityWitten and Frank [36, Chapter 1] address the ethical aspects of using data for data miningpurposes. The main ethical problem discussed is when data mining is performed with personaldata, since this can lead to discrimination. Weather or not discrimination is ethical dependson the reason behind it. Witten and Frank argue that using sexual and racial information formedical purposes is ethical, while using the same information to decide who gets a loan is not.
27
According to the Swedish Personal Data Act [7], sensitive personal information is data thatreveals: racial or ethnic origin, political opinions, religious or philosophical beliefs, union mem-bership or health or sex life. In this thesis, none of the data fall into these categories. However,using data about what videos individual users have watched may still be considered sensitive.Therefore, it is important to depersonalize data. This was handled in a careful way where eachuser was only identified by a user ID.
In this particular case, video watching behaviour data is used in order to specialize themarketing and service towards the users. The data mining performed is to improve the service,which is beneficial both for the customer and the company. When dealing with potentiallysensitive data in an organization it is best practice to collect and use data only if absolutely forthe desired output, as this minimizes chances of data leaks or data being used in an unethicalmanner. The data access within the company should be handled so that each employee only hasaccess to data needed to perform his or her tasks. All employees handling any type of sensitivedata should also sign a legal agreement concerning data sharing/leaking.
Services like Viaplay can perform a market segmentation, with the use of machine learningmethods in order to in order to improve their services. In general, online services of higher qualitymore personalized experience reduces the need for physical goods, which can help in decreasingthe human environmental footprint.
28
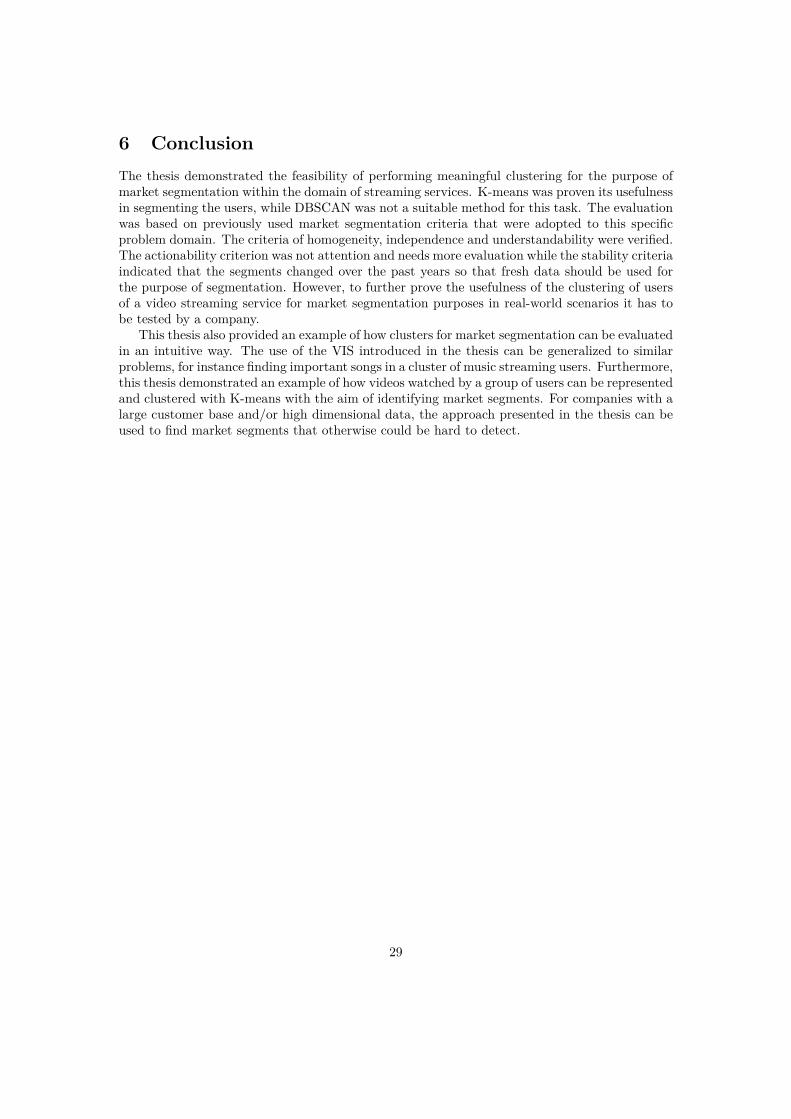
6 ConclusionThe thesis demonstrated the feasibility of performing meaningful clustering for the purpose ofmarket segmentation within the domain of streaming services. K-means was proven its usefulnessin segmenting the users, while DBSCAN was not a suitable method for this task. The evaluationwas based on previously used market segmentation criteria that were adopted to this specificproblem domain. The criteria of homogeneity, independence and understandability were verified.The actionability criterion was not attention and needs more evaluation while the stability criteriaindicated that the segments changed over the past years so that fresh data should be used forthe purpose of segmentation. However, to further prove the usefulness of the clustering of usersof a video streaming service for market segmentation purposes in real-world scenarios it has tobe tested by a company.
This thesis also provided an example of how clusters for market segmentation can be evaluatedin an intuitive way. The use of the VIS introduced in the thesis can be generalized to similarproblems, for instance finding important songs in a cluster of music streaming users. Furthermore,this thesis demonstrated an example of how videos watched by a group of users can be representedand clustered with K-means with the aim of identifying market segments. For companies with alarge customer base and/or high dimensional data, the approach presented in the thesis can beused to find market segments that otherwise could be hard to detect.
29
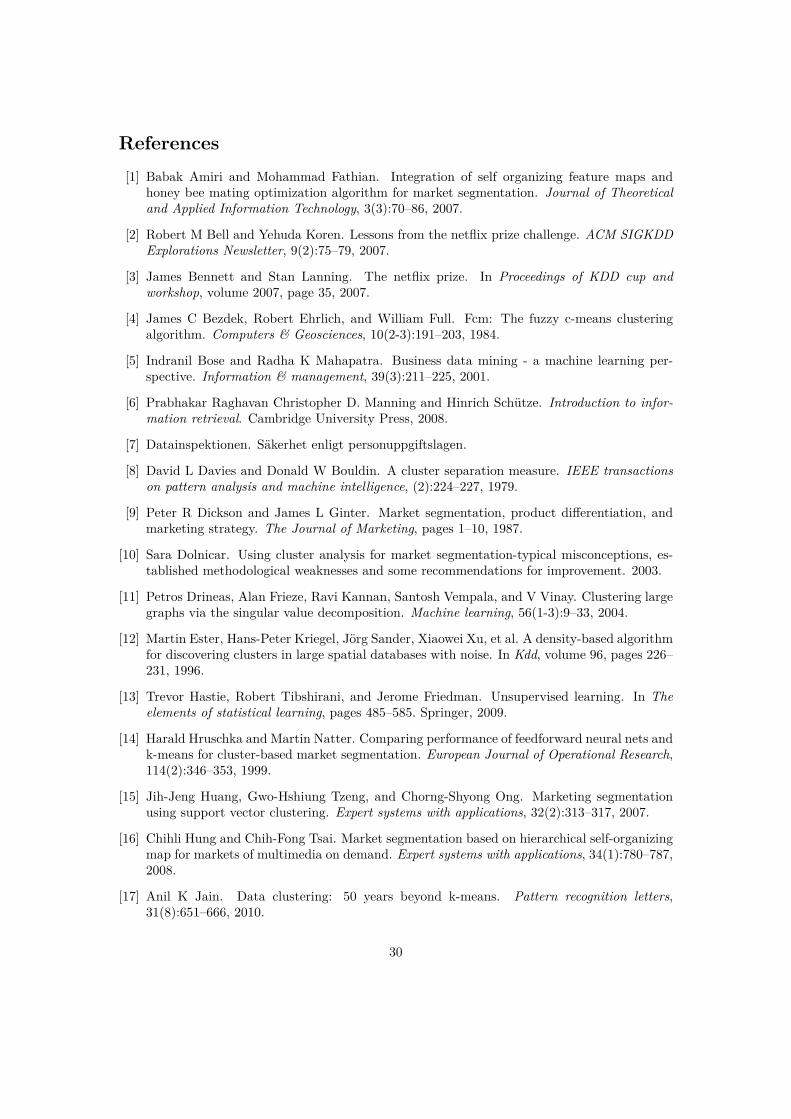
References[1] Babak Amiri and Mohammad Fathian. Integration of self organizing feature maps and
honey bee mating optimization algorithm for market segmentation. Journal of Theoreticaland Applied Information Technology, 3(3):70–86, 2007.
[2] Robert M Bell and Yehuda Koren. Lessons from the netflix prize challenge. ACM SIGKDDExplorations Newsletter, 9(2):75–79, 2007.
[3] James Bennett and Stan Lanning. The netflix prize. In Proceedings of KDD cup andworkshop, volume 2007, page 35, 2007.
[4] James C Bezdek, Robert Ehrlich, and William Full. Fcm: The fuzzy c-means clusteringalgorithm. Computers & Geosciences, 10(2-3):191–203, 1984.
[5] Indranil Bose and Radha K Mahapatra. Business data mining - a machine learning per-spective. Information & management, 39(3):211–225, 2001.
[6] Prabhakar Raghavan Christopher D. Manning and Hinrich Schutze. Introduction to infor-mation retrieval. Cambridge University Press, 2008.
[7] Datainspektionen. Sakerhet enligt personuppgiftslagen.
[8] David L Davies and Donald W Bouldin. A cluster separation measure. IEEE transactionson pattern analysis and machine intelligence, (2):224–227, 1979.
[9] Peter R Dickson and James L Ginter. Market segmentation, product differentiation, andmarketing strategy. The Journal of Marketing, pages 1–10, 1987.
[10] Sara Dolnicar. Using cluster analysis for market segmentation-typical misconceptions, es-tablished methodological weaknesses and some recommendations for improvement. 2003.
[11] Petros Drineas, Alan Frieze, Ravi Kannan, Santosh Vempala, and V Vinay. Clustering largegraphs via the singular value decomposition. Machine learning, 56(1-3):9–33, 2004.
[12] Martin Ester, Hans-Peter Kriegel, Jorg Sander, Xiaowei Xu, et al. A density-based algorithmfor discovering clusters in large spatial databases with noise. In Kdd, volume 96, pages 226–231, 1996.
[13] Trevor Hastie, Robert Tibshirani, and Jerome Friedman. Unsupervised learning. In Theelements of statistical learning, pages 485–585. Springer, 2009.
[14] Harald Hruschka and Martin Natter. Comparing performance of feedforward neural nets andk-means for cluster-based market segmentation. European Journal of Operational Research,114(2):346–353, 1999.
[15] Jih-Jeng Huang, Gwo-Hshiung Tzeng, and Chorng-Shyong Ong. Marketing segmentationusing support vector clustering. Expert systems with applications, 32(2):313–317, 2007.
[16] Chihli Hung and Chih-Fong Tsai. Market segmentation based on hierarchical self-organizingmap for markets of multimedia on demand. Expert systems with applications, 34(1):780–787,2008.
[17] Anil K Jain. Data clustering: 50 years beyond k-means. Pattern recognition letters,31(8):651–666, 2010.
30
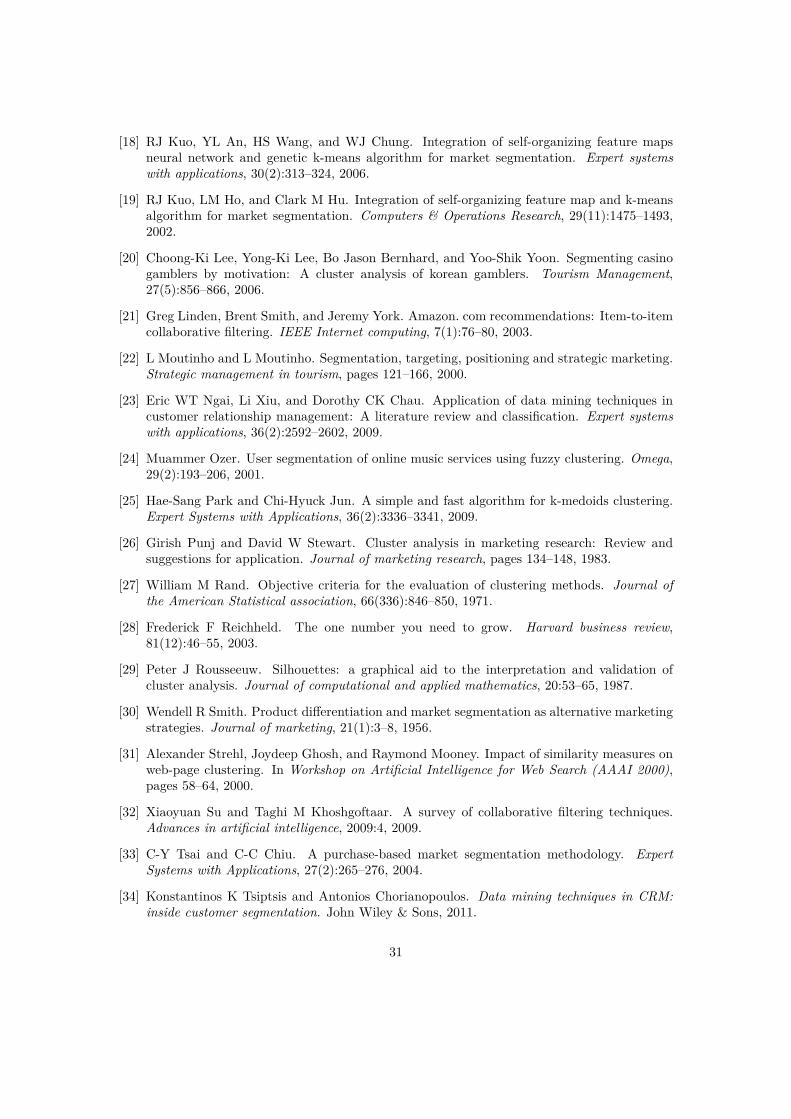
[18] RJ Kuo, YL An, HS Wang, and WJ Chung. Integration of self-organizing feature mapsneural network and genetic k-means algorithm for market segmentation. Expert systemswith applications, 30(2):313–324, 2006.
[19] RJ Kuo, LM Ho, and Clark M Hu. Integration of self-organizing feature map and k-meansalgorithm for market segmentation. Computers & Operations Research, 29(11):1475–1493,2002.
[20] Choong-Ki Lee, Yong-Ki Lee, Bo Jason Bernhard, and Yoo-Shik Yoon. Segmenting casinogamblers by motivation: A cluster analysis of korean gamblers. Tourism Management,27(5):856–866, 2006.
[21] Greg Linden, Brent Smith, and Jeremy York. Amazon. com recommendations: Item-to-itemcollaborative filtering. IEEE Internet computing, 7(1):76–80, 2003.
[22] L Moutinho and L Moutinho. Segmentation, targeting, positioning and strategic marketing.Strategic management in tourism, pages 121–166, 2000.
[23] Eric WT Ngai, Li Xiu, and Dorothy CK Chau. Application of data mining techniques incustomer relationship management: A literature review and classification. Expert systemswith applications, 36(2):2592–2602, 2009.
[24] Muammer Ozer. User segmentation of online music services using fuzzy clustering. Omega,29(2):193–206, 2001.
[25] Hae-Sang Park and Chi-Hyuck Jun. A simple and fast algorithm for k-medoids clustering.Expert Systems with Applications, 36(2):3336–3341, 2009.
[26] Girish Punj and David W Stewart. Cluster analysis in marketing research: Review andsuggestions for application. Journal of marketing research, pages 134–148, 1983.
[27] William M Rand. Objective criteria for the evaluation of clustering methods. Journal ofthe American Statistical association, 66(336):846–850, 1971.
[28] Frederick F Reichheld. The one number you need to grow. Harvard business review,81(12):46–55, 2003.
[29] Peter J Rousseeuw. Silhouettes: a graphical aid to the interpretation and validation ofcluster analysis. Journal of computational and applied mathematics, 20:53–65, 1987.
[30] Wendell R Smith. Product differentiation and market segmentation as alternative marketingstrategies. Journal of marketing, 21(1):3–8, 1956.
[31] Alexander Strehl, Joydeep Ghosh, and Raymond Mooney. Impact of similarity measures onweb-page clustering. In Workshop on Artificial Intelligence for Web Search (AAAI 2000),pages 58–64, 2000.
[32] Xiaoyuan Su and Taghi M Khoshgoftaar. A survey of collaborative filtering techniques.Advances in artificial intelligence, 2009:4, 2009.
[33] C-Y Tsai and C-C Chiu. A purchase-based market segmentation methodology. ExpertSystems with Applications, 27(2):265–276, 2004.
[34] Konstantinos K Tsiptsis and Antonios Chorianopoulos. Data mining techniques in CRM:inside customer segmentation. John Wiley & Sons, 2011.
31

[35] Michel Wedel and Wagner A Kamakura. Market segmentation: Conceptual and methodolog-ical foundations, volume 8. Springer Science & Business Media, 2000.
[36] Ian H Witten and Eibe Frank. Data Mining: Practical machine learning tools and techniques.Morgan Kaufmann, 2005.
[37] Shi Zhong. Efficient online spherical k-means clustering. In Proceedings. 2005 IEEE Inter-national Joint Conference on Neural Networks, 2005., volume 5, pages 3180–3185. IEEE,2005.
32

www.kth.se