Embed Size (px)
DESCRIPTION
Cluster Analysis vs. Market Segmentation. Pavel Brusilovsky. Objectives. Introduce cluster analysis and market segmentation by discussing: Concept of cluster analysis and basic ideas and algorithms Concept of market segmentation and basic ideas Comparison of these two approaches. - PowerPoint PPT Presentation
Citation preview
Cluster Analysis vs. Market Segmentation
Pavel Brusilovsky
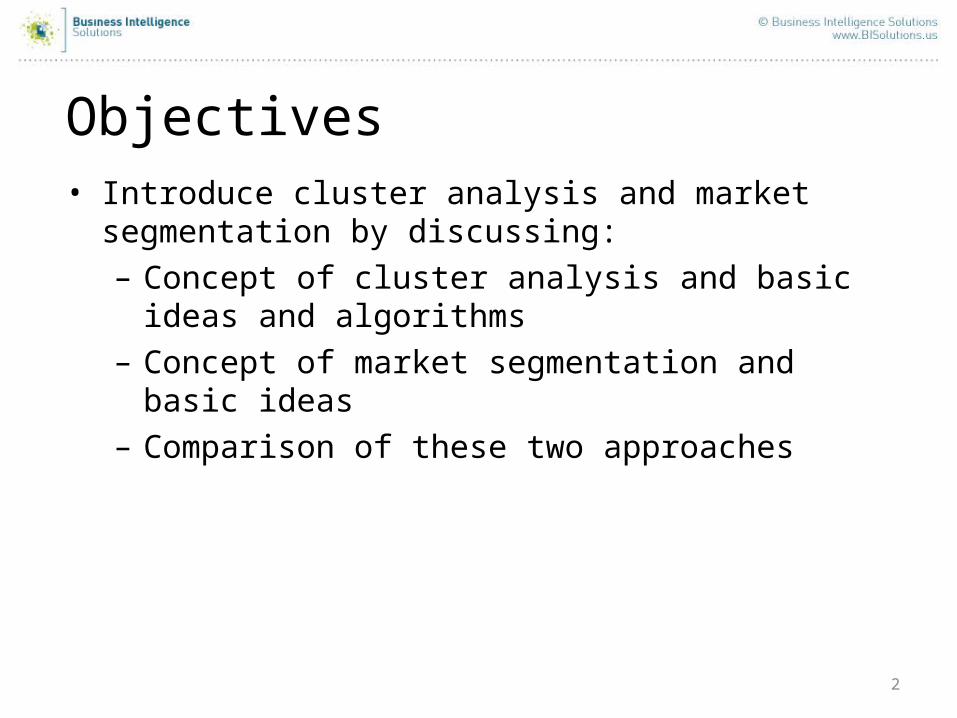
Objectives
2
• Introduce cluster analysis and market segmentation by discussing:– Concept of cluster analysis and basic ideas and
algorithms– Concept of market segmentation and basic ideas– Comparison of these two approaches
Cluster Analysis Algorithms
• There appear to be more algorithms for clustering data than data to analyze
Quant People Folklore
3
4
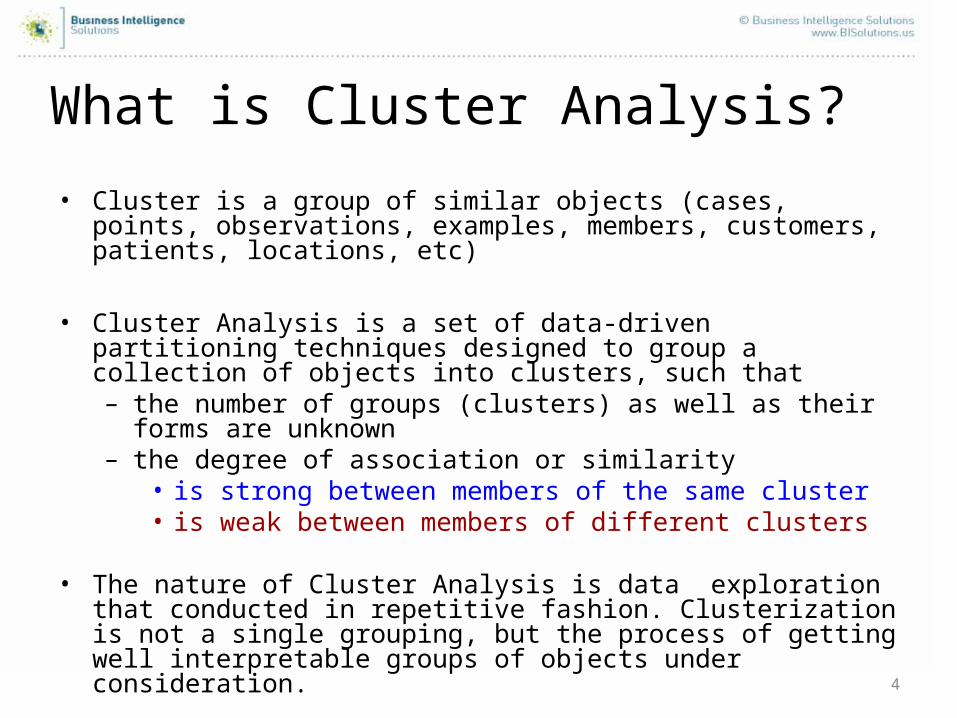
What is Cluster Analysis?
• Cluster is a group of similar objects (cases, points, observations, examples, members, customers, patients, locations, etc)
• Cluster Analysis is a set of data-driven partitioning techniques designed to group a collection of objects into clusters, such that – the number of groups (clusters) as well as their forms are
unknown– the degree of association or similarity
• is strong between members of the same cluster• is weak between members of different clusters
• The nature of Cluster Analysis is data exploration that conducted in repetitive fashion. Clusterization is not a single grouping, but the process of getting well interpretable groups of objects under consideration.
5
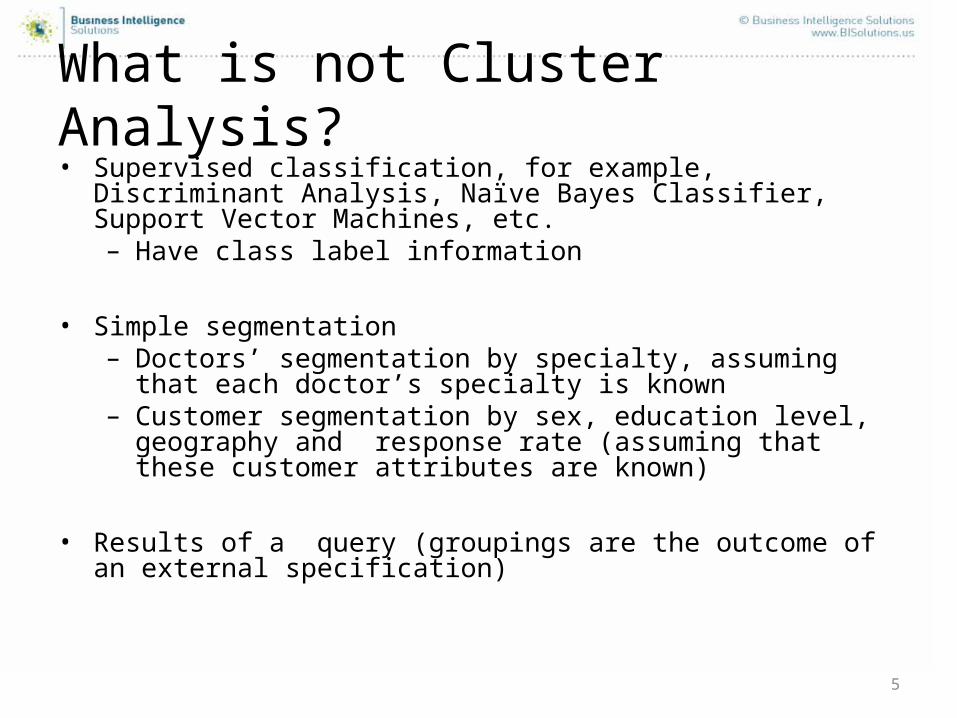
What is not Cluster Analysis?• Supervised classification, for example, Discriminant Analysis, Naïve
Bayes Classifier, Support Vector Machines, etc.– Have class label information
• Simple segmentation – Doctors’ segmentation by specialty, assuming that each doctor’s
specialty is known– Customer segmentation by sex, education level, geography and
response rate (assuming that these customer attributes are known)
• Results of a query (groupings are the outcome of an external specification)
6
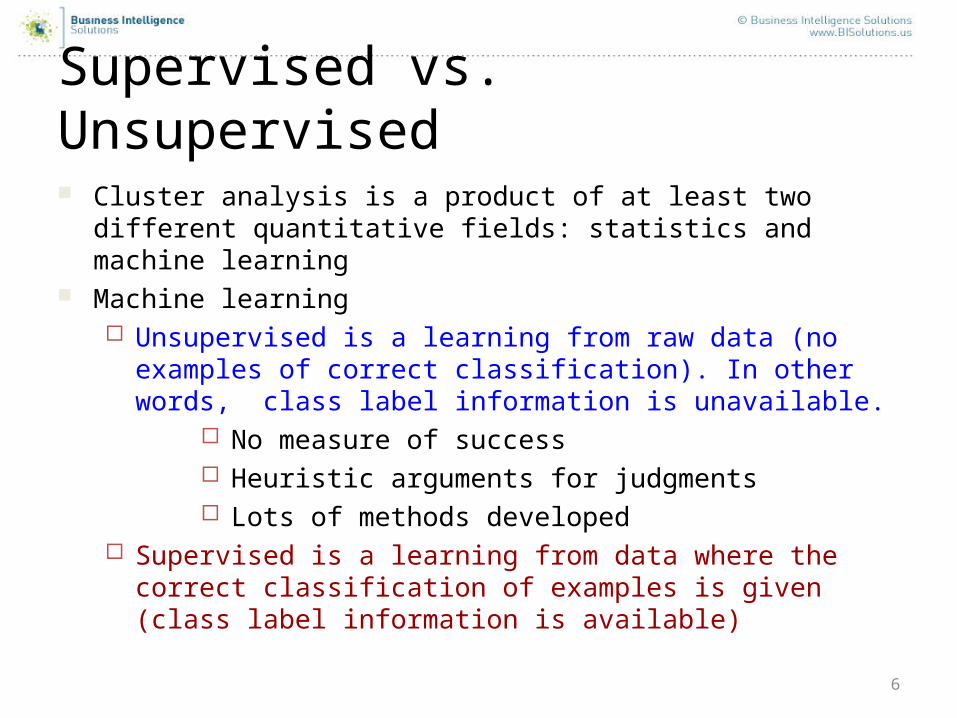
Supervised vs. Unsupervised
Cluster analysis is a product of at least two different quantitative fields: statistics and machine learning
Machine learning Unsupervised is a learning from raw data (no examples of
correct classification). In other words, class label information is unavailable.
No measure of success Heuristic arguments for judgments Lots of methods developed
Supervised is a learning from data where the correct classification of examples is given (class label information is available)
7
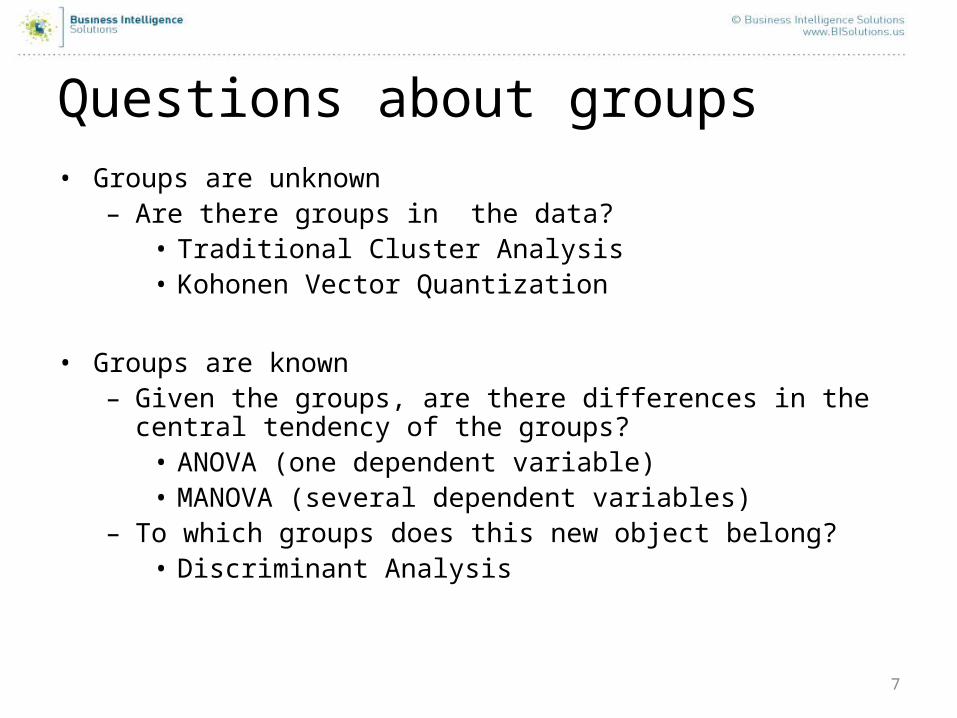
Questions about groups• Groups are unknown
– Are there groups in the data?• Traditional Cluster Analysis • Kohonen Vector Quantization
• Groups are known– Given the groups, are there differences in the central tendency
of the groups?• ANOVA (one dependent variable)• MANOVA (several dependent variables)
– To which groups does this new object belong?• Discriminant Analysis
8
Market segmentation– Market segmentation is one of the most fundamental strategic
marketing concepts:• grouping people (with the willingness, purchasing power, and the
authority to buy) according to their similarity in several dimensions related to a product under consideration.
– The better the segments chosen for targeting by a particular organization, the more successful the organization is in the marketplace. The objectives are accurately predict the needs of customers and improve the profitability.
9
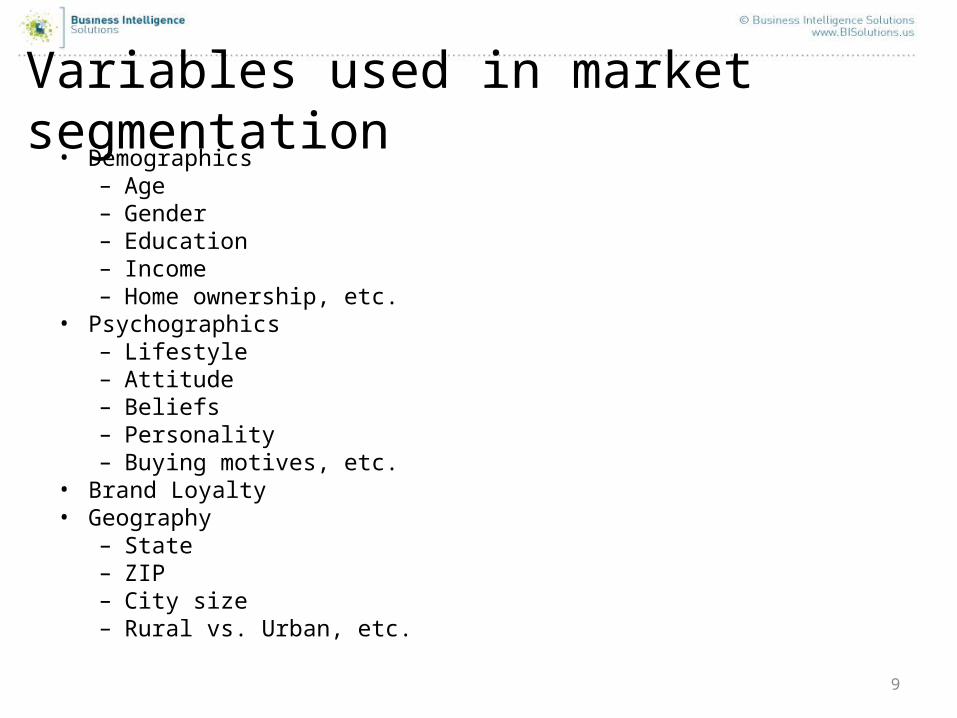
Variables used in market segmentation• Demographics
– Age– Gender– Education– Income– Home ownership, etc.
• Psychographics– Lifestyle – Attitude– Beliefs– Personality– Buying motives, etc.
• Brand Loyalty• Geography
– State– ZIP– City size– Rural vs. Urban, etc.
10
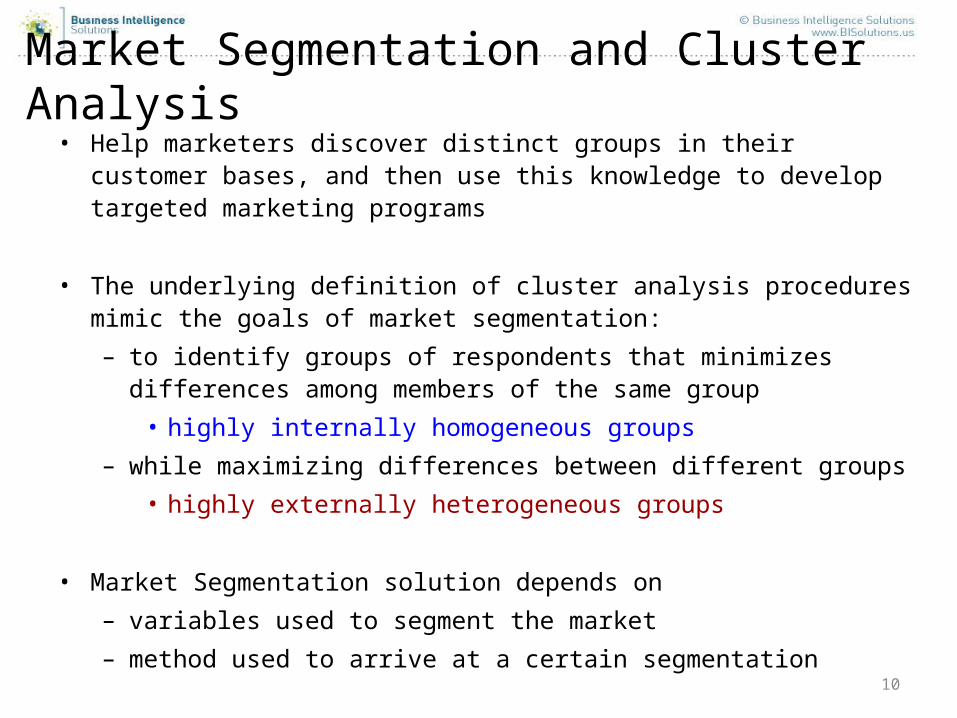
Market Segmentation and Cluster Analysis• Help marketers discover distinct groups in their customer bases, and
then use this knowledge to develop targeted marketing programs
• The underlying definition of cluster analysis procedures mimic the goals of market segmentation:
– to identify groups of respondents that minimizes differences among members of the same group
• highly internally homogeneous groups
– while maximizing differences between different groups
• highly externally heterogeneous groups
• Market Segmentation solution depends on
– variables used to segment the market
– method used to arrive at a certain segmentation
11
Criteria for Successful Market Segmentation
• Identifiability– Can we see clear differences between segments?
• Substantiality– Are the segments large enough to warrant separate marketing
targeting?• Accessibility
– Can we reach our customers?• Stability
– Do our segments stable over a certain period of time?• Responsiveness
– Is the response to our marketing effort segment specific?• Actionability
– Do the segmentation provides direction of marketing efforts?
12
Types of Clustering
• Partitional clustering– A division of objects into non-overlapping subsets (clusters)
such that each object is in exactly one cluster
• Hierarchical clustering– A set of nested clusters organized as a hierarchical tree
13
Other Distinctions Between Different Clustering
• Different treatment of object characteristics vs. even treatment– Characteristics are subdivided into two groups: dependent
variable and independent variables (Classification and Regression trees)
– There is no such a subdivision (K-means)• Model-based vs. Non-model-based
– A model is hypothesized for each of the clusters and the idea is to find the best fit of that model to each cluster (Latent Class Clustering)
14
Limitations and Problems of Traditional Cluster Analysis Methods
• Need to specify K (number of clusters) in advance• Applicable only for interval variables (only numeric data)• Has problems when clusters are of differing
– Sizes– Densities– Non-globular shapes
• Unable to handle noisy data and outliers
15
Latent Class Cluster Analysis (LCCA)
• LCCA is a model-based approach:– Statistical model is postulated for the population from which the
data sample is obtained– LC model do not rely on the traditional modeling assumptions
(linearity, normality, homogeneity)– It is assumed that a mixture of underlying probability distributions
generates the data– LC model includes a K-category latent variable, each category
represents a cluster– Objects are classified into clusters based upon membership
probabilities that are estimated directly from the data
16
Advantages of Latent Class Cluster Analysis (LCCA)
• Optimal number of clusters is determined as a result of LCCA, using rigorous statistical tests
• No decisions have to be made about the scaling of the observed variables
• Variables maybe continuous, nominal, ordinal, count, or any combination of these
17
Theory and Cluster Analysis
Is clustering a theory? A theory could be true or false
Unlike a theory, a clustering is neither true nor false, and should be judged largely on the interpretability and usefulness of results No measure of success
Heuristic arguments for judgments Selection of right method is a problem
However, a clustering may be useful for suggesting a theory, which could then be tested
18
References
Leonard Kaufman and Peter Rousseeuw (2005), Finding Groups in Data: An Introduction to Cluster Analysis, Wiley Series in Probability and Statistics, 337 p.
Mark Aldenderfer and Roger Blashfield (1984), Cluster Analysis (Quantitative Applications in the Social Sciences), SAGE Publications, Inc., 90 p.
Brian Everitt, Sabine Landau and Morven Leese (2001) Cluster Analysis, Oxford University Press, 248 p.
Marketing Segmentation (http://www.beckmanmarketing8e.nelson.com/ppt/chapter03.pps. )
19
Application of clustering and customer segmentation to survey data
20
Case study: background, objectives, and methodology• Producer and distributor of health and beauty products launched a new product.
The product can be ordered only on the website. • In six month an internet survey was conducted. Only three simple questions were
asked: – How many adults are in your household?– How many of them adopted the product?– How many of them did not adopt the product?
• When the total number of adopters and non-adopters is less than the number of adults in a household, the difference is treated as the number of unknowns. There are some other situation when the number of unknown makes sense to introduce.
• The client asked us to analyze the survey data (obviously it is not the most informative survey BI Solutions dealt with).
• The objectives of the study was to extract as much as possible useful information from the survey data in order to understand the distribution and the usage of the product among households, associate with each household a corresponding likelihood of adoption, and develop methodology to employ this info in the marketing programs.
• Methodology: synergy of cluster analysis of proportional data and intuitive segmentation.
21
Clustering of households
• We calculated the following three variables:– P1 is a proportion of customers in a household with unknown product
adaption behavior– P2 is a proportion of customers in a household who adopted the
product– P3 is a proportion of customers in a household who did not adopt the
product• Therefore, each household is characterized by a point in three-
dimensional proportion space. Once again, it was the only available information (that we got from the client).
• We decided to employ synergy of cluster analysis and customer segmentation. Six clusters were identified as the result of K-means clustering.
• Variables importance in K-means clustering:
22
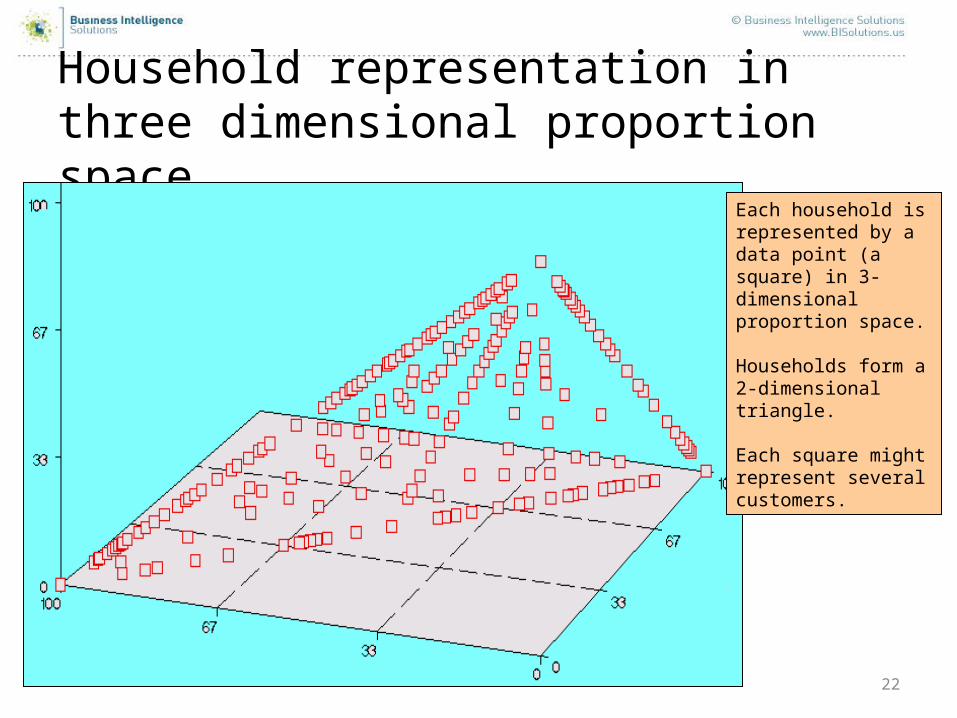
Household representation in three dimensional proportion space
Each household is represented by a data point (a square) in 3-dimensional proportion space.
Households form a 2-dimensional triangle.
Each square might represent several customers.
23
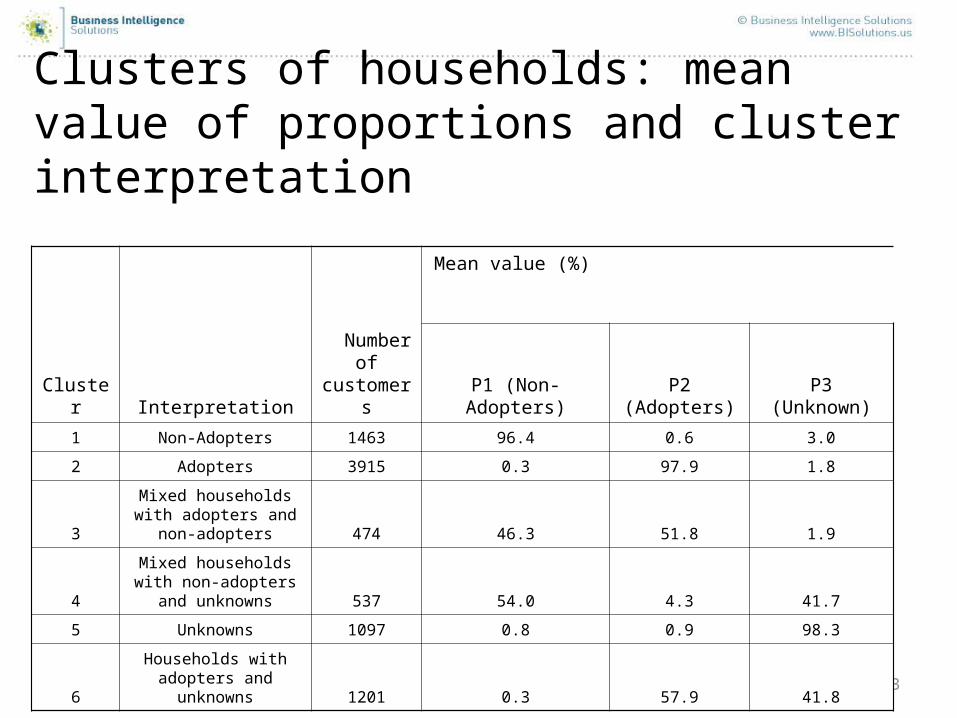
Clusters of households: mean value of proportions and cluster interpretation
Cluster Interpretation
Number of customers
Mean value (%)
P1 (Non-Adopters) P2 (Adopters) P3 (Unknown)
1 Non-Adopters 1463 96.4 0.6 3.0
2 Adopters 3915 0.3 97.9 1.8
3
Mixed households with adopters and non-
adopters 474 46.3 51.8 1.9
4
Mixed households with non-adopters and
unknowns 537 54.0 4.3 41.7
5 Unknowns 1097 0.8 0.9 98.3
6Households with adopters
and unknowns 1201 0.3 57.9 41.8
24
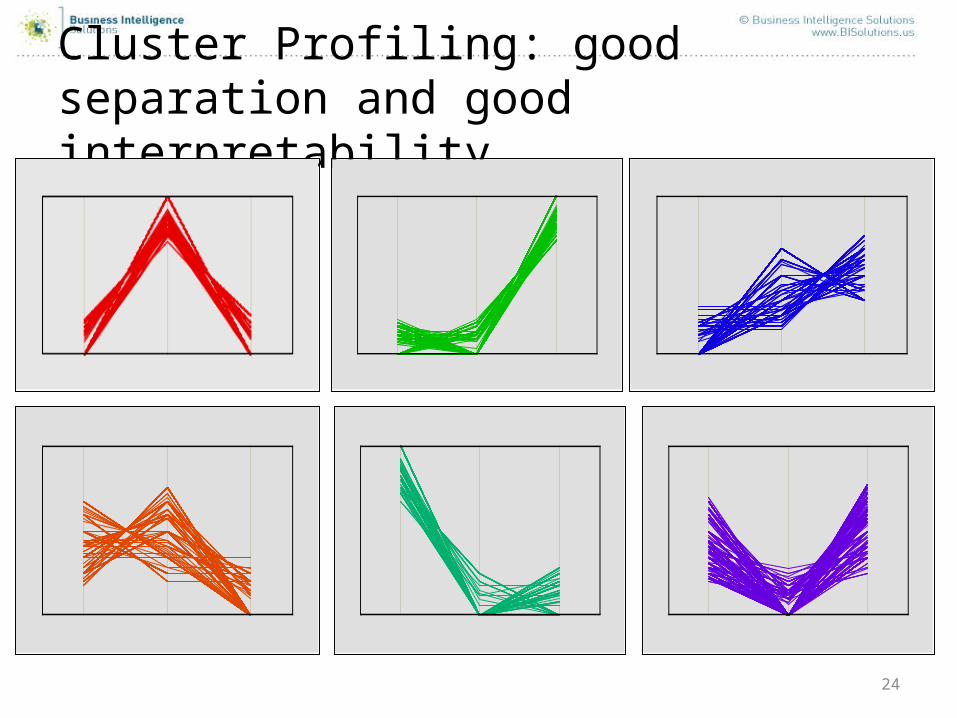
Cluster Profiling: good separation and good interpretability
25
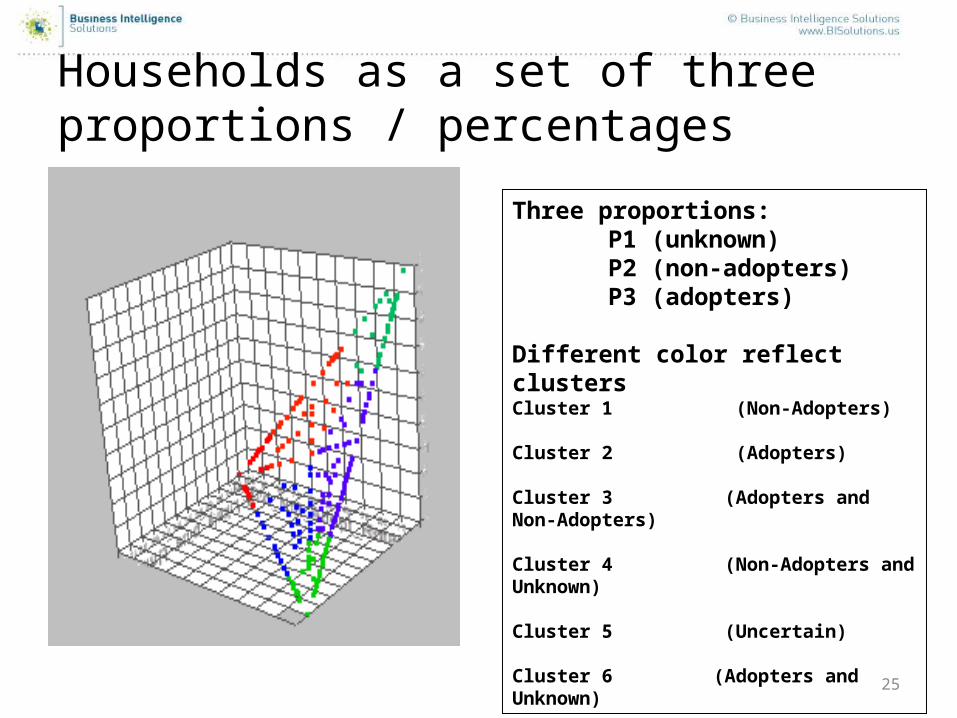
Households as a set of three proportions / percentages
Three proportions:P1 (unknown) P2 (non-adopters) P3 (adopters)
Different color reflect clustersCluster 1 (Non-Adopters) Cluster 2 (Adopters) Cluster 3 (Adopters and Non-Adopters)
Cluster 4 (Non-Adopters and Unknown)
Cluster 5 (Uncertain)
Cluster 6 (Adopters and Unknown)
26
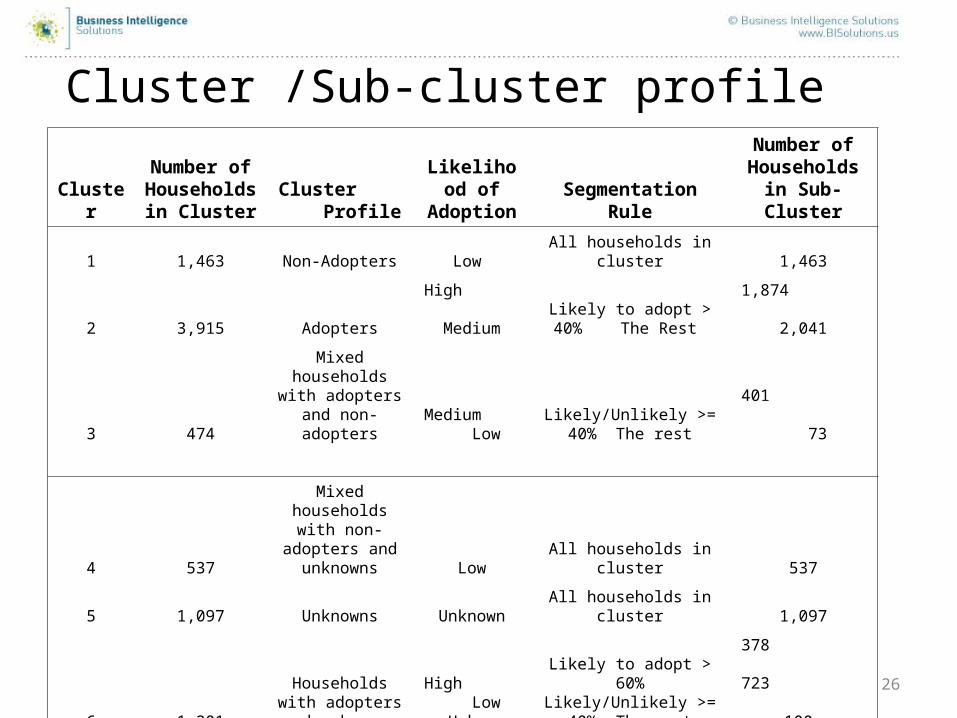
Cluster /Sub-cluster profile
Cluster
Number of Households in
ClusterCluster
Profile Likelihood
of Adoption Segmentation Rule
Number of Households in
Sub-Cluster
1 1,463 Non-Adopters Low All households in cluster 1,463
2 3,915 AdoptersHigh
MediumLikely to adopt > 40% The
Rest 1,874
2,041
3 474
Mixed households with adopters and
non-adoptersMedium
LowLikely/Unlikely >= 40% The
rest401
73
4 537
Mixed households with non-adopters
and unknowns Low All households in cluster 537
5 1,097 Unknowns Unknown All households in cluster 1,097
6 1,201
Households with adopters and
unknowns
High Low
Unknown
Likely to adopt > 60% Likely/Unlikely >= 40% The
rest
378 723
100
27
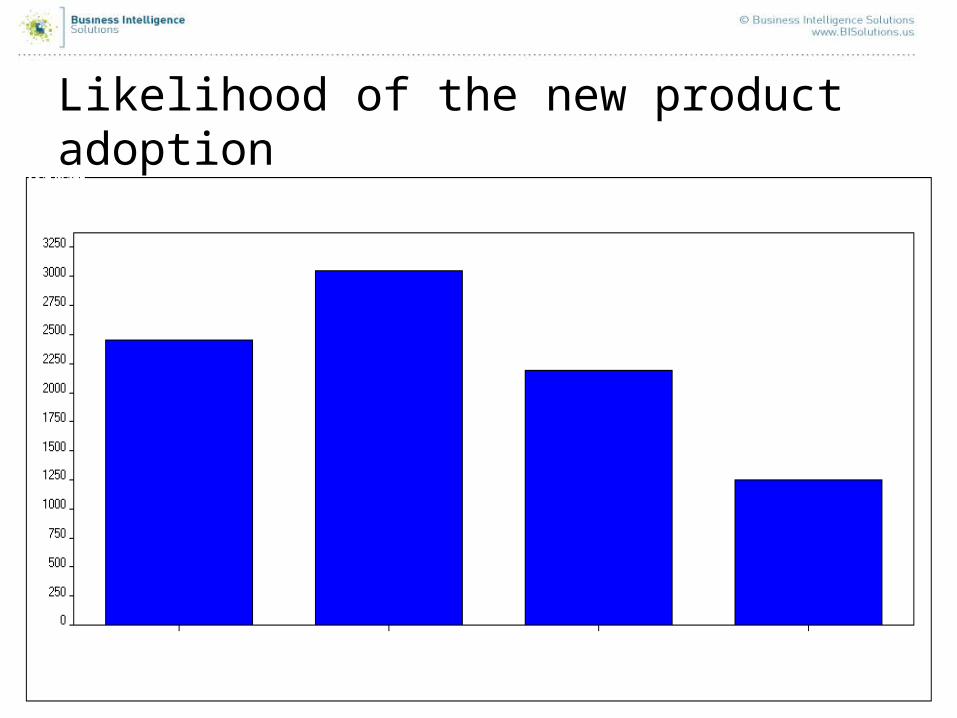
Likelihood of the new product adoption
28
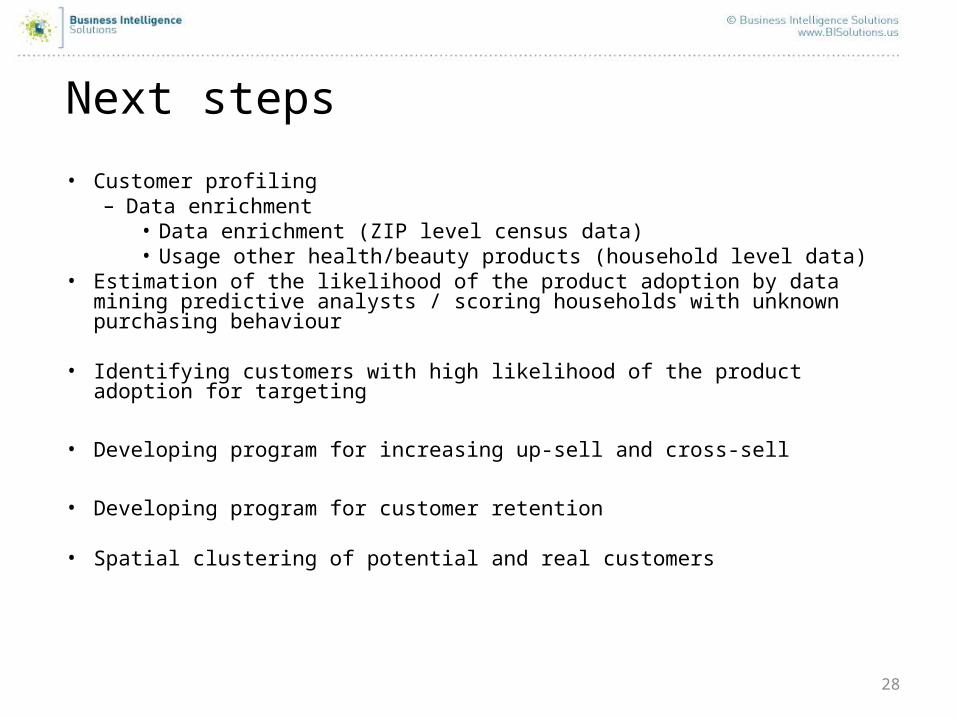
Next steps
• Customer profiling– Data enrichment
• Data enrichment (ZIP level census data)• Usage other health/beauty products (household level data)
• Estimation of the likelihood of the product adoption by data mining predictive analysts / scoring households with unknown purchasing behaviour
• Identifying customers with high likelihood of the product adoption for targeting
• Developing program for increasing up-sell and cross-sell
• Developing program for customer retention
• Spatial clustering of potential and real customers