Embed Size (px)
DESCRIPTION
The national economy has finally gained back all jobs lost during recession, 79 months after the recession began. Not only are we back to the pre-recession employment peak—we’re 98,000 jobs above it. The 217,000 new jobs created in May represent the fourth consecutive month of more than 200,000 payroll additions, the first time that this has happened during the recovery of late. Unemployment held steady at 6.3 percent, as did the labor force participation rate at its low of 62.8 percent. See details on the data, including demographic, geographic and industry breakdowns, in this report featuring research from the Bureau of Labor Statistics and JLL.
Citation preview

U.S. employment situation: September 2013
Release date: October 22, 2013
All jobs are now finally recovered from
prior employment peak…79 months later
U.S. employment situation: May 2014 June 6, 2014

What were May’s bright spots and challenges?
Source: JLL Research, Bureau of Labor Statistics
2
• Total non-farm employment
increased by 217,000 jobs, the
fourth consecutive month of
200,000+ additions.
• Unemployment held steady at 6.3
percent.
• The U.S. economy has finally
regained all lost jobs and is currently
98,000 jobs above its previous peak.
• Growth was highly concentrated in
three major subsectors in May:
education and health, PBS and
leisure and hospitality.
• On a year-on-year basis, PBS has
been by far the leader among
subsectors, with core segments
contributing roughly four in five new
jobs.
• Although the public sector has shed
jobs in comparison to two years ago,
May marked the fourth consecutive
month of net increases in
government employment.
• White-collar unemployment
decreased to just 3.2 percent.
• Tech and energy are both on the up,
while total non-farm and office-using
job growth remain steady.
• Consumer confidence increased yet
again to 83.0 points, the third month
in a row above 80.0 points.
• Although slowing somewhat, online
help ads remain near peak at 4.9
million.
• Some Sunbelt markets are
increasing year-on-year gains in to
more than 4.0 percent.
• Midwestern and East Coast
geographies continue to grapple
with below-average employment
growth, some still contracting.
• The labor force participation rate is
stuck at its record low of 62.8
percent.
• Total unemployment dropped by
only 10 basis points to 12.2 percent
and is still nearly double the official
rate of 6.3 percent.
• A slowdown in office-using job
growth means that only one in four
new jobs in May was in PBS,
financial activities or information.
• Non-durable goods slowing down
goods-producing employment.
• High school graduate participation
fell to 57.9 percent.
Overview Bright spots Challenges
OVERVIEW

June marked the fourth consecutive month of 200,000+
monthly job additions; this had yet to occur during the
recovery prior 22
0,00
0
121,
000
120,
000
360,
000
226,
000
243,
000
96,0
00
110,
000
88,0
00
106,
000
122,
000
221,
000
183,
000
164,
000 19
6,00
0
360,
000
226,
000
243,
000
96,0
00
110,
000
88,0
00
160,
000
150,
000
161,
000
225,
000
203,
000
214,
000
197,
000
280,
000
141,
000
203,
000
199,
000
201,
000
149,
000
202,
000
164,
000
237,
000 27
4,00
0
84,0
00
144,
000
222,
000
203,
000
282,
000
217,
000
0
50,000
100,000
150,000
200,000
250,000
300,000
350,000
400,000
Oct
-10
Dec
-11
Feb
-11
Apr
-11
Jun-
11
Aug
-11
Oct
-11
Dec
-11
Feb
-12
Apr
-12
Jun-
12
Aug
-12
Oct
-12
Dec
-12
Feb
-13
Apr
-13
Jun-
13
Aug
-13
Oct
-13
Dec
-13
Feb
-14
Apr
-14
1-m
onth
net
cha
nge
Source: JLL Research, Bureau of Labor Statistics
3
OVERVIEW

Three-month growth currently rests at 702,000 jobs as
unemployment remains stable at 6.3 percent
0.0%
2.0%
4.0%
6.0%
8.0%
10.0%
12.0%
-1,000.0
-800.0
-600.0
-400.0
-200.0
0.0
200.0
400.0
600.0
2003 2004 2005 2006 2007 2008 2009 2010 2011 2012 2013 2014
Une
mpl
oym
ent r
ate
(%)
1-m
onth
net
cha
nge
(tho
usan
ds)
Monthly employment change Unemployment rate
Source: JLL Research, Bureau of Labor Statistics
4
OVERVIEW
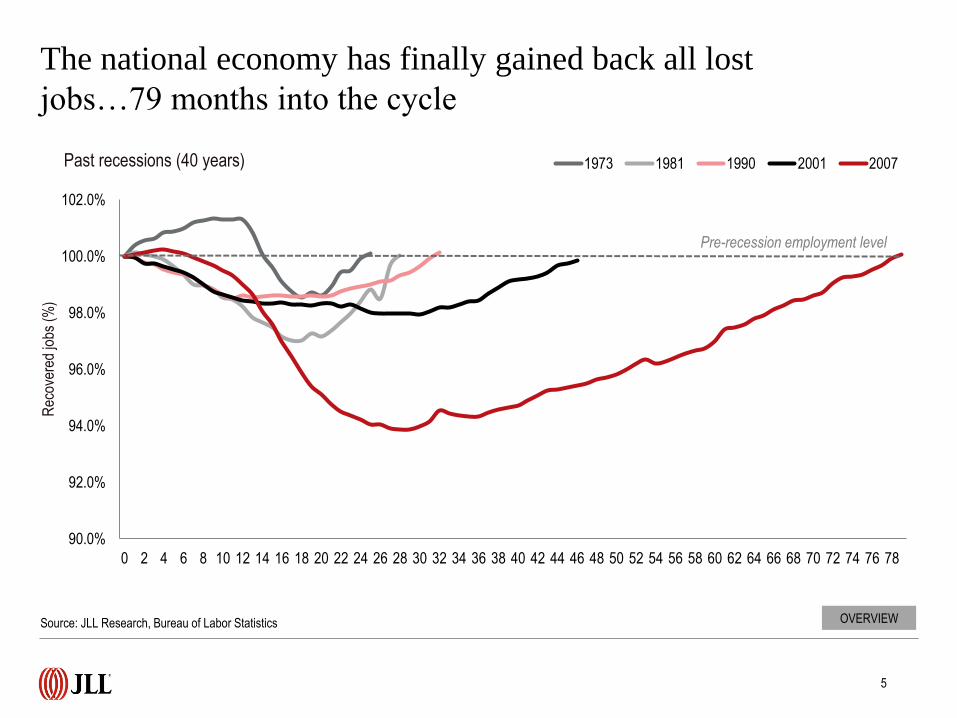
90.0%
92.0%
94.0%
96.0%
98.0%
100.0%
102.0%
0 2 4 6 8 10 12 14 16 18 20 22 24 26 28 30 32 34 36 38 40 42 44 46 48 50 52 54 56 58 60 62 64 66 68 70 72 74 76 78
1973 1981 1990 2001 2007
The national economy has finally gained back all lost
jobs…79 months into the cycle
Rec
over
ed jo
bs (
%)
Past recessions (40 years)
Source: JLL Research, Bureau of Labor Statistics
Pre-recession employment level
5
OVERVIEW

Jobs lost during recession…
Jobs gained during recovery…
As a result, total non-farm employment is now 98,000 jobs
higher than its previous peak
Source: JLL Research, Bureau of Labor Statistics
6
OVERVIEW

Office-using jobs lost
during recession…
Office-using jobs gained
during recovery…
This has been the case for the office-using sector for a while,
however, which continues to outperform the national economy
Source: JLL Research, Bureau of Labor Statistics
7
OVERVIEW

-7.0
-5.0
1.0
2.0
2.9
3.0
4.0
6.0
9.9
10.0
12.5
14.3
16.4
17.0
39.0
54.9
55.0
63.0
-40 -20 0 20 40 60 80
Nondurable goods
Information
Government
Mining and logging
Motor vehicles and parts
Financial activities
Other services
Construction
Wholesale trade
Manufacturing
Retail trade
Temporary help services
Transportation and warehousing
Durable goods
Leisure and hospitality
Health care and social assistance
Professional and business services
Education and health services
1-month net change (thousands)
Education and health overtakes PBS as the largest monthly
contributor; growth largely concentrated in major subsectors
Source: JLL Research, Bureau of Labor Statistics
8
OVERVIEW
Education and health
PBS
Leisure and hospitality
All other subsectors
Top three
subsectors
responsible for
72.4 percent of
monthly
growth.

-31.0
0.0
17.0
45.0
46.0
46.0
65.1
105.0
105.0
125.6
132.0
188.0
223.8
316.2
317.4
363.0
391.0
635.0
-100 0 100 200 300 400 500 600 700
Information
Nondurable goods
Government
Mining and logging
Financial activities
Other services
Motor vehicles and parts
Durable goods
Manufacturing
Transportation and warehousing
Wholesale trade
Construction
Temporary help services
Health care and social assistance
Retail trade
Education and health services
Leisure and hospitality
Professional and business services
12-month net change (thousands)
PBS
Leisure and hospitality
Education and health
Retail trade
Manufacturing
Financial activities
All other jobs
Only information posts a net loss of jobs year-on-year; PBS,
health, education, retail and leisure continue to lead
Source: JLL Research, Bureau of Labor Statistics
9
Core subsectors added 78.1 percent
of all jobs over the past 12 months.
OVERVIEW

-1,000
-800
-600
-400
-200
0
200
400
2008 2009 2010 2011 2012 2013 2014
Change in '000s jobs
Although lower than 2012 levels, public sector employment
growth has been positive for four consecutive months
Private sector hiring up 4.0
million since May 2012
Public sector shed 41,000 workers
since April 2012
Source: JLL Research, Bureau of Labor Statistics
10
BRIGHT SPOT

0
2
4
6
8
10
12
Une
mpl
oym
ent (
%)
Bachelor's degree and higher High school graduates, no college
White-collar unemployment dropped to 3.2 percent, although
high school grads saw a 20bp increase in unemployment
3.3%
6.3%
Source: JLL Research, Bureau of Labor Statistics
11
BRIGHT SPOT

Tech and energy, mining and utilities are both on the up; total
non-farm and office-using steady
-11.0
-9.0
-7.0
-5.0
-3.0
-1.0
1.0
3.0
5.0
7.0
2008 2009 2010 2011 2012 2013 2014
High-tech Energy, Mining, and Utilities Office-using industries Total non-farm
Source: JLL Research, Moody’s. Note: Due to data lags, high-tech employment only available through April 2014.
12
12-m
onth
% c
hang
e (jo
bs)
BRIGHT SPOT

Tech is up near recovery norms again after seeing slowdown
in recent months
Year-on-year percent employment growth
Source: JLL Research, Bureau of Labor Statistics
13
BRIGHT SPOT
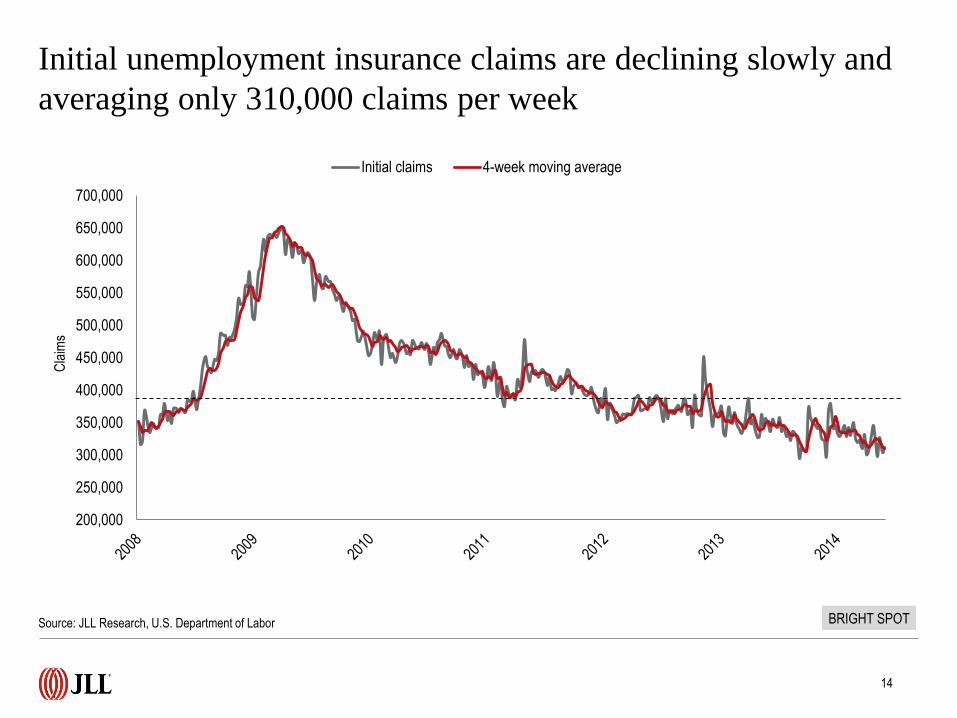
Initial unemployment insurance claims are declining slowly and
averaging only 310,000 claims per week
Source: JLL Research, U.S. Department of Labor
14
BRIGHT SPOT
200,000
250,000
300,000
350,000
400,000
450,000
500,000
550,000
600,000
650,000
700,000
Cla
ims
Initial claims 4-week moving average

0%
2%
4%
6%
8%
10%
12%
0
10
20
30
40
50
60
70
80
90
100
2008 2009 2010 2011 2012 2013 2014
Une
mpl
oym
ent r
ate
(%)
Con
sum
er c
onfid
ence
inde
x
Consumer confidence index
Unemployment rate
Consumer confidence increased by 70bp to 83.0 points, the third
consecutive month of 80.0+ points
Source: JLL Research, Conference Board, Bureau of Labor Statistics
15
BRIGHT SPOT

0.0%
2.0%
4.0%
6.0%
8.0%
10.0%
12.0%
0
1,000,000
2,000,000
3,000,000
4,000,000
5,000,000
6,000,000
2008 2009 2010 2011 2012 2013 2014
Une
mpl
oym
ent r
ate
Onl
ine
help
wan
ted
ads
Online help wanted ads
Unemployment rate
Online help wanted ads are hovering around 4.9 million, high,
but slowing
Source: JLL Research, Conference Board
16
BRIGHT SPOT
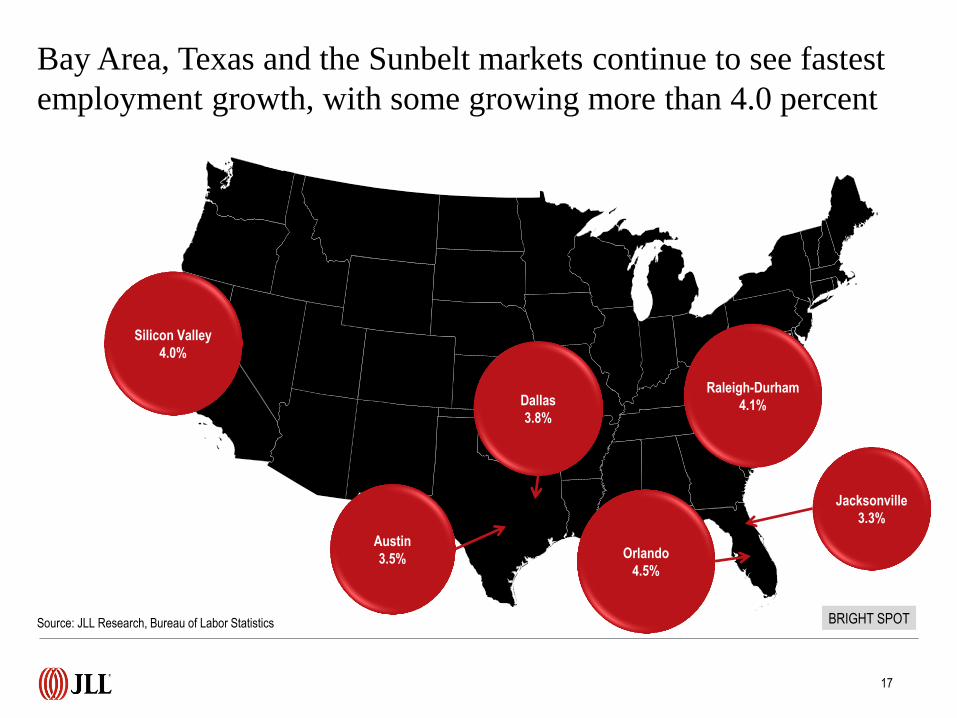
Bay Area, Texas and the Sunbelt markets continue to see fastest
employment growth, with some growing more than 4.0 percent
Source: JLL Research, Bureau of Labor Statistics
17
BRIGHT SPOT
Austin
3.5%
Dallas
3.8%
Jacksonville
3.3%
Raleigh-Durham
4.1%
Silicon Valley
4.0%
Orlando
4.5%

Midwestern and East Coast markets still lag the rest
of the country in growth
Source: JLL Research, Bureau of Labor Statistics
18
CHALLENGE
New Jersey
0.0%
Philadelphia
0.5%
Washington,
DC
0.2%
Pittsburgh
0.5%
Cleveland
0.6%
Detroit
-0.3%

The labor force participation remained at a record low of 62.8
percent in May
Source: JLL Research, Bureau of Labor Statistics
19
CHALLENGE
61.0%
62.0%
63.0%
64.0%
65.0%
66.0%
67.0%
2008 2009 2010 2011 2012 2013 2014
Labo
r fo
rce
part
icip
atio
n ra
te (
%)

Total unemployment fell to 12.2 percent, but is double the
official rate of 6.3 percent
6.0%
8.0%
10.0%
12.0%
14.0%
16.0%
18.0%
2002 2003 2004 2005 2006 2007 2008 2009 2010 2011 2012 2013 2014
Total unemployment U-6 10-year average
Source: JLL Research, Bureau of Labor Statistics
20
CHALLENGE

Fewer than one in four jobs added in May were office-using
(although rate of growth remains faster than total non-farm)
Source: JLL Research, Bureau of Labor Statistics
21
CHALLENGE

This slowdown occurred across the board, even in PBS,
which drives the office-using sector
-300
-250
-200
-150
-100
-50
0
50
100
150
2009 2010 2011 2012 2013 2014
Information Professional and business services Financial activities
PBS represented 75.0 percent of office jobs lost in February 2010.
In May 2014, it represented all 25.3 percent of new office jobs.
Source: JLL Research, Bureau of Labor Statistics
22
CHALLENGE

Goods-producing employment on the up, but still suppressed
due to neutral non-durable goods growth
-1,000.0
-800.0
-600.0
-400.0
-200.0
0.0
200.0
400.0
600.0
2008 2009 2010 2011 2012 2013 2014
1-m
onth
net
cha
nge
(tho
usan
ds)
Goods-producing Service-providing
Source: JLL Research, Bureau of Labor Statistics
23
CHALLENGE

73
74
75
76
77
78
79
Jan-
07
Jan-
08
Jan-
09
Jan-
10
Jan-
11
Jan-
12
Jan-
13
Jan-
14
58
59
60
61
62
63
College graduates
High school grads no college
Labor force participation for high school graduates drops to
just 57.9 percent
Col
lege
gra
duat
e pa
rtic
ipat
ion
(%)
High school graduate participation (%
)
Source: JLL Research, Bureau of Labor Statistics
24
CHALLENGE

Temporary help services nears 2.9 million jobs, growing at 8.5
percent year-on-year
1,000.0
1,200.0
1,400.0
1,600.0
1,800.0
2,000.0
2,200.0
2,400.0
2,600.0
2,800.0
3,000.0
-100.0
-80.0
-60.0
-40.0
-20.0
0.0
20.0
40.0
60.0
80.0
2009 2010 2011 2012 2013 2014
Mon
thly
net
cha
nge
in jo
bs (
ths)
Temporary employment monthly net change Temporary employment
Temporary em
ployment (ths)
Source: JLL Research, Bureau of Labor Statistics
25
CHALLENGE

©2014 JLL Research IP, Inc. All rights reserved. All information contained herein is from sources deemed reliable; however, no representation or warranty is made to the accuracy thereof.
For more information, please contact:
Ben Breslau
Managing Director - Americas Research
John Sikaitis
Managing Director - Office and Local Markets Research
Phil Ryan
Research Analyst
Or, find more employment, business and real
estate research at jll.com.
>>> Click here to check it out.