Embed Size (px)
Citation preview

U.S. employment situation: September 2013
Release date: October 22, 2013
Seven months into the year,
employment is up by 1.6 million jobs
U.S. employment situation: July 2014 August 1, 2014

What were July’s bright spots and challenges?
Source: JLL Research, Bureau of Labor Statistics
2
• The U.S. economy added 209,000
jobs in July. Combined with revised
figures for the previous two months,
the three-month trailing total is now
736,000 jobs.
• The unemployment rate increased
by 10 basis points to 6.2 percent,
remaining relatively flat as has been
the case through much of the
recovery.
• Monthly growth has become
increasingly evenly distributed, with
the top three contributors
responsible for less than one half of
jobs added in July.
• The sustained 200,000+ monthly
additions have pushed year-on-year
total non-farm employment up 1.9
percent with diverse contributors.
• Unemployment for college graduates
dropped yet again, this month to 3.1
percent. While high school
unemployment increased, both are
below the national rate.
• Goods-producing employment is
making a comeback and has
consistently shown 20,000+ monthly
gains.
• Tech’s year-on-year increase is now
at 4.2 percent, while energy is also
on the up.
• Initial claims are falling, with weekly
figures now hovering around
300,000.
• Consumer confidence exceeds 90
points as indicators continue to rise.
• Online help wanted ads, despite no
growth, are still at record highs.
• Some East Coast and Midwestern
markets continue to post year-on-
year job growth of less than 1.0
percent.
• The labor force participation rate is
neutral at 62.9 percent, near the
record low reached earlier in 2014.
• Total unemployment also rose by
10 basis points to 12.2 percent.
• PBS’ slowdown in job creation
means that slightly more than one
quarter of new jobs in July were
office-using. The labor force
participation rate for both high
school and college graduates is on
the decline.
• Temporary help services remains at
record highs and is approaching 2.9
million.
Overview Bright spots Challenges
OVERVIEW

July marked the sixth consecutive month of 200,000+ monthly
job growth; revisions to previous months a slight boost 22
0,00
0
121,
000
120,
000
360,
000
226,
000
243,
000
96,0
00
110,
000
88,0
00
106,
000
122,
000
221,
000
183,
000
164,
000 19
6,00
0
360,
000
226,
000
243,
000
96,0
00
110,
000
88,0
00
160,
000
150,
000
161,
000
225,
000
203,
000
214,
000
197,
000
280,
000
141,
000
203,
000
199,
000
201,
000
149,
000
202,
000
164,
000
237,
000 27
4,00
0
84,0
00
144,
000
222,
000
201,
000
304,
000
229,
000
298,
000
209,
000
0
50,000
100,000
150,000
200,000
250,000
300,000
350,000
400,000
Oct
-10
Dec
-11
Feb
-11
Apr
-11
Jun-
11
Aug
-11
Oct
-11
Dec
-11
Feb
-12
Apr
-12
Jun-
12
Aug
-12
Oct
-12
Dec
-12
Feb
-13
Apr
-13
Jun-
13
Aug
-13
Oct
-13
Dec
-13
Feb
-14
Apr
-14
Jun-
14
1-m
onth
net
cha
nge
Source: JLL Research, Bureau of Labor Statistics
3
OVERVIEW

As a result, the national economy has added 736,000 jobs over
the past three months; unemployment up 10bp at 6.2 percent
0.0%
2.0%
4.0%
6.0%
8.0%
10.0%
12.0%
-1,000.0
-800.0
-600.0
-400.0
-200.0
0.0
200.0
400.0
600.0
2003 2004 2005 2006 2007 2008 2009 2010 2011 2012 2013 2014
Une
mpl
oym
ent r
ate
(%)
1-m
onth
net
cha
nge
(tho
usan
ds)
Monthly employment change Unemployment rate
Source: JLL Research, Bureau of Labor Statistics
4
OVERVIEW

90.0%
92.0%
94.0%
96.0%
98.0%
100.0%
102.0%
0 2 4 6 8 10 12 14 16 18 20 22 24 26 28 30 32 34 36 38 40 42 44 46 48 50 52 54 56 58 60 62 64 66 68 70 72 74 76 78 80
1973 1981 1990 2001 2007
There are now 639,000 more jobs than at the previous peak,
an increase of 0.5 percent
Rec
over
ed jo
bs (
%)
Past recessions (40 years)
Source: JLL Research, Bureau of Labor Statistics
Pre-recession employment level
5
OVERVIEW

-2.0
1.2
2.0
2.7
7.0
7.0
7.9
8.0
8.5
11.0
14.6
17.0
21.0
22.0
25.4
26.7
28.0
30.0
47.0
-40 -20 0 20 40 60
Nondurable goods
Utilities
Information
Wholesale trade
Other services
Financial activities
Transportation and warehousing
Mining and logging
Temporary help services
Government
Motor vehicles and parts
Education and health services
Leisure and hospitality
Construction
Health care and social assistance
Retail trade
Manufacturing
Durable goods
Professional and business services
1-month net change (thousands)
Monthly growth was even more evenly distributed in July, with
the top three sectors contributing less than half of all new jobs
Source: JLL Research, Bureau of Labor Statistics
6
OVERVIEW
PBS
Manufacturing
Retail trade
All other subsectors
Top three
subsectors
responsible for
48.7 percent of
monthly
growth.

-31.0
0.0
9.0
48.0
49.0
50.0
60.7
91.0
127.3
150.8
169.0
178.0
211.0
216.7
297.6
336.3
375.0
375.0
648.0
-100 0 100 200 300 400 500 600 700
Information
Utilities
Nondurable goods
Other services
Mining and logging
Financial activities
Motor vehicles and parts
Government
Wholesale trade
Transportation and warehousing
Durable goods
Manufacturing
Construction
Temporary help services
Retail trade
Health care and social assistance
Education and health services
Leisure and hospitality
Professional and business services
12-month net change (thousands)
PBS
Leisure and hospitality
Education and health
Retail trade
Manufacturing
Financial activities
All other jobs
Year-on-year gains also continue to broaden as PBS growth
slows and other sectors catch up
Source: JLL Research, Bureau of Labor Statistics
7
Core subsectors added 74.8 percent
of all jobs over the past 12 months.
OVERVIEW

-1,000
-800
-600
-400
-200
0
200
400
2008 2009 2010 2011 2012 2013 2014
Change in '000s jobs
Local government hiring in recent months has pushed public-
sector employment up compared to two years ago
Private sector hiring up 4.8
million since July 2012
Public sector hiring up 11,000
workers since July 2012
Source: JLL Research, Bureau of Labor Statistics
8
BRIGHT SPOT

0
2
4
6
8
10
12
Une
mpl
oym
ent (
%)
Bachelor's degree and higher High school graduates, no college
Although high school unemployment nudged up, both levels
remain below the national unemployment rate
3.1%
6.1%
Source: JLL Research, Bureau of Labor Statistics
9
BRIGHT SPOT

Goods-producing employment is rising and has seen monthly
gains consistently of more than 20,000 jobs throughout 2014
-1,000.0
-800.0
-600.0
-400.0
-200.0
0.0
200.0
400.0
600.0
2008 2009 2010 2011 2012 2013 2014
1-m
onth
net
cha
nge
(tho
usan
ds)
Goods-producing Service-providing
Source: JLL Research, Bureau of Labor Statistics
10
BRIGHT SPOT
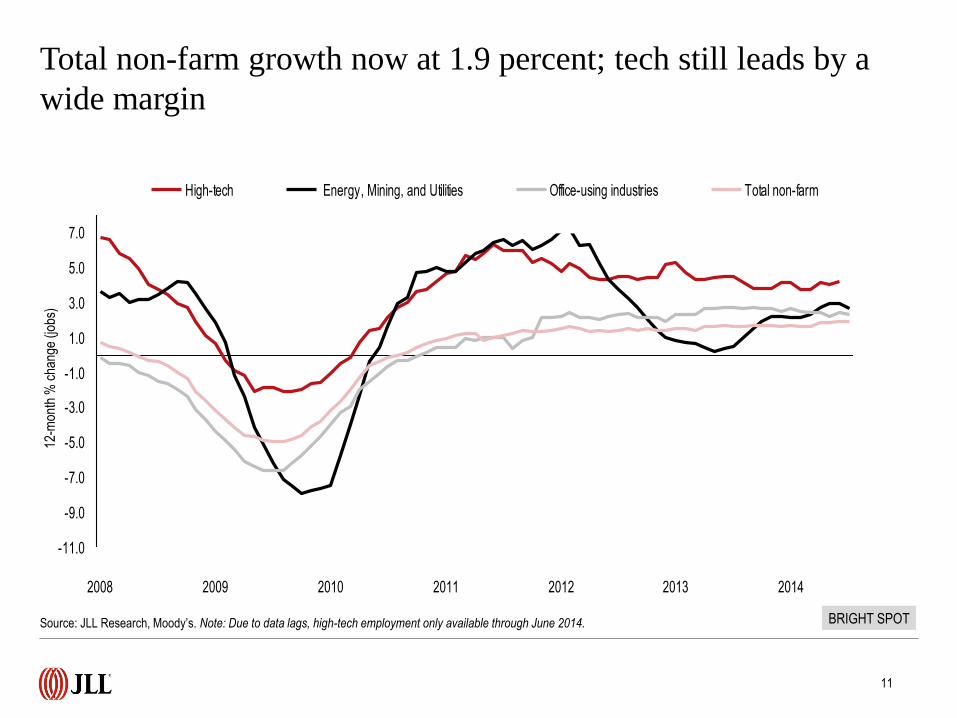
Total non-farm growth now at 1.9 percent; tech still leads by a
wide margin
-11.0
-9.0
-7.0
-5.0
-3.0
-1.0
1.0
3.0
5.0
7.0
2008 2009 2010 2011 2012 2013 2014
High-tech Energy, Mining, and Utilities Office-using industries Total non-farm
Source: JLL Research, Moody’s. Note: Due to data lags, high-tech employment only available through June 2014.
11
12-m
onth
% c
hang
e (jo
bs)
BRIGHT SPOT

Tech is up near recovery norms again after seeing slowdown in
recent months, while energy picks up a bit in recent months
Year-on-year percent employment growth
Source: JLL Research, Bureau of Labor Statistics
12
BRIGHT SPOT

Initial unemployment insurance claims are now hovering around
the 300,000 mark each week
Source: JLL Research, U.S. Department of Labor
13
BRIGHT SPOT
200,000
250,000
300,000
350,000
400,000
450,000
500,000
550,000
600,000
650,000
700,000
Cla
ims
Initial claims 4-week moving average

0%
2%
4%
6%
8%
10%
12%
0
10
20
30
40
50
60
70
80
90
100
2008 2009 2010 2011 2012 2013 2014
Une
mpl
oym
ent r
ate
(%)
Con
sum
er c
onfid
ence
inde
x
Consumer confidence index
Unemployment rate
Consumer confidence breaks the 90-point threshold for the first
time since before the recession as indicators trend upward
Source: JLL Research, Conference Board, Bureau of Labor Statistics
14
BRIGHT SPOT

0.0%
2.0%
4.0%
6.0%
8.0%
10.0%
12.0%
0
1,000,000
2,000,000
3,000,000
4,000,000
5,000,000
6,000,000
2008 2009 2010 2011 2012 2013 2014
Une
mpl
oym
ent r
ate
Onl
ine
help
wan
ted
ads
Online help wanted ads
Unemployment rate
Online help wanted ads remain near record highs, but flat in
July as unemployment changes little
Source: JLL Research, Conference Board
15
BRIGHT SPOT

Year-on-year job growth of more than 3.0 percent is becoming
increasingly common in many metro areas
Source: JLL Research, Bureau of Labor Statistics
16
BRIGHT SPOT
Orlando
3.7%
Jacksonville
3.2%
Silicon Valley
3.4%
Austin
3.6%
Dallas
3.6%
Houston
3.1%
Portland
3.1%

Some East Coast and Midwestern markets are still posting
job growth below 1.0 percent year-on-year, however
17
CHALLENGE
New Jersey
0.2%
Source: JLL Research, Bureau of Labor Statistics
Detroit
0.3%
Chicago
0.7%
Hampton
Roads
0.3%
Kansas City
0.2%
Pittsburgh
0.9%
Washington,
DC
0.9%
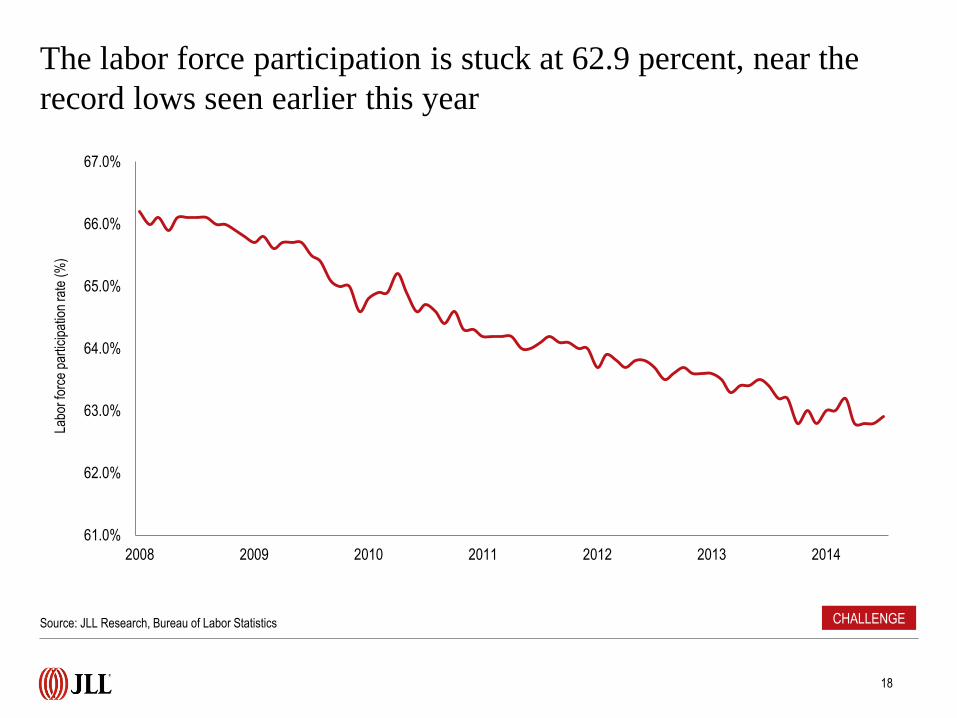
The labor force participation is stuck at 62.9 percent, near the
record lows seen earlier this year
Source: JLL Research, Bureau of Labor Statistics
18
CHALLENGE
61.0%
62.0%
63.0%
64.0%
65.0%
66.0%
67.0%
2008 2009 2010 2011 2012 2013 2014
Labo
r fo
rce
part
icip
atio
n ra
te (
%)
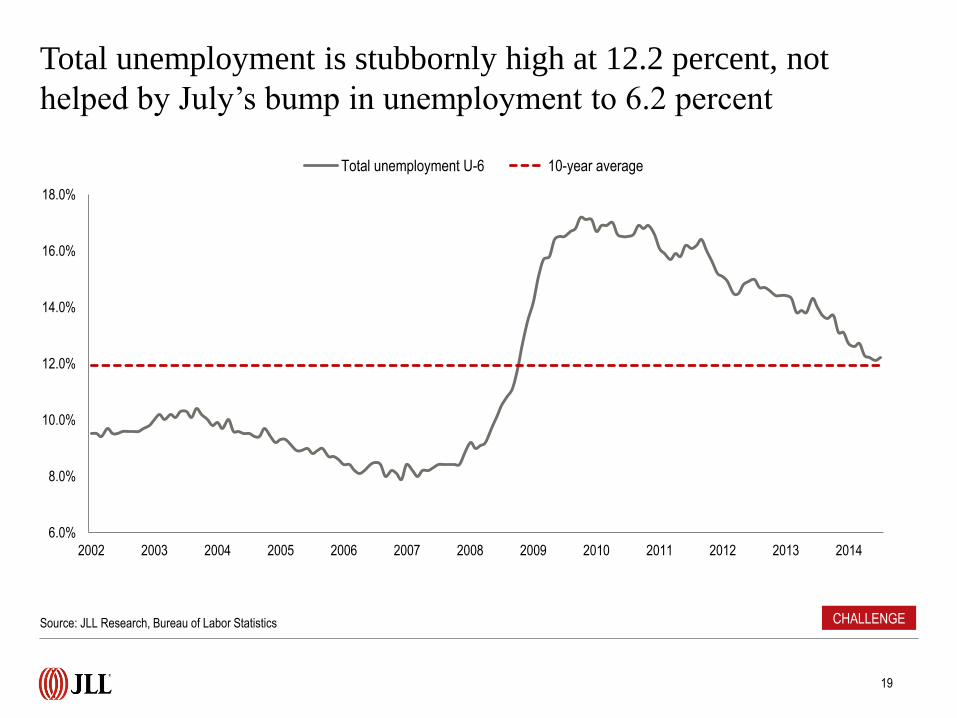
Total unemployment is stubbornly high at 12.2 percent, not
helped by July’s bump in unemployment to 6.2 percent
6.0%
8.0%
10.0%
12.0%
14.0%
16.0%
18.0%
2002 2003 2004 2005 2006 2007 2008 2009 2010 2011 2012 2013 2014
Total unemployment U-6 10-year average
Source: JLL Research, Bureau of Labor Statistics
19
CHALLENGE

The slowdown in PBS growth has had a measurable impact
on the office-using sector, contributing a quarter of new jobs
Source: JLL Research, Bureau of Labor Statistics
20
CHALLENGE

Office-using growth has become increasingly unstable, with
year-on-year growth slowing to the 2.3-percent range
-300
-250
-200
-150
-100
-50
0
50
100
150
2009 2010 2011 2012 2013 2014
Information Professional and business services Financial activities
PBS represented 75.0 percent of office jobs lost in February 2010.
In July 2014, it represented all 83.9 percent of new office jobs.
Source: JLL Research, Bureau of Labor Statistics
21
CHALLENGE

Labor force participation in both college and high school grads
is falling and has yet to flatline
Source: JLL Research, Bureau of Labor Statistics
22
CHALLENGE
54.0%
55.0%
56.0%
57.0%
58.0%
59.0%
60.0%
61.0%
62.0%
63.0%
64.0%
70.0%
71.0%
72.0%
73.0%
74.0%
75.0%
76.0%
77.0%
78.0%
79.0%
80.0%
2007 2008 2009 2010 2011 2012 2013 2014
Hig
h sc
hool
gra
duat
e la
bor
forc
e pa
rtic
ipat
ion
rate
(%
)
Col
lege
gra
duat
e la
bor
forc
e pa
rtic
ipat
ion
rate
(%
)
Bachelor's degree High school, no college

Temporary help services nears 2.9 million jobs, although its
rate of growth is slowing somewhat
1,000.0
1,200.0
1,400.0
1,600.0
1,800.0
2,000.0
2,200.0
2,400.0
2,600.0
2,800.0
3,000.0
-100.0
-80.0
-60.0
-40.0
-20.0
0.0
20.0
40.0
60.0
80.0
2009 2010 2011 2012 2013 2014
Mon
thly
net
cha
nge
in jo
bs (
ths)
Temporary employment monthly net change Temporary employment
Temporary em
ployment (ths)
Source: JLL Research, Bureau of Labor Statistics
23
CHALLENGE

©2014 JLL Research IP, Inc. All rights reserved. All information contained herein is from sources deemed reliable; however, no representation or warranty is made to the accuracy thereof.
For more information, please contact:
Ben Breslau
Managing Director - Americas Research
John Sikaitis
Managing Director - Office and Local Markets Research
Phil Ryan
Research Analyst
Or, find more employment, business and real
estate research at jll.com.
>>> Click here to check it out.