Embed Size (px)
Citation preview

Financial Results Q2 2014
CEO Jouko Karvinen, Karl-Henrik Sundström (CEO as of 1 August) and CFO Seppo Parvi21 July 2014

It should be noted that certain statements herein which are not historical facts, including, withoutlimitation those regarding expectations for market growth and developments; expectations for growthand profitability; and statements preceded by “believes”, “expects”, “anticipates”, “foresees”, or similarexpressions, are forward-looking statements within the meaning of the United States Private SecuritiesLitigation Reform Act of 1995. Since these statements are based on current plans. estimates andprojections, they involve risks and uncertainties which may cause actual results to materially differ fromthose expressed in such forward-looking statements. Such factors include, but are not limited to: (1)operating factors such as continued success of manufacturing activities and the achievement ofefficiencies therein, continued success of product development, acceptance of new products or servicesby the Group’s targeted customers, success of the existing and future collaboration arrangements,changes in business strategy or development plans or targets, changes in the degree of protectioncreated by the Group’s patents and other intellectual property rights, the availability of capital onacceptable terms; (2) industry conditions, such as strength of product demand, intensity of competition,prevailing and future global market prices for the Group’s products and the pricing pressures thereto.price fluctuations in raw materials, financial condition of the customers and the competitors of theGroup, the potential introduction of competing products and technologies by competitors; and (3)general economic conditions, such as rates of economic growth in the Group’s principal geographicmarkets or fluctuations in exchange and interest rates.
Stora Enso Q2 2014 Financial Results 221 July 2014

Significant operational earnings improvement continuesQ2 2014 year-on-year
• Sales EUR 2 579 (EUR 2 726) million, structural paper demand decline• Operational EBITDA margin of 12.6 (9.4) %, EUR 326 (EUR 257) million • Operational EBIT margin of 8.1 (4.5) %, EUR 209 (EUR124) million• Net debt to Operational EBITDA 2.8 (3.2)• Operational ROCE 9.8 (5.4)%
• Fixed costs reduction programme completed– Savings of MEUR 244 million, exceeding target by 22%
• Transformation to renewable materials company continues– Virdia acquisition and Varkaus packaging materials conversion
• Corbehem Mill closure plan announced
Stora Enso Q2 2014 Financial Results 321 July 2014
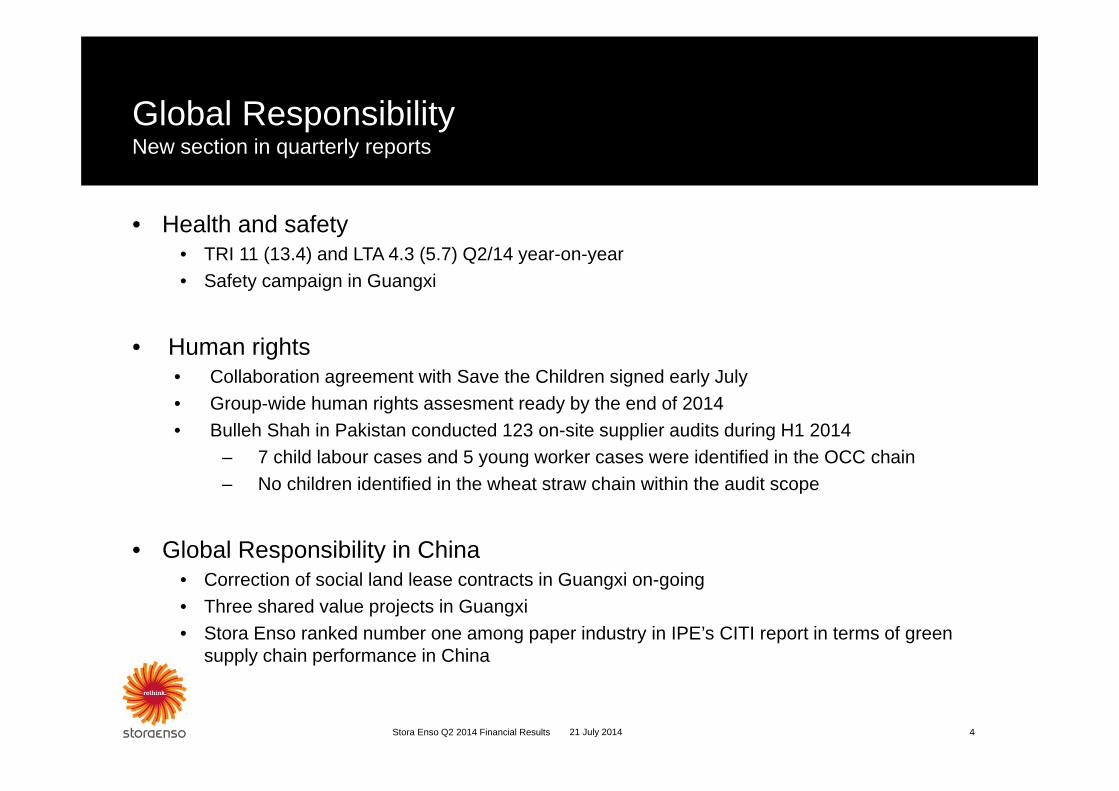
Global ResponsibilityNew section in quarterly reports
• Health and safety • TRI 11 (13.4) and LTA 4.3 (5.7) Q2/14 year-on-year• Safety campaign in Guangxi
• Human rights• Collaboration agreement with Save the Children signed early July• Group-wide human rights assesment ready by the end of 2014• Bulleh Shah in Pakistan conducted 123 on-site supplier audits during H1 2014
– 7 child labour cases and 5 young worker cases were identified in the OCC chain– No children identified in the wheat straw chain within the audit scope
• Global Responsibility in China• Correction of social land lease contracts in Guangxi on-going• Three shared value projects in Guangxi• Stora Enso ranked number one among paper industry in IPE’s CITI report in terms of green
supply chain performance in China
Stora Enso Q2 2014 Financial Results 421 July 2014

Operational EBIT up 69%Record Renewable Packaging Performance, Fixed Cost Take Out Target Exceeded
Stora Enso Q2 2014 Financial Results 5
MEUR
0%
1%
2%
3%
4%
5%
6%
7%
8%
9%
0
50
100
150
200
250
12Q2 12Q3 12Q4 13Q1 13Q2 13Q3 13Q4 14Q1 14Q2
Operational EBIT Operational EBIT margin
21 July 2014

Fixed costs reduction programme target exceeded by EUR 44 million or 22%Quarterly fixed cost development Q2 2012–Q2 2014, annualised impact
Stora Enso Q2 2014 Financial Results 21 July 2014 6
*Restated in accordance with IFRS11
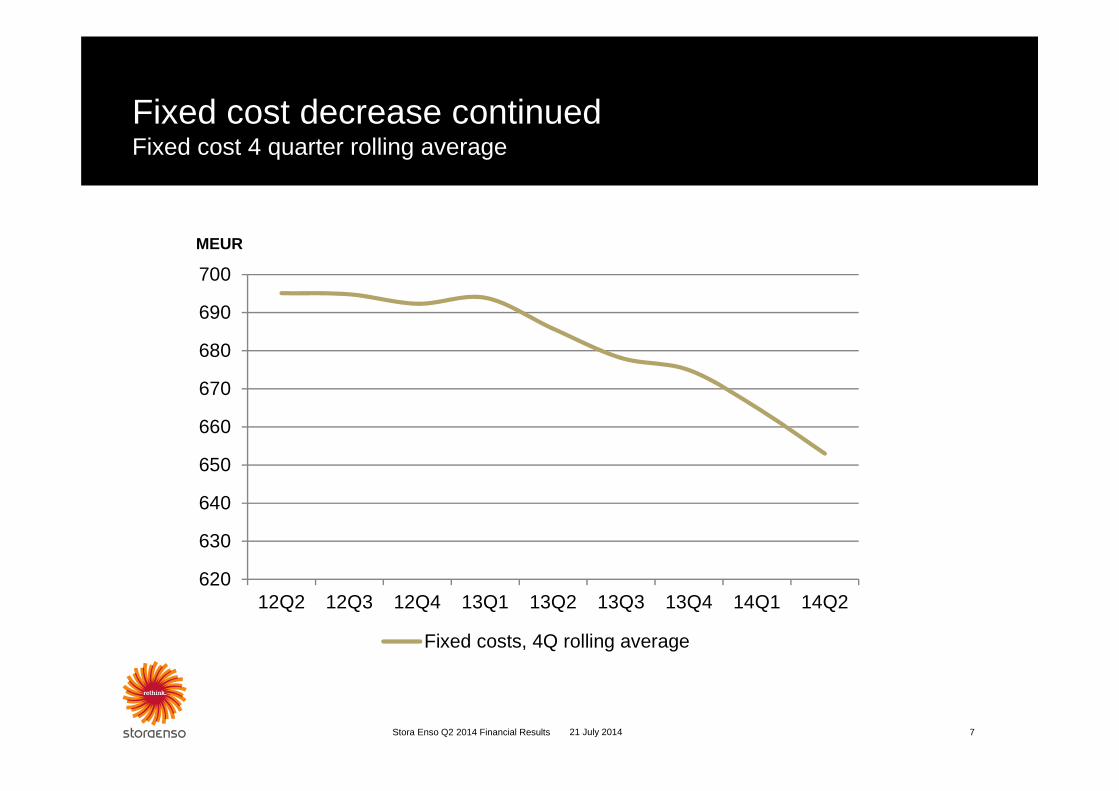
Fixed cost decrease continuedFixed cost 4 quarter rolling average
Stora Enso Q2 2014 Financial Results 7
MEUR
21 July 2014
620
630
640
650
660
670
680
690
700
12Q2 12Q3 12Q4 13Q1 13Q2 13Q3 13Q4 14Q1 14Q2
Fixed costs, 4Q rolling average

Virdia acquisition – enabling step-change entry into high value renewable materials technologies
Stora Enso Q2 2014 Financial Results 821 July 2014
Fine paper machine to be converted to light-weight containerboard in Varkaus Mill
• EUR 110 million for transformation
• EBITDA margin above 15%
• Start up Q4 2015
• Capacity 390 000 tonnes
21 July 2014 9Stora Enso Q2 2014 Financial Results

38 %
32 %
18 %
10 %2 %
2014 H1
66 %
24 %
11 %‐1 %
2006*
The JourneyTo be continued
Stora Enso Q2 2014 Financial Results 1021 July 2014
Breakdown of sales
*Including North America and Merchants. Pulp produced was used internally.
2006* 2014 H1
New Leadership, journey continuesCEO as of 1 August: Karl-Henrik Sundström
• EVP, Printing and Living Division
• Joined in August 2012 as a CFO
• Wide global experience in manufacturing industry
• A solid background in financial management
21 July 2014Stora Enso Q2 2014 Financial Results 11


Summary financialsQ2 2014
13Stora Enso Q2 2014 Financial Results 21 July 2014

Printing and Reading Operational EBIT improved EUR 53 millionQ2 2014 year-on-year
• Operational EBIT:– Costs lower– Depreciation EUR 20 million lower– Lower volumes due to machine
closures
• Cash flow improved sequentially
• Uetersen Mill non-core asset divestment
• Corbehem Mill closure plan
• Maintenance at Oulu, Kvarnsvedenand Veitsiluoto Mills in Q3
Stora Enso Q2 2014 Financial Results 14
MEUR
21 July 2014
0
20
40
60
80
100
120
140
160
12Q2 12Q3 12Q4 13Q1 13Q2 13Q3 13Q4 14Q1 14Q2
Operational EBITDA
Cash flow from operations, 4Q rolling
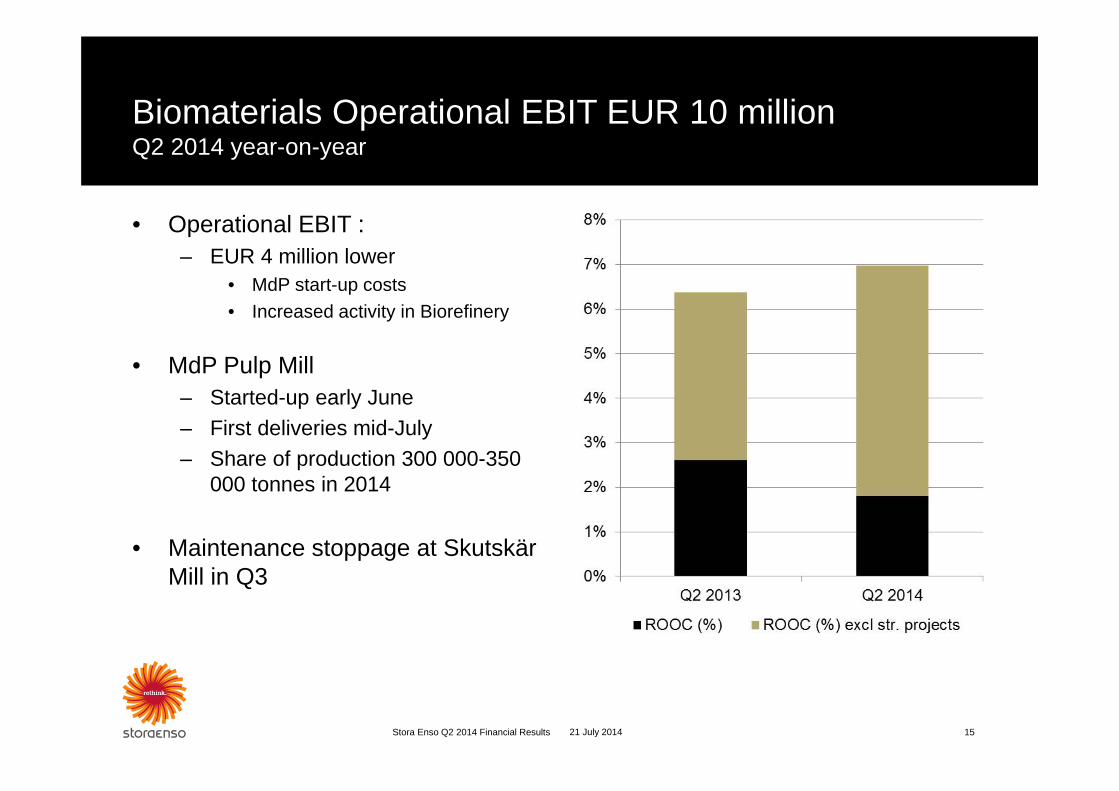
Biomaterials Operational EBIT EUR 10 millionQ2 2014 year-on-year
15Stora Enso Q2 2014 Financial Results
• Operational EBIT :– EUR 4 million lower
• MdP start-up costs• Increased activity in Biorefinery
• MdP Pulp Mill– Started-up early June – First deliveries mid-July– Share of production 300 000-350
000 tonnes in 2014
• Maintenance stoppage at SkutskärMill in Q3
21 July 2014

Building and Living highest quarterly Operational EBIT since Q2 2007Q2 2014 year-on-year
• Operational EBIT EUR 37 million:– Increase of 32%– Lower fixed costs due to own
actions– Operational ROOC 27%
• Several sawmills have maintenance stoppages during Q3
21 July 2014Stora Enso Q2 2014 Financial Results 16
MEUR
0%2%4%6%8%10%12%14%16%18%20%
0
5
10
15
20
25
30
35
40
12Q2 12Q3 12Q4 13Q1 13Q2 13Q3 13Q4 14Q1 14Q2
Operational EBIT ROOC, 4Q rolling
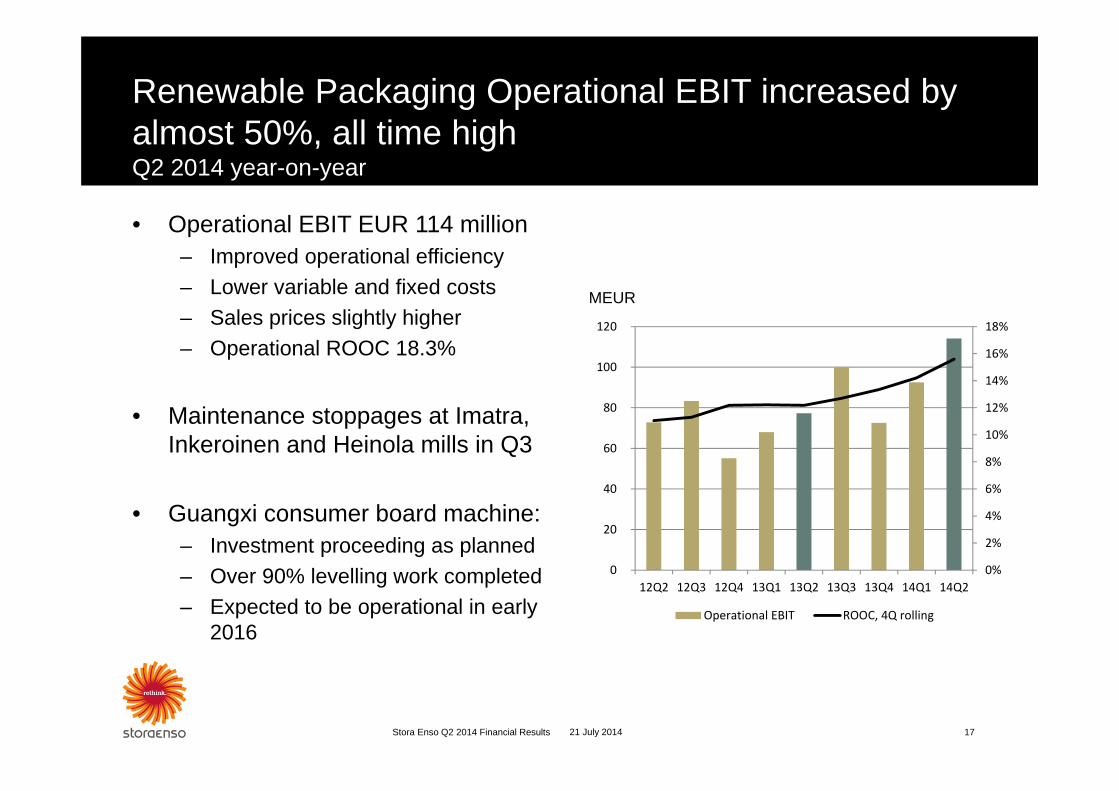
Renewable Packaging Operational EBIT increased by almost 50%, all time highQ2 2014 year-on-year
MEUR
17Stora Enso Q2 2014 Financial Results
• Operational EBIT EUR 114 million– Improved operational efficiency– Lower variable and fixed costs– Sales prices slightly higher– Operational ROOC 18.3%
• Maintenance stoppages at Imatra, Inkeroinen and Heinola mills in Q3
• Guangxi consumer board machine:– Investment proceeding as planned– Over 90% levelling work completed– Expected to be operational in early
2016
0%
2%
4%
6%
8%
10%
12%
14%
16%
18%
0
20
40
60
80
100
120
12Q2 12Q3 12Q4 13Q1 13Q2 13Q3 13Q4 14Q1 14Q2
Operational EBIT ROOC, 4Q rolling
21 July 2014

Forecast for Capex and Equity Injections in 2014Forecast unchanged
* Capital expenditure includes approximately EUR 300 million for the project in Guangxi, China. These figures do not include theacquisition of Bergvik Skog and Virdia shares.
18Stora Enso Q2 2014 Financial Results 21 July 2014
EUR million Forecast 2014*
Capital expenditure 760–840
Equity injections 30
Total 790–870
Depreciation 550–580

Guidance for Q3 2014Compared to Q2 2014
• Sales are forecast to be roughly similar to the EUR 2 579 million
• Operational EBIT similar to or slightly lower than the strong EUR 209 million in Q2
• The maintenance impact in Q3/2014 is expected to be approximately EUR 30 million higher than in Q2/2014.
Stora Enso Q2 2014 Financial Results 2021 July 2014

”We will continue on the chosen path”
• To build a winning team
• More resources to the Corporate Responsibility area
• Company transformation with increased customer focus
– MdP Pulp Mill– Virdia acquisition– Varkaus machine conversion to
packaging materials– Guangxi Consumer Board Mill
21 July 2014Stora Enso Q2 2014 Financial Results 21


Operational EBIT by segments
23Stora Enso Q2 2014 Financial Results 21 July 2014
EUR million Q2/14 Q2/13Change % Change %
Q2 14 / Q2 13
Q1/14 Q2 14 / Q1 14
Printing and Reading 36 -17 n/m 35 2.9% of sales 3.7 -1.5 3.5
Biomaterials 10 14 -28.6 21 -52.4% of sales 4.1 5.3 8.0
Building and Living 37 28 32.1 20 85.0% of sales 7.6 5.6 4.5
Renewable Packaging 114 77 48.1 92 23.9% of sales 13.4 9.2 11.2
Other 12 22 -45.5 14 -14.3% of sales 1.8 3.2 2.0

Cash flow in Q2 2014
Stora Enso Q2 2014 Financial Results 24
MEUR
21 July 2014
‐100
‐50
0
50
100
150
Printing andReading
Biomaterials Building andLiving
RenewablePackaging
Other
Cash flow from Operations Cash flow after investments

Balance Sheet strengthQ2 2012 – Q2 2014
Stora Enso Q2 2014 Financial Results 25
*Last twelve months’ operational EBITDA
MEUR
2,6
2,7
2,8
2,9
3,0
3,1
3,2
3,3
2 900
3 000
3 100
3 200
3 300
3 400
3 500
3 600
12Q2 12Q3 12Q4 13Q1 13Q2 13Q3 13Q4 14Q1 14Q2
Net Debt Net Debt/Operational EBITDA*
21 July 2014

Permanent pulp, paper and board capacity reductions since 2006
Stora Enso Q2 2014 Financial Results 2621 July 2014
Mill Date Grade Capacity reduction, t
Corbehem PM 3 and PM 4 Jun 2006 LWC 250 000
Varkaus PM 1 End 2006 WFC 95 000
Berghuizer Mill Oct 2007 WFU 235 000
Reisholz Mill End 2007 SC 215 000
Summa Mill Jan 2008 Newsprint, uncoated mag, book paper 415 000
Anjala Mill PM1 Feb 2008 Coated magazine paper 155 000
Baienfurt Mill End 2008 FBB 190 000
Kabel Mill PM 3 End 2008 Coated magazine 140 000
Kemijärvi Pulp Mill April 2008 Long-fibre (SW) pulp 250 000
Norrsundet Pulp Mill Dec 2008 Long-fibre (SW), pulp 300 000
Varkaus Mill coreboard machine Dec 2008 Coreboard 100 000
Imatra PM 8 Mar 2010 WFU 210 000
Varkaus PM 2 and PM 4 Sep 2010 Newsprint, directory paper 290 000
Maxau PM 7 Nov 2010 Newsprint 195 000
Hylte PM1 Dec 2012 Newsprint 180 000
Ostroleka PM2 Jan 2013 Containerboard 85 000
Hylte PM2 May 2013 Newsprint 205 000
Kvarnsveden PM11 May 2013 Newsprint 270 000
Veitsiluoto PM1 Apr 2014 Coated magazine 190 000
Total 3 970 000

Permanent sawn wood capacity reductions since 2006
Stora Enso Q2 2014 Financial Results 2721 July 2014
Mill Date Capacity reduction, m3
Veitsiluoto Sawmill 2006 100 000
Honkalahti Sawmill 2006 90 000
Sauga Sawmill Jun 2007 130 000
Sollenau Sawmill 2007 110 000
Näpi Sawmill 2007-2008 100 000
Kotka Sawmill 2007-2008 70 000
Paikuse Sawmill End 2008 220 000
Zdirec Sawmill 2008 120 000
Ybbs Sawmill 2008 & Jun 2009 200 000
Kitee Sawmill 2008 & Jun 2009 130 000
Varkaus Sawmill Jun 2009 60 000
Tolkkinen Sawmill End 2009 260 000
Kopparfors Sawmill End 2011 310 000
Sollenau Sawmill Mar 2014 150 000
Total 2 050 000
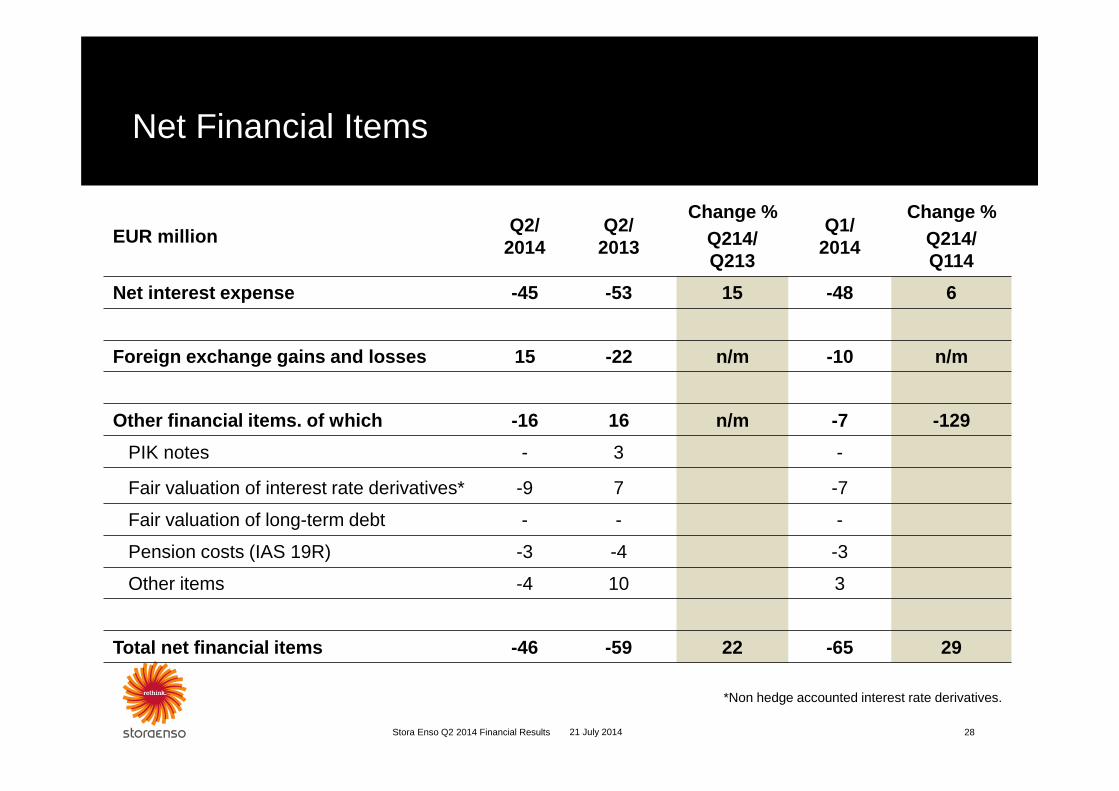
Net Financial Items
Stora Enso Q2 2014 Financial Results 28
*Non hedge accounted interest rate derivatives.
21 July 2014
EUR million Q2/2014
Q2/2013
Change % Q214/Q213
Q1/2014
Change % Q214/Q114
Net interest expense -45 -53 15 -48 6
Foreign exchange gains and losses 15 -22 n/m -10 n/m
Other financial items. of which -16 16 n/m -7 -129PIK notes - 3 -
Fair valuation of interest rate derivatives* -9 7 -7
Fair valuation of long-term debt - - -
Pension costs (IAS 19R) -3 -4 -3
Other items -4 10 3
Total net financial items -46 -59 22 -65 29
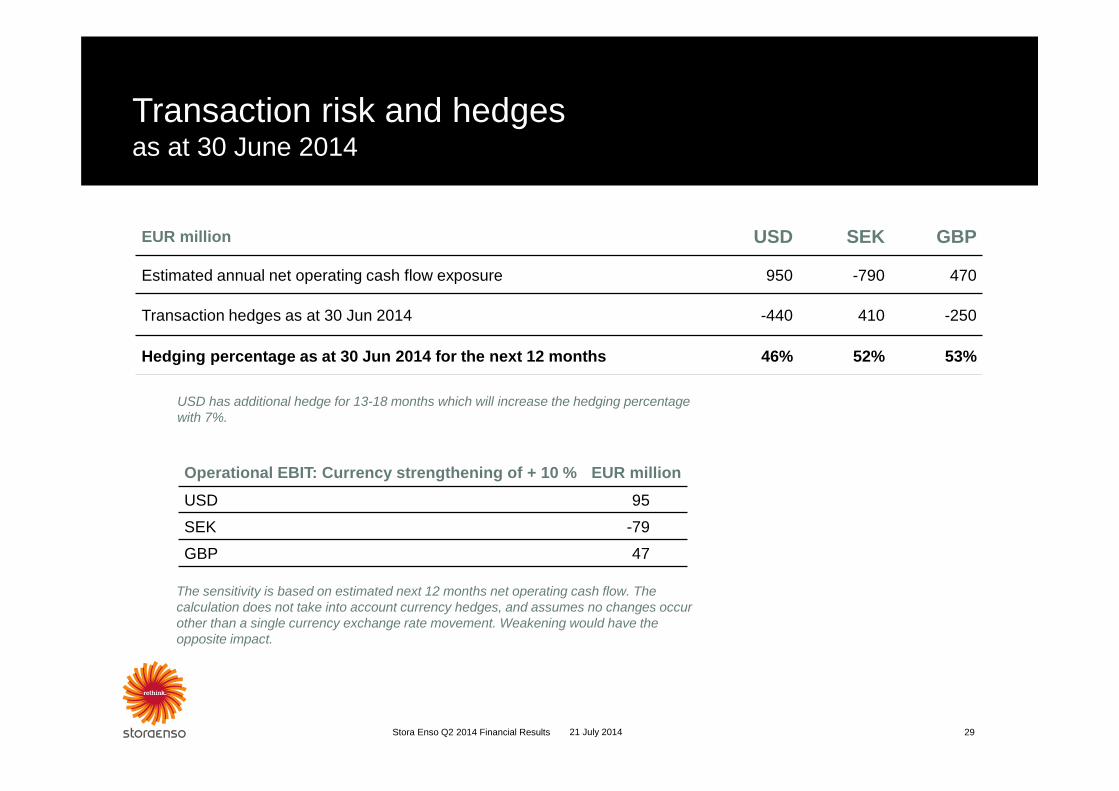
Transaction risk and hedgesas at 30 June 2014
The sensitivity is based on estimated next 12 months net operating cash flow. The calculation does not take into account currency hedges, and assumes no changes occur other than a single currency exchange rate movement. Weakening would have the opposite impact.
Stora Enso Q2 2014 Financial Results
USD has additional hedge for 13-18 months which will increase the hedging percentage with 7%.
2921 July 2014
EUR million USD SEK GBP
Estimated annual net operating cash flow exposure 950 -790 470
Transaction hedges as at 30 Jun 2014 -440 410 -250
Hedging percentage as at 30 Jun 2014 for the next 12 months 46% 52% 53%
Operational EBIT: Currency strengthening of + 10 % EUR millionUSD 95
SEK -79
GBP 47

0
2
4
6
8
10
12
14
16
11Q1 11Q2 11Q3 11Q4 12Q1 12Q2 12Q3 12Q4 13Q1 13Q2 13Q3 13Q4 14Q1 14Q2
Paper and Board Wood Products
Curtailmentsof capacity
30Stora Enso Q2 2014 Financial Results
% of the capacity
21 July 2014

Softwood pulp pricesStora Enso’s market pulp is softwood
Stora Enso Q2 2014 Financial Results 31
Source: FOEX
21 July 2014
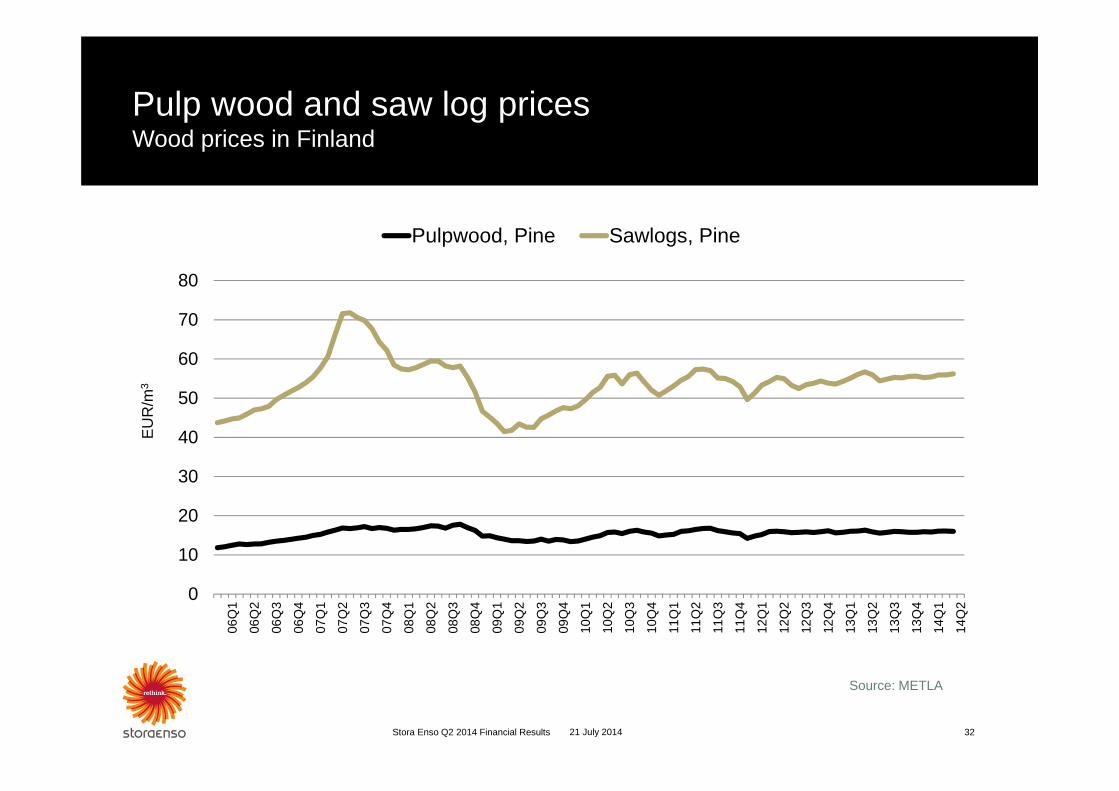
Pulp wood and saw log pricesWood prices in Finland
Source: METLA
32Stora Enso Q2 2014 Financial Results 21 July 2014
0
10
20
30
40
50
60
70
80
06Q
1
06Q
2
06Q
3
06Q
4
07Q
1
07Q
2
07Q
3
07Q
4
08Q
1
08Q
2
08Q
3
08Q
4
09Q
1
09Q
2
09Q
3
09Q
4
10Q
1
10Q
2
10Q
3
10Q
4
11Q
1
11Q
2
11Q
3
11Q
4
12Q
1
12Q
2
12Q
3
12Q
4
13Q
1
13Q
2
13Q
3
13Q
4
14Q
1
14Q
2
EUR
/m3
Pulpwood, Pine Sawlogs, Pine

Paper for Recycling prices
Stora Enso Q2 2014 Financial Results 33
German RCP price development. free deliveredSource: Verband Deutscher Papierfabriken/Stora Enso
21 July 2014
0,0
40,0
80,0
120,0
160,0
200,0
07Q
1
07Q
3
08Q
1
08Q
3
09Q
1
09Q
3
10Q
1
10Q
3
11Q
1
11Q
3
12Q
1
12Q
3
13Q
1
13Q
3
14Q
1
EUR
/tonn
eMixed OCC De-inking
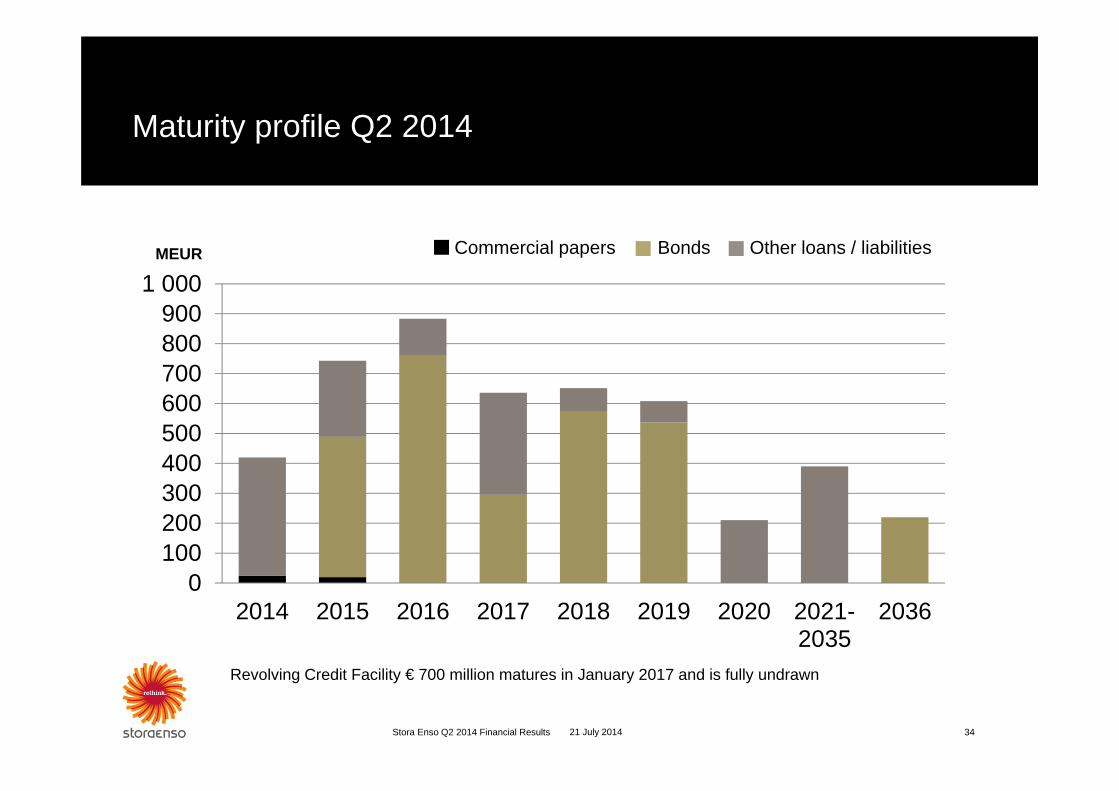
MEUR Other loans / liabilitiesBondsCommercial papers
Revolving Credit Facility € 700 million matures in January 2017 and is fully undrawn
Maturity profile Q2 2014
21 July 2014Stora Enso Q2 2014 Financial Results 34
0100200300400500600700800900
1 000
2014 2015 2016 2017 2018 2019 2020 2021-2035
2036

Energy balance* Q2 2014
Stora Enso Q2 2014 Financial Results 35
**) Remaining impact on non-hedged volume*) Pulp. paper and board mills. Europe and overseas
21 July 2014
Impact** on operating profit from 10% change in: EUR million p.a.
Electricity market price ~3
Fossil fuel price ~10

Stora Enso Electricity procurement* Q2 2014
Stora Enso Q2 2014 Financial Results 36
*) Pulp. paper and board mills. Europe and overseas3621 July 2014