Embed Size (px)
Citation preview

FinancialsPart of Stora Enso’s Annual Report 2018
Strateg
yS
ustainability
FinancialsG
overnance
Annual Report 2018
Financials
Financials includes the report of the Board of Directors and the financial statements, as well as Stora Enso in capital markets and our tax footprint.
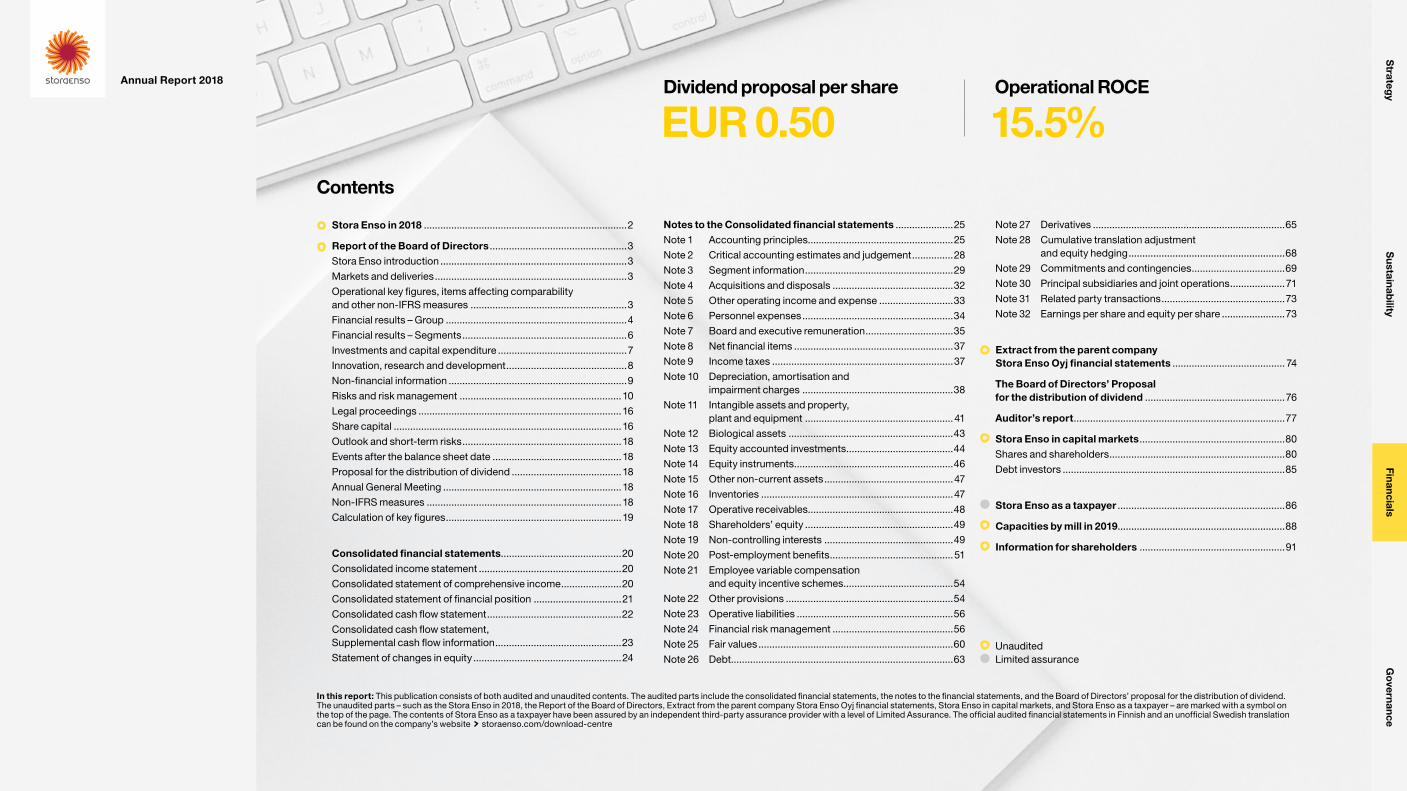
Operational ROCE
15.5%Dividend proposal per share
EUR 0.50
Stora Enso in 2018 ..........................................................................2
Report of the Board of Directors ..................................................3
Stora Enso introduction ....................................................................3
Markets and deliveries ......................................................................3
Operational key figures, items affecting comparability and other non-IFRS measures .........................................................3
Financial results – Group ..................................................................4
Financial results – Segments ............................................................6
Investments and capital expenditure ...............................................7
Innovation, research and development ............................................8
Non-financial information .................................................................9
Risks and risk management ...........................................................10
Legal proceedings ..........................................................................16
Share capital ...................................................................................16
Outlook and short-term risks ..........................................................18
Events after the balance sheet date ...............................................18
Proposal for the distribution of dividend ........................................18
Annual General Meeting .................................................................18
Non-IFRS measures .......................................................................18
Calculation of key figures ................................................................19
Consolidated financial statements ............................................20
Consolidated income statement ....................................................20
Consolidated statement of comprehensive income ......................20
Consolidated statement of financial position ................................21
Consolidated cash flow statement .................................................22
Consolidated cash flow statement, Supplemental cash flow information ..............................................23
Statement of changes in equity ......................................................24
Notes to the Consolidated financial statements .....................25
Note 1 Accounting principles.....................................................25
Note 2 Critical accounting estimates and judgement ...............28
Note 3 Segment information ......................................................29
Note 4 Acquisitions and disposals ............................................32
Note 5 Other operating income and expense ...........................33
Note 6 Personnel expenses .......................................................34
Note 7 Board and executive remuneration ................................35
Note 8 Net financial items ..........................................................37
Note 9 Income taxes ..................................................................37
Note 10 Depreciation, amortisation and impairment charges .......................................................38
Note 11 Intangible assets and property, plant and equipment ......................................................41
Note 12 Biological assets ............................................................43
Note 13 Equity accounted investments .......................................44
Note 14 Equity instruments ..........................................................46
Note 15 Other non-current assets ...............................................47
Note 16 Inventories ......................................................................47
Note 17 Operative receivables.....................................................48
Note 18 Shareholders’ equity ......................................................49
Note 19 Non-controlling interests ...............................................49
Note 20 Post-employment benefits .............................................51
Note 21 Employee variable compensation and equity incentive schemes ........................................54
Note 22 Other provisions .............................................................54
Note 23 Operative liabilities .........................................................56
Note 24 Financial risk management ............................................56
Note 25 Fair values .......................................................................60
Note 26 Debt.................................................................................63 Unaudited
Limited assurance
Note 27 Derivatives ......................................................................65
Note 28 Cumulative translation adjustment and equity hedging .........................................................68
Note 29 Commitments and contingencies ..................................69
Note 30 Principal subsidiaries and joint operations ....................71
Note 31 Related party transactions .............................................73
Note 32 Earnings per share and equity per share .......................73
Extract from the parent company Stora Enso Oyj financial statements ......................................... 74
The Board of Directors’ Proposal for the distribution of dividend ...................................................76
Auditor’s report .............................................................................77
Stora Enso in capital markets .....................................................80
Shares and shareholders ................................................................80
Debt investors .................................................................................85
Stora Enso as a taxpayer .............................................................86
Capacities by mill in 2019.............................................................88
Information for shareholders .....................................................91
Contents
In this report: This publication consists of both audited and unaudited contents. The audited parts include the consolidated financial statements, the notes to the financial statements, and the Board of Directors’ proposal for the distribution of dividend. The unaudited parts – such as the Stora Enso in 2018, the Report of the Board of Directors, Extract from the parent company Stora Enso Oyj financial statements, Stora Enso in capital markets, and Stora Enso as a taxpayer – are marked with a symbol on the top of the page. The contents of Stora Enso as a taxpayer have been assured by an independent third-party assurance provider with a level of Limited Assurance. The official audited financial statements in Finnish and an unofficial Swedish translation can be found on the company’s website storaenso.com/download-centre
Strateg
yS
ustainability
FinancialsG
overnance
Annual Report 2018
Stora Enso in 2018
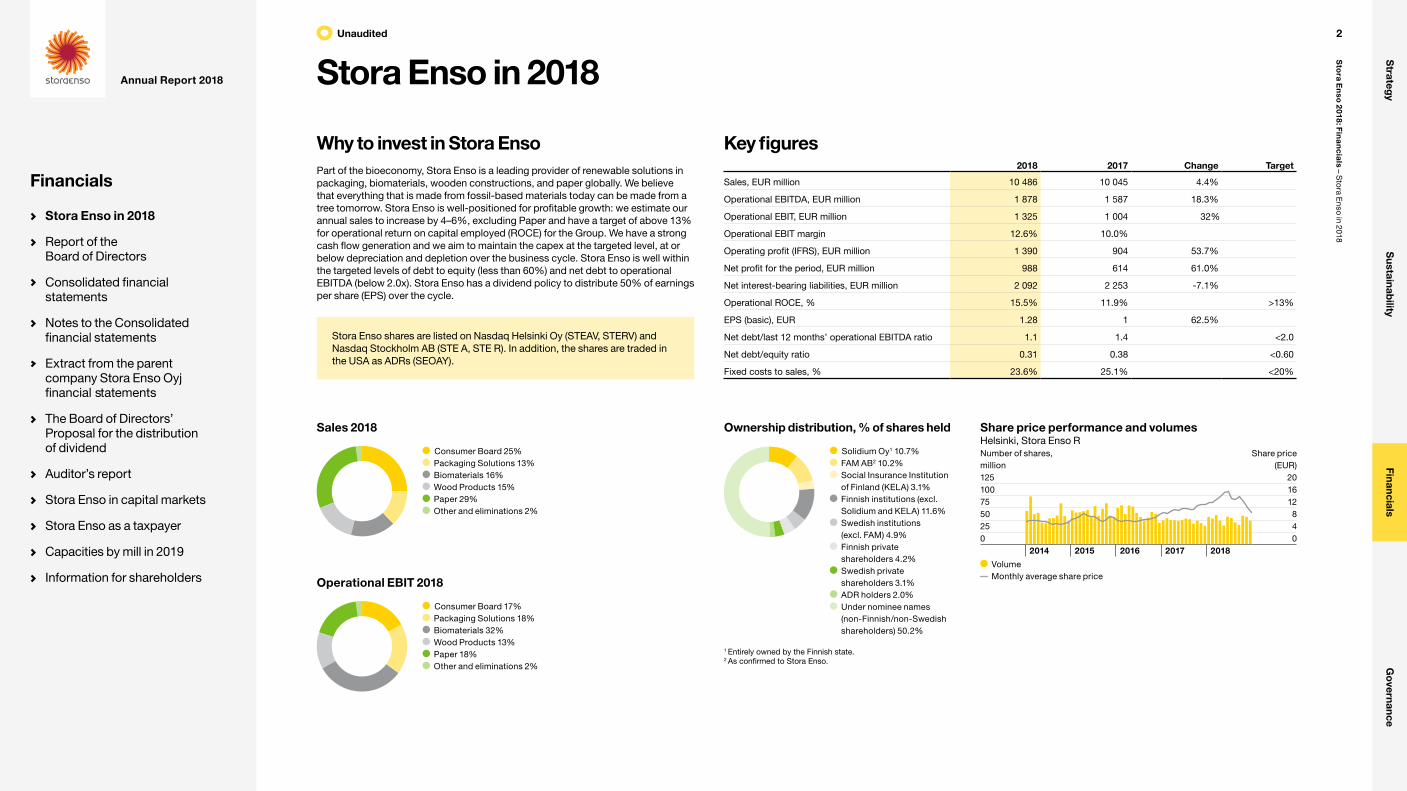
Why to invest in Stora EnsoPart of the bioeconomy, Stora Enso is a leading provider of renewable solutions in packaging, biomaterials, wooden constructions, and paper globally. We believe that everything that is made from fossil-based materials today can be made from a tree tomorrow. Stora Enso is well-positioned for profitable growth: we estimate our annual sales to increase by 4–6%, excluding Paper and have a target of above 13% for operational return on capital employed (ROCE) for the Group. We have a strong cash flow generation and we aim to maintain the capex at the targeted level, at or below depreciation and depletion over the business cycle. Stora Enso is well within the targeted levels of debt to equity (less than 60%) and net debt to operational EBITDA (below 2.0x). Stora Enso has a dividend policy to distribute 50% of earnings per share (EPS) over the cycle.
Share price performance and volumesHelsinki, Stora Enso RNumber of shares, million
Share price (EUR)
125 20100 1675 1250 825 40 0
2014 2015 2016 2017 2018
Volume Monthly average share price
Sales 2018
Consumer Board 25% Packaging Solutions 13% Biomaterials 16% Wood Products 15% Paper 29% Other and eliminations 2%
Operational EBIT 2018
Consumer Board 17% Packaging Solutions 18% Biomaterials 32% Wood Products 13% Paper 18% Other and eliminations 2%
Key figures2018 2017 Change Target
Sales, EUR million 10 486 10 045 4.4%
Operational EBITDA, EUR million 1 878 1 587 18.3%
Operational EBIT, EUR million 1 325 1 004 32%
Operational EBIT margin 12.6% 10.0%
Operating profit (IFRS), EUR million 1 390 904 53.7%
Net profit for the period, EUR million 988 614 61.0%
Net interest-bearing liabilities, EUR million 2 092 2 253 -7.1%
Operational ROCE, % 15.5% 11.9% >13%
EPS (basic), EUR 1.28 1 62.5%
Net debt/last 12 months’ operational EBITDA ratio 1.1 1.4 <2.0
Net debt/equity ratio 0.31 0.38 <0.60
Fixed costs to sales, % 23.6% 25.1% <20%
Stora Enso shares are listed on Nasdaq Helsinki Oy (STEAV, STERV) and Nasdaq Stockholm AB (STE A, STE R). In addition, the shares are traded in the USA as ADRs (SEOAY).
Ownership distribution, % of shares held
Solidium Oy1 10.7% FAM AB2 10.2% Social Insurance Institution of Finland (KELA) 3.1%
Finnish institutions (excl. Solidium and KELA) 11.6%
Swedish institutions (excl. FAM) 4.9%
Finnish private shareholders 4.2%
Swedish private shareholders 3.1%
ADR holders 2.0% Under nominee names (non-Finnish/non-Swedish shareholders) 50.2%
1 Entirely owned by the Finnish state.2 As confirmed to Stora Enso.
Unaudited 2
Sto
ra En
so 2
018: Fin
an
cia
ls – Sto
ra Enso in 2018
Strateg
yS
ustainability
FinancialsG
overnance
Annual Report 2018
Financials
Stora Enso in 2018
Report of the Board of Directors
Consolidated financial statements
Notes to the Consolidated financial statements
Extract from the parent company Stora Enso Oyj financial statements
The Board of Directors’ Proposal for the distribution of dividend
Auditor’s report
Stora Enso in capital markets
Stora Enso as a taxpayer
Capacities by mill in 2019
Information for shareholders
Report of the Board of Directors
Stora Enso introductionPart of the bioeconomy, Stora Enso (the Group or the Company) is a leading global provider of renewable solutions in packaging, biomaterials, wooden constructions and papers. Our customers include packaging manufacturers, brand owners, paper and board producers, publishers, retailers, printing houses, converters, and joinery and construction companies.
Our fibre-based materials are renewable and recyclable. Our solutions offer low-carbon alternatives to products based on fossil fuels and other non-renewable materials. We believe that everything that is made from fossil-based materials today can be made from a tree tomorrow.
We make every effort to use 100% of a tree for our products as well as for producing bioenergy. In production, we are driving down the use of fossil fuels and pushing towards carbon neutrality as much as it is technically and commercially feasible. We practice and promote sustainable forestry, and work to ensure that more trees are planted than are harvested.
Stora Enso has some 26 000 employees. Our sales in 2018 were EUR 10.5 billion, with an operational EBIT of EUR 1.3 billion. Stora Enso shares are listed on Nasdaq Helsinki Oy (STEAV, STERV) and Nasdaq Stockholm AB (STE A, STE R).
Markets and deliveriesDemand for cartonboard increased by 2% in Western Europe and continued to grow strongly in Eastern Europe, reaching almost 5% growth in 2018. Demand for cartonboard in North America decreased slightly by 1% and demand in Asia Pacific declined 2% after a long period of strong demand growth. This was due to a 5% market decline in China.
Containerboard demand was healthy in 2018. However, the annual average growth rate decreased slightly towards the end of the year due to global economic uncertainties related to e.g. trade dispute among other factors. Demand growth of corrugated board was strong; the annual average growth rate in our European focus countries was almost 3%.
World chemical market pulp demand slowed down from previous year and rose approximately 1.2% during 2018. Softwood pulp demand contracted by 2.5%, and hardwood pulp demand grew by 3.7% compared to 2017. Global demand increased in Europe and China and was stable or declined in other regions. The global increase in supply was again concentrated on the hardwood pulp segment.
Strong market and record high price levels were supported by numerous unexpected disruptions in the supply side over the year, especially in the softwood pulp sector. New capacity and substitution from softwood to hardwood pulp kept the hardwood pulp demand strong. High inventories and weakness in the Chinese paper and board sector started to contract pulp demand in the latter part of the year.
Global market pulp capacity rose around 4.7%, equivalent to 3.1 million tonnes in 2018. Hardwood capacity increased by 5.7% or 2.1 million tonnes. Major increases took place in Asia and Latin America. Softwood capacity expansion accounted 3.5% equivalent to 1 million tonnes mainly in Europe. The overall demand-capacity balance stood at 88%, 4 percent points down from 2017.
Softwood sawn demand remained good in 2018, but with some slowdown in Europe towards the year-end. Market demand in the USA was also good, driving prices to historically high levels during the summer months. Overall market demand was favourable in most markets, but overall uncertainty in global economy was visible in the latter part of the year. The Australian sawn wood market remained active with increased prices, and market was struggling with undersupply for most of the year. Japanese housing market was somewhat below the 2017 level and the market remained overstocked in some products. There was a slight increase in European sawn softwood production, driven by growing consumption in sub region and increasing overseas exports.
Structural erosion of paper demand continued in Europe and North America during 2018. European paper demand was 6% weaker than in 2017. However, European supply and demand was balanced especially in newsprint and uncoated magazine paper grades as result of substantial capacity closures. In North America demand declined by 4% compared to 2017. In Asia demand declined 2%. Global paper consumption was 4% lower than 2017. However, variation between paper grades was wide. Global demand for uncoated fine paper was stable, whereas newsprint declined by 8%.
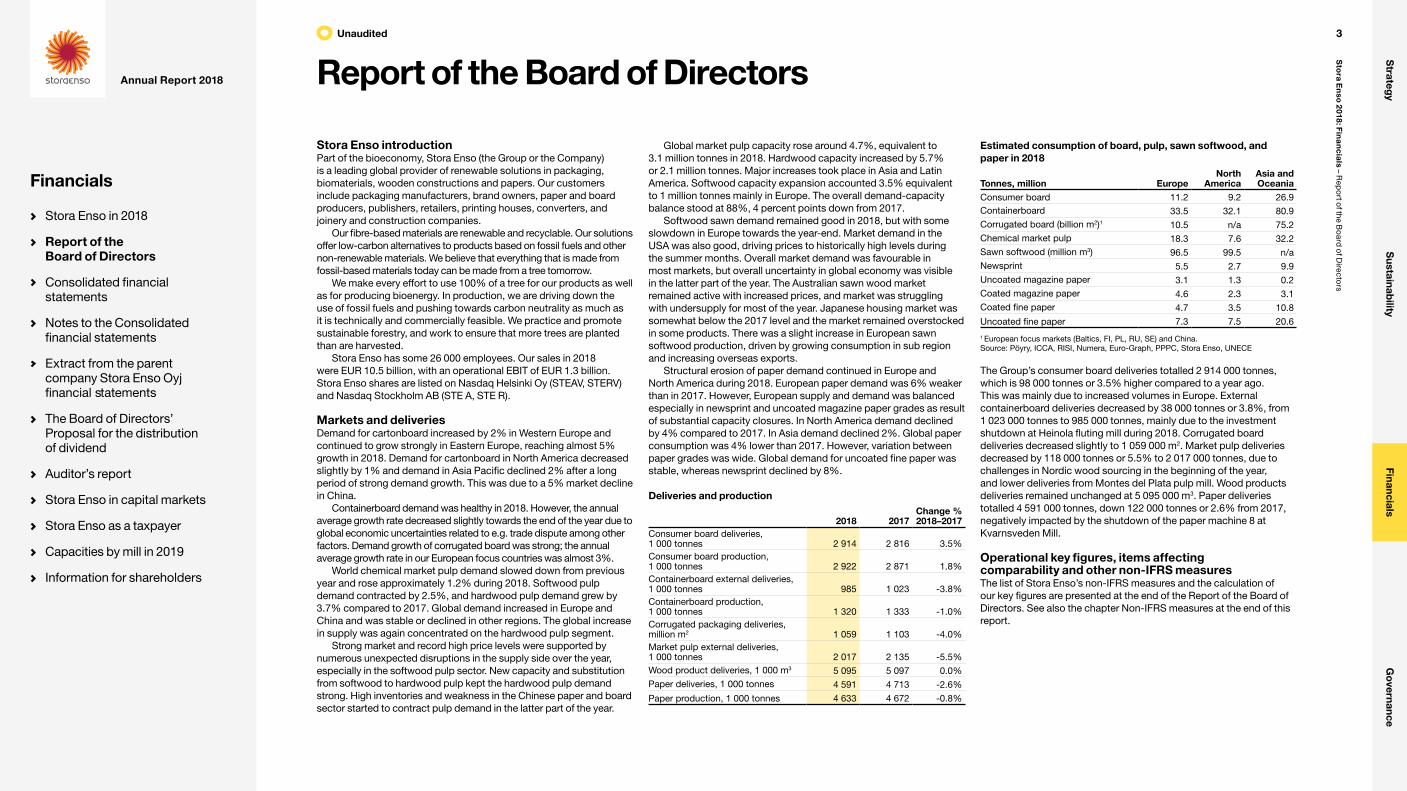
Deliveries and production
2018 2017Change % 2018–2017
Consumer board deliveries, 1 000 tonnes 2 914 2 816 3.5%Consumer board production, 1 000 tonnes 2 922 2 871 1.8%Containerboard external deliveries, 1 000 tonnes 985 1 023 -3.8%Containerboard production, 1 000 tonnes 1 320 1 333 -1.0%Corrugated packaging deliveries, million m2 1 059 1 103 -4.0%Market pulp external deliveries, 1 000 tonnes 2 017 2 135 -5.5%Wood product deliveries, 1 000 m3 5 095 5 097 0.0%Paper deliveries, 1 000 tonnes 4 591 4 713 -2.6%
Paper production, 1 000 tonnes 4 633 4 672 -0.8%
Estimated consumption of board, pulp, sawn softwood, and paper in 2018
Tonnes, million EuropeNorth
AmericaAsia and Oceania
Consumer board 11.2 9.2 26.9Containerboard 33.5 32.1 80.9Corrugated board (billion m2)1 10.5 n/a 75.2Chemical market pulp 18.3 7.6 32.2Sawn softwood (million m3) 96.5 99.5 n/aNewsprint 5.5 2.7 9.9Uncoated magazine paper 3.1 1.3 0.2Coated magazine paper 4.6 2.3 3.1Coated fine paper 4.7 3.5 10.8
Uncoated fine paper 7.3 7.5 20.6
1 European focus markets (Baltics, FI, PL, RU, SE) and China.Source: Pöyry, ICCA, RISI, Numera, Euro-Graph, PPPC, Stora Enso, UNECE
The Group’s consumer board deliveries totalled 2 914 000 tonnes, which is 98 000 tonnes or 3.5% higher compared to a year ago. This was mainly due to increased volumes in Europe. External containerboard deliveries decreased by 38 000 tonnes or 3.8%, from 1 023 000 tonnes to 985 000 tonnes, mainly due to the investment shutdown at Heinola fluting mill during 2018. Corrugated board deliveries decreased slightly to 1 059 000 m2. Market pulp deliveries decreased by 118 000 tonnes or 5.5% to 2 017 000 tonnes, due to challenges in Nordic wood sourcing in the beginning of the year, and lower deliveries from Montes del Plata pulp mill. Wood products deliveries remained unchanged at 5 095 000 m3. Paper deliveries totalled 4 591 000 tonnes, down 122 000 tonnes or 2.6% from 2017, negatively impacted by the shutdown of the paper machine 8 at Kvarnsveden Mill.
Operational key figures, items affecting comparability and other non-IFRS measuresThe list of Stora Enso’s non-IFRS measures and the calculation of our key figures are presented at the end of the Report of the Board of Directors. See also the chapter Non-IFRS measures at the end of this report.
Unaudited 3
Sto
ra En
so 2
018: Fin
an
cia
ls – Rep
ort o
f the Bo
ard o
f Directo
rs
Strateg
yS
ustainability
FinancialsG
overnance
Annual Report 2018
Financials
Stora Enso in 2018
Report of the Board of Directors
Consolidated financial statements
Notes to the Consolidated financial statements
Extract from the parent company Stora Enso Oyj financial statements
The Board of Directors’ Proposal for the distribution of dividend
Auditor’s report
Stora Enso in capital markets
Stora Enso as a taxpayer
Capacities by mill in 2019
Information for shareholders
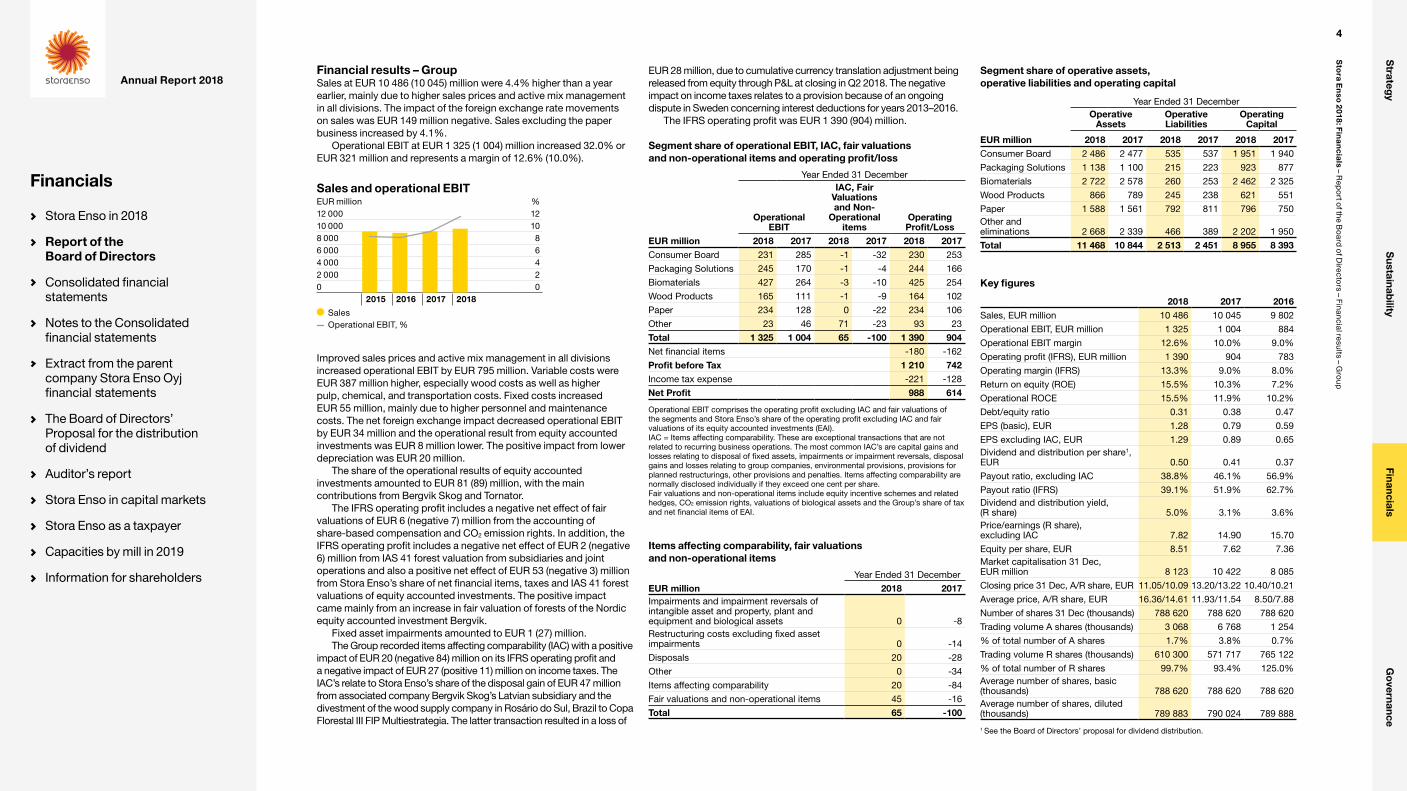
Financial results – GroupSales at EUR 10 486 (10 045) million were 4.4% higher than a year earlier, mainly due to higher sales prices and active mix management in all divisions. The impact of the foreign exchange rate movements on sales was EUR 149 million negative. Sales excluding the paper business increased by 4.1%.
Operational EBIT at EUR 1 325 (1 004) million increased 32.0% or EUR 321 million and represents a margin of 12.6% (10.0%).
Improved sales prices and active mix management in all divisions increased operational EBIT by EUR 795 million. Variable costs were EUR 387 million higher, especially wood costs as well as higher pulp, chemical, and transportation costs. Fixed costs increased EUR 55 million, mainly due to higher personnel and maintenance costs. The net foreign exchange impact decreased operational EBIT by EUR 34 million and the operational result from equity accounted investments was EUR 8 million lower. The positive impact from lower depreciation was EUR 20 million.
The share of the operational results of equity accounted investments amounted to EUR 81 (89) million, with the main contributions from Bergvik Skog and Tornator.
The IFRS operating profit includes a negative net effect of fair valuations of EUR 6 (negative 7) million from the accounting of share-based compensation and CO2 emission rights. In addition, the IFRS operating profit includes a negative net effect of EUR 2 (negative 6) million from IAS 41 forest valuation from subsidiaries and joint operations and also a positive net effect of EUR 53 (negative 3) million from Stora Enso’s share of net financial items, taxes and IAS 41 forest valuations of equity accounted investments. The positive impact came mainly from an increase in fair valuation of forests of the Nordic equity accounted investment Bergvik.
Fixed asset impairments amounted to EUR 1 (27) million.The Group recorded items affecting comparability (IAC) with a positive
impact of EUR 20 (negative 84) million on its IFRS operating profit and a negative impact of EUR 27 (positive 11) million on income taxes. The IAC’s relate to Stora Enso’s share of the disposal gain of EUR 47 million from associated company Bergvik Skog’s Latvian subsidiary and the divestment of the wood supply company in Rosário do Sul, Brazil to Copa Florestal III FIP Multiestrategia. The latter transaction resulted in a loss of
Sales and operational EBITEUR million %12 000 1210 000 108 000 86 000 64 000 42 000 20 0
2015 2016 2017 2018
Sales Operational EBIT, %
EUR 28 million, due to cumulative currency translation adjustment being released from equity through P&L at closing in Q2 2018. The negative impact on income taxes relates to a provision because of an ongoing dispute in Sweden concerning interest deductions for years 2013–2016.
The IFRS operating profit was EUR 1 390 (904) million.
Segment share of operational EBIT, IAC, fair valuations and non-operational items and operating profit/loss
Year Ended 31 December
Operational EBIT
IAC, Fair Valuations and Non-
Operational items
Operating Profit/Loss
EUR million 2018 2017 2018 2017 2018 2017Consumer Board 231 285 -1 -32 230 253
Packaging Solutions 245 170 -1 -4 244 166
Biomaterials 427 264 -3 -10 425 254
Wood Products 165 111 -1 -9 164 102
Paper 234 128 0 -22 234 106
Other 23 46 71 -23 93 23
Total 1 325 1 004 65 -100 1 390 904Net financial items -180 -162
Profit before Tax 1 210 742Income tax expense -221 -128
Net Profit 988 614
Operational EBIT comprises the operating profit excluding IAC and fair valuations of the segments and Stora Enso’s share of the operating profit excluding IAC and fair valuations of its equity accounted investments (EAI).IAC = Items affecting comparability. These are exceptional transactions that are not related to recurring business operations. The most common IAC’s are capital gains and losses relating to disposal of fixed assets, impairments or impairment reversals, disposal gains and losses relating to group companies, environmental provisions, provisions for planned restructurings, other provisions and penalties. Items affecting comparability arenormally disclosed individually if they exceed one cent per share.Fair valuations and non-operational items include equity incentive schemes and related hedges, CO2 emission rights, valuations of biological assets and the Group’s share of tax and net financial items of EAI.
Items affecting comparability, fair valuations and non-operational items
Year Ended 31 December
EUR million 2018 2017Impairments and impairment reversals of intangible asset and property, plant and equipment and biological assets 0 -8Restructuring costs excluding fixed asset impairments 0 -14
Disposals 20 -28
Other 0 -34
Items affecting comparability 20 -84
Fair valuations and non-operational items 45 -16
Total 65 -100
Segment share of operative assets, operative liabilities and operating capital
Year Ended 31 DecemberOperative
AssetsOperative Liabilities
Operating Capital
EUR million 2018 2017 2018 2017 2018 2017Consumer Board 2 486 2 477 535 537 1 951 1 940
Packaging Solutions 1 138 1 100 215 223 923 877
Biomaterials 2 722 2 578 260 253 2 462 2 325
Wood Products 866 789 245 238 621 551
Paper 1 588 1 561 792 811 796 750Other and eliminations 2 668 2 339 466 389 2 202 1 950
Total 11 468 10 844 2 513 2 451 8 955 8 393
Key figures
2018 2017 2016Sales, EUR million 10 486 10 045 9 802
Operational EBIT, EUR million 1 325 1 004 884
Operational EBIT margin 12.6% 10.0% 9.0%
Operating profit (IFRS), EUR million 1 390 904 783
Operating margin (IFRS) 13.3% 9.0% 8.0%
Return on equity (ROE) 15.5% 10.3% 7.2%
Operational ROCE 15.5% 11.9% 10.2%
Debt/equity ratio 0.31 0.38 0.47
EPS (basic), EUR 1.28 0.79 0.59
EPS excluding IAC, EUR 1.29 0.89 0.65Dividend and distribution per share1, EUR 0.50 0.41 0.37
Payout ratio, excluding IAC 38.8% 46.1% 56.9%
Payout ratio (IFRS) 39.1% 51.9% 62.7%Dividend and distribution yield, (R share) 5.0% 3.1% 3.6%Price/earnings (R share), excluding IAC 7.82 14.90 15.70
Equity per share, EUR 8.51 7.62 7.36Market capitalisation 31 Dec, EUR million 8 123 10 422 8 085
Closing price 31 Dec, A/R share, EUR 11.05/10.09 13.20/13.22 10.40/10.21
Average price, A/R share, EUR 16.36/14.61 11.93/11.54 8.50/7.88
Number of shares 31 Dec (thousands) 788 620 788 620 788 620
Trading volume A shares (thousands) 3 068 6 768 1 254
% of total number of A shares 1.7% 3.8% 0.7%
Trading volume R shares (thousands) 610 300 571 717 765 122
% of total number of R shares 99.7% 93.4% 125.0%Average number of shares, basic (thousands) 788 620 788 620 788 620Average number of shares, diluted (thousands) 789 883 790 024 789 888
1 See the Board of Directors’ proposal for dividend distribution.
4
Sto
ra En
so 2
018: Fin
an
cia
ls – Rep
ort o
f the Bo
ard o
f Directo
rs – Financial results – G
roup
Strateg
yS
ustainability
FinancialsG
overnance
Annual Report 2018
Financials
Stora Enso in 2018
Report of the Board of Directors
Consolidated financial statements
Notes to the Consolidated financial statements
Extract from the parent company Stora Enso Oyj financial statements
The Board of Directors’ Proposal for the distribution of dividend
Auditor’s report
Stora Enso in capital markets
Stora Enso as a taxpayer
Capacities by mill in 2019
Information for shareholders

Net financial expenses at EUR 180 (162) million were EUR 18 million higher than a year ago. The increase was mainly due to the net foreign exchange loss of EUR 33 (gain of EUR 34) million coming from the revaluation of foreign currency net debt and related foreign-currency hedges in subsidiaries and joint operations. Net interest expenses at EUR 129 million decreased by EUR 10 million mainly due to reduced average debt levels and lower bank fee amortisation. Other net financial expenses at EUR 18 million were EUR 39 million lower than a year ago mainly due to the absence of bond repurchases related financial expenses that were recorded in 2017.
The net tax charge totalled EUR 221 (128) million, equivalent to an effective tax rate of 18.3% (17.3%), as described in more detail in Note 9 Income taxes, of the Consolidated Financial Statements.
The loss attributable to non-controlling interests was EUR 24 (11) million, leaving a profit of EUR 1 013 (625) million attributable to Company shareholders.
Earnings per share excluding items affecting comparability were EUR 1.29 (0.89) and including items affecting comparability EUR 1.28 (0.79). Operational return on capital employed was 15.5% (11.9%).
The Group capital employed was EUR 8 824 million on 31 December 2018, an increase of EUR 516 million on a year earlier.
Operational ROCE%1614121086
2015 2016 2017 2018
Operational ROCE, % Target >13%
Breakdown of Capital Employed Change
EUR million Capital Employed31 December 2017 8 308Capital expenditure less depreciation 59
Impairments and reversal of impairments -1
Fair valuation of biological assets -2
Costs related to growth of biological assets -66
Available-for-sale: operative (mainly PVO) 104
Equity accounted investments 186
Net liabilities in defined benefit plans -27Operative working capital and other interest-free items, net 384
Net tax liabilities -54
Translation difference -81
Other changes 14
31 December 2018 8 824
FinancingCash flow from operations was EUR 1 365 (1 492) million and cash flow after investing activities was EUR 811 (825) million. Working capital increased by EUR 428 (decreased 37) million, inventories increased by EUR 267 million and short-term receivables by EUR 179 million having a negative impact into working capital. Payments related to the previously announced provisions were EUR 19 million.
Operative Cash Flow
EUR million 2018 2017Operational EBITDA 1 878 1 587
IAC on operational EBITDA 20 -76
Other adjustments -104 -56
Change in working capital -428 37
Cash Flow from Operations 1 365 1 492Cash spent on fixed and biological assets -525 -658
Acquisitions of equity accounted investments -29 -9
Cash Flow after Investing Activities 811 825
At the end of the period, net interest-bearing liabilities of the Group were EUR 2 092 (2 253) million. Cash and cash equivalents net of bank overdrafts amounted to EUR 1 128 (603) million.
During the third quarter of 2018, Fitch Ratings assigned Stora Enso Oyj an investment grade credit rating of BBB- with stable outlook
highlighting Stora Enso’s improved cash flow generation and strengthened balance sheet. In the fourth quarter of 2018, Moody’s Investors Service also assigned Stora Enso Oyj an investment grade credit rating by upgrading the long-term issuer rating from Ba1 to Baa3 with stable outlook.
During 2018 Stora Enso also launched a Green Bond Framework as part of its Sustainable Finance approach. The ambition is to offer a loan-format to support sustainability-focused fixed income investors and to report the direct environmental impacts of some investments and business activities.
Stora Enso has EUR 600 million committed revolving credit facility that was fully undrawn at the year-end. Additionally, Stora Enso has access to various long-term sources of funding up to EUR 1 000 (900) million.
The debt/equity ratio at 31 December 2018 was 0.31 (0.38). The ratio of net debt to the last 12 months’ operational EBITDA was 1.1, compared to the ratio of 1.4 at the end of the previous year.
The fair valuation of cash flow hedges and equity investments fair valued through other comprehensive income in accordance with IFRS 9 increased equity by EUR 75 (increase EUR 69) million mainly due to higher fair valuation of Group’s shareholding in Pohjolan Voima Oy and net gains from outstanding commodity hedges recorded in other comprehensive income partly offset by net loss from outstanding foreign-currency cash flow hedges.
At the end of the year, the ratings for Stora Enso’s rated bonds were as follows:
Rating agency Long/short-term rating Valid fromFitch Ratings BBB- (stable) 8 August 2018
Moody’s Baa3 (stable) / P-3 1 November 2018
Debt/equity ratio0.700.600.500.400.300.200.100
2015 2016 2017 2018
Debt/equity ratio Target <0.6
5
Sto
ra En
so 2
018: Fin
an
cia
ls – Rep
ort o
f the Bo
ard o
f Directo
rs – Financial results – G
roup
Strateg
yS
ustainability
FinancialsG
overnance
Annual Report 2018
Financials
Stora Enso in 2018
Report of the Board of Directors
Consolidated financial statements
Notes to the Consolidated financial statements
Extract from the parent company Stora Enso Oyj financial statements
The Board of Directors’ Proposal for the distribution of dividend
Auditor’s report
Stora Enso in capital markets
Stora Enso as a taxpayer
Capacities by mill in 2019
Information for shareholders

Financial results – Segments
Consumer Board divisionThe ambition of the Consumer Board division is to be the global leader in high-quality virgin fibre cartonboard. We aim to be the preferred partner of customers and brand owners in premium end-use packaging and graphical segments. Our wide board and barrier coating selection is suitable for consumer packaging for liquid, food, pharmaceutical and luxury goods.
EUR million 2018 2017Sales 2 622 2 516
Operational EBITDA 423 477
Operational EBITDA margin 16.1% 19.0%
Operational EBIT 231 285
Operational EBIT margin 8.8% 11.3%
Operational ROOC 11.9% 14.6%
Cash flow from operations 339 458
Cash flow after investing activities 177 218
Board deliveries, 1 000 tonnes 2 914 2 816
Board production, 1 000 tonnes 2 922 2 871
Consumer Board division sales at EUR 2 622 (2 516) million grew over 4%. Sales volumes increased driven by strong operational performance. Average price per ton improved, due to price increases and favourable sales mix development. Currency impact on sales was negative EUR 22 million.
Operational EBIT at EUR 231 (285) million decreased 19%, due to significantly higher raw material prices for wood, pulp, and chemicals. This could not be fully compensated through sales price increases as most of the Consumer Board contracts are long-term. Fixed costs decreased as a result of cost saving actions and the weakening of the Swedish crown.
Sales and operational ROOCConsumer BoardEUR million %3 000 302 500 252 000 201 500 151 000 10500 50 0
2015 2016 2017 2018
Sales Operational ROOC, % Operational ROOC target >20%
Sales and operational ROOCPackaging SolutionsEUR million %1 400 351 200 301 000 25800 20600 15400 10200 50 0
2015 2016 2017 2018
Sales Operational ROOC, % Operational ROOC target >20%
Packaging Solutions divisionThe Packaging Solutions division provides fibre-based board materials and corrugated packaging products and services that are designed for a wide array of applications. Our renewable high-end packaging solutions serve leading converters, brand owners and retailers – including those in e-commerce that are looking to optimise performance, drive innovation and improve their sustainability.
EUR million 2018 2017Sales 1 344 1 255
Operational EBITDA 313 240
Operational EBITDA margin 23.3% 19.1%
Operational EBIT 245 170
Operational EBIT margin 18.2% 13.5%
Operational ROOC 27.2% 19.6%
Cash flow from operations 272 249
Cash flow after investing activities 172 156
Board deliveries, 1 000 tonnes 985 1 023
Board production, 1 000 tonnes 1 320 1 333
Corrugated packaging deliveries, million m2 1 059 1 103
Corrugated packaging production, million m2 1 048 1 102
Packaging Solutions division sales were EUR 1 344 (1 255) million, all time high annual sales and up 7% compared to 2017. The increase was driven by higher sales prices in all businesses and sales mix improvements, which were partly offset by lower volumes and currency impact.
Operational EBIT at EUR 245 (170) million was also all time high and 44% up from the previous year, due to significantly higher sales prices. Operational EBIT was negatively impacted by higher raw material costs in Europe, lower volumes due to investment shut down at Heinola Mill, and higher fixed costs in China Packaging.
Biomaterials divisionThe Biomaterials division offers a wide variety of pulp grades to meet the demands of paper, board, tissue, textile and hygiene product producers. We are maximising the business potential of the by-products extracted in our processes, such as tall oil and turpentine from biomass. Based on our strong innovation approach, all fractions of biomass, like sugars and lignin, hold substantial potential for use in various applications.
EUR million 2018 2017Sales 1 635 1 483
Operational EBITDA 550 409
Operational EBITDA margin 33.6% 27.6%
Operational EBIT 427 264
Operational EBIT margin 26.1% 17.8%
Operational ROOC 17.9% 10.5%
Cash flow from operations 438 404
Cash flow after investing activities 327 271
Pulp deliveries, 1 000 tonnes 2 432 2 597
Biomaterials division sales were EUR 1 635 (1 483) million, up 10% due to significantly higher pulp sales prices in all grades. Delivery volumes were lower, and currencies had a negative impact to sales.
Operational EBIT at EUR 427 (264) million was 62% up from previous year, due to significantly higher sales prices in all grades. Operational EBIT was negatively impacted by higher wood, chemical and energy costs. Fixed costs were higher due to higher maintenance costs. Foreign exchange rates had a negative impact on operational EBIT.
Sales and operational ROOCBiomaterialsEUR million %2 000 201 500 151 000 10500 50 0
2015 2016 2017 2018
Sales Operational ROOC, % Operational ROOC target >15%
6
Sto
ra En
so 2
018: Fin
an
cia
ls – Rep
ort o
f the Bo
ard o
f Directo
rs – Financial results – S
egm
ents
Strateg
yS
ustainability
FinancialsG
overnance
Annual Report 2018
Financials
Stora Enso in 2018
Report of the Board of Directors
Consolidated financial statements
Notes to the Consolidated financial statements
Extract from the parent company Stora Enso Oyj financial statements
The Board of Directors’ Proposal for the distribution of dividend
Auditor’s report
Stora Enso in capital markets
Stora Enso as a taxpayer
Capacities by mill in 2019
Information for shareholders
Wood Products divisionThe Wood Products division is a leading provider of innovative wood-based solutions. The product range covers all areas of construction, including massive wooden elements and wooden components. It also includes a variety of sawn timber goods and pellets for sustainable heating. The emerging product range of Biocomposites addresses the opportunities to replace plastics in consumer goods and creates potential in various demanding exterior applications in a cost-competitive way.
EUR million 2018 2017Sales 1 622 1 669
Operational EBITDA 199 147
Operational EBITDA margin 12.3% 8.8%
Operational EBIT 165 111
Operational EBIT margin 10.2% 6.7%
Operational ROOC 28.1% 20.5%
Cash flow from operations 147 152
Cash flow after investing activities 80 90
Deliveries, 1 000 m3 4 932 4 926
Wood Products division sales were EUR 1 622 (1 669) million. Comparable sales grew 5% excluding the Puumerkki divestment in November 2017 and the transfer of the Baltic wood supply operations to Segment Other in the second quarter of 2017. The growth was mainly due to higher sales prices and the ramp-ups of the Varkaus laminated veneer lumber (LVL) mill in Finland and the modernisation and expansion of the Murów sawmill in Poland.
Operational EBIT at EUR 165 (111) million was all time high and 49% up from previous year. Higher sales prices and higher volumes had a positive impact. The impact of higher wood costs in Nordics, Baltics and Russia was more than offset by lower wood costs in Central Europe. Logistics and fixed costs were higher than previous year.
Paper divisionStora Enso is the second largest paper producer in Europe with an established customer base and a wide product portfolio for print and office use. Customers benefit from Stora Enso’s broad selection of papers made from recycled and virgin fibre as well as our valuable industry experience, know-how and customer support.
EUR million 2018 2017Sales 3 066 2 920
Operational EBITDA 345 239
Operational EBITDA margin 11.3% 8.2%
Operational EBIT 234 128
Operational EBIT margin 7.6% 4.4%
Operational ROOC 30.2% 14.8%
Cash flow from operations 222 259
Cash flow after investing activities 175 160
Cash flow after investing activities to sales 5.7% 5.5%
Paper deliveries, 1 000 tonnes 4 591 4 713
Paper production, 1 000 tonnes 4 633 4 672
Paper division sales were EUR 3 066 (2 920) million, up 5% due to price increases in local currencies. Foreign exchange had EUR 43 million negative impact on sales. Volumes were lower, mainly due to the closure of the paper machine 8 at Kvarnsveden Mill in Sweden in June 2017, and lower demand for wood-free coated papers (WFC). Also, Nymölla Mill in Southern Sweden was able to produce only half of its capacity for 11 weeks during Q4 due to water shortage.
Operational EBIT at EUR 234 (128) million was 83% up from 2017 due to higher sales prices which more than offset higher wood, pulp, chemical and transportation costs and lower volumes.
Sales and operational ROOCWood ProductsEUR million %3 000 302 500 252 000 201 500 151 000 10500 50 0
2015 2016 2017 2018
Sales Operational ROOC, % Operational ROOC target >20%
Sales and cash flow after investing activities to sales1
PaperEUR million %5 000 104 000 83 000 62 000 41 000 20 0
2015 2016 2017 2018
Sales Cash flow after investing activities to sales, % Cash flow after investing activities to sales target >7%
1 The Paper division’s financial target is cash flow after investing activities to sales (non-IFRS), because the division’s goal is to generate cash flow for the Group so that it can transform into a renewable materials growth company.
OtherThe segment Other includes the Nordic forest equity-accounted investments, Stora Enso’s shareholding in the energy company Pohjolan Voima, operations supplying wood to the Nordic and Baltic mills, plantations not connected to any mill site, and Group shared services and administration.
EUR million 2018 2017Sales 3 425 2 490
Operational EBITDA 48 75
Operational EBITDA margin 1.4% 3.0%
Operational EBIT 23 46
Operational EBIT margin 0.7% 1.8%
Cash flow from operations -52 -30
Cash flow after investing activities -119 -70
Sales of the Segment Other at EUR 3 425 (2 490) million was up from previous year mainly due to higher wood prices, the transfer of the Baltic wood supply operations from Wood Products division to Segment Other in Q2 2017 and the reclassification of transport and freight sales from other operating income into sales line.
Operational EBIT at EUR 23 (46) million was down from previous year mainly due to lower results from the equity accounted investments and higher operational costs in our wood harvesting operations.
Investments and capital expenditureAdditions to fixed and biological assets including internal costs capitalised in 2018 totalled EUR 574 (640) million. The total amount includes additions in biological assets of EUR 83 (80) million.
During the first quarter of 2018, the EUR 19 million investment consolidating corrugated packaging manufacturing in Finland was completed according to the plan. At Skutskär Mill in Sweden, the EUR 16 million investment to improve the environmental performance by reducing the sulphur emissions was completed. Production of biocomposite granules started at Hylte Mill in Sweden, following the EUR 12 million investment.
During the second quarter of 2018, Stora Enso completed the EUR 28 million investment at its Heinola Fluting Mill in Finland improving quality and increasing production capacity of the AvantFlute SC (semi-chemical fluting) products. Production started as planned at the new fluff pulp line at Skutskär Mill in Sweden following the EUR 26 million investment.
The investment to a new cross laminated timber (CLT) unit at the Gruvön sawmill in Sweden is proceeding as planned. The commercial production is scheduled to begin during Q1/2019. The investment at Imatra Mills to enhance the availability of the chemi-thermomechanical pulp (CTMP) is proceeding as planned. The project is scheduled to be completed during Q1/2019. The investment to increase the dissolving pulp production capacity at Enocell Mill is proceeding as planned and the investment is scheduled to be completed during the second half of 2019.
7
Sto
ra En
so 2
018: Fin
an
cia
ls – Rep
ort o
f the Bo
ard o
f Directo
rs – Investments and
capital exp
enditure
Strateg
yS
ustainability
FinancialsG
overnance
Annual Report 2018
Financials
Stora Enso in 2018
Report of the Board of Directors
Consolidated financial statements
Notes to the Consolidated financial statements
Extract from the parent company Stora Enso Oyj financial statements
The Board of Directors’ Proposal for the distribution of dividend
Auditor’s report
Stora Enso in capital markets
Stora Enso as a taxpayer
Capacities by mill in 2019
Information for shareholders

In June 2018, Stora Enso announced a feasibility study and an environmental impact assessment (EIA) for a possible investment at Oulu Mill. The feasibility study and the EIA evaluate a potential conversion of the Oulu paper mill into packaging board production. The EIA was finalised in December 2018. Currently, Oulu Mill has a production capacity of 360 000 tonnes of chemical softwood pulp and 1 080 000 tonnes of woodfree coated papers on two paper machines. The potential investment would include a new chemi-thermomechanical pulp (CTMP) plant, a brown-based cartonboard line with a capacity of 450 000 t/a and a kraftliner line with a capacity of 400 000 t/a. The potential conversion of Oulu Mill would enable Stora Enso to further improve its position in the growing consumer board and packaging solutions businesses and take a major step in its transformation. The other option is to continue the current fine paper production.
In July 2018, Stora Enso announced investment of EUR 13 million to increase the sawmilling and planing capacity at Launkalne sawmill in Latvia. The start-up is expected to take place in phases during Q2–Q3/2019.
Also in July, Stora Enso announced investment of EUR 25 million to boost green energy generation at Maxau Paper Mill. The project is scheduled to be completed in 2020. Stora Enso wants to secure the long-term profitable energy production in Maxau Mill by increased electricity generation and higher efficiency. The new 57 MW extraction-condensing turbine complements the existing Combined Heat and Power (CHP) plant which started up in 2010. The investment will reduce the energy cost and secure long term cost competitiveness of the paper mill.
In October 2018, Stora Enso announced investment of EUR 9 million to upgrade and expand the corrugated packaging plant in Riga, Latvia. The project is expected to be completed in 2019.
Also in October, Stora Enso announced investment of EUR 7 million in building a Competence Centre for biocomposites in Hylte mill, Sweden. The investment covers also the installation of new machinery for the milling of large fibres for biocomposites. Production is scheduled to start by the end of 2019.
Stora Enso and the energy company Gasum announced plan to build a biogas plant at Stora Enso’s Nymölla paper mill in Sweden. The plant, built and operated by Gasum will turn the mill’s wastewater effluent into renewable energy. The total investment for Stora Enso is approximately EUR 5 million.
In December, Stora Enso announced a EUR 22 million investment at Skoghall Mill in Sweden in an expansion of the existing water treatment plant.
Also in December, Stora Enso announced that it will acquire a 25% share in TreeToTextile AB, a joint venture between H&M group, Inter IKEA group and innovator Lars Stigsson, with the aim of developing new textile fibres in a sustainable way at attractive cost levels. Stora Enso will also support the industrialisation of TreeToTextile’s production process by setting up a demonstration plant at one of its Nordic facilities. The four partners have an equally big stake in TreeToTextile.
Stora Enso is in a process of restructuring its ownership in Bergvik Skog AB, a Swedish forest holding company. The transaction is planned to be completed during the first half of 2019. Following the transaction, Stora Enso’s forest holdings in Sweden will increase to
1.4 million hectares, of which 1.15 million hectares is productive forest land. Stora Enso’s 49.8% share of the productive forest land in Bergvik totalled 0.9 million hectares at end of December 2018. The transaction is estimated to increase Stora Enso’s balance sheet by approximately EUR 1.0 billion. Bergvik Skog’s Swedish forest assets are owned by its subsidiaries Bergvik Väst AB and Bergvik Öst AB, representing approximately 83% and 17% of these assets respectively. As a result of this transaction, Stora Enso will transform its current ownership of 49.8% in Bergvik Skog, to a direct holding of 69.8% of the value of the forest assets in Bergvik Väst.
Innovation, research and developmentStora Enso’s expenditure on innovation, research and development in 2018 was EUR 149 (142) million, which was equivalent to 1.4% (1.4%) of sales. In 2018, Stora Enso expanded the definition to include also innovation costs and the figure for 2017 has been adjusted accordingly.
Transformation towards the renewable materials continues. We believe that everything made with fossil-based materials today can be made from a tree tomorrow.
In 2018, The Wood Products division commenced operations at the Hylte mill for biocomposite production and are currently ramping up the operations and sales of DuraSenseTM by Stora Enso. The Biomaterials division launched LineoTM by Stora Enso for our lignin-based products and Consumer Board division have moved to pilot stage of Microfibrillated Cellulose (MFC) films.
ECO™ by Stora Enso technology enables the RFID tags to be produced on a 100% fibre-based paper label, unlike traditional plastic tags, resulting in a lower carbon footprint for sustainability conscious B2B and B2C companies. The ECO tag can be recycled in an environmentally friendly way together with paper and board materials. Moreover, it offers high conductivity at a lower cost compared with graphene or silver printed antennas. The ECO technology is available for use in multiple ongoing projects across multiple sectors.
Stora Enso defines innovation as the process of translating ideas into new value. Research and Development work is a basic element in the process.
The company focuses on five renewable material R&D themes: Forestry & Biomass, Bio-based chemistry, Material Science and Design, process solutions, and wood as a construction material. Additionally, we focus on Digitalisation, where the focus areas have been Robotic Process Automation (RPA), machine learning, smart operations, transparent supply chain, digital customer experience and Intelligent Packaging.
The strong effort to reduce the use of and replace fossil-based plastics has positively impacted the attractiveness of new fibre based solutions to our customers. These applications include materials for new packaging board grades especially targeting to replace single use plastics and plastic packaging. For long-term success, Stora Enso collaborates with academia and research institutes; for fast results, we work together with startups. Good examples are Sulapac, where the cooperation originates in Stora Enso Accelerator programme and 20tree.ai, where cooperation with the startup shows results of joint efforts with the Combient Foundry Venture Client Program. Sulapac
holds patents in biodegradable materials, and 20tree.ai technology is used for forest valuation based on satellite images.
To trigger innovation processes, we will need ideas, which we will receive from customers, suppliers, various stakeholders and our own employees. WeNovate, our group-wide tool for collecting and evaluating ideas from the Stora Enso divisions and functions, was successfully launched in 2017. It has changed our ideation and innovation culture by engaging an increasing number of employees into the activity. In 2018, we ran 25 campaigns and have 7 idea channels open. In total over 850 ideas were collected, growing from 175 in 2017. The most suitable ideas enter state-gate based innovation processes of the divisions and functions.
Stora Enso has established funds to be used in an agile manner for capital expenditure in novel projects, which have potential business cases. The Innovation Fund is an allocation for new pilot scale opportunities and new business models. The digitalisation fund is an allocation for piloting new digital tools and models. Applications for these resources will be approved in the company’s Investment Working Group. We have also allocated an agility reserve to cover operational expenses related to cross-divisional projects in 2019. With this we aim for increased number of good innovation projects.
Stora Enso employs close to 400 people in the following R&D centers:• Research Centre and Pulp Competence Centre in Imatra (Finland)• Research Centre and Pulp Competence Centre in Karlstad
(Sweden)• The Innovation Centre for biomaterials in Sickla, Stockholm
(Sweden)• The Innovation Centre for packaging in Helsinki (Finland)• Support Centre in Mönchengladbach (Germany)• Biocomposite Competence Centre in Hylte (Sweden)• Intelligent Packaging Center in Tampere (Finland)• Virdia demonstration plant in Louisiana and Research Centre in
Virginia (United States)
Supporting Stora Enso’s innovation strategy, we have several cooperation projects with research organisations and academic institutions. The aim is to build a clearer understanding of how our needs and the universities’ capabilities can meet, first and foremost in the research sphere surrounding Stora Enso research themes and the long-term research needs in the divisions. The second target is to widen the contact network. Thirdly, we aim to identify topics where we have special interest regarding the universities’ bachelor, master and PhD programmes, also for recruiting talents to mills and research/innovation centres.
Our collaboration partners include Aalto University in Finland, and Chalmers University of Technology in Sweden, the Royal Institute of Technology, VTT Technical Research Centre of Finland, SweTree Technologies Ltd, and Wallenberg Wood Science Center R&D. Stora Enso is a member of national, European and trade associations focused on the bioeconomy and forest agendas including Confederation of European Paper Industries (CEPI), Forest Technology Platform (FTP), and the Swedish and Finnish Forest Industry Federations. Stora Enso
8
Sto
ra En
so 2
018: Fin
an
cia
ls – Rep
ort o
f the Bo
ard o
f Directo
rs – Innovation, research and
develo
pm
ent
Strateg
yS
ustainability
FinancialsG
overnance
Annual Report 2018
Financials
Stora Enso in 2018
Report of the Board of Directors
Consolidated financial statements
Notes to the Consolidated financial statements
Extract from the parent company Stora Enso Oyj financial statements
The Board of Directors’ Proposal for the distribution of dividend
Auditor’s report
Stora Enso in capital markets
Stora Enso as a taxpayer
Capacities by mill in 2019
Information for shareholders

is also a member in the EU’s Biobased Industries Consortium (BIC) and the Bio-Based Industries Initiative Joint Undertaking, a new partnership within the EU Horizon 2020 research programme.
Intellectual property is an increasingly important tool to support Stora Enso’s strategy and to differentiate from our competitors. During 2018 Stora Enso continued to strengthen its patent portfolio, with 56 priority founding patent applications filed and over 324 patents granted worldwide. The Group IP has within the Group the responsibility for handling IP matters, including e.g. patentability/trademark/design opinions, assessments, preparations, filings and maintaining of IP rights as well as for investigations, opinions, oppositions and appeals of external parties IP rights. In addition, work with IP Landscaping is crucial before starting R&D projects also as part of the Stora Enso stage gate process. Landscaping can also reveal potential candidates for licensing, cross licensing, possible Joint Development Agreements etc. Group IP takes active part together with Legal Services in drafting various IP related agreements. Furthermore, before launching new products the Freedom to Operate (FTO) needs to be established. The Group IP strategy has been adopted by the CEO supported by the Group IP Steering Team.
Non-financial information Requirements of non-financial information reporting according to the Finnish Accounting Act are reported below. The scope of the reporting includes those non-financial topics that are identified as the Group’s key risks.
Risks and policy principles related to these topics are additionally described on pages 10–16. In addition, respect for human rights is explicitly covered below from the risk perspective.
Business modelReplacing the use of fossil-based resources with renewable raw materials is the foundation for a sustainable bioeconomy. Stora Enso’s products contribute to a low-carbon circular economy, in which materials are reused and recycled, while waste is minimised, to maximise environmental, social, and financial added value. Stora Enso’s business model description is in the beginning of the Report of Board of Directors and value creation model is presented in Strategy 2018 on page 10.
Sustainability Sustainability is a key element of Stora Enso’s corporate governance, promoted by the Board of Directors, the CEO and the Group Leadership Team (GLT). The CEO carries the ultimate responsibility for the successful implementation of the sustainability strategy. Work on sustainability is led by the Executive Vice President, Sustainability, who reports directly to the CEO. The Board of Directors’ Sustainability and Ethics Committee oversees the implementation of Stora Enso’s Sustainability Strategy and Ethics and Compliance Strategy. The Committee met four times in 2018.
Stora Enso’s Sustainability Policy describes our overall approach and governance model. At the same time, our Code of Conduct and other policies, guidelines, and statements on specific sustainability topics all further elaborate our approach, while also guiding our
employees in their everyday work. These documents are available at storaenso.com/sustainability.
More information on Stora Enso’s approach to sustainability is published in Sustainability 2018.
Environmental mattersForests, plantations, and land useKey policy: Wood and fibre sourcing, and land management policyProgress on responsible forestry is followed with a key performance indicator (KPI) measuring the proportion of land in wood production and harvesting owned and managed by Stora Enso that is covered by forest certification schemes. Our target is to maintain the high level of 96%. In 2018, coverage amounted to 96% (97% in 20171). As of January 2018, the scope excludes forest management units, whose primary purpose is not wood production and harvesting. These areas include, for example, test and pilot sites. At year-end Stora Enso owned or managed lands with a total area of 933 000 hectares.
In 2018, the total amount of wood (including roundwood, wood chips, and sawdust) delivered to our mills was 38.7 million m3 (solid under bark) (37.5 million m3 in 2017). The proportion of third-party certified wood in the Group’s total wood supply was 76%. As of 2018 the share of certified wood excludes externally delivered certified wood. This decreased the certified share compared to the previous years.
Carbon dioxideKey policy: Energy and carbon policyStora Enso’s science-based target (KPI) is to reduce greenhouse gas emissions from our operations by 31% per tonne of pulp, paper and board produced by 2030 compared with the 2010 base-year. In 2018, our CO2e emissions per saleable tonne of board, pulp, and paper were 18% lower than the 2010 benchmark level (21% lower in 2017). The performance declined three percentage points from 2017, mainly due to the increased use of peat at two Finnish mills and a higher fossil content in the generation of the purchased electricity in Finland and Poland.
Social and employee mattersEmployees and wider workforce Key policies: Minimum HR requirements, Health and Safety policyOn 31 December 2018, there were 26 100 (25 700) employees in the Group. The average number of employees in 2018 was 26 100, which was approximately 100 lower than the average number in 2017. The numbers include 50% of the employees at Veracel in Brazil and Montes del Plata in Uruguay.
Personnel expenses totalled EUR 1 330 (1 331) million or 12.7% of sales. Wages and salaries were EUR 1 000 (999) million, pension costs EUR 170 (166) million and other employer costs amounted to EUR 153 (158) million.
At the end of 2018, the Group’s top three countries in respect to the number of employees were Finland, China and Sweden. 26% (26%) of employees were women.
Personnel turnover in 2018 was 15.0% (14.6%). Illness-related absenteeism amounted to 3.0% (3.1%) of total theoretical working hours.
On January 2018 Stora Enso signed a Global Framework Agreement with the three global unions - IndustriALL Global Union, UNI Global Union and the Building and Wood Worker’s International - as another step towards creating working environments where all our employees are treated with respect and in a fair manner.
From the beginning of 2018, Stora Enso changed the main key performance indicator (KPI) for measuring safety performance from the Lost Time Accident (LTA) rate to the Total Recordable Incident (TRI) rate. The TRI rate gives a more comprehensive picture of safety performance as it also includes less-severe accidents.
In 2018, our TRI rate decreased to 6.12 (7.4). Compared to 2017, a 18% reduction was achieved on the TRI-rate.
Stora Enso’s KPI for leadership, the Leadership Index, measures employee perceptions of their managers. The index is calculated based on our annual employee survey. Our target was to achieve an index of 80/100 by 2018. The Leadership Index in 2018 improved to 83 (81).
Employee-related information including the personnel strategy is discussed in more detail in the Group’s Sustainability 2018 and Strategy 2018, published during week 7.
Remuneration to the Board of Directors and key management is described in Note 7 of the Consolidated financial statements.
SuppliersKey policy: Supplier Code of Conduct (SCoC)Stora Enso’s key performance indicator (KPI) for responsible sourcing measures the proportion of our total supplier spend covered by our SCoC, including all categories and regions. By the end of 2018, 95% of Stora Enso’s total spend on materials, goods, and services was duly covered (95% at the end of 2017), which meets our target to maintain the high level of 95%.
CommunityKey policies: Guidelines for Social Responsibility, Human Rights PolicyGuangxi, China Stora Enso leases 82 217 hectares of land in Guangxi province China, of which 29 265 hectares (29 581 hectares in 2017), corresponding to 36% (36%) of the total area, is social land leased from village collectives, individual households, and local forest farms.
Bahia, BrazilIn Bahia, Brazil, work continued on a Sustainable Settlement Initiative launched in 2012 to provide farming land and educational support for local families in the landless people’s social movements. In 2018, Veracel signed a new agreement with the social landless movements to complement the earlier agreed Sustainable Settlement Initiative. In the new agreement Veracel sells 3 300 hectares of previously occupied lands to the movements and related associations, and the movements will leave from Veracel’s lands corresponding to 800 hectares. In addition, Veracel donates 225 hectares. After this new agreement, 468
1 Recalculated according to the reviewed definition.2 Recalculated due to additional data after the Q4/2018 Interim Report.
9
Sto
ra En
so 2
018: Fin
an
cia
ls – Rep
ort o
f the Bo
ard o
f Directo
rs – No
n-financial inform
ation
Strateg
yS
ustainability
FinancialsG
overnance
Annual Report 2018
Financials
Stora Enso in 2018
Report of the Board of Directors
Consolidated financial statements
Notes to the Consolidated financial statements
Extract from the parent company Stora Enso Oyj financial statements
The Board of Directors’ Proposal for the distribution of dividend
Auditor’s report
Stora Enso in capital markets
Stora Enso as a taxpayer
Capacities by mill in 2019
Information for shareholders
hectares of productive land owned by Veracel remained occupied by social landless movements not involved in the Sustainable Settlement Initiative or in the new agreement. Veracel will continue to seek repossessions of remaining occupied areas through legal processes. Previously Veracel has voluntarily reserved 16 500 hectares to support the Sustainable Settlement Initiative. At the end of 2018, the total land area owned by Veracel was 213 500 hectares, of which 76 000 hectares are planted with eucalyptus for pulp production.
Respect for human rightsKey policy: Human Rights policyStora Enso’s human rights commitment covers all our operations, including our employees, contractors, suppliers, and neighbouring communities. In addition to our commitment to the UN Guiding Principles on Business and Human Rights, Stora Enso respects and follows the legal reporting requirements of the UK Modern Slavery Act and we continue to monitor the development of similar legislation in other countries. Human rights are integrated into our Sustainability Agenda, which is aligned with the ten principles of the UN Global Compact, including its principles on human rights.
Human rights risks and impacts shall be taken into account throughout our operations, including investment decisions related to mergers, acquisitions, and divestments. Our investment guidelines stipulate that environmental and social risks and impacts, including those related to human rights, must be duly identified, assessed, and addressed prior to any investments in projects with business-critical risks.
In 2018, we completed the defining of our human rights priorities with support from BSR, an international expert organisation. To reflect this, we updated and published our Human Rights Statement as a Human Rights Policy and confirmed eight group-wide highest priority human rights:• Health and safety• Fair employment conditions• Forced labour• Freedom of association• Non-discrimination and non-harassment• Land and natural resource rights acquisition and management• Grievance mechanisms• Children’s rights (relevant to the forestry sector).
While we respect and consider all human rights important, our identified highest priority human rights will be the primary focus of our future work. This includes our updated due diligence and monitoring programme, which will be finalised and implemented in 2019. We also aim to develop a new consolidated key performance indicator (KPI) for our human rights work during 2019 to monitor compliance with our eight highest priority human rights.
Anti-corruption and bribery mattersKey policies: Business practice policy, the Stora Enso Code (Code of Conduct)As to Business Ethics, in 2018, a total of 68 reports received through Stora Enso’s various grievance channels were identified as potential non-compliance cases (61 in 2017). Based on the investigations
finalised by end of the year 2018, proven misconduct leading to disciplinary actions, legal actions and/or process improvements was identified in 20 (14) of the completed investigations, while 18 (22) further complaints were found to be valid without involving misconduct.
Based on our assessments two of the proven misconduct cases can be considered relating to corruption and/or fraud. Both cases resulted in employee dismissal or disciplinary process and in one of the cases the business relationship with an external party was terminated.
The company’s Code of Conduct index monitors and evaluates employees’ perceptions of Stora Enso’s work on topics covered by the Stora Enso Code (Code of Conduct) and it is based on the annual employee survey results. In 2018, this index improved to 85 (83 in 2017). Our goal is to maintain this positive trend.
Environmental investments and liabilities In 2018 Stora Enso’s environmental investments amounted to EUR 46 (65) million. These investments were mainly to improve the quality of air and water, to enhance resource efficiency and energy self-sufficiency, and to minimise the risk of accidental spills.
Stora Enso’s environmental costs in 2018 excluding interest and including depreciation totalled EUR 184 (170) million. These costs include taxes, fees, refunds, permit-related costs, and repair and maintenance costs, as well as waste water treatment chemicals and certain other materials.
Provisions for environmental remediation amounted to EUR 99 (108) million at 31 December 2018, details of which are in Note 22, Other Provisions, of the Consolidated financial statements. There are currently no active or pending legal claims concerning environmental issues that could have a material adverse effect on Stora Enso’s financial position. Cash costs related to environmental remediation measures amounted to EUR 8 (11) million.
Risks and risk management
Our approach to risk managementRisk is an integral component of business, and it is characterised by both threats and opportunities. Stora Enso is committed to ensuring that systematic, holistic and proactive management of risks and opportunities is a core capability and an integral part of all Group activities, and that a risk aware corporate culture is fostered in all decision making. Through consistent application of dynamic risk analysis, we manage risk in order to enhance opportunities and reduce threats to thus achieve our competitive advantage.
Risk governanceStora Enso defines risk as the effect of uncertainty on our ability to meet organisational values, objectives and goals. The Group Risk and Internal Control Policy, which is approved by the Board of Directors, sets out the overall approach to governance and the management of risks in accordance with the COSO (Committee of Sponsoring Organizations) framework and in line with the ISO 31000 standard.
The Board retains the ultimate responsibility for the overall risk management process and for determining what an appropriate and
acceptable level of risk is. The Board has established the Financial and Audit Committee to provide support to the Board in relation to the monitoring of the adequacy of the risk management process within Stora Enso, and specifically regarding the management and reporting of financial risks. The Sustainability and Ethics Committee is responsible for overseeing the company’s sustainability and ethical business conduct, its’ strive to be a responsible corporate citizen, and its contribution to sustainable development.
The head of Enterprise Risk Management, reporting to the CFO, is responsible for the design, development and monitoring of the top-down implementation of the Group risk management framework. Each division head, together with their respective management teams, are responsible for process execution and cascading the framework and guidelines further down in the organisation. The Internal Audit unit evaluates the effectiveness and efficiency of the Stora Enso risk management process.
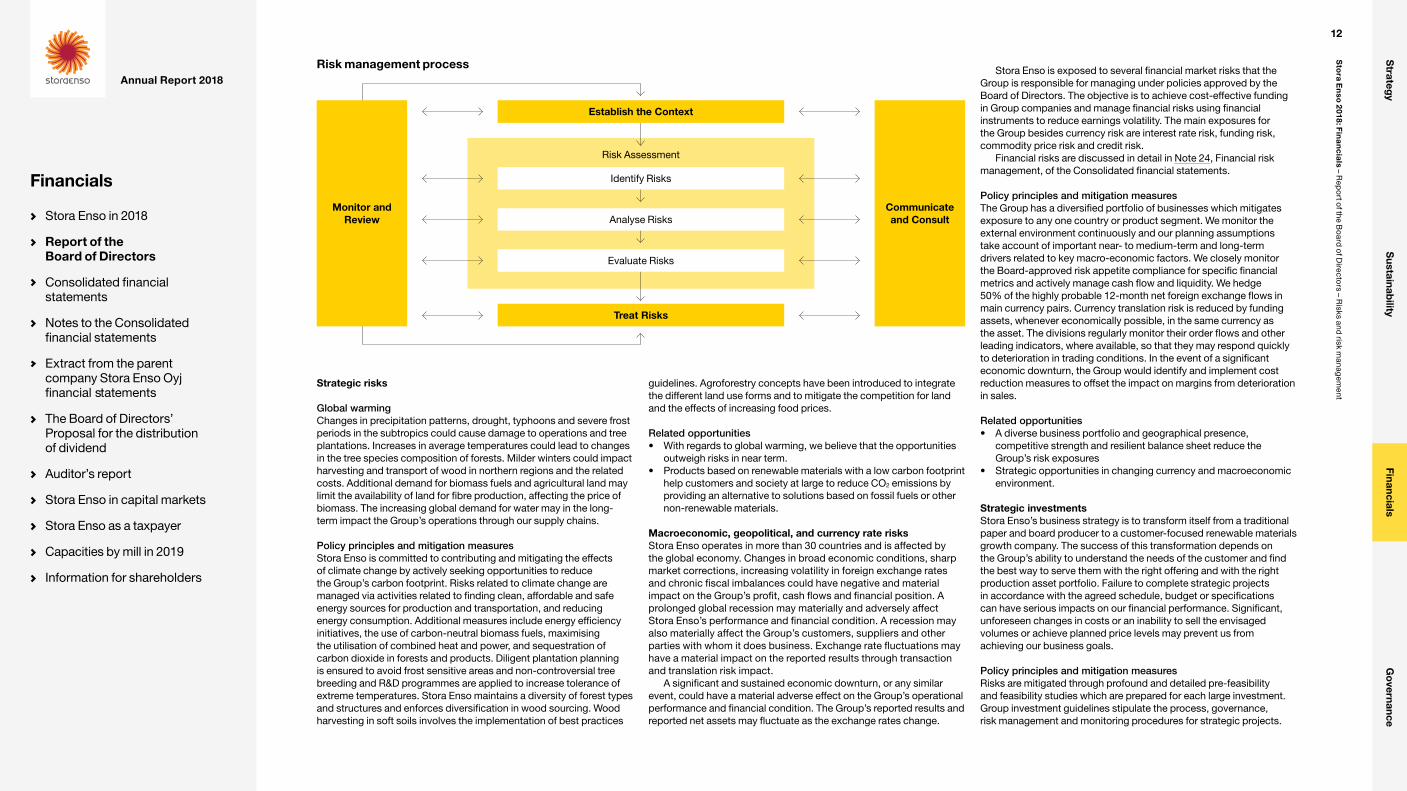
Risk management processIn connection with the annual strategy process, business divisions and group service and support functions conduct a holistic baseline risk assessment, linked to their key objectives. Specific guidance regarding the risk management process is outlined in the enterprise risk management instructions, distributed with the annual strategy guidelines.
Business entities and functions identify the sources of risk, events including changes in circumstances and their causes and their potential consequences. Stora Enso’s risk model outlines the overall risk universe which is used to support holistic risk identification and risk consolidation, while also providing taxonomy as well as consistency tin risk terminology. Risk appetite is determined across main risk categories on the business division level.
Risk analysis involves developing an understanding of the risk to provide an input for risk evaluation. The purpose of risk evaluation is to determine the risk priorities and to support decision making to determine which risks require treatment/actions. Risks are assessed in terms of their impact and likelihood of occurrence while the effectiveness of existing risk reduction is factored in to define the residual risk level. Pre-defined impact scales consider financial, people and reputational impacts, on both a quantitative and qualitative basis.
Risk treatment involves selecting one or more risk management option, such as avoidance, reduction, sharing or retention. Additional risk mitigation actions are determined for risks which exceed the perceived risk tolerance incorporating the assignment of responsibility, schedule and timetable of the risk treatment actions.
Following the annual baseline assessment, prioritised and emerging risks, as well as the corresponding risk mitigation and business continuity plans related to those risks, are reviewed in divisional business review meetings on a quarterly basis.
Despite the measures taken to manage risks and mitigate the impact of risks, and while some of the risks remain beyond the direct control of the management, there can be no absolute assurance that risks, if they occur, will not have a materially adverse effect on Stora Enso’s business, financial condition, operating profit or ability to meet financial obligations.
10
Sto
ra En
so 2
018: Fin
an
cia
ls – Rep
ort o
f the Bo
ard o
f Directo
rs – Risks and
risk manag
ement
Strateg
yS
ustainability
FinancialsG
overnance
Annual Report 2018
Financials
Stora Enso in 2018
Report of the Board of Directors
Consolidated financial statements
Notes to the Consolidated financial statements
Extract from the parent company Stora Enso Oyj financial statements
The Board of Directors’ Proposal for the distribution of dividend
Auditor’s report
Stora Enso in capital markets
Stora Enso as a taxpayer
Capacities by mill in 2019
Information for shareholders

Main risk factors
Risk map
Like
liho
od
Very high
5 10 15 20 25
High
4 8 12 16 20
Medium
3 6 9 12 15
Low
2 4 6 8 10
Very low
1 2 3 4 5
Incidental Minor Moderate Major Extreme
Impact – annualised Group EBITDA impact / share price impact / reputational impact
AE
H
IK
LM
N
PO
J
D
FG
BC
Key risks in 2018
Risk* Risk classification
Time span
Change vs 2017
Level of possible management influence
Major impact – high likelihood
A Global warming E/S LT
B Macroeconomy, geopolitics and currency rates E/S/F ST/LT
C Sourcing I/S/O ST/LT
Moderate impact – high likelihood
D Regulatory changes E/S/C ST/LT
E Information technology and security I/O ST
Major impact – medium likelihood
F Ethics and compliance M/C ST
G People and capabilities I/O ST/LT
H Strategic investments M/C ST/LT
Moderate impact – medium likelihood
I Community relations and social responsibility I/O/C ST
J Competition and market demand E/S ST/LT
K Product safety M/O/C ST
Minor impact – high likelihood
L Occupational health and safety I/O ST
M Physical assets I/O ST/LT
Major impact – low likelihood
N Digitalisation I/S ST/LT
O Forest and land use I/O/C ST/LT
P Mergers, acquisitions and divestitures M/I/O/C ST
* Residual risk = risk remaining after risk treatment
Symbols
M = Mandatory obligationsE = External factorsI = Internal capabilitiesS = StrategicO = OperationalC = ComplianceF = Financial market and reportingST = Short-termLT = Long-term
Change vs 2017
Increased Decreased Stable
Level of possible management influence
Low High
11
Sto
ra En
so 2
018: Fin
an
cia
ls – Rep
ort o
f the Bo
ard o
f Directo
rs – Risks and
risk manag
ement
Strateg
yS
ustainability
FinancialsG
overnance
Annual Report 2018
Financials
Stora Enso in 2018
Report of the Board of Directors
Consolidated financial statements
Notes to the Consolidated financial statements
Extract from the parent company Stora Enso Oyj financial statements
The Board of Directors’ Proposal for the distribution of dividend
Auditor’s report
Stora Enso in capital markets
Stora Enso as a taxpayer
Capacities by mill in 2019
Information for shareholders
Strategic risks
Global warmingChanges in precipitation patterns, drought, typhoons and severe frost periods in the subtropics could cause damage to operations and tree plantations. Increases in average temperatures could lead to changes in the tree species composition of forests. Milder winters could impact harvesting and transport of wood in northern regions and the related costs. Additional demand for biomass fuels and agricultural land may limit the availability of land for fibre production, affecting the price of biomass. The increasing global demand for water may in the long-term impact the Group’s operations through our supply chains.
Policy principles and mitigation measuresStora Enso is committed to contributing and mitigating the effects of climate change by actively seeking opportunities to reduce the Group’s carbon footprint. Risks related to climate change are managed via activities related to finding clean, affordable and safe energy sources for production and transportation, and reducing energy consumption. Additional measures include energy efficiency initiatives, the use of carbon-neutral biomass fuels, maximising the utilisation of combined heat and power, and sequestration of carbon dioxide in forests and products. Diligent plantation planning is ensured to avoid frost sensitive areas and non-controversial tree breeding and R&D programmes are applied to increase tolerance of extreme temperatures. Stora Enso maintains a diversity of forest types and structures and enforces diversification in wood sourcing. Wood harvesting in soft soils involves the implementation of best practices
guidelines. Agroforestry concepts have been introduced to integrate the different land use forms and to mitigate the competition for land and the effects of increasing food prices.
Related opportunities• With regards to global warming, we believe that the opportunities
outweigh risks in near term.• Products based on renewable materials with a low carbon footprint
help customers and society at large to reduce CO2 emissions by providing an alternative to solutions based on fossil fuels or other non-renewable materials.
Macroeconomic, geopolitical, and currency rate risksStora Enso operates in more than 30 countries and is affected by the global economy. Changes in broad economic conditions, sharp market corrections, increasing volatility in foreign exchange rates and chronic fiscal imbalances could have negative and material impact on the Group’s profit, cash flows and financial position. A prolonged global recession may materially and adversely affect Stora Enso’s performance and financial condition. A recession may also materially affect the Group’s customers, suppliers and other parties with whom it does business. Exchange rate fluctuations may have a material impact on the reported results through transaction and translation risk impact.
A significant and sustained economic downturn, or any similar event, could have a material adverse effect on the Group’s operational performance and financial condition. The Group’s reported results and reported net assets may fluctuate as the exchange rates change.
Stora Enso is exposed to several financial market risks that the Group is responsible for managing under policies approved by the Board of Directors. The objective is to achieve cost-effective funding in Group companies and manage financial risks using financial instruments to reduce earnings volatility. The main exposures for the Group besides currency risk are interest rate risk, funding risk, commodity price risk and credit risk.
Financial risks are discussed in detail in Note 24, Financial risk management, of the Consolidated financial statements.
Policy principles and mitigation measuresThe Group has a diversified portfolio of businesses which mitigates exposure to any one country or product segment. We monitor the external environment continuously and our planning assumptions take account of important near- to medium-term and long-term drivers related to key macro-economic factors. We closely monitor the Board-approved risk appetite compliance for specific financial metrics and actively manage cash flow and liquidity. We hedge 50% of the highly probable 12-month net foreign exchange flows in main currency pairs. Currency translation risk is reduced by funding assets, whenever economically possible, in the same currency as the asset. The divisions regularly monitor their order flows and other leading indicators, where available, so that they may respond quickly to deterioration in trading conditions. In the event of a significant economic downturn, the Group would identify and implement cost reduction measures to offset the impact on margins from deterioration in sales.
Related opportunities• A diverse business portfolio and geographical presence,
competitive strength and resilient balance sheet reduce the Group’s risk exposures
• Strategic opportunities in changing currency and macroeconomic environment.
Strategic investmentsStora Enso’s business strategy is to transform itself from a traditional paper and board producer to a customer-focused renewable materials growth company. The success of this transformation depends on the Group’s ability to understand the needs of the customer and find the best way to serve them with the right offering and with the right production asset portfolio. Failure to complete strategic projects in accordance with the agreed schedule, budget or specifications can have serious impacts on our financial performance. Significant, unforeseen changes in costs or an inability to sell the envisaged volumes or achieve planned price levels may prevent us from achieving our business goals.
Policy principles and mitigation measuresRisks are mitigated through profound and detailed pre-feasibility and feasibility studies which are prepared for each large investment. Group investment guidelines stipulate the process, governance, risk management and monitoring procedures for strategic projects.
Risk management process
Treat Risks
Monitor and Review
Communicate and Consult
Identify Risks
Analyse Risks
Evaluate Risks
Risk Assessment
Establish the Context
12
Sto
ra En
so 2
018: Fin
an
cia
ls – Rep
ort o
f the Bo
ard o
f Directo
rs – Risks and
risk manag
ement
Strateg
yS
ustainability
FinancialsG
overnance
Annual Report 2018
Financials
Stora Enso in 2018
Report of the Board of Directors
Consolidated financial statements
Notes to the Consolidated financial statements
Extract from the parent company Stora Enso Oyj financial statements
The Board of Directors’ Proposal for the distribution of dividend
Auditor’s report
Stora Enso in capital markets
Stora Enso as a taxpayer
Capacities by mill in 2019
Information for shareholders
Environmental and Social Impact Assessments (ESIAs) are conducted for all new projects that could cause significant adverse effects in local communities. Post completion audits are carried out for all significant investments.
Related opportunities• Replacing fossil-based materials by innovating and developing new
products and services based on wood and other renewable materials.
Competition and market demandContinued competition and supply and demand imbalances in the raw material, energy and products market may have an impact on profitability. The paper, pulp, packaging and wood products industries are mature, capital intensive and highly competitive. Stora Enso’s principal competitors include a number of large international forest products companies and numerous regional and more specialised competitors. Customer demand for products is influenced by the general economic conditions and inventory levels, and affects product price levels. Product prices, which tend to be cyclical in this industry, are affected by capacity utilisation, which decreases in times of economic slowdowns. Changes in prices differ between products and geographic regions.
The following table shows the operating profit sensitivity to a +/- 10% change in either price or volume for different segments based on figures for 2018.
Operating Profit: Impact of Changes +/- 10%, EUR million
Segments Price VolumeConsumer Board 251 84
Packaging Solutions 129 59
Biomaterials 162 85
Wood Products 160 44
Paper 283 75
Policy principles and mitigation measuresThe ability to respond to changes in product demand and consumer preferences and to develop new products on a competitive and economic basis calls for innovation, continuous capacity management and structural development. The risks related to factors such as demand, price, competition and customers are regularly monitored by each division and unit as a routine part of business management. These risks are also continuously monitored and evaluated on a Group level to gain a perspective of the Group’s total asset portfolio and overall long-term profitability potential.
Related opportunities• Our expertise in wood and other biomass is focused on responding
to customer and consumer demand in a changing world.
DigitalisationThe digital transformation of businesses continues to alter the ways in which organisations operate. Digital capabilities penetrate all
aspects of business and operating models, reshaping how companies and functions generate value. Therefore, digitalisation also involves potentially disruptive forces. Moreover, customers, regulators and other stakeholders expect companies to understand what data they have or could have, what risks it poses, and to have plans to manage it well.
Business process erosion, failure to take advantage of the upside that technology offers or inability to harvest related synergies could significantly impair Stora Enso’s competitiveness in the market place.
Policy principles and mitigation measuresStora Enso has an extensive digitalisation programme with the aim to develop a competitive advantage by making full use of the opportunities to drive revenue growth and internal efficiency. Stora Enso has established a programme with external partners to search for technological development initiatives with a clear business purpose. With experimental and fast prototyping, these projects will help to identify and further develop initiatives that will speed up Stora Enso’s digital maturity by exploring new technologies and capabilities.
Related opportunities• Opportunities related to digitalisation clearly exceed related risks• New technologies offer significant potential for higher level of
process optimisation and automatisation, new business models and enhanced value propositions for customers and consumers.
Mergers, acquisitions, and divestituresFailure to achieve the expected benefits from any acquisition or value from assets or businesses sold can have serious financial impacts. The Group could find itself liable for past acts or omissions of the acquired business, without any adequate right of redress. Failure to achieve expected values from the sales of assets or deliveries beyond the expected receipt of funds may also impact the Group’s financial position. In connection with an acquisition, past practices with targets related to e.g. pollution, competition law compliance or corruption could result in additional costs for Stora Enso and cause reputational damage. Divestments may involve additional costs due to historical and unaccounted liabilities. Business restructuring may also involve reputational impacts.
Policy principles and mitigation measuresRigorous M&A guidelines, including due diligence procedures are applied to the evaluation and execution of all acquisitions that require the approval of the Board of Directors. Structured governance and policies such as the policy for responsible rightsizing, are followed when making restructuring decisions.
Related opportunities• A strong balance sheet and cash flow enable value enhancing
M&A, when the timing and opportunity are right.
Operational risks
Sourcing and logisticsViolation of Supplier Code of Conduct could result in contractual, financial and reputational damages and loss of sales if Stora Enso were to be blacklisted by customers. Similarly poor occupational safety performance of subcontractors can be a risk to our reputation. Increasing input costs or availability of materials, goods and services may adversely affect Stora Enso’s profitability. Securing access to reliable low-cost supplies and proactively managing costs and productivity are of key importance. Reliance on outside suppliers for natural gas, oil and coal, and for peat and nearly half of the electricity consumed, leaves the Group susceptible to changes in energy market prices and disturbances in the supply chain.
The following table shows Stora Enso’s major cost items.
Composition of costs in 2018
Operative Costs % of Costs % of SalesLogistics and commissions 11% 10%
Manufacturing costsFibre 34% 30%
Chemicals and fillers 10% 9%
Energy 7% 6%
Material 7% 6%
Personnel 14% 13%
Other 12% 10%
Depreciation 5% 5%
Total costs and sales 100% 88%Total operative costs and sales in EUR million 9 241 10 486
Equity accounted investments (EAI), operational 81
Operational EBIT 1 325
In many areas Stora Enso is dependent on suppliers and their ability to deliver a product or a service at the right time and of the right quality. The most important products are fibre, chemicals and energy, and machinery and equipment in capital investment projects. The most important services are transport and various outsourced business support services. For some of these inputs, the limited number of suppliers is a risk.
Policy principles and mitigation measuresInput cost volatility is closely monitored on the business unit, divisional and Group level. The Group applies consistent long-term energy risk management. The price and supply risks are mitigated through increased own generation, shareholding in competitive power assets such as PVO/TVO, physical long-term contracts and financial
13
Sto
ra En
so 2
018: Fin
an
cia
ls – Rep
ort o
f the Bo
ard o
f Directo
rs – Risks and
risk manag
ement
Strateg
yS
ustainability
FinancialsG
overnance
Annual Report 2018
Financials
Stora Enso in 2018
Report of the Board of Directors
Consolidated financial statements
Notes to the Consolidated financial statements
Extract from the parent company Stora Enso Oyj financial statements
The Board of Directors’ Proposal for the distribution of dividend
Auditor’s report
Stora Enso in capital markets
Stora Enso as a taxpayer
Capacities by mill in 2019
Information for shareholders
derivatives. The Group hedges price risks in raw material and end-product markets, and supports the development of financial hedging markets. The Group uses a wide range of suppliers and monitors them to avoid situations that might jeopardise continued production, business transactions or development projects.
Suppliers and subcontractors must also comply with Stora Enso’s sustainability requirements as they are part of Stora Enso’s value chain, and their weak sustainability performance could harm Stora Enso and its reputation. Stora Enso’s sustainability requirements for suppliers and audit schemes cover its raw materials, and other goods and services procured. Suppliers are assessed for risks related to their environmental, social and business practices through self-assessment questionnaires and supplier audits. Findings from such assessments are continuously followed up and progressive blacklisting procedures are applied as necessary.
Environmental and social responsibility in wood procurement and forest management is a prime requirement of stakeholders. Failing to ensure that the origin of wood used by the Group is acceptable could have serious consequences in the markets. Stora Enso manages this risk through its policies of sustainable sourcing of wood and fibre, and land management, which set the basic requirements for all Stora Enso wood procurement operations. Traceability systems are used to document that all wood and fibre come from legal and acceptable sources.
Related opportunities• Add value and bring innovation to our business globally by building
strong and measurable relationships with the best suppliers.• Enforce harmonised sourcing processes to increase capabilities,
increase tender quality to reduce cost, and develop sustainable suppliers to reduce risk.
Information technology and securityThe Group is dependent on IT systems for both internal and external communications and for the day-to-day management of its operations. The Group’s information systems, personnel and facilities are subject to cyber security risk. Failure to capitalise on digitalisation and cognitive technologies could impair Stora Enso’s competitiveness. Other IT related risks relate to the potential unavailability of IT services due to human error in operations, damaged hardware in data rooms and data centres, network connection issues and the failure of suppliers to follow service level agreements.
Accidental disclosure of confidential information due to a failure to follow information handling guidelines or due to an accident or criminal act may result in financial damage, penalties, disrupted or delayed launch of new lines of business or ventures, loss of customer and market confidence, loss of research secrets and other business critical information. Further risks involve the loss of backup media and violation of data privacy regulations.
Policy principles and mitigation measuresThe management of risks is actively pursued in the Information Risk Management System and best practice change management and project methodologies are applied. A number of security controls
have been implemented to strengthen the protection of confidential information and to facilitate compliance with international regulations. Specific measures include a thorough RfP process in supplier selection for business-critical services, supplier audits, annual controls and audit, data centres located in low-risk areas, backup connections for critical services, disaster recovery plans, targeted scanning and investigation activities, encryption of communication, information and devices, remote management of security on devices and information security awareness training.
Related opportunitiesEfficient operations, performance optimisation, innovative product offerings, and new customer services through digitisation and sophisticated IT systems.
People and capabilitiesRecruiting, retaining and developing a competent workforce and managing key talent throughout Stora Enso’s global organisation are crucial to success. Competition for personnel is intense and the Group may not be successful in attracting or retaining qualified personnel. A significant portion of Stora Enso employees are members of labour unions and there is a risk that the Group may face labour market disruptions especially in a time of restructuring and redundancies due to divestments and mill closures.
The loss of key employees, the Group’s inability to attract new or adequately trained employees, or a delay in hiring key personnel could seriously harm the Group’s business and impede the Group and its business divisions from reaching their strategic objectives. Labour market disruptions and strikes could have adverse material effects on the business, financial conditions and profitability.
Policy principles and mitigation measuresStora Enso manages the risks and loss of key talents through a combination of different actions. Some of the activities aim at providing a better overview of the workforce of the whole Group, making the Stora Enso employer brand better known both internally and externally, globalising some of the remuneration practices and intensifying the efforts to identify and develop talents. Finally, the Group actively focuses on talent and management assessments, including succession planning for key positions. The majority of employees are represented by labour unions under several collective agreements in different countries where Stora Enso operates, thus relations with unions are of high importance to manage labour disruption risks.
Related opportunities• Skilled and dedicated employees are essential for success.• Engaged high performing people enable the implementation of
transformation strategy and commercial success.
Community relations and social responsibilitySocial risks may harm existing operations and the execution of investments, especially in growth markets. Failure to successfully manage relationships with local communities and non-governmental
organisations (NGOs) could disrupt our operations and adversely affect the Group’s reputation. The Group operates in certain countries, where land and resource ownership rights remain unclear and where related disputes may arise.
Potential impacts include reputational impacts and negative media coverage, harm to communities and rights holders, disruption of operations, and loss of the licence to operate.
Policy principles and mitigation measuresStora Enso strives to identify and minimise risks related to social issues in good time, in order to guide decision-making in its investment processes as well as in its ongoing operations. Tools such as sustainability risk assessment, human rights due diligence and Environmental and Social Impact Assessments (ESIA) help ensure that no unsustainable projects are initiated and all related risks and opportunities are fully understood in all operations. These tools also enable project plans and operating practices to be adapted to suit local circumstances. Furthermore, dialogue with NGOs is a part of the Group’s stakeholder engagement. More information on community engagement is presented in Stora Enso’s Sustainability Report.
Related opportunities• Ensuring that the communities around our operations thrive
economically, socially, and environmentally is crucial for the success and sustainability of Stora Enso.
• Clear business benefits to Stora Enso through a strong focus on social responsibility, as customers, business partners, investors and potential employees become more and more attracted to socially responsible companies.
Product safetySome of our products are used to package liquids and food consumer products, so any defects could affect health or packaging functions and result in costly product recalls. Wood products are incorporated into buildings, and this may involve product liability resulting from failures in structural design, product selection or installation. Failure to ensure product safety could result in product recalls involving significant costs including compensation for indirect costs of customers, and reputational damage.
Policy principles and mitigation measuresThe mills producing food and drink contact products have established certified hygiene management systems based on risk and hazard analysis. To ensure the safety of its products, Stora Enso actively participates in CEPI (Confederation of European Paper Industry) working groups on chemical and product safety. In addition, all Stora Enso mills have certified ISO quality management systems. Furthermore, contractual liability limitation and insurance protection are used to limit the risk exposure to Stora Enso.
Related opportunities• Differentiation and value creation through superior product quality
and the highest level of product conformity.
14
Sto
ra En
so 2
018: Fin
an
cia
ls – Rep
ort o
f the Bo
ard o
f Directo
rs – Risks and
risk manag
ement
Strateg
yS
ustainability
FinancialsG
overnance
Annual Report 2018
Financials
Stora Enso in 2018
Report of the Board of Directors
Consolidated financial statements
Notes to the Consolidated financial statements
Extract from the parent company Stora Enso Oyj financial statements
The Board of Directors’ Proposal for the distribution of dividend
Auditor’s report
Stora Enso in capital markets
Stora Enso as a taxpayer
Capacities by mill in 2019
Information for shareholders
Occupational health and safetyFailure to maintain high levels of safety management can result in harm to the Group’s employees or contractors, and also to communities near our operations and the environment. Impacts in addition to physical injury, health effects and environmental damage could include liability to employees or third parties, impairment of the Group’s reputation, or inability to attract and retain skilled employees. Government authorities could additionally enforce the closure of our operations on a temporary basis.
Personnel security can never be compromised and thus Stora Enso must be aware of potential safety risks and provide adequate guidelines to people for managing risks related to, for example, travel, work and living in countries with security or crime concerns. Focusing on the security of key personnel is also important from a business continuity perspective.
Policy principles and mitigation measuresStora Enso measures its performance in health and safety through lag indicators on accidents and near-misses, and lead indicators on safety observations. The target in safety is to achieve zero accidents, but demanding milestones have also been set for accident and incident rates. Stora Enso has adopted a common model for safety management, establishing a set of safety tools that all units must implement in their operations. Implementation of the tools is followed up and reported internally on a quarterly basis, and support is offered to units through training, coaching and the sharing of best-practice. The main responsibility for identifying and managing safety risks remains with the units. At the mill level, safety and health risks are assessed jointly, in co-operation with the occupational health service providers. Global health and safety risks are monitored and assessed by the Group’s Occupational Health and Safety unit.
Stora Enso carries out constant monitoring of risks related to the security and safety of the personnel, including health issues, and information available on the Intranet is delivered directly to travelling employees. An external service provider takes care of action in medical or security crises, under guidance from Stora Enso’s crisis management team.
Related opportunities• Leading health and safety performance strengthens the brand as
an employer.• Improved engagement, efficiency and productivity.
Physical assets The physical assets that comprise the installed capacity of the production facilities have inherent risks or the potential for failure, and also involve the potential for off-specification operation that could result in poor product quality, lower output or increased production costs. In addition to the inherent risks of catastrophic failure, the management must also consider the relative importance, e.g. criticality, of each asset on the plant’s ability to meet delivery commitments and the business plan. In some instances the risks
are the result of inherent design deficiencies, mode of operation or operating practices. In Stora Enso the significant asset risks lie predominantly in integrated (but also non-integrated) pulp and related energy production.
Policy principles and mitigation measuresProtecting production assets and business results is a high priority for Stora Enso to achieve the target of avoiding any unplanned production stoppages. This is achieved through structured methods of identifying, measuring and controlling different types of risk and exposure. Divisional risk specialists manage this process together with insurance companies and other loss prevention specialists. Each year a number of technical risk inspections are carried out at production units. Risk improvement programmes and cost-benefit analyses of proposed investments are managed via internal reporting and risk assessment tools. Internal and external property loss prevention guidelines, fire loss control assessments, key machinery risk assessments and specific loss prevention programmes are also utilised.
Planned stoppages for maintenance and other work are important to keep machinery in good order. Preventive maintenance programmes and spare part criticality analyses are utilized to secure the high availability and efficiency of key machinery. Striking a balance between accepting risks and avoiding, treating or sharing risks is a high priority.
Related opportunities• Optimised maintenance and well controlled loss prevention
programmes• Potential for competitive advantage through improved productivity
and overall efficiency
Compliance risks
Regulatory changes The Group’s businesses may be affected by political or regulatory developments in any of the countries and jurisdictions in which the Group operates, including changes to fiscal, tax, environmental or other regulatory regimes. Potential impacts include higher costs and capex to meet new environmental requirements, expropriation of assets, imposition of royalties or other taxes targeted at our industry, and requirements for local ownership or beneficiation. In particular, the EU energy and carbon policies may impact upon the availability and price of wood fibre. Additionally, political instability may result in civil unrest, nullification of existing agreements, harvesting permits or land leases. Unpredicted changes in forest certification schemes could limit the availability of certified raw materials.
Policy principles and mitigation measures• Active monitoring of regulatory and political developments in the
countries where the Group operates• Participation in policy development mainly through industry
associations
Related opportunities• Regulatory changes involve market growth potential for sustainable
products. Resource efficiency, the circular economy and renewabilityare increasingly important sources of competitive advantage.
Ethics and complianceStora Enso operates in a highly regulated business area and is thereby exposed to risks related to breach of applicable laws and regulations (e.g. capital markets regulation, company and tax laws, customs regulation and safety regulation) and breaches of group policies such as the Stora Enso Code, Supplier Code of Conduct and Business Practice Policy regarding fraud, anti-trust, corruption, conflict of interests and other misconduct. Stora Enso may face high compliance and remediation costs under environmental laws and regulations. See also Information systems and information security. Potential impacts include prosecution, fines, penalties, and contractual, financial and reputational damage.
Policy principles and mitigation measuresStora Enso’s Ethics and Compliance Programme, including policy setting, value promotion, training and knowledge sharing and grievance mechanisms are kept continuously up to date and developed. Other compliance mechanisms include Stora Enso Group’s internal control system and Internal Audit assurance, the Supplier Code of Conduct in supplier contracts, supplier risk assessments, supplier trainings, supplier audits and black-listing procedures. In response to capital markets regulations, Stora Enso’s Disclosure Policy emphasises the importance of transparency, credibility, responsibility, proactivity and interaction.
Environmental risks are minimised through environmental management systems and environmental due diligence for acquisitions and divestments, and indemnification agreements where effective and appropriate remediation projects are required. Special remediation projects related to discontinued activities and mill closures are executed based on risk assessments.
Related opportunities• Focusing on wider ethical topics rather than mere compliance with
regulations will lead to successful business, foster accountability and enhance corporate reputation.
Forest and land useWood is our most important raw material. Adverse changes in growing conditions and natural hazards, caused by climate change, for example, could result in significant financial loss to Stora Enso. Failure to meet stakeholder expectations or to ensure the chain of custody and economically, socially and environmentally sustainable forest and land management practices throughout our wood procurement and plantation operations could also result in significant reputational and financial loss to Stora Enso. Furthermore, global challenges such as population growth, increasing demand for agricultural land, and the widening gap between the supply and demand for wood, all require us to use natural resources even more efficiently.
15
Sto
ra En
so 2
018: Fin
an
cia
ls – Rep
ort o
f the Bo
ard o
f Directo
rs – Risks and
risk manag
ement
Strateg
yS
ustainability
FinancialsG
overnance
Annual Report 2018
Financials
Stora Enso in 2018
Report of the Board of Directors
Consolidated financial statements
Notes to the Consolidated financial statements
Extract from the parent company Stora Enso Oyj financial statements
The Board of Directors’ Proposal for the distribution of dividend
Auditor’s report
Stora Enso in capital markets
Stora Enso as a taxpayer
Capacities by mill in 2019
Information for shareholders

Policy principles and mitigation measuresOur Policy for Wood and Fibre Sourcing, and Land Management, robust traceability systems and our active promotion of forest certification all help to ensure that no wood or fibre from unacceptable sources enters our supply chain. In addition, when sourcing logging residues and other forest biomass for energy use, we follow the specific guidelines developed for the harvesting of forest energy, which include strict environmental considerations.
Related opportunitiesAs trees absorb carbon dioxide (CO2) from the atmosphere and – together with wood-based products – act as carbon sinks, wood from sustainably managed forests represents a carbon neutral, renewable alternative to many non-renewable materials. If forests and plantations are managed sustainably, new generations of trees will replace those that are logged, sequestering more CO2 from the atmosphere. Well-managed forests can make entire ecosystems more resilient to negative impacts, and benefit from positive ones.
Corporate governance in Stora EnsoStora Enso complies with the Finnish Corporate Governance Code issued by the Securities Market Association (the “Code”). The Code is available at cgfinland.fi. Stora Enso also complies with the Swedish Corporate Governance Code (“Swedish Code”), with the exception of the deviations listed in Appendix 1 of the Corporate Governance Report. The deviations are due to differences between the Swedish and Finnish legislation, governance code rules and practices, and in these cases Stora Enso follows the practice in its domicile. The Swedish Code is issued by the Swedish Corporate Governance Board and is available at corporategovernanceboard.se.
Legal proceedings
Contingent liabilities Stora Enso has undertaken significant restructuring actions in recent years which have included the divestment of companies, sale of assets and mill closures. These transactions include a risk of possible environmental or other obligations the existence of which would be confirmed only by the occurrence or non-occurrence of one or more uncertain future events not wholly within the control of the Group.
Stora Enso is party to legal proceedings that arise in the ordinary course of business and which primarily involve claims arising out of commercial law. The management does not consider that liabilities related to such proceedings before insurance recoveries, if any, are likely to be material to the Group’s financial condition or results of operations.
Legal proceedings in Latin America Veracel On 11 July 2008, Stora Enso announced that a federal judge in Brazil had issued a decision claiming that the permits issued by the State of Bahia for the operations of Stora Enso’s joint operations company Veracel were not valid. The judge also ordered Veracel to take certain actions, including reforestation with native trees on part of Veracel’s
plantations and a possible fine of BRL 20 (EUR 5) million. Veracel disputes the decision and has filed an appeal against it. Veracel operates in full compliance with all Brazilian laws and has obtained all the necessary environmental and operating licences for its industrial and forestry activities from the relevant authorities. In November 2008, a Federal Court suspended the effects of the decision. No provisions have been recorded in Veracel’s or Stora Enso’s accounts for the reforestation or the possible fine.
In June 2017, Veracel received a tax infringement note referring to year 2012 with a total amount of BRL 224 (EUR 50) million including interest and fines. The dispute is limited to fiscal year 2012 for which the tax authority applied another transfer pricing method due to a different interpretation of a transition rule. Veracel acts in full compliance with Brazilian transfer pricing law and has filed an administrative defense against the tax note in July 2017. In June 2018 Veracel received a positive decision from Federal Revenue Judgement, which has been confirmed by the Administrative Council For Fiscal Resources in January 2019. The total exposure at year end is BRL 241 (EUR 54) million considering interest until 31 December 2018. Stora Enso’s share of the exposure is BRL 120 (EUR 27) million. No provisions have been recorded in Veracel’s or Stora Enso’s accounts for this tax dispute.
Legal proceedings in Finland Roundwood claim In December 2009, the Finnish Market Court fined Stora Enso for competition law infringements in the market for roundwood in Finland from 1997 to 2004. Stora Enso did not appeal against the ruling. In March 2011, Metsähallitus of Finland initiated legal proceedings against Stora Enso, UPM and Metsäliitto claiming compensation for damage allegedly suffered due to the competition infringement. In its judgement rendered in June 2016, the Helsinki District Court dismissed Metsähallitus’ claim for damages against Stora Enso, UPM and Metsäliitto. Metsähallitus appealed against the District Court’s judgment to the Helsinki Court of Appeal, which rendered its judgement in the matter in May 2018. In its judgement, the Court of Appeal dismissed Metsähallitus’ appeal and upheld the District Court’s judgement. The total amount of Metsähallitus’ claim jointly and severally against Stora Enso, UPM and Metsäliitto in the Court of Appeal was approximately EUR 125 million and the secondary claim against Stora Enso was approximately EUR 68 million. Metsähallitus applied for a leave of appeal from the Supreme Court. The Supreme Court decided on 29 January 2019 that the application to appeal is denied. This concludes the case without Stora Enso having any payment obligation towards Metsähallitus. Further the entire round woodclaim case can be now considered closed without any material financial effects on Stora Enso. The quarterly reporting will discontinue.
Legal proceedings in Sweden Insurance claim In July and August 2016, six Swedish insurance companies filed lawsuits in the Environmental Court and the District Court of Falun against Stora Enso, due to damage caused by the forest fire in
Västmanland, Sweden, in 2014. The claimed amount is approximately SEK 300 (EUR 30) million. Stora Enso denies liability. So far the Environmental Court and thereafter the Environmental Court of Appeal has found that the Environmental code is not applicable on damage caused by fire.
Company fine In January 2018, a Swedish prosecutor filed a lawsuit against Stora Enso and its supplier, due to the forest fire in Västmanland, Sweden in 2014, claiming a company fine of SEK 5 million each. Both Stora Enso and the supplier have disputed the claim.
Share capitalStora Enso Oyj’s shares are divided into A and R shares. The A and R shares entitle holders to the same dividend but different voting rights. Each A share and each ten R shares carry one vote at a shareholders’ meeting. However, each shareholder has at least one vote.
During 2018, a total of 79 648 A-shares converted into R-shares were recorded in the Finnish Trade Register. On 31 December 2018, Stora Enso had 176 312 672 A shares and 612 307 315 R shares in issue. The company did not hold its own shares. The total number of Stora Enso shares in issue was 788 619 987 and the total number votes at least 237 543 403.
The Board of Directors is not currently authorised to issue, acquire or dispose of shares in the Company.
16
Sto
ra En
so 2
018: Fin
an
cia
ls – Rep
ort o
f the Bo
ard o
f Directo
rs – Legal p
roceed
ings
Strateg
yS
ustainability
FinancialsG
overnance
Annual Report 2018
Financials
Stora Enso in 2018
Report of the Board of Directors
Consolidated financial statements
Notes to the Consolidated financial statements
Extract from the parent company Stora Enso Oyj financial statements
The Board of Directors’ Proposal for the distribution of dividend
Auditor’s report
Stora Enso in capital markets
Stora Enso as a taxpayer
Capacities by mill in 2019
Information for shareholders
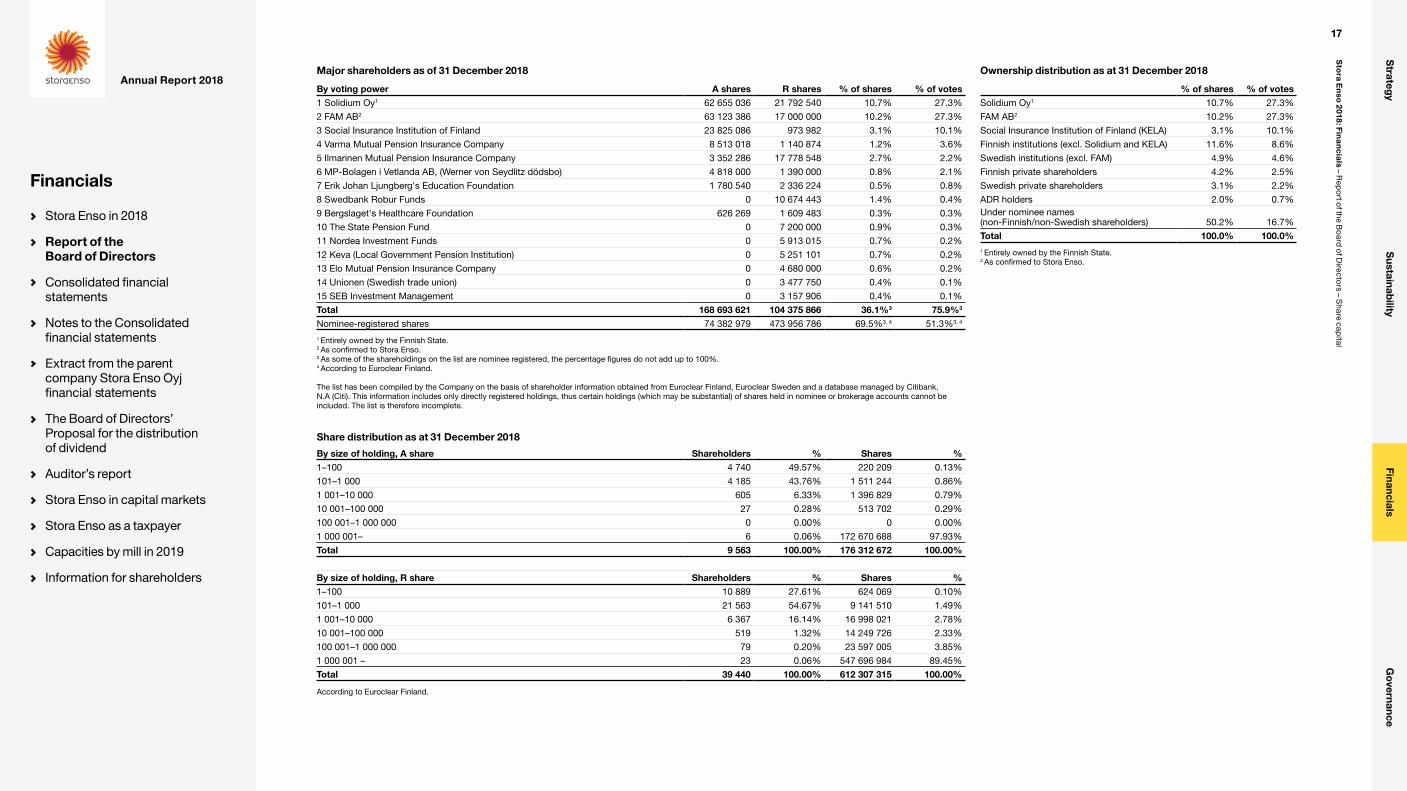
Major shareholders as of 31 December 2018
By voting power A shares R shares % of shares % of votes1 Solidium Oy1 62 655 036 21 792 540 10.7% 27.3%
2 FAM AB2 63 123 386 17 000 000 10.2% 27.3%
3 Social Insurance Institution of Finland 23 825 086 973 982 3.1% 10.1%
4 Varma Mutual Pension Insurance Company 8 513 018 1 140 874 1.2% 3.6%
5 Ilmarinen Mutual Pension Insurance Company 3 352 286 17 778 548 2.7% 2.2%
6 MP-Bolagen i Vetlanda AB, (Werner von Seydlitz dödsbo) 4 818 000 1 390 000 0.8% 2.1%
7 Erik Johan Ljungberg's Education Foundation 1 780 540 2 336 224 0.5% 0.8%
8 Swedbank Robur Funds 0 10 674 443 1.4% 0.4%
9 Bergslaget's Healthcare Foundation 626 269 1 609 483 0.3% 0.3%
10 The State Pension Fund 0 7 200 000 0.9% 0.3%
11 Nordea Investment Funds 0 5 913 015 0.7% 0.2%
12 Keva (Local Government Pension Institution) 0 5 251 101 0.7% 0.2%
13 Elo Mutual Pension Insurance Company 0 4 680 000 0.6% 0.2%
14 Unionen (Swedish trade union) 0 3 477 750 0.4% 0.1%
15 SEB Investment Management 0 3 157 906 0.4% 0.1%
Total 168 693 621 104 375 866 36.1%3 75.9%3
Nominee-registered shares 74 382 979 473 956 786 69.5%3, 4 51.3%3, 4
1 Entirely owned by the Finnish State.2 As confirmed to Stora Enso.3 As some of the shareholdings on the list are nominee registered, the percentage figures do not add up to 100%.4 According to Euroclear Finland.
The list has been compiled by the Company on the basis of shareholder information obtained from Euroclear Finland, Euroclear Sweden and a database managed by Citibank, N.A (Citi). This information includes only directly registered holdings, thus certain holdings (which may be substantial) of shares held in nominee or brokerage accounts cannot be included. The list is therefore incomplete.
Share distribution as at 31 December 2018
By size of holding, A share Shareholders % Shares %1–100 4 740 49.57% 220 209 0.13%
101–1 000 4 185 43.76% 1 511 244 0.86%
1 001–10 000 605 6.33% 1 396 829 0.79%
10 001–100 000 27 0.28% 513 702 0.29%
100 001–1 000 000 0 0.00% 0 0.00%
1 000 001– 6 0.06% 172 670 688 97.93%
Total 9 563 100.00% 176 312 672 100.00%
By size of holding, R share Shareholders % Shares %1–100 10 889 27.61% 624 069 0.10%
101–1 000 21 563 54.67% 9 141 510 1.49%
1 001–10 000 6 367 16.14% 16 998 021 2.78%
10 001–100 000 519 1.32% 14 249 726 2.33%
100 001–1 000 000 79 0.20% 23 597 005 3.85%
1 000 001 – 23 0.06% 547 696 984 89.45%
Total 39 440 100.00% 612 307 315 100.00%
According to Euroclear Finland.
Ownership distribution as at 31 December 2018
% of shares % of votesSolidium Oy1 10.7% 27.3%
FAM AB2 10.2% 27.3%
Social Insurance Institution of Finland (KELA) 3.1% 10.1%
Finnish institutions (excl. Solidium and KELA) 11.6% 8.6%
Swedish institutions (excl. FAM) 4.9% 4.6%
Finnish private shareholders 4.2% 2.5%
Swedish private shareholders 3.1% 2.2%
ADR holders 2.0% 0.7%Under nominee names (non-Finnish/non-Swedish shareholders) 50.2% 16.7%
Total 100.0% 100.0%1 Entirely owned by the Finnish State.2 As confirmed to Stora Enso.
17
Sto
ra En
so 2
018: Fin
an
cia
ls – Rep
ort o
f the Bo
ard o
f Directo
rs – Share cap
ital
Strateg
yS
ustainability
FinancialsG
overnance
Annual Report 2018
Financials
Stora Enso in 2018
Report of the Board of Directors
Consolidated financial statements
Notes to the Consolidated financial statements
Extract from the parent company Stora Enso Oyj financial statements
The Board of Directors’ Proposal for the distribution of dividend
Auditor’s report
Stora Enso in capital markets
Stora Enso as a taxpayer
Capacities by mill in 2019
Information for shareholders
Outlook and short-term risksStora Enso introduces new way of giving annual outlook and quarterly guidance. The Group starts to guide absolute range for quarterly operational EBIT, instead of comparing quarterly sales and operational EBIT to the previous quarter qualitatively.
Stora Enso’s year 2019 is expected to be largely in line with 2018, provided that the current trading conditions do not significantly change. Demand growth is expected to continue for Stora Enso’s other businesses except for European Paper, for which demand is forecast to continue to decline in 2019. Group’s sales are expected to be higher and costs are forecast to increase in 2019 compared to 2018. Stora Enso will implement measures to mitigate these cost increases and the increased uncertainties with the profit protection programme.
Stora Enso publishes the quarterly guidances in its interim reports.Increasing competition, and supply and demand imbalances in
the paper, pulp, packaging, wood products and roundwood markets may affect Stora Enso’s market share and profitability. Changes in the global economic and political environment, sharp market corrections, increasing volatility in foreign exchange rates and deteriorating economic conditions in the main markets could all affect Stora Enso’s profits, cash flows and financial position.
With reference to current geopolitical circumstances, there is an increasing risk of an escalation in protectionist measures to the extent that global trade could materially shrink. This would have major knock-on effects for inflation, business sentiment, consumer sentiment and ultimately global economic growth.
Furthermore, as the global economy is moving into a new phase where the main central banks will begin to reduce or reverse their lenient monetary policy positions, such developments may give rise to significant uncertainty and negatively affect Stora Enso’s business conditions.
Other risks and uncertainties include, but are not limited to, general industry conditions, such as changes in the cost or availability of raw materials, energy and transportation costs, unanticipated expenditures related to the cost of compliance with existing and new environmental and other governmental regulations and to actual or potential litigation, material disruption at one of our manufacturing facilities, risks inherent in conducting business through joint ventures, and other factors that can be found in Stora Enso’s press releases and disclosures.
Energy sensitivity analysis: the direct effect of a 10% increase in electricity, heat, oil and other fossil fuel market prices would have a negative impact of approximately EUR 12 million on operational EBIT for the next 12 months, after the effect of hedges.
Wood sensitivity analysis: the direct effect of a 10% increase in wood prices would have a negative impact of approximately EUR 203 million on operational EBIT for the next 12 months.
Pulp sensitivity analysis: the direct effect of a 10% increase in pulp market prices would have a positive impact of approximately EUR 130 million on operational EBIT for the next 12 months.
Chemical and filler sensitivity analysis: the direct effect of a 10% increase in chemical and filler prices would have a negative impact
of approximately EUR 62 million on operational EBIT for the next 12 months.
A decrease of energy, wood, pulp or chemical and filler prices would have the opposite impact.
Foreign exchange rates sensitivity analysis for the next twelve months: the direct effect on operational EBIT of a 10% strengthening in the value of the US dollar, Swedish krona and British pound against the euro would be approximately positive EUR 184 million, negative EUR 99 million and positive EUR 38 million annual impact, respectively. Weakening of the currencies would have the opposite impact. These numbers are before the effect of hedges and assuming no changes occur other than a single currency exchange rate movement.
The Group incurs annual unhedged net costs worth approximately EUR 120 million in Brazilian real (BRL) in its operations in Brazil and approximately EUR 110 million in Chinese Renminbi (CNY) in its operations in China. For these flows, a 10% strengthening in the value of a foreign currency would have a EUR 12 million and EUR 11 million negative impact on operational EBIT, respectively.
Events after the balance sheet dateOn 29 January the Supreme Court denied the Finnish Metsähallitus’ application to appeal in the roundwood claim case.
On 1 February Stora Enso announced a profit protection programme to strengthen competitiveness. The intention is to achieve annual cost reduction of EUR 120 million as well as reduction of capital expenditure by about EUR 50 million compared to the earlier forecast.
Proposal for the distribution of dividendThe Board of Directors proposes to the AGM that a dividend of EUR 0.50 per share be distributed for the year 2018.
The dividend would be paid to shareholders who on the record date of the dividend payment, 18 March 2019, are recorded in the shareholders’ register maintained by Euroclear Finland Oy or in the separate register of shareholders maintained by Euroclear Sweden AB for Euroclear Sweden registered shares. Dividends payable to Euroclear Sweden registered shares will be forwarded by Euroclear Sweden AB and paid in Swedish crowns. Dividends payable to ADR holders will be forwarded by Citibank N.A. and paid in US dollars.
The Board of Directors proposes to the AGM that the dividend be paid on or about 25 March 2019.
Annual General MeetingStora Enso Oyj’s Annual General Meeting (AGM) will be held on Thursday 14 March 2019 at 4.00 p.m. Finnish time at Finlandia Hall, Mannerheimintie 13 e, Helsinki, Finland.
Non-IFRS measuresThe Group’s key non-IFRS performance metric is operational EBIT, which is used to evaluate the performance of its operating segments and to steer allocation of resources to them. Operational EBIT comprises the operating profit excluding items affecting comparability
(IAC) and fair valuations from the segments and Stora Enso’s share of the operating profit of equity accounted investments (EAI), also excluding items affecting comparability and fair valuations.
Items affecting comparability are exceptional transactions that are not related to recurring business operations. The most common IAC are capital gains and losses relating to disposal of fixed assets, impairments or impairment reversals, disposals gains and losses relating to Group companies, environmental provisions, provisions for planned restructurings, other provisions and penalties. Items affecting comparability are normally disclosed individually if they exceed one cent per share.
Fair valuations and non-operational items include equity incentive schemes and related hedges, CO2 emission rights, valuations of biological assets and the Group’s share of income tax and net financial items of EAI.
Cash flow from operations (non-IFRS) is a group specific way to present operative cash flow without hedging result from OCI and starting from operational EBITDA instead of operating profit.
Cash flow after investing activities (non-IFRS) is calculated as follows: cash flow from operations (non-IFRS) excluding cash spent on intangible assets, property, plant and equipment, and biological assets and acquisitions of EAIs.
The full list of the non-IFRS measures is presented at the end of this report.
18
Sto
ra En
so 2
018: Fin
an
cia
ls – Rep
ort o
f the Bo
ard o
f Directo
rs – Outlo
ok and
short-term
risks
Strateg
yS
ustainability
FinancialsG
overnance
Annual Report 2018
Financials
Stora Enso in 2018
Report of the Board of Directors
Consolidated financial statements
Notes to the Consolidated financial statements
Extract from the parent company Stora Enso Oyj financial statements
The Board of Directors’ Proposal for the distribution of dividend
Auditor’s report
Stora Enso in capital markets
Stora Enso as a taxpayer
Capacities by mill in 2019
Information for shareholders
Calculation of key figuresOperational return on capital employed, operational ROCE (%) 100 x
Annualised operational EBIT
Capital employed1, 2
Operational return on operating capital, operational ROOC (%) 100 x
Annualised operational EBIT
Operating capital1, 2
Return on equity, ROE (%) 100 xNet profit/loss for the period
Total equity 2
Net interest-bearing liabilities Interest-bearing liabilities – interest-bearing assets
Net debt/equity ratioNet interest-bearing liabilities
Equity3
Earnings per share (EPS)Net profit/loss for the period3
Average number of shares
Payout ratio, excl. IAC, % 100 xDividend distribution / share
EPS excl. IAC
Dividend and distribution yield, % 100 xDividend distribution / share
Closing price of share
Price/earnings ratio (P/E), excl. IACClosing price of share
EPS excl. IAC
Operational EBIT
Operating profit/loss excluding items affecting comparability (IAC) and fair valuations of the segments and Stora Enso’s share of operating profit/loss excluding IAC and fair valuations of its equity accounted investments (EAI)
Operational EBITDA
Operating profit/loss excluding operational decrease in the value of biological assets, fixed asset depreciation and impairment, IACs and fair valuations. The definition includes the respective items of subsidiaries, joint arrangements and equity accounted investments.
Net debt/last 12 months’ operational EBITDA ratio
Net interest-bearing liabilities
LTM operational EBITDA
Fixed costs Maintenance, personnel and other administrative type of costs, excluding IAC and fair valuations
Last 12 months (LTM) 12 months prior to the end of reporting period
TRI Total recordable incident rate = number of incidents per one million hours worked
1 Capital employed = Operating capital – Net tax liabilities2 Average for the financial period3 Attributable to owners of the Parent
List of non-IFRS measuresOperational EBITDA Operational EBITDA margin Operational EBIT Operational EBIT margin Capital expenditure Capital employed Operational ROCE Earnings per share (EPS), excl. IAC Operational ROOC Net debt/last 12 months’ operational EBITDA ratio Cash flow from operations Cash flow after investing activities
19
Sto
ra En
so 2
018: Fin
an
cia
ls – Rep
ort o
f the Bo
ard o
f Directo
rs – Calculatio
n of key fig
ures
Strateg
yS
ustainability
FinancialsG
overnance
Annual Report 2018
Financials
Stora Enso in 2018
Report of the Board of Directors
Consolidated financial statements
Notes to the Consolidated financial statements
Extract from the parent company Stora Enso Oyj financial statements
The Board of Directors’ Proposal for the distribution of dividend
Auditor’s report
Stora Enso in capital markets
Stora Enso as a taxpayer
Capacities by mill in 2019
Information for shareholders

Consolidated income statement Consolidated statement of comprehensive income
Year Ended 31 December
EUR million Note 2018 2017Sales 3 10 486 10 045
Other operating income 5 92 147
Changes in inventories of finished goods and work in progress 125 28
Materials and services -6 157 -5 945
Freight and sales commissions -932 -968
Personnel expenses 6 -1 330 -1 331
Other operating expenses 5 -526 -551
Share of results of equity accounted investments 13 181 66
Change in net value of biological assets 12 -68 -72Depreciation, amortisation and impairment charges 10 -479 -515
Operating Profit 3 1 390 904Financial income 8 27 38
Financial expense 8 -207 -200
Profit before Tax 1 210 742Income tax 9 -221 -128
Net Profit for the Year 988 614
Attributable to:Owners of the Parent 18 1 013 625
Non-controlling Interests 19 -24 -11
Net Profit for the Year 988 614
Earnings per ShareBasic and diluted earnings per share, EUR 32 1.28 0.79
Year Ended 31 December
EUR million Note 2018 2017Net profit for the year 988 614
Other Comprehensive Income (OCI)
Items that will Not be Reclassified to Profit and LossEquity instruments at fair value through other comprehensive income 14 97 0
Actuarial losses/gains on defined benefit plans 20 -24 61
Income tax relating to items that will not be reclassified 9 5 -10
78 51
Items that may be Reclassified Subsequently to Profit and LossShare of OCI of equity accounted investments that may be reclassified 27 4 5
Currency translation movements on equity net investments (CTA) 28 -36 -288
Currency translation movements on non-controlling interests 19 0 -3
Net investment hedges 28 -14 40
Cash flow hedges 27 -24 32
Cost of hedging - time value of options 27 -2 0
Non-controlling interests' share of cash flow hedges 19 -2 0
Available-for-sale investments 14 0 39
Income tax relating to items that may be reclassified 9 7 -10
-68 -185
Total Comprehensive Income 999 480
Attributable to:Owners of the Parent 1 025 494
Non-controlling interests 19 -27 -14
Total Comprehensive Income 999 480
The accompanying Notes are an integral part of these Consolidated financial statements.
Consolidated financial statements20
Sto
ra En
so 2
018: Fin
an
cia
ls – Co
nsolid
ated financial statem
ents – Co
nsolid
ated inco
me statem
ent
Strateg
yS
ustainability
FinancialsG
overnance
Annual Report 2018
Financials
Stora Enso in 2018
Report of the Board of Directors
Consolidated financial statements
Notes to the Consolidated financial statements
Extract from the parent company Stora Enso Oyj financial statements
The Board of Directors’ Proposal for the distribution of dividend
Auditor’s report
Stora Enso in capital markets
Stora Enso as a taxpayer
Capacities by mill in 2019
Information for shareholders
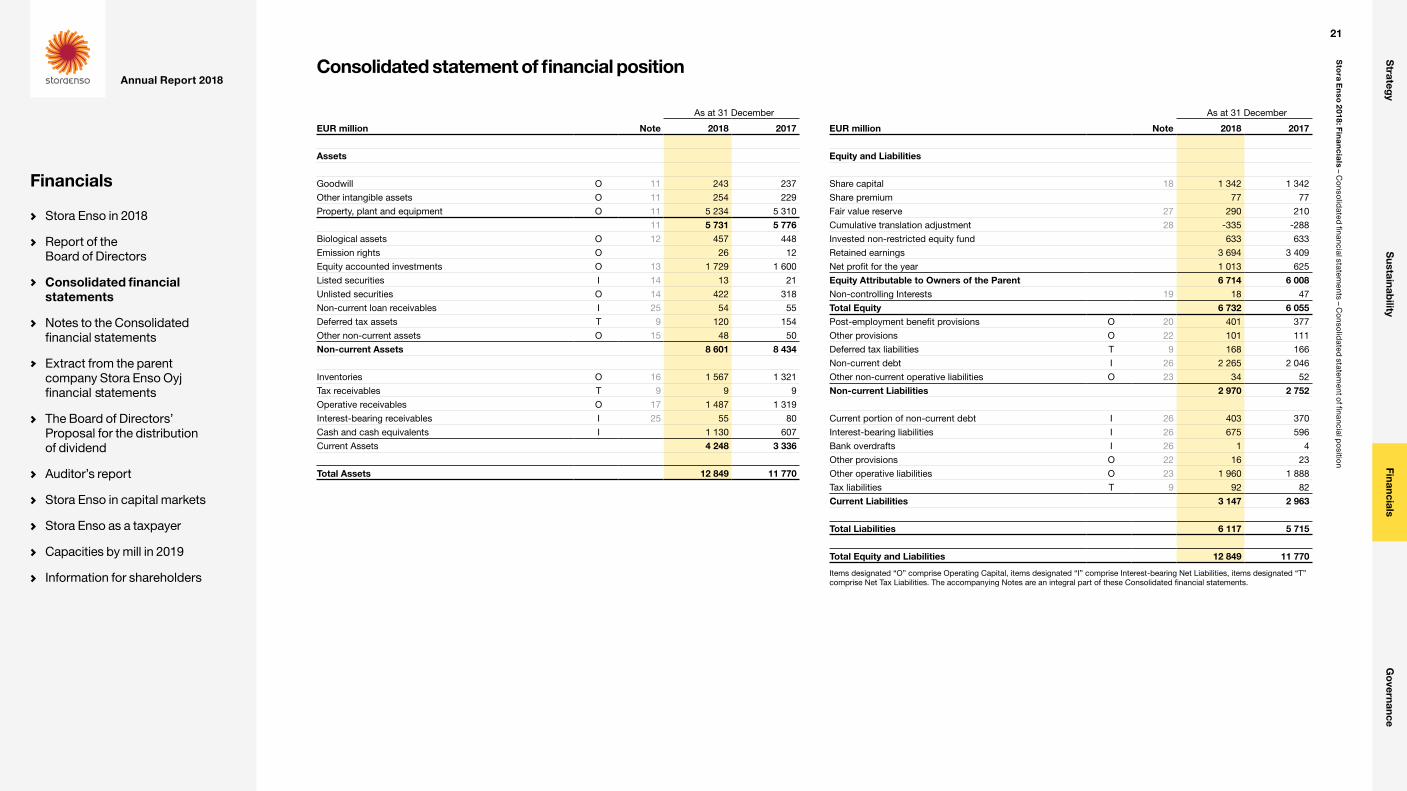
Consolidated statement of financial position
As at 31 December
EUR million Note 2018 2017
Assets
Goodwill O 11 243 237
Other intangible assets O 11 254 229
Property, plant and equipment O 11 5 234 5 310
11 5 731 5 776Biological assets O 12 457 448
Emission rights O 26 12
Equity accounted investments O 13 1 729 1 600
Listed securities I 14 13 21
Unlisted securities O 14 422 318
Non-current loan receivables I 25 54 55
Deferred tax assets T 9 120 154
Other non-current assets O 15 48 50
Non-current Assets 8 601 8 434
Inventories O 16 1 567 1 321
Tax receivables T 9 9 9
Operative receivables O 17 1 487 1 319
Interest-bearing receivables I 25 55 80
Cash and cash equivalents I 1 130 607
Current Assets 4 248 3 336
Total Assets 12 849 11 770
As at 31 December
EUR million Note 2018 2017
Equity and Liabilities
Share capital 18 1 342 1 342
Share premium 77 77
Fair value reserve 27 290 210
Cumulative translation adjustment 28 -335 -288
Invested non-restricted equity fund 633 633
Retained earnings 3 694 3 409
Net profit for the year 1 013 625
Equity Attributable to Owners of the Parent 6 714 6 008Non-controlling Interests 19 18 47
Total Equity 6 732 6 055Post-employment benefit provisions O 20 401 377
Other provisions O 22 101 111
Deferred tax liabilities T 9 168 166
Non-current debt I 26 2 265 2 046
Other non-current operative liabilities O 23 34 52
Non-current Liabilities 2 970 2 752
Current portion of non-current debt I 26 403 370
Interest-bearing liabilities I 26 675 596
Bank overdrafts I 26 1 4
Other provisions O 22 16 23
Other operative liabilities O 23 1 960 1 888
Tax liabilities T 9 92 82
Current Liabilities 3 147 2 963
Total Liabilities 6 117 5 715
Total Equity and Liabilities 12 849 11 770
Items designated “O” comprise Operating Capital, items designated “I” comprise Interest-bearing Net Liabilities, items designated “T” comprise Net Tax Liabilities. The accompanying Notes are an integral part of these Consolidated financial statements.
21
Sto
ra En
so 2
018: Fin
an
cia
ls – Co
nsolid
ated financial statem
ents – Co
nsolid
ated statem
ent of financial p
ositio
n
Strateg
yS
ustainability
FinancialsG
overnance
Annual Report 2018
Financials
Stora Enso in 2018
Report of the Board of Directors
Consolidated financial statements
Notes to the Consolidated financial statements
Extract from the parent company Stora Enso Oyj financial statements
The Board of Directors’ Proposal for the distribution of dividend
Auditor’s report
Stora Enso in capital markets
Stora Enso as a taxpayer
Capacities by mill in 2019
Information for shareholders

Consolidated cash flow statement
Year Ended 31 December
EUR million Note 2018 2017Cash Flow from Operating ActivitiesNet profit for the year 988 614
Adjustments and reversal of non-cash items:
Taxes 9 221 128
Depreciation and impairment charges 10 479 515
Change in value of biological assets 12 68 72
Change in fair value of share awards and TRS 2 10
Share of results of equity accounted investments 13 -181 -66
Profits and losses on sale of fixed assets and investments 5 20 7
Net financial items 8 180 162
Other adjustments -9 -7
Dividends received from equity accounted investments 13 24 20
Interest received 3 3
Interest paid -116 -143
Other financial items, net -9 -53
Income taxes paid 9 -152 -97
Change in net working capital, net of businesses acquired or sold -428 37
Net Cash Provided by Operating Activities 1 092 1 202
Cash Flow from Investing ActivitiesAcquisition of subsidiary shares and business operations, net of disposed cash 4 -4 0
Acquisition of shares in equity accounted investments 13 -29 -9
Acquisition of unlisted securities 14 -3 -8Proceeds from disposal of subsidiary shares and business operations, net of disposed cash 4 42 -4
Proceeds from disposal of shares in equity accounted investments 13 3 5
Proceeds from disposal of unlisted securities 14 1 0Proceeds from disposal of intangible assets and property, plant and equipment 11 9 45
Income taxes paid on disposal of property 0 -15
Capital expenditure 3, 11 -442 -578
Investment in biological assets 12 -83 -80
Proceeds from/payment of non-current receivables, net 8 -52
Net Cash Used in Investing Activities -497 -696
Year Ended 31 December
EUR million Note 2018 2017Cash Flow from Financing ActivitiesProceeds from issue of new long-term debt 26 578 425
Repayment of long-term debt 26 -358 -1 034
Change in short-term borrowings 26 39 76
Dividends paid -323 -292
Buy-out of interest in subsidiaries from non-controlling interests 19 -2 0
Equity injections from, less dividends to, non-controlling interests 19 -2 -1
Purchase of own shares -5 -3
Net Cash Used in Financing Activities -73 -829
Net Change in Cash and Cash Equivalents 521 -323Translation adjustment 4 -23
Net Cash and cash equivalents at beginning of year 603 949
Net Cash and Cash Equivalents at Year End 1 128 603
Cash and Cash Equivalents at Year End1 1 130 607Bank Overdrafts at Year End -1 -4Net Cash and Cash Equivalents at Year End 1 128 6031 Cash and cash equivalents comprise cash-in-hand, deposits held at call with banks and other liquid investments with original maturity of less than three months. Bank overdrafts are included in current liabilities.The accompanying Notes are an integral part of these Consolidated financial statements.
22
Sto
ra En
so 2
018: Fin
an
cia
ls – Co
nsolid
ated financial statem
ents – Co
nsolid
ated cash flow
statement
Strateg
yS
ustainability
FinancialsG
overnance
Annual Report 2018
Financials
Stora Enso in 2018
Report of the Board of Directors
Consolidated financial statements
Notes to the Consolidated financial statements
Extract from the parent company Stora Enso Oyj financial statements
The Board of Directors’ Proposal for the distribution of dividend
Auditor’s report
Stora Enso in capital markets
Stora Enso as a taxpayer
Capacities by mill in 2019
Information for shareholders
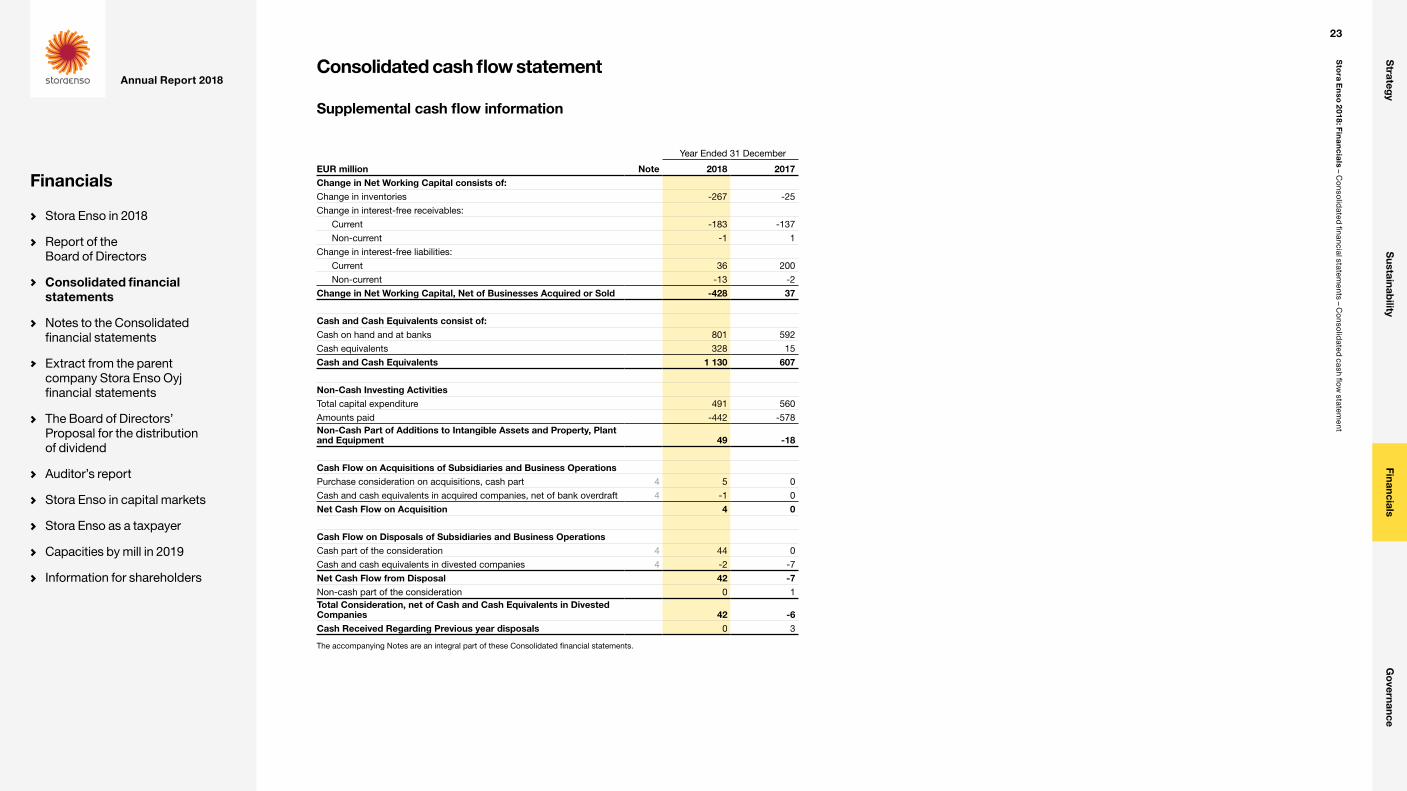
Supplemental cash flow information
Year Ended 31 December
EUR million Note 2018 2017Change in Net Working Capital consists of:Change in inventories -267 -25
Change in interest-free receivables:
Current -183 -137
Non-current -1 1
Change in interest-free liabilities:
Current 36 200
Non-current -13 -2
Change in Net Working Capital, Net of Businesses Acquired or Sold -428 37
Cash and Cash Equivalents consist of:Cash on hand and at banks 801 592
Cash equivalents 328 15
Cash and Cash Equivalents 1 130 607
Non-Cash Investing ActivitiesTotal capital expenditure 491 560
Amounts paid -442 -578Non-Cash Part of Additions to Intangible Assets and Property, Plant and Equipment 49 -18
Cash Flow on Acquisitions of Subsidiaries and Business OperationsPurchase consideration on acquisitions, cash part 4 5 0
Cash and cash equivalents in acquired companies, net of bank overdraft 4 -1 0
Net Cash Flow on Acquisition 4 0
Cash Flow on Disposals of Subsidiaries and Business OperationsCash part of the consideration 4 44 0
Cash and cash equivalents in divested companies 4 -2 -7
Net Cash Flow from Disposal 42 -7Non-cash part of the consideration 0 1Total Consideration, net of Cash and Cash Equivalents in Divested Companies 42 -6Cash Received Regarding Previous year disposals 0 3
The accompanying Notes are an integral part of these Consolidated financial statements.
Consolidated cash flow statement
23
Sto
ra En
so 2
018: Fin
an
cia
ls – Co
nsolid
ated financial statem
ents – Co
nsolid
ated cash flow
statement
Strateg
yS
ustainability
FinancialsG
overnance
Annual Report 2018
Financials
Stora Enso in 2018
Report of the Board of Directors
Consolidated financial statements
Notes to the Consolidated financial statements
Extract from the parent company Stora Enso Oyj financial statements
The Board of Directors’ Proposal for the distribution of dividend
Auditor’s report
Stora Enso in capital markets
Stora Enso as a taxpayer
Capacities by mill in 2019
Information for shareholders
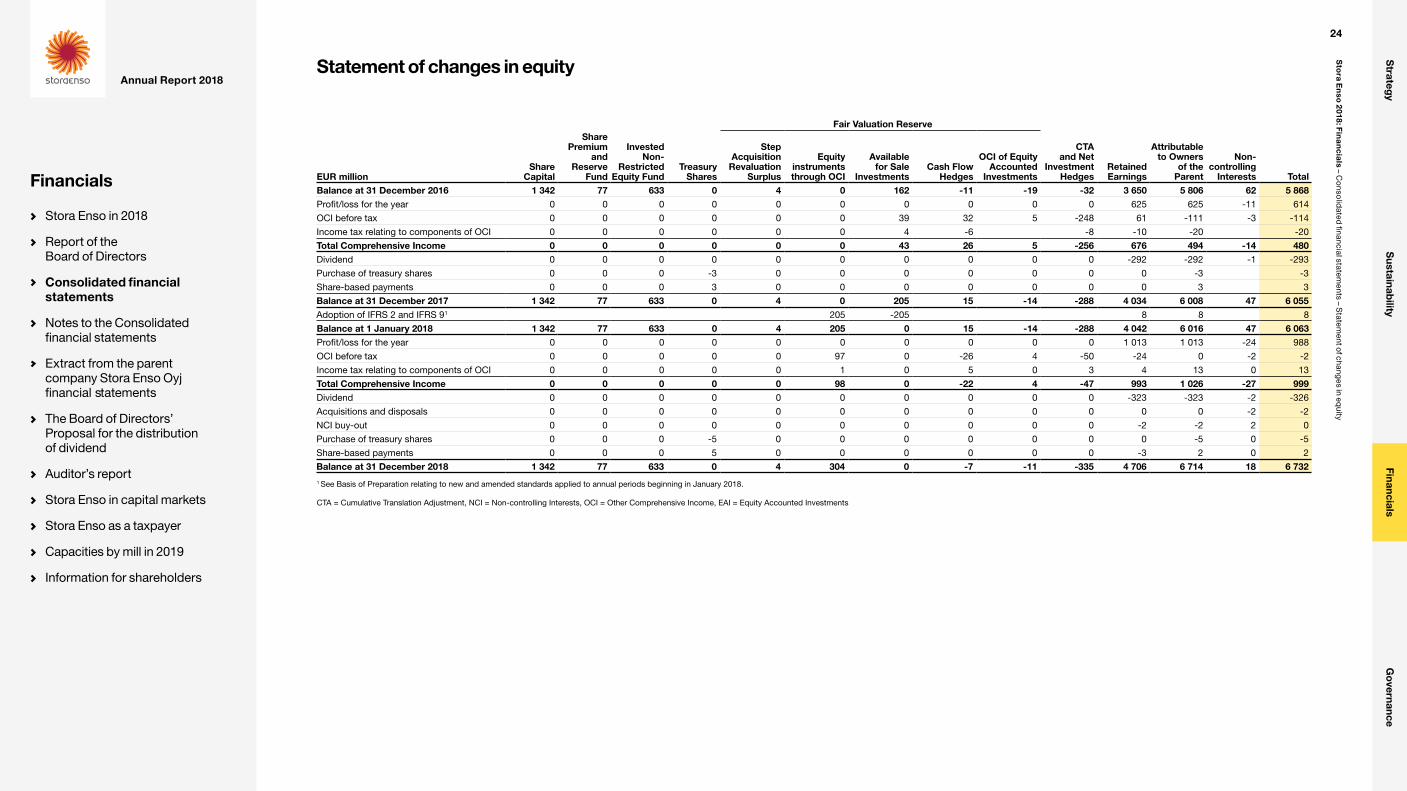
Statement of changes in equity
Fair Valuation Reserve
EUR millionShare
Capital
Share Premium
and Reserve
Fund
Invested Non-
Restricted Equity Fund
Treasury Shares
Step Acquisition
Revaluation Surplus
Equity instruments through OCI
Available for Sale
InvestmentsCash Flow
Hedges
OCI of Equity Accounted
Investments
CTA and Net
Investment Hedges
Retained Earnings
Attributable to Owners
of the Parent
Non-controlling
Interests TotalBalance at 31 December 2016 1 342 77 633 0 4 0 162 -11 -19 -32 3 650 5 806 62 5 868Profit/loss for the year 0 0 0 0 0 0 0 0 0 0 625 625 -11 614
OCI before tax 0 0 0 0 0 0 39 32 5 -248 61 -111 -3 -114
Income tax relating to components of OCI 0 0 0 0 0 0 4 -6 -8 -10 -20 -20
Total Comprehensive Income 0 0 0 0 0 0 43 26 5 -256 676 494 -14 480Dividend 0 0 0 0 0 0 0 0 0 0 -292 -292 -1 -293
Purchase of treasury shares 0 0 0 -3 0 0 0 0 0 0 0 -3 -3
Share-based payments 0 0 0 3 0 0 0 0 0 0 0 3 3
Balance at 31 December 2017 1 342 77 633 0 4 0 205 15 -14 -288 4 034 6 008 47 6 055Adoption of IFRS 2 and IFRS 91 205 -205 8 8 8
Balance at 1 January 2018 1 342 77 633 0 4 205 0 15 -14 -288 4 042 6 016 47 6 063Profit/loss for the year 0 0 0 0 0 0 0 0 0 0 1 013 1 013 -24 988
OCI before tax 0 0 0 0 0 97 0 -26 4 -50 -24 0 -2 -2
Income tax relating to components of OCI 0 0 0 0 0 1 0 5 0 3 4 13 0 13
Total Comprehensive Income 0 0 0 0 0 98 0 -22 4 -47 993 1 026 -27 999Dividend 0 0 0 0 0 0 0 0 0 0 -323 -323 -2 -326
Acquisitions and disposals 0 0 0 0 0 0 0 0 0 0 0 0 -2 -2
NCI buy-out 0 0 0 0 0 0 0 0 0 0 -2 -2 2 0
Purchase of treasury shares 0 0 0 -5 0 0 0 0 0 0 0 -5 0 -5
Share-based payments 0 0 0 5 0 0 0 0 0 0 -3 2 0 2
Balance at 31 December 2018 1 342 77 633 0 4 304 0 -7 -11 -335 4 706 6 714 18 6 732
1 See Basis of Preparation relating to new and amended standards applied to annual periods beginning in January 2018.
CTA = Cumulative Translation Adjustment, NCI = Non-controlling Interests, OCI = Other Comprehensive Income, EAI = Equity Accounted Investments
24
Sto
ra En
so 2
018: Fin
an
cia
ls – Co
nsolid
ated financial statem
ents – Statem
ent of chang
es in equity
Strateg
yS
ustainability
FinancialsG
overnance
Annual Report 2018
Financials
Stora Enso in 2018
Report of the Board of Directors
Consolidated financial statements
Notes to the Consolidated financial statements
Extract from the parent company Stora Enso Oyj financial statements
The Board of Directors’ Proposal for the distribution of dividend
Auditor’s report
Stora Enso in capital markets
Stora Enso as a taxpayer
Capacities by mill in 2019
Information for shareholders

Note 1 Accounting principles
Principal activitiesStora Enso Oyj (“the Company”) is a Finnish public limited liability company organised under the laws of the Republic of Finland and with its registered address at Kanavaranta 1, 00160 Helsinki. Its shares are currently listed on Nasdaq Helsinki and Stockholm. The operations of Stora Enso Oyj and its subsidiaries (together “Stora Enso” or “the Group”) are organised into the following divisions: Consumer Board, Packaging Solutions, Biomaterials, Wood Products, Paper and the segment Other. Segment Other includes the Nordic forest equity accounted investments, Stora Enso’s shareholding in Pohjolan Voima, operations supplying wood to the Nordic and Baltic mills, plantations not connected to any mill site and group shared services and administration. The Group’s main market is Europe, with an expanding presence in Asia and South America.
The Financial Statements were authorised for issue by the Board of Directors on 31 January 2019.
Basis of preparationThe Consolidated Financial Statements of Stora Enso Oyj have been prepared in accordance with International Financial Reporting Standards (IFRS), as adopted by the European Union, including International Accounting Standards (IAS) and interpretations issued by the IFRS Interpretations Committee (IFRIC). The Consolidated Financial Statements of Stora Enso Oyj have been prepared according to the historical cost convention, except as disclosed in the accounting policies. The detailed accounting principles are explained in the related notes with a few exceptions where the accounting principles are presented in this note. The Consolidated financial statements are presented in euros, which is the parent company’s functional currency.
All figures in this Annual Report have been rounded to the nearest million, unless otherwise stated. Therefore, figures in this report may not add up precisely to the totals presented and may vary from previously published financial information.
New and amended standards and interpretations adopted in 2018The Group has applied the following amendments which are effective from 1 January 2018:
• IFRS 9 Financial Instruments. The Group has adopted IFRS 9 Financial Instruments standard effective from 1 January 2018. The standard replaced IAS 39 Financial instruments: Recognition and Measurement. The standard includes revised requirements for recognition and measurement of financial assets and liabilities, impairment and general hedge accounting.
The new impairment model for financial assets requires recognition of loss allowances based on the expected credit
Notes to the Consolidated financial statements
loss model. At the adoption of IFRS 9, the Group has updated its impairment methodology to be in line with IFRS 9. For trade receivables, simplified approach has been implemented and loss allowances are recognised based on expected lifetime credit losses. For receivables measured at amortised cost or fair value through other comprehensive income, general approach has been implemented with the loss allowance being recognised based on 12-month expected credit losses if there has not been a significant increase in credit risk since the initial recognition. As a result of the new impairment methodology, the Group recognised EUR 3 million
negative pre-tax transition adjustment to the opening balance of retained earnings for 2018.
The Group has evaluated its financial assets and liabilities based on the new classification and measurement criteria under IFRS 9. Stora Enso has categorised its financial assets to be measured at amortised cost, at fair value through other comprehensive income and at fair value through Income statement. For financial liabilities, the classification is based on amortised cost and fair value through income statement categories. On the date of initial application, 1 January 2018, the financial assets and liabilities of the Group were as follows:
Classification changes of financial instruments
Measurement category Carrying amountClassification under IAS 39 Classification under IFRS 9 Original New Difference
Non-current financial assets
Listed securitiesAvailable-for-sale financial assets
Fair value through other comprehensive income (FVTOCI) 21 21 0
Unlisted securitiesAvailable-for-sale financial assets
Fair value through Other comprehensive income (FVTOCI) and Fair value through Income Statement (FVTPL) 318 318 0
Non-current loan receivablesLoans and receivables (amortised cost) Amortised cost 55 55 0
Current financial assets
Trade and other operative receivablesLoans and receivables (amortised cost)
Amortised cost and Fair value through Other comprehensive income (FVTOCI) 965 962 -3
Interest-bearing receivablesLoans and receivables (amortised cost) Amortised cost 15 15 0
Derivatives (under hedge accounting)
Fair value through other comprehensive income (FVTOCI)
Fair value through Other comprehensive income (FVTOCI) 49 49 0
Derivatives (not under hedge accounting)Fair value through Income Statement (FVTPL)
Fair value through Income Statement (FVTPL) 16 16 0
Cash and cash equivalentsLoans and receivables (amortised cost) Amortised cost 607 607 0
Total financial assets 2 046 2 043 -3
Non-current financial liabilitiesNon-current debt Amortised cost Amortised cost 2 046 2 046 0Current financial liabilitiesCurrent portion of non-current debt Amortised cost Amortised cost 370 370 0Interest-bearing liabilities Amortised cost Amortised cost 560 560 0
Derivatives (under hedge accounting)
Fair value through other comprehensive income (FVTOCI)
Fair value through other comprehensive income (FVTOCI) 32 32 0
Derivatives (not under hedge accounting)Fair value through Income Statement (FVTPL)
Fair value through Income Statement (FVTPL) 4 4 0
Bank overdrafts Amortised cost Amortised cost 4 4 0
Contingent considerationFair value through Income Statement (FVTPL)
Fair value through Income Statement (FVTPL) 20 20 0
Trade and other operative payables Amortised cost Amortised cost 1 576 1 576 0Total financial liabilities 4 612 4 612 0
25
Sto
ra En
so 2
018: Fin
an
cia
ls – No
tes to the Co
nsolid
ated financial statem
ents
Strateg
yS
ustainability
FinancialsG
overnance
Annual Report 2018
Financials
Stora Enso in 2018
Report of the Board of Directors
Consolidated financial statements
Notes to the Consolidated financial statements
Extract from the parent company Stora Enso Oyj financial statements
The Board of Directors’ Proposal for the distribution of dividend
Auditor’s report
Stora Enso in capital markets
Stora Enso as a taxpayer
Capacities by mill in 2019
Information for shareholders
The Group has elected to classify its equity investments in Pohjolan Voima shares and certain listed shares held by the Group, earlier classified as available-for-sale investments (AFS) under IAS 39, at fair value through other comprehensive income (FVTOCI) under IFRS 9. The gains and losses resulting from changes in the fair value of equity investments under FVTOCI are not recycled to the Income Statement upon impairment or disposal, with only dividend income being recognised in the Income Statement.
Under IFRS 9 the changes in the time value of currency options used as hedges of foreign currency sales will be recognised in other comprehensive income to the extent that they relate to the hedged items, and will be reclassified from equity to profit or loss in the same period or periods during which the expected future cash flows will affect the profit or loss. The change will reduce income statement volatility compared to IAS 39. The outstanding option time value as at the date of adoption amounted to EUR 1 million negative and was recognised as a transition adjustment to the opening balance of retained earnings for 2018.
Figures in the comparison periods have not been restated.
• IFRS 15 Revenue from Contracts with Customers. The Group has adopted IFRS 15 standard and related clarifications effective from 1 January 2018. The standard replaced IAS 18 Revenue and IAS 11 Construction Contracts standards and related interpretations. The new standard specifies how and when revenue is recognised. The standard is based on the principle that revenue is recognised when control of a good or service transfers to a customer. The Group has reviewed its performance obligations, main customer contracts for each division and evaluated the impact of IFRS 15 based on the amount and timing of revenue recognition.
In conclusion, the adoption of IFRS 15 has no significant impact on the substance of the principles applied by the Group to the amount and timing of revenue recognition. The revenue recognition principles and delivery terms applied by the Group remain generally unaltered.
The Group has adopted the modified retrospective application of IFRS 15 from 1 January 2018, without adjusting prior reporting periods. The new guidance is applied only to contracts that are not completed at the adoption date. No adjustment to the opening balance of retained earnings has been made as there are no changes in the timing of the revenue recognition. As from 1 January 2018 non-significant amounts of transport and freight sales and silviculture services previously presented under other operating income have been reclassified to the sales line in the consolidated income statement. In 2018 the amount of these items was EUR 56 million. The previous year’s figures have not been restated due to immateriality.
• Amendments to IFRS 2 Classification and Measurement of Share-based Payment Transactions effective from 1 January 2018 were adopted prospectively without restatement of comparative periods. Taxlaws or regulations may require the Group to withhold an amount for an employee’s tax obligation associated with a share-based payment and transfer that amount, normally in cash, to the tax authority on the employee’s behalf. To fulfil this obligation, the Group withholds the number of equity instruments equal to the monetary value of the
employee’s tax obligation from the total number of equity instruments that otherwise would have been issued to the employee upon vesting of the share-based payment. According to the IFRS 2 amendments, such transactions are to be classified in their entirety as equity-settled share-based payment transactions, even though the tax obligation is paid in cash on behalf of the employee. Resulting from the application of the amendments, the Group recognised EUR 9 million positive transition adjustment to the opening balance of retained earnings for 2018.
• Other amended IFRS standards and interpretations are not relevant to the Group.
Consolidation principlesThe Consolidated financial statements include the parent company, Stora Enso Oyj, and all companies controlled by the Group. Control is defined as when the Group:• has power over the investee,• is exposed, or has rights, to variable returns from its involvement
with the investee; and• has the ability to use its power to affect its returns.
If facts and circumstances indicate that there are changes to the three elements of control listed above the Group reassess whether or not it controls an investee. Acquired companies are accounted for under the purchase method whereby they are included in the consolidated financial statements from the date the control over the subsidiary is obtained, whereas, conversely, divestments are included up to the date when the control is lost. The principal subsidiaries and joint operations are listed in Note 30 Principal subsidiaries and joint operations.
All intercompany transactions, receivables, liabilities and unrealised profits, as well as intragroup profit distributions, are eliminated. Accounting policies for subsidiaries, joint arrangements and all equity accounted investments are adjusted where necessary to ensure consistency with the policies adopted by Stora Enso. Non-controlling interests are presented as a separate component of equity.
Associated companies over which Stora Enso exercises significant influence are accounted for using the equity method, which involves recognising the Group’s share of the equity accounted investment profit or loss for the year less any impaired goodwill in the consolidated income statement. These companies are undertakings in which the Group has significant influence, but which it does not control. Significant influence means the power to participate in the financial and operating policy decisions of the company without control or joint control over those policies. The most significant of such companies are listed in Note 13 Equity accounted investments.
The Group’s interest in an associated company is carried in the consolidated statement of financial position at an amount that reflects its share of the net assets of the associate together with any remaining goodwill upon acquisition. When the Group share of losses exceeds the carrying amount of an investment, the carrying amount is reduced to zero and any recognition of further losses ceases unless the Group is obliged to satisfy obligations of the investee that it has guaranteed or which it is otherwise committed to.
Joint control is the contractually agreed sharing of control of the joint arrangement, which exists only when decisions on relevant activities require the unanimous consent of the parties sharing control.
Joint operations are joint arrangements whereby the partners who have joint control of the arrangement have rights to the assets, and obligations for the liabilities, relating to the arrangement. A joint venture is a joint arrangement whereby the partners who have joint control of the arrangement have rights to the net assets of the joint arrangement.
The Group has two joint operations: Veracel and Montes del Plata. In relation to its interest in joint operations, as a joint operator, the Group recognises assets, liabilities, revenues and expenses using the line-by-line method.• Veracel is a jointly (50%/50%) owned company of Stora Enso and
Fibria located in Brazil. The pulp mill produces 1.2 million tonnes of bleached eucalyptus hard wood pulp per year and both owners are entitled to half of the mill’s output. The eucalyptus is sourced mostly from the company’s own forestry plantations. The mill commenced production in May 2005 and the group’s share of the pulp shipments are sent primarily to Stora Enso mills in Europe and China.
• Montes del Plata is a jointly (50%/50%) owned company of Stora Enso and Arauco located in Uruguay. The Montes del Plata Pulp Mill’s annual capacity is 1.4 million tonnes of bleached eucalyptus hard wood pulp and Stora Enso’s part, 700 000 tonnes, is sold entirely as market pulp. The eucalyptus is sourced mostly from the company’s own forestry plantations. The mill started in June 2014.
Revenue recognitionSales comprise products, raw materials and services less indirect sales tax and discounts, and are adjusted for exchange differences on sales in foreign currencies. Sales are recognised after Stora Enso has transferred the control of goods and services to a customer and the Group retains neither a continuing right to dispose of the goods, nor effective control of those goods; usually, this means that sales are recorded upon the delivery of goods to customers in accordance with the agreed terms of delivery.
Stora Enso’s terms of delivery are based on Incoterms 2010, which are the official rules for the interpretation of trade terms as issued by the International Chamber of Commerce (ICC). The main categories of the terms covering Group sales are:• “D” terms, under which the group is obliged to deliver the goods to
the buyer at the agreed place in the manner specified in the chosen rule, in which case the Point of Sale is the moment of delivery to the buyer.
• “C” terms, whereby the Group arranges and pays for the external carriage and certain other costs, though the Group ceases to be responsible for the goods once they have been handed over to the carrier in accordance with the relevant term. The Point of Sale is thus the handing over of the goods to the carrier contracted by the seller for the carriage to the agreed destination.
• “F” terms, being where the buyer arranges and pays for the carriage, thus the Point of Sale is the handing over of the goods to the carrier contracted by the buyer at the agreed point.
26
Sto
ra En
so 2
018: Fin
an
cia
ls – No
tes to the Co
nsolid
ated financial statem
ents – No
te 1
Strateg
yS
ustainability
FinancialsG
overnance
Annual Report 2018
Financials
Stora Enso in 2018
Report of the Board of Directors
Consolidated financial statements
Notes to the Consolidated financial statements
Extract from the parent company Stora Enso Oyj financial statements
The Board of Directors’ Proposal for the distribution of dividend
Auditor’s report
Stora Enso in capital markets
Stora Enso as a taxpayer
Capacities by mill in 2019
Information for shareholders

Where local rules may result in invoices being raised in advance of the above, the effect of this revenue advancement is quantified, and an adjustment is made for it.Stora Enso’s sales mainly comprise sales of products and the revenue is typically recognised at a point in time when Stora Enso transfers control of these products to a customer. Revenues from services are recognised over time once the service has been performed. More detailed information regarding Stora Enso’s principal activities from which the Group generates its revenue and disaggregation of revenue is presented in Note 3 Segment information.
Shipping and handling costsWhen Stora Enso is responsible for arranging transport for its sales, such costs are not billed separately but are included in revenue in the value of the goods billed to customers; the shipping costs incurred are shown in materials and services.
Foreign currency transactionsTransactions in foreign currencies are recorded at the rate of exchange prevailing at the transaction date, but at the end of the month foreign-currency-denominated receivables and liabilities are translated using the month-end exchange rate. Foreign exchange differences for operating items are recorded in the appropriate income statement account in the operating profit, and, for financial assets and liabilities, they are entered in the financial items of the consolidated income statement, except when deferred in equity as qualifying net investment hedges. Translation differences on non-monetary financial assets, such as equities classified at fair value through other comprehensive income (FVTOCI), are included in equity.
Foreign currency translationsThe Group operates internationally and is thus exposed to currency risks arising from exchange rate fluctuations on the value of its net investment in non-euro area foreign subsidiaries and equity accounted investments. The Income Statements of subsidiaries with functional and presentational currencies other than the euro are translated into the Group reporting currency using the average exchange rates for the year, whereas the statements of financial position of these subsidiaries are translated using the exchange rates at the reporting date. Exchange differences arising from the retranslation of net investments in foreign entities that are non-euro foreign subsidiaries, joint arrangements or equity accounted investments, and of financial instruments that are designated as and are hedges of such investments, are recorded directly in the shareholders’ equity in the cumulative translation adjustment (CTA), as shown in the consolidated statement of comprehensive income and Note 28 Cumulative translation adjustments and equity hedging. The cumulative translation differences of divestments and liquidations are combined with their gain or loss on disposal. The CTA is also recycled in the consolidated income statement upon the repayment of share capital, return of investment and any partial disposal of a business unit.
Future standard changes endorsed by the EU but not yet effective in 2018• IFRS 16 Leases. This standard replaces the current guidance in IAS 17 and related interpretations and is a significant change in accounting by lessees in particular. IFRS 16 requires lessees to recognize a lease liability reflecting future lease payments and a right-of-use (ROU) asset for virtually all lease contracts. In accordance IFRS 16, at inception of a contract, the Group assesses whether a contract is, or contains, a lease. A contract is, or contains, a lease if the contract conveys the right to control the use of an identified asset for a period of time in exchange for consideration. Amendment in lease definition have no material effect to the Group.
Stora Enso will adopt IFRS 16 on 1 January 2019, using the modified retrospective approach and therefore the comparative information will not be restated and continues to be reported under IAS 17 and IFRIC 4. Effect of initial application of IFRS 16 is recognised in balance sheet at 1 January 2019. At transition, lease liabilities are measured at the present value of the remaining lease payments, discounted at the Group’s incremental borrowing rates. ROU assets are measured an amount equal to the lease liability, adjusted by the amount of any prepaid or accrued lease payments. The Group allocates the consideration in the contract to each lease component and will separate non-lease components if these are identifiable.
ROU assets are initially measured at cost, which comprises the initial amount of the lease liability adjusted mainly for lease payments made at or before the commencement date. The ROU assets are subsequently depreciated using the straight-line method from the commencement date to the earlier of the end of the useful life of the ROU asset or the end of the lease term. In addition, the ROU asset is adjusted for certain remeasurements of the lease liability.
Lease liabilities are initially measured at the present value of the lease payments that are not paid at the commencement date, discounted using the Group’s incremental borrowing rates. The lease liabilities are measured at amortised cost using the effective interest method. Lease liabilities are remeasured mainly when there is a change in future lease payments arising from a change in an index or rate, or if there is a change in the Group’s assessment whether it will exercise an extension option. When lease liability is remeasured, a corresponding adjustment is generally made to the carrying amount of the ROU asset.
The Group has elected not to recognise ROU assets and lease liabilities for short-term leases that have a lease term of 12 months or less and leases of low value assets. The Group has also applied the exemption not to recognise contracts which are ending in 2019. The Group has defined low value asset exemption to include leases in which the underlying asset is not material to Stora Enso. The assessment of whether the underlying asset is material and is within the scope or excluded from the recognition requirements of IFRS 16 is based on the concept of materiality in the Conceptual Framework and IAS 1. Leases of low value assets are mainly including IT and office equipment, certain vehicles and machinery and other low value items. The Group recognises the lease payments associated with these leases as an expense on a straight-line basis over the lease term.
Undiscounted operating lease commitments at the end of 2018 are EUR 731 million. In accordance with the current assessment of the impact of implementing IFRS 16 indicates that a lease liability in the range of EUR 500-550 million will be recognised. It is expected that operating profit (IFRS) / operational EBIT will somewhat increase since the interest component of leasing payments will be presented in financial expenses. Operational EBITDA will also increase, since both depreciation and interest expenses will be presented below EBITDA. Impact on EPS is not expected to be material. Operating cash flow will increase and financing cash flow will decrease since most of the lease payments are shown in financing cash flow, with no additional impact to total cash flow.
In addition certain land use contracts, amounting to EUR 76 million, before IFRS 16 transition accounted as intangible assets will be classified on transition to IFRS 16 as leases. All the liabilities related to the arrangements have already been settled in previous periods and therefore there is no effect on the lease liability or income statement.
• Other amended IFRS standards and interpretations are not relevant to the Group.
Future standard changes not yet effective and not yet endorsed by the EU in 2018• Amendments to IAS 28: Long-term Interests in Associates and
Joint Ventures. These amendments clarify that an entity should apply IFRS 9 Financial Instruments to long-term interests in an associate or joint venture that form part of the net investment in the associate or joint venture but to which the equity method is not applied. The effective date for these amendments is 1 January 2019. The amendment does not have a significant effect on the Group’s financial statement.
• Amendments to IAS 19: Plan Amendment, Curtailment or Settlement. The amendments clarify the accounting when a plan amendment, curtailment or settlement occurs. The amendments require a company to use the updated assumptions from this remeasurement to determine current service cost and net interest for the remainder of the reporting period after the change to the plan. Until now, IAS 19 did not specify how to determine these expenses for the period after the change to the plan. The effective date for these amendments is 1 January 2019. The amendments are not expected to be material for the Group.
• Amendments to IFRS 3 Business combinations. The amendments will help companies determine whether an acquisition made is of a business or a group of assets. The amended definition emphasises that the output of a business is to provide goods and services to customers, whereas the previous definition focused on returns in the form of dividends, lower costs or other economic benefits to investors and others. The effective date for these amendments is 1 January 2019. The amendments are not expected to have material effect for the Group.
• Amendments to References to the Conceptual Framework in IFRS Standards. The revised Conceptual Framework includes: a new chapter on measurement; guidance on reporting financial
27
Sto
ra En
so 2
018: Fin
an
cia
ls – No
tes to the Co
nsolid
ated financial statem
ents – No
te 1
Strateg
yS
ustainability
FinancialsG
overnance
Annual Report 2018
Financials
Stora Enso in 2018
Report of the Board of Directors
Consolidated financial statements
Notes to the Consolidated financial statements
Extract from the parent company Stora Enso Oyj financial statements
The Board of Directors’ Proposal for the distribution of dividend
Auditor’s report
Stora Enso in capital markets
Stora Enso as a taxpayer
Capacities by mill in 2019
Information for shareholders
performance; improved definitions and guidance—in particular the definition of a liability; and clarifications in important areas, such as the roles of stewardship, prudence and measurement uncertainty in financial reporting. The effective date for these amendments is 1 January 2020. The amendments are not expected to have material effect for the Group.
• Amendments to IAS 1 and IAS 8: Definition of Material. Amendments will clarify the definition of material and to align the definition used in the Conceptual Framework and the standards themselves. The effective date for these amendments is 1 January 2020. The Group is assessing the impact of these amendments.
• IFRS 17 Insurance Contracts: This standard replaces IFRS 4, which currently permits a wide variety of practices in accounting for insurance contracts. The effective date for these amendments is 1 January 2021. The standard is not relevant for the Group.
• Other published standard changes or interpretations are not expected to have a significant effect on the Group’s consolidated financial statements or disclosures.
Note 2 Critical accounting estimates and judgements
Use of estimatesThe preparation of consolidated financial statements conforming to IFRS requires management to make estimates and assumptions that affect the reported amounts of assets and liabilities, as well as the disclosure of contingent assets and liabilities at the dates of the financial statements and the reported amounts of revenues and expenses during the period. The estimates are based on historical experience and various other assumptions that are believed to be reasonable, though actual results and timing could differ from the estimates. Management believes that the accounting policies below represent those matters requiring the exercise of judgement where a different opinion could result in the greatest changes to reported results.
Intangible assets and property, plant and equipmentFor material intangible assets and property, plant and equipment in an acquisition, an external advisor makes a fair valuation of the acquired intangible assets and property, plant and equipment and assists in determining their remaining useful lives. Management believes that the assigned values and useful lives, as well as the underlying assumptions, are reasonable, though different assumptions and assigned lives could have a significant impact on the reported amounts.
The carrying amounts of Intangible assets and property, plant and equipment are reviewed at each reporting date or whenever events or changes in circumstances indicate that the carrying amount of an asset may be impaired. The recoverable amount of an asset is estimated as the higher of fair value less the cost of disposal and the value in use, with an impairment charge recognised whenever the carrying amount exceeds the recoverable amount. The value in use is calculated using a discounted cash flow model which is most
sensitive to the discount rate as well as the expected future cash flows. The key assumptions used in the impairment testing, including sensitivity analysis, are explained further in Note 10 Depreciation, amortisation and impairment charges.
GoodwillGoodwill is tested per Cash Generating Unit (CGU) or by group of CGUs at least on an annual basis and any impairment is measured using the discounted cash flow valuation method. This method uses future projections of cash flows from each of the reporting units in a CGU or group of CGUs and includes, among other estimates, projections of future product pricing, production levels, product costs, market supply and demand, projected maintenance capital expenditures and an assumption of the weighted average cost of capital. A pre-tax discount rate used for the net present value calculation of projected cash flows reflects the weighted average cost of capital.
The Group has evaluated the most sensitive estimates which when changed could have a material effect on the fair value of the assets or goodwill and therefore could lead to an impairment. These estimates are expected sales prices of the products, expected operating costs and discount rate. The key assumptions used in the impairment testing, including sensitivity analysis, are explained further in Note 10 Depreciation, amortisation and impairment charges.
Control assessment of joint operations and associatesNote 1 Accounting principles describes Veracel and Montes del Plata as joint operations. In both companies Stora Enso’s ownership is 50%. The interpretations as joint operations are based on shareholders’ agreements which give Stora Enso rights to a share of the returns and make the Group liable indirectly for the liabilities, as our ability to pay for the pulp is used to finance the debts. Joint operations are consolidated with the proportionate line-by-line method.
The forest holding companies Bergvik Skog Ab and Tornator Oyj are equity accounted investments. Stora Enso does not control the companies alone or jointly with other parties and thus retains its significant minority interest as equity accounted investments. Equity accounted investments are accounted for using the equity method. These companies are presented in Note 13 Equity accounted investments.
Fair value of financial instrumentsWhere the fair value of financial assets and liabilities cannot be derived directly from publicly quoted market prices, other valuation techniques such as discounted cash flow models, transaction multiples, the Black and Scholes model and the Gordon model are employed. The key judgements include future cash flows, credit risk, volatility and changes in assumptions about these factors which could affect the reported fair value of the financial instruments. Investments in debt and equity instruments of unlisted entities, such as Pohjolan Voima Oy (PVO), represent a significant portion of the group’s assets and require significant management judgement, as explained in
more detail in Notes 14 Equity instruments and 24 Financial risk management.
Income taxesTax assets and liabilities are reviewed on a periodic basis and balances are adjusted appropriately. Management considers that adequate provision has been made for future tax consequences based on the current facts, circumstances and tax law. However, should any tax positions be challenged and not prevail, different outcomes could result and have a significant impact on the amounts reported in the consolidated financial statements.
Post-retirement benefitsThe determination of the Group pension obligation and expense is subject to the selection of certain assumptions used by actuaries in calculating such amounts, including, among others, the discount rate, the annual rate of increase in future compensation levels and estimated lifespans. Amounts charged in the Income statement are determined by independent actuaries, however, where actual results differ from the initial estimates, together with the effect of any change in assumptions or other factors, these differences are recorded directly in equity, as disclosed in the statement of comprehensive income. See Note 20 Post-employment benefits for detailed information on the assumptions used in the pension liability calculations.
Biological assetsThe Group has biological assets in equity accounted investment companies, joint operation companies and in subsidiaries. Biological assets, in the form of standing trees, are accounted for under IAS 41, which requires that the assets are measured at fair value less the costs to sell them. Fair value is determined using discounted cash flows from continuous operations based on sustainable forest management plans taking into account the growth potential of one cycle. These discounted cash flows require estimates of growth, harvest, sales price and costs, and changes in these premises are included in the consolidated income statement, for directly owned interests and for joint operations, on the line for change in Net Value of Biological assets. For those assets shown in the Consolidated statement of financial position of equity accounted investments, changes are included on the line for Share of results of equity accounted investments. It is therefore important that the Group’s, joint operation companies’ and the equity accounted investments’ management makes appropriate estimates of future price levels and trends for sales and costs, and undertakes regular surveys of the forest to establish the volumes of wood available for cutting and their current growth rates. See Note 12 Biological assets for more detailed information.
Environmental provisionsThe Group has made provisions for known environmental liabilities where legal or constructive obligation exists, based on management’s best estimate of the remediation costs. There is some uncertainty regarding the timing and amount of these costs and therefore the final liability could differ significantly from the original estimate.
28
Sto
ra En
so 2
018: Fin
an
cia
ls – No
tes to the Co
nsolid
ated financial statem
ents – No
te 2
Strateg
yS
ustainability
FinancialsG
overnance
Annual Report 2018
Financials
Stora Enso in 2018
Report of the Board of Directors
Consolidated financial statements
Notes to the Consolidated financial statements
Extract from the parent company Stora Enso Oyj financial statements
The Board of Directors’ Proposal for the distribution of dividend
Auditor’s report
Stora Enso in capital markets
Stora Enso as a taxpayer
Capacities by mill in 2019
Information for shareholders
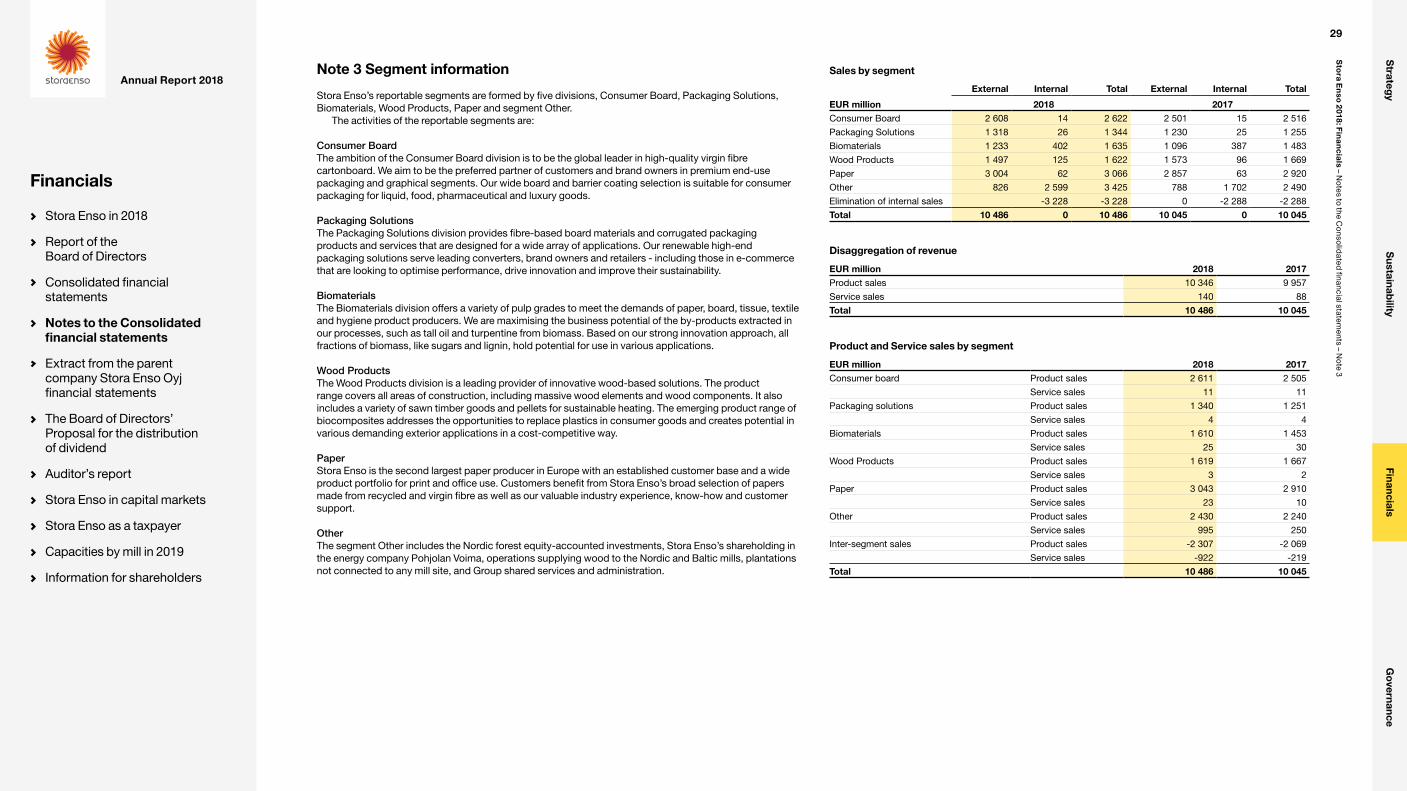
Note 3 Segment information
Stora Enso’s reportable segments are formed by five divisions, Consumer Board, Packaging Solutions, Biomaterials, Wood Products, Paper and segment Other.
The activities of the reportable segments are:
Consumer BoardThe ambition of the Consumer Board division is to be the global leader in high-quality virgin fibre cartonboard. We aim to be the preferred partner of customers and brand owners in premium end-use packaging and graphical segments. Our wide board and barrier coating selection is suitable for consumer packaging for liquid, food, pharmaceutical and luxury goods.
Packaging SolutionsThe Packaging Solutions division provides fibre-based board materials and corrugated packaging products and services that are designed for a wide array of applications. Our renewable high-end packaging solutions serve leading converters, brand owners and retailers - including those in e-commerce that are looking to optimise performance, drive innovation and improve their sustainability.
BiomaterialsThe Biomaterials division offers a variety of pulp grades to meet the demands of paper, board, tissue, textile and hygiene product producers. We are maximising the business potential of the by-products extracted in our processes, such as tall oil and turpentine from biomass. Based on our strong innovation approach, all fractions of biomass, like sugars and lignin, hold potential for use in various applications.
Wood ProductsThe Wood Products division is a leading provider of innovative wood-based solutions. The product range covers all areas of construction, including massive wood elements and wood components. It also includes a variety of sawn timber goods and pellets for sustainable heating. The emerging product range of biocomposites addresses the opportunities to replace plastics in consumer goods and creates potential in various demanding exterior applications in a cost-competitive way.
PaperStora Enso is the second largest paper producer in Europe with an established customer base and a wide product portfolio for print and office use. Customers benefit from Stora Enso’s broad selection of papers made from recycled and virgin fibre as well as our valuable industry experience, know-how and customer support.
OtherThe segment Other includes the Nordic forest equity-accounted investments, Stora Enso’s shareholding in the energy company Pohjolan Voima, operations supplying wood to the Nordic and Baltic mills, plantations not connected to any mill site, and Group shared services and administration.
Sales by segment
External Internal Total External Internal Total
EUR million 2018 2017Consumer Board 2 608 14 2 622 2 501 15 2 516
Packaging Solutions 1 318 26 1 344 1 230 25 1 255
Biomaterials 1 233 402 1 635 1 096 387 1 483
Wood Products 1 497 125 1 622 1 573 96 1 669
Paper 3 004 62 3 066 2 857 63 2 920
Other 826 2 599 3 425 788 1 702 2 490
Elimination of internal sales -3 228 -3 228 0 -2 288 -2 288
Total 10 486 0 10 486 10 045 0 10 045
Disaggregation of revenue
EUR million 2018 2017Product sales 10 346 9 957
Service sales 140 88
Total 10 486 10 045
Product and Service sales by segment
EUR million 2018 2017Consumer board Product sales 2 611 2 505
Service sales 11 11
Packaging solutions Product sales 1 340 1 251
Service sales 4 4
Biomaterials Product sales 1 610 1 453
Service sales 25 30
Wood Products Product sales 1 619 1 667
Service sales 3 2
Paper Product sales 3 043 2 910
Service sales 23 10
Other Product sales 2 430 2 240
Service sales 995 250
Inter-segment sales Product sales -2 307 -2 069
Service sales -922 -219
Total 10 486 10 045
29
Sto
ra En
so 2
018: Fin
an
cia
ls – No
tes to the Co
nsolid
ated financial statem
ents – No
te 3
Strateg
yS
ustainability
FinancialsG
overnance
Annual Report 2018
Financials
Stora Enso in 2018
Report of the Board of Directors
Consolidated financial statements
Notes to the Consolidated financial statements
Extract from the parent company Stora Enso Oyj financial statements
The Board of Directors’ Proposal for the distribution of dividend
Auditor’s report
Stora Enso in capital markets
Stora Enso as a taxpayer
Capacities by mill in 2019
Information for shareholders
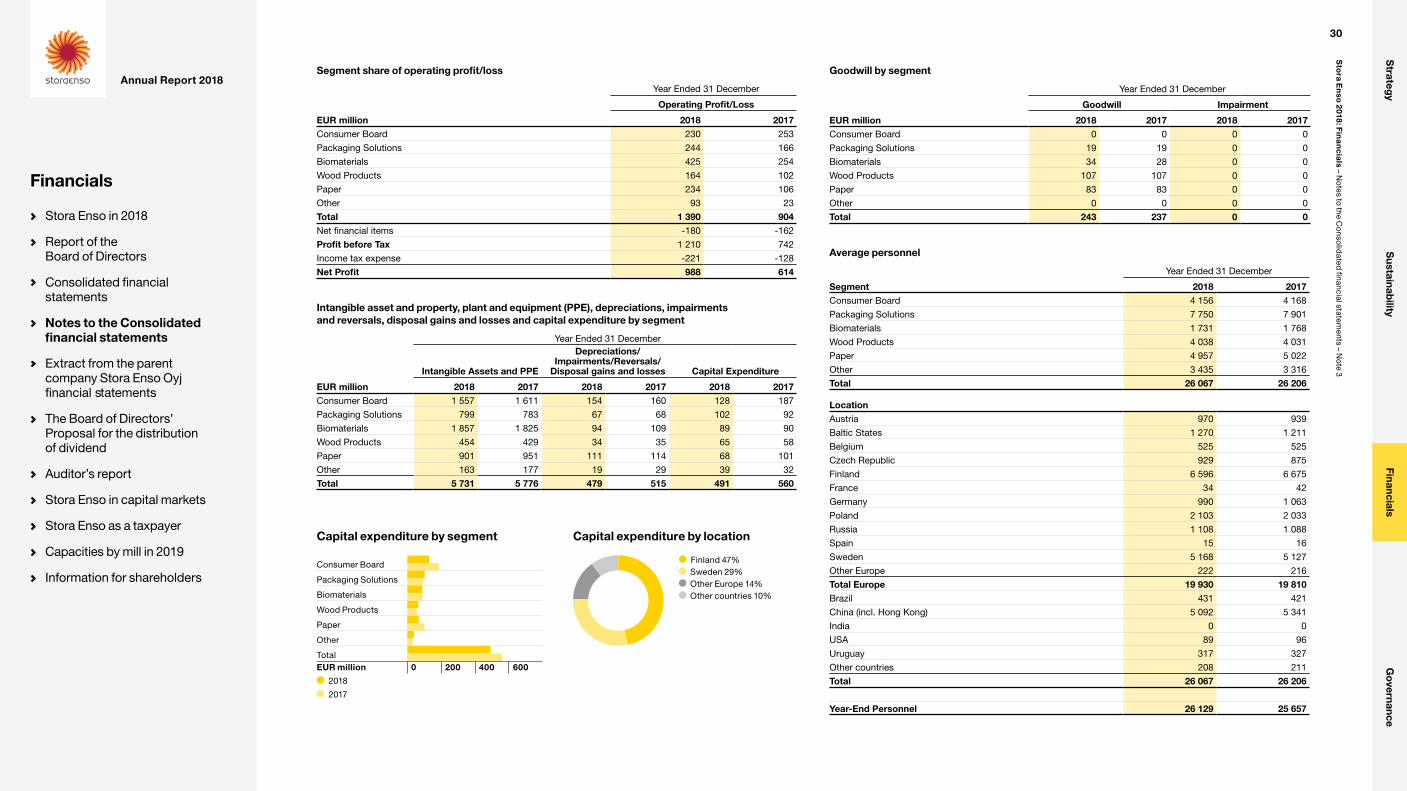
Segment share of operating profit/loss
Year Ended 31 December
Operating Profit/Loss
EUR million 2018 2017Consumer Board 230 253
Packaging Solutions 244 166
Biomaterials 425 254
Wood Products 164 102
Paper 234 106
Other 93 23
Total 1 390 904Net financial items -180 -162
Profit before Tax 1 210 742
Income tax expense -221 -128
Net Profit 988 614
Intangible asset and property, plant and equipment (PPE), depreciations, impairments and reversals, disposal gains and losses and capital expenditure by segment
Year Ended 31 December
Intangible Assets and PPE
Depreciations/Impairments/Reversals/
Disposal gains and losses Capital Expenditure
EUR million 2018 2017 2018 2017 2018 2017Consumer Board 1 557 1 611 154 160 128 187
Packaging Solutions 799 783 67 68 102 92
Biomaterials 1 857 1 825 94 109 89 90
Wood Products 454 429 34 35 65 58
Paper 901 951 111 114 68 101
Other 163 177 19 29 39 32
Total 5 731 5 776 479 515 491 560
Goodwill by segment
Year Ended 31 December
Goodwill Impairment
EUR million 2018 2017 2018 2017Consumer Board 0 0 0 0
Packaging Solutions 19 19 0 0
Biomaterials 34 28 0 0
Wood Products 107 107 0 0
Paper 83 83 0 0
Other 0 0 0 0
Total 243 237 0 0
Average personnel
Year Ended 31 December
Segment 2018 2017Consumer Board 4 156 4 168
Packaging Solutions 7 750 7 901
Biomaterials 1 731 1 768
Wood Products 4 038 4 031
Paper 4 957 5 022
Other 3 435 3 316
Total 26 067 26 206
LocationAustria 970 939
Baltic States 1 270 1 211
Belgium 525 525
Czech Republic 929 875
Finland 6 596 6 675
France 34 42
Germany 990 1 063
Poland 2 103 2 033
Russia 1 108 1 088
Spain 15 16
Sweden 5 168 5 127
Other Europe 222 216
Total Europe 19 930 19 810Brazil 431 421
China (incl. Hong Kong) 5 092 5 341
India 0 0
USA 89 96
Uruguay 317 327
Other countries 208 211
Total 26 067 26 206
Year-End Personnel 26 129 25 657
Capital expenditure by segment
Consumer Board
Packaging Solutions
Biomaterials
Wood Products
Paper
Other
TotalEUR million 0 200 400 600
2018
2017
Capital expenditure by location
Finland 47% Sweden 29% Other Europe 14% Other countries 10%
30
Sto
ra En
so 2
018: Fin
an
cia
ls – No
tes to the Co
nsolid
ated financial statem
ents – No
te 3
Strateg
yS
ustainability
FinancialsG
overnance
Annual Report 2018
Financials
Stora Enso in 2018
Report of the Board of Directors
Consolidated financial statements
Notes to the Consolidated financial statements
Extract from the parent company Stora Enso Oyj financial statements
The Board of Directors’ Proposal for the distribution of dividend
Auditor’s report
Stora Enso in capital markets
Stora Enso as a taxpayer
Capacities by mill in 2019
Information for shareholders
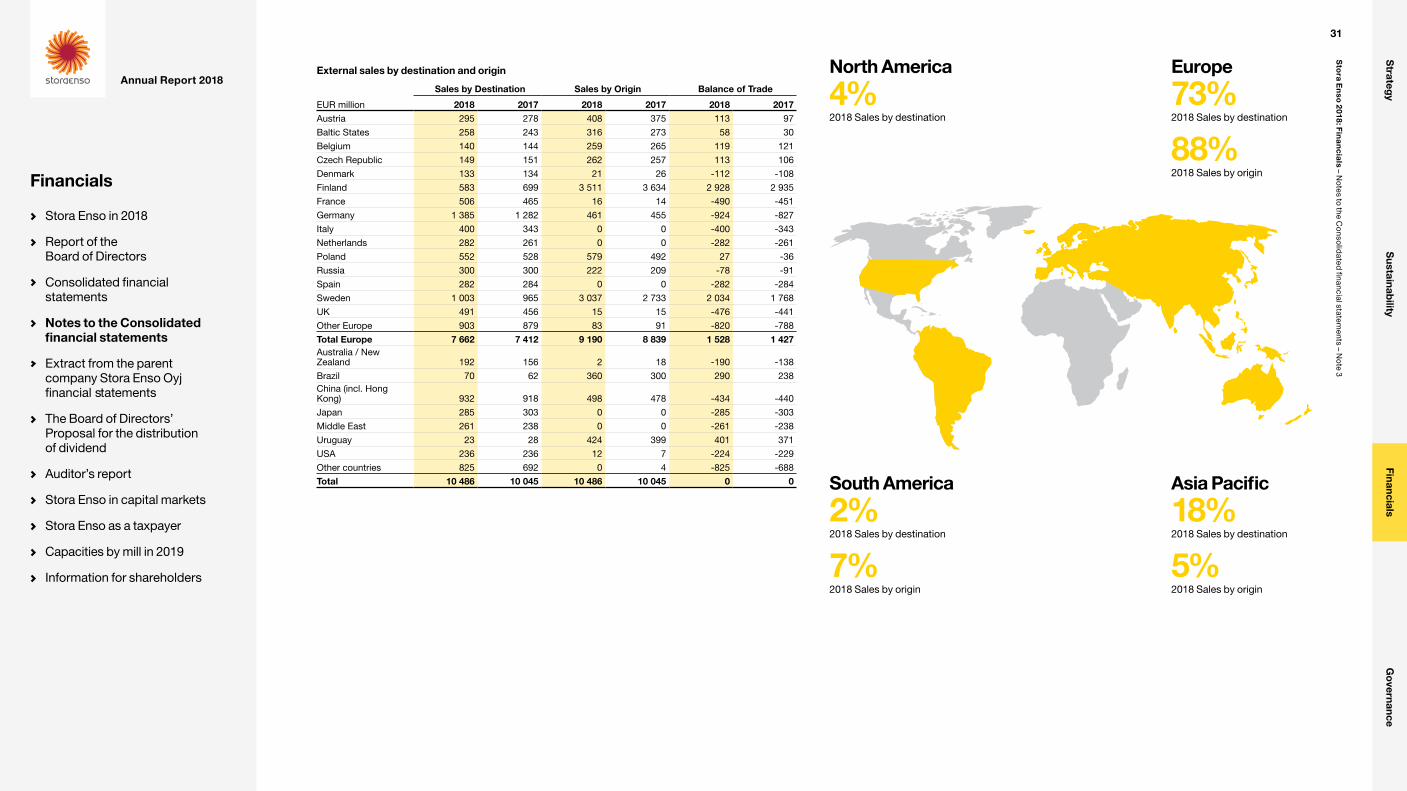
External sales by destination and origin
Sales by Destination Sales by Origin Balance of Trade
EUR million 2018 2017 2018 2017 2018 2017Austria 295 278 408 375 113 97
Baltic States 258 243 316 273 58 30
Belgium 140 144 259 265 119 121
Czech Republic 149 151 262 257 113 106
Denmark 133 134 21 26 -112 -108
Finland 583 699 3 511 3 634 2 928 2 935
France 506 465 16 14 -490 -451
Germany 1 385 1 282 461 455 -924 -827
Italy 400 343 0 0 -400 -343
Netherlands 282 261 0 0 -282 -261
Poland 552 528 579 492 27 -36
Russia 300 300 222 209 -78 -91
Spain 282 284 0 0 -282 -284
Sweden 1 003 965 3 037 2 733 2 034 1 768
UK 491 456 15 15 -476 -441
Other Europe 903 879 83 91 -820 -788
Total Europe 7 662 7 412 9 190 8 839 1 528 1 427Australia / New Zealand 192 156 2 18 -190 -138
Brazil 70 62 360 300 290 238China (incl. Hong Kong) 932 918 498 478 -434 -440
Japan 285 303 0 0 -285 -303
Middle East 261 238 0 0 -261 -238
Uruguay 23 28 424 399 401 371
USA 236 236 12 7 -224 -229
Other countries 825 692 0 4 -825 -688
Total 10 486 10 045 10 486 10 045 0 0 Asia Pacific
18%2018 Sales by destination
5%2018 Sales by origin
Europe
73%2018 Sales by destination
88%2018 Sales by origin
South America
2%2018 Sales by destination
7%2018 Sales by origin
North America
4%2018 Sales by destination
31
Sto
ra En
so 2
018: Fin
an
cia
ls – No
tes to the Co
nsolid
ated financial statem
ents – No
te 3
Strateg
yS
ustainability
FinancialsG
overnance
Annual Report 2018
Financials
Stora Enso in 2018
Report of the Board of Directors
Consolidated financial statements
Notes to the Consolidated financial statements
Extract from the parent company Stora Enso Oyj financial statements
The Board of Directors’ Proposal for the distribution of dividend
Auditor’s report
Stora Enso in capital markets
Stora Enso as a taxpayer
Capacities by mill in 2019
Information for shareholders
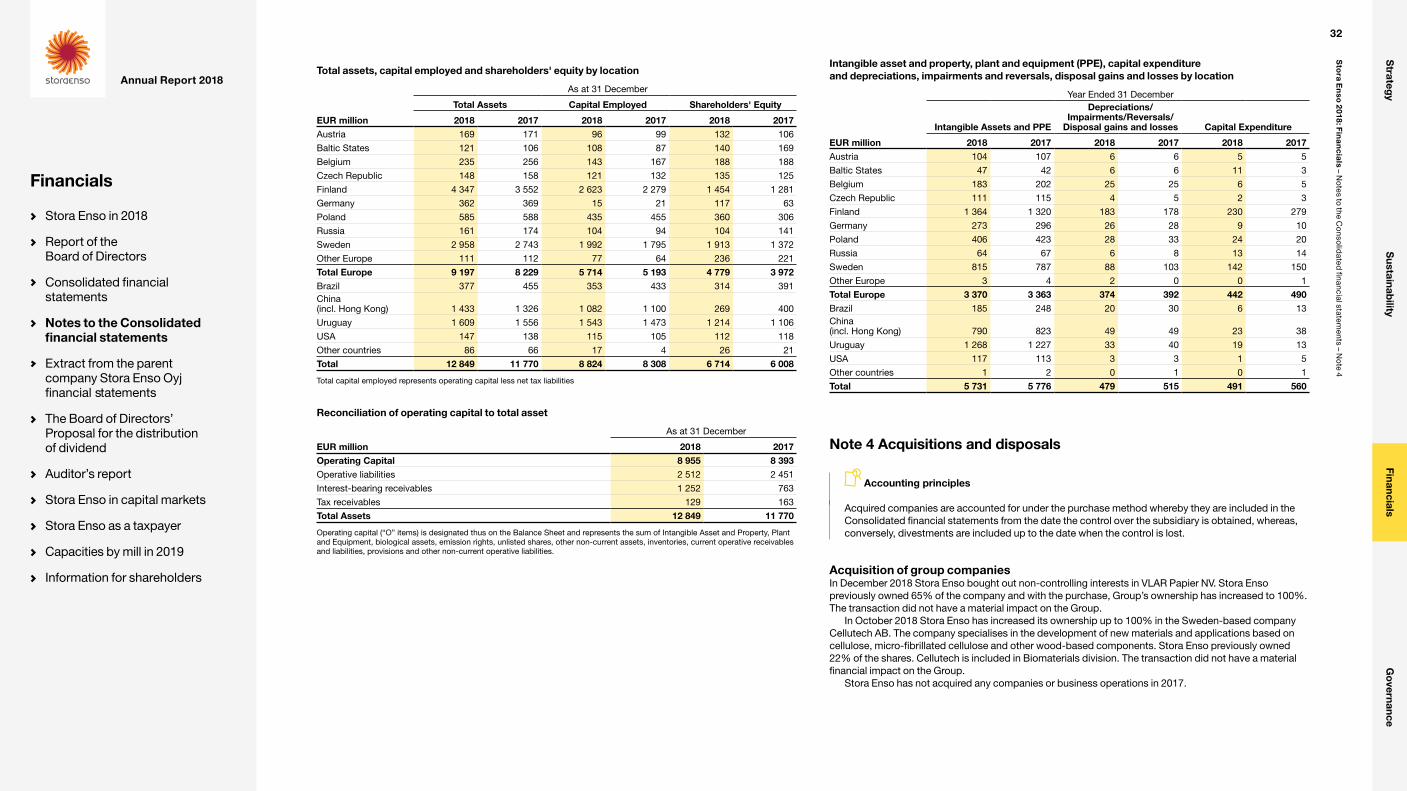
Total assets, capital employed and shareholders' equity by location
As at 31 December
Total Assets Capital Employed Shareholders' Equity
EUR million 2018 2017 2018 2017 2018 2017Austria 169 171 96 99 132 106
Baltic States 121 106 108 87 140 169
Belgium 235 256 143 167 188 188
Czech Republic 148 158 121 132 135 125
Finland 4 347 3 552 2 623 2 279 1 454 1 281
Germany 362 369 15 21 117 63
Poland 585 588 435 455 360 306
Russia 161 174 104 94 104 141
Sweden 2 958 2 743 1 992 1 795 1 913 1 372
Other Europe 111 112 77 64 236 221
Total Europe 9 197 8 229 5 714 5 193 4 779 3 972Brazil 377 455 353 433 314 391China (incl. Hong Kong) 1 433 1 326 1 082 1 100 269 400
Uruguay 1 609 1 556 1 543 1 473 1 214 1 106
USA 147 138 115 105 112 118
Other countries 86 66 17 4 26 21
Total 12 849 11 770 8 824 8 308 6 714 6 008
Total capital employed represents operating capital less net tax liabilities
Reconciliation of operating capital to total asset
As at 31 December
EUR million 2018 2017Operating Capital 8 955 8 393Operative liabilities 2 512 2 451
Interest-bearing receivables 1 252 763
Tax receivables 129 163
Total Assets 12 849 11 770
Operating capital (“O” items) is designated thus on the Balance Sheet and represents the sum of Intangible Asset and Property, Plant and Equipment, biological assets, emission rights, unlisted shares, other non-current assets, inventories, current operative receivables and liabilities, provisions and other non-current operative liabilities.
Intangible asset and property, plant and equipment (PPE), capital expenditure and depreciations, impairments and reversals, disposal gains and losses by location
Year Ended 31 December
Intangible Assets and PPE
Depreciations/Impairments/Reversals/
Disposal gains and losses Capital Expenditure
EUR million 2018 2017 2018 2017 2018 2017Austria 104 107 6 6 5 5
Baltic States 47 42 6 6 11 3
Belgium 183 202 25 25 6 5
Czech Republic 111 115 4 5 2 3
Finland 1 364 1 320 183 178 230 279
Germany 273 296 26 28 9 10
Poland 406 423 28 33 24 20
Russia 64 67 6 8 13 14
Sweden 815 787 88 103 142 150
Other Europe 3 4 2 0 0 1
Total Europe 3 370 3 363 374 392 442 490Brazil 185 248 20 30 6 13China (incl. Hong Kong) 790 823 49 49 23 38
Uruguay 1 268 1 227 33 40 19 13
USA 117 113 3 3 1 5
Other countries 1 2 0 1 0 1
Total 5 731 5 776 479 515 491 560
Note 4 Acquisitions and disposals
Accounting principles
Acquired companies are accounted for under the purchase method whereby they are included in the Consolidated financial statements from the date the control over the subsidiary is obtained, whereas, conversely, divestments are included up to the date when the control is lost.
Acquisition of group companiesIn December 2018 Stora Enso bought out non-controlling interests in VLAR Papier NV. Stora Enso previously owned 65% of the company and with the purchase, Group’s ownership has increased to 100%. The transaction did not have a material impact on the Group.
In October 2018 Stora Enso has increased its ownership up to 100% in the Sweden-based company Cellutech AB. The company specialises in the development of new materials and applications based on cellulose, micro-fibrillated cellulose and other wood-based components. Stora Enso previously owned 22% of the shares. Cellutech is included in Biomaterials division. The transaction did not have a material financial impact on the Group.
Stora Enso has not acquired any companies or business operations in 2017.
32
Sto
ra En
so 2
018: Fin
an
cia
ls – No
tes to the Co
nsolid
ated financial statem
ents – No
te 4
Strateg
yS
ustainability
FinancialsG
overnance
Annual Report 2018
Financials
Stora Enso in 2018
Report of the Board of Directors
Consolidated financial statements
Notes to the Consolidated financial statements
Extract from the parent company Stora Enso Oyj financial statements
The Board of Directors’ Proposal for the distribution of dividend
Auditor’s report
Stora Enso in capital markets
Stora Enso as a taxpayer
Capacities by mill in 2019
Information for shareholders

Disposal of group companies and business operations
Year Ended 31 December
EUR million 2018 2017Net Assets SoldCash and cash equivalents 2 7
Intangible assets and Property, plant and equipment 38 3
Working capital -2 1
Interest-bearing assets and liabilities 0 -1
Non-controlling interest -1 0
Net Assets in Divested Companies and Businesses 38 10Total Disposal Consideration 44 1CTA release -27 0
Transaction costs -1 0
Total Net Gain/loss -22 -9
Attributable to the owners of the parent -22 -9Attributable to the non-controlling interest holders 0 0
In December 2018 Stora Enso divested 100% of the shares of its Swedish subsidiary June Emballage AB to its current management. June Emballage is a manufacturer specialized in small-batch custom-made transport packaging in corrugated board and was part of the Packaging Solutions division. The transaction did not have a material impact on the Group.
On 8 August 2018, Stora Enso disposed the shares in Dongguan E-creative Industrial Co. Ltd to Dongguan An Shen Investment Co. Ltd. Stora Enso previously had 51% ownership of the company. The transaction did not have a material impact on the Group.
On 28 March 2018, Stora Enso signed an agreement do divest of its entire 100% shareholding in the wood supply company in Rio Grande do Sul, Brazil to Copa Florestal III FIP Multiestrategia. The final consideration for the divestment of the shares was EUR 30 million. In 2017 the Group recorded writedowns in fixed assets amounting to EUR 5 million in order to reduce the value of the net assets disposed to the consideration. The disposal was completed in the second quarter of 2018. The transaction resulted in a loss of EUR 28 million, due to cumulative translation adjustment (CTA) released from equity through profit and loss at closing. Rio Grande do Sul was part of the segment Other.
In November 2017, Stora Enso signed an agreement to divest its sheeting centre business in Baienfurt, Germany to Pyroll. The sheeting centre operations started in April 2009 and was 100% owned by Stora Enso. The transaction was completed in beginning of January 2018. The transaction did not have a material impact on the Group.
On 1 November 2017, Stora Enso sold 100% of its shares in the Finnish Puumerkki Oy and the Estonian Puumerkki AS to Mimir Invest AB, a global investment firm. Puumerkki is a specialised wholesaler of wooden building materials. The transaction resulted in a loss of EUR 8 million. The divestment supports Stora Enso’s Wood Products division in focusing on its growth strategy and further building on the strength of its premium portfolio of products and services.
On 5 July 2017, Stora Enso signed an agreement to divest the business and assets of its Swedish subsidiary Stora Enso Re-board AB, a producer of rigid paperboard for expositions and displays, to Culas AB. The transaction did not have a material impact on the Group.
On 24 March 2017, Stora Enso disposed of the shares of the real estate company Sunilan Kesäniemi Oy. The transaction did not have a material impact on the Group.
On 2 January 2017, Stora Enso divested its Finnish subsidiary Formeca Oy, a provider of high-quality machines for automated packaging lines, to Amitec Oy, a specialised engineering and machine construction company based in Finland. The transaction did not have a material impact on the Group.
Note 5 Other operating income and expense
Accounting principles
Research and developmentResearch costs are expensed as incurred in other operating expenses in the Consolidated Income Statement. Development costs are also expensed as incurred unless it is probable that future economic benefits will flow to the Group, in which case they are capitalised as intangible assets and depreciated over the period of the income streams.
Government grantsGovernment grants relating to the purchase of property, plant and equipment are deducted from the carrying value of the asset, while the net cost are capitalised. Other government grants are recognised as income on a systematic basis over the periods necessary to match them with the related costs which they were intended to compensate.
Emission rights and tradingThe Group’s participation in the European Emissions Trading Scheme, in which it has been allocated allowances to emit a fixed tonnage of carbon dioxide over a fixed period of time, gives rise to an intangible asset for the allowances, a government grant and a liability for the obligation to deliver allowances equal to the emissions that have been made during the compliance period. Emission allowances recorded as intangible assets are recognised when the Group is able to exercise control and are measured at level 1 fair value at the date of initial recognition. If the market value for the emission allowances falls significantly below the carrying amount, and the decrease is considered permanent. At that point an impairment charge is booked for allowances which the Group will not use internally. The liability to deliver allowances is recognised based on actual emissions; this liability will be settled using allowances on hand and measured at the carrying amount of those allowances, with any excess emissions measured at the market value of the allowances at the period end.
In the Consolidated Income Statement, the Group will expense emissions made at the fair value of the rights at their grant date, under materials and services, together with purchased emission rights at their purchase price. Such costs will be offset under other operating income by the income from the original grant of the rights used at their fair value at the grant date, together with income from the release or sale of surplus rights. The Consolidated Income Statement will thus be neutral in respect of all rights consumed that were within the original grant. Any net effect represents the costs of purchasing additional rights to cover excess emissions, or the sale of unused rights in the case that the realised emissions are below the allowances received free of charge or the impairment of allowances are not required for internal use.
Green certificatesStora Enso is part of the local green energy production system which entitles selected mills in Sweden, Belgium and Poland to receive green certificates based on megawatt hours of green energy produced. Green certificates represent the environmental value of renewable energy generated. The certificates can be traded separately from the energy produced. Several countries use green certificates as a mean to make the support of green electricity generation closer to a market economy instead of more bureaucratic investment support and feed-in tariffs. The certificates are typically received free of charge and they can be traded in the local market to offset part of the production costs. Green certificates are often sold to electricity distributors which have a quota obligation to buy a certain percentage of their electricity from renewable sources. Green certificates are evidencing that the electricity has been produced from sustainable sources.
All certificates received are recognized at grant date market value only in the Balance Sheet. Certificates are posted to prepaid costs and accrued income and a corresponding liability is entered into accrued liabilities and deferred income. As such the fluctuation in market prices does not have impact on the Income statement. The income is recognised only when the certificate is sold.
33
Sto
ra En
so 2
018: Fin
an
cia
ls – No
tes to the Co
nsolid
ated financial statem
ents – No
te 5
Strateg
yS
ustainability
FinancialsG
overnance
Annual Report 2018
Financials
Stora Enso in 2018
Report of the Board of Directors
Consolidated financial statements
Notes to the Consolidated financial statements
Extract from the parent company Stora Enso Oyj financial statements
The Board of Directors’ Proposal for the distribution of dividend
Auditor’s report
Stora Enso in capital markets
Stora Enso as a taxpayer
Capacities by mill in 2019
Information for shareholders

Other Operating Income and expense
Year Ended 31 December
EUR million 2018 2017Other Operating IncomeEmission rights granted and disposal gains 32 13
Sale of Green Certificates 32 18Capital gains on sale of Intangible Assets and Property, Plant and Equipment 4 4
Dividend and gain on sale of unlisted shares 0 3
Insurance compensation 4 25
Rent and other1 14 76
Government grants 6 8
Total 92 147
Other Operating Expenses includeRents paid 96 98
Research and development 104 85
Credit losses, net of reversals 8 -7
CTA release 28 0
Materials and Services includeEmissions rights to be delivered and disposal losses 23 10
1 As from 1 January 2018, transport and freight sales and silviculture services in Finland previously presented under other operating income are presented in sales. In 2018 total sales of excess freight capacity amounted to EUR 51 (EUR 66) million. The previous periods have not been restated due to immateriality.
The Group has recorded an Other Operating Income of EUR 32 (EUR 13) million related to Emissions. Under Material and Services an expense of EUR 23 (EUR 10) million has been booked related to the cost of CO2 emissions from production. Actual realised profits amounted to EUR 8 (EUR 3) million on the disposal of surplus rights and EUR 3 (EUR 2) million is the value of excess emission rights held at the year end.
The Group also generates income from its renewable power generation in Belgium, Sweden and Poland. The power is produced from biomass, so the Group is entitled to Green Certificates for onward sale to electricity retailers for fulfilling their renewable power quota obligations. The income from the sale of green certificates amounted to EUR 32 (EUR 18) million.
Auditor's fees and services
Year Ended 31 December
EUR million 2018 2017Audit fees 4 4
Audit-related 0 0
Tax fees 0 0
Other fees 1 1
Total 5 5
In 2018, PwC was selected as the principal auditor of the group. Aggregate fees for professional services rendered to the Group principal auditor PwC amounted to EUR 5 (EUR 5) million. Audit fees relate to the auditing of the annual financial statements or ancillary services normally provided in connection with statutory and regulatory filings. Audit-related fees are incurred for assurance and associated services that are reasonably related to the performance of the audit or for the review of the financial statements.
Note 6 Personnel expenses
Personnel expenses
Year Ended 31 December
EUR million 2018 2017Wages and salaries 1 000 999
Pensions (see below) 170 166
Share-based remuneration (Note 21) 7 10
Total return swaps 0 -2
Other statutory employer costs 134 136
Other voluntary costs 19 22
Total 1 330 1 331
Pensions
Year Ended 31 December
EUR million 2018 2017Defined benefit plans 10 13
Defined contribution plans 160 153
Total 170 166
The average number of employees in 2018 amounted to 26 067 compared with 26 206 in 2017. Pension costs are discussed further in Note 20 Post-employment benefits.
In 2018, the expense of the share-based remuneration was EUR 7 (EUR 10) million. The expense of share-based remuneration net of Total Return Swaps (TRS) in 2018 amounted to EUR 7 (EUR 8) million. Income of EUR 0 (EUR 2) million was recorded in respect to TRS.
Share-based remuneration comprising of share awards and related hedges are described in more detail in Note 21 Employee variable compensation and equity incentive schemes.
Remuneration of the Group Leadership Team and Board are described in Note 7 Board and executive remuneration.
34
Sto
ra En
so 2
018: Fin
an
cia
ls – No
tes to the Co
nsolid
ated financial statem
ents – No
te 6
Strateg
yS
ustainability
FinancialsG
overnance
Annual Report 2018
Financials
Stora Enso in 2018
Report of the Board of Directors
Consolidated financial statements
Notes to the Consolidated financial statements
Extract from the parent company Stora Enso Oyj financial statements
The Board of Directors’ Proposal for the distribution of dividend
Auditor’s report
Stora Enso in capital markets
Stora Enso as a taxpayer
Capacities by mill in 2019
Information for shareholders
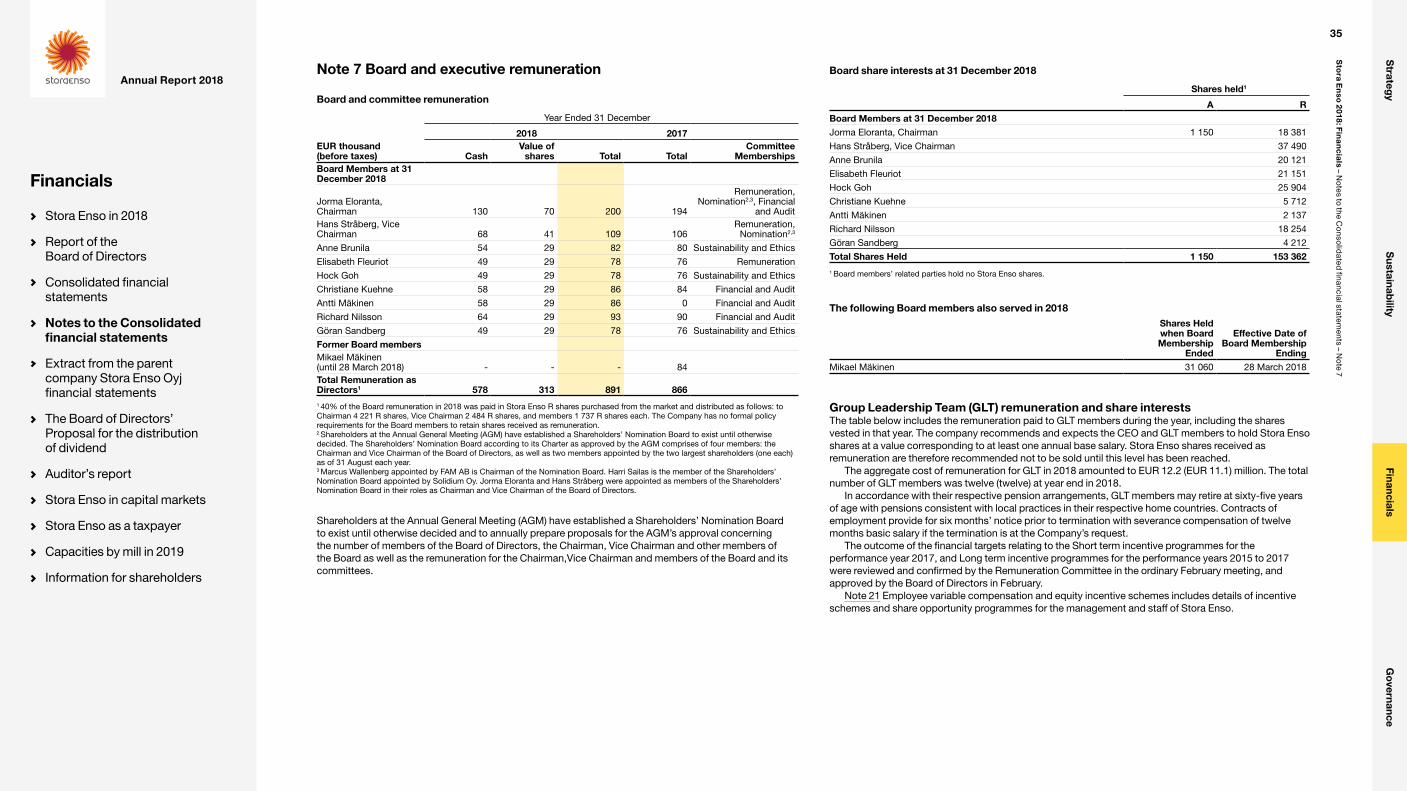
Note 7 Board and executive remuneration
Board and committee remuneration
Year Ended 31 December
2018 2017EUR thousand (before taxes) Cash
Value of shares Total Total
Committee Memberships
Board Members at 31 December 2018
Jorma Eloranta, Chairman 130 70 200 194
Remuneration, Nomination2,3, Financial
and AuditHans Stråberg, Vice Chairman 68 41 109 106
Remuneration, Nomination2,3
Anne Brunila 54 29 82 80 Sustainability and Ethics
Elisabeth Fleuriot 49 29 78 76 Remuneration
Hock Goh 49 29 78 76 Sustainability and Ethics
Christiane Kuehne 58 29 86 84 Financial and Audit
Antti Mäkinen 58 29 86 0 Financial and Audit
Richard Nilsson 64 29 93 90 Financial and Audit
Göran Sandberg 49 29 78 76 Sustainability and Ethics
Former Board membersMikael Mäkinen (until 28 March 2018) - - - 84Total Remuneration as Directors1 578 313 891 8661 40% of the Board remuneration in 2018 was paid in Stora Enso R shares purchased from the market and distributed as follows: to Chairman 4 221 R shares, Vice Chairman 2 484 R shares, and members 1 737 R shares each. The Company has no formal policy requirements for the Board members to retain shares received as remuneration.2 Shareholders at the Annual General Meeting (AGM) have established a Shareholders’ Nomination Board to exist until otherwise decided. The Shareholders’ Nomination Board according to its Charter as approved by the AGM comprises of four members: the Chairman and Vice Chairman of the Board of Directors, as well as two members appointed by the two largest shareholders (one each) as of 31 August each year. 3 Marcus Wallenberg appointed by FAM AB is Chairman of the Nomination Board. Harri Sailas is the member of the Shareholders’ Nomination Board appointed by Solidium Oy. Jorma Eloranta and Hans Stråberg were appointed as members of the Shareholders’ Nomination Board in their roles as Chairman and Vice Chairman of the Board of Directors.
Shareholders at the Annual General Meeting (AGM) have established a Shareholders’ Nomination Board to exist until otherwise decided and to annually prepare proposals for the AGM’s approval concerning the number of members of the Board of Directors, the Chairman, Vice Chairman and other members of the Board as well as the remuneration for the Chairman,Vice Chairman and members of the Board and its committees.
Board share interests at 31 December 2018
Shares held1
A RBoard Members at 31 December 2018Jorma Eloranta, Chairman 1 150 18 381
Hans Stråberg, Vice Chairman 37 490
Anne Brunila 20 121
Elisabeth Fleuriot 21 151
Hock Goh 25 904
Christiane Kuehne 5 712
Antti Mäkinen 2 137
Richard Nilsson 18 254
Göran Sandberg 4 212
Total Shares Held 1 150 153 362
1 Board members’ related parties hold no Stora Enso shares.
The following Board members also served in 2018Shares Heldwhen BoardMembership
Ended
Effective Date ofBoard Membership
EndingMikael Mäkinen 31 060 28 March 2018
Group Leadership Team (GLT) remuneration and share interestsThe table below includes the remuneration paid to GLT members during the year, including the shares vested in that year. The company recommends and expects the CEO and GLT members to hold Stora Enso shares at a value corresponding to at least one annual base salary. Stora Enso shares received as remuneration are therefore recommended not to be sold until this level has been reached.
The aggregate cost of remuneration for GLT in 2018 amounted to EUR 12.2 (EUR 11.1) million. The total number of GLT members was twelve (twelve) at year end in 2018.
In accordance with their respective pension arrangements, GLT members may retire at sixty-five years of age with pensions consistent with local practices in their respective home countries. Contracts of employment provide for six months’ notice prior to termination with severance compensation of twelve months basic salary if the termination is at the Company’s request.
The outcome of the financial targets relating to the Short term incentive programmes for the performance year 2017, and Long term incentive programmes for the performance years 2015 to 2017 were reviewed and confirmed by the Remuneration Committee in the ordinary February meeting, and approved by the Board of Directors in February.
Note 21 Employee variable compensation and equity incentive schemes includes details of incentive schemes and share opportunity programmes for the management and staff of Stora Enso.
35
Sto
ra En
so 2
018: Fin
an
cia
ls – No
tes to the Co
nsolid
ated financial statem
ents – No
te 7
Strateg
yS
ustainability
FinancialsG
overnance
Annual Report 2018
Financials
Stora Enso in 2018
Report of the Board of Directors
Consolidated financial statements
Notes to the Consolidated financial statements
Extract from the parent company Stora Enso Oyj financial statements
The Board of Directors’ Proposal for the distribution of dividend
Auditor’s report
Stora Enso in capital markets
Stora Enso as a taxpayer
Capacities by mill in 2019
Information for shareholders
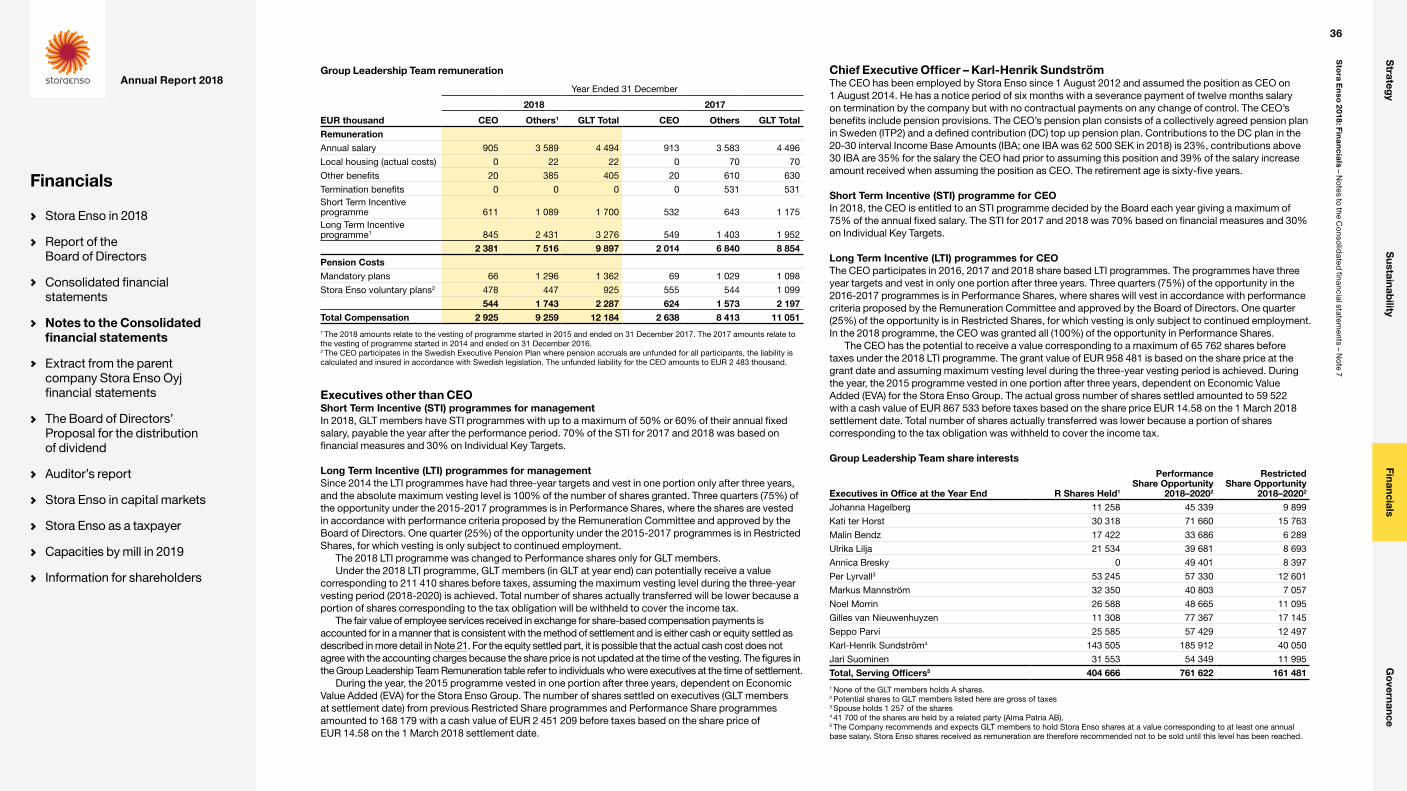
Group Leadership Team remuneration
Year Ended 31 December
2018 2017
EUR thousand CEO Others1 GLT Total CEO Others GLT TotalRemunerationAnnual salary 905 3 589 4 494 913 3 583 4 496
Local housing (actual costs) 0 22 22 0 70 70
Other benefits 20 385 405 20 610 630
Termination benefits 0 0 0 0 531 531Short Term Incentive programme 611 1 089 1 700 532 643 1 175Long Term Incentive programme1 845 2 431 3 276 549 1 403 1 952
2 381 7 516 9 897 2 014 6 840 8 854Pension CostsMandatory plans 66 1 296 1 362 69 1 029 1 098
Stora Enso voluntary plans2 478 447 925 555 544 1 099
544 1 743 2 287 624 1 573 2 197Total Compensation 2 925 9 259 12 184 2 638 8 413 11 0511 The 2018 amounts relate to the vesting of programme started in 2015 and ended on 31 December 2017. The 2017 amounts relate to the vesting of programme started in 2014 and ended on 31 December 2016. 2 The CEO participates in the Swedish Executive Pension Plan where pension accruals are unfunded for all participants, the liability is calculated and insured in accordance with Swedish legislation. The unfunded liability for the CEO amounts to EUR 2 483 thousand.
Executives other than CEOShort Term Incentive (STI) programmes for managementIn 2018, GLT members have STI programmes with up to a maximum of 50% or 60% of their annual fixed salary, payable the year after the performance period. 70% of the STI for 2017 and 2018 was based on financial measures and 30% on Individual Key Targets.
Long Term Incentive (LTI) programmes for managementSince 2014 the LTI programmes have had three-year targets and vest in one portion only after three years, and the absolute maximum vesting level is 100% of the number of shares granted. Three quarters (75%) of the opportunity under the 2015-2017 programmes is in Performance Shares, where the shares are vested in accordance with performance criteria proposed by the Remuneration Committee and approved by the Board of Directors. One quarter (25%) of the opportunity under the 2015-2017 programmes is in Restricted Shares, for which vesting is only subject to continued employment.
The 2018 LTI programme was changed to Performance shares only for GLT members. Under the 2018 LTI programme, GLT members (in GLT at year end) can potentially receive a value
corresponding to 211 410 shares before taxes, assuming the maximum vesting level during the three-year vesting period (2018-2020) is achieved. Total number of shares actually transferred will be lower because a portion of shares corresponding to the tax obligation will be withheld to cover the income tax.
The fair value of employee services received in exchange for share-based compensation payments is accounted for in a manner that is consistent with the method of settlement and is either cash or equity settled as described in more detail in Note 21. For the equity settled part, it is possible that the actual cash cost does not agree with the accounting charges because the share price is not updated at the time of the vesting. The figures in the Group Leadership Team Remuneration table refer to individuals who were executives at the time of settlement.
During the year, the 2015 programme vested in one portion after three years, dependent on Economic Value Added (EVA) for the Stora Enso Group. The number of shares settled on executives (GLT members at settlement date) from previous Restricted Share programmes and Performance Share programmes amounted to 168 179 with a cash value of EUR 2 451 209 before taxes based on the share price of EUR 14.58 on the 1 March 2018 settlement date.
Chief Executive Officer – Karl-Henrik SundströmThe CEO has been employed by Stora Enso since 1 August 2012 and assumed the position as CEO on 1 August 2014. He has a notice period of six months with a severance payment of twelve months salary on termination by the company but with no contractual payments on any change of control. The CEO’s benefits include pension provisions. The CEO’s pension plan consists of a collectively agreed pension plan in Sweden (ITP2) and a defined contribution (DC) top up pension plan. Contributions to the DC plan in the 20-30 interval Income Base Amounts (IBA; one IBA was 62 500 SEK in 2018) is 23%, contributions above 30 IBA are 35% for the salary the CEO had prior to assuming this position and 39% of the salary increase amount received when assuming the position as CEO. The retirement age is sixty-five years.
Short Term Incentive (STI) programme for CEOIn 2018, the CEO is entitled to an STI programme decided by the Board each year giving a maximum of 75% of the annual fixed salary. The STI for 2017 and 2018 was 70% based on financial measures and 30% on Individual Key Targets.
Long Term Incentive (LTI) programmes for CEOThe CEO participates in 2016, 2017 and 2018 share based LTI programmes. The programmes have three year targets and vest in only one portion after three years. Three quarters (75%) of the opportunity in the 2016-2017 programmes is in Performance Shares, where shares will vest in accordance with performance criteria proposed by the Remuneration Committee and approved by the Board of Directors. One quarter (25%) of the opportunity is in Restricted Shares, for which vesting is only subject to continued employment. In the 2018 programme, the CEO was granted all (100%) of the opportunity in Performance Shares.
The CEO has the potential to receive a value corresponding to a maximum of 65 762 shares before taxes under the 2018 LTI programme. The grant value of EUR 958 481 is based on the share price at the grant date and assuming maximum vesting level during the three-year vesting period is achieved. During the year, the 2015 programme vested in one portion after three years, dependent on Economic Value Added (EVA) for the Stora Enso Group. The actual gross number of shares settled amounted to 59 522 with a cash value of EUR 867 533 before taxes based on the share price EUR 14.58 on the 1 March 2018 settlement date. Total number of shares actually transferred was lower because a portion of shares corresponding to the tax obligation was withheld to cover the income tax.
Group Leadership Team share interests
Executives in Office at the Year End R Shares Held1
Performance Share Opportunity
2018–20202
Restricted Share Opportunity
2018–20202
Johanna Hagelberg 11 258 45 339 9 899
Kati ter Horst 30 318 71 660 15 763
Malin Bendz 17 422 33 686 6 289
Ulrika Lilja 21 534 39 681 8 693
Annica Bresky 0 49 401 8 397
Per Lyrvall3 53 245 57 330 12 601
Markus Mannström 32 350 40 803 7 057
Noel Morrin 26 588 48 665 11 095
Gilles van Nieuwenhuyzen 11 308 77 367 17 145
Seppo Parvi 25 585 57 429 12 497
Karl-Henrik Sundström4 143 505 185 912 40 050
Jari Suominen 31 553 54 349 11 995
Total, Serving Officers5 404 666 761 622 161 4811 None of the GLT members holds A shares.2 Potential shares to GLT members listed here are gross of taxes3 Spouse holds 1 257 of the shares4 41 700 of the shares are held by a related party (Alma Patria AB).5 The Company recommends and expects GLT members to hold Stora Enso shares at a value corresponding to at least one annual base salary. Stora Enso shares received as remuneration are therefore recommended not to be sold until this level has been reached.
36
Sto
ra En
so 2
018: Fin
an
cia
ls – No
tes to the Co
nsolid
ated financial statem
ents – No
te 7
Strateg
yS
ustainability
FinancialsG
overnance
Annual Report 2018
Financials
Stora Enso in 2018
Report of the Board of Directors
Consolidated financial statements
Notes to the Consolidated financial statements
Extract from the parent company Stora Enso Oyj financial statements
The Board of Directors’ Proposal for the distribution of dividend
Auditor’s report
Stora Enso in capital markets
Stora Enso as a taxpayer
Capacities by mill in 2019
Information for shareholders

Note 8 Net financial items
Accounting principles
Net financial items comprise of net interest expenses, foreign exchange gains and losses and other financial income and expenses mainly arising from interest-bearing assets and liabilities.
Financial income and expense
Year Ended 31 December
EUR million 2018 2017Net Financial Expense in the Income StatementFinancial income 27 38
Financial expense -207 -200
Total -180 -162
Represented byInterest expense
Interest expense from borrowings measured at amortised cost -126 -140Net interest from interest rate derivatives measured at fair value through OCI -6 -2
Interest expense on finance leases -1 -1
Interest income on loans and receivables measured at amortised cost 4 3
Net interest on net defined benefit liabilities -6 -6
Foreign exchange gains and losses
Currency derivatives 22 24
Borrowings and deposits -55 10
Other financial income 1 1
Other financial expense
Bond buybacks 0 -29
Financial fees -10 -22
Fair valuation losses -3 0
Total -180 -162
Gains and losses on derivative financial instruments are shown in Note 27 Derivatives.
In 2018, the net interest expense on borrowings decreased due to lower average gross debt level and fee amortisations. There were no capitalised borrowing costs in 2018 (EUR nil). Costs on long-term debt issues capitalised as part of non-current debt amounted to EUR 14 (EUR 17) million in the Statement of financial position. During the year EUR 5 (EUR 7) million was amortised through interest expense by using the effective interest rate method.
Exchange gains and losses for currency derivatives mainly relate to non-hedge accounted instruments fair valued in the Income statement.
In 2017 the Group recorded a net expense of EUR 29 million due to repurchases of bond notes with the impact recorded under other financial expense. In addition, the Group recorded a net expense of EUR 10 million under financial fees related to an early loan repayment in 2017. The transactions are explained in more detail in Note 26 Debt.
The amount reported under financial fees in the table above mainly relates to net financial fees for unused committed credit facilities, guarantees and rating agencies.
Note 9 Income taxes
Accounting principles
The Group income tax expense/benefit includes taxes of group companies based on taxable profit/loss for the period, together with tax adjustments for previous periods and the change in deferred income taxes.
Deferred income taxes are provided using the liability method, as measured with enacted, or substantially enacted, tax rates, to reflect the net tax effects of all temporary differences between the tax bases and the accounting bases of assets and liabilities. No deferred tax is recognised for the initial recognition of goodwill and the initial recognition of an asset or liability in a transaction which is not a business combination and at the time of the transaction it affects neither accounting profit nor taxable profit. Deferred tax assets reduce income taxes payable on taxable income in future years. The deferred tax assets, whether arising from temporary differences or from tax losses, are recognised only to the extent that it is probable that future taxable profits will be available against which the assets can be utilised.
Tax expense
Year Ended 31 December
EUR million 2018 2017Current Tax -166 -123
Deferred Tax -55 -5
Total Tax -221 -128
Income tax rate reconciliation
Year Ended 31 December
EUR million 2018 2017Profit before tax 1 210 742
Tax at statutory rates applicable to profits in the country concerned1 -247 -147
Non-deductible expenses and tax exempt income2 13 6
Valuation of deferred tax assets -17 -22
Taxes from prior years -23 -6
Changes in tax rates and tax laws 9 5
Impairment of goodwill 0 0
Profits from equity accounted investments 39 18
Other3 3 18
Total Tax -221 -128Effective Tax Rate 18.3% 17.3%Statutory Tax Rate (blended) 20.4% 19.8%1 Includes a EUR 21 million impact from countries with tax holidays and tax benefits in 2018 and a EUR 9 million impact from tax holidays and other tax benefits in 2017.2 The tax value of non-deductible expenses of EUR 26 million has been netted against tax exempt income of EUR 39 million in 2018, and tax value of non-deductible expenses of EUR 17 million has been netted against tax exempt income of EUR 23 million in 2017.3 The 2017 figure includes a EUR 19 million release of deferred tax liabilities in relation to subsidiary dividend distribution as the distribution is not probable within the foreseeable future.
The statutory tax rate is a weighted average of the statutory tax rates prevailing in jurisdictions where Stora Enso operates.
37
Sto
ra En
so 2
018: Fin
an
cia
ls – No
tes to the Co
nsolid
ated financial statem
ents – No
te 8
Strateg
yS
ustainability
FinancialsG
overnance
Annual Report 2018
Financials
Stora Enso in 2018
Report of the Board of Directors
Consolidated financial statements
Notes to the Consolidated financial statements
Extract from the parent company Stora Enso Oyj financial statements
The Board of Directors’ Proposal for the distribution of dividend
Auditor’s report
Stora Enso in capital markets
Stora Enso as a taxpayer
Capacities by mill in 2019
Information for shareholders
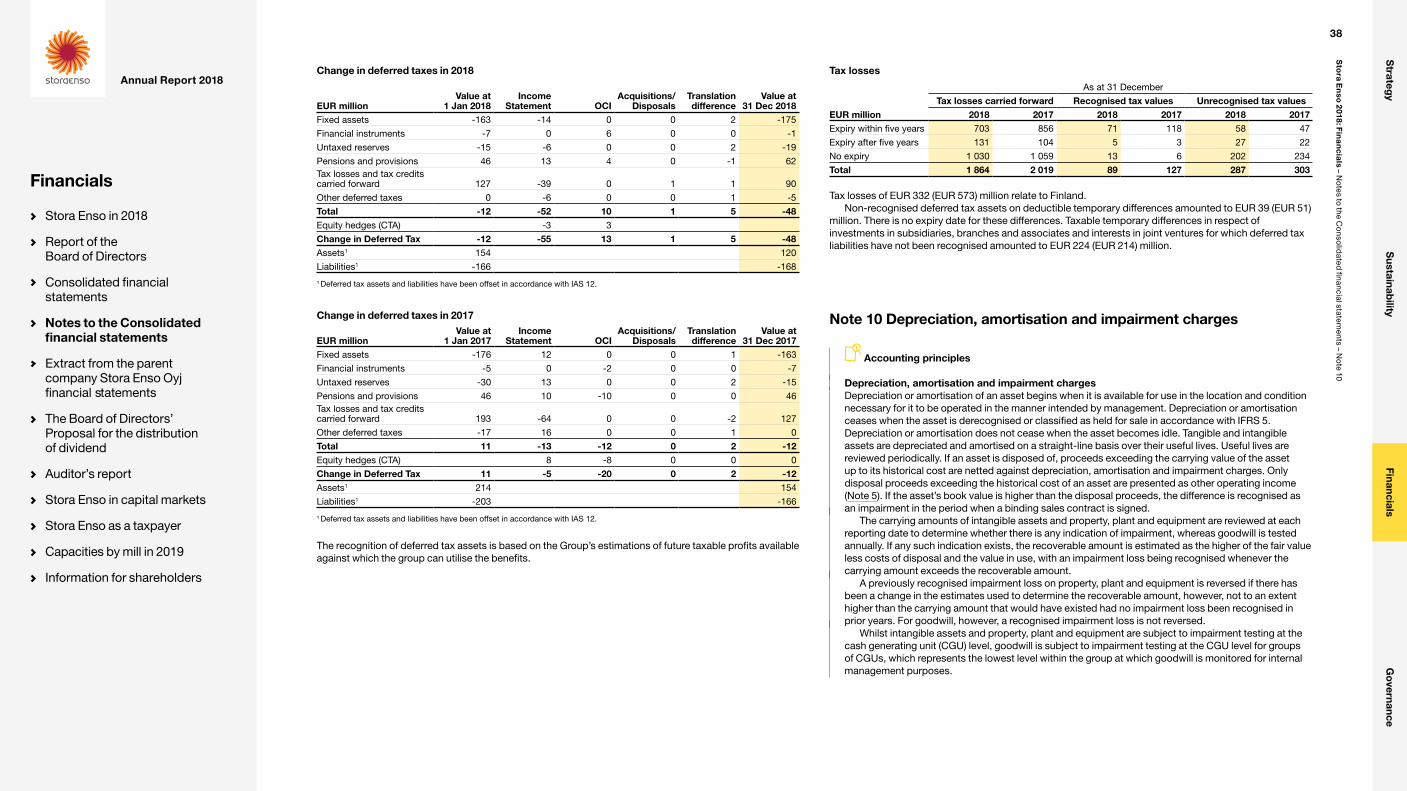
Change in deferred taxes in 2018
EUR millionValue at
1 Jan 2018Income
Statement OCIAcquisitions/
DisposalsTranslation difference
Value at 31 Dec 2018
Fixed assets -163 -14 0 0 2 -175
Financial instruments -7 0 6 0 0 -1
Untaxed reserves -15 -6 0 0 2 -19
Pensions and provisions 46 13 4 0 -1 62Tax losses and tax credits carried forward 127 -39 0 1 1 90
Other deferred taxes 0 -6 0 0 1 -5
Total -12 -52 10 1 5 -48Equity hedges (CTA) -3 3
Change in Deferred Tax -12 -55 13 1 5 -48Assets1 154 120
Liabilities1 -166 -168
1 Deferred tax assets and liabilities have been offset in accordance with IAS 12.
Change in deferred taxes in 2017
EUR millionValue at
1 Jan 2017Income
Statement OCIAcquisitions/
DisposalsTranslation difference
Value at 31 Dec 2017
Fixed assets -176 12 0 0 1 -163
Financial instruments -5 0 -2 0 0 -7
Untaxed reserves -30 13 0 0 2 -15
Pensions and provisions 46 10 -10 0 0 46Tax losses and tax credits carried forward 193 -64 0 0 -2 127
Other deferred taxes -17 16 0 0 1 0
Total 11 -13 -12 0 2 -12Equity hedges (CTA) 8 -8 0 0 0
Change in Deferred Tax 11 -5 -20 0 2 -12Assets1 214 154
Liabilities1 -203 -166
1 Deferred tax assets and liabilities have been offset in accordance with IAS 12.
The recognition of deferred tax assets is based on the Group’s estimations of future taxable profits available against which the group can utilise the benefits.
Note 10 Depreciation, amortisation and impairment charges
Accounting principles
Depreciation, amortisation and impairment chargesDepreciation or amortisation of an asset begins when it is available for use in the location and condition necessary for it to be operated in the manner intended by management. Depreciation or amortisation ceases when the asset is derecognised or classified as held for sale in accordance with IFRS 5. Depreciation or amortisation does not cease when the asset becomes idle. Tangible and intangible assets are depreciated and amortised on a straight-line basis over their useful lives. Useful lives are reviewed periodically. If an asset is disposed of, proceeds exceeding the carrying value of the asset up to its historical cost are netted against depreciation, amortisation and impairment charges. Only disposal proceeds exceeding the historical cost of an asset are presented as other operating income (Note 5). If the asset’s book value is higher than the disposal proceeds, the difference is recognised as an impairment in the period when a binding sales contract is signed.
The carrying amounts of intangible assets and property, plant and equipment are reviewed at each reporting date to determine whether there is any indication of impairment, whereas goodwill is tested annually. If any such indication exists, the recoverable amount is estimated as the higher of the fair value less costs of disposal and the value in use, with an impairment loss being recognised whenever the carrying amount exceeds the recoverable amount.
A previously recognised impairment loss on property, plant and equipment is reversed if there has been a change in the estimates used to determine the recoverable amount, however, not to an extent higher than the carrying amount that would have existed had no impairment loss been recognised in prior years. For goodwill, however, a recognised impairment loss is not reversed.
Whilst intangible assets and property, plant and equipment are subject to impairment testing at the cash generating unit (CGU) level, goodwill is subject to impairment testing at the CGU level for groups of CGUs, which represents the lowest level within the group at which goodwill is monitored for internal management purposes.
Tax losses
As at 31 December
Tax losses carried forward Recognised tax values Unrecognised tax valuesEUR million 2018 2017 2018 2017 2018 2017Expiry within five years 703 856 71 118 58 47
Expiry after five years 131 104 5 3 27 22
No expiry 1 030 1 059 13 6 202 234
Total 1 864 2 019 89 127 287 303
Tax losses of EUR 332 (EUR 573) million relate to Finland.Non-recognised deferred tax assets on deductible temporary differences amounted to EUR 39 (EUR 51)
million. There is no expiry date for these differences. Taxable temporary differences in respect of investments in subsidiaries, branches and associates and interests in joint ventures for which deferred tax liabilities have not been recognised amounted to EUR 224 (EUR 214) million.
38
Sto
ra En
so 2
018: Fin
an
cia
ls – No
tes to the Co
nsolid
ated financial statem
ents – No
te 10
Strateg
yS
ustainability
FinancialsG
overnance
Annual Report 2018
Financials
Stora Enso in 2018
Report of the Board of Directors
Consolidated financial statements
Notes to the Consolidated financial statements
Extract from the parent company Stora Enso Oyj financial statements
The Board of Directors’ Proposal for the distribution of dividend
Auditor’s report
Stora Enso in capital markets
Stora Enso as a taxpayer
Capacities by mill in 2019
Information for shareholders

Depreciation, amortisation and impairment charges
Year Ended 31 December
EUR million 2018 2017Depreciation and AmortisationIntangible assets 23 18
Buildings and structures 78 82
Plant and equipment 368 382
Other tangible assets 10 11
Total 479 493Impairment and Disposal Gains/LossesGoodwill 0 0
Intangible assets 0 11
Land 0 5
Buildings and structures 0 0
Plant and equipment 1 7
Other tangible assets 0 4
Gain on sale of fixed assets -4 -2
Loss on sale of fixed assets 4 3
Total 1 28Reversal of ImpairmentIntangible assets 0 -3
Buildings and structures 0 0
Plant and equipment 0 -3
Total 0 -6Depreciation, Amortisation and Impairment Charges 479 515
Depreciation and amortisationThe total depreciation and amortisation charge amounted to EUR 479 million and was EUR 14 million less than in 2017. A breakdown of depreciation, amortisation and impairment charges by divisions is set out in Note 3 Segment information.
Disposal gains and lossesThere were no material disposal gains or losses relating to fixed assets in 2018 or 2017.
Impairment testingThe recoverable amount for the cash generating units (CGUs) has been determined based on a value-in-use calculation using cash flow projections from financial budgets approved by the Board of Directors and management. The pre-tax discount rates are calculated for each cash generating unit taking into account the tax and risk profile of the country in which the cash flow is generated. The table in the goodwill impairment testing section below sets out the pre-tax discount rates used for goodwill impairment testing, which are similar to those used in the impairment testing of other intangible assets and property, plant and equipment.
Impairments were calculated using a value-in-use method for each CGU based on the following main assumptions:• Sales price estimates in accordance with internal and external specialist analysis• Cash flows and discount rates were prepared in real terms• Current cost structure to remain unchanged
• For goodwill testing a four-year future period was used after which the perpetuity value was based on zero growth rates, whereas for intangible assets, property, plant and equipment testing the period was the remaining expected economic life of the assets.
Other intangible assets and property, plant and equipment impairmentThe total impairment charges on other intangible assets and property, plant and equipment in 2018 amounted to EUR 1 (EUR 27) million and resulted mainly from impairment testing.
Newsprint Europe and Wood Free Uncoated CGU’s in Paper division were tested for fixed asset impairment reversal in 2018 and the testing did not result in reversal of previous impairments. These CGU’s in Paper division were not tested for fixed asset impairment or impairment reversal in 2017.
Goodwill impairment testingIn 2018 or 2017 the Goodwill testing did not result in any impairments.
39
Sto
ra En
so 2
018: Fin
an
cia
ls – No
tes to the Co
nsolid
ated financial statem
ents – No
te 10
Strateg
yS
ustainability
FinancialsG
overnance
Annual Report 2018
Financials
Stora Enso in 2018
Report of the Board of Directors
Consolidated financial statements
Notes to the Consolidated financial statements
Extract from the parent company Stora Enso Oyj financial statements
The Board of Directors’ Proposal for the distribution of dividend
Auditor’s report
Stora Enso in capital markets
Stora Enso as a taxpayer
Capacities by mill in 2019
Information for shareholders
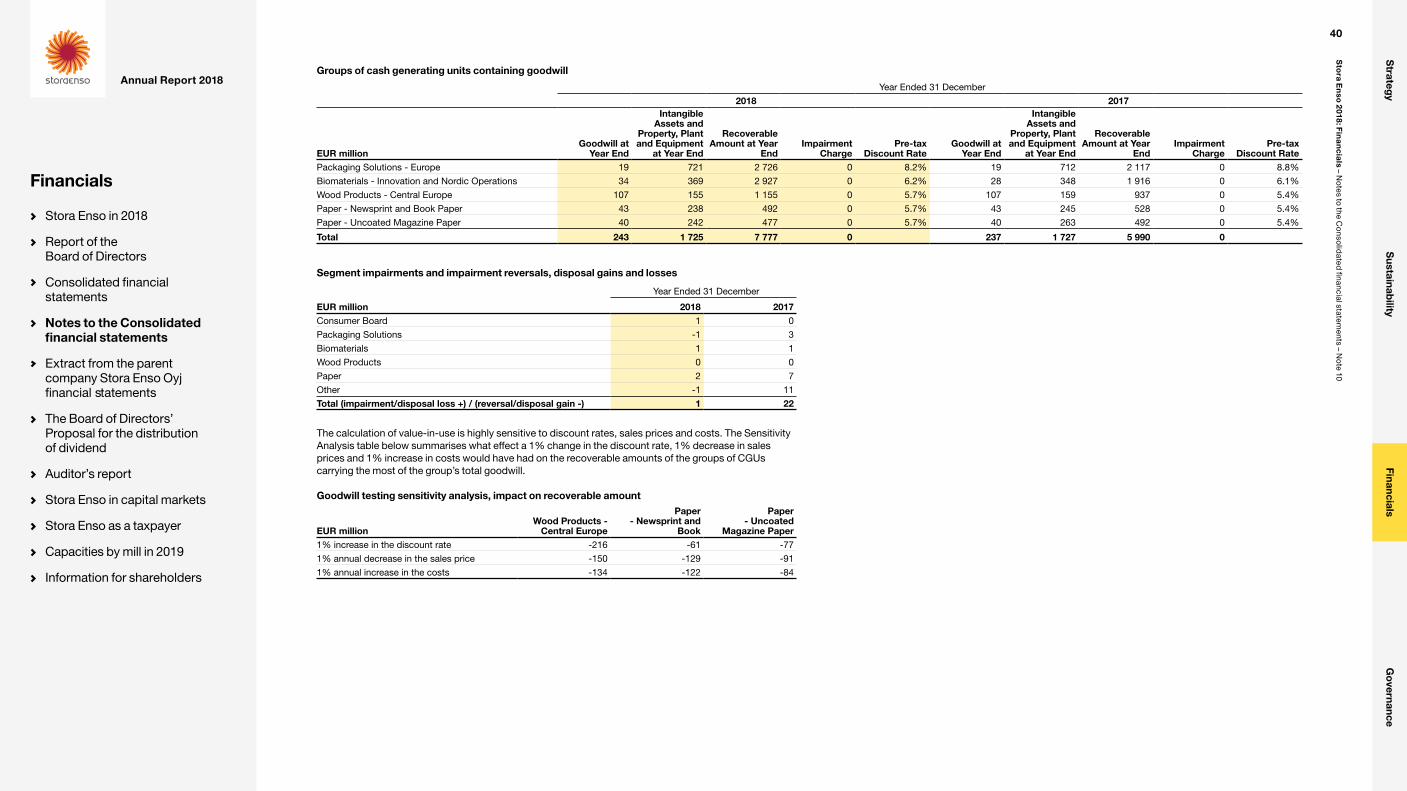
Groups of cash generating units containing goodwill
Year Ended 31 December
2018 2017
EUR millionGoodwill at
Year End
Intangible Assets and
Property, Plant and Equipment
at Year End
Recoverable Amount at Year
EndImpairment
ChargePre-tax
Discount RateGoodwill at
Year End
Intangible Assets and
Property, Plant and Equipment
at Year End
Recoverable Amount at Year
EndImpairment
ChargePre-tax
Discount RatePackaging Solutions - Europe 19 721 2 726 0 8.2% 19 712 2 117 0 8.8%
Biomaterials - Innovation and Nordic Operations 34 369 2 927 0 6.2% 28 348 1 916 0 6.1%
Wood Products - Central Europe 107 155 1 155 0 5.7% 107 159 937 0 5.4%
Paper - Newsprint and Book Paper 43 238 492 0 5.7% 43 245 528 0 5.4%
Paper - Uncoated Magazine Paper 40 242 477 0 5.7% 40 263 492 0 5.4%
Total 243 1 725 7 777 0 237 1 727 5 990 0
Segment impairments and impairment reversals, disposal gains and losses
Year Ended 31 December
EUR million 2018 2017Consumer Board 1 0
Packaging Solutions -1 3
Biomaterials 1 1
Wood Products 0 0
Paper 2 7
Other -1 11
Total (impairment/disposal loss +) / (reversal/disposal gain -) 1 22
The calculation of value-in-use is highly sensitive to discount rates, sales prices and costs. The Sensitivity Analysis table below summarises what effect a 1% change in the discount rate, 1% decrease in sales prices and 1% increase in costs would have had on the recoverable amounts of the groups of CGUs carrying the most of the group’s total goodwill.
Goodwill testing sensitivity analysis, impact on recoverable amount
EUR millionWood Products -
Central Europe
Paper - Newsprint and
Book
Paper - Uncoated
Magazine Paper1% increase in the discount rate -216 -61 -77
1% annual decrease in the sales price -150 -129 -91
1% annual increase in the costs -134 -122 -84
40
Sto
ra En
so 2
018: Fin
an
cia
ls – No
tes to the Co
nsolid
ated financial statem
ents – No
te 10
Strateg
yS
ustainability
FinancialsG
overnance
Annual Report 2018
Financials
Stora Enso in 2018
Report of the Board of Directors
Consolidated financial statements
Notes to the Consolidated financial statements
Extract from the parent company Stora Enso Oyj financial statements
The Board of Directors’ Proposal for the distribution of dividend
Auditor’s report
Stora Enso in capital markets
Stora Enso as a taxpayer
Capacities by mill in 2019
Information for shareholders
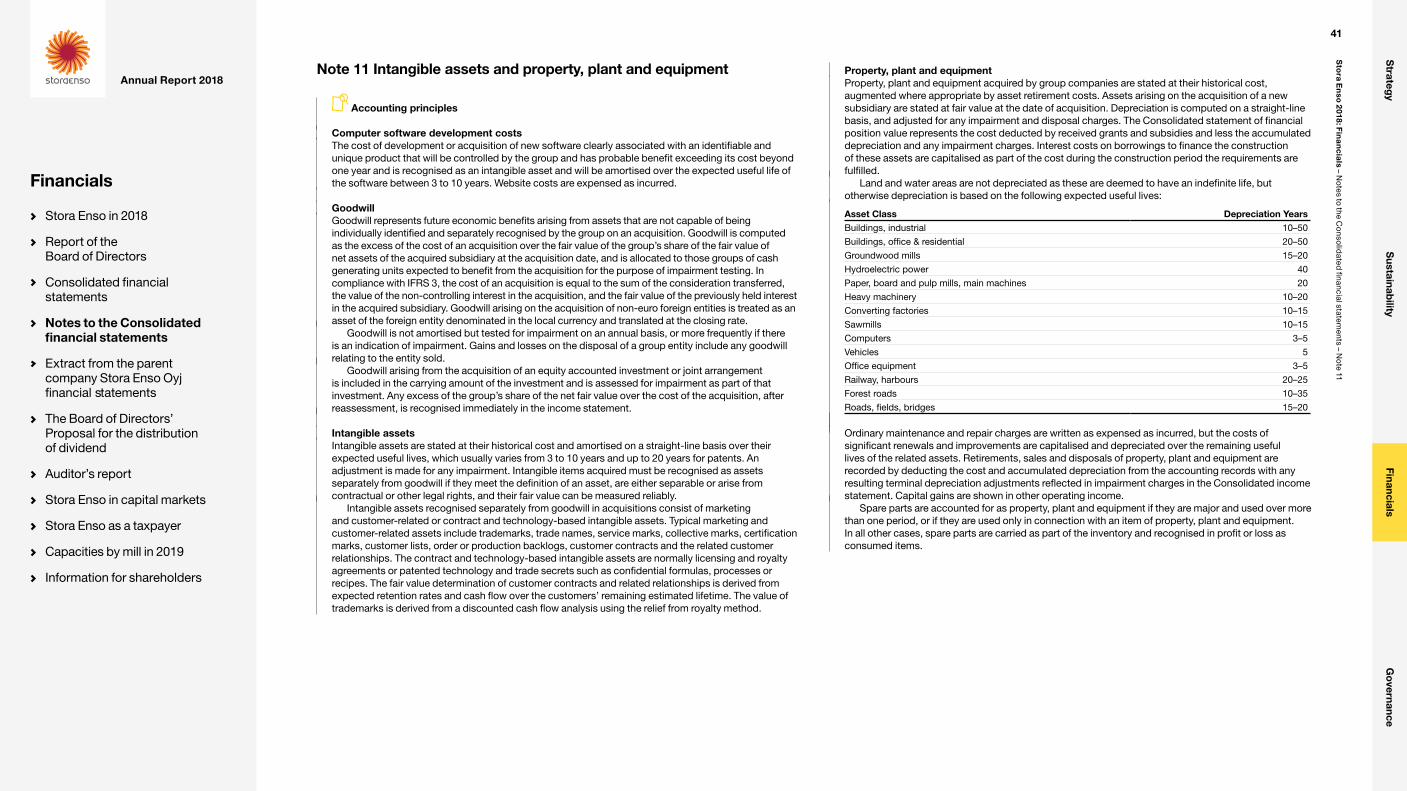
Note 11 Intangible assets and property, plant and equipment
Accounting principles
Computer software development costsThe cost of development or acquisition of new software clearly associated with an identifiable and unique product that will be controlled by the group and has probable benefit exceeding its cost beyond one year and is recognised as an intangible asset and will be amortised over the expected useful life of the software between 3 to 10 years. Website costs are expensed as incurred.
GoodwillGoodwill represents future economic benefits arising from assets that are not capable of being individually identified and separately recognised by the group on an acquisition. Goodwill is computed as the excess of the cost of an acquisition over the fair value of the group’s share of the fair value of net assets of the acquired subsidiary at the acquisition date, and is allocated to those groups of cash generating units expected to benefit from the acquisition for the purpose of impairment testing. In compliance with IFRS 3, the cost of an acquisition is equal to the sum of the consideration transferred, the value of the non-controlling interest in the acquisition, and the fair value of the previously held interest in the acquired subsidiary. Goodwill arising on the acquisition of non-euro foreign entities is treated as an asset of the foreign entity denominated in the local currency and translated at the closing rate.
Goodwill is not amortised but tested for impairment on an annual basis, or more frequently if there is an indication of impairment. Gains and losses on the disposal of a group entity include any goodwill relating to the entity sold.
Goodwill arising from the acquisition of an equity accounted investment or joint arrangement is included in the carrying amount of the investment and is assessed for impairment as part of that investment. Any excess of the group’s share of the net fair value over the cost of the acquisition, after reassessment, is recognised immediately in the income statement.
Intangible assetsIntangible assets are stated at their historical cost and amortised on a straight-line basis over their expected useful lives, which usually varies from 3 to 10 years and up to 20 years for patents. An adjustment is made for any impairment. Intangible items acquired must be recognised as assets separately from goodwill if they meet the definition of an asset, are either separable or arise from contractual or other legal rights, and their fair value can be measured reliably.
Intangible assets recognised separately from goodwill in acquisitions consist of marketing and customer-related or contract and technology-based intangible assets. Typical marketing and customer-related assets include trademarks, trade names, service marks, collective marks, certification marks, customer lists, order or production backlogs, customer contracts and the related customer relationships. The contract and technology-based intangible assets are normally licensing and royalty agreements or patented technology and trade secrets such as confidential formulas, processes or recipes. The fair value determination of customer contracts and related relationships is derived from expected retention rates and cash flow over the customers’ remaining estimated lifetime. The value of trademarks is derived from a discounted cash flow analysis using the relief from royalty method.
Property, plant and equipmentProperty, plant and equipment acquired by group companies are stated at their historical cost, augmented where appropriate by asset retirement costs. Assets arising on the acquisition of a new subsidiary are stated at fair value at the date of acquisition. Depreciation is computed on a straight-line basis, and adjusted for any impairment and disposal charges. The Consolidated statement of financial position value represents the cost deducted by received grants and subsidies and less the accumulated depreciation and any impairment charges. Interest costs on borrowings to finance the construction of these assets are capitalised as part of the cost during the construction period the requirements are fulfilled.
Land and water areas are not depreciated as these are deemed to have an indefinite life, but otherwise depreciation is based on the following expected useful lives:
Asset Class Depreciation YearsBuildings, industrial 10–50
Buildings, office & residential 20–50
Groundwood mills 15–20
Hydroelectric power 40
Paper, board and pulp mills, main machines 20
Heavy machinery 10–20
Converting factories 10–15
Sawmills 10–15
Computers 3–5
Vehicles 5
Office equipment 3–5
Railway, harbours 20–25
Forest roads 10–35
Roads, fields, bridges 15–20
Ordinary maintenance and repair charges are written as expensed as incurred, but the costs of significant renewals and improvements are capitalised and depreciated over the remaining useful lives of the related assets. Retirements, sales and disposals of property, plant and equipment are recorded by deducting the cost and accumulated depreciation from the accounting records with any resulting terminal depreciation adjustments reflected in impairment charges in the Consolidated income statement. Capital gains are shown in other operating income.
Spare parts are accounted for as property, plant and equipment if they are major and used over more than one period, or if they are used only in connection with an item of property, plant and equipment. In all other cases, spare parts are carried as part of the inventory and recognised in profit or loss as consumed items.
41
Sto
ra En
so 2
018: Fin
an
cia
ls – No
tes to the Co
nsolid
ated financial statem
ents – No
te 11
Strateg
yS
ustainability
FinancialsG
overnance
Annual Report 2018
Financials
Stora Enso in 2018
Report of the Board of Directors
Consolidated financial statements
Notes to the Consolidated financial statements
Extract from the parent company Stora Enso Oyj financial statements
The Board of Directors’ Proposal for the distribution of dividend
Auditor’s report
Stora Enso in capital markets
Stora Enso as a taxpayer
Capacities by mill in 2019
Information for shareholders
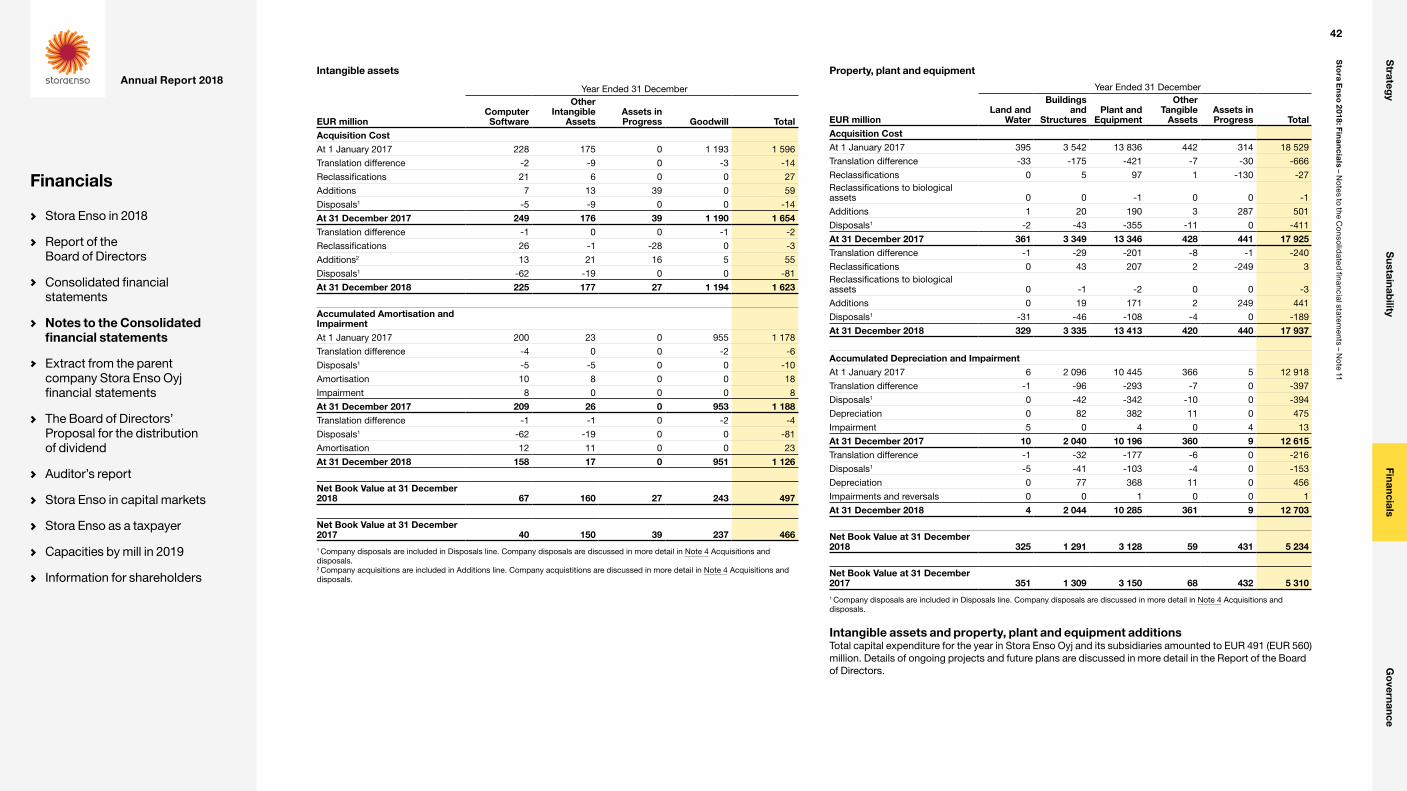
Intangible assets
Year Ended 31 December
EUR millionComputer Software
Other Intangible
AssetsAssets in Progress Goodwill Total
Acquisition CostAt 1 January 2017 228 175 0 1 193 1 596
Translation difference -2 -9 0 -3 -14
Reclassifications 21 6 0 0 27
Additions 7 13 39 0 59
Disposals1 -5 -9 0 0 -14
At 31 December 2017 249 176 39 1 190 1 654Translation difference -1 0 0 -1 -2
Reclassifications 26 -1 -28 0 -3
Additions2 13 21 16 5 55
Disposals1 -62 -19 0 0 -81
At 31 December 2018 225 177 27 1 194 1 623
Accumulated Amortisation and ImpairmentAt 1 January 2017 200 23 0 955 1 178
Translation difference -4 0 0 -2 -6
Disposals1 -5 -5 0 0 -10
Amortisation 10 8 0 0 18
Impairment 8 0 0 0 8
At 31 December 2017 209 26 0 953 1 188Translation difference -1 -1 0 -2 -4
Disposals1 -62 -19 0 0 -81
Amortisation 12 11 0 0 23
At 31 December 2018 158 17 0 951 1 126
Net Book Value at 31 December 2018 67 160 27 243 497
Net Book Value at 31 December 2017 40 150 39 237 4661 Company disposals are included in Disposals line. Company disposals are discussed in more detail in Note 4 Acquisitions and disposals.2 Company acquisitions are included in Additions line. Company acquistitions are discussed in more detail in Note 4 Acquisitions and disposals.
Property, plant and equipment
Year Ended 31 December
EUR millionLand and
Water
Buildings and
StructuresPlant and
Equipment
Other Tangible
AssetsAssets in Progress Total
Acquisition CostAt 1 January 2017 395 3 542 13 836 442 314 18 529
Translation difference -33 -175 -421 -7 -30 -666
Reclassifications 0 5 97 1 -130 -27Reclassifications to biological assets 0 0 -1 0 0 -1
Additions 1 20 190 3 287 501
Disposals1 -2 -43 -355 -11 0 -411
At 31 December 2017 361 3 349 13 346 428 441 17 925Translation difference -1 -29 -201 -8 -1 -240
Reclassifications 0 43 207 2 -249 3Reclassifications to biological assets 0 -1 -2 0 0 -3
Additions 0 19 171 2 249 441
Disposals1 -31 -46 -108 -4 0 -189
At 31 December 2018 329 3 335 13 413 420 440 17 937
Accumulated Depreciation and ImpairmentAt 1 January 2017 6 2 096 10 445 366 5 12 918
Translation difference -1 -96 -293 -7 0 -397
Disposals1 0 -42 -342 -10 0 -394
Depreciation 0 82 382 11 0 475
Impairment 5 0 4 0 4 13
At 31 December 2017 10 2 040 10 196 360 9 12 615Translation difference -1 -32 -177 -6 0 -216
Disposals1 -5 -41 -103 -4 0 -153
Depreciation 0 77 368 11 0 456
Impairments and reversals 0 0 1 0 0 1
At 31 December 2018 4 2 044 10 285 361 9 12 703
Net Book Value at 31 December 2018 325 1 291 3 128 59 431 5 234
Net Book Value at 31 December 2017 351 1 309 3 150 68 432 5 3101 Company disposals are included in Disposals line. Company disposals are discussed in more detail in Note 4 Acquisitions and disposals.
Intangible assets and property, plant and equipment additionsTotal capital expenditure for the year in Stora Enso Oyj and its subsidiaries amounted to EUR 491 (EUR 560) million. Details of ongoing projects and future plans are discussed in more detail in the Report of the Board of Directors.
42
Sto
ra En
so 2
018: Fin
an
cia
ls – No
tes to the Co
nsolid
ated financial statem
ents – No
te 11
Strateg
yS
ustainability
FinancialsG
overnance
Annual Report 2018
Financials
Stora Enso in 2018
Report of the Board of Directors
Consolidated financial statements
Notes to the Consolidated financial statements
Extract from the parent company Stora Enso Oyj financial statements
The Board of Directors’ Proposal for the distribution of dividend
Auditor’s report
Stora Enso in capital markets
Stora Enso as a taxpayer
Capacities by mill in 2019
Information for shareholders
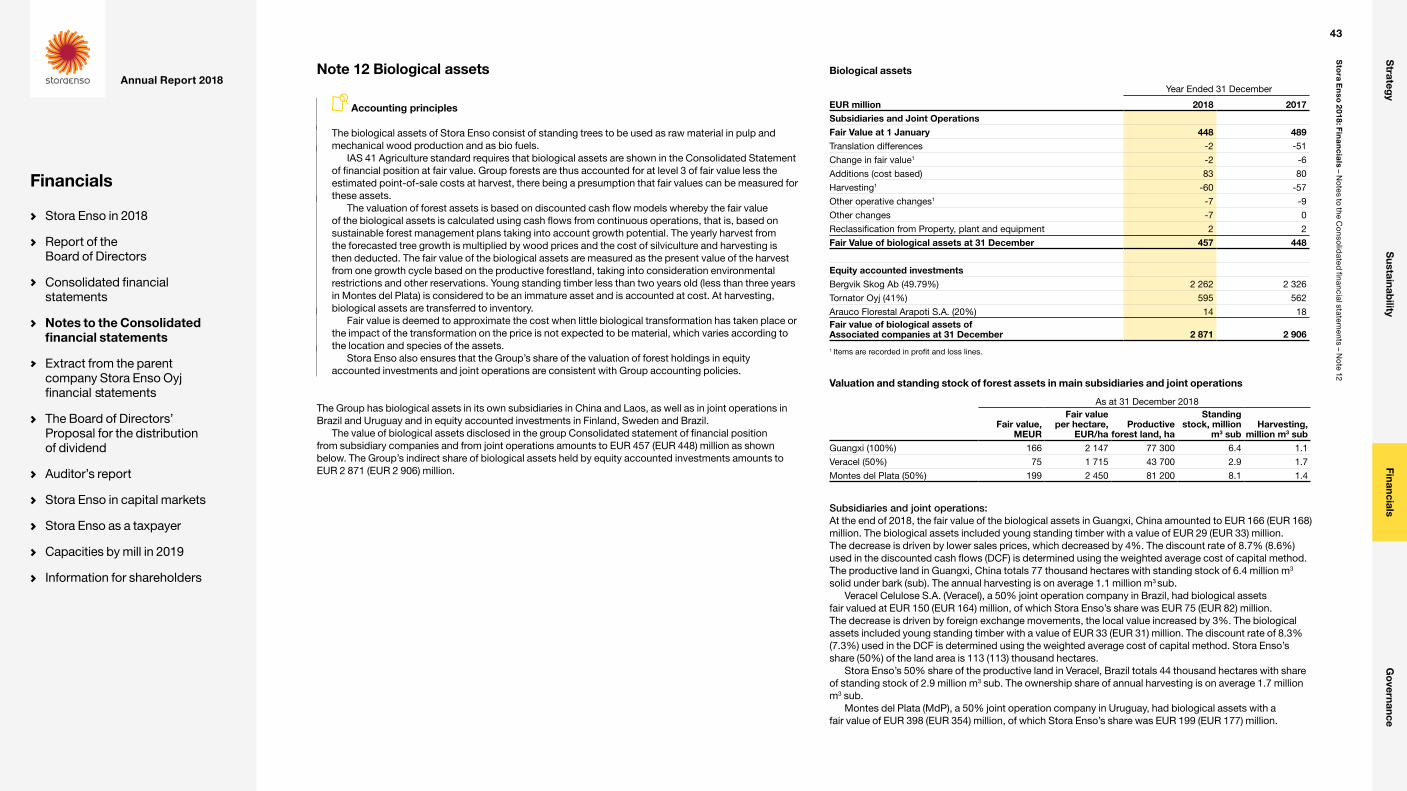
Note 12 Biological assets
Accounting principles
The biological assets of Stora Enso consist of standing trees to be used as raw material in pulp and mechanical wood production and as bio fuels.
IAS 41 Agriculture standard requires that biological assets are shown in the Consolidated Statement of financial position at fair value. Group forests are thus accounted for at level 3 of fair value less the estimated point-of-sale costs at harvest, there being a presumption that fair values can be measured for these assets.
The valuation of forest assets is based on discounted cash flow models whereby the fair value of the biological assets is calculated using cash flows from continuous operations, that is, based on sustainable forest management plans taking into account growth potential. The yearly harvest from the forecasted tree growth is multiplied by wood prices and the cost of silviculture and harvesting is then deducted. The fair value of the biological assets are measured as the present value of the harvest from one growth cycle based on the productive forestland, taking into consideration environmental restrictions and other reservations. Young standing timber less than two years old (less than three years in Montes del Plata) is considered to be an immature asset and is accounted at cost. At harvesting, biological assets are transferred to inventory.
Fair value is deemed to approximate the cost when little biological transformation has taken place or the impact of the transformation on the price is not expected to be material, which varies according to the location and species of the assets.
Stora Enso also ensures that the Group’s share of the valuation of forest holdings in equity accounted investments and joint operations are consistent with Group accounting policies.
The Group has biological assets in its own subsidiaries in China and Laos, as well as in joint operations in Brazil and Uruguay and in equity accounted investments in Finland, Sweden and Brazil.
The value of biological assets disclosed in the group Consolidated statement of financial position from subsidiary companies and from joint operations amounts to EUR 457 (EUR 448) million as shown below. The Group’s indirect share of biological assets held by equity accounted investments amounts to EUR 2 871 (EUR 2 906) million.
Biological assets
Year Ended 31 December
EUR million 2018 2017Subsidiaries and Joint OperationsFair Value at 1 January 448 489Translation differences -2 -51
Change in fair value1 -2 -6
Additions (cost based) 83 80
Harvesting1 -60 -57
Other operative changes1 -7 -9
Other changes -7 0
Reclassification from Property, plant and equipment 2 2
Fair Value of biological assets at 31 December 457 448
Equity accounted investmentsBergvik Skog Ab (49.79%) 2 262 2 326
Tornator Oyj (41%) 595 562
Arauco Florestal Arapoti S.A. (20%) 14 18Fair value of biological assets of Associated companies at 31 December 2 871 2 906
1 Items are recorded in profit and loss lines.
Valuation and standing stock of forest assets in main subsidiaries and joint operations
As at 31 December 2018
Fair value, MEUR
Fair value per hectare,
EUR/haProductive
forest land, ha
Standing stock, million
m3 subHarvesting,
million m3 subGuangxi (100%) 166 2 147 77 300 6.4 1.1
Veracel (50%) 75 1 715 43 700 2.9 1.7
Montes del Plata (50%) 199 2 450 81 200 8.1 1.4
Subsidiaries and joint operations: At the end of 2018, the fair value of the biological assets in Guangxi, China amounted to EUR 166 (EUR 168) million. The biological assets included young standing timber with a value of EUR 29 (EUR 33) million. The decrease is driven by lower sales prices, which decreased by 4%. The discount rate of 8.7% (8.6%) used in the discounted cash flows (DCF) is determined using the weighted average cost of capital method. The productive land in Guangxi, China totals 77 thousand hectares with standing stock of 6.4 million m3
solid under bark (sub). The annual harvesting is on average 1.1 million m3 sub.Veracel Celulose S.A. (Veracel), a 50% joint operation company in Brazil, had biological assets
fair valued at EUR 150 (EUR 164) million, of which Stora Enso’s share was EUR 75 (EUR 82) million. The decrease is driven by foreign exchange movements, the local value increased by 3%. The biological assets included young standing timber with a value of EUR 33 (EUR 31) million. The discount rate of 8.3% (7.3%) used in the DCF is determined using the weighted average cost of capital method. Stora Enso’s share (50%) of the land area is 113 (113) thousand hectares.
Stora Enso’s 50% share of the productive land in Veracel, Brazil totals 44 thousand hectares with share of standing stock of 2.9 million m3 sub. The ownership share of annual harvesting is on average 1.7 million m3 sub.
Montes del Plata (MdP), a 50% joint operation company in Uruguay, had biological assets with a fair value of EUR 398 (EUR 354) million, of which Stora Enso’s share was EUR 199 (EUR 177) million.
43
Sto
ra En
so 2
018: Fin
an
cia
ls – No
tes to the Co
nsolid
ated financial statem
ents – No
te 12
Strateg
yS
ustainability
FinancialsG
overnance
Annual Report 2018
Financials
Stora Enso in 2018
Report of the Board of Directors
Consolidated financial statements
Notes to the Consolidated financial statements
Extract from the parent company Stora Enso Oyj financial statements
The Board of Directors’ Proposal for the distribution of dividend
Auditor’s report
Stora Enso in capital markets
Stora Enso as a taxpayer
Capacities by mill in 2019
Information for shareholders
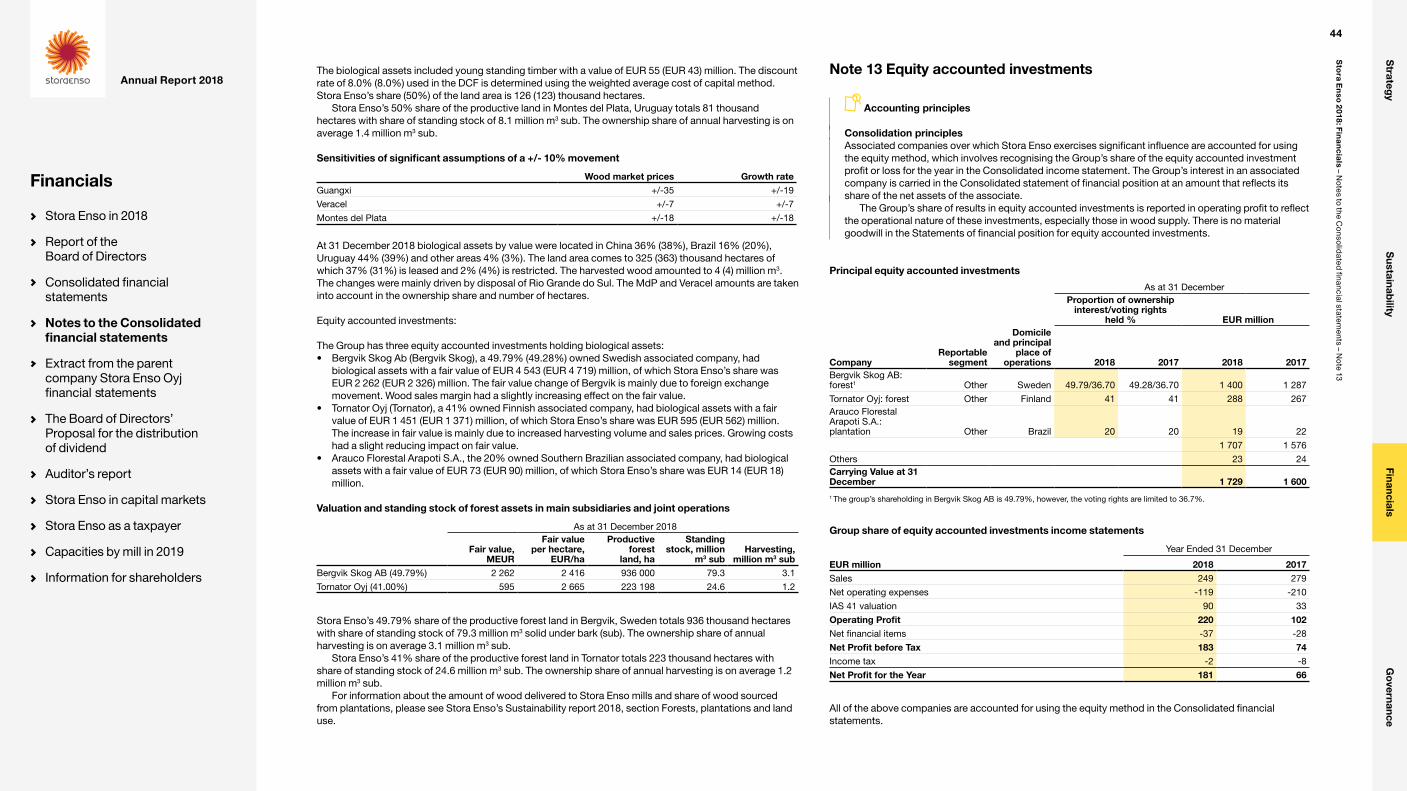
The biological assets included young standing timber with a value of EUR 55 (EUR 43) million. The discount rate of 8.0% (8.0%) used in the DCF is determined using the weighted average cost of capital method. Stora Enso’s share (50%) of the land area is 126 (123) thousand hectares.
Stora Enso’s 50% share of the productive land in Montes del Plata, Uruguay totals 81 thousand hectares with share of standing stock of 8.1 million m3 sub. The ownership share of annual harvesting is on average 1.4 million m3 sub.
Sensitivities of significant assumptions of a +/- 10% movement
Wood market prices Growth rateGuangxi +/-35 +/-19
Veracel +/-7 +/-7
Montes del Plata +/-18 +/-18
At 31 December 2018 biological assets by value were located in China 36% (38%), Brazil 16% (20%), Uruguay 44% (39%) and other areas 4% (3%). The land area comes to 325 (363) thousand hectares of which 37% (31%) is leased and 2% (4%) is restricted. The harvested wood amounted to 4 (4) million m3. The changes were mainly driven by disposal of Rio Grande do Sul. The MdP and Veracel amounts are taken into account in the ownership share and number of hectares.
Equity accounted investments:
The Group has three equity accounted investments holding biological assets:• Bergvik Skog Ab (Bergvik Skog), a 49.79% (49.28%) owned Swedish associated company, had
biological assets with a fair value of EUR 4 543 (EUR 4 719) million, of which Stora Enso’s share was EUR 2 262 (EUR 2 326) million. The fair value change of Bergvik is mainly due to foreign exchange movement. Wood sales margin had a slightly increasing effect on the fair value.
• Tornator Oyj (Tornator), a 41% owned Finnish associated company, had biological assets with a fair value of EUR 1 451 (EUR 1 371) million, of which Stora Enso’s share was EUR 595 (EUR 562) million. The increase in fair value is mainly due to increased harvesting volume and sales prices. Growing costs had a slight reducing impact on fair value.
• Arauco Florestal Arapoti S.A., the 20% owned Southern Brazilian associated company, had biological assets with a fair value of EUR 73 (EUR 90) million, of which Stora Enso’s share was EUR 14 (EUR 18) million.
Valuation and standing stock of forest assets in main subsidiaries and joint operations
As at 31 December 2018
Fair value, MEUR
Fair value per hectare,
EUR/ha
Productive forest
land, ha
Standing stock, million
m3 subHarvesting,
million m3 subBergvik Skog AB (49.79%) 2 262 2 416 936 000 79.3 3.1
Tornator Oyj (41.00%) 595 2 665 223 198 24.6 1.2
Stora Enso’s 49.79% share of the productive forest land in Bergvik, Sweden totals 936 thousand hectares with share of standing stock of 79.3 million m3 solid under bark (sub). The ownership share of annual harvesting is on average 3.1 million m3 sub.
Stora Enso’s 41% share of the productive forest land in Tornator totals 223 thousand hectares with share of standing stock of 24.6 million m3 sub. The ownership share of annual harvesting is on average 1.2 million m3 sub.
For information about the amount of wood delivered to Stora Enso mills and share of wood sourced from plantations, please see Stora Enso’s Sustainability report 2018, section Forests, plantations and land use.
Note 13 Equity accounted investments
Accounting principles
Consolidation principlesAssociated companies over which Stora Enso exercises significant influence are accounted for using the equity method, which involves recognising the Group’s share of the equity accounted investment profit or loss for the year in the Consolidated income statement. The Group’s interest in an associated company is carried in the Consolidated statement of financial position at an amount that reflects its share of the net assets of the associate.
The Group’s share of results in equity accounted investments is reported in operating profit to reflect the operational nature of these investments, especially those in wood supply. There is no material goodwill in the Statements of financial position for equity accounted investments.
Principal equity accounted investments
As at 31 DecemberProportion of ownership
interest/voting rights held % EUR million
CompanyReportable
segment
Domicile and principal
place of operations 2018 2017 2018 2017
Bergvik Skog AB: forest1 Other Sweden 49.79/36.70 49.28/36.70 1 400 1 287
Tornator Oyj: forest Other Finland 41 41 288 267Arauco Florestal Arapoti S.A.: plantation Other Brazil 20 20 19 22
1 707 1 576
Others 23 24Carrying Value at 31 December 1 729 1 600
1 The group’s shareholding in Bergvik Skog AB is 49.79%, however, the voting rights are limited to 36.7%.
Group share of equity accounted investments income statements
Year Ended 31 December
EUR million 2018 2017Sales 249 279
Net operating expenses -119 -210
IAS 41 valuation 90 33
Operating Profit 220 102Net financial items -37 -28
Net Profit before Tax 183 74Income tax -2 -8
Net Profit for the Year 181 66
All of the above companies are accounted for using the equity method in the Consolidated financial statements.
44
Sto
ra En
so 2
018: Fin
an
cia
ls – No
tes to the Co
nsolid
ated financial statem
ents – No
te 13
Strateg
yS
ustainability
FinancialsG
overnance
Annual Report 2018
Financials
Stora Enso in 2018
Report of the Board of Directors
Consolidated financial statements
Notes to the Consolidated financial statements
Extract from the parent company Stora Enso Oyj financial statements
The Board of Directors’ Proposal for the distribution of dividend
Auditor’s report
Stora Enso in capital markets
Stora Enso as a taxpayer
Capacities by mill in 2019
Information for shareholders
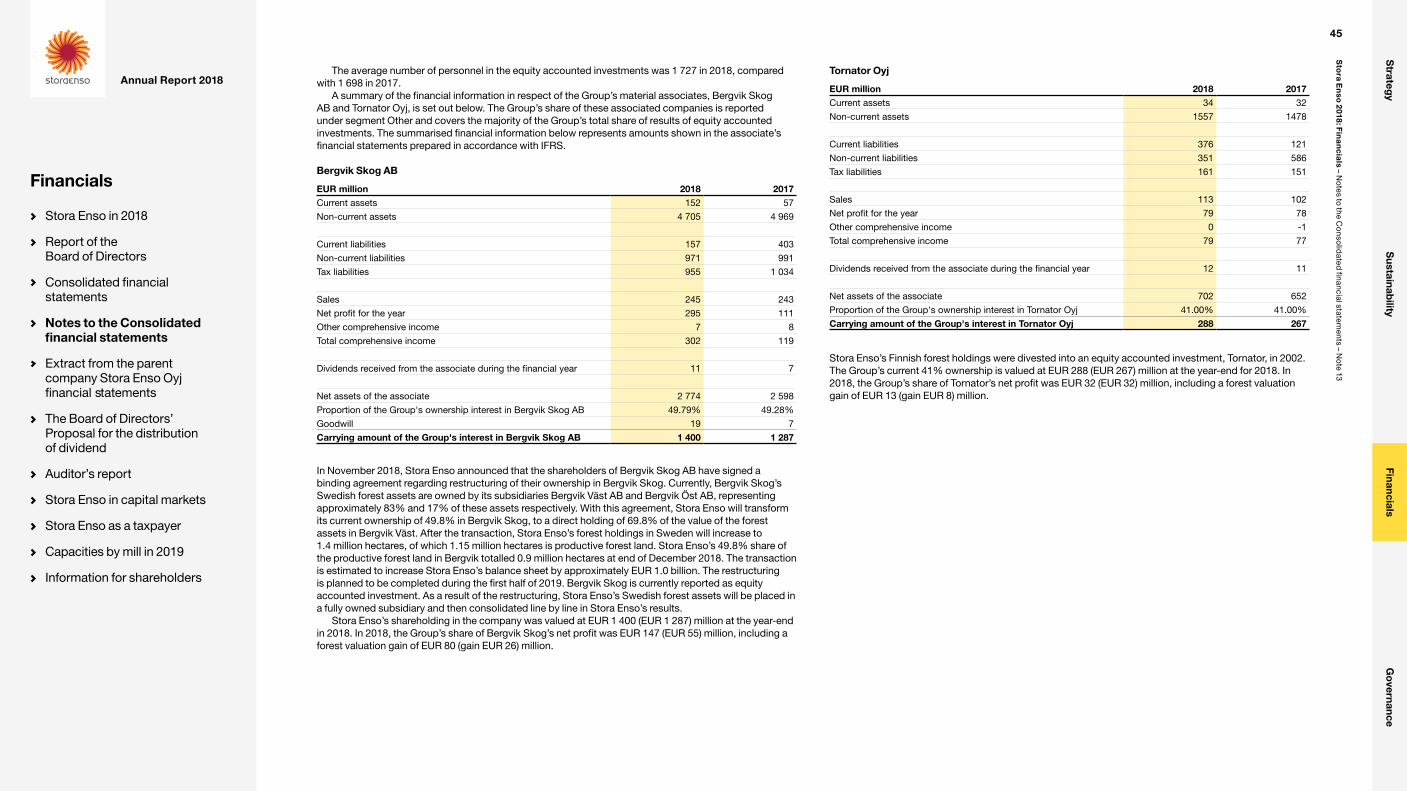
The average number of personnel in the equity accounted investments was 1 727 in 2018, compared with 1 698 in 2017.
A summary of the financial information in respect of the Group’s material associates, Bergvik Skog AB and Tornator Oyj, is set out below. The Group’s share of these associated companies is reported under segment Other and covers the majority of the Group’s total share of results of equity accounted investments. The summarised financial information below represents amounts shown in the associate’s financial statements prepared in accordance with IFRS.
Bergvik Skog AB
EUR million 2018 2017Current assets 152 57
Non-current assets 4 705 4 969
Current liabilities 157 403
Non-current liabilities 971 991
Tax liabilities 955 1 034
Sales 245 243
Net profit for the year 295 111
Other comprehensive income 7 8
Total comprehensive income 302 119
Dividends received from the associate during the financial year 11 7
Net assets of the associate 2 774 2 598
Proportion of the Group's ownership interest in Bergvik Skog AB 49.79% 49.28%
Goodwill 19 7
Carrying amount of the Group's interest in Bergvik Skog AB 1 400 1 287
In November 2018, Stora Enso announced that the shareholders of Bergvik Skog AB have signed a binding agreement regarding restructuring of their ownership in Bergvik Skog. Currently, Bergvik Skog’s Swedish forest assets are owned by its subsidiaries Bergvik Väst AB and Bergvik Öst AB, representing approximately 83% and 17% of these assets respectively. With this agreement, Stora Enso will transform its current ownership of 49.8% in Bergvik Skog, to a direct holding of 69.8% of the value of the forest assets in Bergvik Väst. After the transaction, Stora Enso’s forest holdings in Sweden will increase to 1.4 million hectares, of which 1.15 million hectares is productive forest land. Stora Enso’s 49.8% share of the productive forest land in Bergvik totalled 0.9 million hectares at end of December 2018. The transaction is estimated to increase Stora Enso’s balance sheet by approximately EUR 1.0 billion. The restructuring is planned to be completed during the first half of 2019. Bergvik Skog is currently reported as equity accounted investment. As a result of the restructuring, Stora Enso’s Swedish forest assets will be placed in a fully owned subsidiary and then consolidated line by line in Stora Enso’s results.
Stora Enso’s shareholding in the company was valued at EUR 1 400 (EUR 1 287) million at the year-end in 2018. In 2018, the Group’s share of Bergvik Skog’s net profit was EUR 147 (EUR 55) million, including a forest valuation gain of EUR 80 (gain EUR 26) million.
Tornator Oyj
EUR million 2018 2017Current assets 34 32
Non-current assets 1557 1478
Current liabilities 376 121
Non-current liabilities 351 586
Tax liabilities 161 151
Sales 113 102
Net profit for the year 79 78
Other comprehensive income 0 -1
Total comprehensive income 79 77
Dividends received from the associate during the financial year 12 11
Net assets of the associate 702 652
Proportion of the Group's ownership interest in Tornator Oyj 41.00% 41.00%
Carrying amount of the Group's interest in Tornator Oyj 288 267
Stora Enso’s Finnish forest holdings were divested into an equity accounted investment, Tornator, in 2002. The Group’s current 41% ownership is valued at EUR 288 (EUR 267) million at the year-end for 2018. In 2018, the Group’s share of Tornator’s net profit was EUR 32 (EUR 32) million, including a forest valuation gain of EUR 13 (gain EUR 8) million.
45
Sto
ra En
so 2
018: Fin
an
cia
ls – No
tes to the Co
nsolid
ated financial statem
ents – No
te 13
Strateg
yS
ustainability
FinancialsG
overnance
Annual Report 2018
Financials
Stora Enso in 2018
Report of the Board of Directors
Consolidated financial statements
Notes to the Consolidated financial statements
Extract from the parent company Stora Enso Oyj financial statements
The Board of Directors’ Proposal for the distribution of dividend
Auditor’s report
Stora Enso in capital markets
Stora Enso as a taxpayer
Capacities by mill in 2019
Information for shareholders

Aggregate information of equity accounted investments that are not individually materia
As at 31 December
EUR million 2018 2017PPE1, goodwill and other intangible assets 21 28
Biological assets 14 18
Operative receivables:
Non-current 0 0
Current 16 16
Inventories 1 1
Cash 8 7
Total Assets 61 70
Operative Liabilities:
Non-current 2 4
Current 11 12
Debt:
Non-current 1 1
Current 0 0
Tax liabilities 4 7
Total Liabilities 19 24
Net Equity in the Group Statement of Financial Position 42 46
Represented by
Capital and Reserves 42 45
OCI 0 1
Equity Accounting Value 42 46
Equity Accounting Value for Bergvik Skog AB 1 400 1 287
Equity Accounting Value for Tornator Oyj 288 267
Total Equity Accounting Value 1 729 1 600
1 PPE = Property, Plant and Equipment
Equity accounted investment company balances
As at 31 December
EUR million 2018 2017Receivables from Equity Accounted InvestmentsNon-current loan receivables 2 3
Trade receivables 6 3
Current loan receivables 0 0
Liabilities due to Equity Accounted InvestmentsTrade payables 39 40
Equity accounted investment transactions
Year Ended 31 December
EUR million 2018 2017Sales to equity accounted investments 53 53
Purchases from equity accounted investments 219 215
The Group engages in transactions with equity accounted investments such as sales and purchases of wood. All agreements are negotiated at arm’s length and are conducted on terms that the Group considers customary in the industry and generally no less favourable than would be available from independent third parties.
Total loans including interest receivable to equity accounted investments at the year-end 2018 amounted to EUR 2 (EUR 3) million.
Note 14 Equity instruments
Accounting principles
The Group has elected to classify its equity investments in Pohjolan Voima shares and certain listed shares held by the Group, earlier classified as available-for-sale investments (AFS) under IAS 39, at fair value through other comprehensive income (FVTOCI) under IFRS 9 by applying the irrevocable election for equity instruments under the standard. The gains and losses resulting from changes in the fair value of equity investments under FVTOCI are not recycled to the Income Statement upon impairment or disposal, only dividend income is recognised in the Income Statement. In addition, the Group also has certain equity investments in unlisted shares that are classified as fair value through Income statement.
Summary of values
Year Ended 31 December
EUR million 2018 2017Acquisition cost at 1 JanuaryListed shares 4 4
Unlisted shares 126 121Investments classified as equity instruments (previously available-for-sale) 130 125OCI in opening balance 209 170
Equity Instruments at 1 January 339 295Translation difference -1 -1
Additions 3 8
Change in fair values accounted for as OCI 97 39
Disposals -1 0
Income Statement - gains and losses -2 -2
Carrying Amount at 31 December 435 339
46
Sto
ra En
so 2
018: Fin
an
cia
ls – No
tes to the Co
nsolid
ated financial statem
ents – No
te 14
Strateg
yS
ustainability
FinancialsG
overnance
Annual Report 2018
Financials
Stora Enso in 2018
Report of the Board of Directors
Consolidated financial statements
Notes to the Consolidated financial statements
Extract from the parent company Stora Enso Oyj financial statements
The Board of Directors’ Proposal for the distribution of dividend
Auditor’s report
Stora Enso in capital markets
Stora Enso as a taxpayer
Capacities by mill in 2019
Information for shareholders

Unrealised gains and losses on listed and unlisted shares
Year Ended 31 December
EUR million 2018 2017Net unrealised holding gains (OCI) 306 209
Cost 129 130
Fair Value 435 339
Net unrealised holding gains (OCI) 306 209
Deferred tax -2 -4
Net Unrealised Holding Gains Shown in Equity as OCI 304 205
Change in Net Unrealised Holding Gains Shown in Equity as OCI 98 43
PVO sharesThe Group holds a 15.6% (15.6%) interest in Pohjolan Voima Oy (PVO), a privately-owned group of companies in the energy sector that produces electricity and heat for its shareholders in Finland. Each subsidiary of the PVO group has its own class of shares that entitle the shareholder to the energy produced in proportion to its ownership of that class of share. The shareholders then have an obligation to cover the costs of production, which are generally lower than market prices. The holding is fair valued quarterly using an average of two methods: the discounted cash flow model and trading multiples. The valuation is categorised at level 3 in the fair value hierarchy according to IFRS 13, levels are explained in Note 25 Fair values.
The electricity prices in the model are based on Nordpool prices. Liquid future derivative prices are used for the available years in the model and thereafter increased by an inflation factor. The historical financial statements provide the basis for the cost structure for each of the power assets, which are adjusted by the inflation factor in future years. The discount rate of 4.06% used in the DCF is determined using the weighted average cost of capital method. The trading multiples are derived from a peer group of European companies operating power assets similar to PVO’s. A +/- 5% change in the electricity price used in the DCF would change the valuation by EUR +54 million and EUR -41 million, respectively. A +/- 1% absolute change in the discount rate would change the valuation by EUR -34 million and EUR +100 million, respectively.
As an outcome of the arbitration proceedings, a settlement agreement was signed during 2018 between the plant owner Teollisuuden Voima Oyj (TVO) and the plant supplier AREVA-Siemens Consortium concerning the costs and losses caused by the delay of the Olkiluoto 3 project. As a result, the plant supplier agreed to compensate EUR 450 million to the plant owner TVO. The supplier is entitled to receive an incentive payment, in a maximum amount of EUR 150 million, upon timely completion of the Olkiluoto 3 project. In November 2018 TVO announced that the regular electricity production will start in January 2020 based on the updated start-up schedule. The arbitration proceeding outcome has been taken into account in the valuation. Stora Enso’s indirect share of the capacity of Olkiluoto 3 is approximately 8.9%, through its PVO B2 shares.
PVO shareholding at 31 December 2018
EUR million Share Series % HoldingAsset
CategoryFair Value
2018Fair Value
2017PVO-Vesivoima Oy A 20.6 Hydro 166 155
Teollisuuden Voima Oyj B 15.7 Nuclear 243 148
Teollisuuden Voima Oyj B2 14.8Nuclear under
construction 0 0
Other C,C2,V,M Various Various 6 5
Total 415 308
The valuation in 2018 amounted to EUR 415 (EUR 308) million against cost value of EUR 118 (EUR 116) million, with the revaluation of EUR 297 (EUR 192) million being taken to other comprehensive income. The change in PVO’s value is mainly caused by increase in electricity market prices. No deferred tax is appropriate as under Finnish tax regulations holdings above 10% are exempt from tax on disposal proceeds.
Principal equity instruments
31 December 2018
EUR million Holding %Number of
SharesAcquisition
Cost Fair ValuePackages Ltd, Pakistan - listed shares 5 396 650 4 13
Total Listed Shares 4 13Pohjolan Voima Oy - unlisted shares 15.6 5 073 972 118 415
Others - unlisted shares 7 7
Total Unlisted Shares 125 422Total Equity instruments at 31 December 2018 129 435Total Available-for-sale Investments at 31 December 2017 130 339
The difference of EUR 306 (EUR 209) million between the initial acquisition cost and reporting date fair value of the equity instruments (previously available-for-sale investments) represents the OCI reserve as shown in the Statement of changes in equity.
Note 15 Other non-current assets
As at 31 December
EUR million 2018 2017Prepaid expenses and accrued income 19 18
Tax credit 16 17
Other non-current operative assets 13 15
Total 48 50
Note 16 Inventories
Accounting principles
Inventories are reported at lower of cost and net realisable value with the cost determined by the first-in first-out (FIFO) method or, alternatively, by the weighted average cost where it approximates FIFO. The cost of finished goods and work in progress comprises raw material, direct labour, depreciation, other direct costs and related production overheads but excludes interest expenses. Net realisable value is the estimated selling price in the ordinary course of business, less the costs of completion and sale.
Where market conditions result in the manufacturing costs of a product exceeding its net realisable value, a valuation allowance is made. Valuation allowances are also made for old, slow moving and obsolete finished goods and spare parts. Such valuation allowances are deducted from the carrying value of the inventories in the consolidated statement of financial position.
47
Sto
ra En
so 2
018: Fin
an
cia
ls – No
tes to the Co
nsolid
ated financial statem
ents – No
te 15
Strateg
yS
ustainability
FinancialsG
overnance
Annual Report 2018
Financials
Stora Enso in 2018
Report of the Board of Directors
Consolidated financial statements
Notes to the Consolidated financial statements
Extract from the parent company Stora Enso Oyj financial statements
The Board of Directors’ Proposal for the distribution of dividend
Auditor’s report
Stora Enso in capital markets
Stora Enso as a taxpayer
Capacities by mill in 2019
Information for shareholders
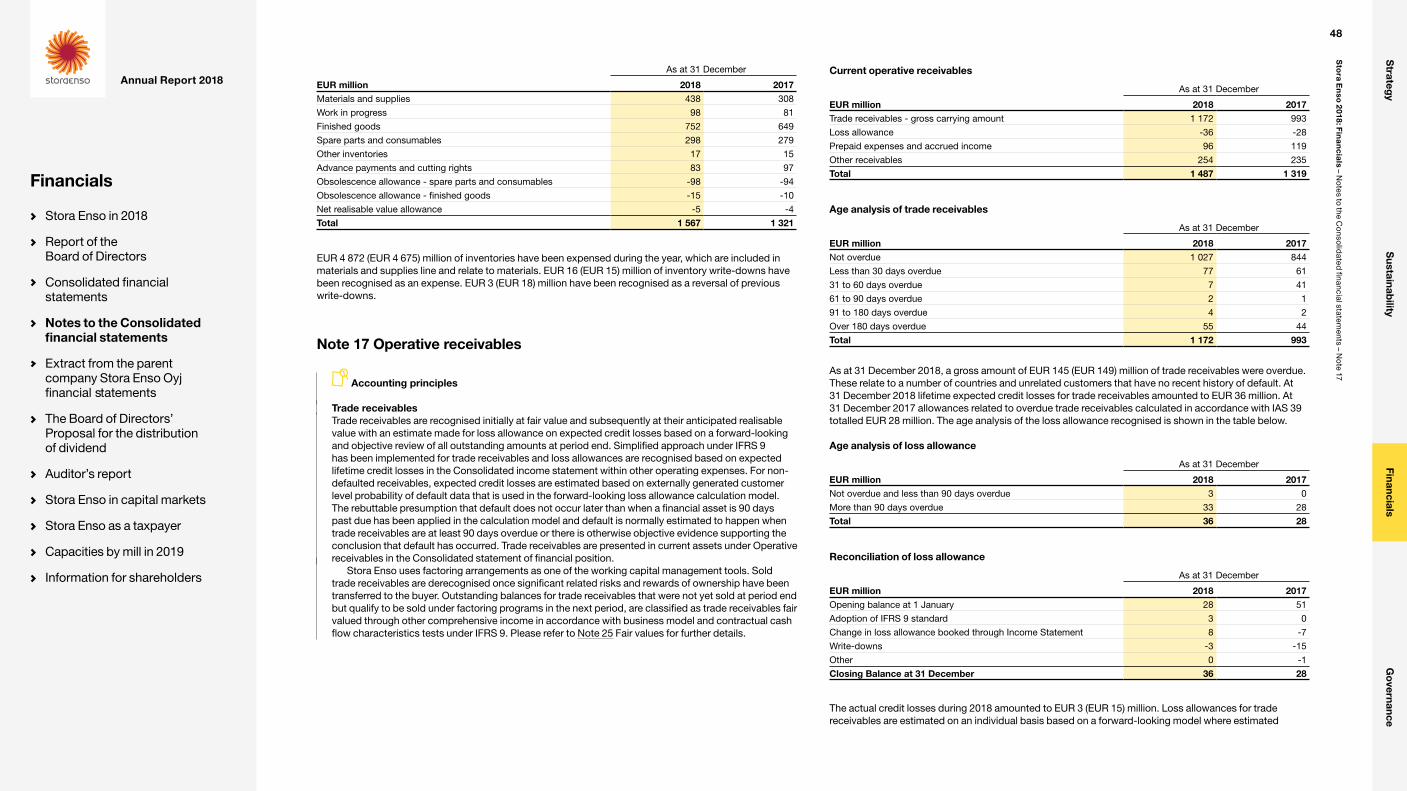
Current operative receivables
As at 31 December
EUR million 2018 2017Trade receivables - gross carrying amount 1 172 993
Loss allowance -36 -28
Prepaid expenses and accrued income 96 119
Other receivables 254 235
Total 1 487 1 319
Age analysis of trade receivables
As at 31 December
EUR million 2018 2017Not overdue 1 027 844
Less than 30 days overdue 77 61
31 to 60 days overdue 7 41
61 to 90 days overdue 2 1
91 to 180 days overdue 4 2
Over 180 days overdue 55 44
Total 1 172 993
As at 31 December 2018, a gross amount of EUR 145 (EUR 149) million of trade receivables were overdue. These relate to a number of countries and unrelated customers that have no recent history of default. At 31 December 2018 lifetime expected credit losses for trade receivables amounted to EUR 36 million. At 31 December 2017 allowances related to overdue trade receivables calculated in accordance with IAS 39 totalled EUR 28 million. The age analysis of the loss allowance recognised is shown in the table below.
Age analysis of loss allowance
As at 31 December
EUR million 2018 2017Not overdue and less than 90 days overdue 3 0
More than 90 days overdue 33 28
Total 36 28
Reconciliation of loss allowance
As at 31 December
EUR million 2018 2017Opening balance at 1 January 28 51
Adoption of IFRS 9 standard 3 0
Change in loss allowance booked through Income Statement 8 -7
Write-downs -3 -15
Other 0 -1
Closing Balance at 31 December 36 28
The actual credit losses during 2018 amounted to EUR 3 (EUR 15) million. Loss allowances for trade receivables are estimated on an individual basis based on a forward-looking model where estimated
As at 31 December
EUR million 2018 2017Materials and supplies 438 308
Work in progress 98 81
Finished goods 752 649
Spare parts and consumables 298 279
Other inventories 17 15
Advance payments and cutting rights 83 97
Obsolescence allowance - spare parts and consumables -98 -94
Obsolescence allowance - finished goods -15 -10
Net realisable value allowance -5 -4
Total 1 567 1 321
EUR 4 872 (EUR 4 675) million of inventories have been expensed during the year, which are included in materials and supplies line and relate to materials. EUR 16 (EUR 15) million of inventory write-downs have been recognised as an expense. EUR 3 (EUR 18) million have been recognised as a reversal of previous write-downs.
Note 17 Operative receivables
Accounting principles
Trade receivablesTrade receivables are recognised initially at fair value and subsequently at their anticipated realisable value with an estimate made for loss allowance on expected credit losses based on a forward-looking and objective review of all outstanding amounts at period end. Simplified approach under IFRS 9 has been implemented for trade receivables and loss allowances are recognised based on expected lifetime credit losses in the Consolidated income statement within other operating expenses. For non-defaulted receivables, expected credit losses are estimated based on externally generated customer level probability of default data that is used in the forward-looking loss allowance calculation model. The rebuttable presumption that default does not occur later than when a financial asset is 90 days past due has been applied in the calculation model and default is normally estimated to happen when trade receivables are at least 90 days overdue or there is otherwise objective evidence supporting the conclusion that default has occurred. Trade receivables are presented in current assets under Operative receivables in the Consolidated statement of financial position.
Stora Enso uses factoring arrangements as one of the working capital management tools. Sold trade receivables are derecognised once significant related risks and rewards of ownership have been transferred to the buyer. Outstanding balances for trade receivables that were not yet sold at period end but qualify to be sold under factoring programs in the next period, are classified as trade receivables fair valued through other comprehensive income in accordance with business model and contractual cash flow characteristics tests under IFRS 9. Please refer to Note 25 Fair values for further details.
48
Sto
ra En
so 2
018: Fin
an
cia
ls – No
tes to the Co
nsolid
ated financial statem
ents – No
te 17
Strateg
yS
ustainability
FinancialsG
overnance
Annual Report 2018
Financials
Stora Enso in 2018
Report of the Board of Directors
Consolidated financial statements
Notes to the Consolidated financial statements
Extract from the parent company Stora Enso Oyj financial statements
The Board of Directors’ Proposal for the distribution of dividend
Auditor’s report
Stora Enso in capital markets
Stora Enso as a taxpayer
Capacities by mill in 2019
Information for shareholders
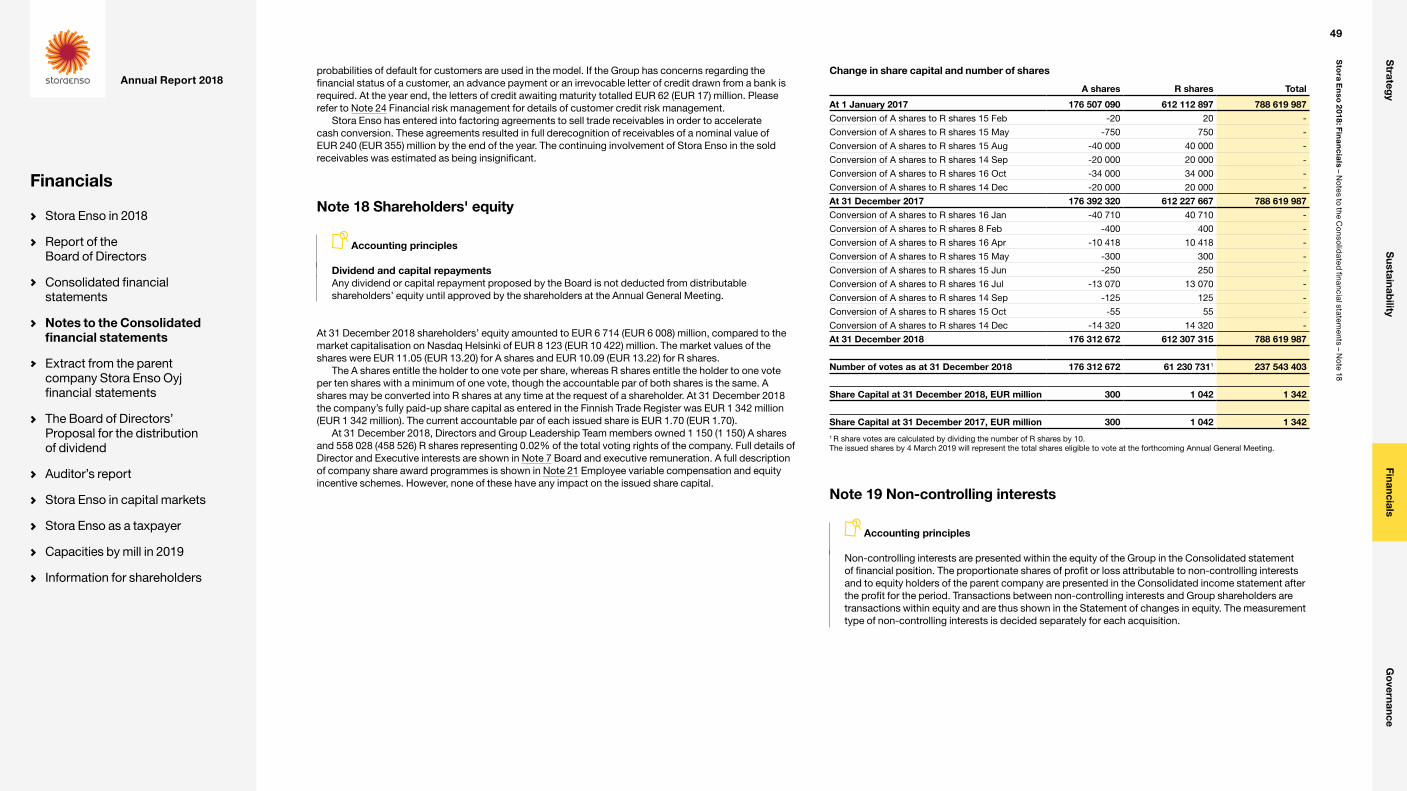
probabilities of default for customers are used in the model. If the Group has concerns regarding the financial status of a customer, an advance payment or an irrevocable letter of credit drawn from a bank is required. At the year end, the letters of credit awaiting maturity totalled EUR 62 (EUR 17) million. Please refer to Note 24 Financial risk management for details of customer credit risk management.
Stora Enso has entered into factoring agreements to sell trade receivables in order to accelerate cash conversion. These agreements resulted in full derecognition of receivables of a nominal value of EUR 240 (EUR 355) million by the end of the year. The continuing involvement of Stora Enso in the sold receivables was estimated as being insignificant.
Change in share capital and number of shares
A shares R shares Total
At 1 January 2017 176 507 090 612 112 897 788 619 987Conversion of A shares to R shares 15 Feb -20 20 -
Conversion of A shares to R shares 15 May -750 750 -
Conversion of A shares to R shares 15 Aug -40 000 40 000 -
Conversion of A shares to R shares 14 Sep -20 000 20 000 -
Conversion of A shares to R shares 16 Oct -34 000 34 000 -
Conversion of A shares to R shares 14 Dec -20 000 20 000 -
At 31 December 2017 176 392 320 612 227 667 788 619 987Conversion of A shares to R shares 16 Jan -40 710 40 710 -
Conversion of A shares to R shares 8 Feb -400 400 -
Conversion of A shares to R shares 16 Apr -10 418 10 418 -
Conversion of A shares to R shares 15 May -300 300 -
Conversion of A shares to R shares 15 Jun -250 250 -
Conversion of A shares to R shares 16 Jul -13 070 13 070 -
Conversion of A shares to R shares 14 Sep -125 125 -
Conversion of A shares to R shares 15 Oct -55 55 -
Conversion of A shares to R shares 14 Dec -14 320 14 320 -
At 31 December 2018 176 312 672 612 307 315 788 619 987
Number of votes as at 31 December 2018 176 312 672 61 230 7311 237 543 403
Share Capital at 31 December 2018, EUR million 300 1 042 1 342
Share Capital at 31 December 2017, EUR million 300 1 042 1 3421 R share votes are calculated by dividing the number of R shares by 10.The issued shares by 4 March 2019 will represent the total shares eligible to vote at the forthcoming Annual General Meeting.
Note 18 Shareholders' equity
Accounting principles
Dividend and capital repaymentsAny dividend or capital repayment proposed by the Board is not deducted from distributable shareholders’ equity until approved by the shareholders at the Annual General Meeting.
At 31 December 2018 shareholders’ equity amounted to EUR 6 714 (EUR 6 008) million, compared to the market capitalisation on Nasdaq Helsinki of EUR 8 123 (EUR 10 422) million. The market values of the shares were EUR 11.05 (EUR 13.20) for A shares and EUR 10.09 (EUR 13.22) for R shares.
The A shares entitle the holder to one vote per share, whereas R shares entitle the holder to one vote per ten shares with a minimum of one vote, though the accountable par of both shares is the same. A shares may be converted into R shares at any time at the request of a shareholder. At 31 December 2018 the company’s fully paid-up share capital as entered in the Finnish Trade Register was EUR 1 342 million (EUR 1 342 million). The current accountable par of each issued share is EUR 1.70 (EUR 1.70).
At 31 December 2018, Directors and Group Leadership Team members owned 1 150 (1 150) A shares and 558 028 (458 526) R shares representing 0.02% of the total voting rights of the company. Full details of Director and Executive interests are shown in Note 7 Board and executive remuneration. A full description of company share award programmes is shown in Note 21 Employee variable compensation and equity incentive schemes. However, none of these have any impact on the issued share capital.
Note 19 Non-controlling interests
Accounting principles
Non-controlling interests are presented within the equity of the Group in the Consolidated statement of financial position. The proportionate shares of profit or loss attributable to non-controlling interests and to equity holders of the parent company are presented in the Consolidated income statement after the profit for the period. Transactions between non-controlling interests and Group shareholders are transactions within equity and are thus shown in the Statement of changes in equity. The measurement type of non-controlling interests is decided separately for each acquisition.
49
Sto
ra En
so 2
018: Fin
an
cia
ls – No
tes to the Co
nsolid
ated financial statem
ents – No
te 18
Strateg
yS
ustainability
FinancialsG
overnance
Annual Report 2018
Financials
Stora Enso in 2018
Report of the Board of Directors
Consolidated financial statements
Notes to the Consolidated financial statements
Extract from the parent company Stora Enso Oyj financial statements
The Board of Directors’ Proposal for the distribution of dividend
Auditor’s report
Stora Enso in capital markets
Stora Enso as a taxpayer
Capacities by mill in 2019
Information for shareholders
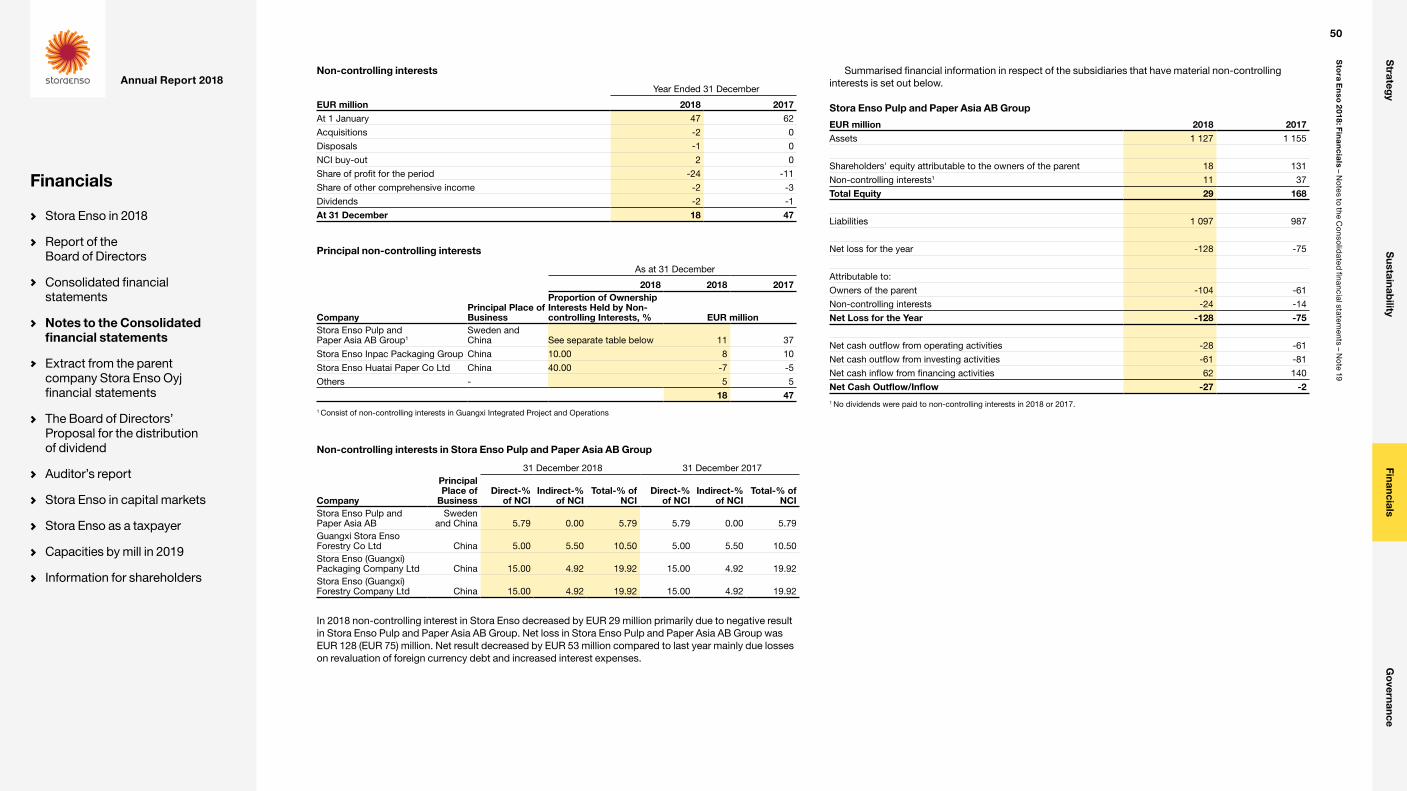
Non-controlling interests
Year Ended 31 December
EUR million 2018 2017At 1 January 47 62
Acquisitions -2 0
Disposals -1 0
NCI buy-out 2 0
Share of profit for the period -24 -11
Share of other comprehensive income -2 -3
Dividends -2 -1
At 31 December 18 47
Principal non-controlling interests
As at 31 December
2018 2018 2017
CompanyPrincipal Place of Business
Proportion of Ownership Interests Held by Non-controlling Interests, % EUR million
Stora Enso Pulp and Paper Asia AB Group1
Sweden and China See separate table below 11 37
Stora Enso Inpac Packaging Group China 10.00 8 10
Stora Enso Huatai Paper Co Ltd China 40.00 -7 -5
Others - 5 5
18 47
1 Consist of non-controlling interests in Guangxi Integrated Project and Operations
Non-controlling interests in Stora Enso Pulp and Paper Asia AB Group
31 December 2018 31 December 2017
Company
Principal Place of
BusinessDirect-%
of NCIIndirect-%
of NCITotal-% of
NCIDirect-%
of NCIIndirect-%
of NCITotal-% of
NCIStora Enso Pulp and Paper Asia AB
Sweden and China 5.79 0.00 5.79 5.79 0.00 5.79
Guangxi Stora Enso Forestry Co Ltd China 5.00 5.50 10.50 5.00 5.50 10.50Stora Enso (Guangxi) Packaging Company Ltd China 15.00 4.92 19.92 15.00 4.92 19.92Stora Enso (Guangxi) Forestry Company Ltd China 15.00 4.92 19.92 15.00 4.92 19.92
In 2018 non-controlling interest in Stora Enso decreased by EUR 29 million primarily due to negative result in Stora Enso Pulp and Paper Asia AB Group. Net loss in Stora Enso Pulp and Paper Asia AB Group was EUR 128 (EUR 75) million. Net result decreased by EUR 53 million compared to last year mainly due losses on revaluation of foreign currency debt and increased interest expenses.
Summarised financial information in respect of the subsidiaries that have material non-controlling interests is set out below.
Stora Enso Pulp and Paper Asia AB Group
EUR million 2018 2017Assets 1 127 1 155
Shareholders' equity attributable to the owners of the parent 18 131
Non-controlling interests1 11 37
Total Equity 29 168
Liabilities 1 097 987
Net loss for the year -128 -75
Attributable to:
Owners of the parent -104 -61
Non-controlling interests -24 -14
Net Loss for the Year -128 -75
Net cash outflow from operating activities -28 -61
Net cash outflow from investing activities -61 -81
Net cash inflow from financing activities 62 140
Net Cash Outflow/Inflow -27 -2
1 No dividends were paid to non-controlling interests in 2018 or 2017.
50
Sto
ra En
so 2
018: Fin
an
cia
ls – No
tes to the Co
nsolid
ated financial statem
ents – No
te 19
Strateg
yS
ustainability
FinancialsG
overnance
Annual Report 2018
Financials
Stora Enso in 2018
Report of the Board of Directors
Consolidated financial statements
Notes to the Consolidated financial statements
Extract from the parent company Stora Enso Oyj financial statements
The Board of Directors’ Proposal for the distribution of dividend
Auditor’s report
Stora Enso in capital markets
Stora Enso as a taxpayer
Capacities by mill in 2019
Information for shareholders

Note 20 Post-employment benefits
Accounting principles
Employee benefitsThe Group operates a number of defined benefit and contribution plans throughout the world, the assets of which are generally held in separate trustee administered funds. Such pension and post-retirement plans are generally funded by payments from employees and by the relevant group companies, taking into account the recommendations of independent qualified actuaries. Employer contributions to the defined contribution pension plans are charged to the Consolidated income statement in the year they relate to.
For defined benefit plans, accounting values are assessed using the projected unit credit method. Under this method, the cost of providing pensions is charged to the Consolidated Income Statement to spread the regular cost over the service lives of employees in accordance with the advice of qualified actuaries who carry out a full valuation of the plan every year in all major pension countries. The pension obligation is measured as the present value of the estimated future cash outflows using interest rates of highly rated corporate bonds or government securities, as appropriate, that match the currency and expected duration of the related liability.
The Group immediately recognises all actuarial gains and losses arising from defined benefit plans directly in equity, as disclosed in its Consolidated Statement of Comprehensive Income. Past service costs are identified at the time of any amendments to the plans and are recognised immediately in the Consolidated income statement regardless of vesting requirements. In the group’s Consolidated statement of financial position, the full liability for all plan deficits is recorded.
The Group has established a number of pension and other benefit plans for its operations throughout the world, the cost amounted to EUR 170 (EUR 166) million in 2018, as shown in Note 6 Personnel expenses. The majority of the plans are defined contribution schemes and the charge amounted to EUR 160 (EUR 154) million.
In accordance with their respective pension arrangements, Group Leadership Team members may retire at 65 years of age with pensions consistent with local practices in their respective home countries. The retirement age for other management teams in companies in the Stora Enso Group follows local law and practices, though some management team members have older agreements with the right to retire earlier, between 60 and 65 years. The retirement age for other staff either follows national retirement ages or is determined by local labour agreements. In the latter case, there may be certain pre-retirement liabilities accruing to the company to cover the income of the early retirees between the age at which they ceased working and the national retirement age.
Stora Enso’s total defined benefit obligations for current and former members of staff amount to EUR 1 115 (EUR 1 139) million, though assets of EUR 714 (EUR 762) million have been put aside in various pension schemes to cover these liabilities. The net funding position of the defined benefit plans is shown in full in the Statement of Financial Position and amounted to EUR 401 million in 2018, an increase of EUR 24 million on the previous year’s liability of EUR 377 million. This increase is mainly caused by the actuarial losses which result from the change in financial assumptions regarding present value of the defined benefit obligations. Interest costs are entered under financial costs. The 2018 defined benefit expense in the Income Statement amounts to EUR 16 million and the actuarial losses recorded in other comprehensive income amount to EUR 24 million. The 2017 defined benefit expense in the Income Statement amounted to EUR 19 million and the actuarial gains recorded in other comprehensive income amounted to EUR 61 million.
Actuarial gains/losses recognised directly in equity
Year Ended 31 December
Total Operations
EUR million 2018 2017Actuarial gains/losses -24 61
Deferred tax thereon 4 -10
Total -20 51
Group policy for funding deficits is intended to satisfy local statutory funding requirements for tax deductible contributions together with adjusting the discount factors used in the actuarial calculations for market rates. However, the emphasis of the Group is to provide defined contribution schemes for its post-employment benefits, thus all aspects of the provision and accounting for defined benefit schemes are evaluated. The net liability in the Group Statement of financial position reflects the actual deficits in the defined benefit plans. Details of the pension arrangements, assets and investment policies in the Group’s main operating countries are shown below.
FinlandThe Group funds its Finnish pension obligations mainly through defined contribution schemes, the charge in the Income Statement being EUR 73 (EUR 72) million. By contrast, the remaining obligations covered by defined benefit schemes resulted in a charge of EUR 1 (EUR 1) million excluding finance costs. Pension cover since 2001 has been organised entirely through local insurance companies. The total defined benefit obligation amounts to EUR 302 (EUR 318) million and the assets to EUR 278 (EUR 294) million, leaving a net liability of EUR 25 (EUR 24) million. As state pensions in Finland provide by far the greatest proportion of pensions, Group liabilities are proportionately much smaller than in comparable countries.
Plan assets in Finland are managed by insurance companies. Details of the exact structure and investment strategy surrounding plan assets are not available to participating employers as the assets actually belong to the insurance companies themselves. The assets are managed in accordance with EU regulations, and also national requirements, under which there is an obligation to pay guaranteed benefits irrespective of market conditions.
GermanyGerman pension costs amounted to EUR 8 (EUR 7) million, of which EUR 7 (EUR 6) million related to defined contribution schemes and EUR 1 (EUR 1) million to defined benefits excluding finance costs. The total defined benefit obligation is EUR 245 (EUR 258) million, nearly all of which is unfunded as total assets come to only EUR 7 (EUR 7) million. The net liability decreased from EUR 251 million to EUR 238 million. The decrease in net liability arose mainly from an increase in the discount rate and changes in experience. Defined benefit pension plans are mainly accounted for in the Statement of financial position through book reserves with some minor plans using insurance companies or independent trustees. Retirement benefits are based on years worked and salaries received during the pensionable service and the commencement of pension payments are linked to the national pension scheme’s retirement age. Pensions are paid directly by the companies themselves to their former employees, the security for the pensioners is provided by the legal requirement that the book reserves held in the Statement of financial position are insured up to certain limits.
SwedenIn Sweden, most blue-collar workers are covered by defined contribution schemes, the charge in the Income statement being EUR 56 (EUR 56) million, with defined benefit schemes covering mainly white-collar staff.
Total defined benefit obligations amounted to EUR 370 (EUR 352) million and the assets came to EUR 278 (EUR 298) million, leaving a net liability of EUR 92 million at the year end, compared with a net liability of EUR 54 million the year before. This increase in net liability arose from a decrease in the discount
51
Sto
ra En
so 2
018: Fin
an
cia
ls – No
tes to the Co
nsolid
ated financial statem
ents – No
te 20
Strateg
yS
ustainability
FinancialsG
overnance
Annual Report 2018
Financials
Stora Enso in 2018
Report of the Board of Directors
Consolidated financial statements
Notes to the Consolidated financial statements
Extract from the parent company Stora Enso Oyj financial statements
The Board of Directors’ Proposal for the distribution of dividend
Auditor’s report
Stora Enso in capital markets
Stora Enso as a taxpayer
Capacities by mill in 2019
Information for shareholders

rate and changes in financial assumptions and experience. Stora Enso has undertaken to pay all local legal pension liabilities for the main ITP scheme to the foundation, thus the remaining liability relates to other small schemes.
The long-term investment return target for the foundation is a 3% real return after tax. Stora Enso’s Swedish pension fund conducts an annual asset/liability study to optimise its risk parameters.
Other countriesTotal defined benefit obligations in the remaining countries amounted to EUR 198 (EUR 211) million and the assets to EUR 151 (EUR 163) million. The net liability came to EUR 46 (EUR 48) million. Obligations and assets were material only in the United Kingdom, at EUR 132 (EUR 145) million and EUR 121 (EUR 129) million, respectively, leaving a net liability of EUR 11 (EUR 16) million at the end of 2018. The reduction in net liability arose from changes in actuarial assumptions.
Group
Net defined benefit obligation reconciliation
Year Ended 31 December
EUR million 2018 2017Present Value of Defined Benefit ObligationDefined benefit obligation at 1 January 1 139 1 223
Translation difference -15 -17
Interest on liabilities 21 20
Current service cost 11 13
Past service cost -2 0Actuarial gains and losses on defined benefit obligation arising from changes in demographic assumptions -3 -3Actuarial gains and losses on defined benefit obligation arising from changes in financial assumptions 27 -10Actuarial gains and losses on defined benefit obligation arising from experience adjustments 2 -24
Benefit payments -61 -63
Net disposals/acquisitions -1 -1
Other -2 1
Defined benefit obligation at 31 December 1 115 1 139Fair Value of Plan AssetFair value of plan asset at 1 January -762 -787
Translation difference 13 13
Expected return on plan assets -15 -14
Actuarial gain/loss on plan assets -1 -24
Employer contributions 3 3
Benefit payments 45 47
Other 3 0
Fair value of plan asset at 31 December -714 -762
Net Defined Benefit Obligation 401 377
Amounts Recognised on the Statement of Financial Position – Defined Benefit Plans
As at 31 DecemberTotal Defined Benefit
PlansDefined Benefit Pension
PlansOther Post-Employment
Benefits
EUR million 2018 2017 2018 2017 2018 2017Present value of funded obligations 841 851 841 851 0 0Present value of unfunded obligations 274 288 249 264 25 24Defined benefit obligations (DBO) 1 115 1 139 1 090 1 115 25 24Fair value of plan assets 714 762 714 762 0 0Net Liability in Defined Benefit Plans 401 377 376 353 25 24
Amounts Recognised in the Income Statement
Year Ended 31 DecemberTotal Defined Benefit
PlansDefined Benefit Pension
PlansOther Post-Employment
Benefits
EUR million 2018 2017 2018 2017 2018 2017Operating costsCurrent service cost 11 13 10 12 1 1
Past service cost -1 0 -1 0 0 0
Finance costNet interest on net defined benefit liability 6 6 6 6 0 0Cost recognised in Income Statement 16 19 15 18 1 1
Statement of Actuarial Gains and Losses
Year Ended 31 December
EUR million 2018 2017Gain/loss on pension scheme assets 1 24
Gain/loss arising on pension scheme liabilities -25 37
Total Gain/loss -24 61
Defined Benefit Plans: Country Assumptions Used in Calculating Benefit Obligations
Year Ended 31 December
Finland Germany Sweden
2018 2017 2018 2017 2018 2017Discount rate % 1.2 1.4 1.6 1.5 2.3 2.5
Future salary increase % 2.7 2.5 2.5 2.5 2.9 2.7
Future pension increase % 1.8 1.8 1.8 1.8 2.0 1.8Average current retirement age 64.0 64.0 63.0 63.0 65.0 65.0Weighted average life expectancy 87.0 87.0 87.0 86.0 89.3 89.3
52
Sto
ra En
so 2
018: Fin
an
cia
ls – No
tes to the Co
nsolid
ated financial statem
ents – No
te 20
Strateg
yS
ustainability
FinancialsG
overnance
Annual Report 2018
Financials
Stora Enso in 2018
Report of the Board of Directors
Consolidated financial statements
Notes to the Consolidated financial statements
Extract from the parent company Stora Enso Oyj financial statements
The Board of Directors’ Proposal for the distribution of dividend
Auditor’s report
Stora Enso in capital markets
Stora Enso as a taxpayer
Capacities by mill in 2019
Information for shareholders
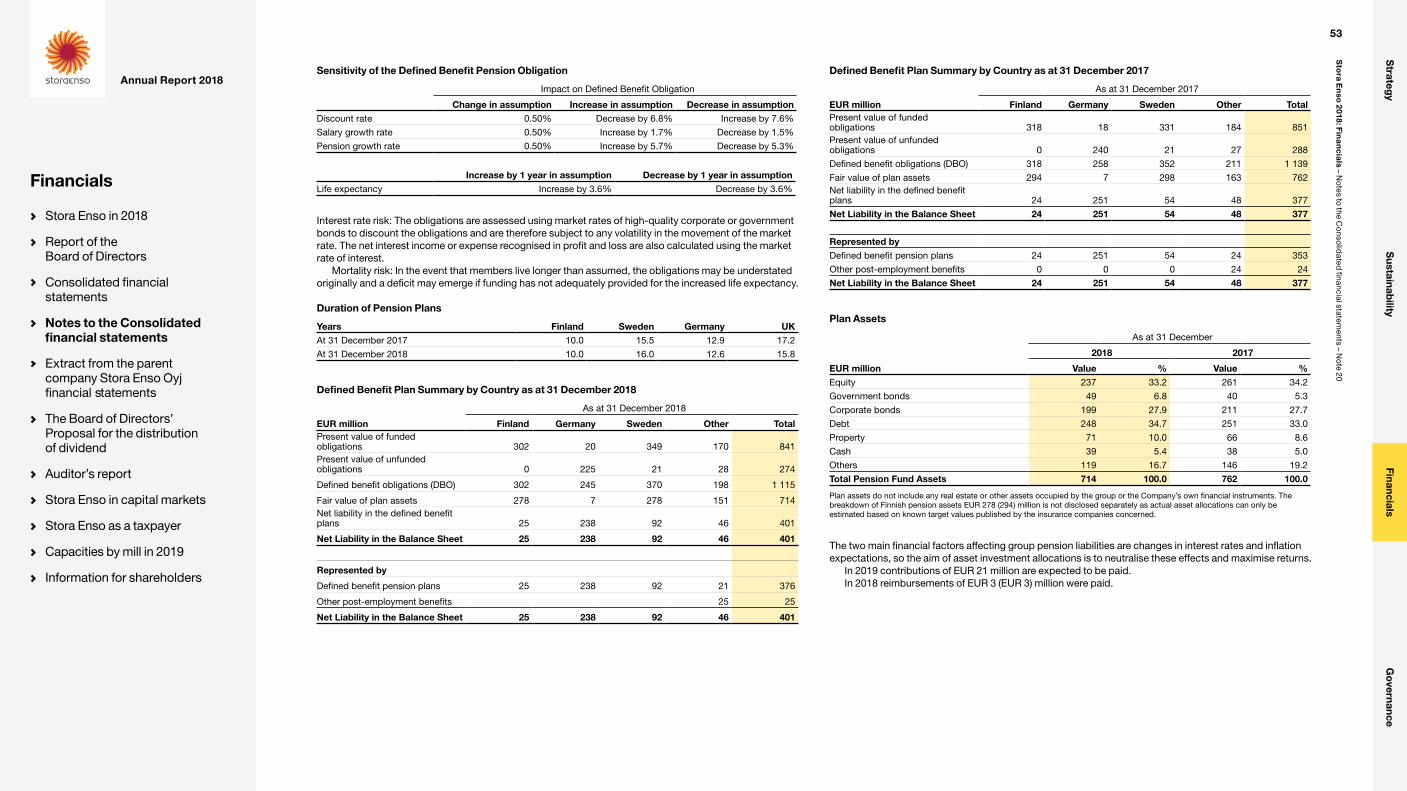
Sensitivity of the Defined Benefit Pension Obligation
Impact on Defined Benefit Obligation
Change in assumption Increase in assumption Decrease in assumptionDiscount rate 0.50% Decrease by 6.8% Increase by 7.6%
Salary growth rate 0.50% Increase by 1.7% Decrease by 1.5%
Pension growth rate 0.50% Increase by 5.7% Decrease by 5.3%
Increase by 1 year in assumption Decrease by 1 year in assumptionLife expectancy Increase by 3.6% Decrease by 3.6%
Interest rate risk: The obligations are assessed using market rates of high-quality corporate or government bonds to discount the obligations and are therefore subject to any volatility in the movement of the market rate. The net interest income or expense recognised in profit and loss are also calculated using the market rate of interest.
Mortality risk: In the event that members live longer than assumed, the obligations may be understated originally and a deficit may emerge if funding has not adequately provided for the increased life expectancy.
Duration of Pension Plans
Years Finland Sweden Germany UKAt 31 December 2017 10.0 15.5 12.9 17.2
At 31 December 2018 10.0 16.0 12.6 15.8
Defined Benefit Plan Summary by Country as at 31 December 2018
As at 31 December 2018
EUR million Finland Germany Sweden Other TotalPresent value of funded obligations 302 20 349 170 841Present value of unfunded obligations 0 225 21 28 274
Defined benefit obligations (DBO) 302 245 370 198 1 115
Fair value of plan assets 278 7 278 151 714Net liability in the defined benefit plans 25 238 92 46 401
Net Liability in the Balance Sheet 25 238 92 46 401
Represented by
Defined benefit pension plans 25 238 92 21 376
Other post-employment benefits 25 25
Net Liability in the Balance Sheet 25 238 92 46 401
Defined Benefit Plan Summary by Country as at 31 December 2017
As at 31 December 2017
EUR million Finland Germany Sweden Other TotalPresent value of funded obligations 318 18 331 184 851Present value of unfunded obligations 0 240 21 27 288
Defined benefit obligations (DBO) 318 258 352 211 1 139
Fair value of plan assets 294 7 298 163 762Net liability in the defined benefit plans 24 251 54 48 377
Net Liability in the Balance Sheet 24 251 54 48 377
Represented byDefined benefit pension plans 24 251 54 24 353
Other post-employment benefits 0 0 0 24 24
Net Liability in the Balance Sheet 24 251 54 48 377
Plan Assets
As at 31 December
2018 2017
EUR million Value % Value %Equity 237 33.2 261 34.2
Government bonds 49 6.8 40 5.3
Corporate bonds 199 27.9 211 27.7
Debt 248 34.7 251 33.0
Property 71 10.0 66 8.6
Cash 39 5.4 38 5.0
Others 119 16.7 146 19.2
Total Pension Fund Assets 714 100.0 762 100.0
Plan assets do not include any real estate or other assets occupied by the group or the Company’s own financial instruments. The breakdown of Finnish pension assets EUR 278 (294) million is not disclosed separately as actual asset allocations can only be estimated based on known target values published by the insurance companies concerned.
The two main financial factors affecting group pension liabilities are changes in interest rates and inflation expectations, so the aim of asset investment allocations is to neutralise these effects and maximise returns.
In 2019 contributions of EUR 21 million are expected to be paid.In 2018 reimbursements of EUR 3 (EUR 3) million were paid.
53
Sto
ra En
so 2
018: Fin
an
cia
ls – No
tes to the Co
nsolid
ated financial statem
ents – No
te 20
Strateg
yS
ustainability
FinancialsG
overnance
Annual Report 2018
Financials
Stora Enso in 2018
Report of the Board of Directors
Consolidated financial statements
Notes to the Consolidated financial statements
Extract from the parent company Stora Enso Oyj financial statements
The Board of Directors’ Proposal for the distribution of dividend
Auditor’s report
Stora Enso in capital markets
Stora Enso as a taxpayer
Capacities by mill in 2019
Information for shareholders
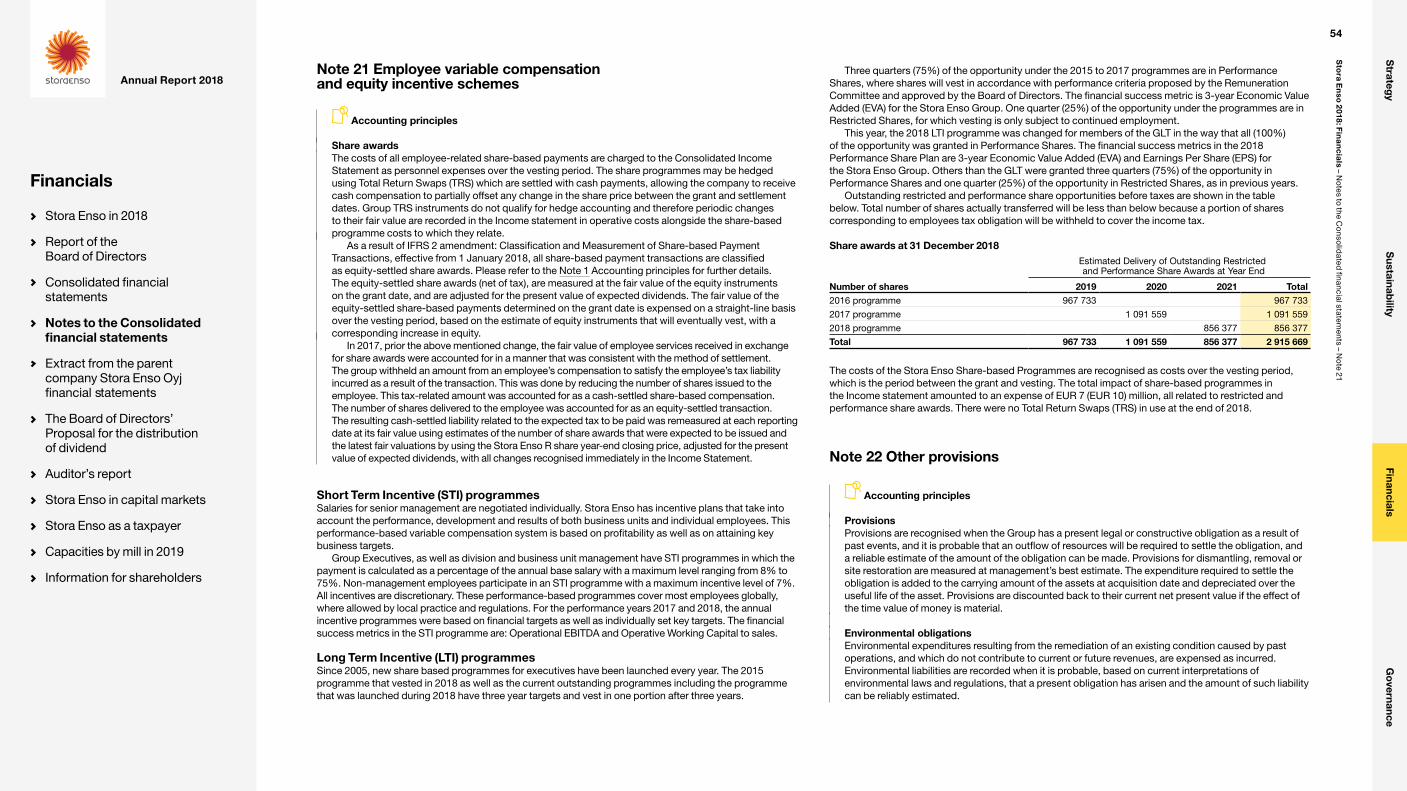
Note 21 Employee variable compensation and equity incentive schemes
Accounting principles
Share awardsThe costs of all employee-related share-based payments are charged to the Consolidated Income Statement as personnel expenses over the vesting period. The share programmes may be hedged using Total Return Swaps (TRS) which are settled with cash payments, allowing the company to receive cash compensation to partially offset any change in the share price between the grant and settlement dates. Group TRS instruments do not qualify for hedge accounting and therefore periodic changes to their fair value are recorded in the Income statement in operative costs alongside the share-based programme costs to which they relate.
As a result of IFRS 2 amendment: Classification and Measurement of Share-based Payment Transactions, effective from 1 January 2018, all share-based payment transactions are classified as equity-settled share awards. Please refer to the Note 1 Accounting principles for further details. The equity-settled share awards (net of tax), are measured at the fair value of the equity instruments on the grant date, and are adjusted for the present value of expected dividends. The fair value of the equity-settled share-based payments determined on the grant date is expensed on a straight-line basis over the vesting period, based on the estimate of equity instruments that will eventually vest, with a corresponding increase in equity.
In 2017, prior the above mentioned change, the fair value of employee services received in exchange for share awards were accounted for in a manner that was consistent with the method of settlement. The group withheld an amount from an employee’s compensation to satisfy the employee’s tax liability incurred as a result of the transaction. This was done by reducing the number of shares issued to the employee. This tax-related amount was accounted for as a cash-settled share-based compensation. The number of shares delivered to the employee was accounted for as an equity-settled transaction. The resulting cash-settled liability related to the expected tax to be paid was remeasured at each reporting date at its fair value using estimates of the number of share awards that were expected to be issued and the latest fair valuations by using the Stora Enso R share year-end closing price, adjusted for the present value of expected dividends, with all changes recognised immediately in the Income Statement.
Short Term Incentive (STI) programmesSalaries for senior management are negotiated individually. Stora Enso has incentive plans that take into account the performance, development and results of both business units and individual employees. This performance-based variable compensation system is based on profitability as well as on attaining key business targets.
Group Executives, as well as division and business unit management have STI programmes in which the payment is calculated as a percentage of the annual base salary with a maximum level ranging from 8% to 75%. Non-management employees participate in an STI programme with a maximum incentive level of 7%. All incentives are discretionary. These performance-based programmes cover most employees globally, where allowed by local practice and regulations. For the performance years 2017 and 2018, the annual incentive programmes were based on financial targets as well as individually set key targets. The financial success metrics in the STI programme are: Operational EBITDA and Operative Working Capital to sales.
Long Term Incentive (LTI) programmesSince 2005, new share based programmes for executives have been launched every year. The 2015 programme that vested in 2018 as well as the current outstanding programmes including the programme that was launched during 2018 have three year targets and vest in one portion after three years.
Three quarters (75%) of the opportunity under the 2015 to 2017 programmes are in Performance Shares, where shares will vest in accordance with performance criteria proposed by the Remuneration Committee and approved by the Board of Directors. The financial success metric is 3-year Economic Value Added (EVA) for the Stora Enso Group. One quarter (25%) of the opportunity under the programmes are in Restricted Shares, for which vesting is only subject to continued employment.
This year, the 2018 LTI programme was changed for members of the GLT in the way that all (100%) of the opportunity was granted in Performance Shares. The financial success metrics in the 2018 Performance Share Plan are 3-year Economic Value Added (EVA) and Earnings Per Share (EPS) for the Stora Enso Group. Others than the GLT were granted three quarters (75%) of the opportunity in Performance Shares and one quarter (25%) of the opportunity in Restricted Shares, as in previous years.
Outstanding restricted and performance share opportunities before taxes are shown in the table below. Total number of shares actually transferred will be less than below because a portion of shares corresponding to employees tax obligation will be withheld to cover the income tax.
Share awards at 31 December 2018Estimated Delivery of Outstanding Restricted and Performance Share Awards at Year End
Number of shares 2019 2020 2021 Total2016 programme 967 733 967 733
2017 programme 1 091 559 1 091 559
2018 programme 856 377 856 377
Total 967 733 1 091 559 856 377 2 915 669
The costs of the Stora Enso Share-based Programmes are recognised as costs over the vesting period, which is the period between the grant and vesting. The total impact of share-based programmes in the Income statement amounted to an expense of EUR 7 (EUR 10) million, all related to restricted and performance share awards. There were no Total Return Swaps (TRS) in use at the end of 2018.
Note 22 Other provisions
Accounting principles
ProvisionsProvisions are recognised when the Group has a present legal or constructive obligation as a result of past events, and it is probable that an outflow of resources will be required to settle the obligation, and a reliable estimate of the amount of the obligation can be made. Provisions for dismantling, removal or site restoration are measured at management’s best estimate. The expenditure required to settle the obligation is added to the carrying amount of the assets at acquisition date and depreciated over the useful life of the asset. Provisions are discounted back to their current net present value if the effect of the time value of money is material.
Environmental obligationsEnvironmental expenditures resulting from the remediation of an existing condition caused by past operations, and which do not contribute to current or future revenues, are expensed as incurred. Environmental liabilities are recorded when it is probable, based on current interpretations of environmental laws and regulations, that a present obligation has arisen and the amount of such liability can be reliably estimated.
54
Sto
ra En
so 2
018: Fin
an
cia
ls – No
tes to the Co
nsolid
ated financial statem
ents – No
te 21
Strateg
yS
ustainability
FinancialsG
overnance
Annual Report 2018
Financials
Stora Enso in 2018
Report of the Board of Directors
Consolidated financial statements
Notes to the Consolidated financial statements
Extract from the parent company Stora Enso Oyj financial statements
The Board of Directors’ Proposal for the distribution of dividend
Auditor’s report
Stora Enso in capital markets
Stora Enso as a taxpayer
Capacities by mill in 2019
Information for shareholders
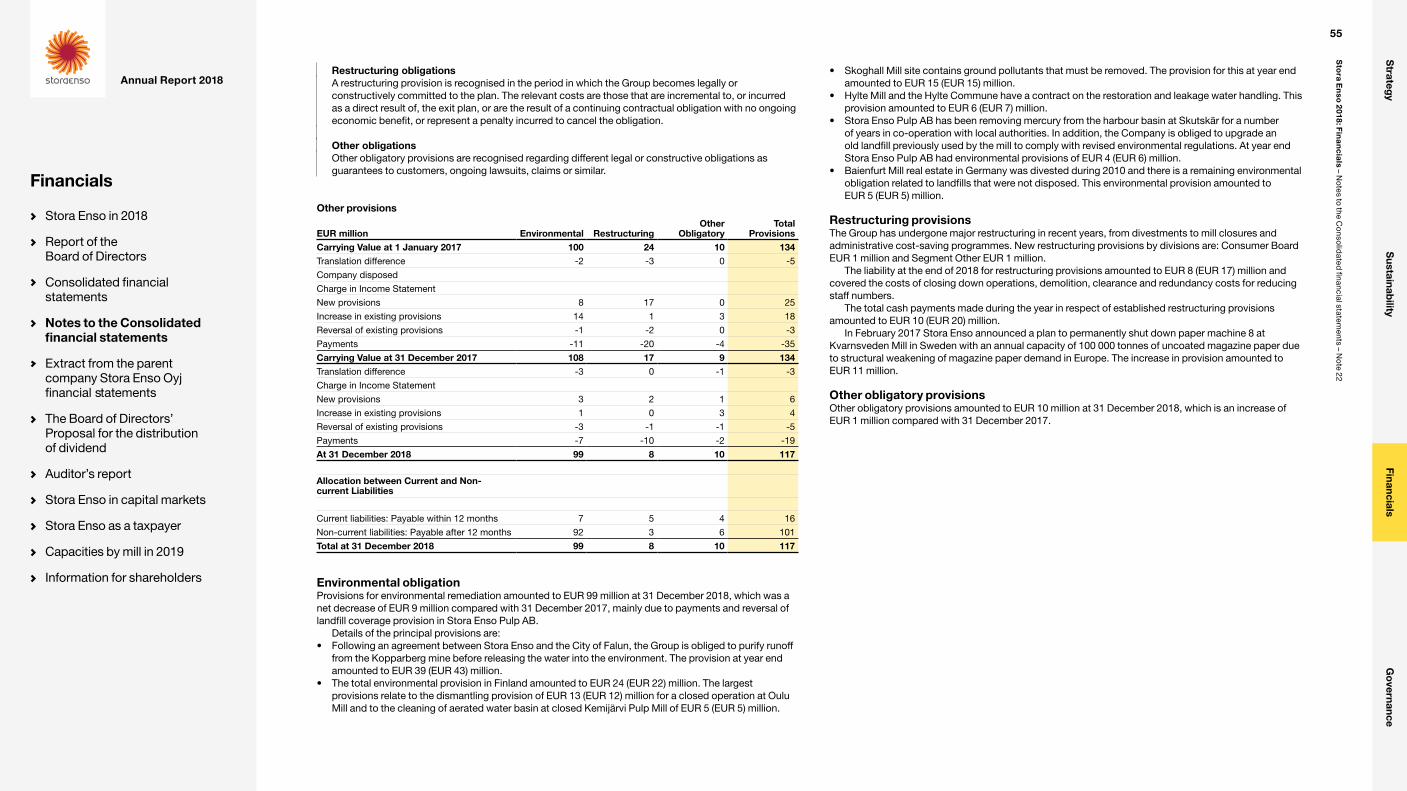
Restructuring obligationsA restructuring provision is recognised in the period in which the Group becomes legally or constructively committed to the plan. The relevant costs are those that are incremental to, or incurred as a direct result of, the exit plan, or are the result of a continuing contractual obligation with no ongoing economic benefit, or represent a penalty incurred to cancel the obligation.
Other obligationsOther obligatory provisions are recognised regarding different legal or constructive obligations as guarantees to customers, ongoing lawsuits, claims or similar.
Other provisions
EUR million Environmental RestructuringOther
ObligatoryTotal
ProvisionsCarrying Value at 1 January 2017 100 24 10 134Translation difference -2 -3 0 -5
Company disposed
Charge in Income Statement
New provisions 8 17 0 25
Increase in existing provisions 14 1 3 18
Reversal of existing provisions -1 -2 0 -3
Payments -11 -20 -4 -35
Carrying Value at 31 December 2017 108 17 9 134Translation difference -3 0 -1 -3
Charge in Income Statement
New provisions 3 2 1 6
Increase in existing provisions 1 0 3 4
Reversal of existing provisions -3 -1 -1 -5
Payments -7 -10 -2 -19
At 31 December 2018 99 8 10 117
Allocation between Current and Non-current Liabilities
Current liabilities: Payable within 12 months 7 5 4 16
Non-current liabilities: Payable after 12 months 92 3 6 101
Total at 31 December 2018 99 8 10 117
Environmental obligationProvisions for environmental remediation amounted to EUR 99 million at 31 December 2018, which was a net decrease of EUR 9 million compared with 31 December 2017, mainly due to payments and reversal of landfill coverage provision in Stora Enso Pulp AB.
Details of the principal provisions are: • Following an agreement between Stora Enso and the City of Falun, the Group is obliged to purify runoff
from the Kopparberg mine before releasing the water into the environment. The provision at year end amounted to EUR 39 (EUR 43) million.
• The total environmental provision in Finland amounted to EUR 24 (EUR 22) million. The largest provisions relate to the dismantling provision of EUR 13 (EUR 12) million for a closed operation at Oulu Mill and to the cleaning of aerated water basin at closed Kemijärvi Pulp Mill of EUR 5 (EUR 5) million.
• Skoghall Mill site contains ground pollutants that must be removed. The provision for this at year end amounted to EUR 15 (EUR 15) million.
• Hylte Mill and the Hylte Commune have a contract on the restoration and leakage water handling. This provision amounted to EUR 6 (EUR 7) million.
• Stora Enso Pulp AB has been removing mercury from the harbour basin at Skutskär for a number of years in co-operation with local authorities. In addition, the Company is obliged to upgrade an old landfill previously used by the mill to comply with revised environmental regulations. At year end Stora Enso Pulp AB had environmental provisions of EUR 4 (EUR 6) million.
• Baienfurt Mill real estate in Germany was divested during 2010 and there is a remaining environmental obligation related to landfills that were not disposed. This environmental provision amounted to EUR 5 (EUR 5) million.
Restructuring provisionsThe Group has undergone major restructuring in recent years, from divestments to mill closures and administrative cost-saving programmes. New restructuring provisions by divisions are: Consumer Board EUR 1 million and Segment Other EUR 1 million.
The liability at the end of 2018 for restructuring provisions amounted to EUR 8 (EUR 17) million and covered the costs of closing down operations, demolition, clearance and redundancy costs for reducing staff numbers.
The total cash payments made during the year in respect of established restructuring provisions amounted to EUR 10 (EUR 20) million.
In February 2017 Stora Enso announced a plan to permanently shut down paper machine 8 at Kvarnsveden Mill in Sweden with an annual capacity of 100 000 tonnes of uncoated magazine paper due to structural weakening of magazine paper demand in Europe. The increase in provision amounted to EUR 11 million.
Other obligatory provisionsOther obligatory provisions amounted to EUR 10 million at 31 December 2018, which is an increase of EUR 1 million compared with 31 December 2017.
55
Sto
ra En
so 2
018: Fin
an
cia
ls – No
tes to the Co
nsolid
ated financial statem
ents – No
te 22
Strateg
yS
ustainability
FinancialsG
overnance
Annual Report 2018
Financials
Stora Enso in 2018
Report of the Board of Directors
Consolidated financial statements
Notes to the Consolidated financial statements
Extract from the parent company Stora Enso Oyj financial statements
The Board of Directors’ Proposal for the distribution of dividend
Auditor’s report
Stora Enso in capital markets
Stora Enso as a taxpayer
Capacities by mill in 2019
Information for shareholders
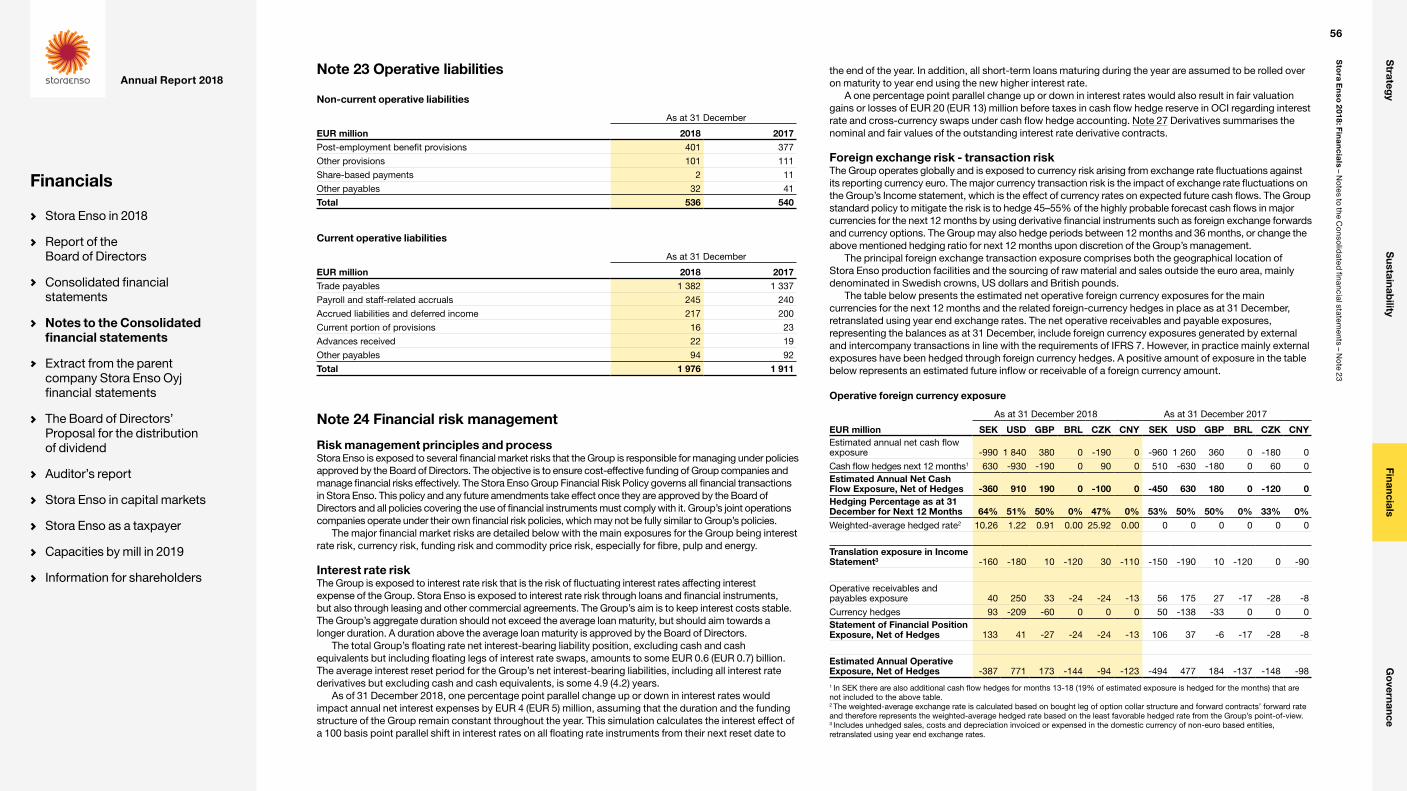
Note 23 Operative liabilities
Non-current operative liabilities
As at 31 December
EUR million 2018 2017Post-employment benefit provisions 401 377
Other provisions 101 111
Share-based payments 2 11
Other payables 32 41
Total 536 540
Current operative liabilities
As at 31 December
EUR million 2018 2017Trade payables 1 382 1 337
Payroll and staff-related accruals 245 240
Accrued liabilities and deferred income 217 200
Current portion of provisions 16 23
Advances received 22 19
Other payables 94 92
Total 1 976 1 911
the end of the year. In addition, all short-term loans maturing during the year are assumed to be rolled over on maturity to year end using the new higher interest rate.
A one percentage point parallel change up or down in interest rates would also result in fair valuation gains or losses of EUR 20 (EUR 13) million before taxes in cash flow hedge reserve in OCI regarding interest rate and cross-currency swaps under cash flow hedge accounting. Note 27 Derivatives summarises the nominal and fair values of the outstanding interest rate derivative contracts.
Foreign exchange risk - transaction riskThe Group operates globally and is exposed to currency risk arising from exchange rate fluctuations against its reporting currency euro. The major currency transaction risk is the impact of exchange rate fluctuations on the Group’s Income statement, which is the effect of currency rates on expected future cash flows. The Group standard policy to mitigate the risk is to hedge 45–55% of the highly probable forecast cash flows in major currencies for the next 12 months by using derivative financial instruments such as foreign exchange forwards and currency options. The Group may also hedge periods between 12 months and 36 months, or change the above mentioned hedging ratio for next 12 months upon discretion of the Group’s management.
The principal foreign exchange transaction exposure comprises both the geographical location of Stora Enso production facilities and the sourcing of raw material and sales outside the euro area, mainly denominated in Swedish crowns, US dollars and British pounds.
The table below presents the estimated net operative foreign currency exposures for the main currencies for the next 12 months and the related foreign-currency hedges in place as at 31 December, retranslated using year end exchange rates. The net operative receivables and payable exposures, representing the balances as at 31 December, include foreign currency exposures generated by external and intercompany transactions in line with the requirements of IFRS 7. However, in practice mainly external exposures have been hedged through foreign currency hedges. A positive amount of exposure in the table below represents an estimated future inflow or receivable of a foreign currency amount.
Operative foreign currency exposure
As at 31 December 2018 As at 31 December 2017
EUR million SEK USD GBP BRL CZK CNY SEK USD GBP BRL CZK CNYEstimated annual net cash flow exposure -990 1 840 380 0 -190 0 -960 1 260 360 0 -180 0
Cash flow hedges next 12 months1 630 -930 -190 0 90 0 510 -630 -180 0 60 0Estimated Annual Net Cash Flow Exposure, Net of Hedges -360 910 190 0 -100 0 -450 630 180 0 -120 0Hedging Percentage as at 31 December for Next 12 Months 64% 51% 50% 0% 47% 0% 53% 50% 50% 0% 33% 0%Weighted-average hedged rate2 10.26 1.22 0.91 0.00 25.92 0.00 0 0 0 0 0 0
Translation exposure in Income Statement3 -160 -180 10 -120 30 -110 -150 -190 10 -120 0 -90
Operative receivables and payables exposure 40 250 33 -24 -24 -13 56 175 27 -17 -28 -8
Currency hedges 93 -209 -60 0 0 0 50 -138 -33 0 0 0Statement of Financial Position Exposure, Net of Hedges 133 41 -27 -24 -24 -13 106 37 -6 -17 -28 -8
Estimated Annual Operative Exposure, Net of Hedges -387 771 173 -144 -94 -123 -494 477 184 -137 -148 -98
1 In SEK there are also additional cash flow hedges for months 13-18 (19% of estimated exposure is hedged for the months) that are not included to the above table.2 The weighted-average exchange rate is calculated based on bought leg of option collar structure and forward contracts’ forward rate and therefore represents the weighted-average hedged rate based on the least favorable hedged rate from the Group’s point-of-view.3 Includes unhedged sales, costs and depreciation invoiced or expensed in the domestic currency of non-euro based entities, retranslated using year end exchange rates.
Note 24 Financial risk management
Risk management principles and processStora Enso is exposed to several financial market risks that the Group is responsible for managing under policies approved by the Board of Directors. The objective is to ensure cost-effective funding of Group companies and manage financial risks effectively. The Stora Enso Group Financial Risk Policy governs all financial transactions in Stora Enso. This policy and any future amendments take effect once they are approved by the Board of Directors and all policies covering the use of financial instruments must comply with it. Group’s joint operations companies operate under their own financial risk policies, which may not be fully similar to Group’s policies.
The major financial market risks are detailed below with the main exposures for the Group being interest rate risk, currency risk, funding risk and commodity price risk, especially for fibre, pulp and energy.
Interest rate riskThe Group is exposed to interest rate risk that is the risk of fluctuating interest rates affecting interest expense of the Group. Stora Enso is exposed to interest rate risk through loans and financial instruments, but also through leasing and other commercial agreements. The Group’s aim is to keep interest costs stable. The Group’s aggregate duration should not exceed the average loan maturity, but should aim towards a longer duration. A duration above the average loan maturity is approved by the Board of Directors.
The total Group’s floating rate net interest-bearing liability position, excluding cash and cash equivalents but including floating legs of interest rate swaps, amounts to some EUR 0.6 (EUR 0.7) billion. The average interest reset period for the Group’s net interest-bearing liabilities, including all interest rate derivatives but excluding cash and cash equivalents, is some 4.9 (4.2) years.
As of 31 December 2018, one percentage point parallel change up or down in interest rates would impact annual net interest expenses by EUR 4 (EUR 5) million, assuming that the duration and the funding structure of the Group remain constant throughout the year. This simulation calculates the interest effect of a 100 basis point parallel shift in interest rates on all floating rate instruments from their next reset date to
56
Sto
ra En
so 2
018: Fin
an
cia
ls – No
tes to the Co
nsolid
ated financial statem
ents – No
te 23
Strateg
yS
ustainability
FinancialsG
overnance
Annual Report 2018
Financials
Stora Enso in 2018
Report of the Board of Directors
Consolidated financial statements
Notes to the Consolidated financial statements
Extract from the parent company Stora Enso Oyj financial statements
The Board of Directors’ Proposal for the distribution of dividend
Auditor’s report
Stora Enso in capital markets
Stora Enso as a taxpayer
Capacities by mill in 2019
Information for shareholders

The following table includes the estimated effect on annual operating profit of a strengthening in EUR versus SEK, USD, GBP, CZK and CNY by 5% and versus BRL by 10%, as reasonably possible changes in rates, measured against year end closing rates. A corresponding decrease in the exchange rates would have an approximately equal opposite impact. A negative amount in the table reflects a potential net loss in the income statement or equity and, conversely, a positive amount reflects a potential net gain. In practice, the actual foreign currency results may differ from the sensitivity analysis presented below since the income statements of subsidiaries with functional currencies other than the euro are translated into the Group reporting currency using the average exchange rates for the year, whereas the statements of financial position of such subsidiaries, including currency hedges, trade receivables and payable, are translated using the exchange rates at the reporting date.
The calculation includes currency hedges and assumes that no changes other than a single currency exchange rate movement have taken place in the underlying risk exposure. The currency effects are based on estimated operative foreign currency flows for the next twelve months, hedging levels at the year end and the assumption that the currency cash flow hedging levels, translation exposure in Income statement and all other variables will remain constant during the next twelve months. Hedging instruments include foreign exchange forward contracts and foreign exchange options. Indirect currency effects with an impact on prices and product flows, such as a product becoming cheaper to produce elsewhere, have not been considered in this calculation.
Estimated currency effects of strengthening of euro
As at 31 December 2018 As at 31 December 2017
EUR million SEK USD GBP BRL CZK CNY SEK USD GBP BRL CZK CNYCurrency change versus EUR -5% -5% -5% -10% -5% -5% -5% -5% -5% -10% -5% -5%Effect on estimated annual net cash flow and translation exposure 58 -83 -20 12 8 6 56 -54 -19 12 9 5Effect on hedging reserve before taxes as at year end1 -32 47 10 0 -5 0 -26 32 9 0 -3 0
EBIT impact as at year end2 -7 -2 1 2 1 1 -5 -2 0 2 1 0
Estimated Annual EBIT Impact3 19 -38 -9 14 4 7 25 -24 -10 14 7 5
1 The effect on hedging reserve (other comprehensive income) before taxes at year end is related to the fair value change in derivatives contracts qualifying as cash flow hedges of highly probable forecast cash flows. 2 The Operating Profit impact as at year end represents the estimated currency effect related to operative payables and receivables, and the net of hedges.3 The estimated annual Operating Profit impact includes currency effects in respect of operative exposures in the Statement of Financial Position, forecast cash flows and related hedges and translation exposure in Income Statement.
The following table presents the financial foreign currency exposure and the related hedges in place as at 31 December for the main currencies. Net debt includes loan payables and related interest rate derivatives, net of loan receivables and cash and cash equivalents. The currency derivatives mainly hedge financial exposures in the statement of financial position and from time to time they also hedge forecast cash flows not qualifying under hedge accounting. These forecast cash flows are not included in the below table. A negative amount of exposure in the table represents a net payable of a foreign currency amount.
Additionally, the table includes the estimated effect on the income statement of a strengthening in the EUR versus SEK, USD, CNY and PLN by 5% and versus BRL by 10%, as reasonably possible changes in rates, measured against year-end closing rates. A corresponding decrease in the exchange rates would have an approximately equal opposite impact. A negative amount in the table reflects a potential net loss in the Income statement and, conversely, a positive amount reflects a net potential gain. In practice, the actual foreign currency results may differ from the sensitivity analysis below as the exposure amounts may change during the year.
Financial foreign currency exposure and estimated currency effects in Income Statement
As at 31 December 2018 As at 31 December 2017
EUR million SEK USD CNY PLN SEK USD CNY PLNNet debt excluding hedges 130 -213 602 112 420 -347 472 161
Currency hedges -187 -47 -283 -4 -530 -28 -86 0
Net Financial Exposure -57 -260 319 108 -110 -375 386 161
Currency change versus EUR -5% -5% -5% -5% -5% -5% -5% -5%
Effect in the Income Statement 3 13 -16 -5 6 19 -19 -8
Foreign exchange risk - translation riskTranslation risk results from fluctuations in exchange rates affecting the value of Stora Enso’s net foreign currency denominated assets and liabilities. Translation risk is reduced by funding assets, whenever economically possible, in the same currency as the asset. The Group may also enter into foreign exchange forwards, foreign exchange options or foreign currency denominated loans to hedge its net investments in foreign entities.
The balance sheets of foreign subsidiaries, equity accounted investments and foreign currency denominated equity instruments in the scope of IFRS 9 are translated into euros using exchange rates prevailing on the reporting date, thus exposing consolidated group equity to fluctuations in currency rates. The resulting translation differences, along with other movements such as the translation rate difference in the income statement, are recorded directly in shareholders’ equity. These cumulative differences materialise through the Income statement on the disposal, in whole or in part, of the foreign entity. The next table shows the translation exposure on equity before and after hedges.
Translation risk and hedges: 2018
As at 31 December 2018
EUR millionEuro area
USD area2 Sweden China Poland Brazil Other Total
Translation Exposure on Equity 2 246 1 345 1 913 269 360 314 267 6 714
EUR/USD hedges1 306 -306 0 0 0 0 0 0
Translation Exposure after Hedges 2 552 1 039 1 913 269 360 314 267 6 7141 USD denominated bonds classified as hedges of investments in foreign assets.2 Includes the joint operation Montes del Plata in Uruguay, which has USD as its functional currency.
Translation risk and hedges: 2017
As at 31 December 2017
EUR millionEuro area
USD area2 Sweden China Poland Brazil Other Total
Translation Exposure on Equity 2 011 1 242 1 372 400 306 391 286 6 008
EUR/USD hedges1 292 -292 0 0 0 0 0 0
Translation Exposure after Hedges 2 303 950 1 372 400 306 391 286 6 0081 USD denominated bonds classified as hedges of investments in foreign assets.2 Includes the joint operation Montes del Plata in Uruguay, which has USD as its functional currency.
57
Sto
ra En
so 2
018: Fin
an
cia
ls – No
tes to the Co
nsolid
ated financial statem
ents – No
te 24
Strateg
yS
ustainability
FinancialsG
overnance
Annual Report 2018
Financials
Stora Enso in 2018
Report of the Board of Directors
Consolidated financial statements
Notes to the Consolidated financial statements
Extract from the parent company Stora Enso Oyj financial statements
The Board of Directors’ Proposal for the distribution of dividend
Auditor’s report
Stora Enso in capital markets
Stora Enso as a taxpayer
Capacities by mill in 2019
Information for shareholders
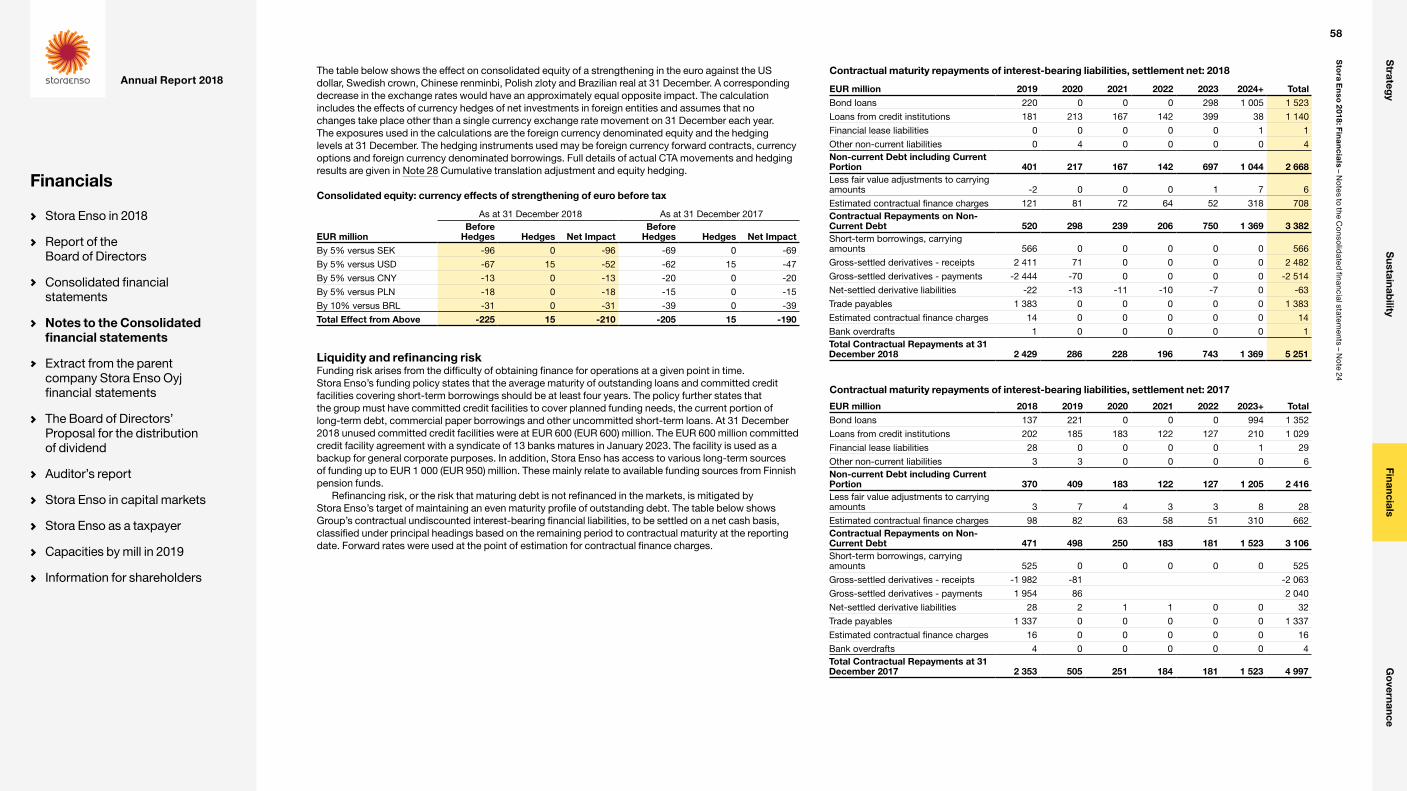
The table below shows the effect on consolidated equity of a strengthening in the euro against the US dollar, Swedish crown, Chinese renminbi, Polish zloty and Brazilian real at 31 December. A corresponding decrease in the exchange rates would have an approximately equal opposite impact. The calculation includes the effects of currency hedges of net investments in foreign entities and assumes that no changes take place other than a single currency exchange rate movement on 31 December each year. The exposures used in the calculations are the foreign currency denominated equity and the hedging levels at 31 December. The hedging instruments used may be foreign currency forward contracts, currency options and foreign currency denominated borrowings. Full details of actual CTA movements and hedging results are given in Note 28 Cumulative translation adjustment and equity hedging.
Consolidated equity: currency effects of strengthening of euro before tax
As at 31 December 2018 As at 31 December 2017
EUR millionBefore
Hedges Hedges Net ImpactBefore
Hedges Hedges Net ImpactBy 5% versus SEK -96 0 -96 -69 0 -69
By 5% versus USD -67 15 -52 -62 15 -47
By 5% versus CNY -13 0 -13 -20 0 -20
By 5% versus PLN -18 0 -18 -15 0 -15
By 10% versus BRL -31 0 -31 -39 0 -39
Total Effect from Above -225 15 -210 -205 15 -190
Liquidity and refinancing risk Funding risk arises from the difficulty of obtaining finance for operations at a given point in time. Stora Enso’s funding policy states that the average maturity of outstanding loans and committed credit facilities covering short-term borrowings should be at least four years. The policy further states that the group must have committed credit facilities to cover planned funding needs, the current portion of long-term debt, commercial paper borrowings and other uncommitted short-term loans. At 31 December 2018 unused committed credit facilities were at EUR 600 (EUR 600) million. The EUR 600 million committed credit facility agreement with a syndicate of 13 banks matures in January 2023. The facility is used as a backup for general corporate purposes. In addition, Stora Enso has access to various long-term sources of funding up to EUR 1 000 (EUR 950) million. These mainly relate to available funding sources from Finnish pension funds.
Refinancing risk, or the risk that maturing debt is not refinanced in the markets, is mitigated by Stora Enso’s target of maintaining an even maturity profile of outstanding debt. The table below shows Group’s contractual undiscounted interest-bearing financial liabilities, to be settled on a net cash basis, classified under principal headings based on the remaining period to contractual maturity at the reporting date. Forward rates were used at the point of estimation for contractual finance charges.
Contractual maturity repayments of interest-bearing liabilities, settlement net: 2018
EUR million 2019 2020 2021 2022 2023 2024+ TotalBond loans 220 0 0 0 298 1 005 1 523
Loans from credit institutions 181 213 167 142 399 38 1 140
Financial lease liabilities 0 0 0 0 0 1 1
Other non-current liabilities 0 4 0 0 0 0 4Non-current Debt including Current Portion 401 217 167 142 697 1 044 2 668Less fair value adjustments to carrying amounts -2 0 0 0 1 7 6
Estimated contractual finance charges 121 81 72 64 52 318 708Contractual Repayments on Non-Current Debt 520 298 239 206 750 1 369 3 382Short-term borrowings, carrying amounts 566 0 0 0 0 0 566
Gross-settled derivatives - receipts 2 411 71 0 0 0 0 2 482
Gross-settled derivatives - payments -2 444 -70 0 0 0 0 -2 514
Net-settled derivative liabilities -22 -13 -11 -10 -7 0 -63
Trade payables 1 383 0 0 0 0 0 1 383
Estimated contractual finance charges 14 0 0 0 0 0 14
Bank overdrafts 1 0 0 0 0 0 1Total Contractual Repayments at 31 December 2018 2 429 286 228 196 743 1 369 5 251
Contractual maturity repayments of interest-bearing liabilities, settlement net: 2017
EUR million 2018 2019 2020 2021 2022 2023+ TotalBond loans 137 221 0 0 0 994 1 352
Loans from credit institutions 202 185 183 122 127 210 1 029
Financial lease liabilities 28 0 0 0 0 1 29
Other non-current liabilities 3 3 0 0 0 0 6Non-current Debt including Current Portion 370 409 183 122 127 1 205 2 416Less fair value adjustments to carrying amounts 3 7 4 3 3 8 28
Estimated contractual finance charges 98 82 63 58 51 310 662Contractual Repayments on Non-Current Debt 471 498 250 183 181 1 523 3 106Short-term borrowings, carrying amounts 525 0 0 0 0 0 525
Gross-settled derivatives - receipts -1 982 -81 -2 063
Gross-settled derivatives - payments 1 954 86 2 040
Net-settled derivative liabilities 28 2 1 1 0 0 32
Trade payables 1 337 0 0 0 0 0 1 337
Estimated contractual finance charges 16 0 0 0 0 0 16
Bank overdrafts 4 0 0 0 0 0 4Total Contractual Repayments at 31 December 2017 2 353 505 251 184 181 1 523 4 997
58
Sto
ra En
so 2
018: Fin
an
cia
ls – No
tes to the Co
nsolid
ated financial statem
ents – No
te 24
Strateg
yS
ustainability
FinancialsG
overnance
Annual Report 2018
Financials
Stora Enso in 2018
Report of the Board of Directors
Consolidated financial statements
Notes to the Consolidated financial statements
Extract from the parent company Stora Enso Oyj financial statements
The Board of Directors’ Proposal for the distribution of dividend
Auditor’s report
Stora Enso in capital markets
Stora Enso as a taxpayer
Capacities by mill in 2019
Information for shareholders

Financial transactions counterparty credit riskFinancial counterparty risk is Stora Enso’s exposure on financial contracts arising from a deterioration in counterparties’ financial health.This risk is minimised by:• entering into transactions only with leading financial institutions and with industrial companies that have
a good credit rating;• investing in liquid cash funds only with financial institutions or companies that have a minimum rating
of BBB-, with at least 50% of liquidity investments in funds with a minimum rating of A-, using Standard and Poor’s credit rating symbols;
• requiring parent company guarantees when dealing with any subsidiary of a rated company.
The Group Financial Risk Policy defines the limits for accepted counterparty risk, based on the tenor of financial contract and counterparty’s credit rating.
At the year end in 2018, there were no significant concentrations of risk with respect to counterparties of derivative contracts, with the highest counterparty exposure being at EUR 8 (EUR 5) million and credit rating of A+ (A+) using Standard and Poor’s credit rating symbols.
Customer credit riskCustomer credit risk is Stora Enso’s exposure to contracts arising from deterioration in the financial health of customers. The Group uses various measures to reduce credit risks, including but not limited to letters of credit, prepayments and bank guarantees. The Group has also obtained export guarantees, covering both political and commercial risks, which are used in connection with individual customers outside the OECD area. Management considers that no significant concentration of credit risk with any individual customer, counterparty or geographical region exists for Stora Enso. The aging information of trade receivables and related loss allowances are given in Note 17 Operative receivables.
Commodity price risk
Outstanding commodity hedges
As at 31 December 2018
EUR million
Underlying amount of commodity
hedgedNominal amount
hedged Fair valueCoal hedges 58 500 tonnes 5 -
Electricity hedges 2 088 000 MWh 67 35
Oil hedges 65 700 barrels 15 -2
Group earnings are exposed to commodity and energy price volatility. Financial energy hedges are part of the total energy price risk management in the group, whilst other commodity risks are measured and hedged if economically possible. A 10% movement in energy and raw material prices would result in a EUR 13 (EUR 27) million change in the fair value of energy and raw material hedging contracts. The majority of these fair value changes, after taxes, are recorded directly in Equity under Hedging Reserves, until the contracts mature and the result is entered in the Income statement. These estimates represent only the sensitivity of the financial instruments to market risk and not the Group exposure to raw material and energy price risks as a whole, since the actual purchases are not financial instruments within the scope of the IFRS 7 disclosure requirements. At end of 2018, the maturities of the energy and commodity contracts ranged between 2019 and 2024. In 2017 the maturities ranged between 2018 and 2024.
The bulk of the Group energy price risk has been covered by entering into long-term physical fixed price purchase agreements. The Group also has a 15.6% holding, fair valued at EUR 415 (EUR 308) million, in Pohjolan Voima Oy (PVO), a privately owned group of companies in the energy sector. The value of these shares is dependent on energy market prices and discussed in more detail in Note 14 Equity instruments.
In addition, in an effort to mitigate other commodity price risk exposures in relation to supply of wood, the Group is a significant shareholder in major forest and wood supply companies in Finland and Sweden. Potential increase in prices for fibre in these countries would also increase profits from these group interests, mainly being Bergvik Skog in Sweden and Tornator in Finland.
Share price riskThe Group has certain investments in publicly traded securities. The market value of these equity investments was EUR 13 (EUR 21) million at the year end. Market value changes in these investments are recorded, after taxes, directly under Shareholders’ Equity in the Equity instruments through OCI reserve. Detailed discussion regarding the publicly traded securities can be found from Note 14 Equity instruments.
Capital risk managementStora Enso’s debt structure is focused on capital markets, whereas banks are primarily used to provide back-up facilities. Group objectives when managing capital are to safeguard the ability to continue as a going concern in order to provide returns for shareholders and benefits for other stakeholders, as well as to maintain an optimal capital structure to reduce the cost of capital. In order to maintain or adjust the capital structure, the Group may, subject to shareholder approval as appropriate, vary the dividend paid to shareholders, buy its own shares on the financial markets, return capital to shareholders, issue new shares or sell assets to reduce debt. Group strives to pay stable dividends linked to the long-term performance with the aim of distributing 50% of the net income over the cycle.
As announced in 2018, the Group set new target levels for Net-debt to-Operational EBITDA and Net-debt-to-Equity ratios. Going forward the Group monitors its capital on the basis of a target net debt-to-equity ratio of 0.60 or less (earlier 0.80 or less), and ensuring that Net-debt-to-Operational EBITDA ratio remains below 2.0 (earlier below 3.0), indicating a solid financial position, and financial flexibility.
Capital structure
As at 31 December
EUR million 2018 2017Interest-bearing liabilities 3 344 3 016
Interest-bearing assets 1 252 763
Net debt 2 092 2 253Equity Attributable to Owners of the Parent 6 714 6 008Operational EBITDA1 1 878 1 587Net debt to Equity Ratio 0.31 0.38Net Debt to Operational EBITDA 1.10 1.421 Operational EBITDA definition is included in the “Non-IFRS measures” chapter in the Report of the Board of Directors.
Montes del Plata, a joint operation of Stora Enso, and the Group’s subsidiary Stora Enso (Guangxi) Packaging Company Ltd. have complied with financial covenants related to debt-to-assets ratio during the reported periods.
59
Sto
ra En
so 2
018: Fin
an
cia
ls – No
tes to the Co
nsolid
ated financial statem
ents – No
te 24
Strateg
yS
ustainability
FinancialsG
overnance
Annual Report 2018
Financials
Stora Enso in 2018
Report of the Board of Directors
Consolidated financial statements
Notes to the Consolidated financial statements
Extract from the parent company Stora Enso Oyj financial statements
The Board of Directors’ Proposal for the distribution of dividend
Auditor’s report
Stora Enso in capital markets
Stora Enso as a taxpayer
Capacities by mill in 2019
Information for shareholders

Note 25 Fair values
Accounting principles
InvestmentsThe Group classifies its investments in debt instruments into three categories, which are amortised cost, fair value through other comprehensive income and fair value through profit and loss. The Group’s investments into equity securities, such as listed and unlisted securities, are classified as fair value through profit and loss unless the Group has at inception decided to apply the irrevocable election under IFRS 9 to classify the investments as fair value through other comprehensive income with only dividend income from the investments being recognised in the Income Statement.
The classification is made according to IFRS 9 standard, based on the business model and contractual cash flow characteristics of debt instruments. Management determines the classification of its investments at the time of the purchase. Investments in debt instruments for which the business model objective is to hold the financial instruments to collect contractual cash flows and those cash flows are solely payments of principal and interest, are classified as amortised cost and presented in current and non-current assets. Investments in debt instruments for which the business model objective is to hold the financial instruments for both to collect contractual cash flows and sell financial instruments and the cash flows are solely payments of principal and interest, are classified as fair value through other comprehensive income and presented in current and non-current assets.
Investments acquired principally for the purpose of generating profits from short-term fluctuations in price are classified as fair value through profit and loss and are therefore fair valued through the Consolidated Income Statement and presented in current and non-current assets.
Fair value of financial instrumentsThe fair values of publicly traded derivatives and listed securities, are based on quoted market prices at the reporting date; the fair values of interest rate swaps are calculated as the present value of the estimated future cash flows and the fair values of foreign exchange forward contracts are determined using forward exchange rates at the reporting date. The valuation principles for derivative financial instruments have been described in more detail in Note 27 Derivatives.
In assessing the fair values of non-traded derivatives and other financial instruments, the Group uses a variety of methods and makes assumptions based on the market conditions at each reporting date. Quoted market prices or dealer quotes for identical or similar instruments are used for non-current debt. Other techniques, such as option pricing models and estimated discounted value of future cash flows, are used to determine fair values for the remaining financial instruments. The face values, less any estimated credit adjustments, for financial assets and liabilities with a maturity of less than one year are assumed to approximate their fair values. The fair values of financial liabilities for disclosure purposes are estimated by discounting the future contractual cash flows at the current market interest rates available to the Group for similar financial instruments.
Purchases and sales of financial instruments are recognised based on trade date accounting, which is the date on which the Group commits to purchasing or selling the financial instrument. Financial instruments are derecognised when the rights to receive or the cash flows from the financial instruments have expired or have been transferred and the Group has substantially transferred all risks, rewards and obligations of the ownership of the financial asset or liability.
Loan receivablesLoan receivables are debt instruments with fixed or determinable payments that are not quoted on an active market. They are recorded initially at fair value and subsequently measured at amortised cost. Loss allowance for expected credit losses is calculated based on the general approach under IFRS 9 where loss allowance is recognised based on 12-month expected credit losses if there has not been a significant increase in credit risk since the initial recognition. Significant increase in the credit risk will be evaluated based on comparison of the risk of a default occurring on the financial instrument
as at the reporting date with the risk of default occurring on the financial instrument as at the date of initial recognition. The Group may use, for example, rates of credit default swaps (CDS) observable on financial markets to produce the risk assessment.
Interest income on loan receivables is included in Financial income and expense. Loan receivables with a maturity less than 12 months are included in current assets under interest-bearing receivables and those with maturities greater than 12 months, in non-current loan receivables.
Fair value hierarchyThe Group uses the following hierarchy for determining and disclosing the fair value of financial instruments by valuation technique:• Level 1: quoted (unadjusted) prices in active markets for identical assets or liabilities;• Level 2: other techniques for which all inputs which have a significant effect on the recorded fair
value are observable, either directly or indirectly;• Level 3: techniques which use inputs which have a significant effect on the recorded fair values that
are not based on observable market data.
See Note 14 Equity instruments for more information on Level 3 fair value measurement of listed and unlisted securities.
60
Sto
ra En
so 2
018: Fin
an
cia
ls – No
tes to the Co
nsolid
ated financial statem
ents – No
te 25
Strateg
yS
ustainability
FinancialsG
overnance
Annual Report 2018
Financials
Stora Enso in 2018
Report of the Board of Directors
Consolidated financial statements
Notes to the Consolidated financial statements
Extract from the parent company Stora Enso Oyj financial statements
The Board of Directors’ Proposal for the distribution of dividend
Auditor’s report
Stora Enso in capital markets
Stora Enso as a taxpayer
Capacities by mill in 2019
Information for shareholders
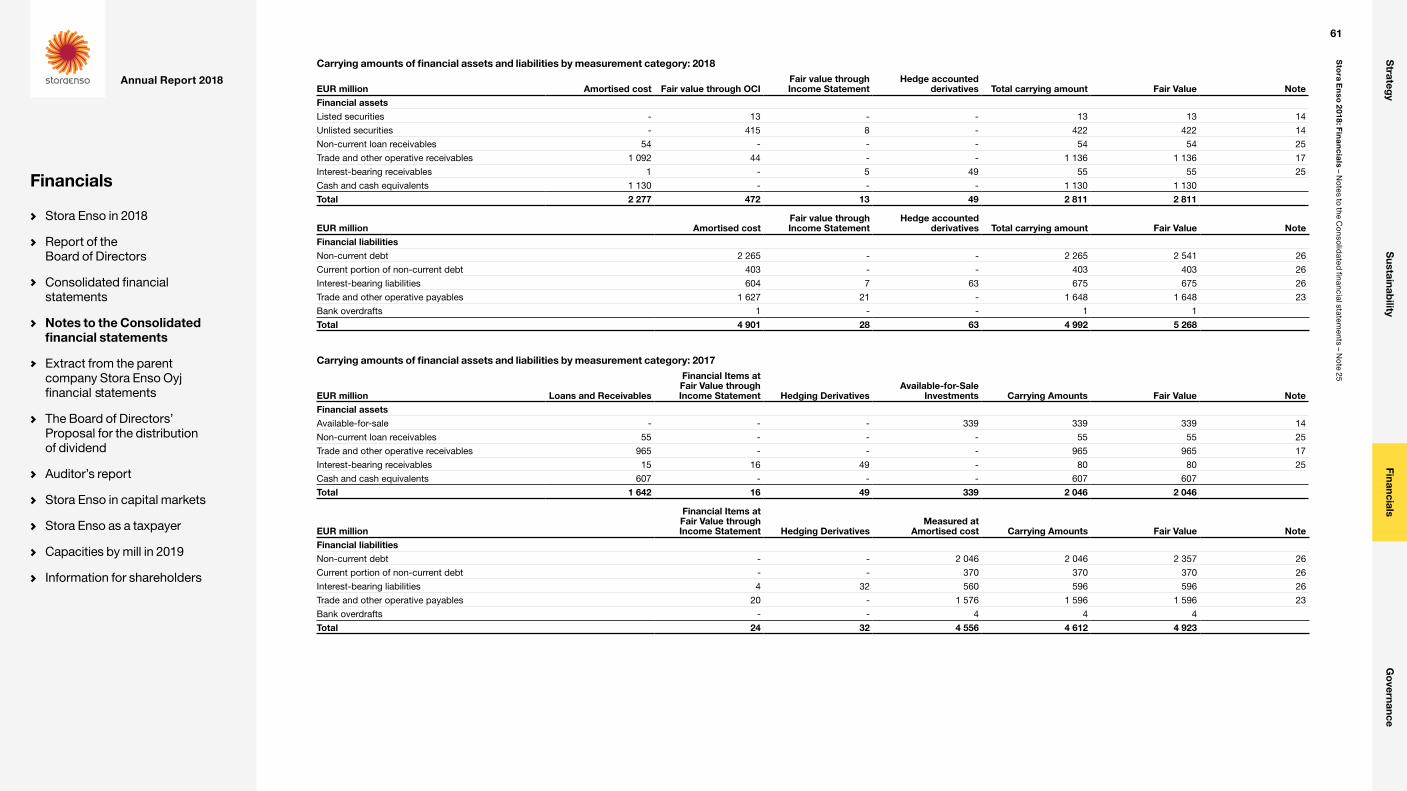
Carrying amounts of financial assets and liabilities by measurement category: 2018
EUR million Amortised cost Fair value through OCIFair value through Income Statement
Hedge accounted derivatives Total carrying amount Fair Value Note
Financial assetsListed securities - 13 - - 13 13 14
Unlisted securities - 415 8 - 422 422 14
Non-current loan receivables 54 - - - 54 54 25
Trade and other operative receivables 1 092 44 - - 1 136 1 136 17
Interest-bearing receivables 1 - 5 49 55 55 25
Cash and cash equivalents 1 130 - - - 1 130 1 130
Total 2 277 472 13 49 2 811 2 811
EUR million Amortised costFair value through Income Statement
Hedge accounted derivatives Total carrying amount Fair Value Note
Financial liabilitiesNon-current debt 2 265 - - 2 265 2 541 26
Current portion of non-current debt 403 - - 403 403 26
Interest-bearing liabilities 604 7 63 675 675 26
Trade and other operative payables 1 627 21 - 1 648 1 648 23
Bank overdrafts 1 - - 1 1
Total 4 901 28 63 4 992 5 268
Carrying amounts of financial assets and liabilities by measurement category: 2017
EUR million Loans and Receivables
Financial Items at Fair Value through Income Statement Hedging Derivatives
Available-for-Sale Investments Carrying Amounts Fair Value Note
Financial assetsAvailable-for-sale - - - 339 339 339 14
Non-current loan receivables 55 - - - 55 55 25
Trade and other operative receivables 965 - - - 965 965 17
Interest-bearing receivables 15 16 49 - 80 80 25
Cash and cash equivalents 607 - - - 607 607
Total 1 642 16 49 339 2 046 2 046
EUR million
Financial Items at Fair Value through Income Statement Hedging Derivatives
Measured at Amortised cost Carrying Amounts Fair Value Note
Financial liabilitiesNon-current debt - - 2 046 2 046 2 357 26
Current portion of non-current debt - - 370 370 370 26
Interest-bearing liabilities 4 32 560 596 596 26
Trade and other operative payables 20 - 1 576 1 596 1 596 23
Bank overdrafts - - 4 4 4
Total 24 32 4 556 4 612 4 923
61
Sto
ra En
so 2
018: Fin
an
cia
ls – No
tes to the Co
nsolid
ated financial statem
ents – No
te 25
Strateg
yS
ustainability
FinancialsG
overnance
Annual Report 2018
Financials
Stora Enso in 2018
Report of the Board of Directors
Consolidated financial statements
Notes to the Consolidated financial statements
Extract from the parent company Stora Enso Oyj financial statements
The Board of Directors’ Proposal for the distribution of dividend
Auditor’s report
Stora Enso in capital markets
Stora Enso as a taxpayer
Capacities by mill in 2019
Information for shareholders
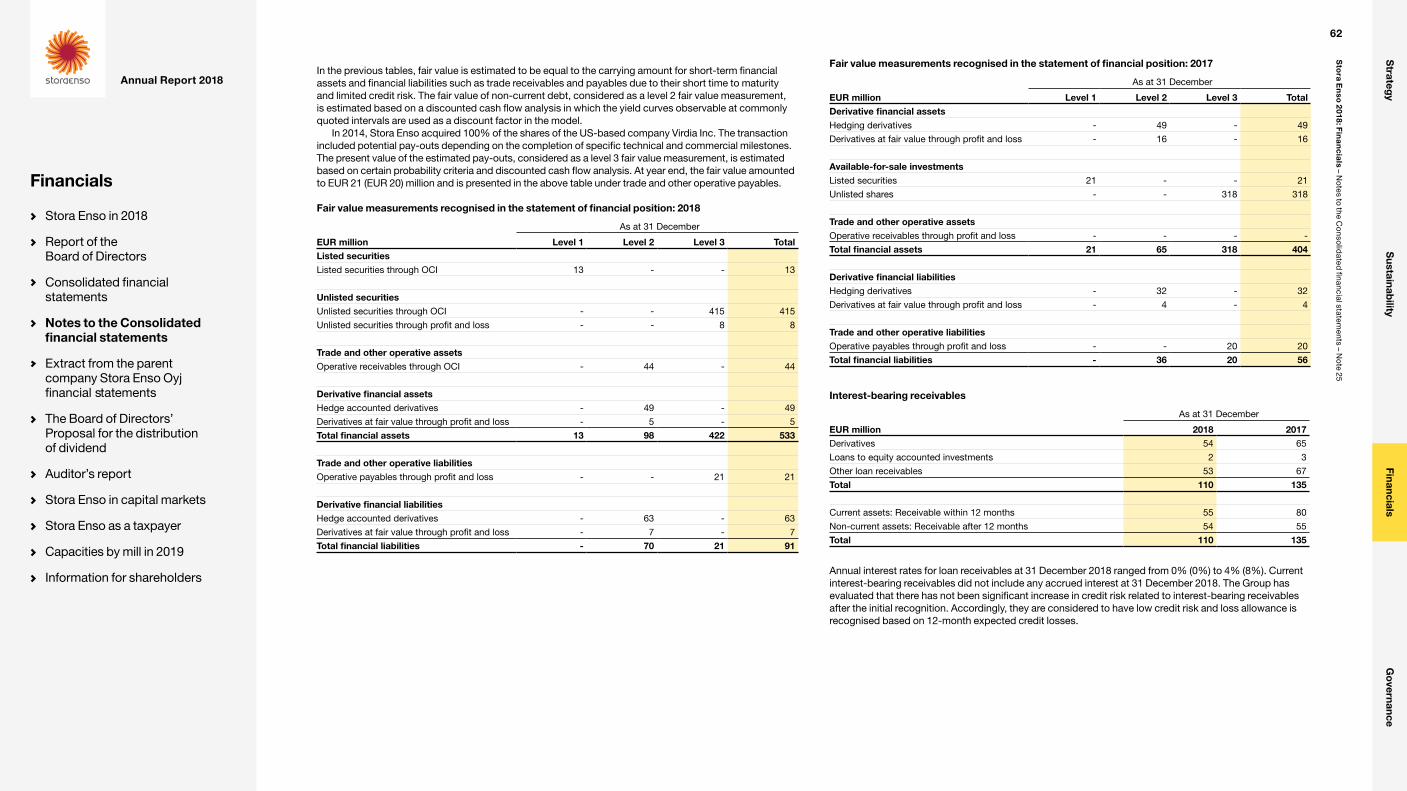
In the previous tables, fair value is estimated to be equal to the carrying amount for short-term financial assets and financial liabilities such as trade receivables and payables due to their short time to maturity and limited credit risk. The fair value of non-current debt, considered as a level 2 fair value measurement, is estimated based on a discounted cash flow analysis in which the yield curves observable at commonly quoted intervals are used as a discount factor in the model.
In 2014, Stora Enso acquired 100% of the shares of the US-based company Virdia Inc. The transaction included potential pay-outs depending on the completion of specific technical and commercial milestones. The present value of the estimated pay-outs, considered as a level 3 fair value measurement, is estimated based on certain probability criteria and discounted cash flow analysis. At year end, the fair value amounted to EUR 21 (EUR 20) million and is presented in the above table under trade and other operative payables.
Fair value measurements recognised in the statement of financial position: 2018
As at 31 December
EUR million Level 1 Level 2 Level 3 TotalListed securitiesListed securities through OCI 13 - - 13
Unlisted securitiesUnlisted securities through OCI - - 415 415
Unlisted securities through profit and loss - - 8 8
Trade and other operative assetsOperative receivables through OCI - 44 - 44
Derivative financial assetsHedge accounted derivatives - 49 - 49
Derivatives at fair value through profit and loss - 5 - 5
Total financial assets 13 98 422 533
Trade and other operative liabilitiesOperative payables through profit and loss - - 21 21
Derivative financial liabilitiesHedge accounted derivatives - 63 - 63
Derivatives at fair value through profit and loss - 7 - 7
Total financial liabilities - 70 21 91
Fair value measurements recognised in the statement of financial position: 2017
As at 31 December
EUR million Level 1 Level 2 Level 3 TotalDerivative financial assetsHedging derivatives - 49 - 49
Derivatives at fair value through profit and loss - 16 - 16
Available-for-sale investmentsListed securities 21 - - 21
Unlisted shares - - 318 318
Trade and other operative assetsOperative receivables through profit and loss - - - -
Total financial assets 21 65 318 404
Derivative financial liabilitiesHedging derivatives - 32 - 32
Derivatives at fair value through profit and loss - 4 - 4
Trade and other operative liabilitiesOperative payables through profit and loss - - 20 20
Total financial liabilities - 36 20 56
Interest-bearing receivables
As at 31 December
EUR million 2018 2017Derivatives 54 65
Loans to equity accounted investments 2 3
Other loan receivables 53 67
Total 110 135
Current assets: Receivable within 12 months 55 80
Non-current assets: Receivable after 12 months 54 55
Total 110 135
Annual interest rates for loan receivables at 31 December 2018 ranged from 0% (0%) to 4% (8%). Current interest-bearing receivables did not include any accrued interest at 31 December 2018. The Group has evaluated that there has not been significant increase in credit risk related to interest-bearing receivables after the initial recognition. Accordingly, they are considered to have low credit risk and loss allowance is recognised based on 12-month expected credit losses.
62
Sto
ra En
so 2
018: Fin
an
cia
ls – No
tes to the Co
nsolid
ated financial statem
ents – No
te 25
Strateg
yS
ustainability
FinancialsG
overnance
Annual Report 2018
Financials
Stora Enso in 2018
Report of the Board of Directors
Consolidated financial statements
Notes to the Consolidated financial statements
Extract from the parent company Stora Enso Oyj financial statements
The Board of Directors’ Proposal for the distribution of dividend
Auditor’s report
Stora Enso in capital markets
Stora Enso as a taxpayer
Capacities by mill in 2019
Information for shareholders
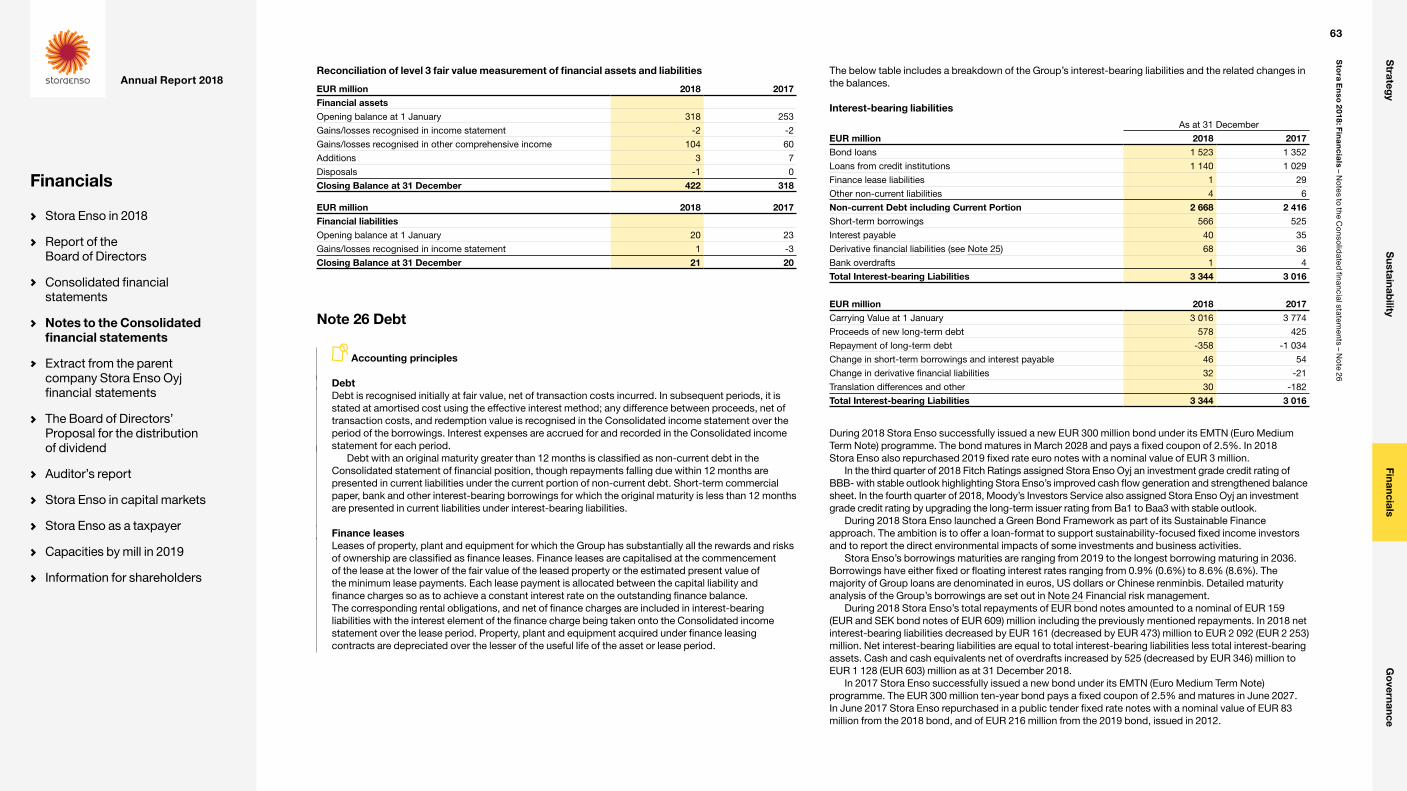
Reconciliation of level 3 fair value measurement of financial assets and liabilities
EUR million 2018 2017Financial assetsOpening balance at 1 January 318 253
Gains/losses recognised in income statement -2 -2
Gains/losses recognised in other comprehensive income 104 60
Additions 3 7
Disposals -1 0
Closing Balance at 31 December 422 318
EUR million 2018 2017Financial liabilitiesOpening balance at 1 January 20 23
Gains/losses recognised in income statement 1 -3
Closing Balance at 31 December 21 20
The below table includes a breakdown of the Group’s interest-bearing liabilities and the related changes in the balances.
Interest-bearing liabilities
As at 31 December
EUR million 2018 2017Bond loans 1 523 1 352
Loans from credit institutions 1 140 1 029
Finance lease liabilities 1 29
Other non-current liabilities 4 6
Non-current Debt including Current Portion 2 668 2 416Short-term borrowings 566 525
Interest payable 40 35
Derivative financial liabilities (see Note 25) 68 36
Bank overdrafts 1 4
Total Interest-bearing Liabilities 3 344 3 016
EUR million 2018 2017Carrying Value at 1 January 3 016 3 774
Proceeds of new long-term debt 578 425
Repayment of long-term debt -358 -1 034
Change in short-term borrowings and interest payable 46 54
Change in derivative financial liabilities 32 -21
Translation differences and other 30 -182
Total Interest-bearing Liabilities 3 344 3 016
During 2018 Stora Enso successfully issued a new EUR 300 million bond under its EMTN (Euro Medium Term Note) programme. The bond matures in March 2028 and pays a fixed coupon of 2.5%. In 2018 Stora Enso also repurchased 2019 fixed rate euro notes with a nominal value of EUR 3 million.
In the third quarter of 2018 Fitch Ratings assigned Stora Enso Oyj an investment grade credit rating of BBB- with stable outlook highlighting Stora Enso’s improved cash flow generation and strengthened balance sheet. In the fourth quarter of 2018, Moody’s Investors Service also assigned Stora Enso Oyj an investment grade credit rating by upgrading the long-term issuer rating from Ba1 to Baa3 with stable outlook.
During 2018 Stora Enso launched a Green Bond Framework as part of its Sustainable Finance approach. The ambition is to offer a loan-format to support sustainability-focused fixed income investors and to report the direct environmental impacts of some investments and business activities.
Stora Enso’s borrowings maturities are ranging from 2019 to the longest borrowing maturing in 2036. Borrowings have either fixed or floating interest rates ranging from 0.9% (0.6%) to 8.6% (8.6%). The majority of Group loans are denominated in euros, US dollars or Chinese renminbis. Detailed maturity analysis of the Group’s borrowings are set out in Note 24 Financial risk management.
During 2018 Stora Enso’s total repayments of EUR bond notes amounted to a nominal of EUR 159 (EUR and SEK bond notes of EUR 609) million including the previously mentioned repayments. In 2018 net interest-bearing liabilities decreased by EUR 161 (decreased by EUR 473) million to EUR 2 092 (EUR 2 253) million. Net interest-bearing liabilities are equal to total interest-bearing liabilities less total interest-bearing assets. Cash and cash equivalents net of overdrafts increased by 525 (decreased by EUR 346) million to EUR 1 128 (EUR 603) million as at 31 December 2018.
In 2017 Stora Enso successfully issued a new bond under its EMTN (Euro Medium Term Note) programme. The EUR 300 million ten-year bond pays a fixed coupon of 2.5% and matures in June 2027. In June 2017 Stora Enso repurchased in a public tender fixed rate notes with a nominal value of EUR 83 million from the 2018 bond, and of EUR 216 million from the 2019 bond, issued in 2012.
Note 26 Debt
Accounting principles
DebtDebt is recognised initially at fair value, net of transaction costs incurred. In subsequent periods, it is stated at amortised cost using the effective interest method; any difference between proceeds, net of transaction costs, and redemption value is recognised in the Consolidated income statement over the period of the borrowings. Interest expenses are accrued for and recorded in the Consolidated income statement for each period.
Debt with an original maturity greater than 12 months is classified as non-current debt in the Consolidated statement of financial position, though repayments falling due within 12 months are presented in current liabilities under the current portion of non-current debt. Short-term commercial paper, bank and other interest-bearing borrowings for which the original maturity is less than 12 months are presented in current liabilities under interest-bearing liabilities.
Finance leasesLeases of property, plant and equipment for which the Group has substantially all the rewards and risks of ownership are classified as finance leases. Finance leases are capitalised at the commencement of the lease at the lower of the fair value of the leased property or the estimated present value of the minimum lease payments. Each lease payment is allocated between the capital liability and finance charges so as to achieve a constant interest rate on the outstanding finance balance. The corresponding rental obligations, and net of finance charges are included in interest-bearing liabilities with the interest element of the finance charge being taken onto the Consolidated income statement over the lease period. Property, plant and equipment acquired under finance leasing contracts are depreciated over the lesser of the useful life of the asset or lease period.
63
Sto
ra En
so 2
018: Fin
an
cia
ls – No
tes to the Co
nsolid
ated financial statem
ents – No
te 26
Strateg
yS
ustainability
FinancialsG
overnance
Annual Report 2018
Financials
Stora Enso in 2018
Report of the Board of Directors
Consolidated financial statements
Notes to the Consolidated financial statements
Extract from the parent company Stora Enso Oyj financial statements
The Board of Directors’ Proposal for the distribution of dividend
Auditor’s report
Stora Enso in capital markets
Stora Enso as a taxpayer
Capacities by mill in 2019
Information for shareholders
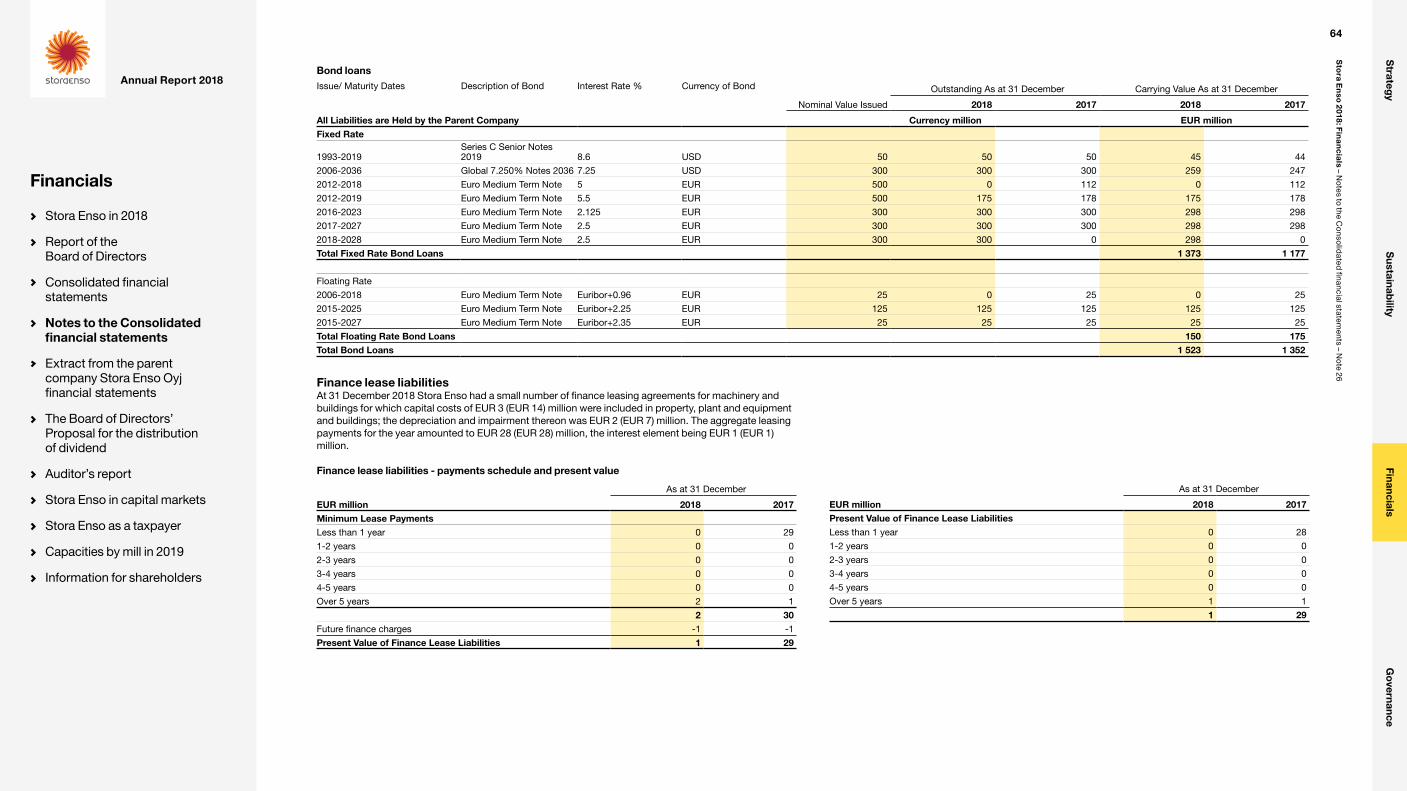
Bond loansIssue/ Maturity Dates Description of Bond Interest Rate % Currency of Bond
Nominal Value Issued
Outstanding As at 31 December Carrying Value As at 31 December
2018 2017 2018 2017
All Liabilities are Held by the Parent Company Currency million EUR millionFixed Rate
1993-2019Series C Senior Notes 2019 8.6 USD 50 50 50 45 44
2006-2036 Global 7.250% Notes 2036 7.25 USD 300 300 300 259 247
2012-2018 Euro Medium Term Note 5 EUR 500 0 112 0 112
2012-2019 Euro Medium Term Note 5.5 EUR 500 175 178 175 178
2016-2023 Euro Medium Term Note 2.125 EUR 300 300 300 298 298
2017-2027 Euro Medium Term Note 2.5 EUR 300 300 300 298 298
2018-2028 Euro Medium Term Note 2.5 EUR 300 300 0 298 0
Total Fixed Rate Bond Loans 1 373 1 177
Floating Rate
2006-2018 Euro Medium Term Note Euribor+0.96 EUR 25 0 25 0 25
2015-2025 Euro Medium Term Note Euribor+2.25 EUR 125 125 125 125 125
2015-2027 Euro Medium Term Note Euribor+2.35 EUR 25 25 25 25 25
Total Floating Rate Bond Loans 150 175Total Bond Loans 1 523 1 352
Finance lease liabilitiesAt 31 December 2018 Stora Enso had a small number of finance leasing agreements for machinery and buildings for which capital costs of EUR 3 (EUR 14) million were included in property, plant and equipment and buildings; the depreciation and impairment thereon was EUR 2 (EUR 7) million. The aggregate leasing payments for the year amounted to EUR 28 (EUR 28) million, the interest element being EUR 1 (EUR 1) million.
Finance lease liabilities - payments schedule and present value
As at 31 December
EUR million 2018 2017Minimum Lease PaymentsLess than 1 year 0 29
1-2 years 0 0
2-3 years 0 0
3-4 years 0 0
4-5 years 0 0
Over 5 years 2 1
2 30Future finance charges -1 -1
Present Value of Finance Lease Liabilities 1 29
As at 31 December
EUR million 2018 2017Present Value of Finance Lease LiabilitiesLess than 1 year 0 28
1-2 years 0 0
2-3 years 0 0
3-4 years 0 0
4-5 years 0 0
Over 5 years 1 1
1 29
64
Sto
ra En
so 2
018: Fin
an
cia
ls – No
tes to the Co
nsolid
ated financial statem
ents – No
te 26
Strateg
yS
ustainability
FinancialsG
overnance
Annual Report 2018
Financials
Stora Enso in 2018
Report of the Board of Directors
Consolidated financial statements
Notes to the Consolidated financial statements
Extract from the parent company Stora Enso Oyj financial statements
The Board of Directors’ Proposal for the distribution of dividend
Auditor’s report
Stora Enso in capital markets
Stora Enso as a taxpayer
Capacities by mill in 2019
Information for shareholders

Note 27 Derivatives
Accounting principles
Derivative financial instruments and hedge accountingFinancial derivatives are initially recognised in the Consolidated Statement of Financial Position at fair value and subsequently measured at their fair value at each reporting date, though the method of recognising the resulting gains or losses is dependent on the nature of the item being hedged. When derivative contracts are entered into, the Group designates them as either hedges of highly probable forecast transactions or firm commitments (cash flow hedges), hedges of the exposure to changes in the fair value of recognised assets or liabilities (fair value hedges), hedges of net investments in foreign entities or derivative financial instruments not meeting the hedge accounting criteria in accordance with IFRS 9.
At the inception of a hedge, the Group documents the relationship between the hedging instrument and the hedged item, as well as its risk management objective and strategy for undertaking various hedging transactions. This process includes linking all financial instruments designated under hedge accounting to specific assets and liabilities or to specific firm commitments or highly probable forecast transactions in order to verify and document hedge relationship between the hedged item and the hedging instrument as required by IFRS 9. For operational cash flow hedging purposes, foreign currency forwards and options are denominated in the same currency as the highly probable forecast transactions resulting in a hedge designation where critical terms of the hedging instrument and the hedged item will coincide. The Group also documents its qualitative prospective assessment at the hedge inception of whether the derivatives used in a hedge relationship are highly effective in offsetting changes in fair value or cash flows of hedged items. Hedge effectiveness will be assessed in accordance with IFRS 9 requirements.
Cash flow hedgesChanges in the fair value of derivatives designated and qualifying as cash flow hedges, and which are effective, are recognised in cash flow hedges reserve within OCI, the movements of which are disclosed in the Consolidated Statement of Comprehensive Income. In case of currency options, the time value of an option is excluded from the hedge designation and only the intrinsic value component of an option is designated as the hedging instrument. The changes in option time value are recognised in cost of hedging reserve within OCI. The cumulative gain or loss of a derivative deferred in equity is transferred to the Consolidated Income Statement and classified as income or expense in the same period in which the hedged item affects the Consolidated Income Statement. Realised results of hedge accounted derivative instruments hedging foreign currency sales transactions or purchases are booked as adjustments to sales or materials and services depending on the nature of the underlying hedged item and are specified in more detail in Note 27 Derivatives.
In respect of hedges of exposures to foreign currency risk of future transactions resulting in the recognition of non-financial assets, the gains and losses deferred to cash flow hedges reserve within OCI are transferred from equity to be included in the initial acquisition cost of the non-financial asset at the time of recognition. The deferred amounts are ultimately recognised in the Income Statement through depreciation over the lifetime of the non-financial assets.
When a hedging instrument expires or is sold, terminated or exercised or no longer meets the hedge accounting criteria under IFRS 9, any cumulative gain or loss deferred in equity at that time remains in equity and is accounted for as an adjustment to income or expense when the committed or forecast transaction is ultimately recognised in the Consolidated Income Statement. However, if the underlying forecasted transaction is no longer expected to occur, the cumulative gain or loss reported in equity from the period when the hedge was effective is immediately recognised in the Consolidated Income Statement.
Fair value hedgesIn case of fair value hedges, the Group uses either derivatives or borrowings as a hedging instrument to manage the risk associated with the fair value of a hedged item. The gains and losses on hedging
instruments designated and qualifying as fair value hedges, and which are highly effective, are recorded in the Consolidated Income Statement, along with any changes in the fair value of the hedged assets or liabilities attributable to the hedged risk.
Net investment hedgesHedges of net investments in foreign entities are accounted for similarly to cash flow hedges. The Group uses either derivatives or foreign-currency borrowings for this purpose. If the hedging instrument is a derivative, any gain or loss thereon relating to the effective portion of the hedge is recognised in equity in CTA as disclosed in the Consolidated Statement of Comprehensive Income; the gain or loss relating to the ineffective portion is immediately recognised in the Consolidated Income Statement. In addition, exchange gains and losses arising on the translation of a foreign-currency borrowing that hedges net investment in a foreign operation are also recognised in CTA, any ineffective portion being immediately recognised in the Consolidated Income Statement.
Fair value through profit and loss derivativesCertain derivative transactions, while providing effective economic hedges under Group risk management policies, do not qualify for hedge accounting under the specific rules in IFRS 9 and therefore changes in the fair value of such non-qualifying hedges are accounted for at fair value in the Consolidated Income Statement. Similarly, any ineffectiveness arising from hedging instruments is immediately recognised in the Consolidated Income Statement. Fair value changes of non-hedge accounted derivatives are recognised in the Consolidated Income Statement under financial income and expense. For total return swaps (TRS), the periodic changes in fair value are recorded in the Income Statement in operative costs alongside the share-based payment programme costs to which they relate.
Valuation of derivativesDerivative financial instruments are recorded in the Statement of financial position at their fair values defined as the amount at which the instrument could be exchanged in an orderly transaction between market participants at the measurement date. The fair values of such financial items have been estimated on the following basis:• Currency forward contract fair values are calculated using forward exchange rates at the reporting
date.• Currency option contract fair values are calculated using year-end market rates together with
common option pricing models.• Commodity contract fair values are computed with reference to quoted market prices on futures
exchanges or other reliable market sources.• Interest rate swaps fair values are calculated using a discounted cash flow analysis.• Cross-currency swaps fair values are calculated using a discounted cash flow analysis with
exchange of notionals being also included into the valuation model.
Shareholders’ equity – other comprehensive incomeOutstanding derivatives designated under cash flow hedge accounting are measured at fair value with the fair value movements being recorded in the separate equity category of OCI: Cash Flow Hedges Reserve. Time value of options is excluded from the cash flow hedge designation and recognised separately in a cost of hedging reserve within OCI.
Cash flow hedgesDerivatives used in currency cash flow hedges are mainly forward contracts and options, with swaps mainly used for commodity and interest rate hedging purposes. In respect to commodity hedges, the Group is also using risk component hedging to hedge highly probable forecast purchases of natural gas. The natural gas price is composed of API2 coal price index component, Dated Brent crude oil price component and local market index component. These purchases create natural gas price exposure that translates as API2 coal and Dated Brent crude oil risk components that can be hedged by using API2 coal and Dated Brent crude
65
Sto
ra En
so 2
018: Fin
an
cia
ls – No
tes to the Co
nsolid
ated financial statem
ents – No
te 27
Strateg
yS
ustainability
FinancialsG
overnance
Annual Report 2018
Financials
Stora Enso in 2018
Report of the Board of Directors
Consolidated financial statements
Notes to the Consolidated financial statements
Extract from the parent company Stora Enso Oyj financial statements
The Board of Directors’ Proposal for the distribution of dividend
Auditor’s report
Stora Enso in capital markets
Stora Enso as a taxpayer
Capacities by mill in 2019
Information for shareholders
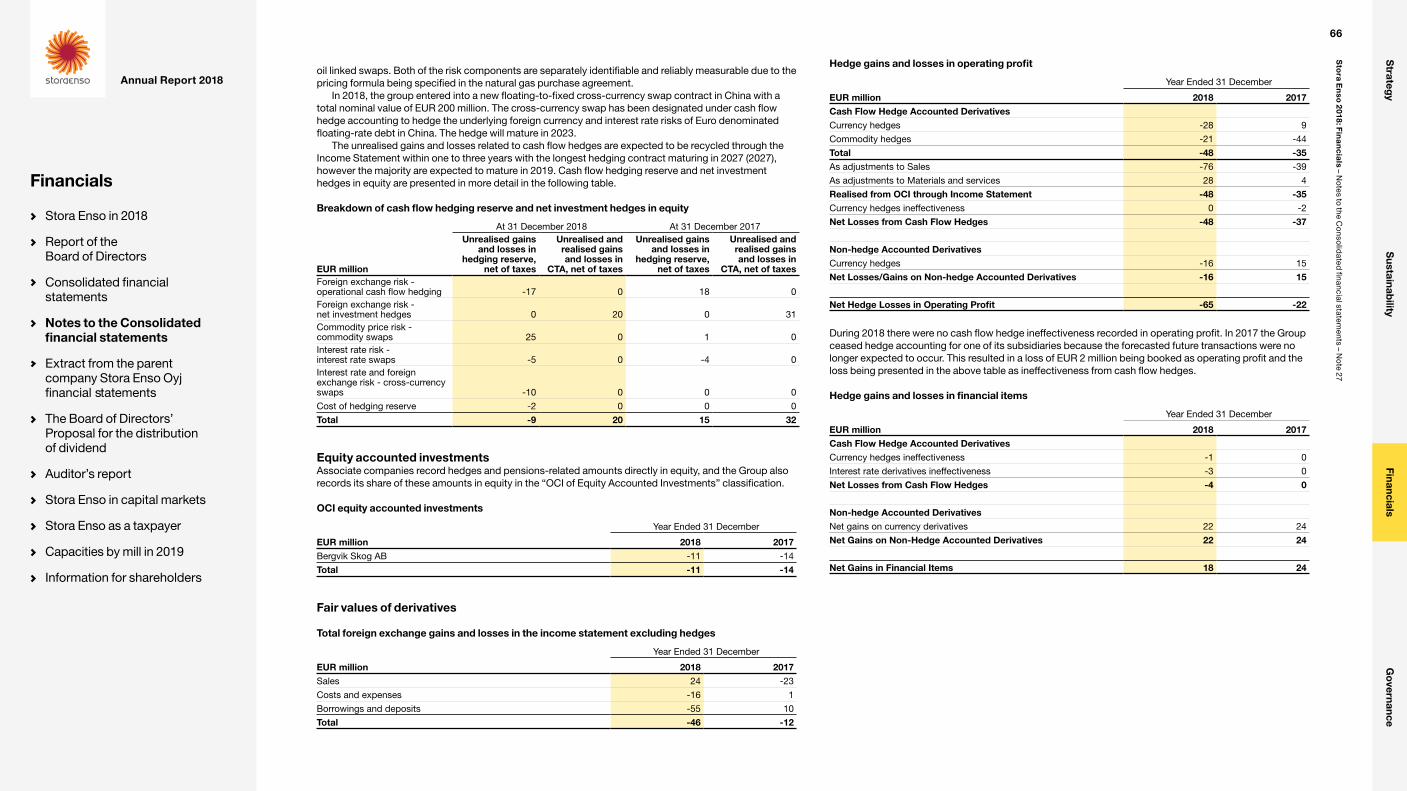
oil linked swaps. Both of the risk components are separately identifiable and reliably measurable due to the pricing formula being specified in the natural gas purchase agreement.
In 2018, the group entered into a new floating-to-fixed cross-currency swap contract in China with a total nominal value of EUR 200 million. The cross-currency swap has been designated under cash flow hedge accounting to hedge the underlying foreign currency and interest rate risks of Euro denominated floating-rate debt in China. The hedge will mature in 2023.
The unrealised gains and losses related to cash flow hedges are expected to be recycled through the Income Statement within one to three years with the longest hedging contract maturing in 2027 (2027), however the majority are expected to mature in 2019. Cash flow hedging reserve and net investment hedges in equity are presented in more detail in the following table.
Breakdown of cash flow hedging reserve and net investment hedges in equity
At 31 December 2018 At 31 December 2017
EUR million
Unrealised gains and losses in
hedging reserve, net of taxes
Unrealised and realised gains and losses in
CTA, net of taxes
Unrealised gains and losses in
hedging reserve, net of taxes
Unrealised and realised gains and losses in
CTA, net of taxesForeign exchange risk - operational cash flow hedging -17 0 18 0Foreign exchange risk - net investment hedges 0 20 0 31Commodity price risk - commodity swaps 25 0 1 0Interest rate risk - interest rate swaps -5 0 -4 0Interest rate and foreign exchange risk - cross-currency swaps -10 0 0 0
Cost of hedging reserve -2 0 0 0
Total -9 20 15 32
Equity accounted investmentsAssociate companies record hedges and pensions-related amounts directly in equity, and the Group also records its share of these amounts in equity in the “OCI of Equity Accounted Investments” classification.
OCI equity accounted investments
Year Ended 31 December
EUR million 2018 2017Bergvik Skog AB -11 -14
Total -11 -14
Fair values of derivatives
Total foreign exchange gains and losses in the income statement excluding hedges
Year Ended 31 December
EUR million 2018 2017Sales 24 -23
Costs and expenses -16 1
Borrowings and deposits -55 10
Total -46 -12
Hedge gains and losses in operating profit
Year Ended 31 December
EUR million 2018 2017Cash Flow Hedge Accounted DerivativesCurrency hedges -28 9
Commodity hedges -21 -44
Total -48 -35As adjustments to Sales -76 -39
As adjustments to Materials and services 28 4
Realised from OCI through Income Statement -48 -35Currency hedges ineffectiveness 0 -2
Net Losses from Cash Flow Hedges -48 -37
Non-hedge Accounted DerivativesCurrency hedges -16 15
Net Losses/Gains on Non-hedge Accounted Derivatives -16 15
Net Hedge Losses in Operating Profit -65 -22
During 2018 there were no cash flow hedge ineffectiveness recorded in operating profit. In 2017 the Group ceased hedge accounting for one of its subsidiaries because the forecasted future transactions were no longer expected to occur. This resulted in a loss of EUR 2 million being booked as operating profit and the loss being presented in the above table as ineffectiveness from cash flow hedges.
Hedge gains and losses in financial items
Year Ended 31 December
EUR million 2018 2017Cash Flow Hedge Accounted DerivativesCurrency hedges ineffectiveness -1 0
Interest rate derivatives ineffectiveness -3 0
Net Losses from Cash Flow Hedges -4 0
Non-hedge Accounted DerivativesNet gains on currency derivatives 22 24
Net Gains on Non-Hedge Accounted Derivatives 22 24
Net Gains in Financial Items 18 24
66
Sto
ra En
so 2
018: Fin
an
cia
ls – No
tes to the Co
nsolid
ated financial statem
ents – No
te 27
Strateg
yS
ustainability
FinancialsG
overnance
Annual Report 2018
Financials
Stora Enso in 2018
Report of the Board of Directors
Consolidated financial statements
Notes to the Consolidated financial statements
Extract from the parent company Stora Enso Oyj financial statements
The Board of Directors’ Proposal for the distribution of dividend
Auditor’s report
Stora Enso in capital markets
Stora Enso as a taxpayer
Capacities by mill in 2019
Information for shareholders
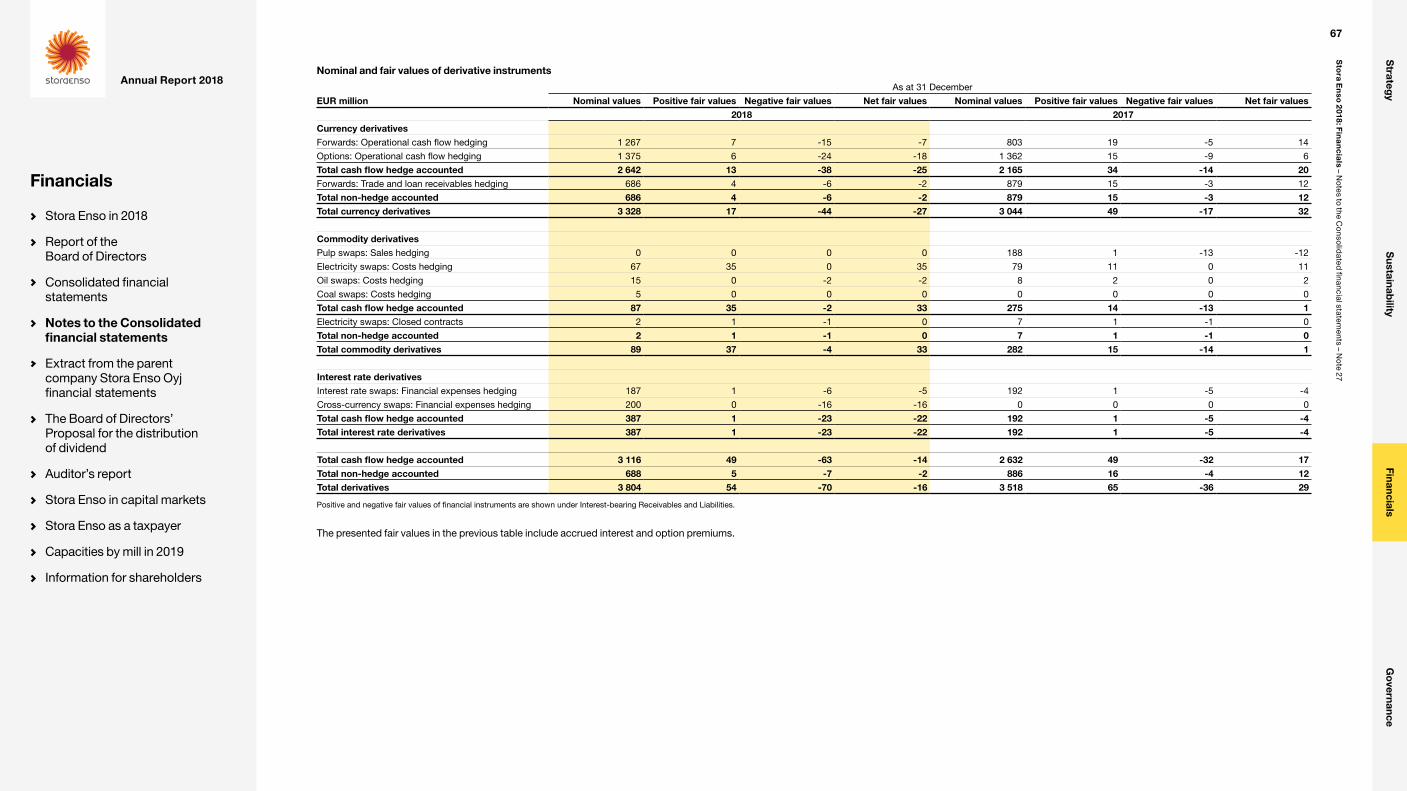
Nominal and fair values of derivative instruments
As at 31 December
EUR million Nominal values Positive fair values Negative fair values Net fair values Nominal values Positive fair values Negative fair values Net fair values2018 2017
Currency derivativesForwards: Operational cash flow hedging 1 267 7 -15 -7 803 19 -5 14
Options: Operational cash flow hedging 1 375 6 -24 -18 1 362 15 -9 6
Total cash flow hedge accounted 2 642 13 -38 -25 2 165 34 -14 20Forwards: Trade and loan receivables hedging 686 4 -6 -2 879 15 -3 12
Total non-hedge accounted 686 4 -6 -2 879 15 -3 12Total currency derivatives 3 328 17 -44 -27 3 044 49 -17 32
Commodity derivativesPulp swaps: Sales hedging 0 0 0 0 188 1 -13 -12
Electricity swaps: Costs hedging 67 35 0 35 79 11 0 11
Oil swaps: Costs hedging 15 0 -2 -2 8 2 0 2
Coal swaps: Costs hedging 5 0 0 0 0 0 0 0
Total cash flow hedge accounted 87 35 -2 33 275 14 -13 1Electricity swaps: Closed contracts 2 1 -1 0 7 1 -1 0
Total non-hedge accounted 2 1 -1 0 7 1 -1 0Total commodity derivatives 89 37 -4 33 282 15 -14 1
Interest rate derivativesInterest rate swaps: Financial expenses hedging 187 1 -6 -5 192 1 -5 -4
Cross-currency swaps: Financial expenses hedging 200 0 -16 -16 0 0 0 0
Total cash flow hedge accounted 387 1 -23 -22 192 1 -5 -4Total interest rate derivatives 387 1 -23 -22 192 1 -5 -4
Total cash flow hedge accounted 3 116 49 -63 -14 2 632 49 -32 17Total non-hedge accounted 688 5 -7 -2 886 16 -4 12Total derivatives 3 804 54 -70 -16 3 518 65 -36 29
Positive and negative fair values of financial instruments are shown under Interest-bearing Receivables and Liabilities.
The presented fair values in the previous table include accrued interest and option premiums.
67
Sto
ra En
so 2
018: Fin
an
cia
ls – No
tes to the Co
nsolid
ated financial statem
ents – No
te 27
Strateg
yS
ustainability
FinancialsG
overnance
Annual Report 2018
Financials
Stora Enso in 2018
Report of the Board of Directors
Consolidated financial statements
Notes to the Consolidated financial statements
Extract from the parent company Stora Enso Oyj financial statements
The Board of Directors’ Proposal for the distribution of dividend
Auditor’s report
Stora Enso in capital markets
Stora Enso as a taxpayer
Capacities by mill in 2019
Information for shareholders
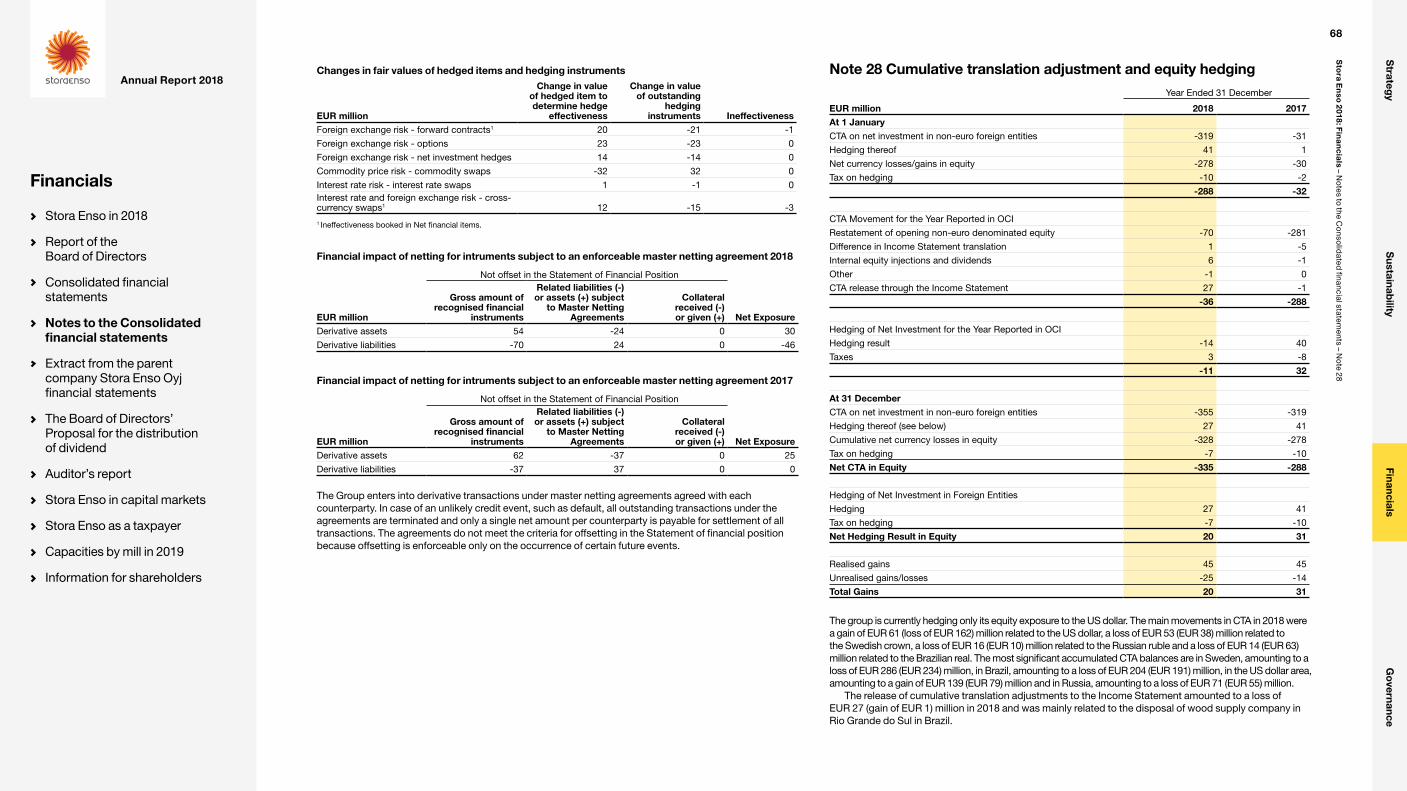
Changes in fair values of hedged items and hedging instruments
EUR million
Change in value of hedged item to determine hedge
effectiveness
Change in value of outstanding
hedging instruments Ineffectiveness
Foreign exchange risk - forward contracts1 20 -21 -1
Foreign exchange risk - options 23 -23 0
Foreign exchange risk - net investment hedges 14 -14 0
Commodity price risk - commodity swaps -32 32 0
Interest rate risk - interest rate swaps 1 -1 0Interest rate and foreign exchange risk - cross-currency swaps1 12 -15 -3
1 Ineffectiveness booked in Net financial items.
Financial impact of netting for intruments subject to an enforceable master netting agreement 2018
Not offset in the Statement of Financial Position
EUR million
Gross amount of recognised financial
instruments
Related liabilities (-) or assets (+) subject
to Master Netting Agreements
Collateral received (-) or given (+) Net Exposure
Derivative assets 54 -24 0 30
Derivative liabilities -70 24 0 -46
Financial impact of netting for intruments subject to an enforceable master netting agreement 2017
Not offset in the Statement of Financial Position
EUR million
Gross amount of recognised financial
instruments
Related liabilities (-) or assets (+) subject
to Master Netting Agreements
Collateral received (-) or given (+) Net Exposure
Derivative assets 62 -37 0 25
Derivative liabilities -37 37 0 0
The Group enters into derivative transactions under master netting agreements agreed with each counterparty. In case of an unlikely credit event, such as default, all outstanding transactions under the agreements are terminated and only a single net amount per counterparty is payable for settlement of all transactions. The agreements do not meet the criteria for offsetting in the Statement of financial position because offsetting is enforceable only on the occurrence of certain future events.
Note 28 Cumulative translation adjustment and equity hedging
Year Ended 31 December
EUR million 2018 2017At 1 JanuaryCTA on net investment in non-euro foreign entities -319 -31
Hedging thereof 41 1
Net currency losses/gains in equity -278 -30
Tax on hedging -10 -2
-288 -32
CTA Movement for the Year Reported in OCI
Restatement of opening non-euro denominated equity -70 -281
Difference in Income Statement translation 1 -5
Internal equity injections and dividends 6 -1
Other -1 0
CTA release through the Income Statement 27 -1
-36 -288
Hedging of Net Investment for the Year Reported in OCI
Hedging result -14 40
Taxes 3 -8
-11 32
At 31 DecemberCTA on net investment in non-euro foreign entities -355 -319
Hedging thereof (see below) 27 41
Cumulative net currency losses in equity -328 -278
Tax on hedging -7 -10
Net CTA in Equity -335 -288
Hedging of Net Investment in Foreign Entities
Hedging 27 41
Tax on hedging -7 -10
Net Hedging Result in Equity 20 31
Realised gains 45 45
Unrealised gains/losses -25 -14
Total Gains 20 31
The group is currently hedging only its equity exposure to the US dollar. The main movements in CTA in 2018 were a gain of EUR 61 (loss of EUR 162) million related to the US dollar, a loss of EUR 53 (EUR 38) million related to the Swedish crown, a loss of EUR 16 (EUR 10) million related to the Russian ruble and a loss of EUR 14 (EUR 63) million related to the Brazilian real. The most significant accumulated CTA balances are in Sweden, amounting to a loss of EUR 286 (EUR 234) million, in Brazil, amounting to a loss of EUR 204 (EUR 191) million, in the US dollar area, amounting to a gain of EUR 139 (EUR 79) million and in Russia, amounting to a loss of EUR 71 (EUR 55) million.
The release of cumulative translation adjustments to the Income Statement amounted to a loss of EUR 27 (gain of EUR 1) million in 2018 and was mainly related to the disposal of wood supply company in Rio Grande do Sul in Brazil.
68
Sto
ra En
so 2
018: Fin
an
cia
ls – No
tes to the Co
nsolid
ated financial statem
ents – No
te 28
Strateg
yS
ustainability
FinancialsG
overnance
Annual Report 2018
Financials
Stora Enso in 2018
Report of the Board of Directors
Consolidated financial statements
Notes to the Consolidated financial statements
Extract from the parent company Stora Enso Oyj financial statements
The Board of Directors’ Proposal for the distribution of dividend
Auditor’s report
Stora Enso in capital markets
Stora Enso as a taxpayer
Capacities by mill in 2019
Information for shareholders

Amounts recognized in the statement of financial position - CTA and equity hedging
As at 31 DecemberCumulative Translation
Adjustments (CTA) Equity HedgesNet CTA in the Statement
of Financial Position
EUR million 2018 2017 2018 2017 2018 2017Brazil -204 -191 0 0 -204 -191
China 65 69 0 0 65 69
Czech Republic 32 33 -9 -9 23 24
Poland -28 -19 17 17 -11 -2
Russia -71 -55 0 0 -71 -55
Sweden -286 -234 50 50 -236 -184
Uruguay 135 80 -31 -17 105 63
USA 4 -1 0 0 4 -1
Others -1 -1 0 0 -1 -1
CTA before Tax -355 -319 27 41 -328 -278Taxes 0 -7 -10 -7 -10
Net CTA in Equity -355 -319 20 31 -335 -288
Amounts recognized in the statement of other comprehensive income - CTA and equity hedging
As at 31 DecemberCumulative Translation
Adjustments (CTA) Equity HedgesNet CTA in the Statement
of Financial Position
EUR million 2018 2017 2018 2017 2018 2017Brazil -14 -63 0 0 -14 -63
China -4 -27 0 0 -4 -27
Czech Republic -1 7 0 0 -1 7
Poland -10 15 0 0 -10 15
Russia -16 -10 0 0 -16 -10
Sweden -53 -38 0 0 -53 -38
Uruguay 56 -147 -14 40 42 -107
USA 5 -15 0 0 5 -15
Others 0 -10 0 0 0 -10
CTA before Tax -36 -288 -14 40 -50 -248Taxes 0 0 3 -8 3 -8Amounts recognised in OCI -36 -288 -11 32 -47 -256
Hedging of net investment in foreign entitiesGroup policy for translation risk exposure is to minimise this by funding assets whenever possible and economically viable in the same currency, but if matching of the assets and liabilities in the same currency is not possible hedging of the remaining translation risk may take place. The gains and losses net of tax on all financial liabilities and instruments used for hedging purposes are offset in CTA against the respective currency movements arising from the restatement of the net investments at current exchange rates on the reporting date; the net amount of losses included in CTA during the period as shown in the previous table amounted to EUR 11 (gains of EUR 32) million.
Hedging instruments and unrealised hedge losses
As at 31 DecemberNominal amount
(Currency) Nominal amount (EUR) Unrealised Losses (EUR)
EUR million 2018 2017 2018 2017 2018 2017BorrowingsUSD area 350 350 306 292 -25 -14
Total Hedging 306 292 -25 -14
Note 29 Commitments and contingencies
Accounting principles
GuaranteesThe guarantees entered into with financial institutions and other credit guarantors generally oblige the group to make payment in the event of default by the borrower. The guarantees have off-Balance-Sheet credit risk representing the accounting loss that would be recognised at the reporting date if the counterparties fail to perform completely as contracted. The credit risk amounts are equal to the contract sums assuming the amounts are not paid in full and are irrecoverable from other parties.
Operating LeasesPayments made under operating leases are expensed on a straight-line basis over the lease periods. When an operating lease is terminated before the expiry of the lease period, any obligatory payment to the lessor by way of penalty is recognised as an expense in the period in which termination takes place. Lease termination benefits are recognised on a discounted basis.
Commitments
As at 31 December
EUR million 2018 2017On Own BehalfMortgages 2 2
Operating leases in next 12 months 100 81
Operating leases after next 12 months 631 644
Other commitments 6 6
On Behalf of Equity Accounted InvestmentsGuarantees 4 4
On Behalf of OthersGuarantees 23 26
Other commitments 13 0
Total 779 763
Mortgages 2 2
Guarantees 27 30
Operating leases 731 725
Other commitments 19 6
Total 779 763
69
Sto
ra En
so 2
018: Fin
an
cia
ls – No
tes to the Co
nsolid
ated financial statem
ents – No
te 29
Strateg
yS
ustainability
FinancialsG
overnance
Annual Report 2018
Financials
Stora Enso in 2018
Report of the Board of Directors
Consolidated financial statements
Notes to the Consolidated financial statements
Extract from the parent company Stora Enso Oyj financial statements
The Board of Directors’ Proposal for the distribution of dividend
Auditor’s report
Stora Enso in capital markets
Stora Enso as a taxpayer
Capacities by mill in 2019
Information for shareholders
native trees on part of Veracel’s plantations and a possible fine of BRL 20 (EUR 5) million. Veracel disputes the decision and has filed an appeal against it. Veracel operates in full compliance with all Brazilian laws and has obtained all the necessary environmental and operating licences for its industrial and forestry activities from the relevant authorities. In November 2008, a Federal Court suspended the effects of the decision. No provisions have been recorded in Veracel’s or Stora Enso’s accounts for the reforestation or the possible fine.
In June 2017, Veracel received a tax infringement note referring to year 2012 with a total amount of BRL 224 (EUR 50) million including interest and fines. The dispute is limited to fiscal year 2012 for which the tax authority applied another transfer pricing method due to a different interpretation of a transition rule. Veracel acts in full compliance with Brazilian transfer pricing law and has filed an administrative defense against the tax note in July 2017. In June 2018 Veracel received a positive decision from Federal Revenue Judgement, which has been confirmed by the Administrative Council For Fiscal Resources in January 2019. The total exposure at year end is BRL 241 (EUR 54) million considering interest until 31 December 2018. Stora Enso’s share of the exposure is BRL 120 (EUR 27) million. No provisions have been recorded in Veracel’s or Stora Enso’s accounts for this tax dispute.
The tax authority has claimed that part of the PIS (social integration programme) and COFINS (contribution for the financing of social security) paid by Veracel on the purchase of raw materials and services since 2006 was not eligible for tax credit. Stora Enso and Veracel consider the claim unjustified and no provisions have been made in Stora Enso’s or Veracel’s accounts for this matter. The dispute is still pending.
Legal proceedings in Finland
Roundwood claim In December 2009, the Finnish Market Court fined Stora Enso for competition law infringements in the market for roundwood in Finland from 1997 to 2004. Stora Enso did not appeal against the ruling. In March 2011, Metsähallitus of Finland initiated legal proceedings against Stora Enso, UPM and Metsäliitto claiming compensation for damage allegedly suffered due to the competition infringement. In its judgement rendered in June 2016, the Helsinki District Court dismissed Metsähallitus’ claim for damages against Stora Enso, UPM and Metsäliitto. Metsähallitus appealed against the District Court’s judgment to the Helsinki Court of Appeal, which rendered its judgement in the matter in May 2018. In its judgement, the Court of Appeal dismissed Metsähallitus’ appeal and upheld the District Court’s judgement. The total amount of Metsähallitus’ claim jointly and severally against Stora Enso, UPM and Metsäliitto in the Court of Appeal was approximately EUR 125 million and the secondary claim against Stora Enso was approximately EUR 68 million. Metsähallitus applied for a leave of appeal from the Supreme Court. The Supreme Court decided on 29 January 2019 that the application to appeal is denied. This concludes the case without Stora Enso having any payment obligation towards Metsähallitus. Further the entire round woodclaim case can be now considered closed without any material financial effects on Stora Enso. The quarterly reporting will discontinue.
Legal proceedings in Sweden
Insurance claim In July and August 2016, six Swedish insurance companies filed lawsuits in the Environmental Court and the District Court of Falun against Stora Enso, due to damage caused by the forest fire in Västmanland, Sweden, in 2014. The claimed amount is approximately SEK 300 (EUR 30) million. Stora Enso denies liability. So far the Environmental Court and thereafter the Environmental Court of Appeal has found that the Environmental code is not applicable on damage caused by fire.
Company fine In January 2018, a Swedish prosecutor filed a lawsuit against Stora Enso and its supplier, due to the forest fire in Västmanland, Sweden in 2014, claiming a company fine of SEK 5 million each. Both Stora Enso and the supplier have disputed the claim.
In 2018, the Group’s commitments amounted to EUR 779 (EUR 763) million. In addition, the parent company Stora Enso Oyj has guaranteed the liabilities of many of its subsidiaries and joint operations up to EUR 1 962 (EUR 2 073) million as of 31 December 2018.
The Group leases properties, land areas, vessels and other logistic equipment and machinery under various non-cancellable operating leases, some of which contain renewal options. There were no leases deemed onerous at the end of 2018 and 2017. The future cost for contracts exceeding one year and for non-cancellable operating leasing contracts are:
Repayment schedule of operating lease commitments
As at 31 December
EUR million 2018 2017Less than 1 year 100 81
1–2 years 92 71
2–3 years 78 63
3–4 years 57 54
4–5 years 48 38
Over 5 years 356 418
Total 731 725
The Group has rental commitments for up to 50 years, with the option to terminate them in 2034, on approximately 82 000 (84 000) hectares of land contracted to date in China, as well as being obliged to pay for the standing trees on land it has contracted to rent. Future land rental payments reported under operating leases are estimated at EUR 371 (EUR 486) million for the plantations.
Capital Commitments
As at 31 December
EUR million 2018 2017Total 111 152
Capital expenditure commitments are not recognised in the balance sheet and these include the Group’s share of direct capital expenditure contracts in joint operations. Commitments in relation to capital expenditure mainly relate to ongoing projects at Enocell and Imatra Mills in Finland, Skutskär and Gruvön Mills in Sweden and Maxau Mill in Germany.
Contingent liabilities Stora Enso has undertaken significant restructuring actions in recent years which have included the divestment of companies, sale of assets and mill closures. These transactions include a risk of possible environmental or other obligations the existence of which would be confirmed only by the occurrence or non-occurrence of one or more uncertain future events not wholly within the control of the Group.
Stora Enso is party to legal proceedings that arise in the ordinary course of business and which primarily involve claims arising out of commercial law. The management does not consider that liabilities related to such proceedings before insurance recoveries, if any, are likely to be material to the Group’s financial condition or results of operations.
Legal proceedings in Latin America
Veracel On 11 July 2008, Stora Enso announced that a federal judge in Brazil had issued a decision claiming that the permits issued by the State of Bahia for the operations of Stora Enso’s joint operations company Veracel were not valid. The judge also ordered Veracel to take certain actions, including reforestation with
70
Sto
ra En
so 2
018: Fin
an
cia
ls – No
tes to the Co
nsolid
ated financial statem
ents – No
te 29
Strateg
yS
ustainability
FinancialsG
overnance
Annual Report 2018
Financials
Stora Enso in 2018
Report of the Board of Directors
Consolidated financial statements
Notes to the Consolidated financial statements
Extract from the parent company Stora Enso Oyj financial statements
The Board of Directors’ Proposal for the distribution of dividend
Auditor’s report
Stora Enso in capital markets
Stora Enso as a taxpayer
Capacities by mill in 2019
Information for shareholders
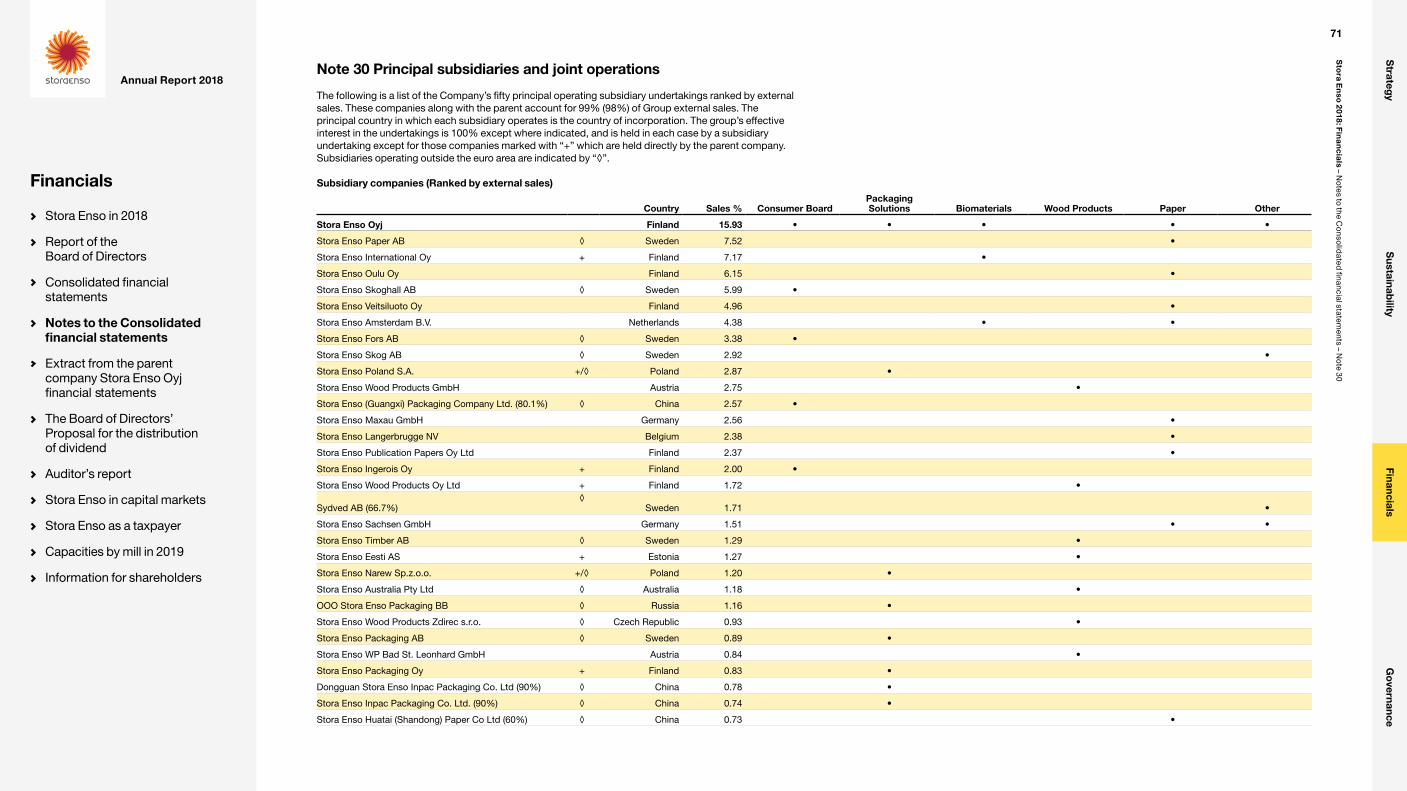
Note 30 Principal subsidiaries and joint operations
The following is a list of the Company’s fifty principal operating subsidiary undertakings ranked by external sales. These companies along with the parent account for 99% (98%) of Group external sales. The principal country in which each subsidiary operates is the country of incorporation. The group’s effective interest in the undertakings is 100% except where indicated, and is held in each case by a subsidiary undertaking except for those companies marked with “+” which are held directly by the parent company. Subsidiaries operating outside the euro area are indicated by “◊”.
Subsidiary companies (Ranked by external sales)
Country Sales % Consumer BoardPackaging Solutions Biomaterials Wood Products Paper Other
Stora Enso Oyj Finland 15.93 • • • • •
Stora Enso Paper AB ◊ Sweden 7.52 •
Stora Enso International Oy + Finland 7.17 •
Stora Enso Oulu Oy Finland 6.15 •
Stora Enso Skoghall AB ◊ Sweden 5.99 •
Stora Enso Veitsiluoto Oy Finland 4.96 •
Stora Enso Amsterdam B.V. Netherlands 4.38 • •
Stora Enso Fors AB ◊ Sweden 3.38 •
Stora Enso Skog AB ◊ Sweden 2.92 •
Stora Enso Poland S.A. +/◊ Poland 2.87 •
Stora Enso Wood Products GmbH Austria 2.75 •
Stora Enso (Guangxi) Packaging Company Ltd. (80.1%) ◊ China 2.57 •
Stora Enso Maxau GmbH Germany 2.56 •
Stora Enso Langerbrugge NV Belgium 2.38 •
Stora Enso Publication Papers Oy Ltd Finland 2.37 •
Stora Enso Ingerois Oy + Finland 2.00 •
Stora Enso Wood Products Oy Ltd + Finland 1.72 •
Sydved AB (66.7%)◊
Sweden 1.71 •
Stora Enso Sachsen GmbH Germany 1.51 • •
Stora Enso Timber AB ◊ Sweden 1.29 •
Stora Enso Eesti AS + Estonia 1.27 •
Stora Enso Narew Sp.z.o.o. +/◊ Poland 1.20 •
Stora Enso Australia Pty Ltd ◊ Australia 1.18 •
OOO Stora Enso Packaging BB ◊ Russia 1.16 •
Stora Enso Wood Products Zdirec s.r.o. ◊ Czech Republic 0.93 •
Stora Enso Packaging AB ◊ Sweden 0.89 •
Stora Enso WP Bad St. Leonhard GmbH Austria 0.84 •
Stora Enso Packaging Oy + Finland 0.83 •
Dongguan Stora Enso Inpac Packaging Co. Ltd (90%) ◊ China 0.78 •
Stora Enso Inpac Packaging Co. Ltd. (90%) ◊ China 0.74 •
Stora Enso Huatai (Shandong) Paper Co Ltd (60%) ◊ China 0.73 •
71
Sto
ra En
so 2
018: Fin
an
cia
ls – No
tes to the Co
nsolid
ated financial statem
ents – No
te 30
Strateg
yS
ustainability
FinancialsG
overnance
Annual Report 2018
Financials
Stora Enso in 2018
Report of the Board of Directors
Consolidated financial statements
Notes to the Consolidated financial statements
Extract from the parent company Stora Enso Oyj financial statements
The Board of Directors’ Proposal for the distribution of dividend
Auditor’s report
Stora Enso in capital markets
Stora Enso as a taxpayer
Capacities by mill in 2019
Information for shareholders
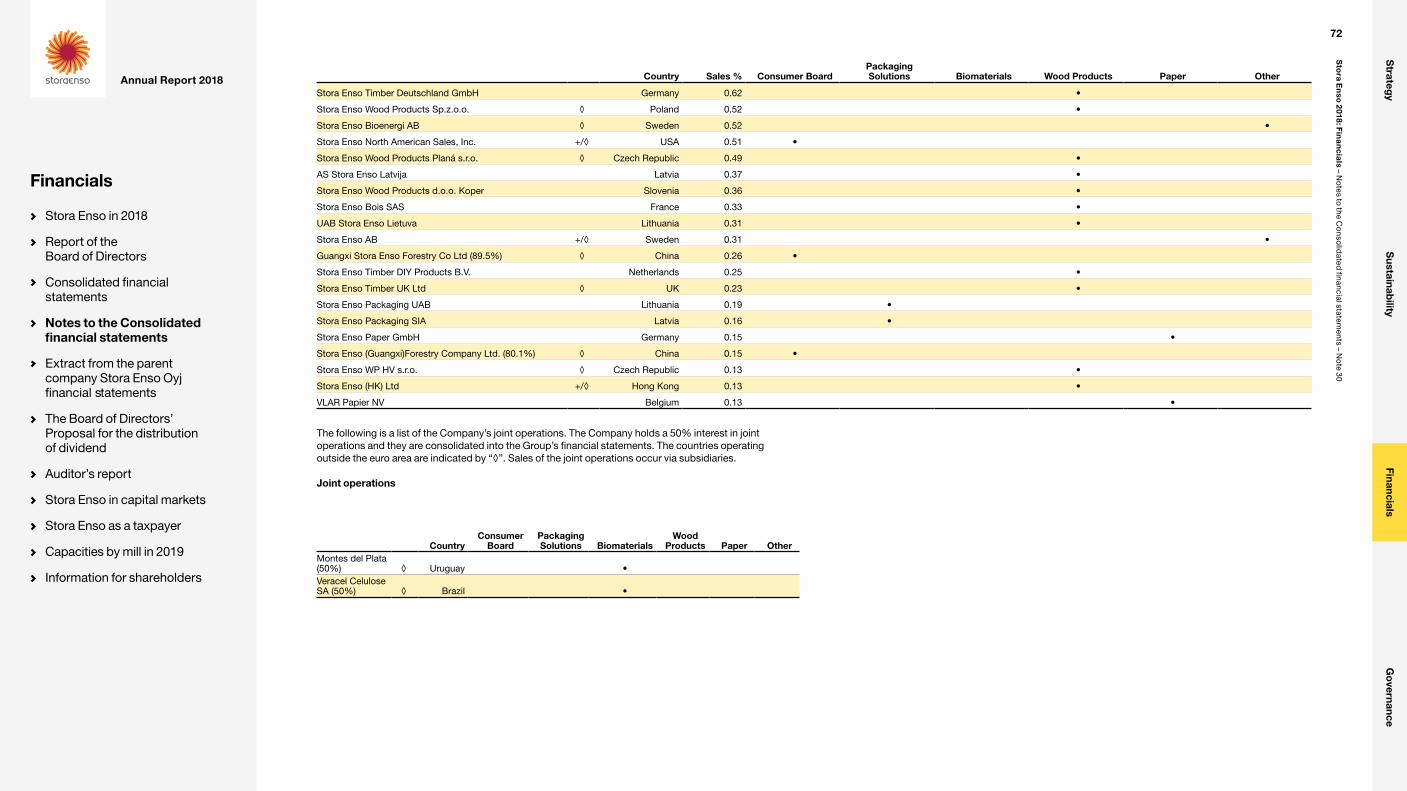
Country Sales % Consumer BoardPackaging Solutions Biomaterials Wood Products Paper Other
Stora Enso Timber Deutschland GmbH Germany 0.62 •
Stora Enso Wood Products Sp.z.o.o. ◊ Poland 0.52 •
Stora Enso Bioenergi AB ◊ Sweden 0.52 •
Stora Enso North American Sales, Inc. +/◊ USA 0.51 •
Stora Enso Wood Products Planá s.r.o. ◊ Czech Republic 0.49 •
AS Stora Enso Latvija Latvia 0.37 •
Stora Enso Wood Products d.o.o. Koper Slovenia 0.36 •
Stora Enso Bois SAS France 0.33 •
UAB Stora Enso Lietuva Lithuania 0.31 •
Stora Enso AB +/◊ Sweden 0.31 •
Guangxi Stora Enso Forestry Co Ltd (89.5%) ◊ China 0.26 •
Stora Enso Timber DIY Products B.V. Netherlands 0.25 •
Stora Enso Timber UK Ltd ◊ UK 0.23 •
Stora Enso Packaging UAB Lithuania 0.19 •
Stora Enso Packaging SIA Latvia 0.16 •
Stora Enso Paper GmbH Germany 0.15 •
Stora Enso (Guangxi)Forestry Company Ltd. (80.1%) ◊ China 0.15 •
Stora Enso WP HV s.r.o. ◊ Czech Republic 0.13 •
Stora Enso (HK) Ltd +/◊ Hong Kong 0.13 •
VLAR Papier NV Belgium 0.13 •
The following is a list of the Company’s joint operations. The Company holds a 50% interest in joint operations and they are consolidated into the Group’s financial statements. The countries operating outside the euro area are indicated by “◊”. Sales of the joint operations occur via subsidiaries.
Joint operations
CountryConsumer
BoardPackaging Solutions Biomaterials
Wood Products Paper Other
Montes del Plata (50%) ◊ Uruguay •Veracel Celulose SA (50%) ◊ Brazil •
72
Sto
ra En
so 2
018: Fin
an
cia
ls – No
tes to the Co
nsolid
ated financial statem
ents – No
te 30
Strateg
yS
ustainability
FinancialsG
overnance
Annual Report 2018
Financials
Stora Enso in 2018
Report of the Board of Directors
Consolidated financial statements
Notes to the Consolidated financial statements
Extract from the parent company Stora Enso Oyj financial statements
The Board of Directors’ Proposal for the distribution of dividend
Auditor’s report
Stora Enso in capital markets
Stora Enso as a taxpayer
Capacities by mill in 2019
Information for shareholders
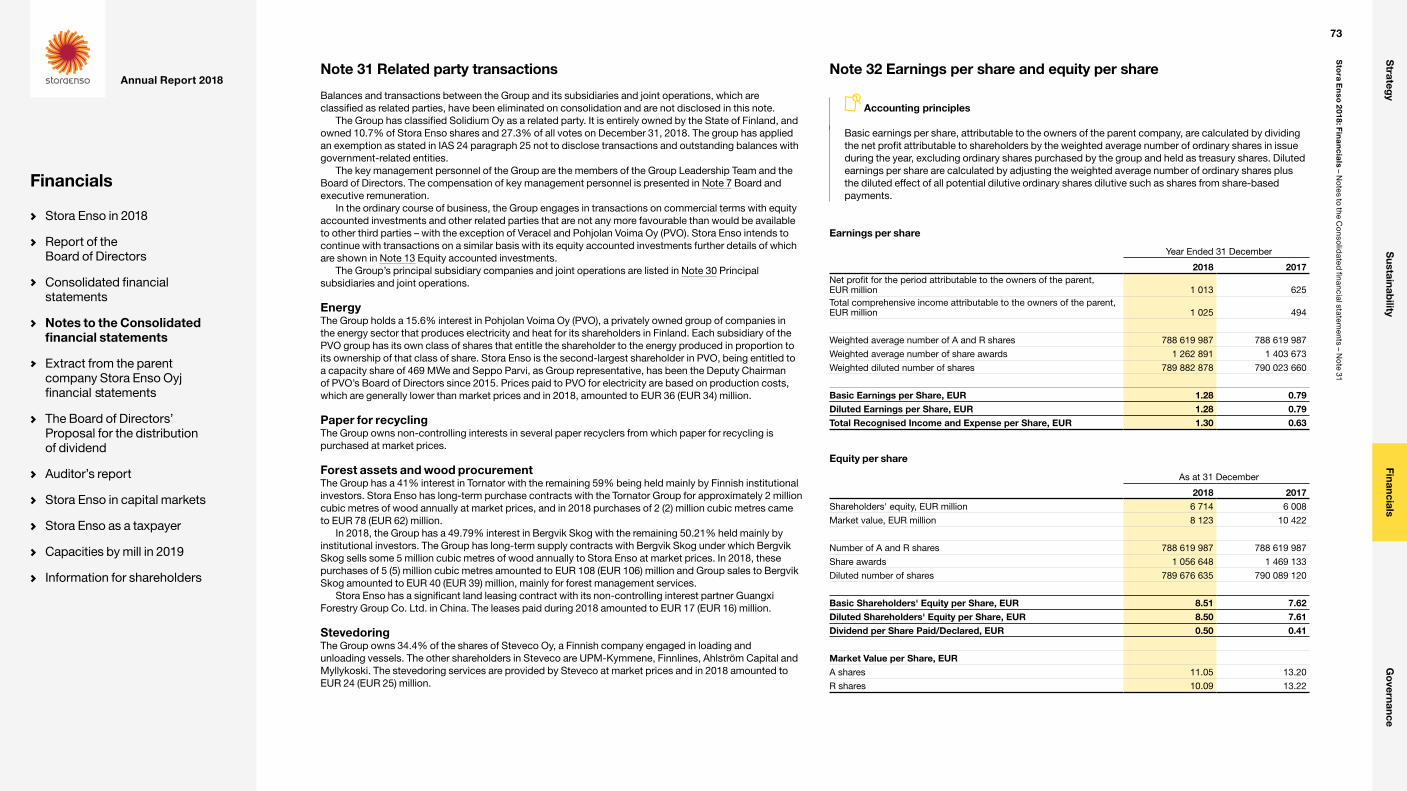
Note 31 Related party transactions
Balances and transactions between the Group and its subsidiaries and joint operations, which are classified as related parties, have been eliminated on consolidation and are not disclosed in this note.
The Group has classified Solidium Oy as a related party. It is entirely owned by the State of Finland, and owned 10.7% of Stora Enso shares and 27.3% of all votes on December 31, 2018. The group has applied an exemption as stated in IAS 24 paragraph 25 not to disclose transactions and outstanding balances with government-related entities.
The key management personnel of the Group are the members of the Group Leadership Team and the Board of Directors. The compensation of key management personnel is presented in Note 7 Board and executive remuneration.
In the ordinary course of business, the Group engages in transactions on commercial terms with equity accounted investments and other related parties that are not any more favourable than would be available to other third parties – with the exception of Veracel and Pohjolan Voima Oy (PVO). Stora Enso intends to continue with transactions on a similar basis with its equity accounted investments further details of which are shown in Note 13 Equity accounted investments.
The Group’s principal subsidiary companies and joint operations are listed in Note 30 Principal subsidiaries and joint operations.
EnergyThe Group holds a 15.6% interest in Pohjolan Voima Oy (PVO), a privately owned group of companies in the energy sector that produces electricity and heat for its shareholders in Finland. Each subsidiary of the PVO group has its own class of shares that entitle the shareholder to the energy produced in proportion to its ownership of that class of share. Stora Enso is the second-largest shareholder in PVO, being entitled to a capacity share of 469 MWe and Seppo Parvi, as Group representative, has been the Deputy Chairman of PVO’s Board of Directors since 2015. Prices paid to PVO for electricity are based on production costs, which are generally lower than market prices and in 2018, amounted to EUR 36 (EUR 34) million.
Paper for recyclingThe Group owns non-controlling interests in several paper recyclers from which paper for recycling is purchased at market prices.
Forest assets and wood procurementThe Group has a 41% interest in Tornator with the remaining 59% being held mainly by Finnish institutional investors. Stora Enso has long-term purchase contracts with the Tornator Group for approximately 2 million cubic metres of wood annually at market prices, and in 2018 purchases of 2 (2) million cubic metres came to EUR 78 (EUR 62) million.
In 2018, the Group has a 49.79% interest in Bergvik Skog with the remaining 50.21% held mainly by institutional investors. The Group has long-term supply contracts with Bergvik Skog under which Bergvik Skog sells some 5 million cubic metres of wood annually to Stora Enso at market prices. In 2018, these purchases of 5 (5) million cubic metres amounted to EUR 108 (EUR 106) million and Group sales to Bergvik Skog amounted to EUR 40 (EUR 39) million, mainly for forest management services.
Stora Enso has a significant land leasing contract with its non-controlling interest partner Guangxi Forestry Group Co. Ltd. in China. The leases paid during 2018 amounted to EUR 17 (EUR 16) million.
StevedoringThe Group owns 34.4% of the shares of Steveco Oy, a Finnish company engaged in loading and unloading vessels. The other shareholders in Steveco are UPM-Kymmene, Finnlines, Ahlström Capital and Myllykoski. The stevedoring services are provided by Steveco at market prices and in 2018 amounted to EUR 24 (EUR 25) million.
Note 32 Earnings per share and equity per share
Accounting principles
Basic earnings per share, attributable to the owners of the parent company, are calculated by dividing the net profit attributable to shareholders by the weighted average number of ordinary shares in issue during the year, excluding ordinary shares purchased by the group and held as treasury shares. Diluted earnings per share are calculated by adjusting the weighted average number of ordinary shares plus the diluted effect of all potential dilutive ordinary shares dilutive such as shares from share-based payments.
Earnings per share
Year Ended 31 December
2018 2017Net profit for the period attributable to the owners of the parent, EUR million 1 013 625Total comprehensive income attributable to the owners of the parent, EUR million 1 025 494
Weighted average number of A and R shares 788 619 987 788 619 987
Weighted average number of share awards 1 262 891 1 403 673
Weighted diluted number of shares 789 882 878 790 023 660
Basic Earnings per Share, EUR 1.28 0.79Diluted Earnings per Share, EUR 1.28 0.79Total Recognised Income and Expense per Share, EUR 1.30 0.63
Equity per share
As at 31 December
2018 2017Shareholders' equity, EUR million 6 714 6 008
Market value, EUR million 8 123 10 422
Number of A and R shares 788 619 987 788 619 987
Share awards 1 056 648 1 469 133
Diluted number of shares 789 676 635 790 089 120
Basic Shareholders' Equity per Share, EUR 8.51 7.62Diluted Shareholders' Equity per Share, EUR 8.50 7.61Dividend per Share Paid/Declared, EUR 0.50 0.41
Market Value per Share, EURA shares 11.05 13.20
R shares 10.09 13.22
73
Sto
ra En
so 2
018: Fin
an
cia
ls – No
tes to the Co
nsolid
ated financial statem
ents – No
te 31
Strateg
yS
ustainability
FinancialsG
overnance
Annual Report 2018
Financials
Stora Enso in 2018
Report of the Board of Directors
Consolidated financial statements
Notes to the Consolidated financial statements
Extract from the parent company Stora Enso Oyj financial statements
The Board of Directors’ Proposal for the distribution of dividend
Auditor’s report
Stora Enso in capital markets
Stora Enso as a taxpayer
Capacities by mill in 2019
Information for shareholders
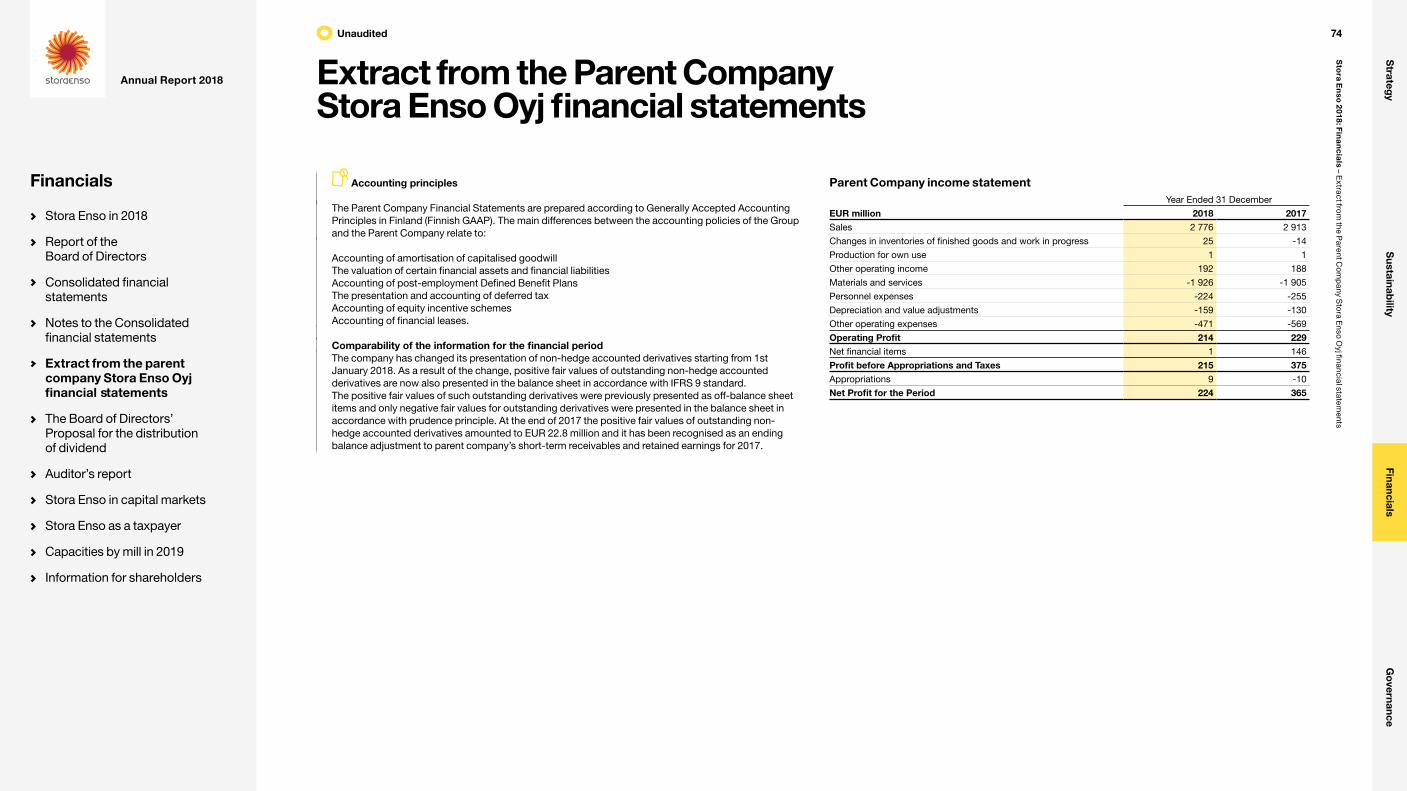
Accounting principles
The Parent Company Financial Statements are prepared according to Generally Accepted Accounting Principles in Finland (Finnish GAAP). The main differences between the accounting policies of the Group and the Parent Company relate to:
Accounting of amortisation of capitalised goodwill The valuation of certain financial assets and financial liabilities Accounting of post-employment Defined Benefit Plans The presentation and accounting of deferred tax Accounting of equity incentive schemes Accounting of financial leases.
Comparability of the information for the financial periodThe company has changed its presentation of non-hedge accounted derivatives starting from 1st January 2018. As a result of the change, positive fair values of outstanding non-hedge accounted derivatives are now also presented in the balance sheet in accordance with IFRS 9 standard. The positive fair values of such outstanding derivatives were previously presented as off-balance sheet items and only negative fair values for outstanding derivatives were presented in the balance sheet in accordance with prudence principle. At the end of 2017 the positive fair values of outstanding non-hedge accounted derivatives amounted to EUR 22.8 million and it has been recognised as an ending balance adjustment to parent company’s short-term receivables and retained earnings for 2017.
Parent Company income statementYear Ended 31 December
EUR million 2018 2017Sales 2 776 2 913
Changes in inventories of finished goods and work in progress 25 -14
Production for own use 1 1
Other operating income 192 188
Materials and services -1 926 -1 905
Personnel expenses -224 -255
Depreciation and value adjustments -159 -130
Other operating expenses -471 -569
Operating Profit 214 229Net financial items 1 146
Profit before Appropriations and Taxes 215 375Appropriations 9 -10
Net Profit for the Period 224 365
Extract from the Parent Company Stora Enso Oyj financial statements
Unaudited 74
Sto
ra En
so 2
018: Fin
an
cia
ls – Extract fro
m the P
arent Co
mp
any Sto
ra Enso O
yj financial statements
Strateg
yS
ustainability
FinancialsG
overnance
Annual Report 2018
Financials
Stora Enso in 2018
Report of the Board of Directors
Consolidated financial statements
Notes to the Consolidated financial statements
Extract from the parent company Stora Enso Oyj financial statements
The Board of Directors’ Proposal for the distribution of dividend
Auditor’s report
Stora Enso in capital markets
Stora Enso as a taxpayer
Capacities by mill in 2019
Information for shareholders

Parent Company statement of financial position
Assets
As at 31 December
EUR million 2018 2017Fixed Assets and Non-current InvestmentsIntangible assets 90 75
Tangible assets 840 805
Shares in Group companies 6 199 6 139
Receivables from Group companies 1 520 1 486
Investments in Associated companies 39 40
Other investments 230 230
8 918 8 775
Current AssetsInventories 326 247
Short-term receivables 555 570
Deposit Group companies 82 816
Deposit other companies 315 0
Cash and cash equivalents 471 375
1 749 2 008
Total Assets 10 667 10 784
Equity and Liabilities
As at 31 December
EUR million 2018 2017Share capital 1 342 1 342
Share premium 3 639 3 639
Fair value reserve -10 1
Invested non-restricted equity fund 633 633
Retained earnings 627 585
Net profit for the period 223 365
6 454 6 565
Appropriations 200 209
Provisions 26 26
Non-current Liabilities 1 464 1 378
Current Liabilities 2 523 2 606
Total Equity and Liabilities 10 667 10 784
Parent Company cash flow statementYear Ended 31 December
EUR million 2018 2017Cash Provided by Operating ActivitiesNet profit for the period 223 365
Appropriations -9 10
Depreciation and value adjustments 159 130
Unrealised foreign exchange gains and losses 6 52
Other non-cash items -3 12
Financial income and expenses -1 -146
Interest received 25 32
Interest paid net of amounts capitalised -64 -105
Dividends received 76 201
Other financial items paid net -35 37
Income taxes paid -1 -1
Change in net working capital -87 -13
Net Cash Provided by Operating Activities 289 574
Net Cash from Investing ActivitiesCapital expenditure -185 -203
Proceeds from sale of fixed assets 6 3
Purchases of other investments 0 -7
Investment in subsidiary shares -61 -87
Proceeds from disposal of subsidiary shares 2 61
Proceeds from disposal of shares in other companies 1 2
Proceeds from long-term receivables net 6 -190
Net Cash Provided in Investing Activities -231 -421
Cash Flow from Financing Activities
Proceeds from (issue of) long-term liabilities 299 300
Proceeds from (payment of) long-term liabilities -226 -662
Proceeds from (payment of) short-term borrowings net -128 -546
Capital repayment / dividend per share paid/declared -323 -292
Net Cash Used in Financing Activities -378 -1 200
Net Increase (Decrease) in Cash and Cash Equivalents -321 -1 046Translation adjustment -1 -7
Business transfers 1.5. 0 -16
Cash and cash equivalents at start of year 1 190 2 259
Cash and Cash Equivalents at Year End 868 1 190
75
Sto
ra En
so 2
018: Fin
an
cia
ls – Extract fro
m the P
arent Co
mp
any Sto
ra Enso O
yj financial statements
Strateg
yS
ustainability
FinancialsG
overnance
Annual Report 2018
Financials
Stora Enso in 2018
Report of the Board of Directors
Consolidated financial statements
Notes to the Consolidated financial statements
Extract from the parent company Stora Enso Oyj financial statements
The Board of Directors’ Proposal for the distribution of dividend
Auditor’s report
Stora Enso in capital markets
Stora Enso as a taxpayer
Capacities by mill in 2019
Information for shareholders

The Parent Company distributable shareholders’ equity on 31 December 2018 amounted to EUR 1 473 289 418.75, including the profit for the period of EUR 223 340 113.24. The Board of Directors proposes to the Annual General Meeting of the Company that the distributable funds be used as follows:
Dividend of EUR 0.50 per share from the distributable shareholders’ equity to be distributed on 788 619 987 shares, not to exceed EUR 394 309 993.50
Remaining in distributable shareholders’ equity EUR 1 078 979 425.25
Distributable shareholders’ equity on 31 December 2018, total EUR 1 473 289 418.75
There have been no material changes in the Parent Company’s financial position since 31 December 2018. The liquidity of the Parent Company remains good and the proposed dividend does not risk the solvency of the Company.
Helsinki, 31 January 2019
Jorma ElorantaChairman
Hans StråbergVice Chairman
Anne Brunila Elisabeth Fleuriot
Hock Goh Christiane Kuehne
Antti Mäkinen Richard Nilsson
Göran Sandberg
Karl-Henrik SundströmCEO
The Board of Director’s Proposal for the distribution of dividend
76
Sto
ra En
so 2
018: Fin
an
cia
ls – The B
oard
of D
irector’s P
rop
osal fo
r the distrib
ution o
f divid
end
Strateg
yS
ustainability
FinancialsG
overnance
Annual Report 2018
Financials
Stora Enso in 2018
Report of the Board of Directors
Consolidated financial statements
Notes to the Consolidated financial statements
Extract from the parent company Stora Enso Oyj financial statements
The Board of Directors’ Proposal for the distribution of dividend
Auditor’s report
Stora Enso in capital markets
Stora Enso as a taxpayer
Capacities by mill in 2019
Information for shareholders

To the Annual General Meeting of Stora Enso Oyj
Report on the Audit of Financial Statements
OpinionIn our opinion• the consolidated financial statements give a true and fair view of the group’s financial position and
financial performance and cash flows in accordance with International Financial Reporting Standards (IFRS) as adopted by the EU
• the financial statements give a true and fair view of the parent company’s financial performance and financial position in accordance with the laws and regulations governing the preparation of the financial statements in Finland and comply with statutory requirements.
Our opinion is consistent with the additional report to the Financial and Audit Committee.
What we have auditedWe have audited the financial statements of Stora Enso Oyj (business identity code 1039050-8) for the year ended 31 December 2018. The financial statements comprise:• the consolidated statement of financial position, income statement, statement of comprehensive
income, statement of changes in equity, cash flows statement and notes, including a summary of significant accounting policies
• the parent company’s statement of financial position, income statement, cash flow statement and notes.
Basis for Opinion We conducted our audit in accordance with good auditing practice in Finland. Our responsibilities under good auditing practice are further described in the Auditor’s Responsibilities for the Audit of the Financial Statements section of our report.
We believe that the audit evidence we have obtained is sufficient and appropriate to provide a basis for our opinion.
IndependenceWe are independent of the parent company and of the group companies in accordance with the ethical requirements that are applicable in Finland and are relevant to our audit, and we have fulfilled our other ethical responsibilities in accordance with these requirements.
To the best of our knowledge and belief, the non-audit services that we have provided to the parent company and to the group companies are in accordance with the applicable law and regulations in Finland and we have not provided non-audit services that are prohibited under Article 5(1) of Regulation (EU) No 537/2014. The non-audit services that we have provided are disclosed in note 5 to the Financial Statements.
Our Audit Approach
Overview
Materiality
Key audit matters
Groupscoping
• We have applied an overall group materiality of EUR 52 million.
• We performed audit procedures at 27 reporting components in 11 countries that are considered significant based on our overall risk assessment and materiality.
• Valuation of biological assets• Provisions and contingent liabilities
As part of designing our audit, we determined materiality and assessed the risks of material misstatement in the financial statements. In particular, we considered where management made subjective judgements; for example, in respect of significant accounting estimates that involved making assumptions and considering future events that are inherently uncertain.
MaterialityThe scope of our audit was influenced by our application of materiality. An audit is designed to obtain reasonable assurance whether the financial statements are free from material misstatement. Misstatements may arise due to fraud or error. They are considered material if individually or in aggregate, they could reasonably be expected to influence the economic decisions of users taken on the basis of the financial statements.
Based on our professional judgement, we determined certain quantitative thresholds for materiality, including the overall group materiality for the consolidated financial statements as set out in the table below. These, together with qualitative considerations, helped us to determine the scope of our audit and the nature, timing and extent of our audit procedures and to evaluate the effect of misstatements on the financial statements as a whole.
Overall group materiality EUR 52 million
How we determined it Based on profit before tax
Rationale for the materiality benchmark applied
We chose profit before tax as the benchmark because, in our view, it is the benchmark against which the performance of the group is commonly measured by users, and is a generally accepted benchmark.
Auditor’s report (Translation of the Finnish Original)
77
Sto
ra En
so 2
018: Fin
an
cia
ls – Aud
itor’s rep
ort
Strateg
yS
ustainability
FinancialsG
overnance
Annual Report 2018
Financials
Stora Enso in 2018
Report of the Board of Directors
Consolidated financial statements
Notes to the Consolidated financial statements
Extract from the parent company Stora Enso Oyj financial statements
The Board of Directors’ Proposal for the distribution of dividend
Auditor’s report
Stora Enso in capital markets
Stora Enso as a taxpayer
Capacities by mill in 2019
Information for shareholders
How we tailored our group audit scopeWe tailored the scope of our audit, taking into account the structure of the group, the accounting processes and controls, and the industry in which the group operates.
The Group operates in a significant number of legal entities or “reporting components” globally. We determined the nature, timing and extent of audit work that needed to be performed at reporting components by us, as the group engagement team, or component auditors operating under our instruction. Where the work was performed by component auditors, we issued specific instructions to those auditors which included our risk analysis, materiality and global audit approach. We performed audit procedures at 27 reporting components in 11 countries that are considered significant based on our overall risk assessment and materiality. We have considered that the remaining reporting components do not present a reasonable risk of material misstatement for consolidated financial statements and thus our procedures related to these reporting components have been limited to targeted audit procedures over significant balances and to analytical procedures performed at group level.
By performing the procedures above at reporting components, combined with additional procedures at the group level, we have obtained sufficient and appropriate evidence regarding the financial information of the group as a whole to provide a basis for our opinion on the consolidated financial statements.
Key Audit Matters Key audit matters are those matters that, in our professional judgment, were of most significance in our audit of the financial statements of the current period. These matters were addressed in the context of our audit of the financial statements as a whole, and in forming our opinion thereon, and we do not provide a separate opinion on these matters.
As in all of our audits, we also addressed the risk of management override of internal controls, including among other matters consideration of whether there was evidence of bias that represented a risk of material misstatement due to fraud.
Key audit matter in the audit of the group How our audit addressed the key audit matter
Valuation of Biological AssetsRefer to Note 1, Note 2 and Note 12 in the consolidated financial statements for the related disclosures
The fair value of group’s biological assets owned through subsidiaries, joint operations and associated companies amounts to EUR 3 327 million as of December 31, 2018.
The value of biological assets is measured at fair value less costs to sell. The fair value is determined using discounted cash flows based on sustainable forest management plans taking into account the growth potential of one cycle. The one cycle varies depending on the geographic location and species. Determining the discounted cash flows requires estimates of growth, harvest, sales price and costs.
Due to the level of judgment involved in the valuation of biological assets, complexity of the governance structure as well as the significance of biological assets to the Group’s financial position, this is considered to be a key audit matter.
We obtained an understanding of management’s biological asset valuation process, evaluated the design and tested the operating effectiveness of internal controls related to directly and indirectly owned biological assets.
Our audit procedures over valuation of directly owned biological asset included:• Evaluation of the methodology adopted by
management for the valuation;• Testing the mathematical accuracy of the model used
for valuation;• Assessment of the discount rates applied in the
valuation;• Assessment of the other key valuation assumptions;
and• Validation of key inputs and data used in the valuation
model including sales price assumptions, growth assumptions and cost assumptions.
We involved valuation specialists in the audit work over valuation of directly owned biological assets.
Related to indirectly owned biological assets we have communicated with the auditors of the four largest associated companies and joint operations. As part of the communication, among other things, we have evaluated the key audit procedures and audit conclusions performed related to valuation of biological assets.
Key audit matter in the audit of the group How our audit addressed the key audit matter
Provisions and contingent liabilitiesRefer to Note 2, Note 22 and Note 29 in the consolidated financial statements for the related disclosures
As of 31 December 2018 the Group had environmental, restructuring and other provisions totaling EUR 117 million.
In addition, the Group has disclosed significant open legal cases and other contingent liabilities in Note 29.
The assessment of the existence of the present legal or constructive obligation, the analysis of the probability of the outflow of future economic benefits, and the analysis of a reliable estimate, require management’s judgement to ensure appropriate accounting or disclosures.
Due to the level of judgement relating to recognition, valuation and presentation of provisions and contingent liabilities, this is considered to be a key audit matter.
We obtained an understanding of management’s process to identify new obligations and changes in existing obligations for compliance with group policy and IAS 37 Provisions, Contingent Liabilities and Contingent Assets requirements.
We analysed significant changes in material provisions from prior periods and obtained a detailed understanding of these changes and assumptions applied.
Our audit procedures related to material provisions recognized included:• Assessment of the recognition criteria for the liability;• Evaluation of the methodology adopted by
management for the measurement of the liability;• Testing of the mathematical accuracy of the
measurement calculation;• Assessment of the discount rates applied in the
measurement; and• Assessment of the other key measurement
assumptions and inputs.
We obtained legal letters on the main outstanding legal cases.
We reviewed minutes of the board meetings including sub committees.
We assessed the appropriateness of the presentation of the most significant contingent liabilities in the consolidated financial statements.
We have no key audit matters to report with respect to our audit of the parent company financial statements.
There are no significant risks of material misstatement referred to in Article 10(2c) of Regulation (EU) No 537/2014 with respect to the consolidated financial statements or the parent company financial statements.
Responsibilities of the Board of Directors and the Managing Director for the Financial StatementsThe Board of Directors and the Managing Director are responsible for the preparation of consolidated financial statements that give a true and fair view in accordance with International Financial Reporting Standards (IFRS) as adopted by the EU, and of financial statements that give a true and fair view in accordance with the laws and regulations governing the preparation of financial statements in Finland and comply with statutory requirements. The Board of Directors and the Managing Director are also responsible for such internal control as they determine is necessary to enable the preparation of financial statements that are free from material misstatement, whether due to fraud or error.
In preparing the financial statements, the Board of Directors and the Managing Director are responsible for assessing the parent company’s and the group’s ability to continue as a going concern, disclosing, as applicable, matters relating to going concern and using the going concern basis of accounting. The financial statements are prepared using the going concern basis of accounting unless there is an intention to liquidate the parent company or the group or to cease operations, or there is no realistic alternative but to do so.
Auditor’s Responsibilities for the Audit of the Financial StatementsOur objectives are to obtain reasonable assurance about whether the financial statements as a whole are free from material misstatement, whether due to fraud or error, and to issue an auditor’s report that includes our opinion. Reasonable assurance is a high level of assurance, but is not a guarantee that an audit
78
Sto
ra En
so 2
018: Fin
an
cia
ls – Aud
itor’s rep
ort
Strateg
yS
ustainability
FinancialsG
overnance
Annual Report 2018
Financials
Stora Enso in 2018
Report of the Board of Directors
Consolidated financial statements
Notes to the Consolidated financial statements
Extract from the parent company Stora Enso Oyj financial statements
The Board of Directors’ Proposal for the distribution of dividend
Auditor’s report
Stora Enso in capital markets
Stora Enso as a taxpayer
Capacities by mill in 2019
Information for shareholders

conducted in accordance with good auditing practice will always detect a material misstatement when it exists. Misstatements can arise from fraud or error and are considered material if, individually or in the aggregate, they could reasonably be expected to influence the economic decisions of users taken on the basis of these financial statements.
As part of an audit in accordance with good auditing practice, we exercise professional judgment and maintain professional skepticism throughout the audit. We also:• Identify and assess the risks of material misstatement of the financial statements, whether due to fraud
or error, design and perform audit procedures responsive to those risks, and obtain audit evidence that is sufficient and appropriate to provide a basis for our opinion. The risk of not detecting a material misstatement resulting from fraud is higher than for one resulting from error, as fraud may involve collusion, forgery, intentional omissions, misrepresentations, or the override of internal control.
• Obtain an understanding of internal control relevant to the audit in order to design audit procedures that are appropriate in the circumstances, but not for the purpose of expressing an opinion on the effectiveness of the parent company’s or the group’s internal control.
• Evaluate the appropriateness of accounting policies used and the reasonableness of accounting estimates and related disclosures made by management.
• Conclude on the appropriateness of the Board of Directors’ and the Managing Director’s use of the going concern basis of accounting and based on the audit evidence obtained, whether a material uncertainty exists related to events or conditions that may cast significant doubt on the parent company’s or the group’s ability to continue as a going concern. If we conclude that a material uncertainty exists, we are required to draw attention in our auditor’s report to the related disclosures in the financial statements or, if such disclosures are inadequate, to modify our opinion. Our conclusions are based on the audit evidence obtained up to the date of our auditor’s report. However, future events or conditions may cause the parent company or the group to cease to continue as a going concern.
• Evaluate the overall presentation, structure and content of the financial statements, including the disclosures, and whether the financial statements represent the underlying transactions and events so that the financial statements give a true and fair view.
• Obtain sufficient appropriate audit evidence regarding the financial information of the entities or business activities within the group to express an opinion on the consolidated financial statements. We are responsible for the direction, supervision and performance of the group audit. We remain solely responsible for our audit opinion.
We communicate with those charged with governance regarding, among other matters, the planned scope and timing of the audit and significant audit findings, including any significant deficiencies in internal control that we identify during our audit.
We also provide those charged with governance with a statement that we have complied with relevant ethical requirements regarding independence, and to communicate with them all relationships and other matters that may reasonably be thought to bear on our independence, and where applicable, related safeguards.
From the matters communicated with those charged with governance, we determine those matters that were of most significance in the audit of the financial statements of the current period and are therefore the key audit matters. We describe these matters in our auditor’s report unless law or regulation precludes public disclosure about the matter or when, in extremely rare circumstances, we determine that a matter should not be communicated in our report because the adverse consequences of doing so would reasonably be expected to outweigh the public interest benefits of such communication.
Other Reporting Requirements
AppointmentWe were first appointed as auditors by the annual general meeting on 28 March 2018.
Other Information The Board of Directors and the Managing Director are responsible for the other information. The other information comprises the report of the Board of Directors.
Our opinion on the financial statements does not cover the other information.In connection with our audit of the financial statements, our responsibility is to read the other
information and, in doing so, consider whether the other information is materially inconsistent with the financial statements or our knowledge obtained in the audit, or otherwise appears to be materially misstated. Our responsibility also includes considering whether the report of the Board of Directors has been prepared in accordance with the applicable laws and regulations.
In our opinion• the information in the report of the Board of Directors is consistent with the information in the financial
statements• the report of the Board of Directors has been prepared in accordance with the applicable laws and
regulations.
If, based on the work we have performed, we conclude that there is a material misstatement of the report of the Board of Directors, we are required to report that fact. We have nothing to report in this regard.
Other StatementsWe support the proposal that the financial statements are adopted. The proposal by the Board of Directors regarding the distribution of profits is in compliance with the Limited Liability Companies Act. We support that the Board of Directors and the Managing Director of the parent company should be discharged from liability for the financial period audited by us.
Helsinki, 13 February 2019
PricewaterhouseCoopers OyAuthorised Public Accountants
Samuli PeräläAuthorised Public Accountant (KHT)
79
Sto
ra En
so 2
018: Fin
an
cia
ls – Aud
itor’s rep
ort
Strateg
yS
ustainability
FinancialsG
overnance
Annual Report 2018
Financials
Stora Enso in 2018
Report of the Board of Directors
Consolidated financial statements
Notes to the Consolidated financial statements
Extract from the parent company Stora Enso Oyj financial statements
The Board of Directors’ Proposal for the distribution of dividend
Auditor’s report
Stora Enso in capital markets
Stora Enso as a taxpayer
Capacities by mill in 2019
Information for shareholders
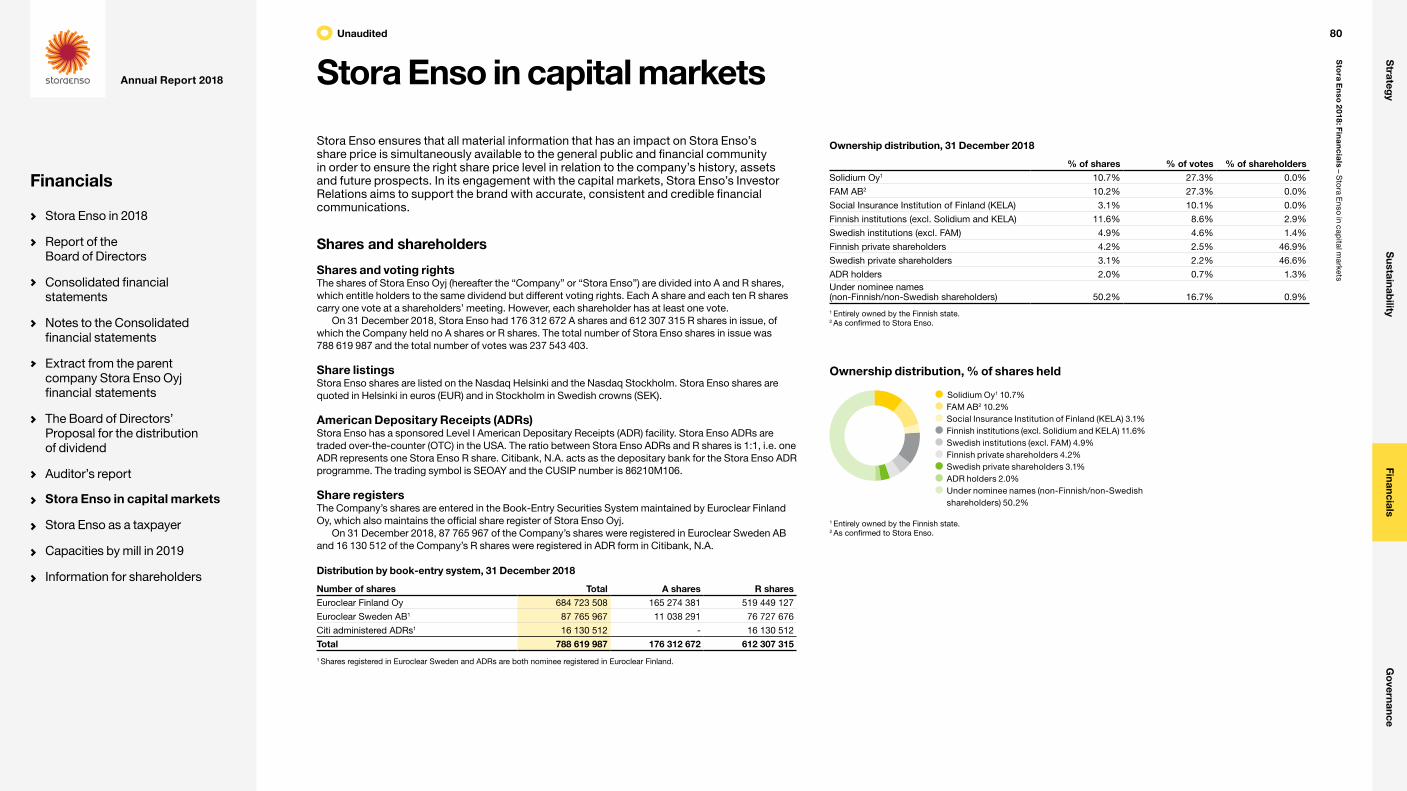
Stora Enso in capital markets
Stora Enso ensures that all material information that has an impact on Stora Enso’s share price is simultaneously available to the general public and financial community in order to ensure the right share price level in relation to the company’s history, assets and future prospects. In its engagement with the capital markets, Stora Enso’s Investor Relations aims to support the brand with accurate, consistent and credible financial communications.
Shares and shareholders
Shares and voting rightsThe shares of Stora Enso Oyj (hereafter the “Company” or “Stora Enso”) are divided into A and R shares, which entitle holders to the same dividend but different voting rights. Each A share and each ten R shares carry one vote at a shareholders’ meeting. However, each shareholder has at least one vote.
On 31 December 2018, Stora Enso had 176 312 672 A shares and 612 307 315 R shares in issue, of which the Company held no A shares or R shares. The total number of Stora Enso shares in issue was 788 619 987 and the total number of votes was 237 543 403.
Share listingsStora Enso shares are listed on the Nasdaq Helsinki and the Nasdaq Stockholm. Stora Enso shares are quoted in Helsinki in euros (EUR) and in Stockholm in Swedish crowns (SEK).
American Depositary Receipts (ADRs)Stora Enso has a sponsored Level I American Depositary Receipts (ADR) facility. Stora Enso ADRs are traded over-the-counter (OTC) in the USA. The ratio between Stora Enso ADRs and R shares is 1:1, i.e. one ADR represents one Stora Enso R share. Citibank, N.A. acts as the depositary bank for the Stora Enso ADR programme. The trading symbol is SEOAY and the CUSIP number is 86210M106.
Share registersThe Company’s shares are entered in the Book-Entry Securities System maintained by Euroclear Finland Oy, which also maintains the official share register of Stora Enso Oyj.
On 31 December 2018, 87 765 967 of the Company’s shares were registered in Euroclear Sweden AB and 16 130 512 of the Company’s R shares were registered in ADR form in Citibank, N.A.
Distribution by book-entry system, 31 December 2018
Number of shares Total A shares R sharesEuroclear Finland Oy 684 723 508 165 274 381 519 449 127
Euroclear Sweden AB1 87 765 967 11 038 291 76 727 676
Citi administered ADRs1 16 130 512 - 16 130 512
Total 788 619 987 176 312 672 612 307 315
1 Shares registered in Euroclear Sweden and ADRs are both nominee registered in Euroclear Finland.
Ownership distribution, 31 December 2018
% of shares % of votes % of shareholdersSolidium Oy1 10.7% 27.3% 0.0%
FAM AB2 10.2% 27.3% 0.0%
Social Insurance Institution of Finland (KELA) 3.1% 10.1% 0.0%
Finnish institutions (excl. Solidium and KELA) 11.6% 8.6% 2.9%
Swedish institutions (excl. FAM) 4.9% 4.6% 1.4%
Finnish private shareholders 4.2% 2.5% 46.9%
Swedish private shareholders 3.1% 2.2% 46.6%
ADR holders 2.0% 0.7% 1.3%Under nominee names (non-Finnish/non-Swedish shareholders) 50.2% 16.7% 0.9%
1 Entirely owned by the Finnish state.2 As confirmed to Stora Enso.
Ownership distribution, % of shares held
Solidium Oy1 10.7% FAM AB2 10.2% Social Insurance Institution of Finland (KELA) 3.1% Finnish institutions (excl. Solidium and KELA) 11.6% Swedish institutions (excl. FAM) 4.9% Finnish private shareholders 4.2% Swedish private shareholders 3.1% ADR holders 2.0% Under nominee names (non-Finnish/non-Swedish shareholders) 50.2%
1 Entirely owned by the Finnish state.2 As confirmed to Stora Enso.
Unaudited 80
Sto
ra En
so 2
018: Fin
an
cia
ls – Sto
ra Enso in cap
ital markets
Strateg
yS
ustainability
FinancialsG
overnance
Annual Report 2018
Financials
Stora Enso in 2018
Report of the Board of Directors
Consolidated financial statements
Notes to the Consolidated financial statements
Extract from the parent company Stora Enso Oyj financial statements
The Board of Directors’ Proposal for the distribution of dividend
Auditor’s report
Stora Enso in capital markets
Stora Enso as a taxpayer
Capacities by mill in 2019
Information for shareholders
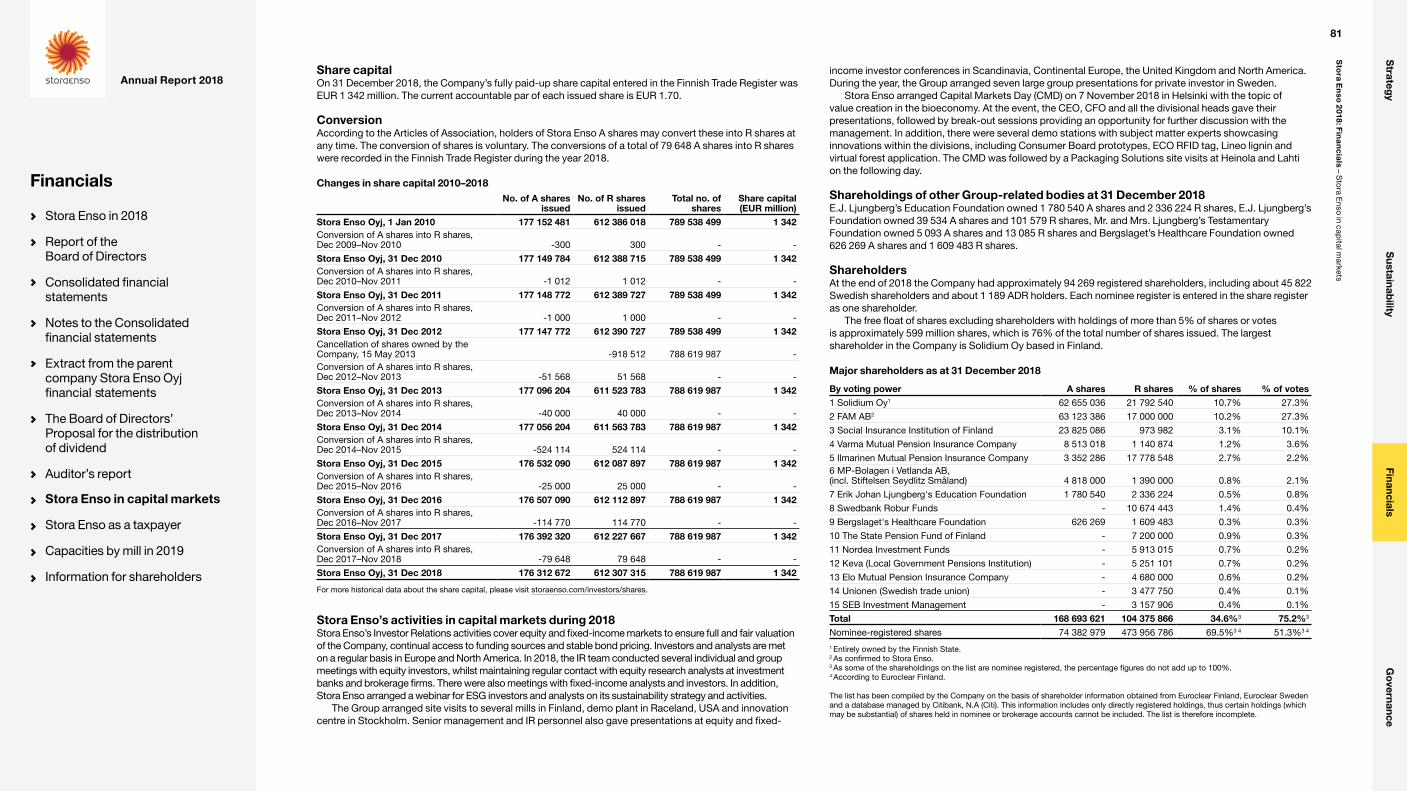
Share capitalOn 31 December 2018, the Company’s fully paid-up share capital entered in the Finnish Trade Register was EUR 1 342 million. The current accountable par of each issued share is EUR 1.70.
ConversionAccording to the Articles of Association, holders of Stora Enso A shares may convert these into R shares at any time. The conversion of shares is voluntary. The conversions of a total of 79 648 A shares into R shares were recorded in the Finnish Trade Register during the year 2018.
Changes in share capital 2010–2018No. of A shares
issuedNo. of R shares
issuedTotal no. of
sharesShare capital (EUR million)
Stora Enso Oyj, 1 Jan 2010 177 152 481 612 386 018 789 538 499 1 342Conversion of A shares into R shares, Dec 2009–Nov 2010 -300 300 - -
Stora Enso Oyj, 31 Dec 2010 177 149 784 612 388 715 789 538 499 1 342Conversion of A shares into R shares, Dec 2010–Nov 2011 -1 012 1 012 - -
Stora Enso Oyj, 31 Dec 2011 177 148 772 612 389 727 789 538 499 1 342Conversion of A shares into R shares, Dec 2011–Nov 2012 -1 000 1 000 - -
Stora Enso Oyj, 31 Dec 2012 177 147 772 612 390 727 789 538 499 1 342Cancellation of shares owned by the Company, 15 May 2013 -918 512 788 619 987 -Conversion of A shares into R shares, Dec 2012–Nov 2013 -51 568 51 568 - -
Stora Enso Oyj, 31 Dec 2013 177 096 204 611 523 783 788 619 987 1 342Conversion of A shares into R shares, Dec 2013–Nov 2014 -40 000 40 000 - -
Stora Enso Oyj, 31 Dec 2014 177 056 204 611 563 783 788 619 987 1 342Conversion of A shares into R shares, Dec 2014–Nov 2015 -524 114 524 114 - -
Stora Enso Oyj, 31 Dec 2015 176 532 090 612 087 897 788 619 987 1 342Conversion of A shares into R shares, Dec 2015–Nov 2016 -25 000 25 000 - -
Stora Enso Oyj, 31 Dec 2016 176 507 090 612 112 897 788 619 987 1 342Conversion of A shares into R shares, Dec 2016–Nov 2017 -114 770 114 770 - -
Stora Enso Oyj, 31 Dec 2017 176 392 320 612 227 667 788 619 987 1 342Conversion of A shares into R shares, Dec 2017–Nov 2018 -79 648 79 648 - -
Stora Enso Oyj, 31 Dec 2018 176 312 672 612 307 315 788 619 987 1 342
For more historical data about the share capital, please visit storaenso.com/investors/shares.
Stora Enso’s activities in capital markets during 2018Stora Enso’s Investor Relations activities cover equity and fixed-income markets to ensure full and fair valuation of the Company, continual access to funding sources and stable bond pricing. Investors and analysts are met on a regular basis in Europe and North America. In 2018, the IR team conducted several individual and group meetings with equity investors, whilst maintaining regular contact with equity research analysts at investment banks and brokerage firms. There were also meetings with fixed-income analysts and investors. In addition, Stora Enso arranged a webinar for ESG investors and analysts on its sustainability strategy and activities.
The Group arranged site visits to several mills in Finland, demo plant in Raceland, USA and innovation centre in Stockholm. Senior management and IR personnel also gave presentations at equity and fixed-
income investor conferences in Scandinavia, Continental Europe, the United Kingdom and North America. During the year, the Group arranged seven large group presentations for private investor in Sweden.
Stora Enso arranged Capital Markets Day (CMD) on 7 November 2018 in Helsinki with the topic of value creation in the bioeconomy. At the event, the CEO, CFO and all the divisional heads gave their presentations, followed by break-out sessions providing an opportunity for further discussion with the management. In addition, there were several demo stations with subject matter experts showcasing innovations within the divisions, including Consumer Board prototypes, ECO RFID tag, Lineo lignin and virtual forest application. The CMD was followed by a Packaging Solutions site visits at Heinola and Lahti on the following day.
Shareholdings of other Group-related bodies at 31 December 2018E.J. Ljungberg’s Education Foundation owned 1 780 540 A shares and 2 336 224 R shares, E.J. Ljungberg’s Foundation owned 39 534 A shares and 101 579 R shares, Mr. and Mrs. Ljungberg’s Testamentary Foundation owned 5 093 A shares and 13 085 R shares and Bergslaget’s Healthcare Foundation owned 626 269 A shares and 1 609 483 R shares.
ShareholdersAt the end of 2018 the Company had approximately 94 269 registered shareholders, including about 45 822 Swedish shareholders and about 1 189 ADR holders. Each nominee register is entered in the share register as one shareholder.
The free float of shares excluding shareholders with holdings of more than 5% of shares or votes is approximately 599 million shares, which is 76% of the total number of shares issued. The largest shareholder in the Company is Solidium Oy based in Finland.
Major shareholders as at 31 December 2018
By voting power A shares R shares % of shares % of votes1 Solidium Oy1 62 655 036 21 792 540 10.7% 27.3%
2 FAM AB2 63 123 386 17 000 000 10.2% 27.3%
3 Social Insurance Institution of Finland 23 825 086 973 982 3.1% 10.1%
4 Varma Mutual Pension Insurance Company 8 513 018 1 140 874 1.2% 3.6%
5 Ilmarinen Mutual Pension Insurance Company 3 352 286 17 778 548 2.7% 2.2%6 MP-Bolagen i Vetlanda AB, (incl. Stiftelsen Seydlitz Småland) 4 818 000 1 390 000 0.8% 2.1%
7 Erik Johan Ljungberg's Education Foundation 1 780 540 2 336 224 0.5% 0.8%
8 Swedbank Robur Funds - 10 674 443 1.4% 0.4%
9 Bergslaget's Healthcare Foundation 626 269 1 609 483 0.3% 0.3%
10 The State Pension Fund of Finland - 7 200 000 0.9% 0.3%
11 Nordea Investment Funds - 5 913 015 0.7% 0.2%
12 Keva (Local Government Pensions Institution) - 5 251 101 0.7% 0.2%
13 Elo Mutual Pension Insurance Company - 4 680 000 0.6% 0.2%
14 Unionen (Swedish trade union) - 3 477 750 0.4% 0.1%
15 SEB Investment Management - 3 157 906 0.4% 0.1%
Total 168 693 621 104 375 866 34.6%3 75.2%3
Nominee-registered shares 74 382 979 473 956 786 69.5%3 4 51.3%3 4
1 Entirely owned by the Finnish State.2 As confirmed to Stora Enso.3 As some of the shareholdings on the list are nominee registered, the percentage figures do not add up to 100%.4 According to Euroclear Finland.
The list has been compiled by the Company on the basis of shareholder information obtained from Euroclear Finland, Euroclear Sweden and a database managed by Citibank, N.A (Citi). This information includes only directly registered holdings, thus certain holdings (which may be substantial) of shares held in nominee or brokerage accounts cannot be included. The list is therefore incomplete.
81
Sto
ra En
so 2
018: Fin
an
cia
ls – Sto
ra Enso in cap
ital markets
Strateg
yS
ustainability
FinancialsG
overnance
Annual Report 2018
Financials
Stora Enso in 2018
Report of the Board of Directors
Consolidated financial statements
Notes to the Consolidated financial statements
Extract from the parent company Stora Enso Oyj financial statements
The Board of Directors’ Proposal for the distribution of dividend
Auditor’s report
Stora Enso in capital markets
Stora Enso as a taxpayer
Capacities by mill in 2019
Information for shareholders
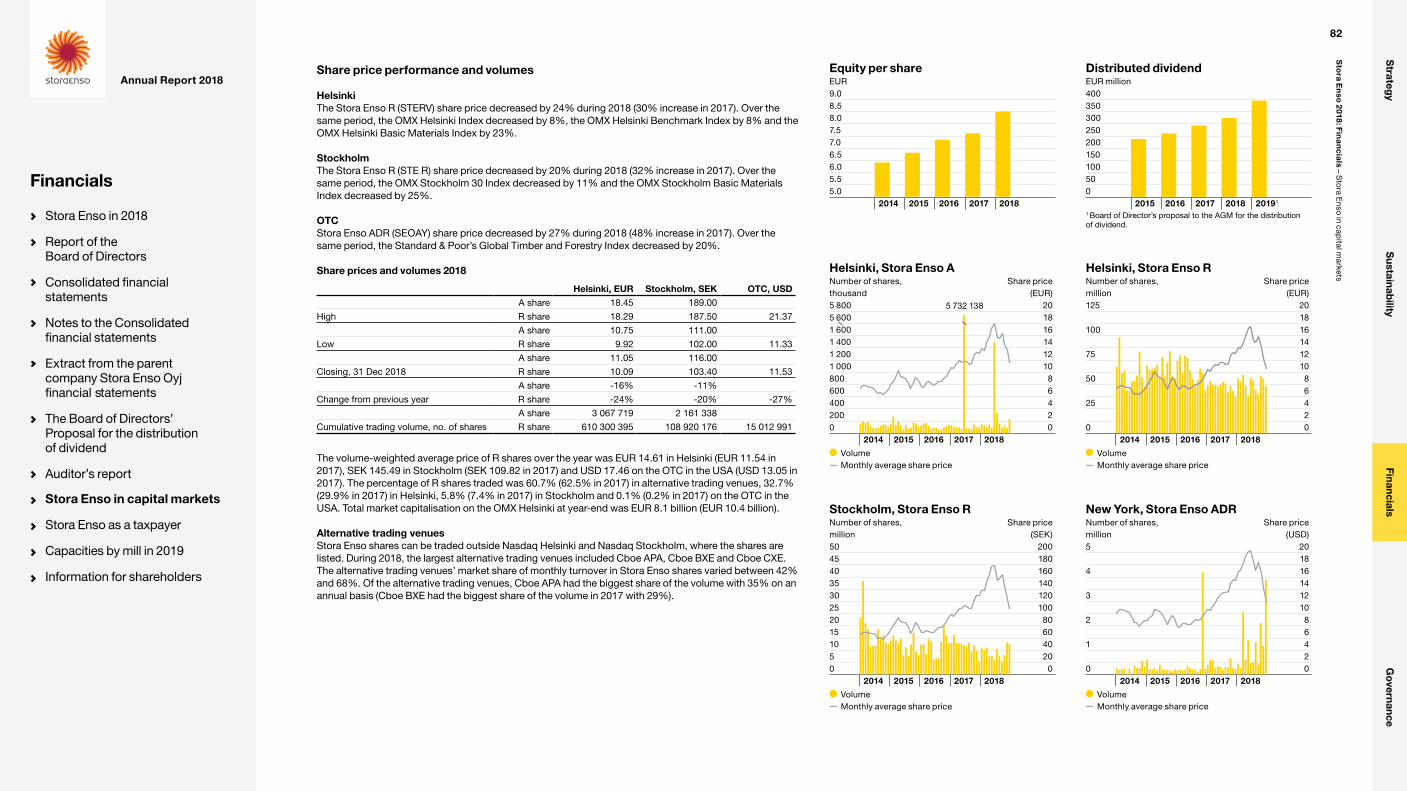
Share price performance and volumes
HelsinkiThe Stora Enso R (STERV) share price decreased by 24% during 2018 (30% increase in 2017). Over the same period, the OMX Helsinki Index decreased by 8%, the OMX Helsinki Benchmark Index by 8% and the OMX Helsinki Basic Materials Index by 23%.
StockholmThe Stora Enso R (STE R) share price decreased by 20% during 2018 (32% increase in 2017). Over the same period, the OMX Stockholm 30 Index decreased by 11% and the OMX Stockholm Basic Materials Index decreased by 25%.
OTCStora Enso ADR (SEOAY) share price decreased by 27% during 2018 (48% increase in 2017). Over the same period, the Standard & Poor’s Global Timber and Forestry Index decreased by 20%.
Share prices and volumes 2018
Helsinki, EUR Stockholm, SEK OTC, USDA share 18.45 189.00
High R share 18.29 187.50 21.37
A share 10.75 111.00
Low R share 9.92 102.00 11.33
A share 11.05 116.00
Closing, 31 Dec 2018 R share 10.09 103.40 11.53
A share -16% -11%
Change from previous year R share -24% -20% -27%
A share 3 067 719 2 161 338
Cumulative trading volume, no. of shares R share 610 300 395 108 920 176 15 012 991
The volume-weighted average price of R shares over the year was EUR 14.61 in Helsinki (EUR 11.54 in 2017), SEK 145.49 in Stockholm (SEK 109.82 in 2017) and USD 17.46 on the OTC in the USA (USD 13.05 in 2017). The percentage of R shares traded was 60.7% (62.5% in 2017) in alternative trading venues, 32.7% (29.9% in 2017) in Helsinki, 5.8% (7.4% in 2017) in Stockholm and 0.1% (0.2% in 2017) on the OTC in the USA. Total market capitalisation on the OMX Helsinki at year-end was EUR 8.1 billion (EUR 10.4 billion).
Alternative trading venuesStora Enso shares can be traded outside Nasdaq Helsinki and Nasdaq Stockholm, where the shares are listed. During 2018, the largest alternative trading venues included Cboe APA, Cboe BXE and Cboe CXE. The alternative trading venues’ market share of monthly turnover in Stora Enso shares varied between 42% and 68%. Of the alternative trading venues, Cboe APA had the biggest share of the volume with 35% on an annual basis (Cboe BXE had the biggest share of the volume in 2017 with 29%).
Equity per shareEUR9.08.58.07.57.06.56.05.55.0
2014 2015 2016 2017 2018
Helsinki, Stora Enso RNumber of shares, million
Share price (EUR)
125 2018
100 1614
75 1210
50 86
25 42
0 02014 2015 2016 2017 2018
Volume Monthly average share price
Distributed dividendEUR million400350300250200150100500
2015 2016 2017 2018 20191
1 Board of Director’s proposal to the AGM for the distribution of dividend.
Helsinki, Stora Enso ANumber of shares, thousand
Share price (EUR)
5 800 205 600 181 600 161 400 141 200 121 000 10800 8600 6400 4200 20 0
2014 2015 2016 2017 2018
Volume Monthly average share price
5 732 138
Stockholm, Stora Enso RNumber of shares, million
Share price (SEK)
50 20045 18040 16035 14030 12025 10020 8015 6010 405 200 0
2014 2015 2016 2017 2018
Volume Monthly average share price
New York, Stora Enso ADRNumber of shares, million
Share price (USD)
5 2018
4 1614
3 1210
2 86
1 42
0 02014 2015 2016 2017 2018
Volume Monthly average share price
82
Sto
ra En
so 2
018: Fin
an
cia
ls – Sto
ra Enso in cap
ital markets
Strateg
yS
ustainability
FinancialsG
overnance
Annual Report 2018
Financials
Stora Enso in 2018
Report of the Board of Directors
Consolidated financial statements
Notes to the Consolidated financial statements
Extract from the parent company Stora Enso Oyj financial statements
The Board of Directors’ Proposal for the distribution of dividend
Auditor’s report
Stora Enso in capital markets
Stora Enso as a taxpayer
Capacities by mill in 2019
Information for shareholders
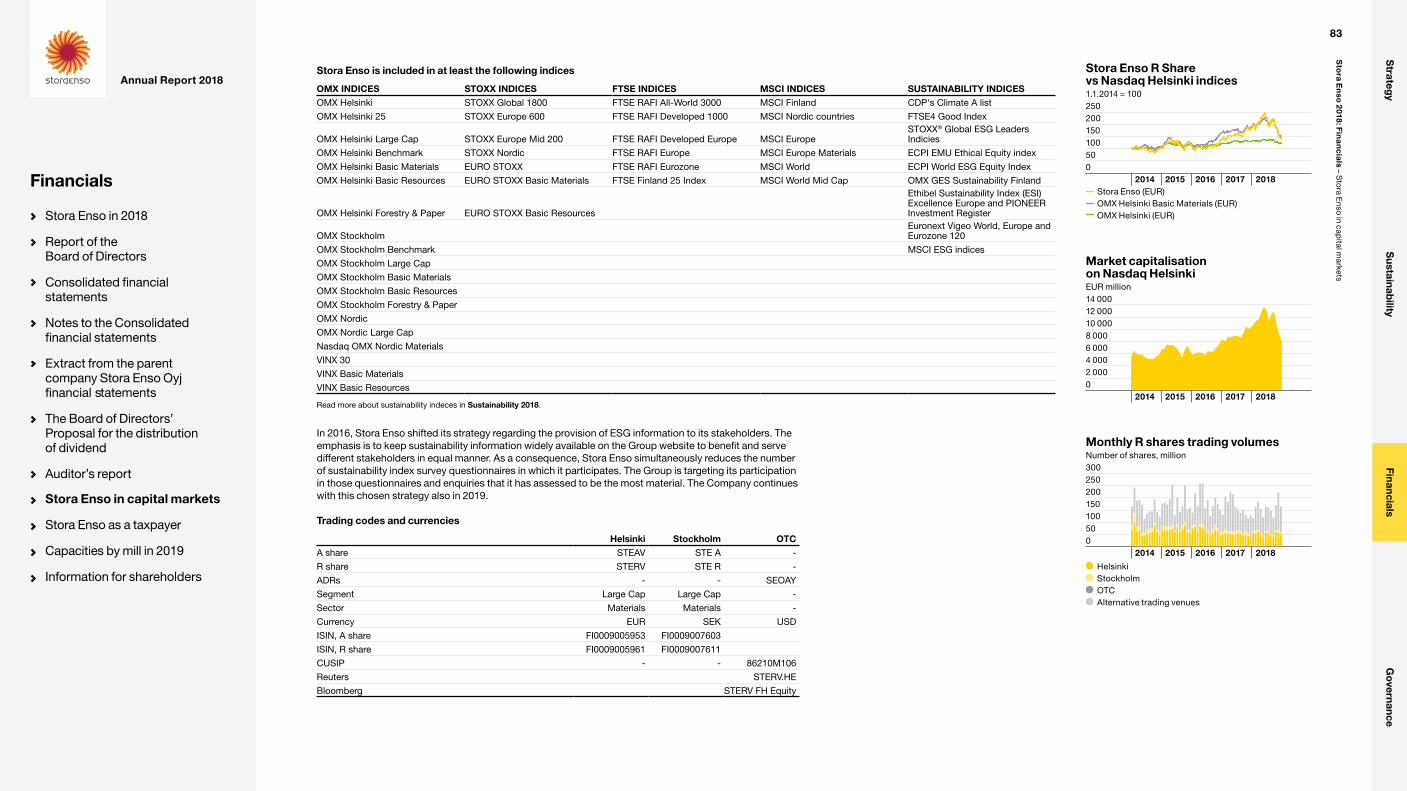
Stora Enso is included in at least the following indices
OMX INDICES STOXX INDICES FTSE INDICES MSCI INDICES SUSTAINABILITY INDICESOMX Helsinki STOXX Global 1800 FTSE RAFI All-World 3000 MSCI Finland CDP's Climate A list
OMX Helsinki 25 STOXX Europe 600 FTSE RAFI Developed 1000 MSCI Nordic countries FTSE4 Good Index
OMX Helsinki Large Cap STOXX Europe Mid 200 FTSE RAFI Developed Europe MSCI EuropeSTOXX® Global ESG Leaders Indicies
OMX Helsinki Benchmark STOXX Nordic FTSE RAFI Europe MSCI Europe Materials ECPI EMU Ethical Equity index
OMX Helsinki Basic Materials EURO STOXX FTSE RAFI Eurozone MSCI World ECPI World ESG Equity Index
OMX Helsinki Basic Resources EURO STOXX Basic Materials FTSE Finland 25 Index MSCI World Mid Cap OMX GES Sustainability Finland
OMX Helsinki Forestry & Paper EURO STOXX Basic Resources
Ethibel Sustainability Index (ESI) Excellence Europe and PIONEER Investment Register
OMX StockholmEuronext Vigeo World, Europe and Eurozone 120
OMX Stockholm Benchmark MSCI ESG indices
OMX Stockholm Large Cap
OMX Stockholm Basic Materials
OMX Stockholm Basic Resources
OMX Stockholm Forestry & Paper
OMX Nordic
OMX Nordic Large Cap
Nasdaq OMX Nordic Materials
VINX 30
VINX Basic Materials
VINX Basic Resources
Read more about sustainability indeces in Sustainability 2018.
In 2016, Stora Enso shifted its strategy regarding the provision of ESG information to its stakeholders. The emphasis is to keep sustainability information widely available on the Group website to benefit and serve different stakeholders in equal manner. As a consequence, Stora Enso simultaneously reduces the number of sustainability index survey questionnaires in which it participates. The Group is targeting its participation in those questionnaires and enquiries that it has assessed to be the most material. The Company continues with this chosen strategy also in 2019.
Trading codes and currencies
Helsinki Stockholm OTCA share STEAV STE A -
R share STERV STE R -
ADRs - - SEOAY
Segment Large Cap Large Cap -
Sector Materials Materials -
Currency EUR SEK USD
ISIN, A share FI0009005953 FI0009007603
ISIN, R share FI0009005961 FI0009007611
CUSIP - - 86210M106
Reuters STERV.HE
Bloomberg STERV FH Equity
Monthly R shares trading volumesNumber of shares, million300250200150100500
2014 2015 2016 2017 2018
Helsinki Stockholm OTC Alternative trading venues
Stora Enso R Share vs Nasdaq Helsinki indices1.1.2014 = 100250200150100500
2014 2015 2016 2017 2018Stora Enso (EUR)OMX Helsinki Basic Materials (EUR)OMX Helsinki (EUR)
Market capitalisation on Nasdaq HelsinkiEUR million14 00012 00010 0008 0006 0004 0002 0000
2014 2015 2016 2017 2018
83
Sto
ra En
so 2
018: Fin
an
cia
ls – Sto
ra Enso in cap
ital markets
Strateg
yS
ustainability
FinancialsG
overnance
Annual Report 2018
Financials
Stora Enso in 2018
Report of the Board of Directors
Consolidated financial statements
Notes to the Consolidated financial statements
Extract from the parent company Stora Enso Oyj financial statements
The Board of Directors’ Proposal for the distribution of dividend
Auditor’s report
Stora Enso in capital markets
Stora Enso as a taxpayer
Capacities by mill in 2019
Information for shareholders

Key share data 2009–2018, total operations (for calculations see Calculation of Key figures)
According to Nasdaq Helsinki 2018 2017 2016 2015 2014 2013 2012 2011 2010 2009Earnings per share, EUR 1.28 0.79 0.59 1.02 0.13 -0.07 0.61 0.43 0.97 -1.12
– diluted, EUR 1.28 0.79 0.59 1.02 0.13 -0.07 0.61 0.43 0.97 -1.12
– excl. IAC, EUR 1.29 0.89 0.65 1.24 0.40 0.40 0.33 0.63 0.79 0.19
Equity/share, EUR 8.51 7.62 7.36 6.83 6.43 6.61 7.32 7.45 7.87 6.50
Dividend and distribution/share, EUR 0.50 0.41 0.37 0.33 0.30 0.30 0.30 0.30 0.25 0.20
Payout ratio, % 39 52 63 32 231 -429 49 70 26 -18
Dividend and distribution yield, %
A share 4.5 3.1 3.56 3.9 4.0 4.1 5.3 5.9 3.2 3.4
R share 5.0 3.1 3.62 3.9 4.0 4.1 5.7 6.5 3.3 4.1
Price/earnings ratio (P/E), excl. IAC
A share 8.6 14.8 16.00 6.8 18.7 18.3 17.3 8.0 10.0 30.8
R share 7.82 14.85 15.71 6.8 18.6 18.3 15.9 7.3 9.7 25.7
Share prices for the period, EUR
A share
– closing price 11.05 13.20 10.40 8.40 7.48 7.31 5.70 5.03 7.90 5.85
– average price 16.36 11.93 8.50 8.87 7.29 6.82 6.15 7.73 6.47 5.03
– high 18.45 13.79 10.45 11.01 8.35 7.49 7.15 9.80 7.94 7.55
– low 10.75 10.26 6.56 6.70 5.73 5.42 5.10 4.70 5.30 2.82
R share
– closing price 10.09 13.22 10.21 8.39 7.44 7.30 5.25 4.63 7.69 4.88
– average price 14.61 11.54 7.88 8.70 7.16 5.79 5.08 6.28 6.03 4.27
– high 18.29 13.75 10.28 10.95 8.38 7.54 5.95 8.99 7.79 6.16
– low 9.92 9.70 6.50 6.58 5.71 4.76 4.14 3.73 4.15 2.65
Market capitalisation at year-end, EUR million
A share 1 948 2 328 1 836 1 483 1 324 1 295 1 010 891 1 400 1 036
R share 6 175 8 094 6 250 5 135 4 547 4 464 3 212 2 835 4 709 2 989
Total 8 123 10 422 8 085 6 618 5 871 5 756 4 222 3 726 6 109 4 025
Number of shares at the end of period, (thousands)
A share 176 313 176 392 176 507 176 532 177 056 177 096 177 148 177 149 177 150 177 150
R share 612 307 612 228 612 113 612 088 611 564 611 524 612 391 612 389 612 389 612 388
Total 788 620 788 620 788 620 788 620 788 620 788 620 789 538 789 538 789 538 789 538
Trading volume, (thousands)
A share 3 068 6 768 1 254 1 641 1 553 1 656 831 1 402 1 887 2 536
% of total number of A shares 1.7 3.8 0.7 0.9 0.9 0.9 0.5 0.8 1.1 1.4
R share 610 300 571 717 765 122 798 507 731 067 828 401 977 746 1 237 898 1 194 245 1 297 668
% of total number of R shares 99.7 93.4 125 130.5 119.5 135.5 159.7 202.1 195.0 211.9
Average number of shares (thousands)
basic 788 620 788 620 788 620 788 620 788 620 788 620 788 620 788 620 788 619 788 620
diluted 789 883 790 024 789 888 789 809 789 210 788 620 788 620 788 620 788 619 788 620
1 Board of Directors' proposal to the AGM for distribution of dividend.IAC = Items affecting comparability
Read more about incentive programmes in Note 21 and management interests in Note 7.
84
Sto
ra En
so 2
018: Fin
an
cia
ls – Sto
ra Enso in cap
ital markets
Strateg
yS
ustainability
FinancialsG
overnance
Annual Report 2018
Financials
Stora Enso in 2018
Report of the Board of Directors
Consolidated financial statements
Notes to the Consolidated financial statements
Extract from the parent company Stora Enso Oyj financial statements
The Board of Directors’ Proposal for the distribution of dividend
Auditor’s report
Stora Enso in capital markets
Stora Enso as a taxpayer
Capacities by mill in 2019
Information for shareholders
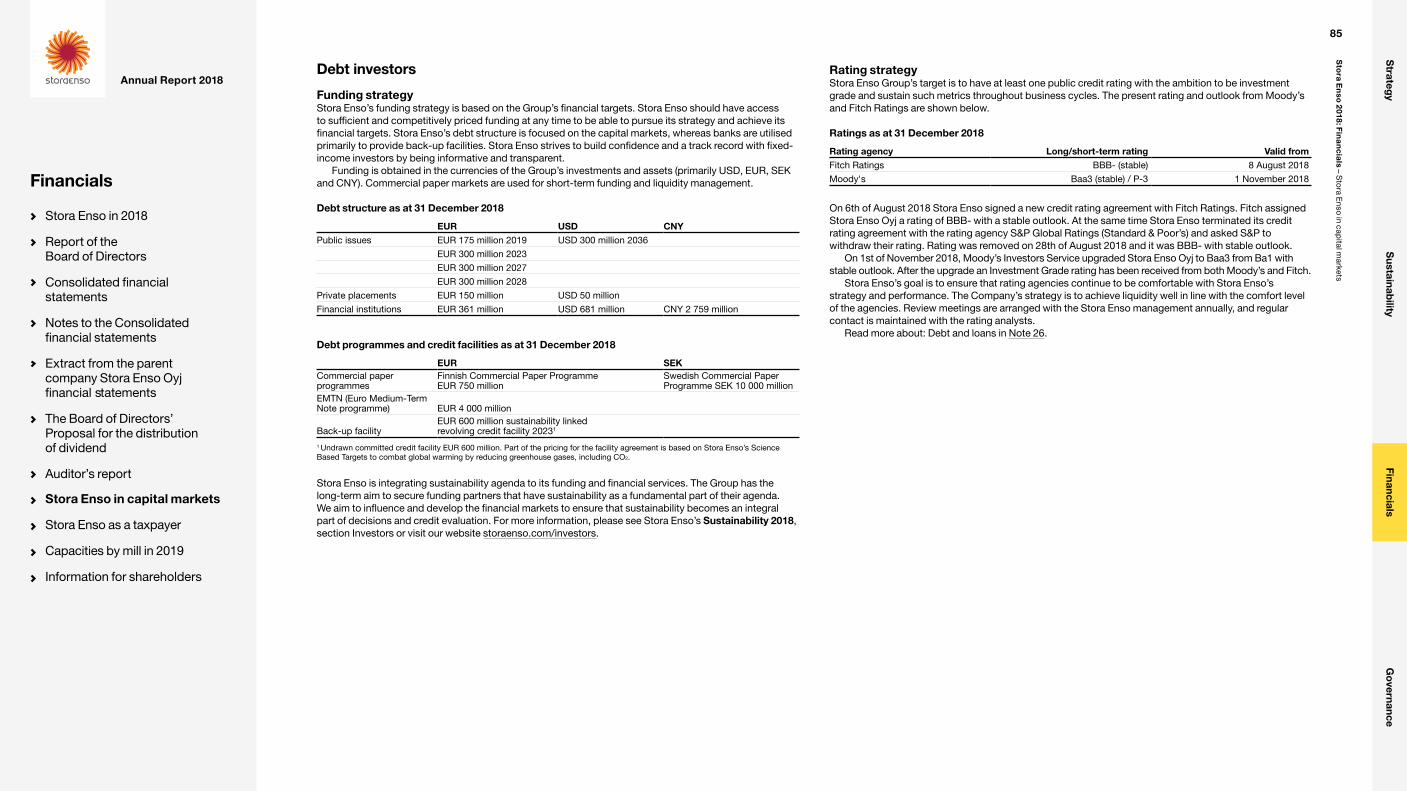
Debt investors
Funding strategyStora Enso’s funding strategy is based on the Group’s financial targets. Stora Enso should have access to sufficient and competitively priced funding at any time to be able to pursue its strategy and achieve its financial targets. Stora Enso’s debt structure is focused on the capital markets, whereas banks are utilised primarily to provide back-up facilities. Stora Enso strives to build confidence and a track record with fixed-income investors by being informative and transparent.
Funding is obtained in the currencies of the Group’s investments and assets (primarily USD, EUR, SEK and CNY). Commercial paper markets are used for short-term funding and liquidity management.
Debt structure as at 31 December 2018
EUR USD CNYPublic issues EUR 175 million 2019 USD 300 million 2036
EUR 300 million 2023
EUR 300 million 2027
EUR 300 million 2028
Private placements EUR 150 million USD 50 million
Financial institutions EUR 361 million USD 681 million CNY 2 759 million
Debt programmes and credit facilities as at 31 December 2018
EUR SEKCommercial paper programmes
Finnish Commercial Paper Programme EUR 750 million
Swedish Commercial Paper Programme SEK 10 000 million
EMTN (Euro Medium-Term Note programme) EUR 4 000 million
Back-up facilityEUR 600 million sustainability linked revolving credit facility 20231
1 Undrawn committed credit facility EUR 600 million. Part of the pricing for the facility agreement is based on Stora Enso’s Science Based Targets to combat global warming by reducing greenhouse gases, including CO2.
Stora Enso is integrating sustainability agenda to its funding and financial services. The Group has the long-term aim to secure funding partners that have sustainability as a fundamental part of their agenda. We aim to influence and develop the financial markets to ensure that sustainability becomes an integral part of decisions and credit evaluation. For more information, please see Stora Enso’s Sustainability 2018, section Investors or visit our website storaenso.com/investors.
Rating strategyStora Enso Group’s target is to have at least one public credit rating with the ambition to be investment grade and sustain such metrics throughout business cycles. The present rating and outlook from Moody’s and Fitch Ratings are shown below.
Ratings as at 31 December 2018
Rating agency Long/short-term rating Valid fromFitch Ratings BBB- (stable) 8 August 2018
Moody's Baa3 (stable) / P-3 1 November 2018
On 6th of August 2018 Stora Enso signed a new credit rating agreement with Fitch Ratings. Fitch assigned Stora Enso Oyj a rating of BBB- with a stable outlook. At the same time Stora Enso terminated its credit rating agreement with the rating agency S&P Global Ratings (Standard & Poor’s) and asked S&P to withdraw their rating. Rating was removed on 28th of August 2018 and it was BBB- with stable outlook.
On 1st of November 2018, Moody’s Investors Service upgraded Stora Enso Oyj to Baa3 from Ba1 with stable outlook. After the upgrade an Investment Grade rating has been received from both Moody’s and Fitch.
Stora Enso’s goal is to ensure that rating agencies continue to be comfortable with Stora Enso’s strategy and performance. The Company’s strategy is to achieve liquidity well in line with the comfort level of the agencies. Review meetings are arranged with the Stora Enso management annually, and regular contact is maintained with the rating analysts.
Read more about: Debt and loans in Note 26.
85
Sto
ra En
so 2
018: Fin
an
cia
ls – Sto
ra Enso in cap
ital markets
Strateg
yS
ustainability
FinancialsG
overnance
Annual Report 2018
Financials
Stora Enso in 2018
Report of the Board of Directors
Consolidated financial statements
Notes to the Consolidated financial statements
Extract from the parent company Stora Enso Oyj financial statements
The Board of Directors’ Proposal for the distribution of dividend
Auditor’s report
Stora Enso in capital markets
Stora Enso as a taxpayer
Capacities by mill in 2019
Information for shareholders
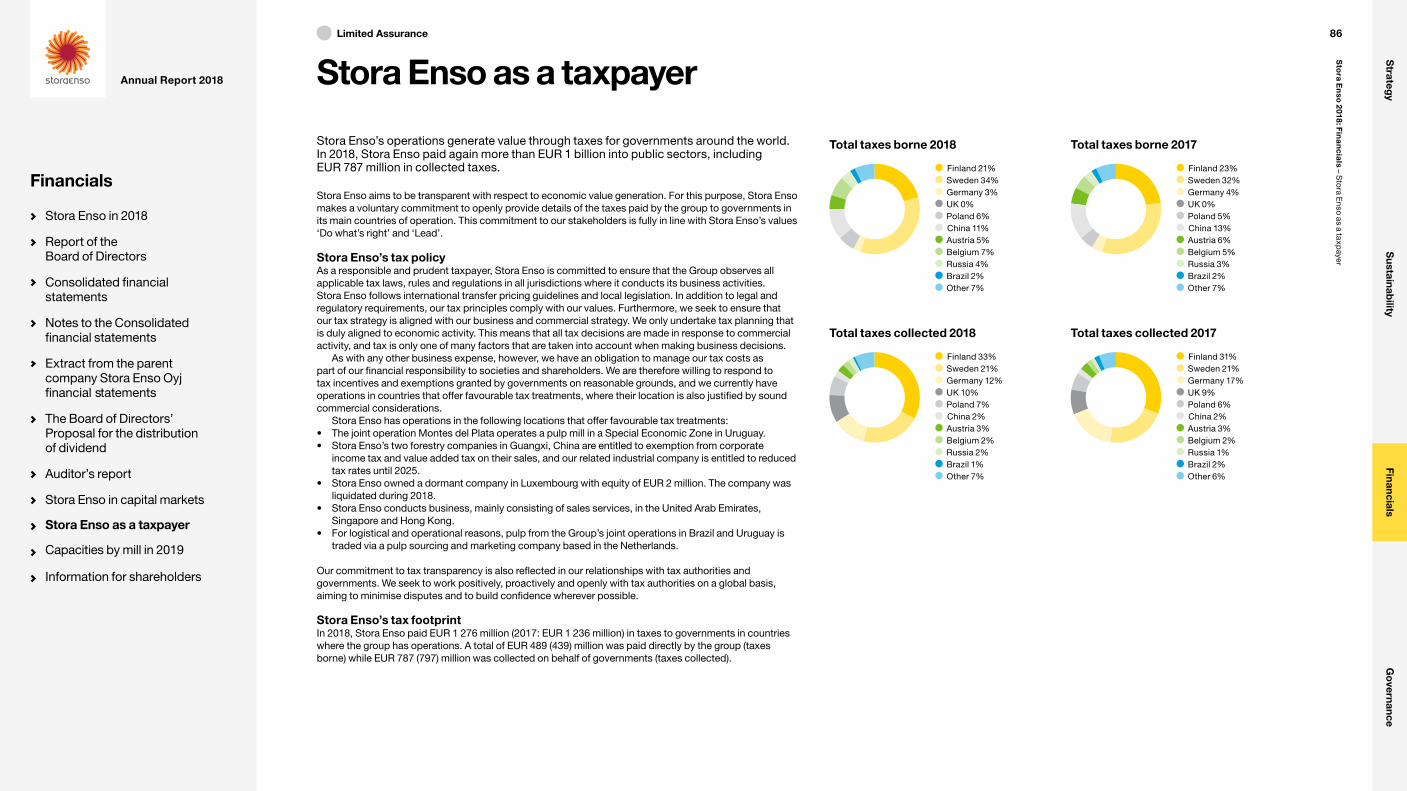
Stora Enso’s operations generate value through taxes for governments around the world. In 2018, Stora Enso paid again more than EUR 1 billion into public sectors, including EUR 787 million in collected taxes.
Stora Enso aims to be transparent with respect to economic value generation. For this purpose, Stora Enso makes a voluntary commitment to openly provide details of the taxes paid by the group to governments in its main countries of operation. This commitment to our stakeholders is fully in line with Stora Enso’s values ‘Do what’s right’ and ‘Lead’.
Stora Enso’s tax policyAs a responsible and prudent taxpayer, Stora Enso is committed to ensure that the Group observes all applicable tax laws, rules and regulations in all jurisdictions where it conducts its business activities. Stora Enso follows international transfer pricing guidelines and local legislation. In addition to legal and regulatory requirements, our tax principles comply with our values. Furthermore, we seek to ensure that our tax strategy is aligned with our business and commercial strategy. We only undertake tax planning that is duly aligned to economic activity. This means that all tax decisions are made in response to commercial activity, and tax is only one of many factors that are taken into account when making business decisions.
As with any other business expense, however, we have an obligation to manage our tax costs as part of our financial responsibility to societies and shareholders. We are therefore willing to respond to tax incentives and exemptions granted by governments on reasonable grounds, and we currently have operations in countries that offer favourable tax treatments, where their location is also justified by sound commercial considerations.
Stora Enso has operations in the following locations that offer favourable tax treatments:• The joint operation Montes del Plata operates a pulp mill in a Special Economic Zone in Uruguay.• Stora Enso’s two forestry companies in Guangxi, China are entitled to exemption from corporate
income tax and value added tax on their sales, and our related industrial company is entitled to reduced tax rates until 2025.
• Stora Enso owned a dormant company in Luxembourg with equity of EUR 2 million. The company was liquidated during 2018.
• Stora Enso conducts business, mainly consisting of sales services, in the United Arab Emirates, Singapore and Hong Kong.
• For logistical and operational reasons, pulp from the Group’s joint operations in Brazil and Uruguay is traded via a pulp sourcing and marketing company based in the Netherlands.
Our commitment to tax transparency is also reflected in our relationships with tax authorities and governments. We seek to work positively, proactively and openly with tax authorities on a global basis, aiming to minimise disputes and to build confidence wherever possible.
Stora Enso’s tax footprint In 2018, Stora Enso paid EUR 1 276 million (2017: EUR 1 236 million) in taxes to governments in countries where the group has operations. A total of EUR 489 (439) million was paid directly by the group (taxes borne) while EUR 787 (797) million was collected on behalf of governments (taxes collected).
Stora Enso as a taxpayer
Total taxes borne 2018
Finland 21% Sweden 34% Germany 3% UK 0% Poland 6% China 11% Austria 5% Belgium 7% Russia 4% Brazil 2% Other 7%
Total taxes collected 2018
Finland 33% Sweden 21% Germany 12% UK 10% Poland 7% China 2% Austria 3% Belgium 2% Russia 2% Brazil 1% Other 7%
Total taxes borne 2017
Finland 23% Sweden 32% Germany 4% UK 0% Poland 5% China 13% Austria 6% Belgium 5% Russia 3% Brazil 2% Other 7%
Total taxes collected 2017
Finland 31% Sweden 21% Germany 17% UK 9% Poland 6% China 2% Austria 3% Belgium 2% Russia 1% Brazil 2% Other 6%
Annual General Meeting 2019. We kindly ask you to familiarise yourself with
Limited Assurance 86
Sto
ra En
so 2
018: Fin
an
cia
ls – Sto
ra Enso as a ta
xpayer
Strateg
yS
ustainability
FinancialsG
overnance
Annual Report 2018
Financials
Stora Enso in 2018
Report of the Board of Directors
Consolidated financial statements
Notes to the Consolidated financial statements
Extract from the parent company Stora Enso Oyj financial statements
The Board of Directors’ Proposal for the distribution of dividend
Auditor’s report
Stora Enso in capital markets
Stora Enso as a taxpayer
Capacities by mill in 2019
Information for shareholders
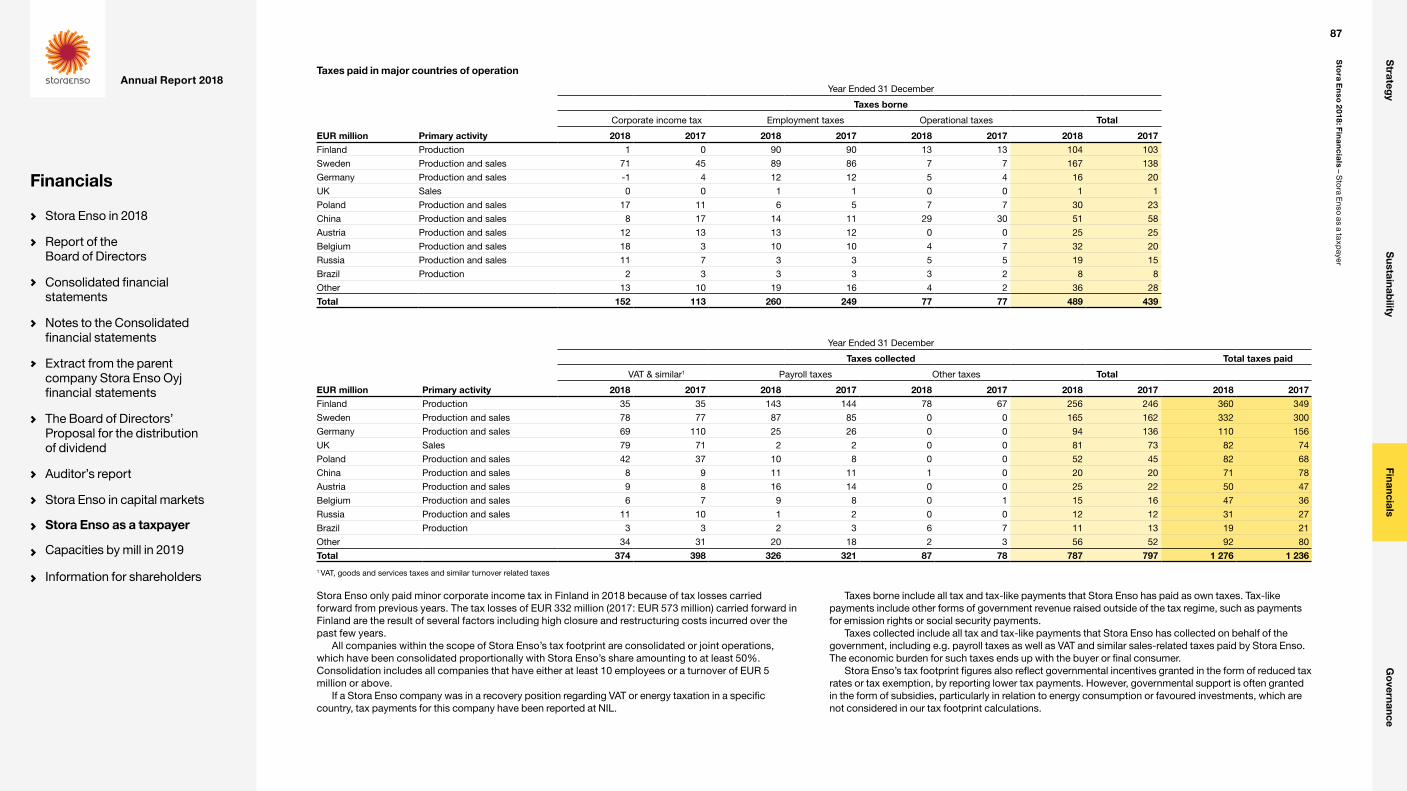
Taxes paid in major countries of operation
Year Ended 31 December
Taxes borne
Corporate income tax Employment taxes Operational taxes Total
EUR million Primary activity 2018 2017 2018 2017 2018 2017 2018 2017Finland Production 1 0 90 90 13 13 104 103
Sweden Production and sales 71 45 89 86 7 7 167 138
Germany Production and sales -1 4 12 12 5 4 16 20
UK Sales 0 0 1 1 0 0 1 1
Poland Production and sales 17 11 6 5 7 7 30 23
China Production and sales 8 17 14 11 29 30 51 58
Austria Production and sales 12 13 13 12 0 0 25 25
Belgium Production and sales 18 3 10 10 4 7 32 20
Russia Production and sales 11 7 3 3 5 5 19 15
Brazil Production 2 3 3 3 3 2 8 8
Other 13 10 19 16 4 2 36 28
Total 152 113 260 249 77 77 489 439
Year Ended 31 December
Taxes collected Total taxes paid
VAT & similar1 Payroll taxes Other taxes Total
EUR million Primary activity 2018 2017 2018 2017 2018 2017 2018 2017 2018 2017Finland Production 35 35 143 144 78 67 256 246 360 349
Sweden Production and sales 78 77 87 85 0 0 165 162 332 300
Germany Production and sales 69 110 25 26 0 0 94 136 110 156
UK Sales 79 71 2 2 0 0 81 73 82 74
Poland Production and sales 42 37 10 8 0 0 52 45 82 68
China Production and sales 8 9 11 11 1 0 20 20 71 78
Austria Production and sales 9 8 16 14 0 0 25 22 50 47
Belgium Production and sales 6 7 9 8 0 1 15 16 47 36
Russia Production and sales 11 10 1 2 0 0 12 12 31 27
Brazil Production 3 3 2 3 6 7 11 13 19 21
Other 34 31 20 18 2 3 56 52 92 80
Total 374 398 326 321 87 78 787 797 1 276 1 236
1 VAT, goods and services taxes and similar turnover related taxes
Stora Enso only paid minor corporate income tax in Finland in 2018 because of tax losses carried forward from previous years. The tax losses of EUR 332 million (2017: EUR 573 million) carried forward in Finland are the result of several factors including high closure and restructuring costs incurred over the past few years.
All companies within the scope of Stora Enso’s tax footprint are consolidated or joint operations, which have been consolidated proportionally with Stora Enso’s share amounting to at least 50%. Consolidation includes all companies that have either at least 10 employees or a turnover of EUR 5 million or above.
If a Stora Enso company was in a recovery position regarding VAT or energy taxation in a specific country, tax payments for this company have been reported at NIL.
Taxes borne include all tax and tax-like payments that Stora Enso has paid as own taxes. Tax-like payments include other forms of government revenue raised outside of the tax regime, such as payments for emission rights or social security payments.
Taxes collected include all tax and tax-like payments that Stora Enso has collected on behalf of the government, including e.g. payroll taxes as well as VAT and similar sales-related taxes paid by Stora Enso. The economic burden for such taxes ends up with the buyer or final consumer.
Stora Enso’s tax footprint figures also reflect governmental incentives granted in the form of reduced tax rates or tax exemption, by reporting lower tax payments. However, governmental support is often granted in the form of subsidies, particularly in relation to energy consumption or favoured investments, which are not considered in our tax footprint calculations.
87
Sto
ra En
so 2
018: Fin
an
cia
ls – Sto
ra Enso as a ta
xpayer
Strateg
yS
ustainability
FinancialsG
overnance
Annual Report 2018
Financials
Stora Enso in 2018
Report of the Board of Directors
Consolidated financial statements
Notes to the Consolidated financial statements
Extract from the parent company Stora Enso Oyj financial statements
The Board of Directors’ Proposal for the distribution of dividend
Auditor’s report
Stora Enso in capital markets
Stora Enso as a taxpayer
Capacities by mill in 2019
Information for shareholders
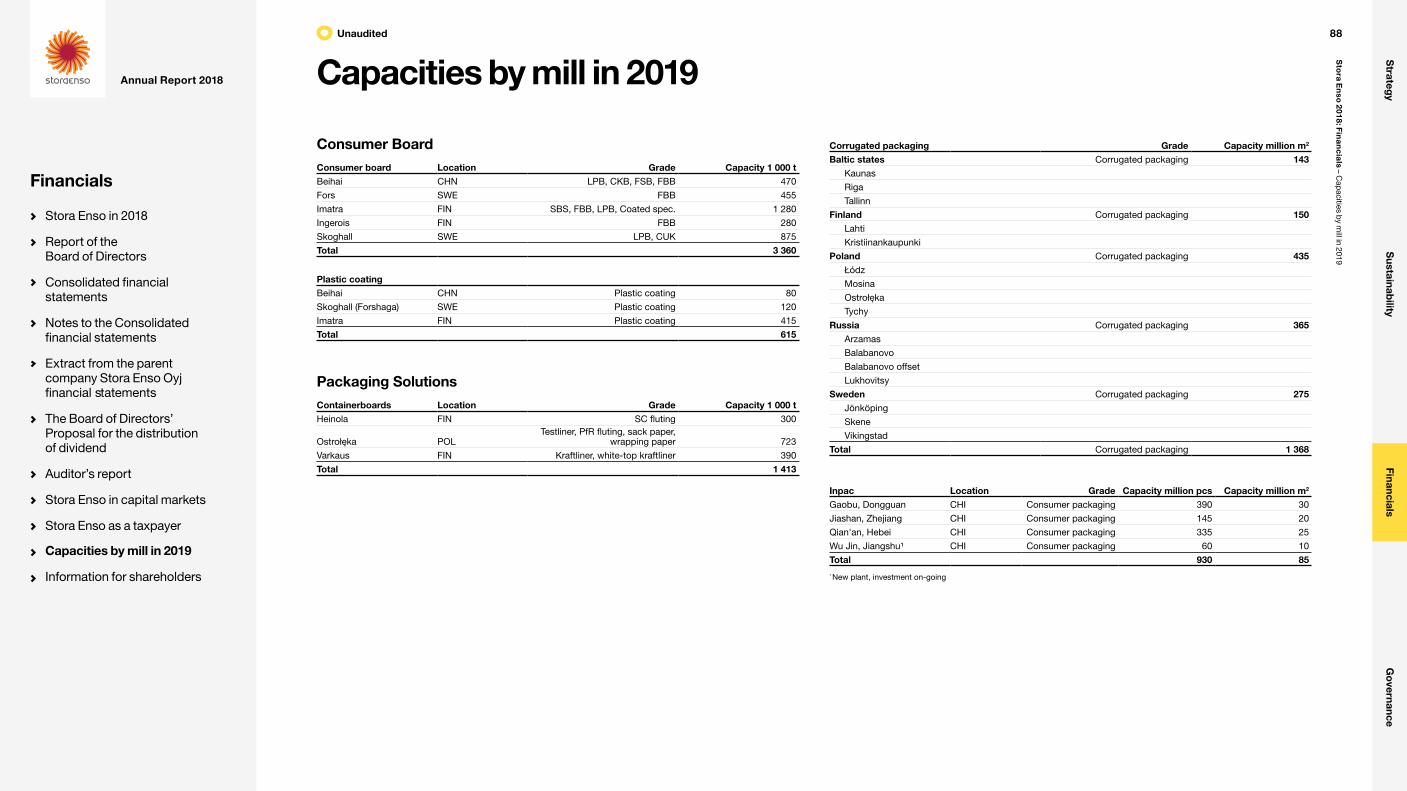
Consumer BoardConsumer board Location Grade Capacity 1 000 tBeihai CHN LPB, CKB, FSB, FBB 470
Fors SWE FBB 455
Imatra FIN SBS, FBB, LPB, Coated spec. 1 280
Ingerois FIN FBB 280
Skoghall SWE LPB, CUK 875
Total 3 360
Plastic coatingBeihai CHN Plastic coating 80
Skoghall (Forshaga) SWE Plastic coating 120
Imatra FIN Plastic coating 415
Total 615
Packaging SolutionsContainerboards Location Grade Capacity 1 000 tHeinola FIN SC fluting 300
Ostrołeka POLTestliner, PfR fluting, sack paper,
wrapping paper 723
Varkaus FIN Kraftliner, white-top kraftliner 390
Total 1 413
Capacities by mill in 2019
Corrugated packaging Grade Capacity million m2
Baltic states Corrugated packaging 143Kaunas
Riga
Tallinn
Finland Corrugated packaging 150Lahti
Kristiinankaupunki
Poland Corrugated packaging 435Łódz
Mosina
Ostrołeka
Tychy
Russia Corrugated packaging 365Arzamas
Balabanovo
Balabanovo offset
Lukhovitsy
Sweden Corrugated packaging 275Jönköping
Skene
Vikingstad
Total Corrugated packaging 1 368
Inpac Location Grade Capacity million pcs Capacity million m2
Gaobu, Dongguan CHI Consumer packaging 390 30
Jiashan, Zhejiang CHI Consumer packaging 145 20
Qian'an, Hebei CHI Consumer packaging 335 25
Wu Jin, Jiangshu¹ CHI Consumer packaging 60 10
Total 930 85
¹ New plant, investment on-going
Unaudited 88
Sto
ra E
nso
2018: Fin
an
cia
ls – Cap
acities by m
ill in 2019
Strateg
yS
ustainability
FinancialsG
overnance
Annual Report 2018
Financials
Stora Enso in 2018
Report of the Board of Directors
Consolidated financial statements
Notes to the Consolidated financial statements
Extract from the parent company Stora Enso Oyj financial statements
The Board of Directors’ Proposal for the distribution of dividend
Auditor’s report
Stora Enso in capital markets
Stora Enso as a taxpayer
Capacities by mill in 2019
Information for shareholders

BiomaterialsMill Location Grade Division Capacity 1 000 tEnocell FIN Short and long-fibre Biomaterials 490
Skutskär SWEShort, long-fibre and
fluff pulp Biomaterials 540
Sunila FIN Long-fibre pulp Biomaterials 375Montes del Plata (50% share) URU Short-fibre pulp Biomaterials 730
Veracel (50% share) BRA Short-fibre pulp Biomaterials 575
Total 2 710
Chemical Pulp
Mill Location Grade Division Capacity 1 000 t
Heinola FINNeutral Sulphite Semi-
Chemical Pulp Packaging Solutions 285
Kaukopää, Imatra FIN Short and long-fibre Consumer Board 825
Nymölla SWE Short and long-fibre Paper 350
Ostrołeka POL Long-fibre Packaging Solutions 110
Oulu FIN Long-fibre Paper 360
Skoghall SWE Long-fibre Consumer Board 375
Tainionkoski, Imatra FIN Short and long-fibre Consumer Board 195
Varkaus FIN Short and long-fibre Packaging Solutions 310
Veitsiluoto FIN Short and long-fibre Paper 380Chemical Pulp Total (incl. Biomaterials) 5 900of which market pulp1 2 150
1 market pulp defined as dried pulp shipped out from the mill to external customers.
Deinked Pulp (DIP)
Mill Location Grade Division Capacity 1 000 tHylte SWE DIP Paper 290
Langerbrugge BEL DIP Paper 680
Maxau GER DIP Paper 295
Ostrołeka POL Recycled fibre based pulp Packaging Solutions 615
Sachsen GER DIP Paper 430
Total 2 310
CTMP
Mill Location Grade Division Capacity 1 000 tBeiha CHN BCTMP Consumer Board 210
Fors SWE CTMP Consumer Board 185
Kaukopää FIN CTMP Consumer Board 220
Skoghall SWE CTMP Consumer Board 270
Total 675
Lignin
Mill Location Product Division Capacity 1 000 tSunila FIN Lignin Biomaterials 50
Total Lignin 50
Xylose
Mill Location Product Division Capacity 1 000 tRaceland¹ USA Xylose Biomaterials 10
Total Xylose 10
1 Starting up
Wood Products
Mill Location
Sawing Capacity 1 000 m3
Further Processing
Capacity 1 000 m3
Pellet capacity
1 000 tCLT capacity
1 000 m3LVL capacity
1 000 m3
Ala SWE 400 50 100 - -
Alytus LIT 210 115 - - -
Amsterdam NLD - 80 - - -
Bad St. Leonhard AUT 360 105 - 80 -
Brand AUT 440 295 - - -
Gruvön SWE 370 150 100 25 -
Honkalahti FIN 310 70 - - -
Imavere EST 340 160 100 - -
Impilahti RUS 150 10 25 - -
Kitee FIN 260 110 25 - -
Launkalne LAT 200 20 - - -
Murow POL 300 210 - - -
Nebolchi RUS 180 45 42 - -
Näpi EST 50 180 23 - -
Pfarrkirchen GER - 145 - - -
Planá CZE 390 220 - - -
Uimaharju FIN 240 20 - - -
Varkaus FIN 150 35 - - 75
Veitsiluoto1 FIN 200 - - - -
Ybbs AUT 700 450 - 100 -
Zdírec CZE 580 220 80 - -
Total 5 830 2 690 495 205 75
¹ Veitsiluoto Sawmill belongs to division Paper.
89
Sto
ra E
nso
2018: Fin
an
cia
ls – Cap
acities by m
ill in 2019
Strateg
yS
ustainability
FinancialsG
overnance
Annual Report 2018
Financials
Stora Enso in 2018
Report of the Board of Directors
Consolidated financial statements
Notes to the Consolidated financial statements
Extract from the parent company Stora Enso Oyj financial statements
The Board of Directors’ Proposal for the distribution of dividend
Auditor’s report
Stora Enso in capital markets
Stora Enso as a taxpayer
Capacities by mill in 2019
Information for shareholders

PaperMill Location Grade Capacity 1 000 tAnjala FIN Impr. news, book, LWC 435
Dawang CHN SC 140
Hylte SWE News 480
Kvarnsveden SWE SC, impr. news 565
Langerbrugge BEL SC, news 555
Maxau GER SC 530
Nymölla SWE WFU 485
Oulu FIN WFC 1 080
Sachsen GER News, impr. news, directory 310
Veitsiluoto FIN LWC, MWC, WFU 790
Total 5 370
Abbreviations used in the tables:BCTMP bleached chemi-thermo- mechanical pulpCKB coated kraft back boardCLT cross-laminated timberCTMP chemi-thermo-mechanical pulpCUK coated unbleached kraftboardDIP deinked pulpFBB folding boxboard LPB liquid packaging boardLVL laminated veneer lumberLWC light-weight coated paperMWC medium-weight coated paperPfR paper for recyclingSBS solid bleached sulphate boardSC super-calendered paperWFC wood free coated paperWFU wood free uncoated paper
The formula: (Sum of net saleable production of two best consecutive months / Available time of these two consecutive months) x Available time of the year
90
Sto
ra E
nso
2018: Fin
an
cia
ls – Cap
acities by m
ill in 2019
Strateg
yS
ustainability
FinancialsG
overnance
Annual Report 2018
Financials
Stora Enso in 2018
Report of the Board of Directors
Consolidated financial statements
Notes to the Consolidated financial statements
Extract from the parent company Stora Enso Oyj financial statements
The Board of Directors’ Proposal for the distribution of dividend
Auditor’s report
Stora Enso in capital markets
Stora Enso as a taxpayer
Capacities by mill in 2019
Information for shareholders

Annual General Meeting (AGM)Stora Enso Oyj’s AGM will be held at 16.00 (Finnish time) on Thursday 14 March 2019 at Finlandia Hall, Mannerheimintie 13 e, Helsinki, Finland.
Nominee-registered shareholders wishing to attend and vote at the AGM must be temporarily registered in the Company’s register of shareholders on the record date, 4 March 2019. Instructions for submitting notice of attendance will be given in the invitation to the AGM, which can be consulted on the Company’s website at storaenso.com/agm.
AGM and dividend in 20194 March Record date for AGM 14 March Annual General Meeting (AGM) 15 March Ex-dividend date 18 March Record date for dividend 25 March Dividend payment
DividendThe Board of Directors proposes to the AGM that a dividend of EUR 0.50 per share be paid to the shareholders for the fiscal year ending 31 December 2018. The dividend payable on shares registered with Euroclear Sweden will be forwarded by Euroclear Sweden AB and paid in Swedish crowns. The dividend payable to ADR holders will be forwarded by Citibank, N.A. (Citi) and paid in US dollars.
Publication dates for 20191 February Financial results for 2018Week 7 Annual Report 2018 25 April Interim Report for January–March 19 July Half-year Report for January–June 29 October Interim Report for January–September
Distribution of financial informationStora Enso’s Annual Report 2018 consists of four sections: Strategy, Sustainability, Financials and Governance. You can find the highlights of the year and all reports as downloadable PDF files at storaenso.com/annualreport2018.
Summary and Governance are available in English, Finnish and Swedish. Strategy, Sustainability and Financials are available in English. The Official Financial Statements (in Finnish) and English and Swedish translations of the Parent Company Financial Statements, and the list of principal subsidiaries in English can be found on the Company’s website.
Interim Reports and Half-year Reports are published in English, Finnish and Swedish at storaenso.com/press.
Information for Shareholders
Information for holders of American Depositary Receipts (ADRs)The Stora Enso dividend reinvestment and direct purchase plan is administered by Citibank, N.A. The plan makes it easier for existing ADR holders and first-time purchasers of Stora Enso ADRs to increase their investment by reinvesting cash distributions or by making additional cash investments. The plan is intended for US residents only. Further information on the Stora Enso ADR programme is available at citi.com/DR.
Contact information for Stora Enso ADR holdersCitibank Shareholder Services Computershare P.O. Box 43077 Providence, Rhode Island 02940-3077 Email: [email protected]
Toll-free number: (877)-CITI-ADR Direct dial: (781) 575-4555
ContactsUlla PaajanenSVP, Investor Relations Stora Enso OyjP.O. Box 309, FI-00101 Helsinki, Finland Tel. +358 2046 21242, [email protected]
storaenso.com [email protected]
Unaudited 91
Sto
ra En
so 2
018: Fin
an
cia
ls – Inform
ation fo
r Shareho
lders
Strateg
yS
ustainability
FinancialsG
overnance
Annual Report 2018
Financials
Stora Enso in 2018
Report of the Board of Directors
Consolidated financial statements
Notes to the Consolidated financial statements
Extract from the parent company Stora Enso Oyj financial statements
The Board of Directors’ Proposal for the distribution of dividend
Auditor’s report
Stora Enso in capital markets
Stora Enso as a taxpayer
Capacities by mill in 2019
Information for shareholders
Stora Enso OyjP.O. Box 309FI-00101 Helsinki, FinlandVisiting address: Kanavaranta 1Tel. +358 2046 131
Stora Enso ABP.O. Box 70395SE-107 24 Stockholm, SwedenVisiting address: World Trade CenterKlarabergsviadukten 70Tel. +46 1046 46 000
Concept and design: Miltton OyPhotography: Mikko Ryhänen It should be noted that Stora Enso and its business are exposed to various risks and uncertainties and certain statements herein which are not historical facts, including, without limitation those regarding expectations for market growth and developments; expectations for growth and profitability; and statements preceded by “believes”, “expects”, “anticipates”, “foresees”, or similar expressions, are forward-looking statements. Since these statements are based on current plans, estimates and projections, they involve risks and uncertainties, which may cause actual results to materially differ from those expressed in such forward-looking statements. Such factors include, but are not limited to: (1) operating factors such as continued success of manufacturing activities and the achievement of efficiencies therein, continued success of product development, acceptance of new products or services by the Group’s targeted customers, success of the existing and future collaboration arrangements, changes in business strategy or development plans or targets, changes in the degree of protection created by the Group’s patents and other intellectual property rights, the availability of capital on acceptable terms; (2) industry conditions, such as strength of product demand, intensity of competition, prevailing and future global market prices for the Group’s products and the pricing pressures thereto, price fluctuations in raw materials, financial condition of the customers and the competitors of the Group, the potential introduction of competing products and technologies by competitors; and (3) general economic conditions, such as rates of economic growth in the Group’s principal geographic markets or fluctuations in exchange and interest rates. All statements are based on management’s best assumptions and beliefs in light of the information currently available to it and Stora Enso assumes no obligation to publicly update or revise any forward-looking statement except to the extent legally required.
Strateg
yS
ustainability
FinancialsG
overnance
Annual Report 2018