Embed Size (px)
Citation preview

SKAGEN Global
Status Report November 2014

2
Summary – November 2014
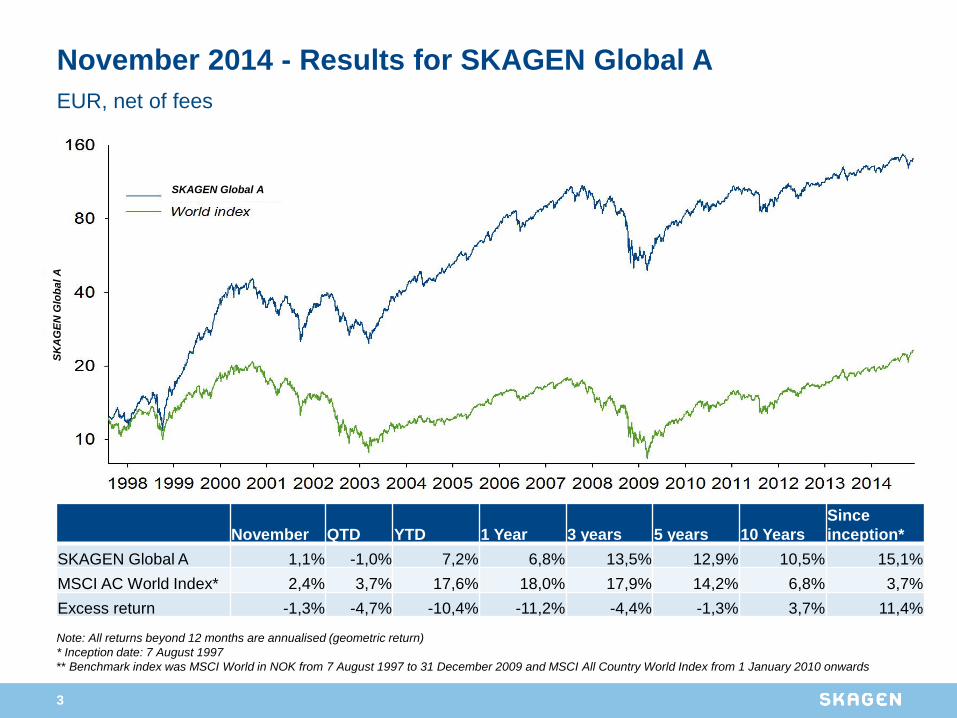
• SKAGEN Global* underperformed its benchmark index in November. While the fund’s unit price increased by 1.1% measured in EUR, the benchmark MSCI All Country World Index increased by 2.4%. Weak developments in the Russian and oil-related names explain the underperformance in November.
• Year-to-date SKAGEN Global is up 7.2%, which is 10.4 percentage points behind the benchmark index.
• Samsung Electronics was the best contributor to absolute performance in November while Weatherford was
the largest detractor.
• The SKAGEN Global team continued to reduce the tail and increase the concentration of the portfolio. At the
end of November, the portfolio contained 78 positions, down from 94 positions at the end of October.
Importantly, the portfolio concentration rose throughout the month as evidenced by the aggregate weight of
the top 10 holdings increasing from 33.0% to 35.6%. The net cash position decreased from 4.8% in October
to 4.3% in November.
• In total, 16 positions left the portfolio, many of which were relatively small positions in the tail e.g. Apetit,
EMGS and Finnair.
• Kingfisher PLC entered the portfolio as a new holding and we added to other positions, including Sanofi and
State Bank of India.
• The SKAGEN Global portfolio remains attractively valued both on an absolute and a relative basis. The
fund’s top 35 holdings trade at a weighted Price/Earnings (2015e) of 10.1x and a Price/Book of 1.1x vs. the
index at 14.7x and 2.1x respectively. Hence, the discount of the portfolio to the index is significant on both
multiples.
• Manufacturing PMI data for November has been mixed, showing slower manufacturing activity in the
Eurozone and the US but higher activity levels in India and the UK.
• The strongest markets in November (measured in EUR) were China (+11%) and Turkey (+8%) whereas
Russia (-10%) and Norway (-6%) performed poorly.
* Unless otherwise stated, all performance data in this report relates to class A units and is net of fees.
3
Note: All returns beyond 12 months are annualised (geometric return)
* Inception date: 7 August 1997
** Benchmark index was MSCI World in NOK from 7 August 1997 to 31 December 2009 and MSCI All Country World Index from 1 January 2010 onwards
November 2014 - Results for SKAGEN Global A
November QTD YTD 1 Year 3 years 5 years 10 Years
Since
inception*
SKAGEN Global A 1,1% -1,0% 7,2% 6,8% 13,5% 12,9% 10,5% 15,1%
MSCI AC World Index* 2,4% 3,7% 17,6% 18,0% 17,9% 14,2% 6,8% 3,7%
Excess return -1,3% -4,7% -10,4% -11,2% -4,4% -1,3% 3,7% 11,4%
EUR, net of fees
SKAGEN Global A
SK
AG
EN
Glo
ba
l A

4
Note: All figures in EUR, net of fees
* Inception date: 7 August 1997
** Benchmark index was MSCI World in NOK from 7 August 1997 to 31 December 1997 and MSCI All Country World Index from 1 January 2010 onwards
71516
-6
24
49
-45
1220
44
27
41
-16
-1-7
135
34
-2
181814
-4
2026
-38
-2
8
26
711
-32
-13-7
44
15
-8
2013 2012 2011 2010 2009 2008 2007 2006 2005 2004 2003 2002 2001 2000 1999 1998 1997 2014
YTD
Percent MSCI AC World** (EUR)
SKAGEN Global A (EUR)
Annual performance since inception (%)* SKAGEN Global A has beaten the benchmark 14 out of 17 years

5
4
7
-6-4
-1
1
-10
-3-2
001
11111112
22
334
444
45
811
Hungary
Hong Kong
SKAGEN Global A Japan
United Kingdom
Spain USA (S&P 500)
Finland France
Netherlands Switzerland
Belgium China (Hong Kong)
USA (Nasdaq) Germany
Turkey China (Local)
Indonesia
Denmark South Africa
Canada MSCI EM Index
Poland South Korea
Brazil
Thailand
Norway Russia
Italy
Mexico
India MSCI AC Index
Markets in November in EUR (%)

6
52
36
9
-22-10
-8-1
4445
7788899
12131414
17181919
2626
36
3940
43
MSCI EM Index Canada
Italy Sweden Mexico
Netherlands Finland
Spain
South Africa MSCI AC Index
Hong Kong China (Hong Kong)
Denmark USA (S&P 500) USA (Nasdaq)
Indonesia Turkey
Thailand China (Local)
India
Germany Poland
South Korea Norway Austria
Hungary Russia
France Japan
SKAGEN Global A United Kingdom
Brazil
Markets YTD 2014 in EUR (%) as at end of November

7
Largest positive contributors Largest detractors
Main contributors in November 2014
NB: Contribution to absolute return
Total value creation November 2014: NOK 1 874 million
Company NOK (m)
Samsung Electronics 179
Citigroup 151
State Bank of India 146
AIG 123
Renault 123
Heidelberg Cement 89
Baker Hughes 85
Yamaha Motor 81
Microsoft 79
Akzo Nobel 77
Company NOK (m)
Weatherford -83
Gazprom -76
Afren -75
Vimpelcom -48
Stolt Nielsen -32
Eletrobras -30
Sistema -28
Sberbank -27
Technip -26
Petrobras -22
8
Largest positive contributors Largest detractors
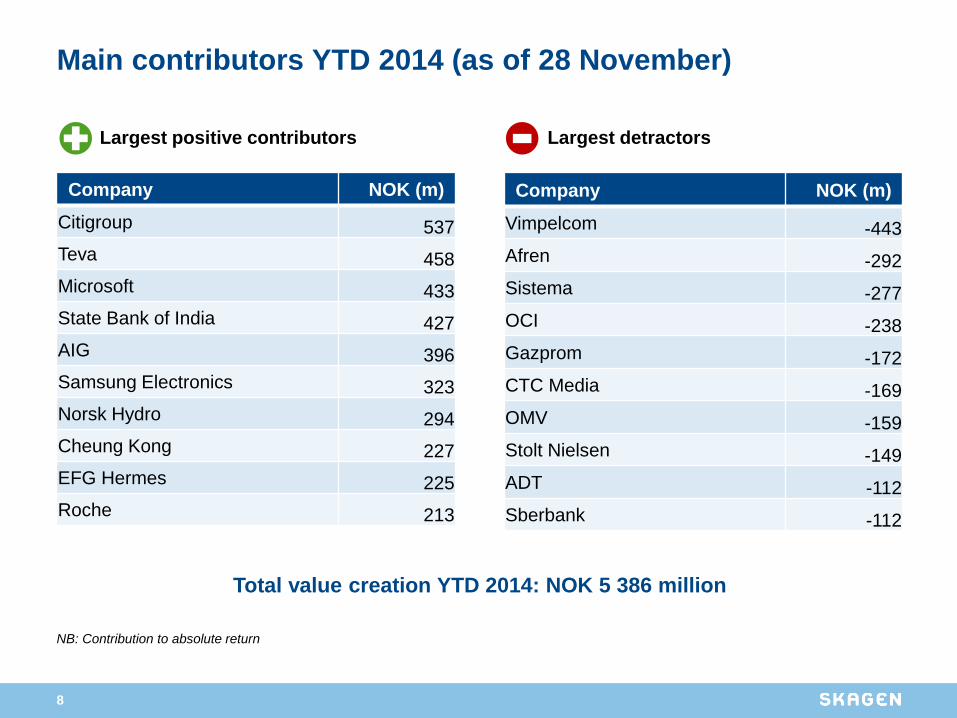
Main contributors YTD 2014 (as of 28 November)
NB: Contribution to absolute return
Total value creation YTD 2014: NOK 5 386 million
Company NOK (m)
Citigroup 537
Teva 458
Microsoft 433
State Bank of India 427
AIG 396
Samsung Electronics 323
Norsk Hydro 294
Cheung Kong 227
EFG Hermes 225
Roche 213
Company NOK (m)
Vimpelcom -443
Afren -292
Sistema -277
OCI -238
Gazprom -172
CTC Media -169
OMV -159
Stolt Nielsen -149
ADT -112
Sberbank -112

9
Holdings increased and decreased in November 2014
Key buys during November
• Kingfisher (new) was added to the portfolio after the company released their Q3 earnings
report that was a touch weaker than expected. We see Kingfisher as a self-help story that
should be able to enhance earnings by improving their margins from internal measures. There
is also potential for asset disposals and we expect to see shareholder return from dividends
and share buybacks.
• State Bank of India – Based on valuable new insight from SKAGEN Kon-Tiki following a
recent visit to India, we have chosen to increase our holding in this company. ROE is
expected to rise from 10% towards 16% as the high level of loan losses begins to recede. The
company currently trades at 1.4x book but with good prospects to re-rate sharply over the next
couple of years. The stock has been a strong performer this year, but we retain our conviction
in the name which has entered the top 10 list.
• Sanofi – The stock pulled back as the CEO left the company. We think that Sanofi has a
strong bench and consider the market reaction to this event overdone. We see the dip as a
buying opportunity based on short-term weakness and added slightly to our position.
10
Holdings increased and decreased in November 2014 (cont.)
• BWLPG (out)
• Stolt Nielsen (out)
• Royal Unibrew (out)
• Apetit (out)
• Rhoen Klinikum (out)
• Tag Immobilien (out)
• RSA (out)
• Japan Sec (out)
• SR Bank (out)
• Deutsche Wohnen (out)
• CTC Media (out)
• Chiquita (out)
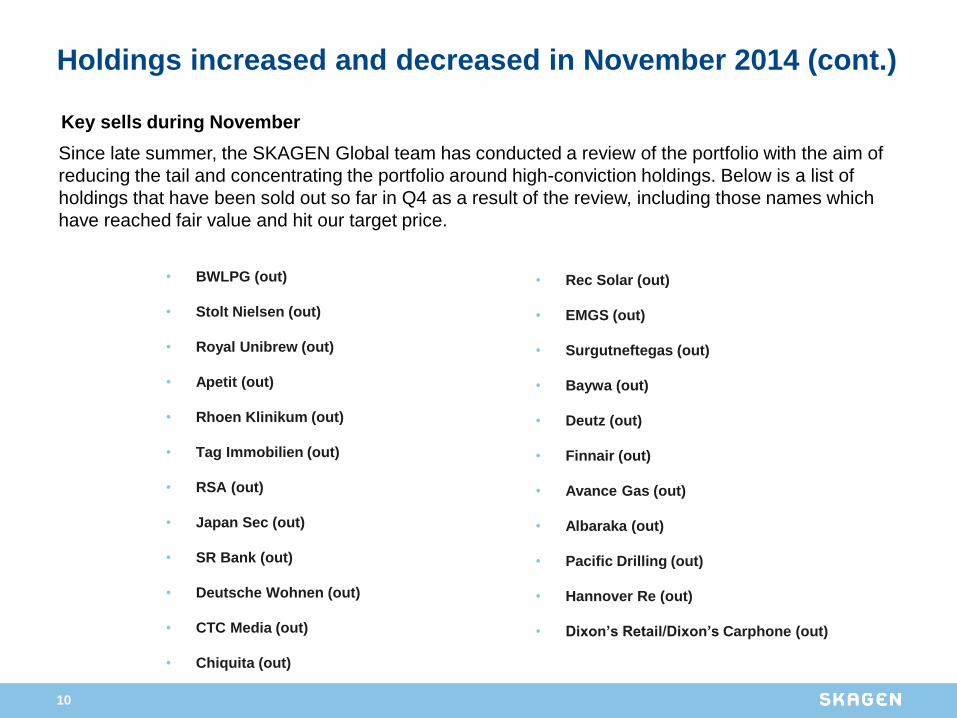
Key sells during November
Since late summer, the SKAGEN Global team has conducted a review of the portfolio with the aim of
reducing the tail and concentrating the portfolio around high-conviction holdings. Below is a list of
holdings that have been sold out so far in Q4 as a result of the review, including those names which
have reached fair value and hit our target price.
• Rec Solar (out)
• EMGS (out)
• Surgutneftegas (out)
• Baywa (out)
• Deutz (out)
• Finnair (out)
• Avance Gas (out)
• Albaraka (out)
• Pacific Drilling (out)
• Hannover Re (out)
• Dixon’s Retail/Dixon’s Carphone (out)

11
• Volvo (new)
• NN Group (new)
• Deutz (new)
• Industrial Bank of Korea
• DSM
• Gap
• Philips
• DSM
• Lundin Mining
• Unilever
• Sanofi
• Varian Medical Systems
• AIG
• Goldman Sachs
• Kingfisher (new)
• State Bank of India
• Lundin Mining
• Cheung Kong
• China Unicom
• Dixons Retail/Dixons Carphone
• Hannover Re
• Oracle(out)
• RCL(out)
• Bunge
• Tyco
• Vale (out)
• RSA
• Weatherford
• Teva
• Samsung Electronics
* See previous slide for a list of
positions which have been sold out
in Q4
Holdings increased Holdings reduced
Q3 Q3
Q4
Q4
Most important changes Q3 and Q4 2014

12
Largest holdings SKAGEN Global as of 28 November 2014
Holding Price P/E P/E P/BV Price
size, % 2014e 2015e last target
CITIGROUP 7,2 54,0 11,5 10,0 0,8 75
SAMSUNG ELECTRONICS 6,9 1 049 000 7,2 7,8 1,0 1 300 000
AIG 4,6 54,8 11,5 10,9 0,7 80
MICROSOFT 2,6 47,8 17,2 15,1 4,4 50
RENAULT 2,6 64,6 9,8 7,1 0,8 80
NORDEA 2,5 93,2 11,9 10,9 1,4 105
ROCHE 2,4 289,4 19,6 18,2 14,1 380
AKZO NOBEL 2,4 55,6 17,9 15,0 2,5 65
LG CORP 2,2 65 100 11,2 9,4 0,9 100 000
STATE BANK OF INDIA 2,1 321,4 13,3 10,7 1,5 430
Weighted top 10 35,6 11,1 10,1 1,1 30 %
Weighted top 35 71,9 11,5 10,1 1,1
MSCI AC World 16,1 14,7 2,1

13
Sector and geographical distribution versus index (Nov 2014)
Sector distribution Geographical distribution
26
4
3
4
0
5
12
7
2
15
10
11
8
0
14
22
12
10
12
10
5
8
Cash
Health
Consumer staples
Consumer discretionary
Industrials
Utilities
Telecom
IT
Banking & Finance
Raw materials
Energy Index
Fund
55
4
3
5
0
10
31
18
3
2
4
20
0
2
10
3
2
10
7
0
2
9
Cash
Oceania
South America
Peripheral EU
The Nordics
North America
Core EU
Japan
Frontier Markets
EMEA
Asia ex Japan

14
Key earnings releases and corporate news, November 2014
DSM
(2.0%)
Reported 3Q 2014 results in line with expectations and announced plans to sell non-core assets
• Summary: Results were in line with expectations and DSM reiterated its FY14 guidance. Sales were up 5%
YoY mainly driven by the performance materials business. EBITDA was flat YoY as the core nutrition
business still faces cyclical challenges in human nutrition. More interestingly, the company changed their
communication regarding portfolio reorganisation. They now explicitly communicate their intention to sell off
their low margin businesses and focus on the high ROIC nutrition business. The new CFO also gave a clear
indication that both costs and working capital have room for improvement.
• Implications for investment case: Very positive. The company basically confirmed that our 3 main triggers
should be released going forward – revaluation from a focus on nutrition, higher margins from cost cutting,
and improving cash flow.
AIG
(4.6%)
Reported better than expected 3Q 2014 results driven by revaluation gains
• Summary: AIG reported better than expected 3Q 2014 results, mainly driven by revaluation gains in the direct
investment book and the AerCap businesses. The underlying core combined ratio in the P&C business
improved substantially YoY driven by a 3pts lower loss ratio and a flat cost ratio. Unfortunately, AIG keeps
adding to prior years’ reserves (added more than 500 million this quarter to reserves from 2006 and before).
The life business continues to do well, growing more than 4% YoY ex. revaluation gains. AIG repurchased
USD 1.5bn worth of shares in 3Q (2% of shares outstanding) and announced a new USD 1.5bn share
buyback authorisation. Book value per share grew 15% YoY.
• Implications for investment case: We are seeing the underlying improvements we are looking for – improved
underlying P&C margin, a growing life business, and very healthy free cash flow supporting higher cash
returns to shareholders. Current valuation seems fair if you assume current profitability will not change. At the
current pace, the company is buying back 8% of outstanding shares a year. This supports our view that we
have downside protection, while we wait for improved profitability and a corresponding revaluation of the
shares.

15
Key earnings releases and corporate news, November 2014
Samsung
Electronics
(6.9%)
Share buybacks announced
• Summary: SEC announced it will buy back 1,650,000 ordinary shares and 250,000 preference shares. This
equals 1.1% of shares issued and 1.3% of outstanding shares excluding treasury shares. Proceeds based on
last share price is KRW 2.2tr or 4% of its net cash position which stood at KRW 53tr or USD 48bn at the end
of 3Q14. The buyback will be executed from now until 25 February 20115 and represents 7 days of average
daily volume in ordinary shares and 6 days of average daily volume in preference shares. The buyback will
increase treasury holding to 12.5% of shares issued and are not expected to be cancelled
• Implications for investment case: This is the first share buyback since 2007, when SEC bought back 2.8m
ordinary shares and 0.4m preference shares (1.9% of shares issued) for KRW 1.8tr. This is a welcome step,
although a very small one. SEC is under pressure to implement a much more shareholder friendly distribution
policy with a dismal 7% payout ratio for 2013. The health of the chairman, current internal “crises” and
ongoing transfer of ownership, however, are likely to delay any quantum leap in policy. Regarding
government pending penalty for cash hording Korean companies, SEC should be off the hook with its planned
KRW 15.6tr semiconductor factory in Korea expected to come on stream in 2H17.
Gap
(1.7%)
Q3 weak as warned
• Summary: Gap reported a weak quarter, which was previously warned. Nevertheless FY guidance came in 3-
4% below consensus and the stock fell by an equal amount on the day. Same-store sales (SSS) were
negative 2%, topline was flat but up 1% if constant FX. Online sales contributed 0.8% topline growth,
indicating underlying SSS was minus 3%. EBIT margin was 13.9% vs.14.4% last year. The relatively weak
quarter was due to lower topline, and particularly at the GAP brand, which posted a 5% negative SSS.
Banana Republic was flat and old Navy was +1%.
• Implications for investment case: The key negative piece of information in the report was the weak topline at
Gap. Management had hoped Gap could improve from September as they had invested into the brand and
because this would be the first month with a full collection from the new design team. Other than that, the
results were not too worrying as we think weak topline is partly cyclical, i.e. it is not a Gap-specific issue.
Furthermore, FX is a major contributor to guidance downgrade as it is expected to hurt EPS by 5% for the FY.
Gap’s costs again showed a very good flexibility and costs increased significantly less than expected. The
gross margin was stable. Inventories are under tight control, and are down 2% y/y on a per store basis
despite weaker than forecast sales. Cash flow remains strong and GAP bought back 2.6% of outstanding
shares in the quarter. The stock now trades at 13x revised 12m forward EPS.

16
Key earnings releases and corporate news, November 2014
(cont.)
Tyco
(1.9%)
Reported quarterly result in line with expectations but with strong order growth
• Summary: Organic revenue is still slow at 3% (in line with expectations). More importantly, margin increased
again this quarter driven by lower costs. Free cash flow also continues to be very healthy at 91% of net
income. The main positive surprise was healthy order growth of 5% YoY, and it seems the North American
commercial real estate construction market is finally taking off (orders were up 18% YoY in this segment). The
company was fairly aggressive in terms of share buybacks (5% of shares outstanding in the quarter).
• Implications for investment case: Tyco continues to execute extremely well on margins, cash conversion and
capital allocation. Tyco also held an investor day to set the stage for the next 3 years. Overall data given by
management confirms our thesis. Even with minimal top-line growth, margin expansion from cost reduction
combined with healthy share buybacks should lead to 12-15% annualised EPS growth in the coming years.
Baker Hughes
(1.5%)
Baker Hughes-Halliburton tie-up
• Summary: Halliburton and Baker Hughes announced that they have started talks regarding a possible
consolidation. This process was initiated by Halliburton and still has to clear several regulatory hurdles before
receiving formal approval. Baker Hughes shareholders will receive 1.12 Halliburton shares and USD 19 in
cash per share. The transaction is expected to close in mid-2015.
• Implications for investment case: Clearly, this consolidation will improve the market power of the oil service
companies as four large players (Schlumberger, Baker Hughes, Halliburton and Weatherford) become three
large players. The transaction may create USD 2bn in synergies by the end of the first year. We would expect
some assets to be divested after the merger for anti-trust reasons.

17
Key earnings releases and corporate news, November 2014
(cont.)
Lenovo
(1.1%)
Strong margins despite weaker revenue growth; volatility ahead
• Summary: Revenue increased 7% YoY to USD 10.5bn, while improved margins contributed to operating profit
growth of 29% YoY. EMEA region (+33% revenue YoY) was the key contributor to top line growth, as Lenovo
increased its market share by 4.4 percentage points YoY to 19.3%. On the negative side, non-PC revenue in
China fell by 28% YoY, and this mainly reflects a tougher smartphone market for Lenovo. Both the IBM server
and Motorola Mobility acquisitions have now closed, so we should expect a drop in earnings and increased
volatility in share price in the short term.
• Implications for investment case: The top line was slightly weak, mainly driven by lower smartphone revenue
in China. Profits were strong though, and in line with Lenovo’s focus on profitability rather than revenue
growth alone. The impact of the two acquisitions creates uncertainty over the near term, which is likely to
have some impact on the share price. Management remains confident that it can turn the businesses around
within 6 quarters (1 year for servers, 6 quarters for Motorola Mobility) and has a track record to support the
claim. Lenovo is now the world’s largest computer & tablet (combined) producer, just ahead of Apple, and as
investors we pay USD 12bn (EV) for the entire business. If we look at the 1HFY15 results, Lenovo grew its
revenue by 12% and its operating profit by 35%. This compares favourably with a valuation of ca. 10x EBIT
before acquisition impact.

18
The largest companies in SKAGEN Global
Samsung Electronics is one of the world's largest producers of consumer electronics. The company is
global #1 in mobile phones and smartphones, the world's largest in TV and a global #1 in memory chips.
Samsung also produces domestic appliances, cameras, printers, PCs and air conditioners.
Citi is a US financial conglomerate with operations in more than 100 countries worldwide. The bank was
bailed out by the US government during the credit crisis and subsequently raised USD 50bn of new
capital. Consists of two units: Citi Holdings which is a vehicle for assets that are to be run down and sold
and Citi Corp which is the core of the going concern business. In Citicorp 60% of revenues are derived
from outside the US - mainly from emerging markets.
AIG is an international insurance company serving commercial, institutional and individual customers. The
company provides property-casualty insurance, life insurance and retirement services. AIG was at the very
centre of the financial crisis as the central bank for mortgage insurance – it was bailed out in a USD 180bn
bailout. The company has two core insurance holdings: Sun America and Chartis that it intends to keep.
The company has set a target to achieve 10% ROE by 2015.
Microsoft is the world’s largest software company and delivers software to a number of applications from
PCs to servers and cell phones – its most famous product is Windows and the affiliated Office Software
Suite. In recent years the company has also diversified into video game consoles, ERP systems, internet
search and cloud-based computing. Despite a strong push for diversification 80% of the company’s
revenues and nearly all its profits come from three main areas: Windows OS, Windows Server and the
business division (Office Suite).
Renault is a leading manufacturer of automobiles through brands like Renault, Dacia and Renault
Samsung Motors. It holds ownership of stakes in Nissan (43.4%), AvtoVaz (25%) and Daimler (1.55%). It
has also built up sizable operations in Russia, Turkey, North Africa and Brazil. Renault is also a leader in
Electrical Vehicles and holds a 2-3 year advance vs. competitors. The market value of the stake in Nissan
makes up ~80% of the market cap. of Renault

19
Akzo Nobel is the world’s leading coatings supplier. It is active in 3 key areas: Performance coatings,
Decorative paints and Specialty chemicals. Revenues in 2013 totalled USD 14.6bn with 50,000
employees. The company has good positions in all key mature markets plus a particularly strong emerging
market portfolio, including top-3 positions in China, India and Brazil. High growth markets make up 44% of
sales, with North America representing 15% and developed Europe 38%.
Roche is a leading pharmaceuticals and diagnostics company based in Switzerland. Half of group sales
and 2/3 of EBIT is derived from the company’s Big 3 oncology franchises: HER2 (breast cancer), Avastin
(colorectal cancer), and MabThera/Rituxan/Gazyva (blood cancer), each about USD 7bn of revenue.
These businesses all come from Genentech, in which Roche has been a majority owner since 1990, and
bought the last 46% in 2009.
LG Corp is the third largest conglomerate in Korea. It is a holding company which operates a number of
listed subsidiaries: LG Chem (basic chemicals but it is also a leading manufacturer of batteries), LG
Electronics (consumer electronics and home appliances), LG Uplus (wireless telecom services), and LG
Household & Health (households and personal care products). The company also operates a number of
unlisted companies.
Nordea holds pole position in the Nordics with 11.2m retail costumers and 625,000 corporate clients.
Nordea is the largest Nordic asset manager/wealth manager with EUR 224bn in AuM (EUR 138bn in
managed funds). It is the most diversified among its Nordic peers. Total loans are EUR 346bn with the
following split: Finland 27%, Sweden 26%, Denmark 24%, Norway 18%, and Baltics/Poland/Russia 5%.
The largest companies in SKAGEN Global (cont.)
State Bank of India is the largest bank in India with a 22% market share. It has an unrivalled pan-India
branch network and a very strong deposit franchise. The bank also has a sizeable overseas presence
(15% of loan book). Aside from its core banking operation, the company is also involved in life insurance,
asset management, credit cards, and capital markets.

20
Kingfisher (KGF LN) GBP 317
Kingfisher is the largest home improvement retailer in Europe with a leading market share in the UK, France and Poland which together represent 90% of sales and 95% of profits. Kingfisher operates via B&Q and Screwfix in the UK and via Castorama and Brico Depot in France. Sales came in at close to GBP 11bn with a net result north of GBP 700mn in 2013/14. Kingfisher has improved its business over the past few years. Looking back to 2008, the company had a net debt of GBP 1.6bn while today they are in a net cash position. Ian Cheshire took over as CEO in 2008 and has guided the company for the past 6 years with good results. Cheshire is now being replaced as CEO by Veronique Laury, most recently CEO of Castorama France. The new CEO, Ms. Laury, has 26 years’ experience within the DIY industry, including 11 years at KGF. Kingfisher owns property worth £3.5bn as of today and they also have lease liabilities in the £3.5bn range. Rationale for investment We see Kingfisher as a company that can improve earnings by internal measures and see it as a classic self-help story (“Create the leader”-program). We go into the investment at a time when the French economy is fragile at best, but we believe that most of this is priced into the stock price. The balance sheet is rock solid and with a new CEO coming in we have high hopes for margin improvement and divestment of assets driving a re-rating of the stock. We don’t pin too much hope on a broad based European recovery, although that would certainly help the investment case. Catalyst: – “Create the leader” execution (accelerated pace) – Special dividend/dividend hike – Sale of China business. Worth GBP 350-400mn – Right sizing the stores. Smaller stores and lease renewals at better prices
Risk: – Meltdown in UK and France – Tried to move to a common range back in 2003 and failed
Target price GBP 450 (15x 2017 earnings + dividend)
Ratios:
MCAP: GBP 7,0bn
Net cash: GBP 475mn
Shares Out.: 2.38bn
P/E(15e): 14,4x
P/E(16e): 13,2x
EV/Sales: 0,63x
EV(inc leases)/Sales: 0,9x
ROE(14e): 8%
Div yield: 3,6%
#Analyst 26
% Sell/Hold 65%

For more information please visit:
Our latest Market report
Information on SKAGEN Global A on our web pages
Unless otherwise stated, performance data relates to class A units and is net of fees. Historical returns are no guarantee for future returns. Future returns will depend, inter alia, on market developments, the fund manager’s skill, the fund’s risk profile and subscription and management fees. The return may become negative as a result of negative price developments. SKAGEN seeks to the best of its ability to ensure that all information given in this report is correct. However, it makes reservations regarding possible errors and omissions. Statements in the report reflect the portfolio managers’ viewpoint at a given time, and this viewpoint may be changed without notice. The report should not be perceived as an offer or recommendation to buy or sell financial instruments. SKAGEN does not assume responsibility for direct or indirect loss or expenses incurred through use or understanding of the report. Employees of SKAGEN AS may be owners of securities issued by companies that are either referred to in this report or are part of the fund's portfolio.