Embed Size (px)
Citation preview
© Transamerica Institute, 2016TCRS xxxx-xxxx
The Current State of Retirement:
A Compendium of Findings
About American Retirees
April 2016
TCRS 1321-0416
Page
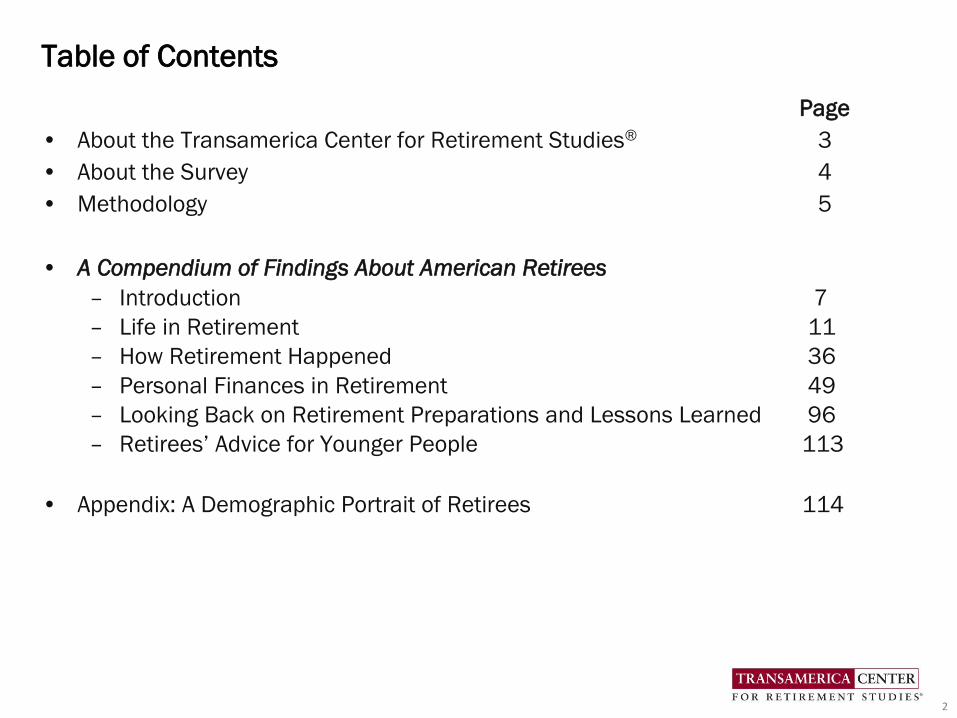
• About the Transamerica Center for Retirement Studies® 3
• About the Survey 4
• Methodology 5
• A Compendium of Findings About American Retirees
– Introduction 7
– Life in Retirement 11
– How Retirement Happened 36
– Personal Finances in Retirement 49
– Looking Back on Retirement Preparations and Lessons Learned 96
– Retirees’ Advice for Younger People 113
• Appendix: A Demographic Portrait of Retirees 114
Table of Contents
2
• The Transamerica Center for Retirement Studies® (TCRS) is a division of Transamerica Institute ® (The Institute), a nonprofit, private foundation. TCRS is dedicated to educating the public on emerging trends surrounding retirement security in the United States. Its research emphasizes employer-sponsored retirement plans, including companies and their employees, unemployed and underemployed workers, and the implications of legislative and regulatory changes. For more information about TCRS, please refer to www.transamericacenter.org.
• The Institute is funded by contributions from Transamerica Life Insurance Company and its affiliates and may receive funds from unaffiliated third parties.
• TCRS and its representatives cannot give ERISA, tax, investment or legal advice. This material is provided for informational purposes only and should not be construed as ERISA, tax, investment or legal advice. Interested parties must consult and rely solely upon their own independent advisors regarding their particular situation and the concepts presented here.
• Although care has been taken in preparing this material and presenting it accurately, TCRS disclaims any express or implied warranty as to the accuracy of any material contained herein and any liability with respect to it.
About the Transamerica Center for Retirement Studies®
3
• Since 1998, the Transamerica Center for Retirement Studies® has conducted national surveys of U.S. business employers and workers regarding their attitudes toward retirement. The overall goals for the study are to illuminate emerging trends, promote awareness, and help educate the public.
• Harris Poll was commissioned to conduct the Retiree Survey for Transamerica Center for Retirement Studies. Transamerica Center for Retirement Studies is not affiliated with Harris Poll.
• About Harris Poll: Over the last 5 decades, Harris Polls have become media staples. With comprehensive experience and precise technique in public opinion polling, along with a proven track record of uncovering consumers’ motivations and behaviors, Harris Poll has gained strong brand recognition around the world. For more information, contact: [email protected].
About the Survey
4
• A 24-minute, online survey was conducted between July 6 – 24, 2015 among a nationally representative sample of 2,012 retirees using the Harris Poll online panel. Retirees met the following criteria:
– U.S. residents, age 50 or older
– Consider themselves to be fully (N=1,741) or semi-retired (N=271)
– Worked for a for-profit company employing 10 or more people for the majority of their career
• Data were weighted as follows:
– Census data were referenced for education, age by gender, race/ethnicity, region, household income, and number of employees by company size. Results were weighted where necessary to bring them into line with the population of US residents age 50+, previously employed for a for-profit company with 10+ employees.
– The weighting also adjusts for attitudinal and behavioral differences between those who are online versus those who are not, those who join online panels versus those who do not, and those who responded to this survey versus those who did not.
• Percentages are rounded to the nearest whole percent.
• Percentages revised to total to 100% in charts when necessary.
Retiree Survey Methodology
5
The Current State of Retirement:
A Compendium of Findings About American Retirees
6
The Current State of Retirement: A Compendium of Findings About American Retirees is based on a 2015
survey of more than 2,000 American retirees by Transamerica Center for Retirement Studies. It provides in-
depth perspectives about retirees including their attitudes about life in retirement, time commitments, living
arrangements, and personal finances.
Many retirees are still recovering from the Great Recession while managing their households with modest
retirement incomes. The good news is that most retirees are enjoying life, but the concerning news is that many
may be ill-equipped to deal with a financial shock such as the possible need for long-term care.
Although years have passed since the financial crisis known as the Great Recession, many retirees are still
feeling its aftereffects. The survey found that only 45 percent of retirees say that they have either fully
financially recovered or were not impacted. Thirty-five percent say they have somewhat recovered, eight percent
have not yet begun to recover, and 12 percent feel they may never recover from it.
As a society, we frequently speak of the need for workers to save and prepare for retirement. Unfortunately, the
conversation often ends once people stop working and retire, which is when it becomes even more critical for
them to have a financial plan that can last their lifetimes.
Ten Important Facts About Today’s Retirees
The compendium offers more than 50 indicators of retirees’ health and wealth by age range, including the
following 10 facts:
1. Just getting by and/or covering basic living expenses is the most frequently cited financial priority. Retirees
cite financial priorities including just getting by and/or covering basic living expenses (42 percent), paying
healthcare expenses (37 percent), paying off mortgages (21 percent), and continuing to save for
retirement (20 percent). An alarming 25 percent of retirees cite paying off credit card debt as a financial
priority. Most retirees are living on a modest income. The annual household income among retirees is
$32,000 (estimated median); however, there is a sizeable gap between those who are married ($48,000)
and unmarried ($19,000).
Introduction
7
2. Social Security is the cornerstone of retirement income. Social Security (89 percent), followed by other
savings and investments (48 percent), company-funded pension plans (42 percent), and
401(k)/403(b)/IRAs (37 percent) are the most frequently cited current sources of income among retirees.
Among those currently receiving income from Social Security, the median age they started collecting
benefits was 62, despite major reductions to their monthly benefits. Only one percent waited until age 70,
the age at which one can receive maximum monthly benefits.
3. Retirees’ confidence about maintaining their lifestyle exceeds the size of their nest eggs. Seventy-two
percent of retirees are “somewhat” or “very” confident that they will be able to maintain a comfortable
lifestyle during retirement. However, fewer than half (46 percent) agree that they have built a large
enough retirement nest egg. Current household savings among retirees in all retirement accounts stands
at $119,000 (estimated median), with a wide disparity between retirees who are married ($224,000) and
unmarried ($40,000).
4. Sixty percent of retirees retired sooner than planned. Retirees in their fifties (79 percent) are far more
likely to have retired sooner than planned, when compared to older retirees. Two-thirds (67 percent) of
retirees in their sixties and 53 percent of age 70-plus retirees retired sooner than planned. Across age
ranges, fewer than 10 percent retired later than planned.
5. Reasons for retiring sooner than planned range from employment-related reasons to health issues.
Among retirees who retired sooner than planned, two-thirds (66 percent) cite employment-related reasons
for having done so. However, reasons for retiring sooner than planned vary by age range. Age 70-plus
retirees (70 percent) were most likely to retire due to employment-related reasons, while retirees in their
fifties (52 percent) were most likely to do so because of their own ill-heath. Only 12 percent of retirees of
all ages who retired sooner than planned say they did so because they saved enough money and could
afford to retire.
Introduction
8
4. Retirees expect a long retirement and most say they are in good health. Retirees expect to live 28 years
(median) in retirement, and 41 percent expect a retirement of more than 30 years. Most retirees (70
percent) believe that they are in good or excellent health with one notable exception: retirees in their fifties.
Only 55 percent of retirees in their fifties consider themselves in good or excellent health. Moreover, 45
percent of retirees in their fifties say they are in fair or poor health, a finding that is much higher than
retirees aged 60 and older.
5. Most retirees are happy and enjoying life. The vast majority of retirees say that they are a generally happy
person (94 percent), are enjoying life (90 percent), and have a strong sense of purpose (84 percent).
However, some say that everyday activities are becoming more difficult for them (31 percent) and/or that
they are having difficulties making ends meet (28 percent). Eleven percent feel isolated and lonely.
8. Retirees spend their time in a wide variety of activities. Retirees most frequently cite spending more time
with family and friends (53 percent), pursuing hobbies (40 percent), and traveling (33 percent) as ways
they are spending their time in retirement. Twenty-four percent are doing volunteer work and 11 percent
are taking care of their grandchildren. Retirees under age 65 are more likely than older retirees to say they
are traveling (72 percent vs 62 percent, respectively) and pursuing hobbies (54 percent vs 42 percent,
respectively). In contrast, retirees age 65 and older are more likely to be doing volunteer work.
9. Retirees’ fears evolve with their age and stage in life. Retirees most frequently cite declining health that
requires long-term care (44 percent) and a reduction in or elimination of Social Security (44 percent) as
their greatest retirement fears, closely followed by outliving their savings and investments (41 percent).
Notably, more age 60-plus retirees cite declining health that requires long-term care as a fear. In contrast,
more retirees in their fifties fear difficulties in finding meaningful ways to spend their time, not being able
to meet the basic needs of their families, and/or feeling isolated and alone.
Introduction
9
10. Few retirees have a written financial plan for their retirement. More than half of retirees (54 percent)
indicate that they have a retirement strategy, but only 10 percent have it in writing. Among retirees with a
retirement strategy, most factor Social Security and Medicare benefits (88 percent) into their current
strategy – and many include ongoing living expenses (71 percent), healthcare costs (60 percent), a budget
for basic living expenses (60 percent), total savings and income needs (60 percent), and investment
returns (56 percent). However, relatively few consider important factors such as pursuing retirement
dreams (31 percent), inflation (30 percent), estate planning (26 percent), tax planning (25 percent), and
long-term care insurance (23 percent). Only seven percent have contingency plans for retiring sooner than
expected and/or savings shortfalls.
Today’s retirees are facing formidable challenges in ensuring that they have adequate income to last their
lifetimes. As Baby Boomers retire, Social Security and other benefit programs will likely be under even greater
strain. It’s imperative that policymakers, employers, industry, individuals and families work together to find
solutions so that the retirees of today and tomorrow can have a comfortable retirement.
We hope that you find this compendium to be a helpful source of retirement-related research and that you will
join me in raising awareness about the need to help improve the financial security among retirees. Working
together, we can make a difference.
Catherine Collinson
President, Transamerica Institute® and Transamerica Center for Retirement Studies®
This compendium serves as a follow-up to the December 2015 report, The Current State of Retirement: Pre-Retiree Expectations and Retiree
Realities, which compares and contrasts the retirement outlook of age 50+ workers with the actual experiences of retirees. Please visit
www.transamericacenter.org to more information, infographics, and materials from the Survey of Retirees and 16th Annual Retirement
Survey. Follow TCRS on Twitter @TCRStudies.
Introduction
10
Detailed Findings
Life In Retirement
11
BASE: ALL QUALIFIED RESPONDENTSQ2780. How much do you agree or disagree with the following statements?
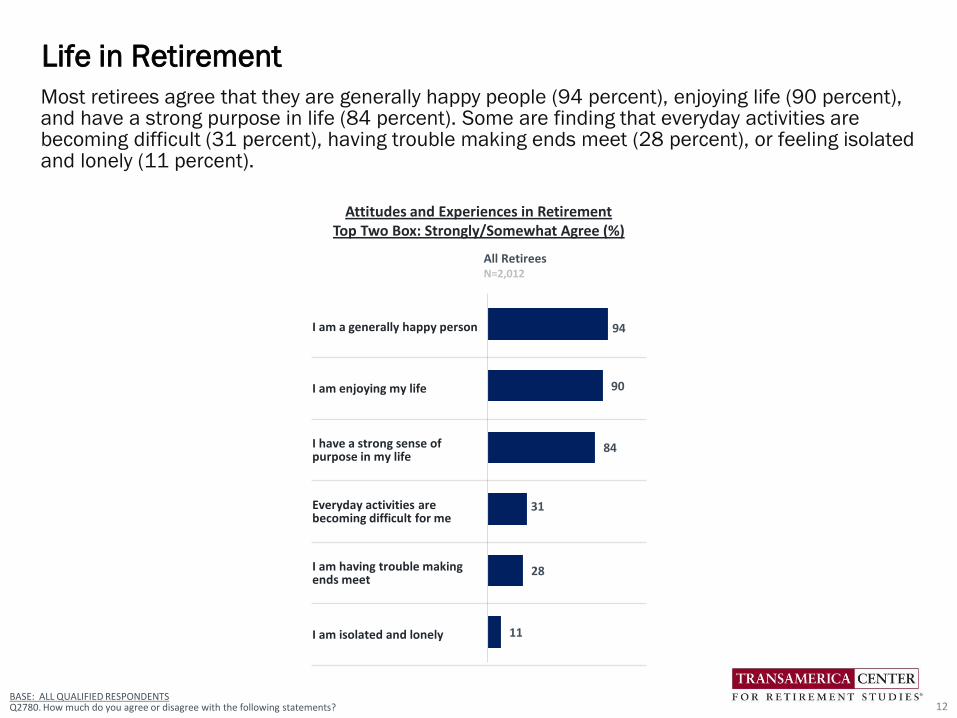
Most retirees agree that they are generally happy people (94 percent), enjoying life (90 percent), and have a strong purpose in life (84 percent). Some are finding that everyday activities are becoming difficult (31 percent), having trouble making ends meet (28 percent), or feeling isolated and lonely (11 percent).
Life in Retirement
12
All RetireesN=2,012
I am a generally happy person
I am enjoying my life
I have a strong sense of purpose in my life
Everyday activities are becoming difficult for me
I am having trouble making ends meet
I am isolated and lonely
94
90
84
31
28
11
Attitudes and Experiences in RetirementTop Two Box: Strongly/Somewhat Agree (%)
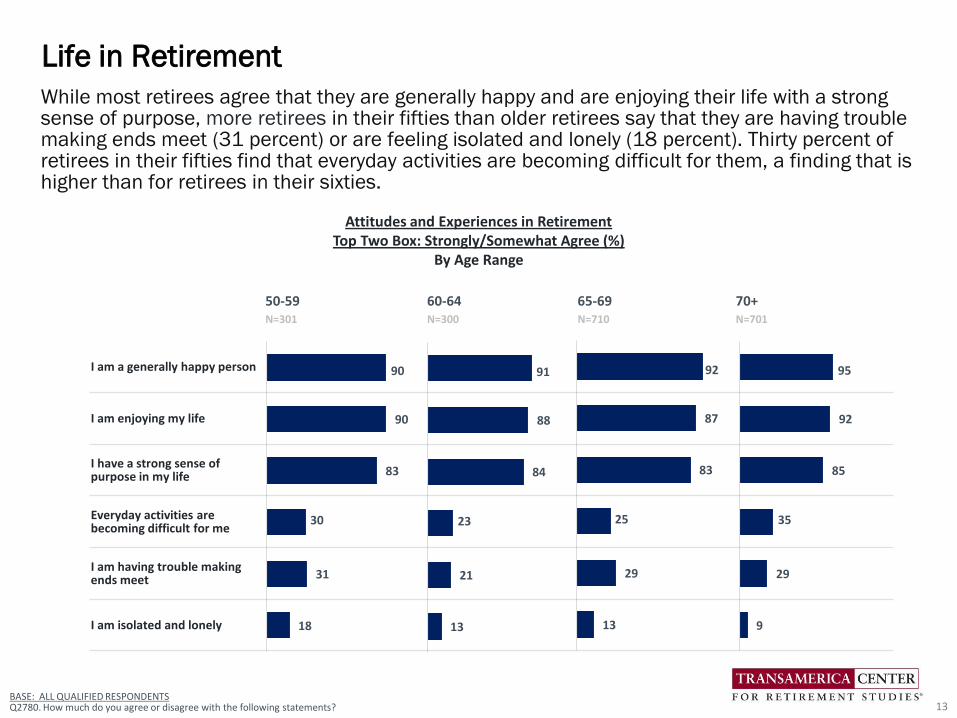
While most retirees agree that they are generally happy and are enjoying their life with a strong sense of purpose, more retirees in their fifties than older retirees say that they are having trouble making ends meet (31 percent) or are feeling isolated and lonely (18 percent). Thirty percent of retirees in their fifties find that everyday activities are becoming difficult for them, a finding that is higher than for retirees in their sixties.
Life in Retirement
13
50-59 60-64 65-69 70+N=301 N=300 N=710 N=701
I am a generally happy person
I am enjoying my life
I have a strong sense of purpose in my life
Everyday activities are becoming difficult for me
I am having trouble making ends meet
I am isolated and lonely
90
90
83
30
31
18
91
88
84
23
21
13
92
87
83
25
29
13
95
92
85
35
29
9
BASE: ALL QUALIFIED RESPONDENTSQ2780. How much do you agree or disagree with the following statements?
Attitudes and Experiences in RetirementTop Two Box: Strongly/Somewhat Agree (%)
By Age Range
Not Sure
All RetireesN=2,012
2
■ Decreased ■ Stayed the Same ■ Increased
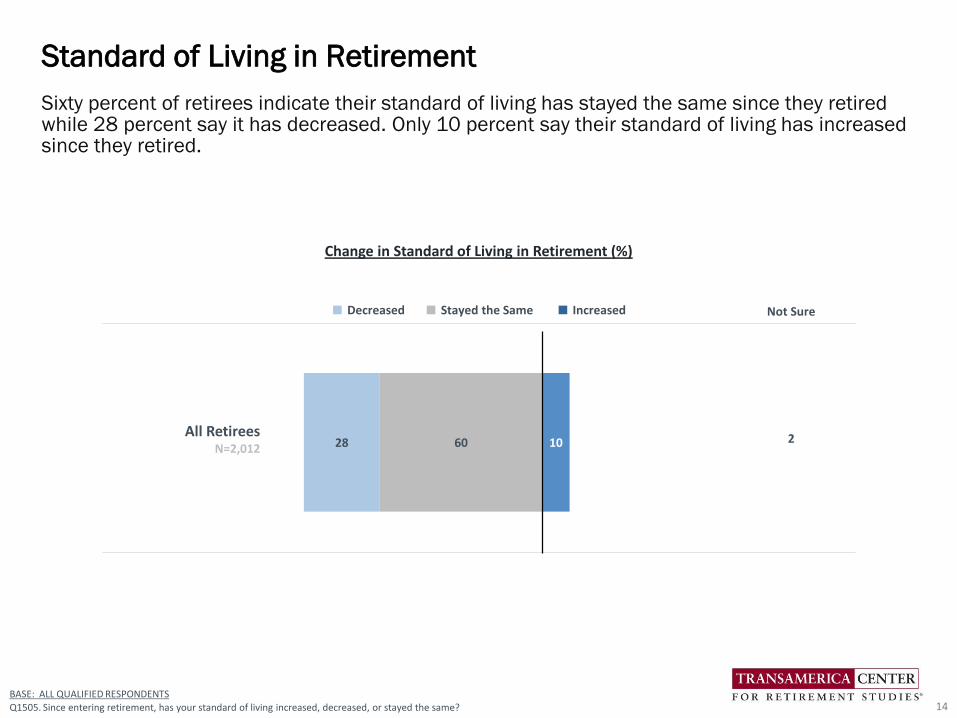
Sixty percent of retirees indicate their standard of living has stayed the same since they retired while 28 percent say it has decreased. Only 10 percent say their standard of living has increased since they retired.
Standard of Living in Retirement
14
6028 10
BASE: ALL QUALIFIED RESPONDENTS
Q1505. Since entering retirement, has your standard of living increased, decreased, or stayed the same?
Change in Standard of Living in Retirement (%)
Not Sure
50-59N=301
2
60-64N=300
1
65-69N=710
0
70+N=701
1
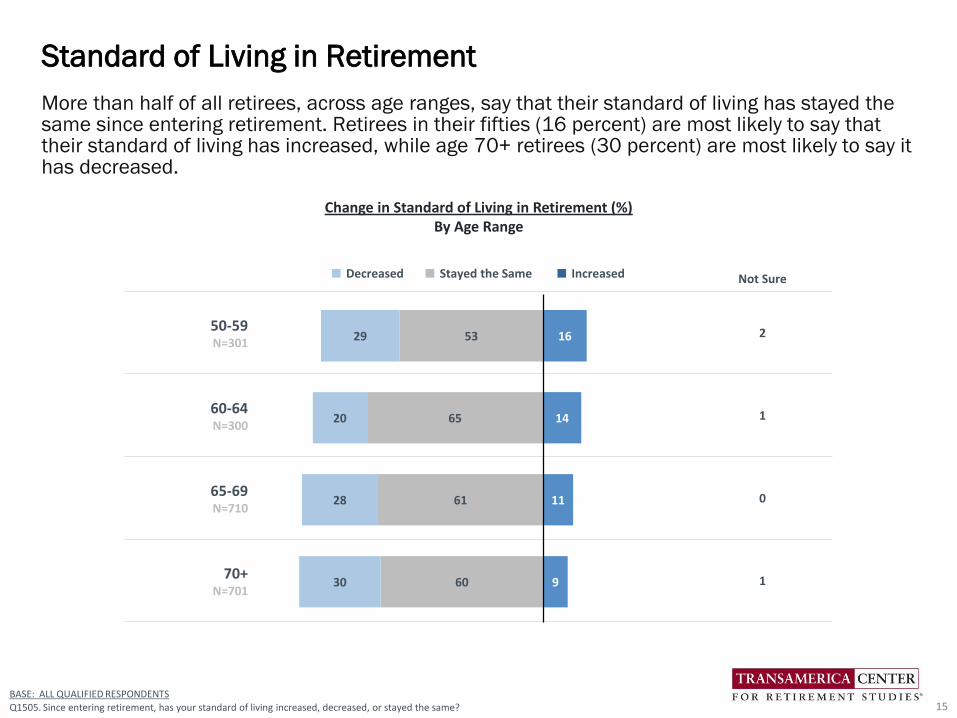
More than half of all retirees, across age ranges, say that their standard of living has stayed the same since entering retirement. Retirees in their fifties (16 percent) are most likely to say that their standard of living has increased, while age 70+ retirees (30 percent) are most likely to say it has decreased.
Standard of Living in Retirement
15
53
65
61
60
29
20
28
30
16
14
11
9
BASE: ALL QUALIFIED RESPONDENTS
Q1505. Since entering retirement, has your standard of living increased, decreased, or stayed the same?
Change in Standard of Living in Retirement (%)By Age Range
■ Decreased ■ Stayed the Same ■ Increased
BASE: ALL QUALIFIED RESPONDENTS
Q1500. Since entering retirement, has your enjoyment of life increased, decreased, or stayed the same?
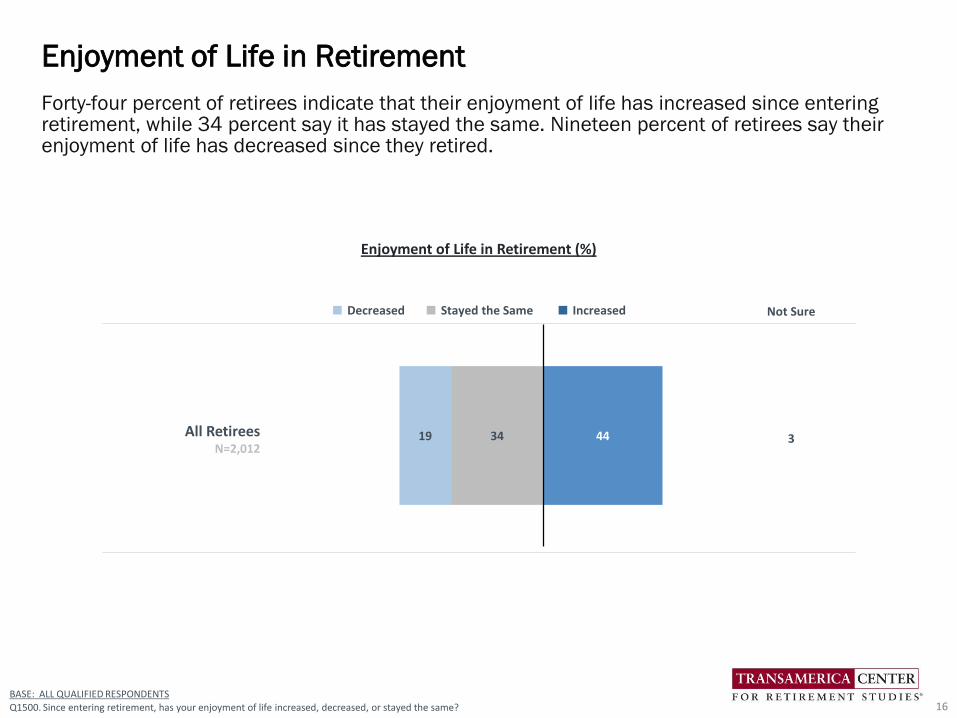
Forty-four percent of retirees indicate that their enjoyment of life has increased since entering retirement, while 34 percent say it has stayed the same. Nineteen percent of retirees say their enjoyment of life has decreased since they retired.
Enjoyment of Life in Retirement
16
3419 44
Enjoyment of Life in Retirement (%)
■ Decreased ■ Stayed the Same ■ Increased Not Sure
All RetireesN=2,012
3
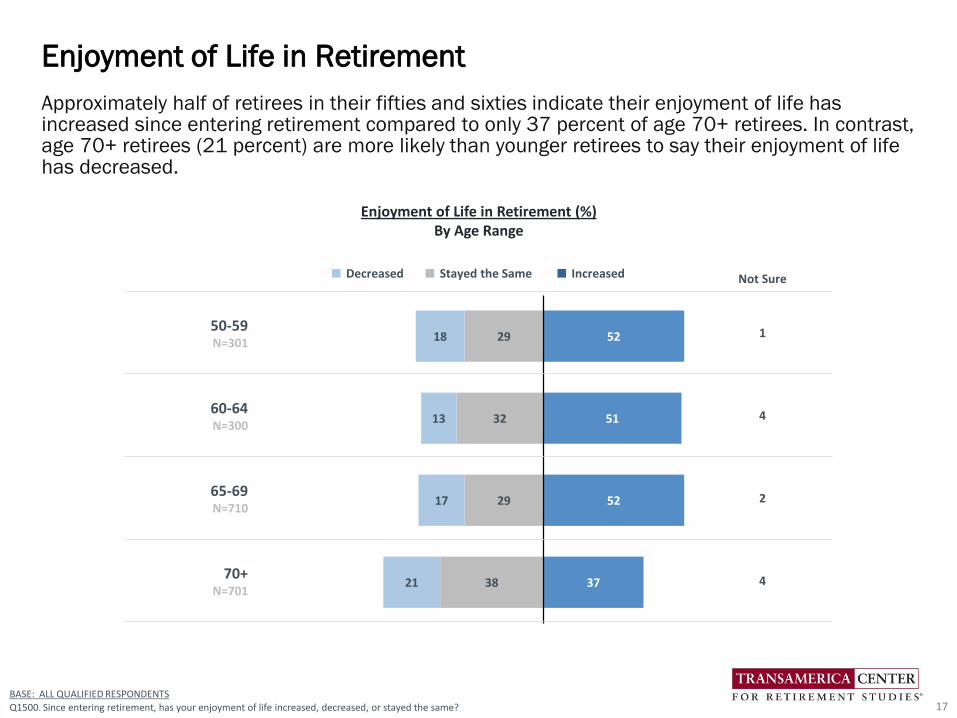
Approximately half of retirees in their fifties and sixties indicate their enjoyment of life has increased since entering retirement compared to only 37 percent of age 70+ retirees. In contrast, age 70+ retirees (21 percent) are more likely than younger retirees to say their enjoyment of life has decreased.
Enjoyment of Life in Retirement
17
29
32
29
38
18
13
17
21
52
51
52
37
BASE: ALL QUALIFIED RESPONDENTS
Q1500. Since entering retirement, has your enjoyment of life increased, decreased, or stayed the same?
Enjoyment of Life in Retirement (%)By Age Range
■ Decreased ■ Stayed the Same ■ Increased Not Sure
50-59N=301
1
60-64N=300
4
65-69N=710
2
70+N=701
4
All RetireesN=2,012
50-59N=301
60-64N=300
65-69N=710
70+N=701
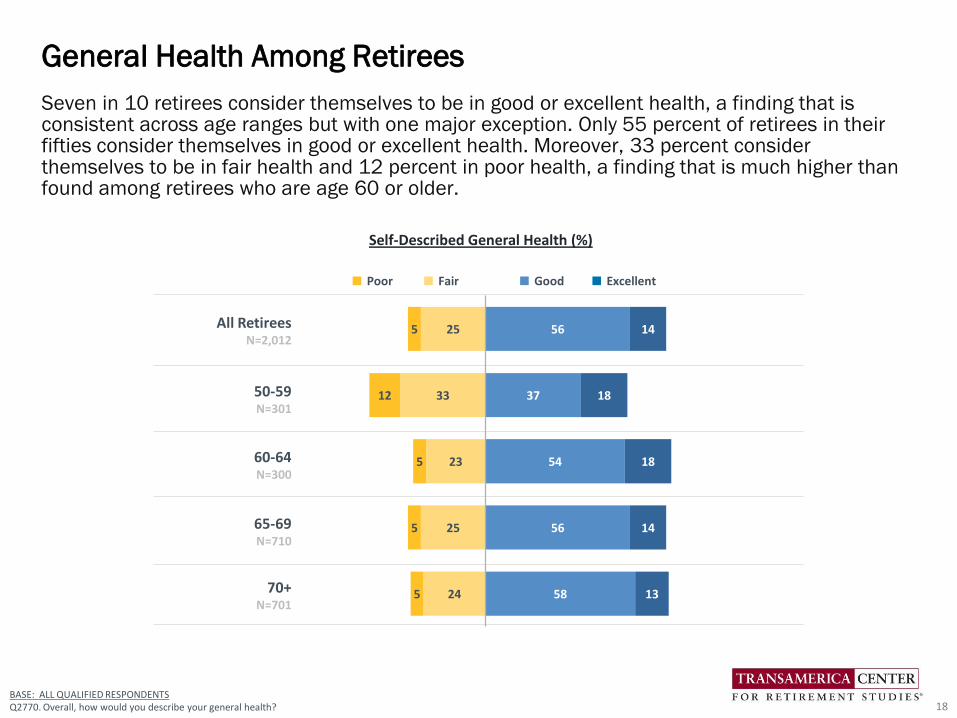
Seven in 10 retirees consider themselves to be in good or excellent health, a finding that is consistent across age ranges but with one major exception. Only 55 percent of retirees in their fifties consider themselves in good or excellent health. Moreover, 33 percent consider themselves to be in fair health and 12 percent in poor health, a finding that is much higher than found among retirees who are age 60 or older.
General Health Among Retirees
18BASE: ALL QUALIFIED RESPONDENTSQ2770. Overall, how would you describe your general health?
■ Poor ■ Fair ■ Good ■ Excellent
Self-Described General Health (%)
25
33
23
25
24
5
12
5
5
5
56
37
54
56
58
14
18
18
14
13
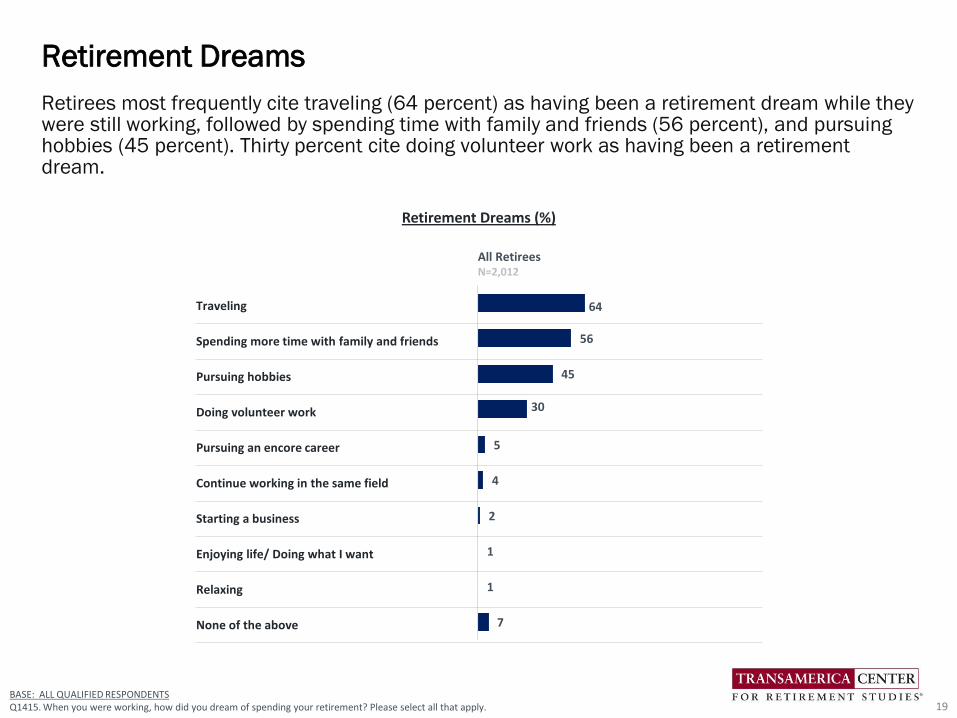
Retirees most frequently cite traveling (64 percent) as having been a retirement dream while they were still working, followed by spending time with family and friends (56 percent), and pursuing hobbies (45 percent). Thirty percent cite doing volunteer work as having been a retirement dream.
Retirement Dreams
19BASE: ALL QUALIFIED RESPONDENTSQ1415. When you were working, how did you dream of spending your retirement? Please select all that apply.
Retirement Dreams (%)
All RetireesN=2,012
Traveling
Spending more time with family and friends
Pursuing hobbies
Doing volunteer work
Pursuing an encore career
Continue working in the same field
Starting a business
Enjoying life/ Doing what I want
Relaxing
None of the above
64
56
45
30
5
4
2
1
1
7
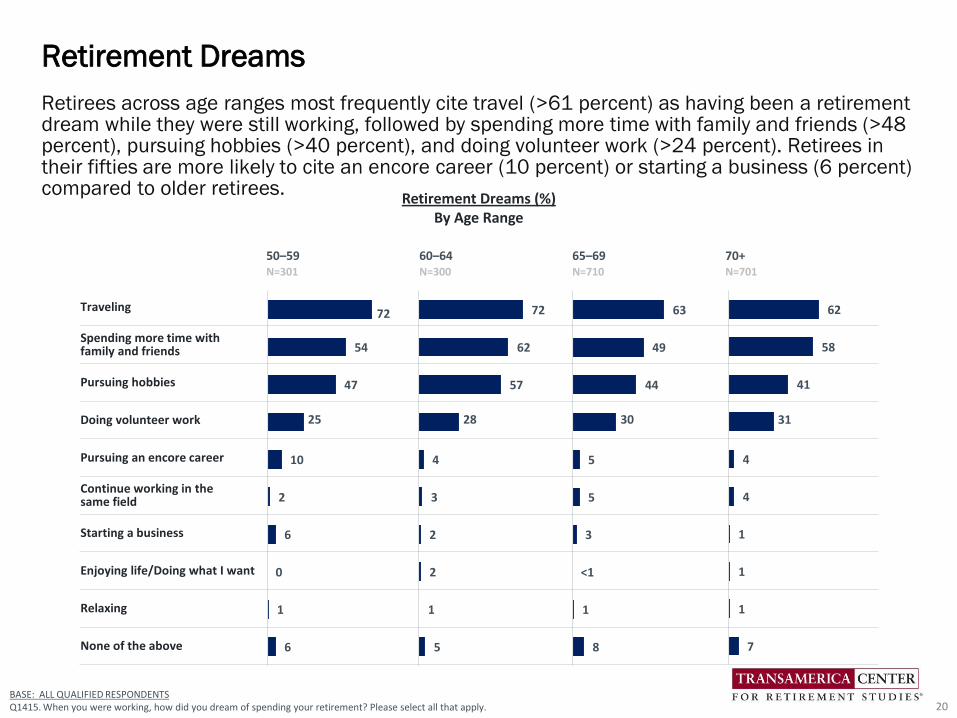
Retirees across age ranges most frequently cite travel (>61 percent) as having been a retirement dream while they were still working, followed by spending more time with family and friends (>48 percent), pursuing hobbies (>40 percent), and doing volunteer work (>24 percent). Retirees in their fifties are more likely to cite an encore career (10 percent) or starting a business (6 percent) compared to older retirees.
Retirement Dreams
20BASE: ALL QUALIFIED RESPONDENTSQ1415. When you were working, how did you dream of spending your retirement? Please select all that apply.
Retirement Dreams (%)By Age Range
50–59 60–64 65–69 70+N=301 N=300 N=710 N=701
Traveling
Spending more time with family and friends
Pursuing hobbies
Doing volunteer work
Pursuing an encore career
Continue working in the same field
Starting a business
Enjoying life/Doing what I want
Relaxing
None of the above
63
49
44
30
5
5
3
<1
1
8
62
58
41
31
4
4
1
1
1
7
72
62
57
28
4
3
2
2
1
5
72
54
47
25
10
2
6
0
1
6
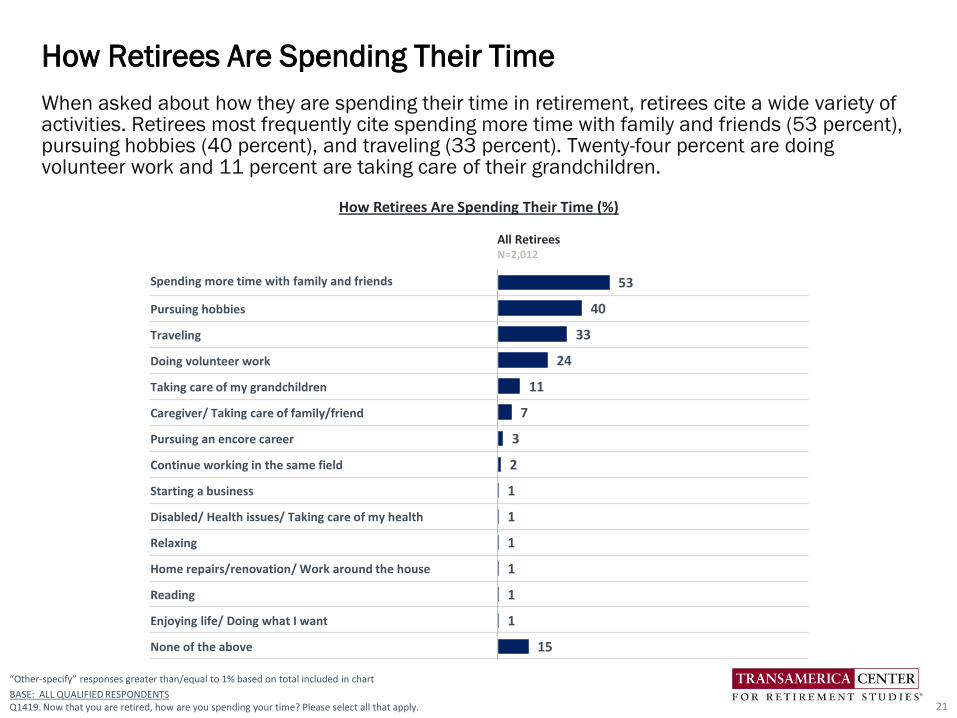
When asked about how they are spending their time in retirement, retirees cite a wide variety of activities. Retirees most frequently cite spending more time with family and friends (53 percent), pursuing hobbies (40 percent), and traveling (33 percent). Twenty-four percent are doing volunteer work and 11 percent are taking care of their grandchildren.
How Retirees Are Spending Their Time
21
“Other-specify” responses greater than/equal to 1% based on total included in chart
BASE: ALL QUALIFIED RESPONDENTSQ1419. Now that you are retired, how are you spending your time? Please select all that apply.
Spending more time with family and friends
Pursuing hobbies
Traveling
Doing volunteer work
Taking care of my grandchildren
Caregiver/ Taking care of family/friend
Pursuing an encore career
Continue working in the same field
Starting a business
Disabled/ Health issues/ Taking care of my health
Relaxing
Home repairs/renovation/ Work around the house
Reading
Enjoying life/ Doing what I want
None of the above
53
40
33
24
11
7
3
2
1
1
1
1
1
1
15
All RetireesN=2,012
How Retirees Are Spending Their Time (%)
Spending more time with family and friends
Pursuing hobbies
Traveling
Doing volunteer work
Taking care of my grandchildren
Caregiver/ Taking care of family/friend
Pursuing an encore career
Continue working in the same field
Starting a business
Disabled/ Health issues/ Taking care of my health
Relaxing
Home repairs/renovation/ Work around the house
Reading
Enjoying life/ Doing what I want
None of the above
55
51
41
19
9
12
8
1
2
2
<1
1
0
0
12
50–59N=301
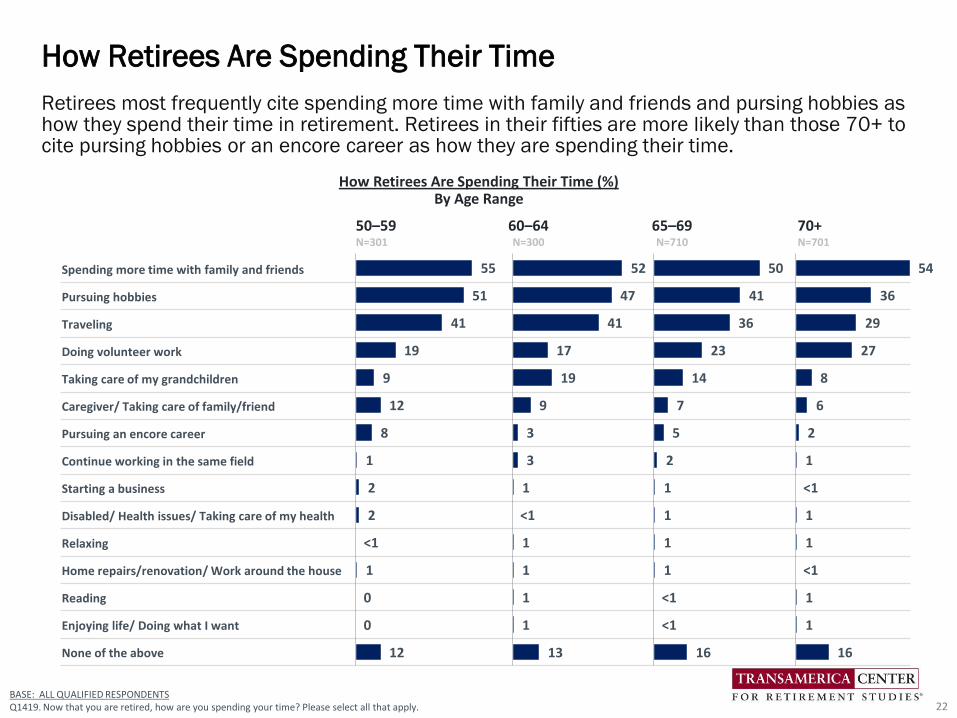
Retirees most frequently cite spending more time with family and friends and pursing hobbies as how they spend their time in retirement. Retirees in their fifties are more likely than those 70+ to cite pursing hobbies or an encore career as how they are spending their time.
How Retirees Are Spending Their Time
22BASE: ALL QUALIFIED RESPONDENTSQ1419. Now that you are retired, how are you spending your time? Please select all that apply.
60–64N=300
65–69N=710
70+N=701
52
47
41
17
19
9
3
3
1
<1
1
1
1
1
13
50
41
36
23
14
7
5
2
1
1
1
1
<1
<1
16
How Retirees Are Spending Their Time (%)By Age Range
54
36
29
27
8
6
2
1
<1
1
1
<1
1
1
16
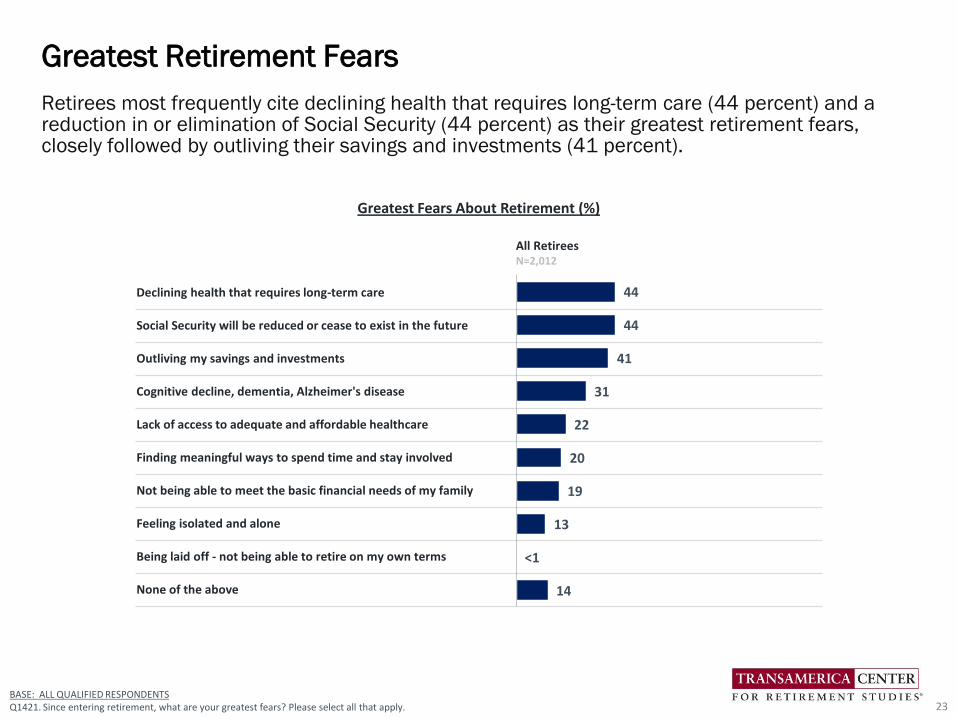
Retirees most frequently cite declining health that requires long-term care (44 percent) and a reduction in or elimination of Social Security (44 percent) as their greatest retirement fears, closely followed by outliving their savings and investments (41 percent).
Greatest Retirement Fears
23
Declining health that requires long-term care
Social Security will be reduced or cease to exist in the future
Outliving my savings and investments
Cognitive decline, dementia, Alzheimer's disease
Lack of access to adequate and affordable healthcare
Finding meaningful ways to spend time and stay involved
Not being able to meet the basic financial needs of my family
Feeling isolated and alone
Being laid off - not being able to retire on my own terms
None of the above
44
44
41
31
22
20
19
13
<1
14
All RetireesN=2,012
BASE: ALL QUALIFIED RESPONDENTSQ1421. Since entering retirement, what are your greatest fears? Please select all that apply.
Greatest Fears About Retirement (%)
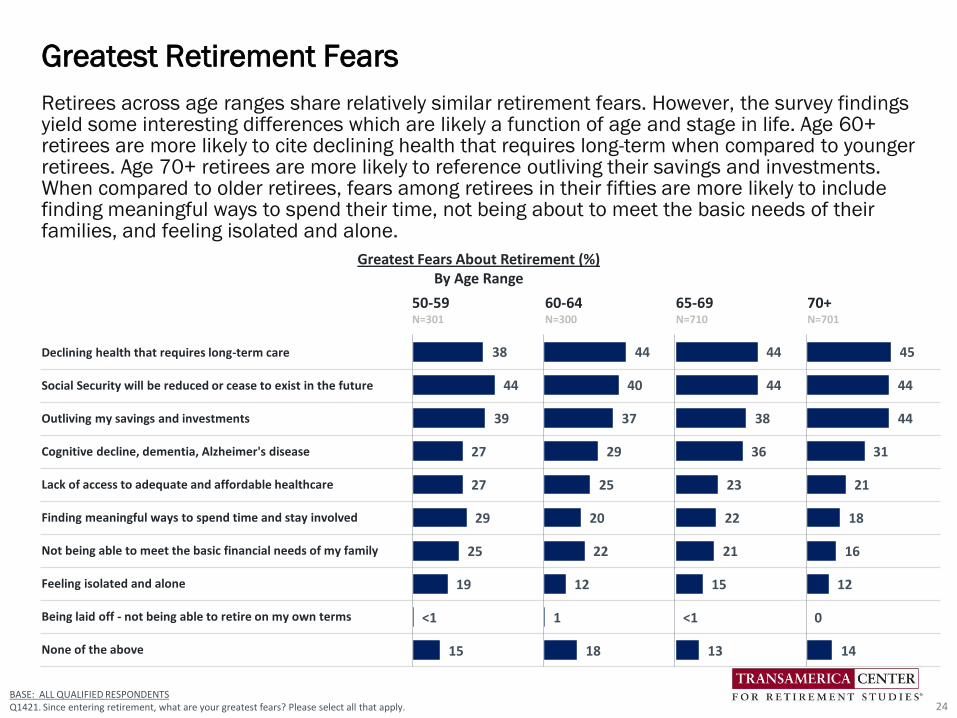
Retirees across age ranges share relatively similar retirement fears. However, the survey findings yield some interesting differences which are likely a function of age and stage in life. Age 60+ retirees are more likely to cite declining health that requires long-term when compared to younger retirees. Age 70+ retirees are more likely to reference outliving their savings and investments. When compared to older retirees, fears among retirees in their fifties are more likely to include finding meaningful ways to spend their time, not being about to meet the basic needs of their families, and feeling isolated and alone.
Greatest Retirement Fears
24
Declining health that requires long-term care
Social Security will be reduced or cease to exist in the future
Outliving my savings and investments
Cognitive decline, dementia, Alzheimer's disease
Lack of access to adequate and affordable healthcare
Finding meaningful ways to spend time and stay involved
Not being able to meet the basic financial needs of my family
Feeling isolated and alone
Being laid off - not being able to retire on my own terms
None of the above
38
44
39
27
27
29
25
19
<1
15
44
40
37
29
25
20
22
12
1
18
44
44
38
36
23
22
21
15
<1
13
45
44
44
31
21
18
16
12
0
14
50-59N=301
60-64N=300
65-69N=710
70+N=701
BASE: ALL QUALIFIED RESPONDENTSQ1421. Since entering retirement, what are your greatest fears? Please select all that apply.
Greatest Fears About Retirement (%)By Age Range
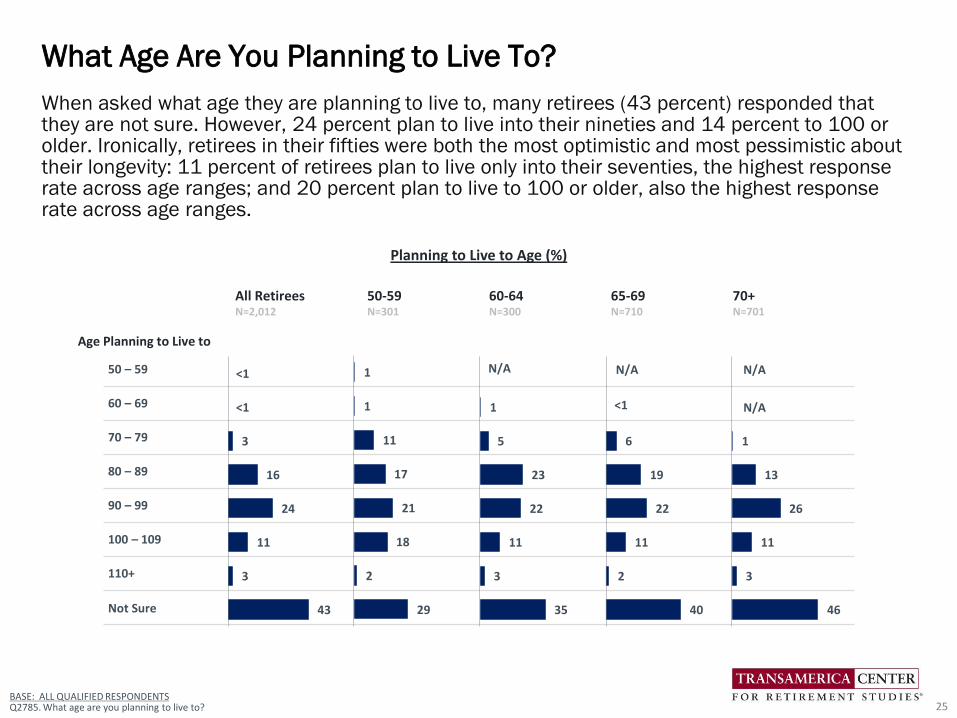
When asked what age they are planning to live to, many retirees (43 percent) responded that they are not sure. However, 24 percent plan to live into their nineties and 14 percent to 100 or older. Ironically, retirees in their fifties were both the most optimistic and most pessimistic about their longevity: 11 percent of retirees plan to live only into their seventies, the highest response rate across age ranges; and 20 percent plan to live to 100 or older, also the highest response rate across age ranges.
What Age Are You Planning to Live To?
25BASE: ALL QUALIFIED RESPONDENTSQ2785. What age are you planning to live to?
All RetireesN=2,012
50-59N=301
60-64N=300
65-69N=710
70+N=701
50 – 59
60 – 69
70 – 79
80 – 89
90 – 99
100 – 109
110+
Not Sure
Planning to Live to Age (%)
1
1
11
17
21
18
2
29
1
5
23
22
11
3
35
6
19
22
11
2
40
1
13
26
11
3
46
N/A N/A
<1
N/A
N/A
<1
<1
3
16
24
11
3
43
Age Planning to Live to
Downsize into a smaller home
Reduce expenses
Start a new chapter in life
Move closer to family and friends
Move into an aging-friendly home
Became widowed
Move into a larger home
Get divorced or separated
Get married or finding new partner
Need care or assisted living
Other
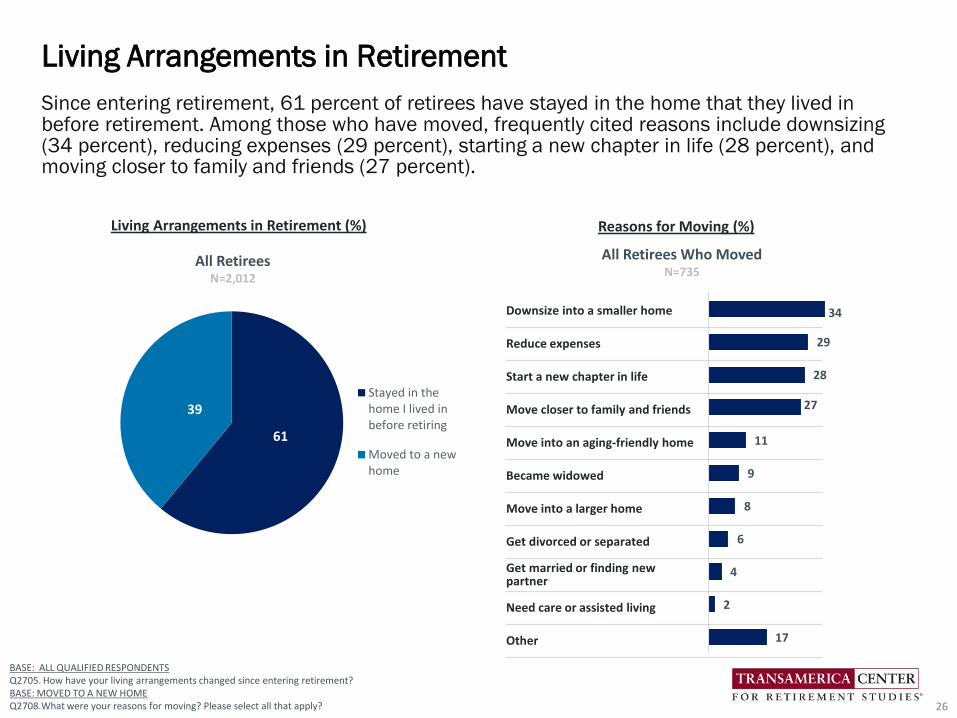
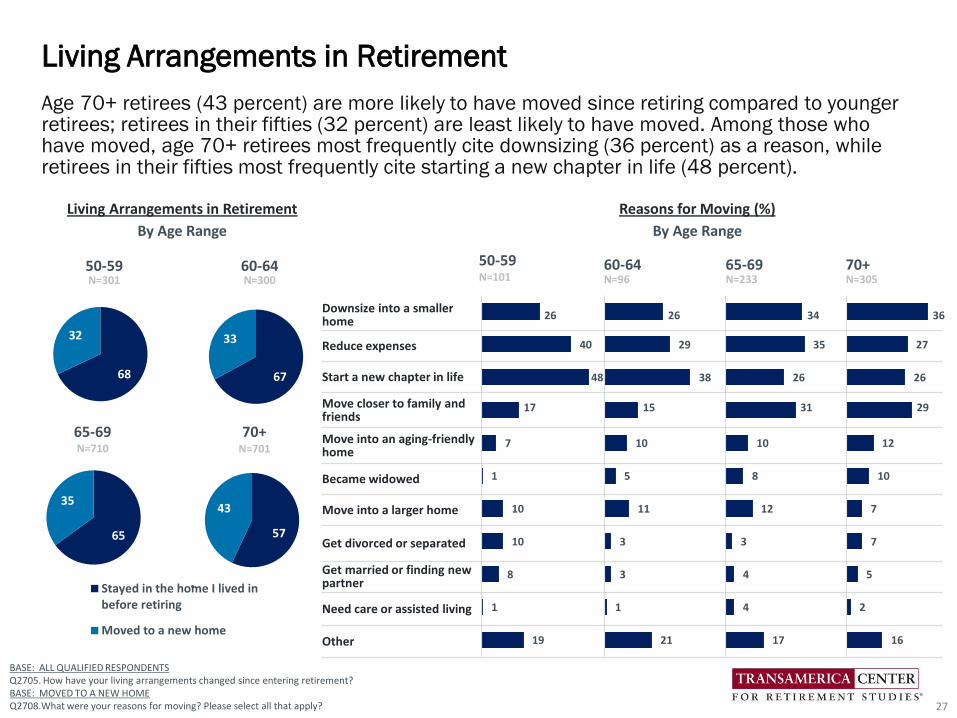
Since entering retirement, 61 percent of retirees have stayed in the home that they lived in before retirement. Among those who have moved, frequently cited reasons include downsizing (34 percent), reducing expenses (29 percent), starting a new chapter in life (28 percent), and moving closer to family and friends (27 percent).
Living Arrangements in Retirement
26
BASE: ALL QUALIFIED RESPONDENTSQ2705. How have your living arrangements changed since entering retirement?BASE: MOVED TO A NEW HOMEQ2708.What were your reasons for moving? Please select all that apply?
61
39Stayed in thehome I lived inbefore retiring
Moved to a newhome
Living Arrangements in Retirement (%)
All Retirees N=2,012
34
29
28
27
11
9
8
6
4
2
17
Reasons for Moving (%)
All Retirees Who Moved N=735
67
33
Age 70+ retirees (43 percent) are more likely to have moved since retiring compared to younger retirees; retirees in their fifties (32 percent) are least likely to have moved. Among those who have moved, age 70+ retirees most frequently cite downsizing (36 percent) as a reason, while retirees in their fifties most frequently cite starting a new chapter in life (48 percent).
Living Arrangements in Retirement
27
Living Arrangements in Retirement
By Age Range
68
32
65-69 70+N=710
Stayed in the home I lived inbefore retiring
Moved to a new home
65
35
57
43
50-59N=101
60-64N=96
65-69N=233
70+N=305
Downsize into a smaller home
Reduce expenses
Start a new chapter in life
Move closer to family and friends
Move into an aging-friendly home
Became widowed
Move into a larger home
Get divorced or separated
Get married or finding new partner
Need care or assisted living
Other
26
40
48
17
7
1
10
10
8
1
19
26
29
38
15
10
5
11
3
3
1
21
34
35
26
31
10
8
12
3
4
4
17
36
27
26
29
12
10
7
7
5
2
16
Reasons for Moving (%)
By Age Range
N=701
50-59 60-64N=300N=301
BASE: ALL QUALIFIED RESPONDENTSQ2705. How have your living arrangements changed since entering retirement?BASE: MOVED TO A NEW HOMEQ2708.What were your reasons for moving? Please select all that apply?
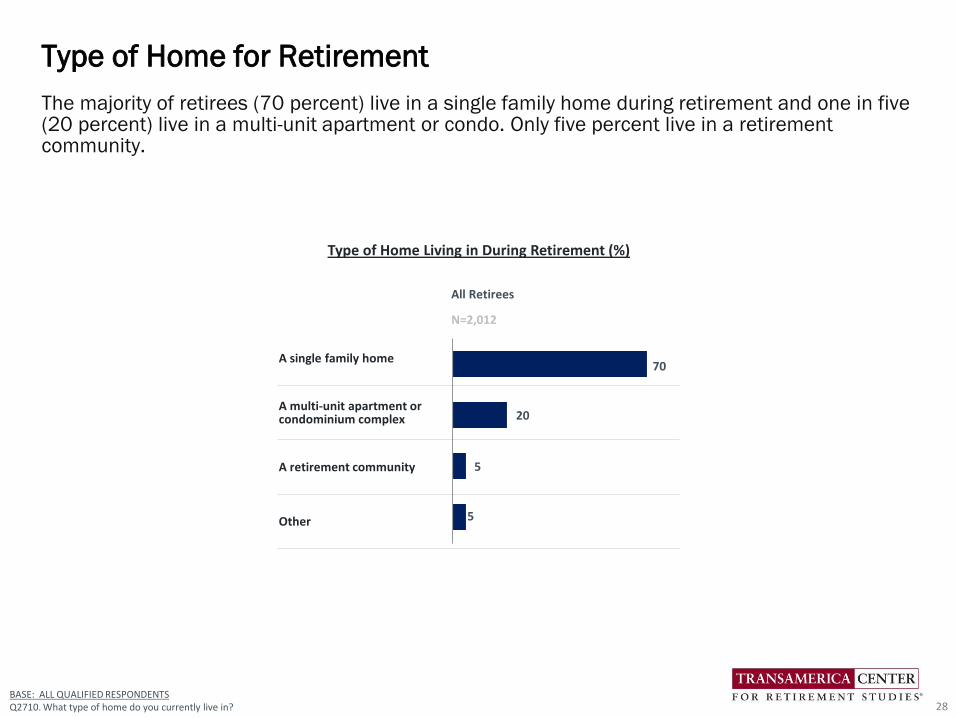
The majority of retirees (70 percent) live in a single family home during retirement and one in five (20 percent) live in a multi-unit apartment or condo. Only five percent live in a retirement community.
Type of Home for Retirement
28BASE: ALL QUALIFIED RESPONDENTSQ2710. What type of home do you currently live in?
All Retirees
N=2,012
A single family home
A multi-unit apartment or condominium complex
A retirement community
Other
Type of Home Living in During Retirement (%)
70
20
5
5
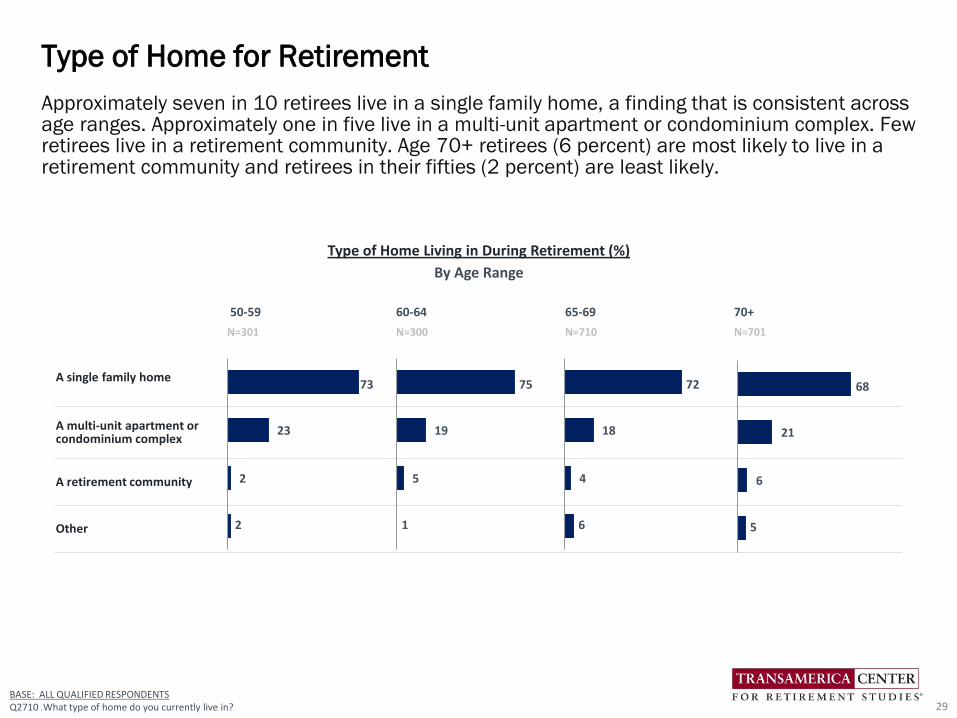
Approximately seven in 10 retirees live in a single family home, a finding that is consistent across age ranges. Approximately one in five live in a multi-unit apartment or condominium complex. Few retirees live in a retirement community. Age 70+ retirees (6 percent) are most likely to live in a retirement community and retirees in their fifties (2 percent) are least likely.
Type of Home for Retirement
29BASE: ALL QUALIFIED RESPONDENTSQ2710 .What type of home do you currently live in?
50-59 60-64 65-69 70+
N=301 N=300 N=710 N=701
A single family home
A multi-unit apartment or condominium complex
A retirement community
Other
73
23
2
2
Type of Home Living in During Retirement (%)
By Age Range
75
19
5
1
72
18
4
6
68
21
6
5
BASE: ALL QUALIFIED RESPONDENTSQ2712. Do you own or rent your home?
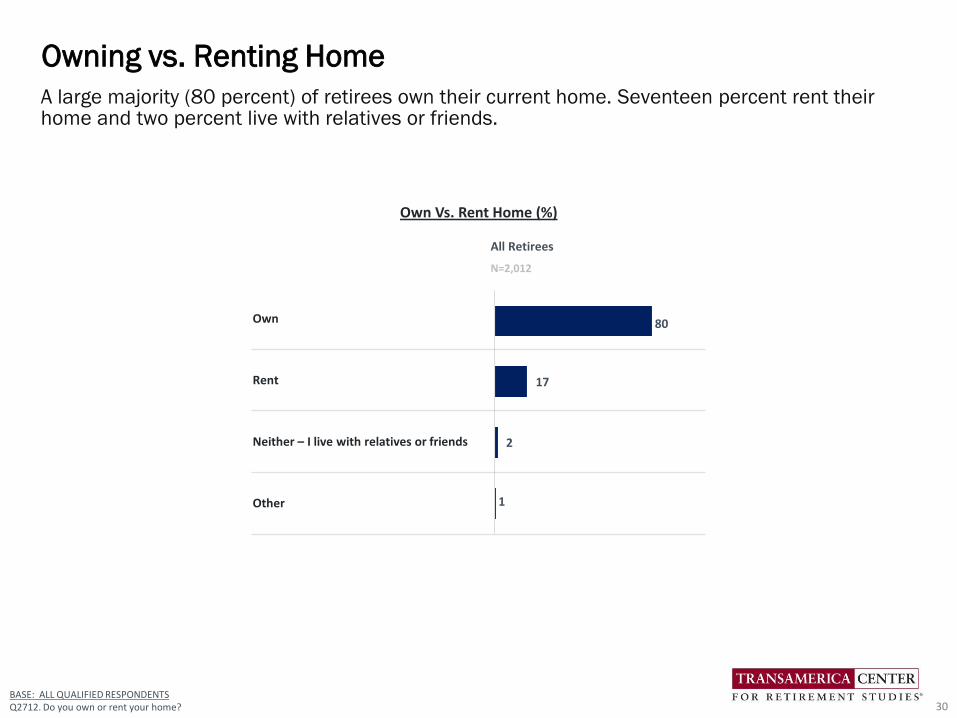
A large majority (80 percent) of retirees own their current home. Seventeen percent rent their home and two percent live with relatives or friends.
Owning vs. Renting Home
30
All Retirees
N=2,012
Own
Rent
Neither – I live with relatives or friends
Other
80
17
2
1
Own Vs. Rent Home (%)
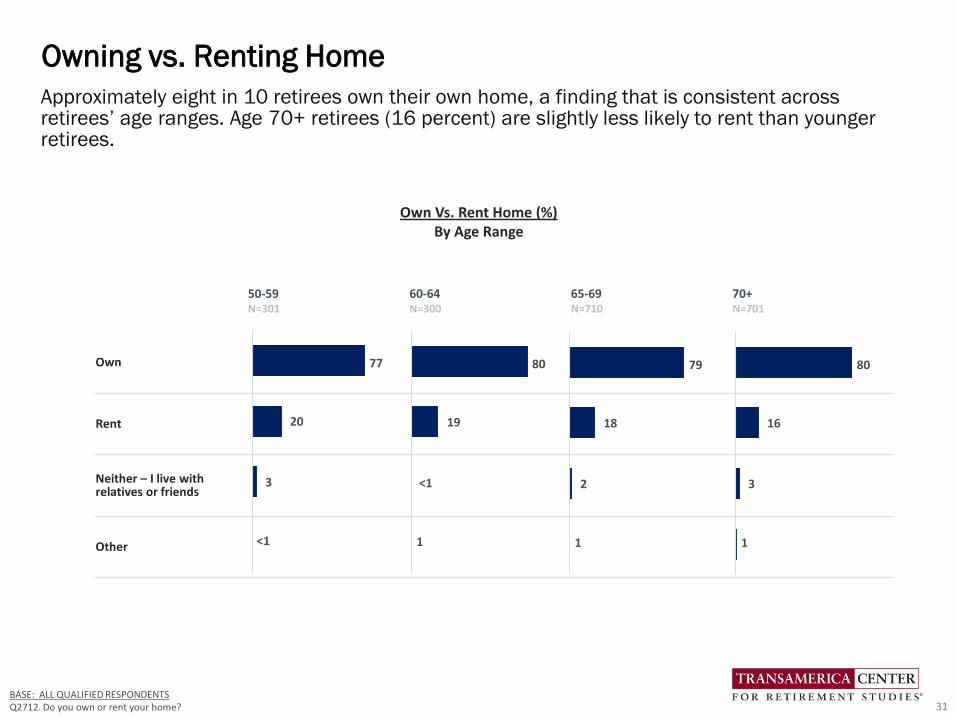
Approximately eight in 10 retirees own their own home, a finding that is consistent across retirees’ age ranges. Age 70+ retirees (16 percent) are slightly less likely to rent than younger retirees.
Owning vs. Renting Home
31
50-59 60-64 65-69 70+N=301 N=300 N=710 N=701
Own
Rent
Neither – I live with relatives or friends
Other
77
20
3
<1
80
19
<1
1
79
18
2
1
80
16
3
1
BASE: ALL QUALIFIED RESPONDENTSQ2712. Do you own or rent your home?
Own Vs. Rent Home (%)By Age Range
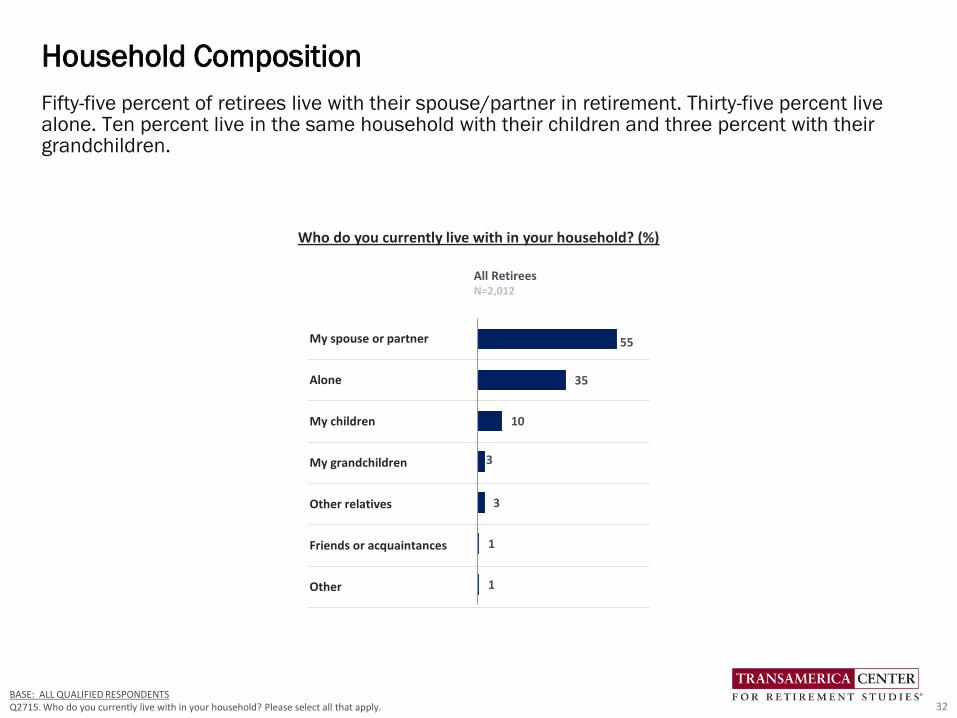
Fifty-five percent of retirees live with their spouse/partner in retirement. Thirty-five percent live alone. Ten percent live in the same household with their children and three percent with their grandchildren.
Household Composition
32BASE: ALL QUALIFIED RESPONDENTSQ2715. Who do you currently live with in your household? Please select all that apply.
All RetireesN=2,012
My spouse or partner
Alone
My children
My grandchildren
Other relatives
Friends or acquaintances
Other
Who do you currently live with in your household? (%)
55
35
10
3
3
1
1
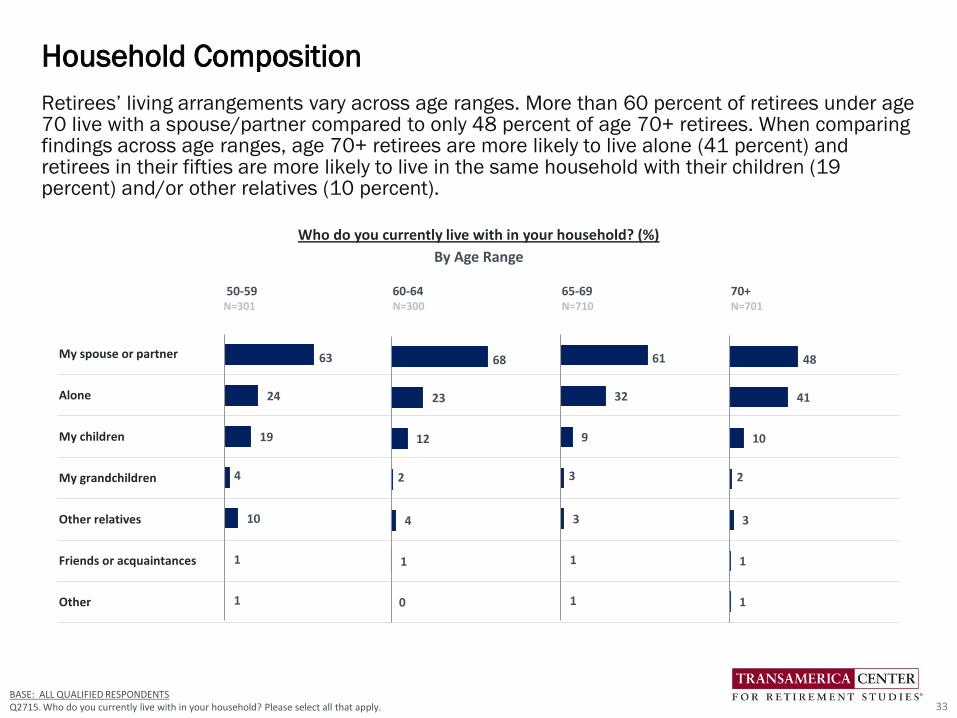
Retirees’ living arrangements vary across age ranges. More than 60 percent of retirees under age 70 live with a spouse/partner compared to only 48 percent of age 70+ retirees. When comparing findings across age ranges, age 70+ retirees are more likely to live alone (41 percent) and retirees in their fifties are more likely to live in the same household with their children (19 percent) and/or other relatives (10 percent).
Household Composition
33BASE: ALL QUALIFIED RESPONDENTSQ2715. Who do you currently live with in your household? Please select all that apply.
50-59 60-64 65-69 70+N=301 N=300 N=710 N=701
My spouse or partner
Alone
My children
My grandchildren
Other relatives
Friends or acquaintances
Other
63
24
19
4
10
1
1
Who do you currently live with in your household? (%)
By Age Range
68
23
12
2
4
1
0
61
32
9
3
3
1
1
48
41
10
2
3
1
1
All RetireesN=2,012
Affordable cost of living
Close to family and friends
Access to excellent healthcare and hospitals
Low crime rate
Good weather
Leisure and recreational activities
A walkable community with easy access to retailers and amenities
Cultural activities and events
Convenient transportation
Community engagement or volunteer opportunities including churches and charitable organizationsAccess to continuing education at nearby schools, universities, and educational resources
Employment opportunities
Other
None of the above
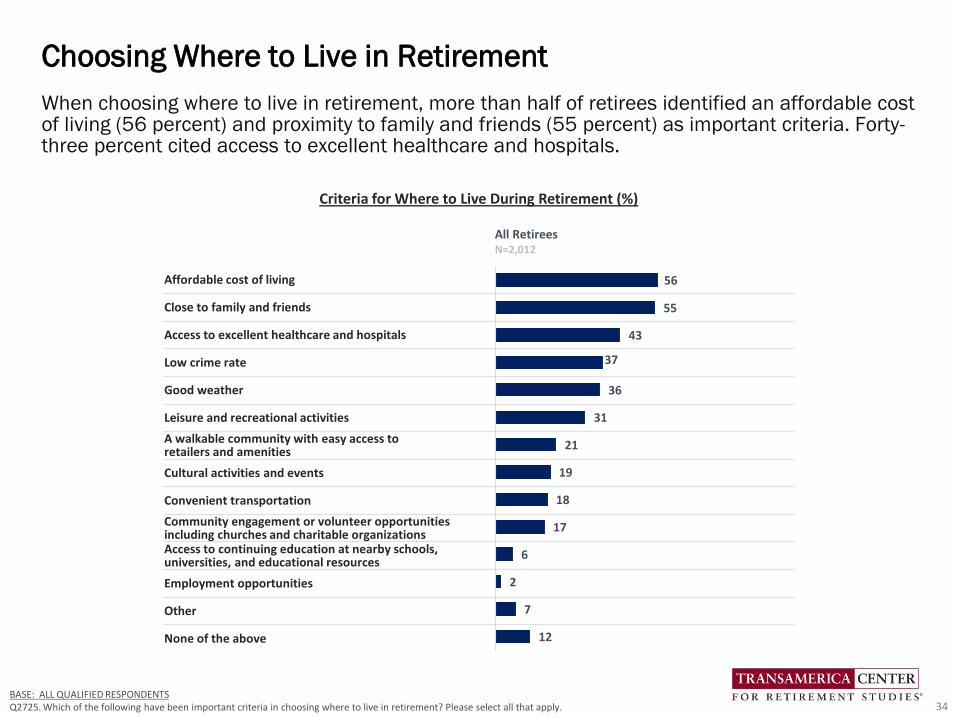
When choosing where to live in retirement, more than half of retirees identified an affordable cost of living (56 percent) and proximity to family and friends (55 percent) as important criteria. Forty-three percent cited access to excellent healthcare and hospitals.
Choosing Where to Live in Retirement
34BASE: ALL QUALIFIED RESPONDENTSQ2725. Which of the following have been important criteria in choosing where to live in retirement? Please select all that apply.
56
55
43
37
36
31
21
19
18
17
6
2
7
12
Criteria for Where to Live During Retirement (%)
50-59 60-64 65-69 70+N=301 N=300 N=710 N=701
Affordable cost of living
Close to family and friends
Access to excellent healthcare and hospitals
Low crime rate
Good weather
Leisure and recreational activities
A walkable community with easy access to retailers and amenities
Cultural activities and events
Convenient transportation
Community engagement or volunteer opportunities including churches and charitable organizationsAccess to continuing education at nearby schools, universities, and educational resources
Employment opportunities
Other
None of the above
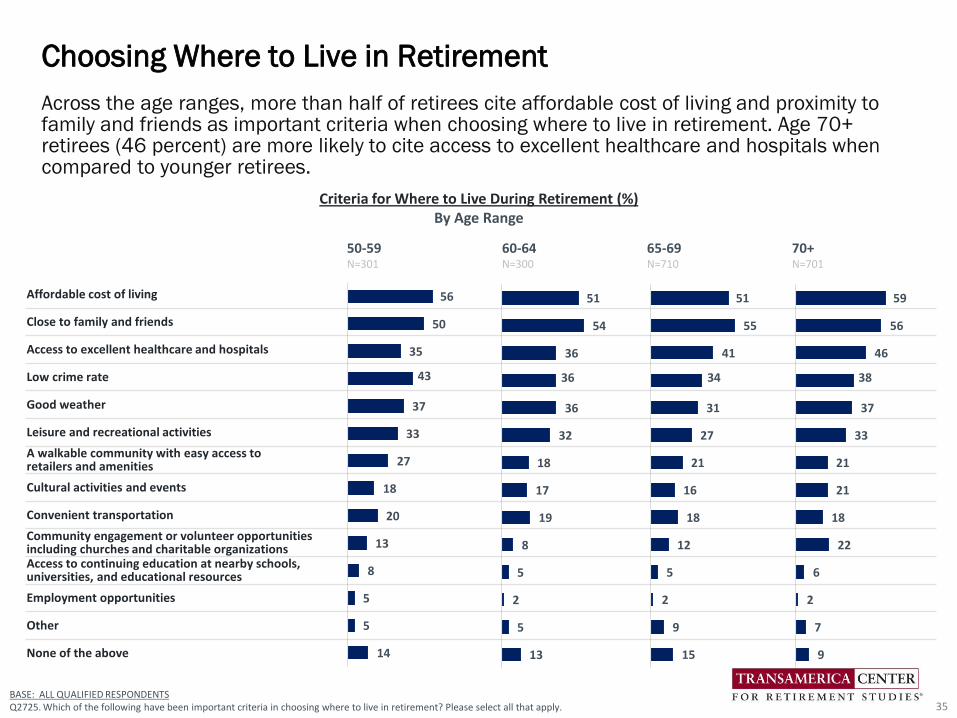
Across the age ranges, more than half of retirees cite affordable cost of living and proximity to family and friends as important criteria when choosing where to live in retirement. Age 70+ retirees (46 percent) are more likely to cite access to excellent healthcare and hospitals when compared to younger retirees.
Choosing Where to Live in Retirement
35BASE: ALL QUALIFIED RESPONDENTSQ2725. Which of the following have been important criteria in choosing where to live in retirement? Please select all that apply.
56
50
35
43
37
33
27
18
20
13
8
5
5
14
Criteria for Where to Live During Retirement (%)By Age Range
51
54
36
36
36
32
18
17
19
8
5
2
5
13
51
55
41
34
31
27
21
16
18
12
5
2
9
15
59
56
46
38
37
33
21
21
18
22
6
2
7
9
Detailed Findings
How Retirement Happened
36
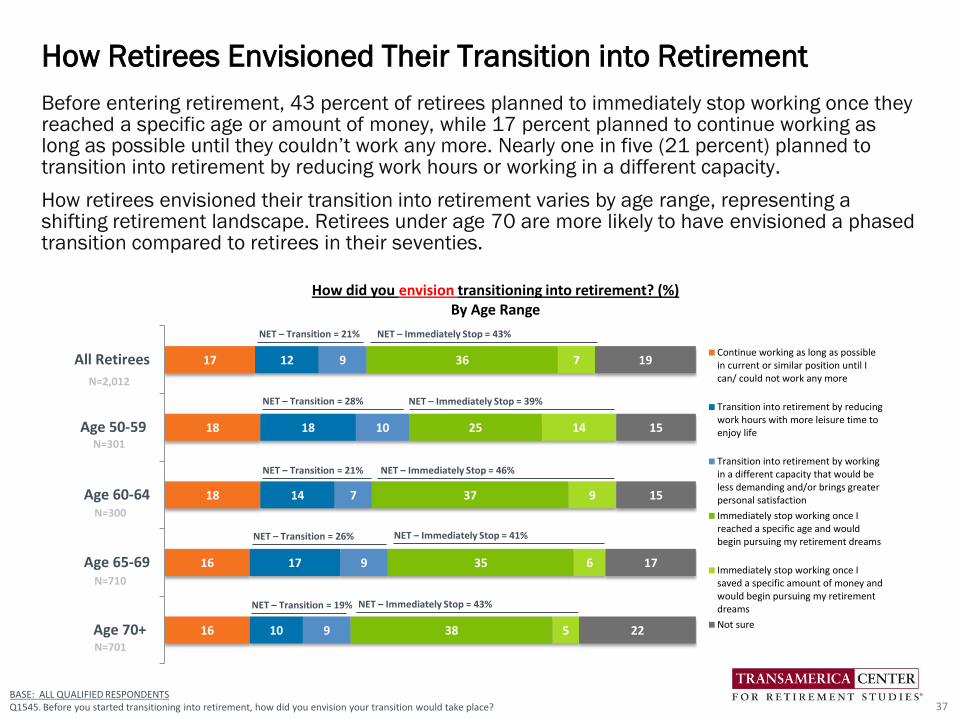
Before entering retirement, 43 percent of retirees planned to immediately stop working once they reached a specific age or amount of money, while 17 percent planned to continue working as long as possible until they couldn’t work any more. Nearly one in five (21 percent) planned to transition into retirement by reducing work hours or working in a different capacity.
How retirees envisioned their transition into retirement varies by age range, representing a shifting retirement landscape. Retirees under age 70 are more likely to have envisioned a phased transition compared to retirees in their seventies.
How Retirees Envisioned Their Transition into Retirement
37
17
18
18
16
16
12
18
14
17
10
9
10
7
9
9
36
25
37
35
38
7
14
9
6
5
19
15
15
17
22
All Retirees
Age 50-59
Age 60-64
Age 65-69
Age 70+
How did you envision transitioning into retirement? (%)By Age Range
Continue working as long as possiblein current or similar position until Ican/ could not work any more
Transition into retirement by reducingwork hours with more leisure time toenjoy life
Transition into retirement by workingin a different capacity that would beless demanding and/or brings greaterpersonal satisfaction
Immediately stop working once Ireached a specific age and wouldbegin pursuing my retirement dreams
Immediately stop working once Isaved a specific amount of money andwould begin pursuing my retirementdreams
Not sure
BASE: ALL QUALIFIED RESPONDENTSQ1545. Before you started transitioning into retirement, how did you envision your transition would take place?
NET – Transition = 21% NET – Immediately Stop = 46%
NET – Transition = 28% NET – Immediately Stop = 39%
NET – Transition = 26% NET – Immediately Stop = 41%
NET – Transition = 19% NET – Immediately Stop = 43%
N=301
N=300
N=710
N=701
N=2,012
NET – Transition = 21% NET – Immediately Stop = 43%
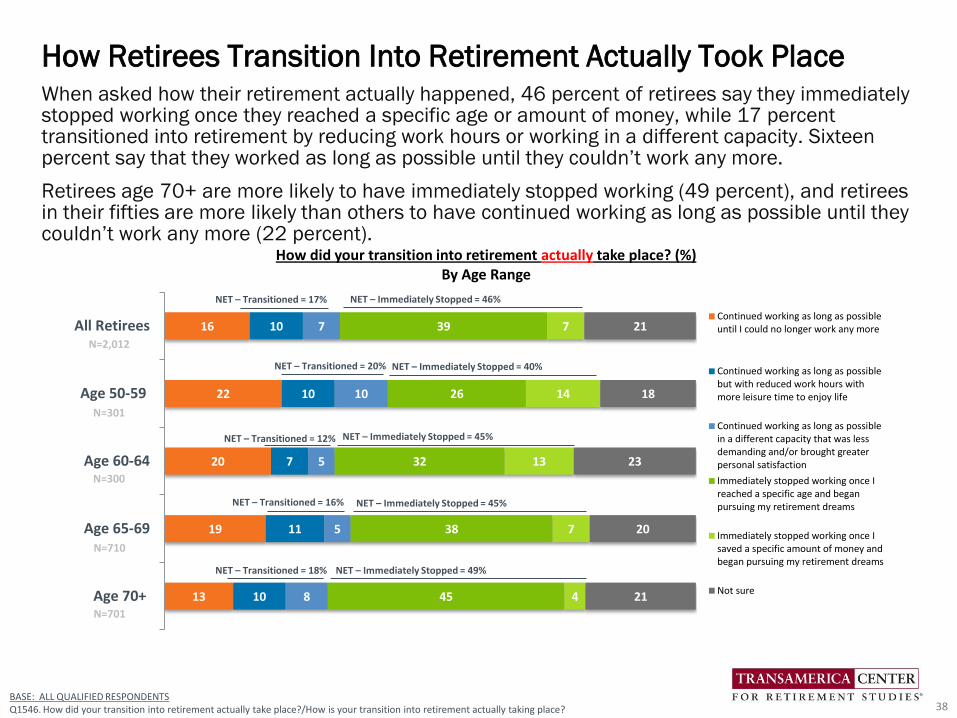
When asked how their retirement actually happened, 46 percent of retirees say they immediately stopped working once they reached a specific age or amount of money, while 17 percent transitioned into retirement by reducing work hours or working in a different capacity. Sixteen percent say that they worked as long as possible until they couldn’t work any more.
Retirees age 70+ are more likely to have immediately stopped working (49 percent), and retirees in their fifties are more likely than others to have continued working as long as possible until they couldn’t work any more (22 percent).
How Retirees Transition Into Retirement Actually Took Place
38
16
22
20
19
13
10
10
7
11
10
7
10
5
5
8
39
26
32
38
45
7
14
13
7
4
21
18
23
20
21
All Retirees
Age 50-59
Age 60-64
Age 65-69
Age 70+
How did your transition into retirement actually take place? (%)By Age Range
Continued working as long as possibleuntil I could no longer work any more
Continued working as long as possiblebut with reduced work hours withmore leisure time to enjoy life
Continued working as long as possiblein a different capacity that was lessdemanding and/or brought greaterpersonal satisfaction
Immediately stopped working once Ireached a specific age and beganpursuing my retirement dreams
Immediately stopped working once Isaved a specific amount of money andbegan pursuing my retirement dreams
Not sure
NET – Transitioned = 12% NET – Immediately Stopped = 45%
NET – Transitioned = 20% NET – Immediately Stopped = 40%
NET – Transitioned = 16% NET – Immediately Stopped = 45%
NET – Transitioned = 18% NET – Immediately Stopped = 49%
N=301
N=300
N=710
N=701
N=2,012
NET – Transitioned = 17% NET – Immediately Stopped = 46%
BASE: ALL QUALIFIED RESPONDENTSQ1546. How did your transition into retirement actually take place?/How is your transition into retirement actually taking place?
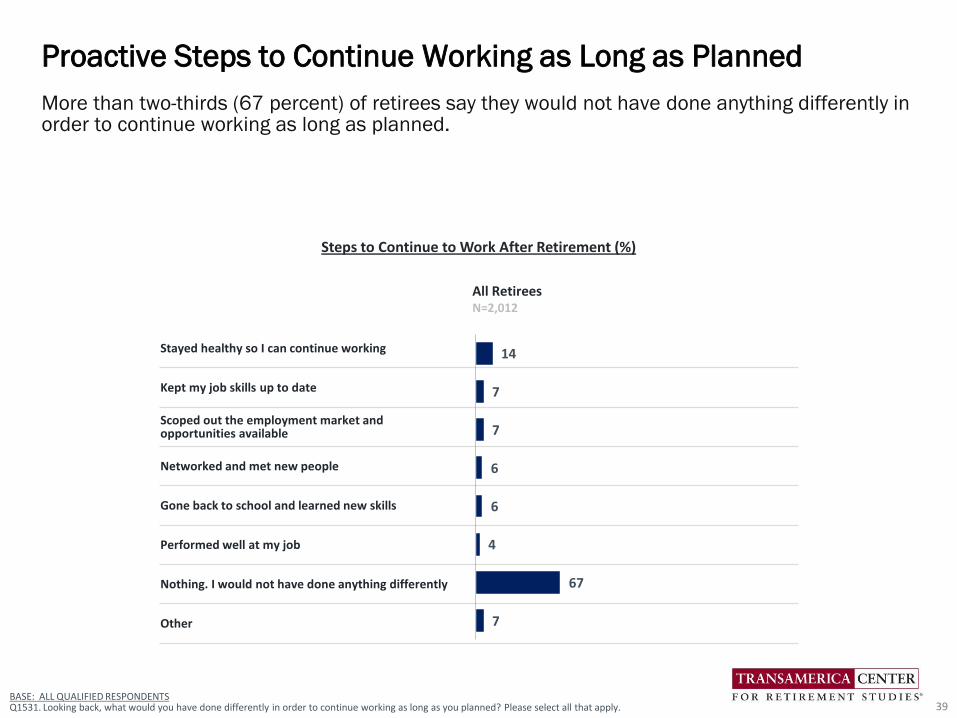
More than two-thirds (67 percent) of retirees say they would not have done anything differently in order to continue working as long as planned.
Proactive Steps to Continue Working as Long as Planned
39BASE: ALL QUALIFIED RESPONDENTSQ1531. Looking back, what would you have done differently in order to continue working as long as you planned? Please select all that apply.
All RetireesN=2,012
Stayed healthy so I can continue working
Kept my job skills up to date
Scoped out the employment market and opportunities available
Networked and met new people
Gone back to school and learned new skills
Performed well at my job
Nothing. I would not have done anything differently
Other
14
7
7
6
6
4
67
7
Steps to Continue to Work After Retirement (%)
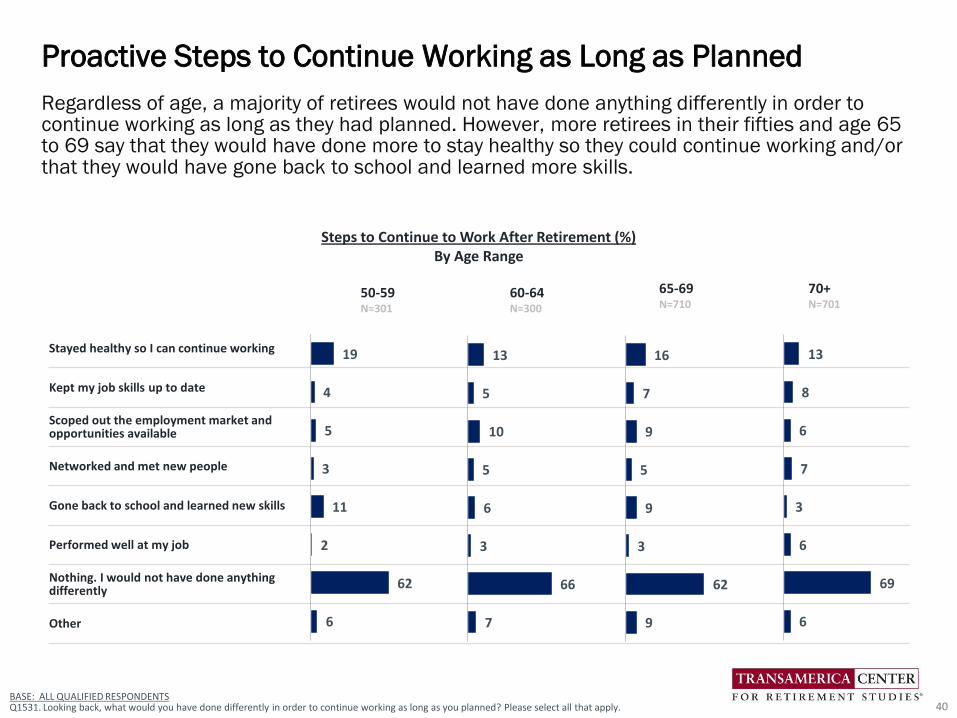
Regardless of age, a majority of retirees would not have done anything differently in order to continue working as long as they had planned. However, more retirees in their fifties and age 65 to 69 say that they would have done more to stay healthy so they could continue working and/or that they would have gone back to school and learned more skills.
Proactive Steps to Continue Working as Long as Planned
40BASE: ALL QUALIFIED RESPONDENTSQ1531. Looking back, what would you have done differently in order to continue working as long as you planned? Please select all that apply.
50-59N=301
60-64N=300
65-69N=710
70+N=701
Stayed healthy so I can continue working
Kept my job skills up to date
Scoped out the employment market and opportunities available
Networked and met new people
Gone back to school and learned new skills
Performed well at my job
Nothing. I would not have done anything differently
Other
19
4
5
3
11
2
62
6
Steps to Continue to Work After Retirement (%)By Age Range
13
5
10
5
6
3
66
7
16
7
9
5
9
3
62
9
13
8
6
7
3
6
69
6
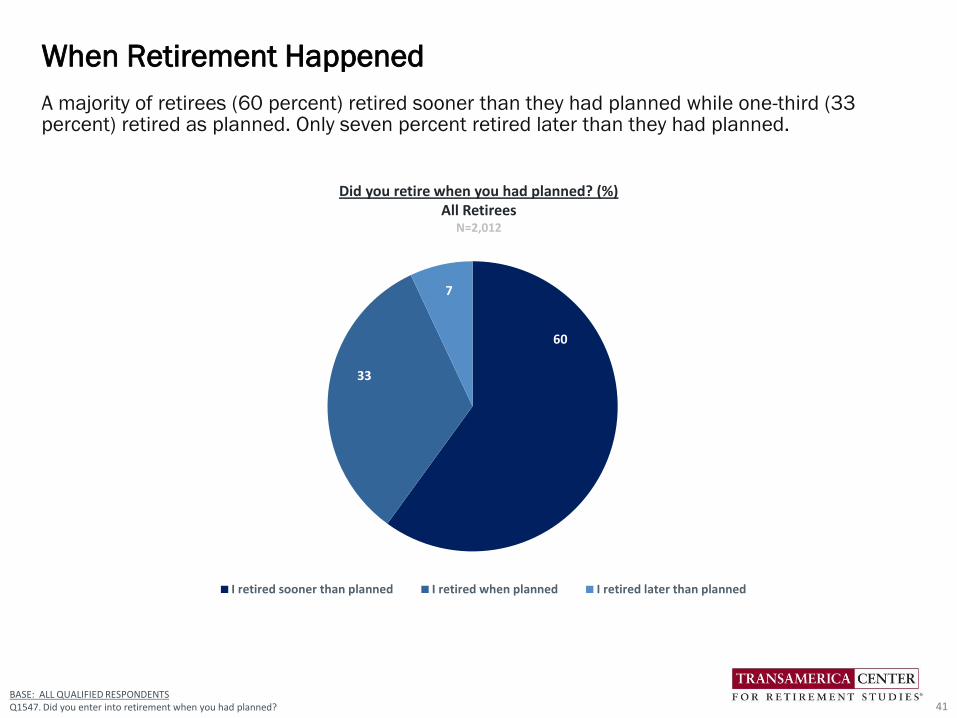
A majority of retirees (60 percent) retired sooner than they had planned while one-third (33 percent) retired as planned. Only seven percent retired later than they had planned.
When Retirement Happened
41BASE: ALL QUALIFIED RESPONDENTSQ1547. Did you enter into retirement when you had planned?
Did you retire when you had planned? (%)All Retirees
N=2,012
60
33
7
I retired sooner than planned I retired when planned I retired later than planned
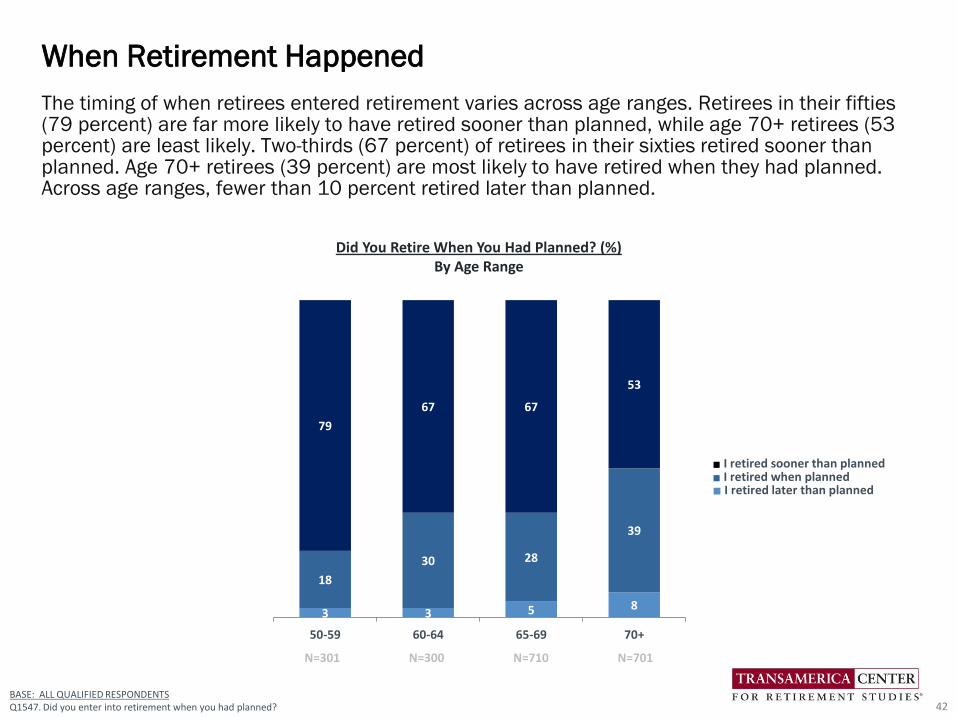
The timing of when retirees entered retirement varies across age ranges. Retirees in their fifties (79 percent) are far more likely to have retired sooner than planned, while age 70+ retirees (53 percent) are least likely. Two-thirds (67 percent) of retirees in their sixties retired sooner than planned. Age 70+ retirees (39 percent) are most likely to have retired when they had planned. Across age ranges, fewer than 10 percent retired later than planned.
When Retirement Happened
42
■ I retired sooner than planned■ I retired when planned■ I retired later than planned
3 3 5 8
18
30 28
39
79
67 67
53
50-59 60-64 65-69 70+
N=301 N=300 N=710 N=701
BASE: ALL QUALIFIED RESPONDENTSQ1547. Did you enter into retirement when you had planned?
Did You Retire When You Had Planned? (%)By Age Range
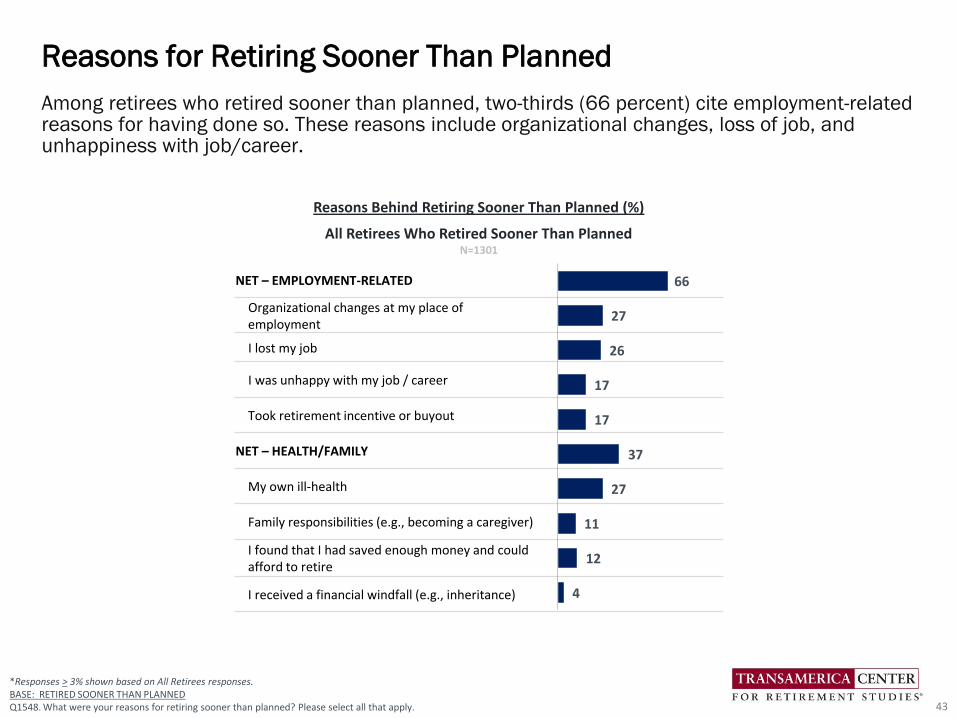
Among retirees who retired sooner than planned, two-thirds (66 percent) cite employment-related reasons for having done so. These reasons include organizational changes, loss of job, and unhappiness with job/career.
Reasons for Retiring Sooner Than Planned
43
NET – EMPLOYMENT-RELATED
Organizational changes at my place of employment
I lost my job
I was unhappy with my job / career
Took retirement incentive or buyout
NET – HEALTH/FAMILY
My own ill-health
Family responsibilities (e.g., becoming a caregiver)
I found that I had saved enough money and could afford to retire
I received a financial windfall (e.g., inheritance)
66
27
26
17
17
37
27
11
12
4
All Retirees Who Retired Sooner Than PlannedN=1301
*Responses > 3% shown based on All Retirees responses. BASE: RETIRED SOONER THAN PLANNEDQ1548. What were your reasons for retiring sooner than planned? Please select all that apply.
Reasons Behind Retiring Sooner Than Planned (%)
NET – EMPLOYMENT-RELATED
Organizational changes at my place of employment
I lost my job
I was unhappy with my job / career
Took retirement incentive or buyout
NET – HEALTH/FAMILY
My own ill-health
Family responsibilities (e.g., becoming a caregiver)
I found that I had saved enough money and could afford to retire
I received a financial windfall (e.g., inheritance)
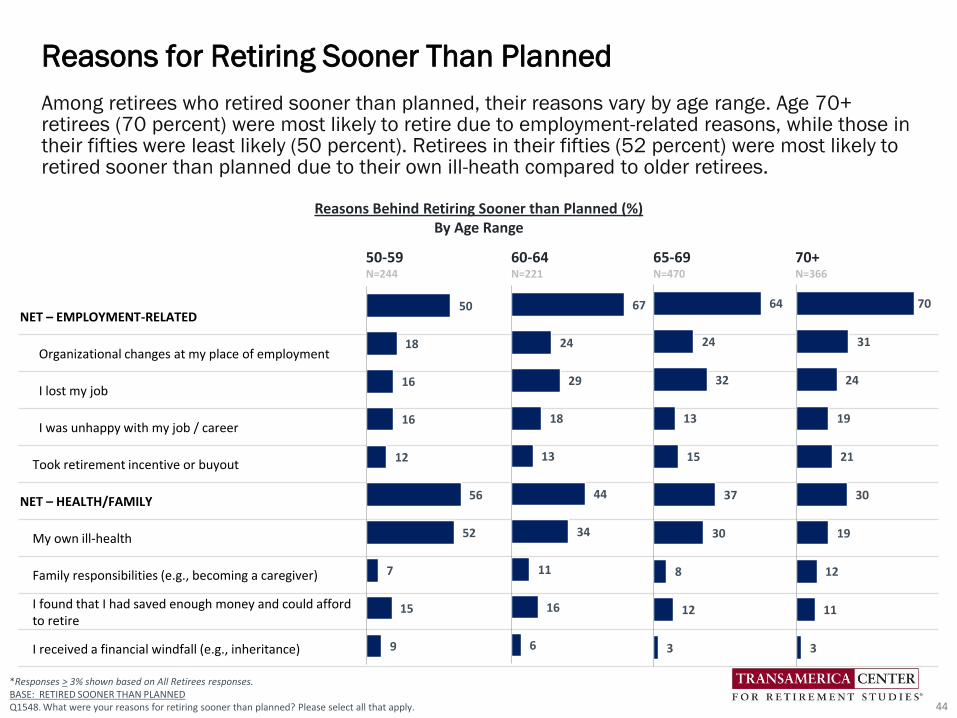
Among retirees who retired sooner than planned, their reasons vary by age range. Age 70+ retirees (70 percent) were most likely to retire due to employment-related reasons, while those in their fifties were least likely (50 percent). Retirees in their fifties (52 percent) were most likely to retired sooner than planned due to their own ill-heath compared to older retirees.
Reasons for Retiring Sooner Than Planned
44
50-59N=244
60-64N=221
65-69N=470
70+N=366
*Responses > 3% shown based on All Retirees responses. BASE: RETIRED SOONER THAN PLANNEDQ1548. What were your reasons for retiring sooner than planned? Please select all that apply.
50
18
16
16
12
56
52
7
15
9
67
24
29
18
13
44
34
11
16
6
64
24
32
13
15
37
30
8
12
3
70
31
24
19
21
30
19
12
11
3
Reasons Behind Retiring Sooner than Planned (%)By Age Range
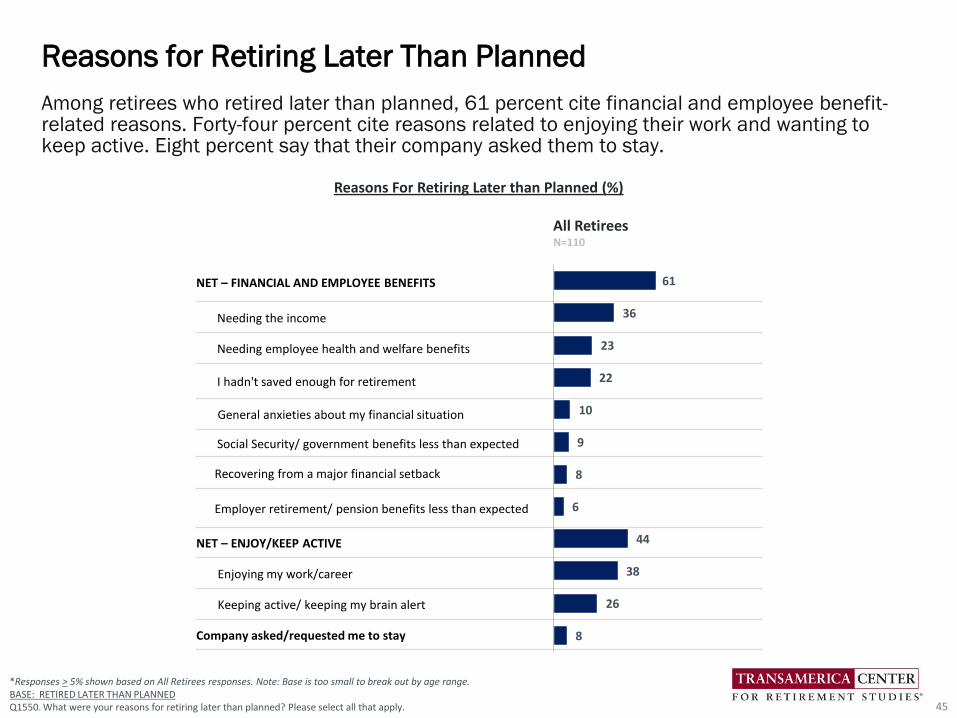
NET – FINANCIAL AND EMPLOYEE BENEFITS
Needing the income
Needing employee health and welfare benefits
I hadn't saved enough for retirement
General anxieties about my financial situation
Social Security/ government benefits less than expected
Recovering from a major financial setback
Employer retirement/ pension benefits less than expected
NET – ENJOY/KEEP ACTIVE
Enjoying my work/career
Keeping active/ keeping my brain alert
Company asked/requested me to stay
Among retirees who retired later than planned, 61 percent cite financial and employee benefit-related reasons. Forty-four percent cite reasons related to enjoying their work and wanting to keep active. Eight percent say that their company asked them to stay.
Reasons for Retiring Later Than Planned
45
All RetireesN=110
*Responses > 5% shown based on All Retirees responses. Note: Base is too small to break out by age range.BASE: RETIRED LATER THAN PLANNEDQ1550. What were your reasons for retiring later than planned? Please select all that apply.
Reasons For Retiring Later than Planned (%)
61
36
23
22
10
9
8
6
44
38
26
8
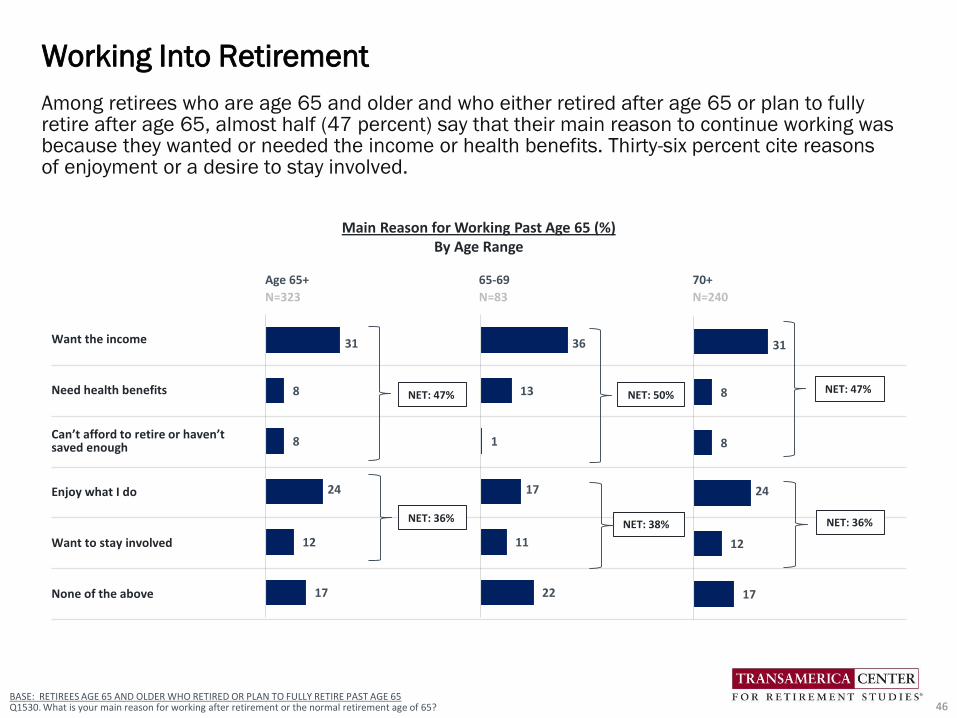
Among retirees who are age 65 and older and who either retired after age 65 or plan to fully retire after age 65, almost half (47 percent) say that their main reason to continue working was because they wanted or needed the income or health benefits. Thirty-six percent cite reasons of enjoyment or a desire to stay involved.
Working Into Retirement
46BASE: RETIREES AGE 65 AND OLDER WHO RETIRED OR PLAN TO FULLY RETIRE PAST AGE 65Q1530. What is your main reason for working after retirement or the normal retirement age of 65?
Main Reason for Working Past Age 65 (%)By Age Range
Age 65+ 65-69 70+
N=323 N=83 N=240
Want the income
Need health benefits
Can’t afford to retire or haven’t saved enough
Enjoy what I do
Want to stay involved
None of the above
36
13
1
17
11
22
31
8
8
24
12
17
31
8
8
24
12
17
NET: 47%
NET: 36%
NET: 50% NET: 47%
NET: 38% NET: 36%
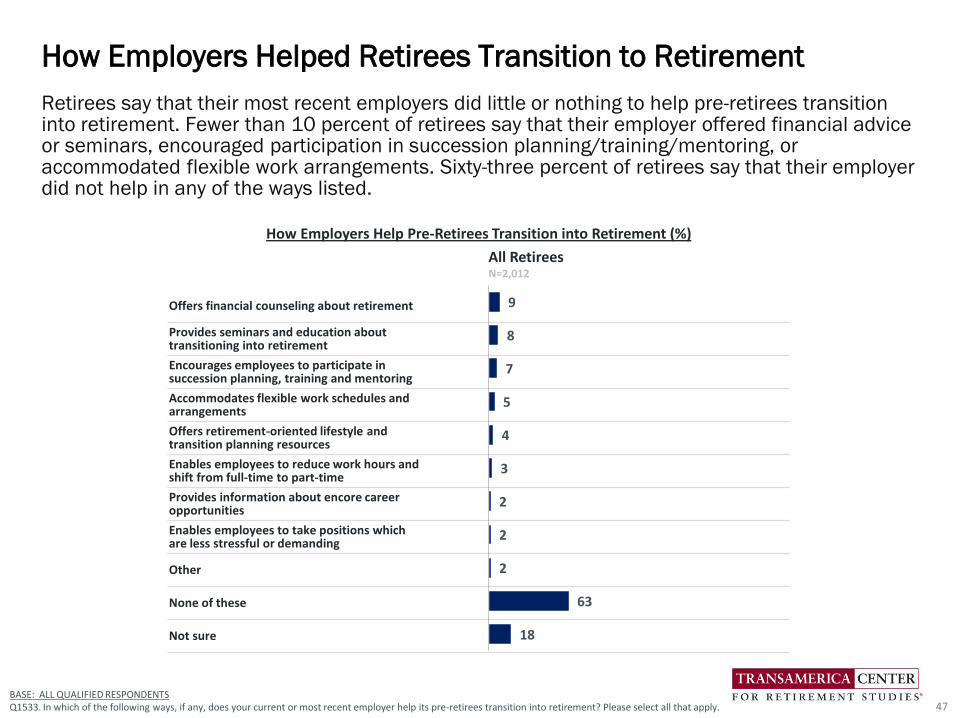
Retirees say that their most recent employers did little or nothing to help pre-retirees transition into retirement. Fewer than 10 percent of retirees say that their employer offered financial advice or seminars, encouraged participation in succession planning/training/mentoring, or accommodated flexible work arrangements. Sixty-three percent of retirees say that their employer did not help in any of the ways listed.
How Employers Helped Retirees Transition to Retirement
47BASE: ALL QUALIFIED RESPONDENTS Q1533. In which of the following ways, if any, does your current or most recent employer help its pre-retirees transition into retirement? Please select all that apply.
Offers financial counseling about retirement
Provides seminars and education about transitioning into retirement
Encourages employees to participate in succession planning, training and mentoring
Accommodates flexible work schedules and arrangements
Offers retirement-oriented lifestyle and transition planning resources
Enables employees to reduce work hours and shift from full-time to part-time
Provides information about encore career opportunities
Enables employees to take positions which are less stressful or demanding
Other
None of these
Not sure
9
8
7
5
4
3
2
2
2
63
18
How Employers Help Pre-Retirees Transition into Retirement (%)
All RetireesN=2,012
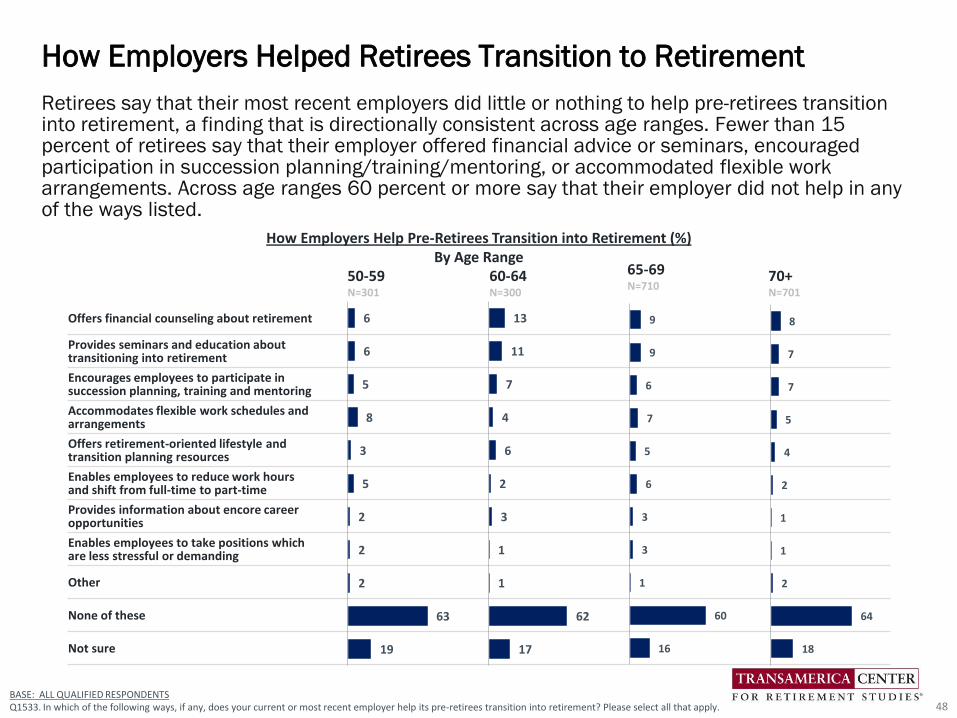
Retirees say that their most recent employers did little or nothing to help pre-retirees transition into retirement, a finding that is directionally consistent across age ranges. Fewer than 15 percent of retirees say that their employer offered financial advice or seminars, encouraged participation in succession planning/training/mentoring, or accommodated flexible work arrangements. Across age ranges 60 percent or more say that their employer did not help in any of the ways listed.
How Employers Helped Retirees Transition to Retirement
48BASE: ALL QUALIFIED RESPONDENTS Q1533. In which of the following ways, if any, does your current or most recent employer help its pre-retirees transition into retirement? Please select all that apply.
Offers financial counseling about retirement
Provides seminars and education about transitioning into retirement
Encourages employees to participate in succession planning, training and mentoring
Accommodates flexible work schedules and arrangements
Offers retirement-oriented lifestyle and transition planning resources
Enables employees to reduce work hours and shift from full-time to part-time
Provides information about encore career opportunities
Enables employees to take positions which are less stressful or demanding
Other
None of these
Not sure
6
6
5
8
3
5
2
2
2
63
19
50-59N=301
13
11
7
4
6
2
3
1
1
62
17
60-64N=300
9
9
6
7
5
6
3
3
1
60
16
65-69N=710
8
7
7
5
4
2
1
1
2
64
18
70+N=701
How Employers Help Pre-Retirees Transition into Retirement (%)By Age Range
Detailed Findings
Personal Finances in Retirement
49
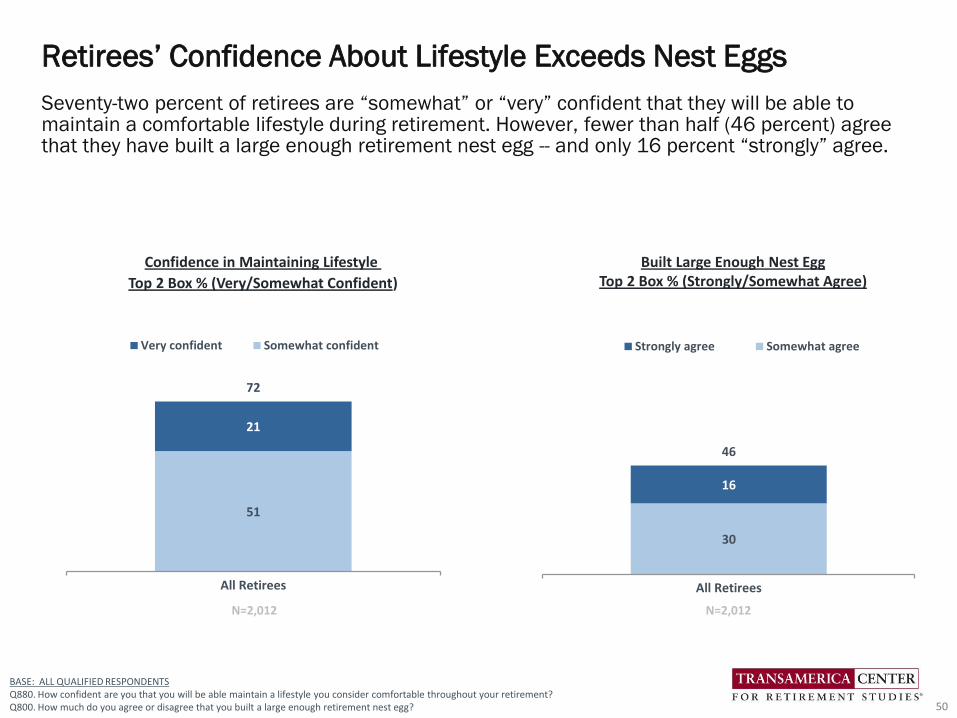
51
21
72
All Retirees
Very confident Somewhat confident
30
16
46
All Retirees
Strongly agree Somewhat agree
Seventy-two percent of retirees are “somewhat” or “very” confident that they will be able to maintain a comfortable lifestyle during retirement. However, fewer than half (46 percent) agree that they have built a large enough retirement nest egg -- and only 16 percent “strongly” agree.
Retirees’ Confidence About Lifestyle Exceeds Nest Eggs
50
N=2,012
BASE: ALL QUALIFIED RESPONDENTSQ880. How confident are you that you will be able maintain a lifestyle you consider comfortable throughout your retirement?Q800. How much do you agree or disagree that you built a large enough retirement nest egg?
N=2,012
Confidence in Maintaining Lifestyle
Top 2 Box % (Very/Somewhat Confident)
Built Large Enough Nest EggTop 2 Box % (Strongly/Somewhat Agree)
46 4453 53
29 2821 18
7572 74
70
50–59 60–64 65–69 70+
Very confident Somewhat confident
2836
30 29
2522
15 13
5358
4542
50–59 60–64 65–69 70+
Strongly agree Somewhat agree
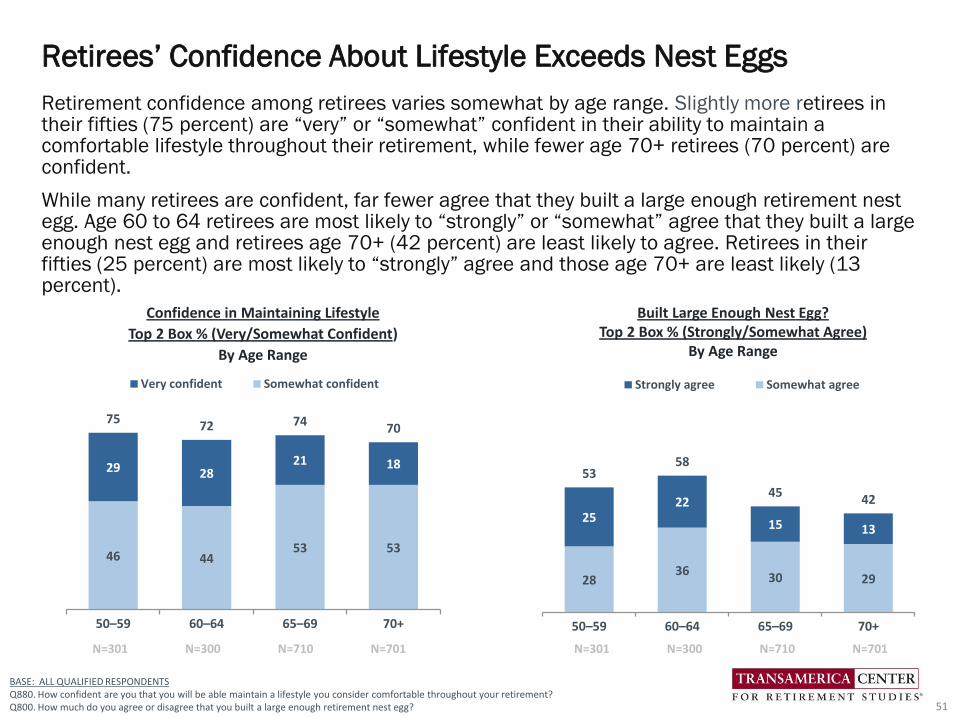
Retirement confidence among retirees varies somewhat by age range. Slightly more retirees in their fifties (75 percent) are “very” or “somewhat” confident in their ability to maintain a comfortable lifestyle throughout their retirement, while fewer age 70+ retirees (70 percent) are confident.
While many retirees are confident, far fewer agree that they built a large enough retirement nest egg. Age 60 to 64 retirees are most likely to “strongly” or “somewhat” agree that they built a large enough nest egg and retirees age 70+ (42 percent) are least likely to agree. Retirees in their fifties (25 percent) are most likely to “strongly” agree and those age 70+ are least likely (13 percent).
Retirees’ Confidence About Lifestyle Exceeds Nest Eggs
51
BASE: ALL QUALIFIED RESPONDENTSQ880. How confident are you that you will be able maintain a lifestyle you consider comfortable throughout your retirement?Q800. How much do you agree or disagree that you built a large enough retirement nest egg?
N=301 N=300 N=710 N=701N=301 N=300 N=710 N=701
Confidence in Maintaining Lifestyle
Top 2 Box % (Very/Somewhat Confident)
By Age Range
Built Large Enough Nest Egg?Top 2 Box % (Strongly/Somewhat Agree)
By Age Range
52BASE: ALL QUALIFIED RESPONDENTS Q1510. Since entering retirement, has your personal financial situation improved, declined, or stayed the same?
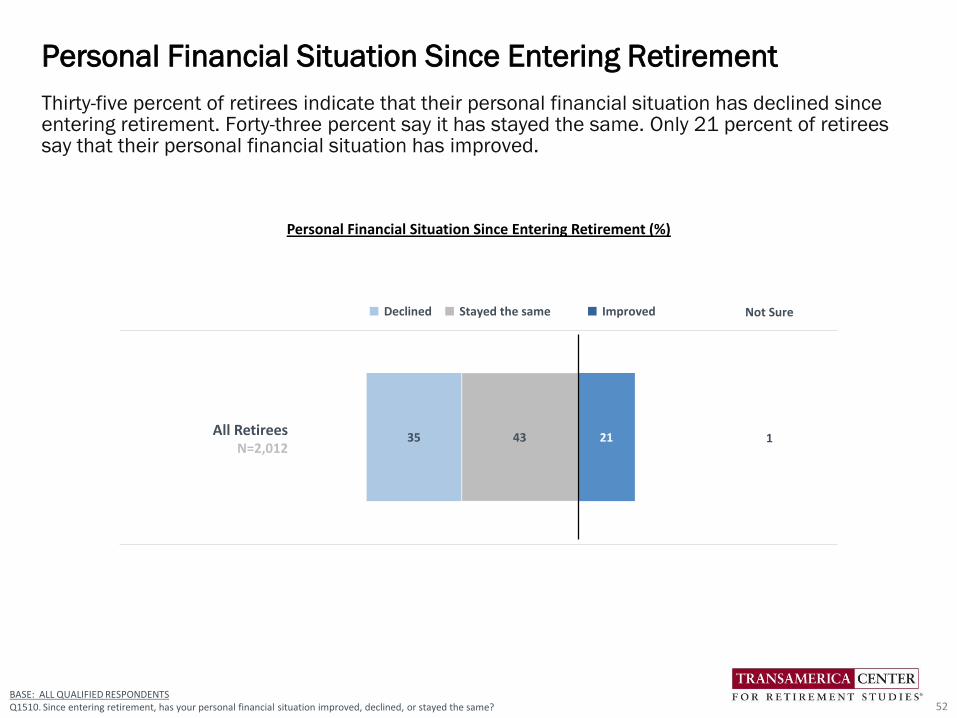
Thirty-five percent of retirees indicate that their personal financial situation has declined since entering retirement. Forty-three percent say it has stayed the same. Only 21 percent of retirees say that their personal financial situation has improved.
Personal Financial Situation Since Entering Retirement
52
Not Sure
All RetireesN=2,012
1
■ Declined ■ Stayed the same ■ Improved
4335 21
Personal Financial Situation Since Entering Retirement (%)
53
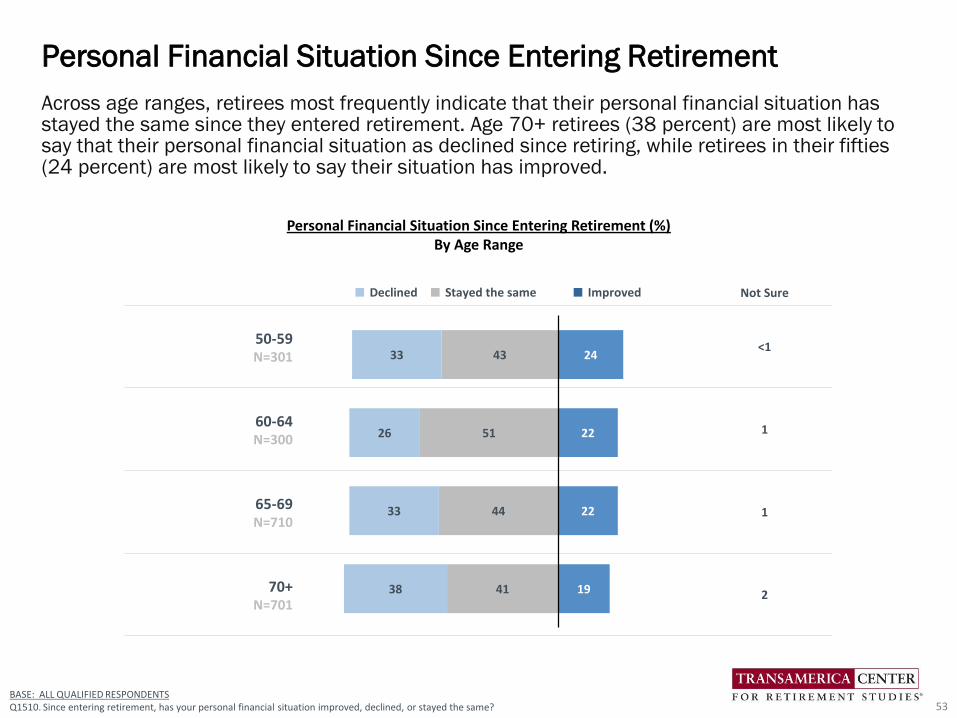
Across age ranges, retirees most frequently indicate that their personal financial situation has stayed the same since they entered retirement. Age 70+ retirees (38 percent) are most likely to say that their personal financial situation as declined since retiring, while retirees in their fifties (24 percent) are most likely to say their situation has improved.
Personal Financial Situation Since Entering Retirement
53
Not Sure
50-59N=301
<1
60-64N=300
1
65-69N=710
1
70+N=701
2
BASE: ALL QUALIFIED RESPONDENTS Q1510. Since entering retirement, has your personal financial situation improved, declined, or stayed the same?
Personal Financial Situation Since Entering Retirement (%)By Age Range
43
51
44
41
33
26
33
38
24
22
22
19
■ Declined ■ Stayed the same ■ Improved
I was not impacted
I have fully recovered
I have somewhat recovered
I have not yet begun to recover
I may never recover
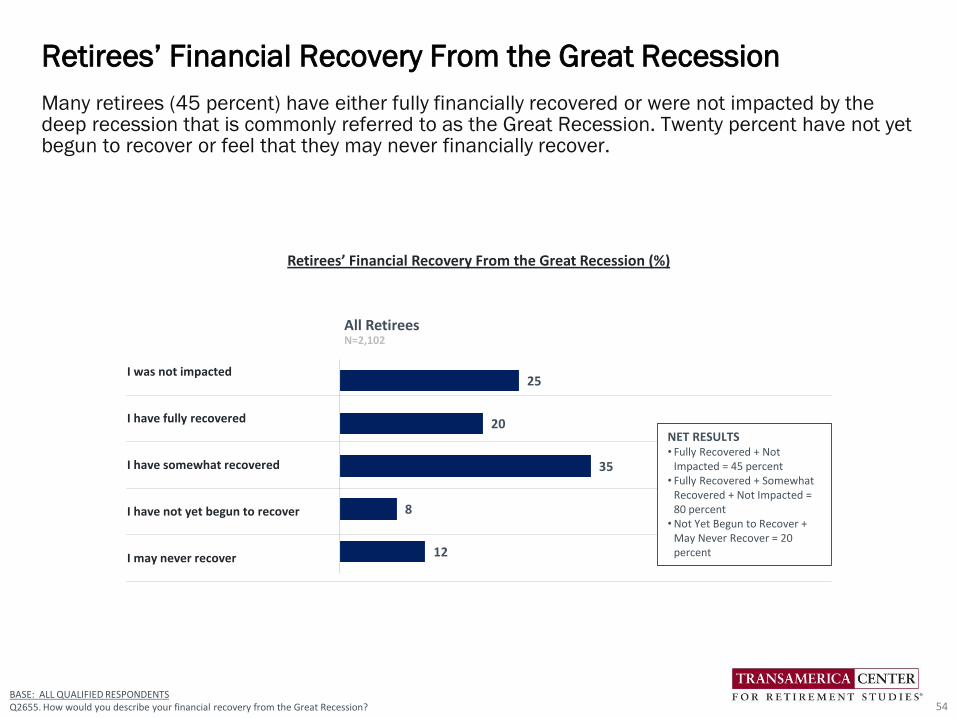
Many retirees (45 percent) have either fully financially recovered or were not impacted by the deep recession that is commonly referred to as the Great Recession. Twenty percent have not yet begun to recover or feel that they may never financially recover.
Retirees’ Financial Recovery From the Great Recession
54BASE: ALL QUALIFIED RESPONDENTSQ2655. How would you describe your financial recovery from the Great Recession?
25
20
35
8
12
Retirees’ Financial Recovery From the Great Recession (%)
NET RESULTS• Fully Recovered + Not
Impacted = 45 percent• Fully Recovered + Somewhat
Recovered + Not Impacted = 80 percent
•Not Yet Begun to Recover + May Never Recover = 20 percent
All RetireesN=2,102
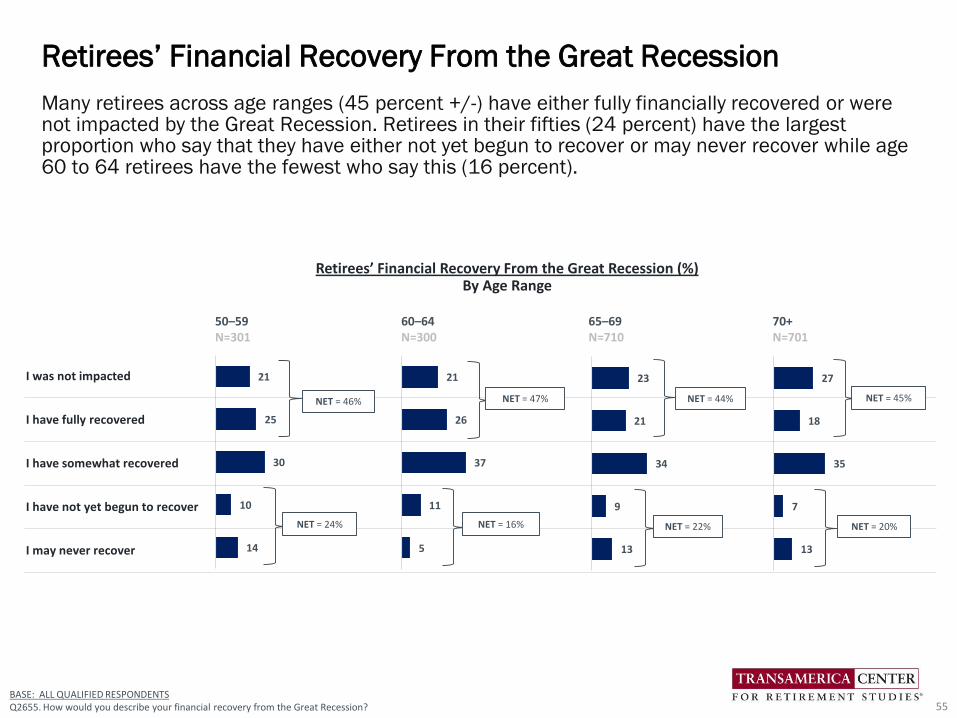
Many retirees across age ranges (45 percent +/-) have either fully financially recovered or were not impacted by the Great Recession. Retirees in their fifties (24 percent) have the largest proportion who say that they have either not yet begun to recover or may never recover while age 60 to 64 retirees have the fewest who say this (16 percent).
Retirees’ Financial Recovery From the Great Recession
55BASE: ALL QUALIFIED RESPONDENTSQ2655. How would you describe your financial recovery from the Great Recession?
50–59 60–64 65–69 70+N=301 N=300 N=710 N=701
I was not impacted
I have fully recovered
I have somewhat recovered
I have not yet begun to recover
I may never recover
21
25
30
10
14
27
18
35
7
13
23
21
34
9
13
21
26
37
11
5
Retirees’ Financial Recovery From the Great Recession (%)By Age Range
NET = 46%
NET = 24%
NET = 47%
NET = 16%
NET = 44%
NET = 22%
NET = 45%
NET = 20%
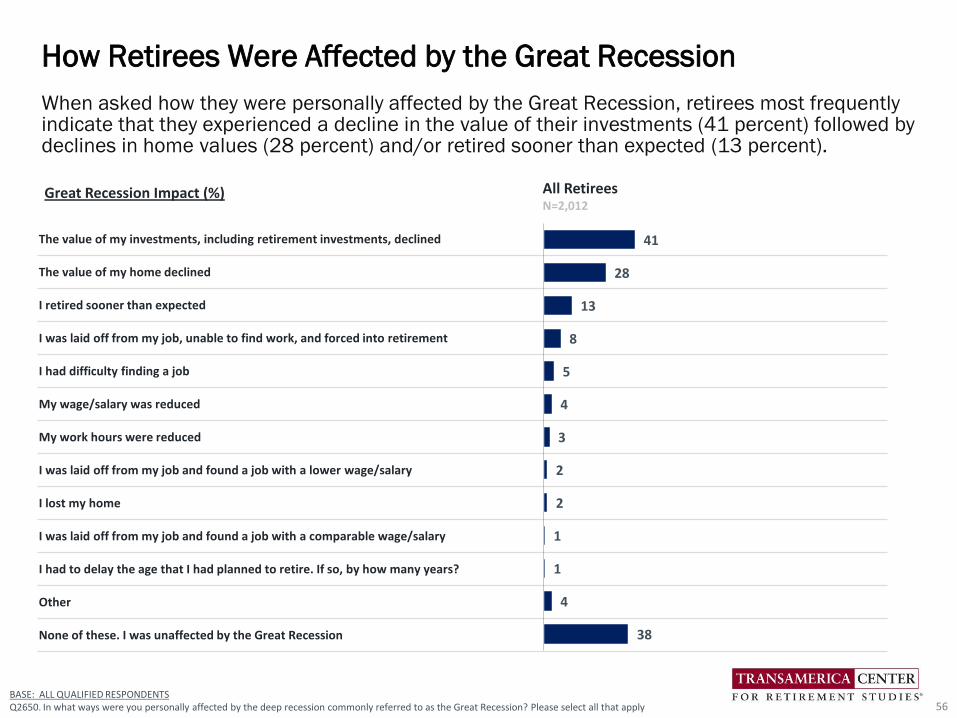
When asked how they were personally affected by the Great Recession, retirees most frequently indicate that they experienced a decline in the value of their investments (41 percent) followed by declines in home values (28 percent) and/or retired sooner than expected (13 percent).
How Retirees Were Affected by the Great Recession
56
The value of my investments, including retirement investments, declined
The value of my home declined
I retired sooner than expected
I was laid off from my job, unable to find work, and forced into retirement
I had difficulty finding a job
My wage/salary was reduced
My work hours were reduced
I was laid off from my job and found a job with a lower wage/salary
I lost my home
I was laid off from my job and found a job with a comparable wage/salary
I had to delay the age that I had planned to retire. If so, by how many years?
Other
None of these. I was unaffected by the Great Recession
41
28
13
8
5
4
3
2
2
1
1
4
38
All RetireesN=2,012
BASE: ALL QUALIFIED RESPONDENTSQ2650. In what ways were you personally affected by the deep recession commonly referred to as the Great Recession? Please select all that apply
Great Recession Impact (%)
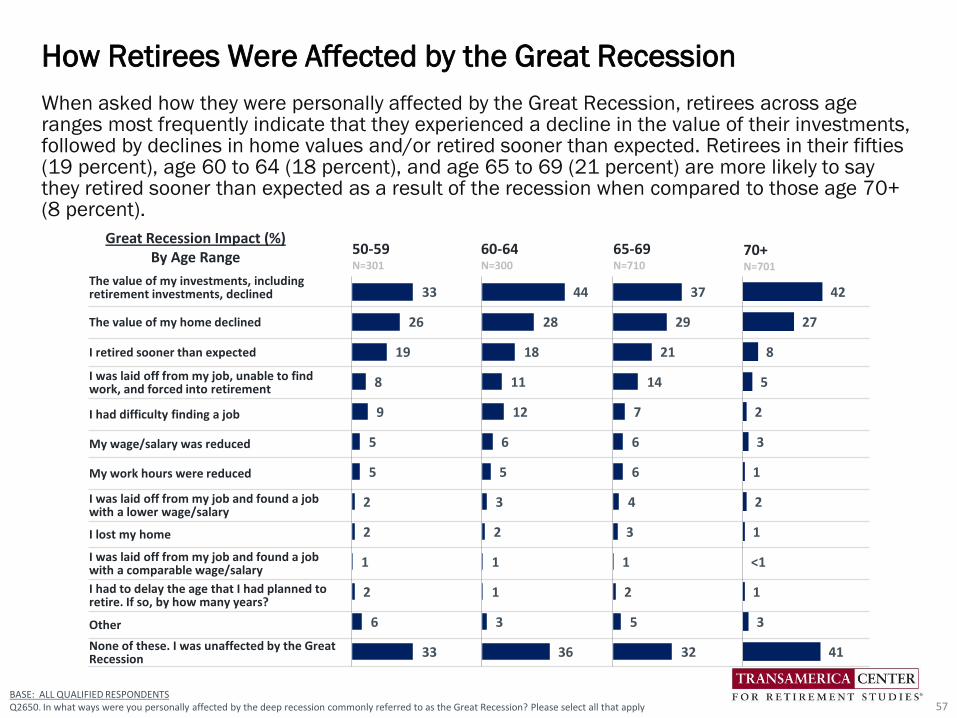
When asked how they were personally affected by the Great Recession, retirees across age ranges most frequently indicate that they experienced a decline in the value of their investments, followed by declines in home values and/or retired sooner than expected. Retirees in their fifties (19 percent), age 60 to 64 (18 percent), and age 65 to 69 (21 percent) are more likely to say they retired sooner than expected as a result of the recession when compared to those age 70+ (8 percent).
How Retirees Were Affected by the Great Recession
57
The value of my investments, including retirement investments, declined
The value of my home declined
I retired sooner than expected
I was laid off from my job, unable to find work, and forced into retirement
I had difficulty finding a job
My wage/salary was reduced
My work hours were reduced
I was laid off from my job and found a job with a lower wage/salary
I lost my home
I was laid off from my job and found a job with a comparable wage/salary
I had to delay the age that I had planned to retire. If so, by how many years?
Other
None of these. I was unaffected by the Great Recession
50-59N=301
60-64N=300
65-69N=710
70+N=701
BASE: ALL QUALIFIED RESPONDENTSQ2650. In what ways were you personally affected by the deep recession commonly referred to as the Great Recession? Please select all that apply
33
26
19
8
9
5
5
2
2
1
2
6
33
37
29
21
14
7
6
6
4
3
1
2
5
32
44
28
18
11
12
6
5
3
2
1
1
3
36
Great Recession Impact (%)By Age Range
42
27
8
5
2
3
1
2
1
<1
1
3
41
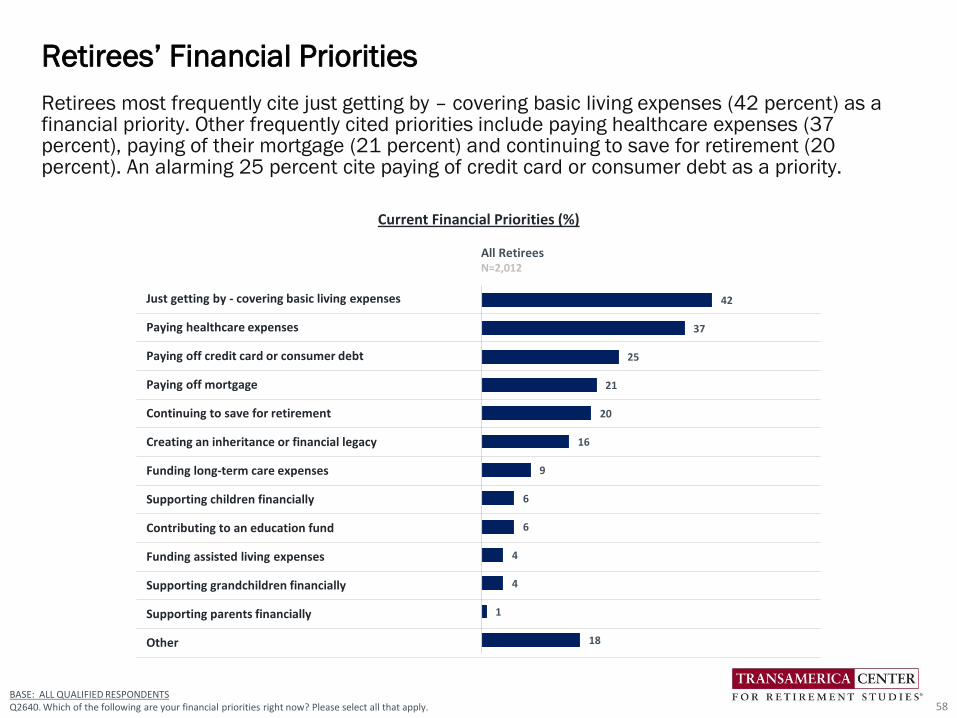
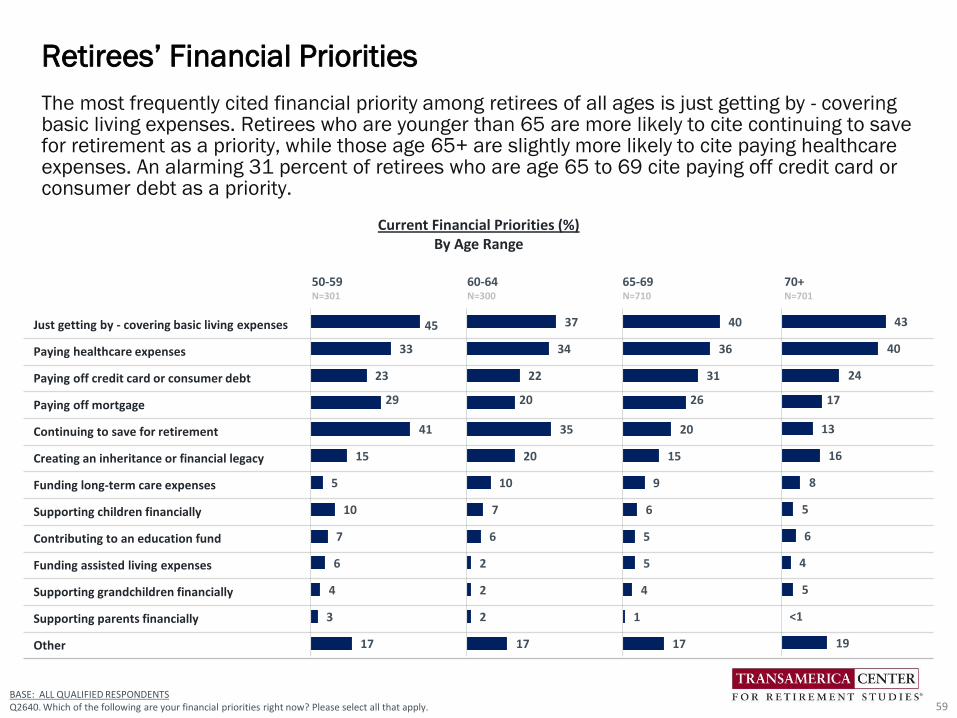
Retirees most frequently cite just getting by – covering basic living expenses (42 percent) as a financial priority. Other frequently cited priorities include paying healthcare expenses (37 percent), paying of their mortgage (21 percent) and continuing to save for retirement (20 percent). An alarming 25 percent cite paying of credit card or consumer debt as a priority.
Retirees’ Financial Priorities
58
All RetireesN=2,012
Just getting by - covering basic living expenses
Paying healthcare expenses
Paying off credit card or consumer debt
Paying off mortgage
Continuing to save for retirement
Creating an inheritance or financial legacy
Funding long-term care expenses
Supporting children financially
Contributing to an education fund
Funding assisted living expenses
Supporting grandchildren financially
Supporting parents financially
Other
BASE: ALL QUALIFIED RESPONDENTSQ2640. Which of the following are your financial priorities right now? Please select all that apply.
42
37
25
21
20
16
9
6
6
4
4
1
18
Current Financial Priorities (%)
50-59 60-64 65-69 70+N=301 N=300 N=710 N=701
Just getting by - covering basic living expenses
Paying healthcare expenses
Paying off credit card or consumer debt
Paying off mortgage
Continuing to save for retirement
Creating an inheritance or financial legacy
Funding long-term care expenses
Supporting children financially
Contributing to an education fund
Funding assisted living expenses
Supporting grandchildren financially
Supporting parents financially
Other
The most frequently cited financial priority among retirees of all ages is just getting by - covering basic living expenses. Retirees who are younger than 65 are more likely to cite continuing to save for retirement as a priority, while those age 65+ are slightly more likely to cite paying healthcare expenses. An alarming 31 percent of retirees who are age 65 to 69 cite paying off credit card or consumer debt as a priority.
Retirees’ Financial Priorities
59
40
36
31
26
20
15
9
6
5
5
4
1
17
43
40
24
17
13
16
8
5
6
4
5
<1
19
37
34
22
20
35
20
10
7
6
2
2
2
17
45
33
23
29
41
15
5
10
7
6
4
3
17
BASE: ALL QUALIFIED RESPONDENTSQ2640. Which of the following are your financial priorities right now? Please select all that apply.
Current Financial Priorities (%)By Age Range
All RetireesN=2,012
Just getting by - covering basic living expenses
Paying off credit card or consumer debt
Paying off mortgage
Continuing to save for retirement
Paying healthcare expenses
Creating an inheritance or financial legacy
Contributing to an education fund
Funding assisted living expenses
Funding long-term care expenses
Supporting children financially
Supporting grandchildren financially
Supporting parents financially
Other
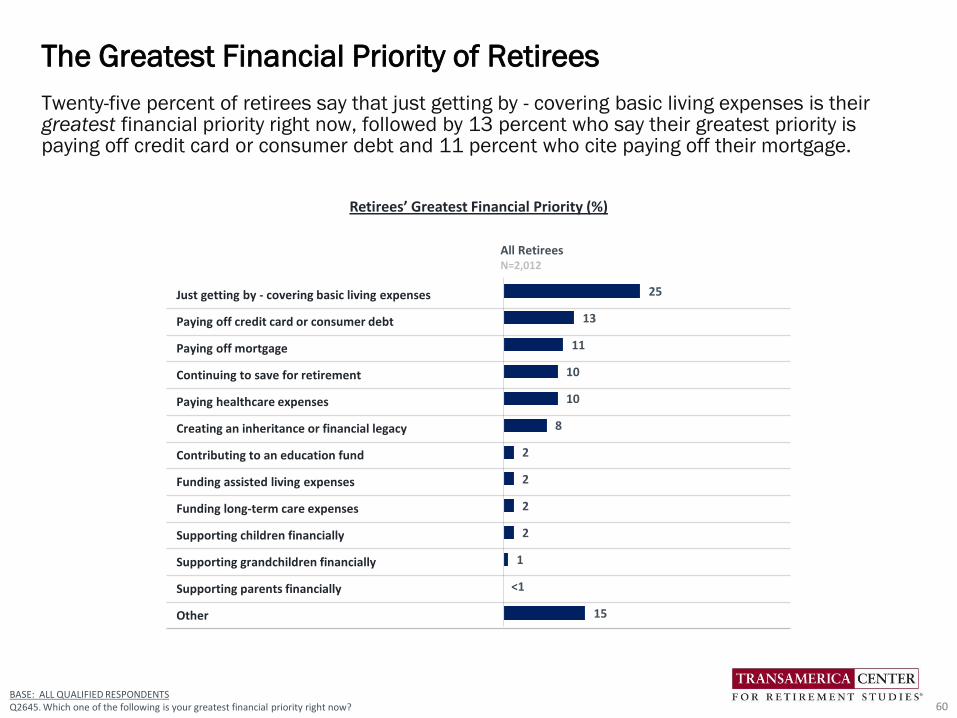
Twenty-five percent of retirees say that just getting by - covering basic living expenses is their greatest financial priority right now, followed by 13 percent who say their greatest priority is paying off credit card or consumer debt and 11 percent who cite paying off their mortgage.
The Greatest Financial Priority of Retirees
60BASE: ALL QUALIFIED RESPONDENTSQ2645. Which one of the following is your greatest financial priority right now?
25
13
11
10
10
8
2
2
2
2
1
<1
15
Retirees’ Greatest Financial Priority (%)
50-59 60-64 65-69 70+N=301 N=300 N=710 N=701
Just getting by - covering basic living expenses
Paying off credit card or consumer debt
Paying off mortgage
Continuing to save for retirement
Paying healthcare expenses
Creating an inheritance or financial legacy
Contributing to an education fund
Funding assisted living expenses
Funding long-term care expenses
Supporting children financially
Supporting grandchildren financially
Supporting parents financially
Other
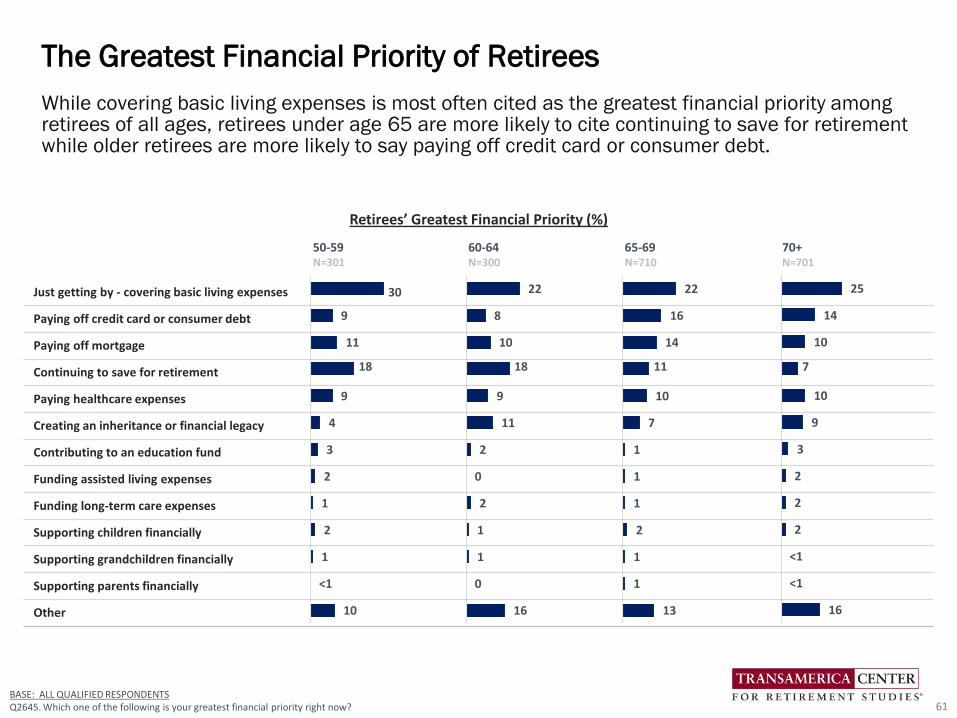
While covering basic living expenses is most often cited as the greatest financial priority among retirees of all ages, retirees under age 65 are more likely to cite continuing to save for retirement while older retirees are more likely to say paying off credit card or consumer debt.
The Greatest Financial Priority of Retirees
61BASE: ALL QUALIFIED RESPONDENTSQ2645. Which one of the following is your greatest financial priority right now?
Retirees’ Greatest Financial Priority (%)
22
16
14
11
10
7
1
1
1
2
1
1
13
25
14
10
7
10
9
3
2
2
2
<1
<1
16
22
8
10
18
9
11
2
0
2
1
1
0
16
30
9
11
18
9
4
3
2
1
2
1
<1
10
BASE: ALL QUALIFIED RESPONDENTSQ1150. What are your current sources of income in retirement? Please select all that apply.
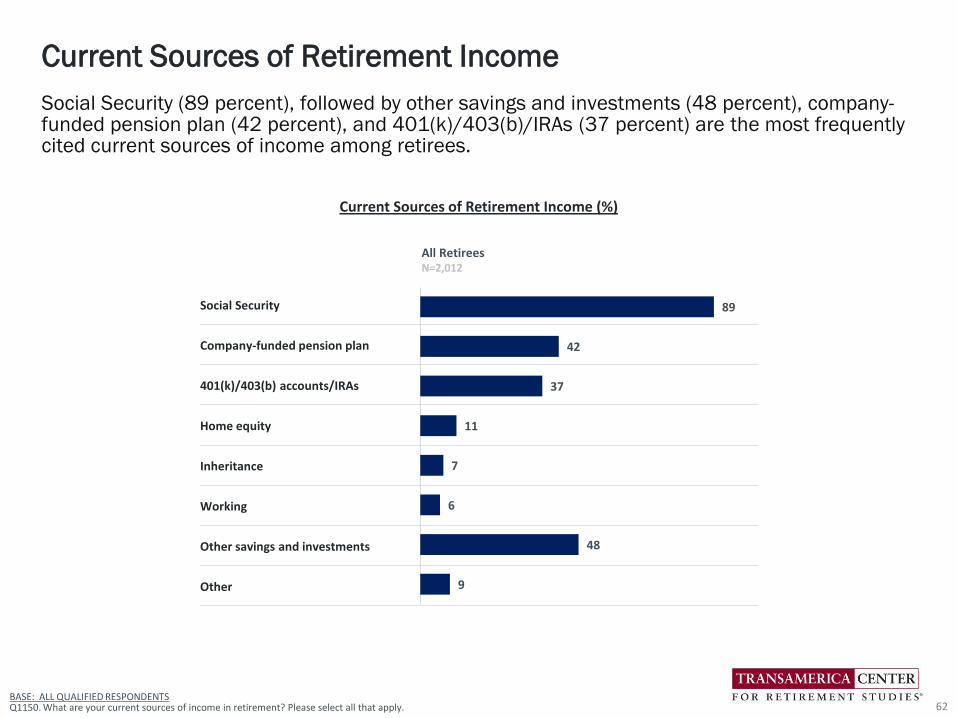
Social Security (89 percent), followed by other savings and investments (48 percent), company-funded pension plan (42 percent), and 401(k)/403(b)/IRAs (37 percent) are the most frequently cited current sources of income among retirees.
Current Sources of Retirement Income
62
All RetireesN=2,012
Social Security
Company-funded pension plan
401(k)/403(b) accounts/IRAs
Home equity
Inheritance
Working
Other savings and investments
Other
89
42
37
11
7
6
48
9
Current Sources of Retirement Income (%)
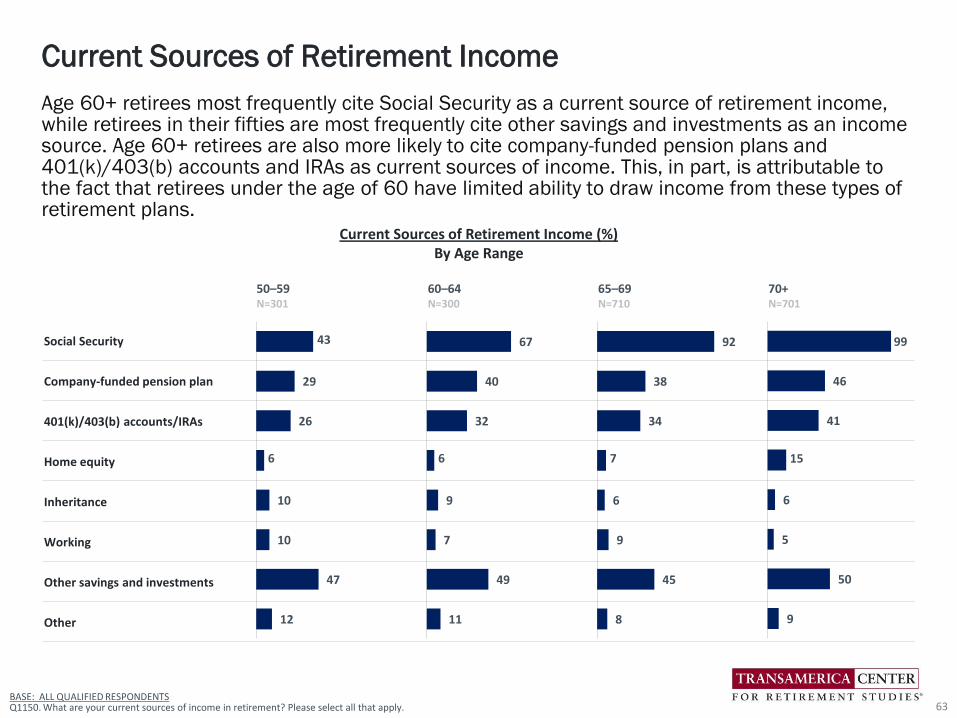
Age 60+ retirees most frequently cite Social Security as a current source of retirement income, while retirees in their fifties are most frequently cite other savings and investments as an income source. Age 60+ retirees are also more likely to cite company-funded pension plans and 401(k)/403(b) accounts and IRAs as current sources of income. This, in part, is attributable to the fact that retirees under the age of 60 have limited ability to draw income from these types of retirement plans.
Current Sources of Retirement Income
63
50–59 60–64 65–69 70+N=301 N=300 N=710 N=701
Social Security
Company-funded pension plan
401(k)/403(b) accounts/IRAs
Home equity
Inheritance
Working
Other savings and investments
Other
92
38
34
7
6
9
45
8
99
46
41
15
6
5
50
9
67
40
32
6
9
7
49
11
43
29
26
6
10
10
47
12
BASE: ALL QUALIFIED RESPONDENTSQ1150. What are your current sources of income in retirement? Please select all that apply.
Current Sources of Retirement Income (%)By Age Range
BASE: ALL QUALIFIED RESPONDENTSQ1155. Over the course of your retirement, what will be your primary source of income?
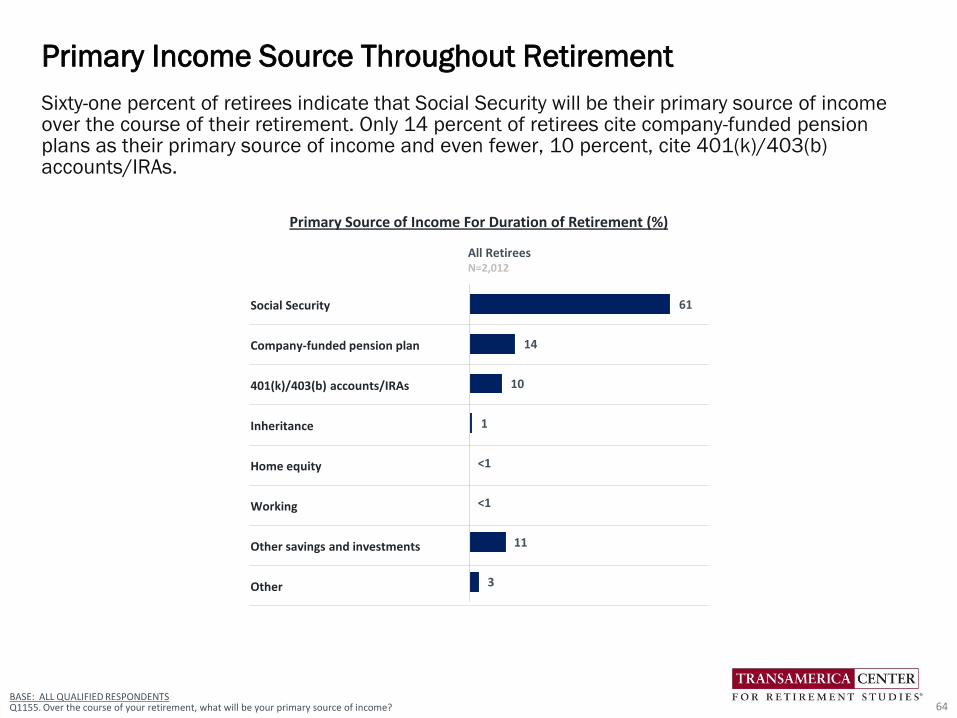
Sixty-one percent of retirees indicate that Social Security will be their primary source of income over the course of their retirement. Only 14 percent of retirees cite company-funded pension plans as their primary source of income and even fewer, 10 percent, cite 401(k)/403(b) accounts/IRAs.
Primary Income Source Throughout Retirement
64
All RetireesN=2,012
Social Security
Company-funded pension plan
401(k)/403(b) accounts/IRAs
Inheritance
Home equity
Working
Other savings and investments
Other
61
14
10
1
<1
<1
11
3
Primary Source of Income For Duration of Retirement (%)
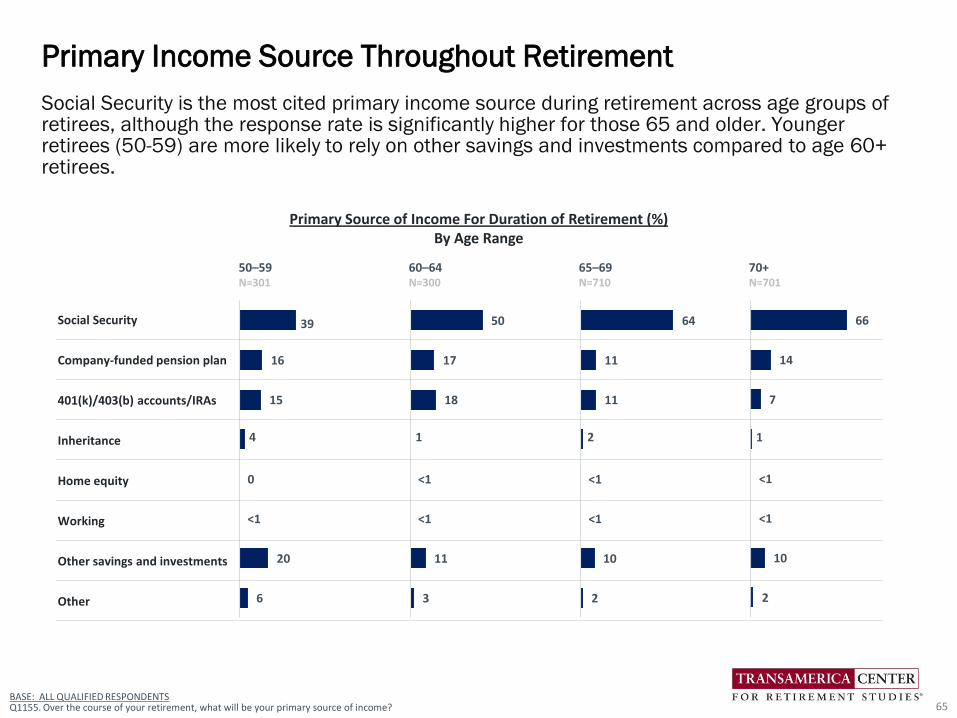
Social Security is the most cited primary income source during retirement across age groups of retirees, although the response rate is significantly higher for those 65 and older. Younger retirees (50-59) are more likely to rely on other savings and investments compared to age 60+ retirees.
Primary Income Source Throughout Retirement
65
Primary Source of Income For Duration of Retirement (%)By Age Range
50–59 60–64 65–69 70+N=301 N=300 N=710 N=701
Social Security
Company-funded pension plan
401(k)/403(b) accounts/IRAs
Inheritance
Home equity
Working
Other savings and investments
Other
64
11
11
2
<1
<1
10
2
66
14
7
1
<1
<1
10
2
50
17
18
1
<1
<1
11
3
39
16
15
4
0
<1
20
6
BASE: ALL QUALIFIED RESPONDENTSQ1155. Over the course of your retirement, what will be your primary source of income?
89 7 4All Retirees
Yes – I am currently receiving Social Security benefit payments
No – I have not yet started receiving Social Security benefit payments
No – I am not eligible to receive Social Security retirement benefits
BASE: ALL QUALIFIED RESPONDENTS Q1540. Are you currently receiving income from Social Security benefits?BASE: RECEIVING SOCIAL SECURITY BENEFIT PAYMENTSQ1555. At what age did you start receiving income from Social Security benefits? 66
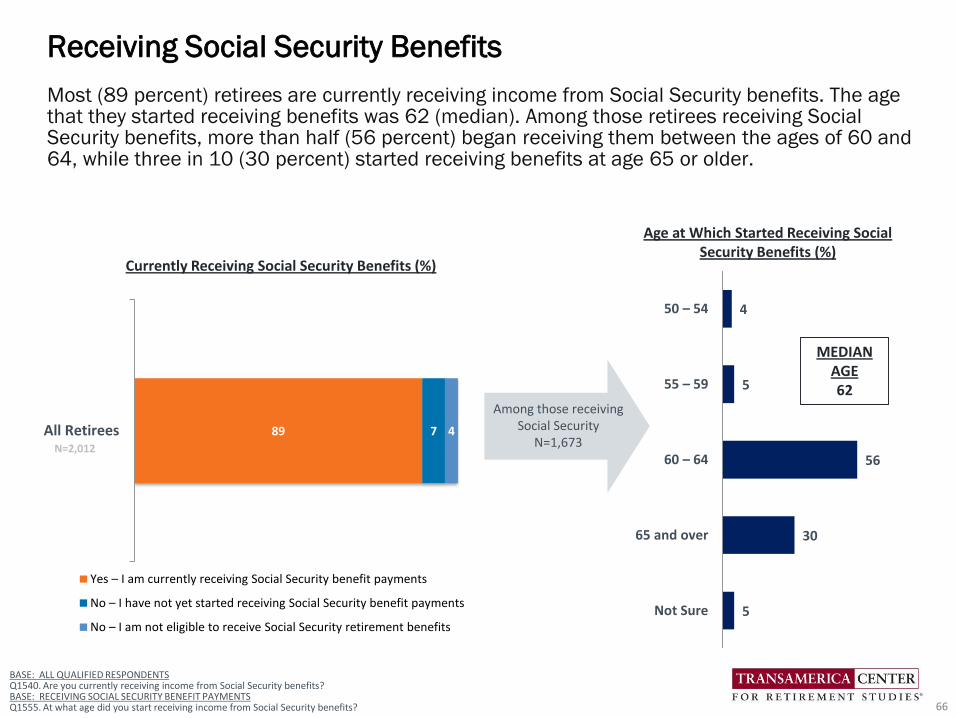
Most (89 percent) retirees are currently receiving income from Social Security benefits. The age that they started receiving benefits was 62 (median). Among those retirees receiving Social Security benefits, more than half (56 percent) began receiving them between the ages of 60 and 64, while three in 10 (30 percent) started receiving benefits at age 65 or older.
Receiving Social Security Benefits
Currently Receiving Social Security Benefits (%)
4
5
56
30
5
50 – 54
55 – 59
60 – 64
65 and over
Not Sure
Age at Which Started Receiving Social Security Benefits (%)
MEDIAN AGE62
N=2,012
Among those receiving Social Security
N=1,673
67
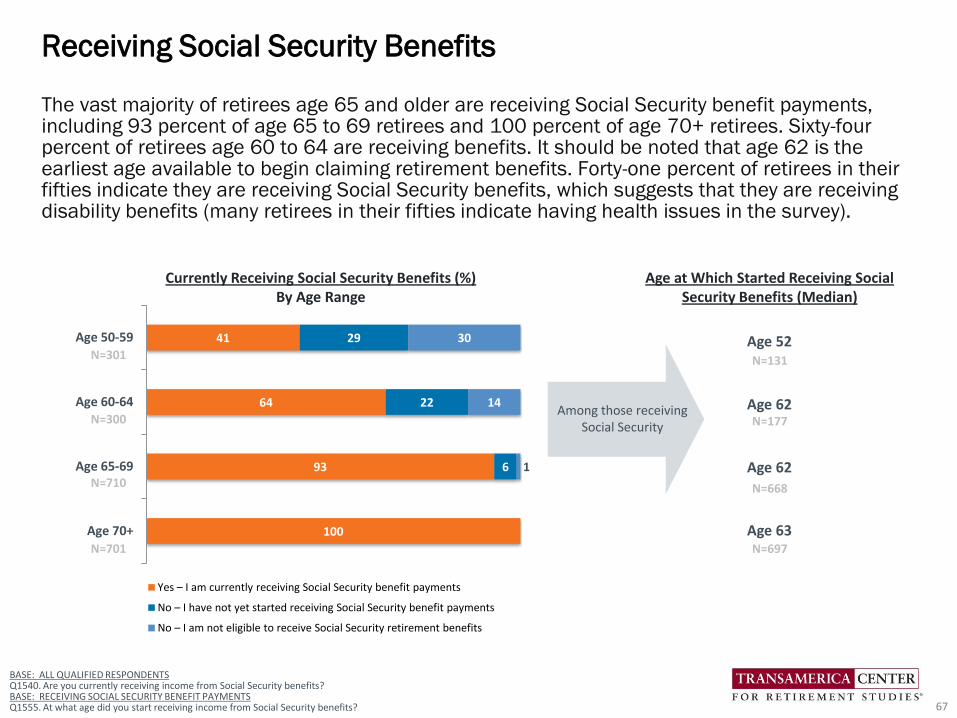
The vast majority of retirees age 65 and older are receiving Social Security benefit payments, including 93 percent of age 65 to 69 retirees and 100 percent of age 70+ retirees. Sixty-four percent of retirees age 60 to 64 are receiving benefits. It should be noted that age 62 is the earliest age available to begin claiming retirement benefits. Forty-one percent of retirees in their fifties indicate they are receiving Social Security benefits, which suggests that they are receiving disability benefits (many retirees in their fifties indicate having health issues in the survey).
Receiving Social Security Benefits
41
64
93
100
29
22
6
30
14
1
Age 50-59
Age 60-64
Age 65-69
Age 70+
Yes – I am currently receiving Social Security benefit payments
No – I have not yet started receiving Social Security benefit payments
No – I am not eligible to receive Social Security retirement benefits
Currently Receiving Social Security Benefits (%)By Age Range
Age at Which Started Receiving Social Security Benefits (Median)
N=301
N=300
N=710
N=701
Age 52
Age 62
Age 62
Age 63
BASE: ALL QUALIFIED RESPONDENTS Q1540. Are you currently receiving income from Social Security benefits?BASE: RECEIVING SOCIAL SECURITY BENEFIT PAYMENTSQ1555. At what age did you start receiving income from Social Security benefits?
Among those receiving Social Security
N=131
N=177
N=668
N=697
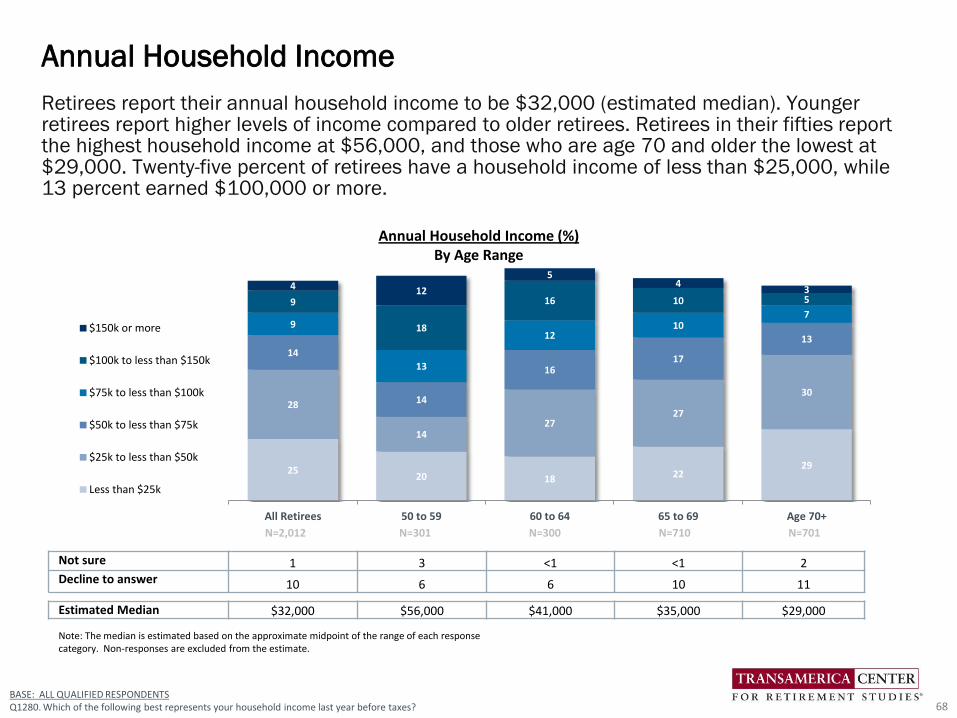
Retirees report their annual household income to be $32,000 (estimated median). Younger retirees report higher levels of income compared to older retirees. Retirees in their fifties report the highest household income at $56,000, and those who are age 70 and older the lowest at $29,000. Twenty-five percent of retirees have a household income of less than $25,000, while 13 percent earned $100,000 or more.
Annual Household Income
68
2520 18 22
29
28
1427
27
30
14
14
1617
13
9
13
1210
79
18
16 10 5
4 12
54
3
All Retirees 50 to 59 60 to 64 65 to 69 Age 70+
$150k or more
$100k to less than $150k
$75k to less than $100k
$50k to less than $75k
$25k to less than $50k
Less than $25k
Not sure 1 3 <1 <1 2Decline to answer 10 6 6 10 11
Estimated Median $32,000 $56,000 $41,000 $35,000 $29,000
Note: The median is estimated based on the approximate midpoint of the range of each response category. Non-responses are excluded from the estimate.
Annual Household Income (%)By Age Range
BASE: ALL QUALIFIED RESPONDENTSQ1280. Which of the following best represents your household income last year before taxes?
N=301 N=300 N=710 N=701N=2,012
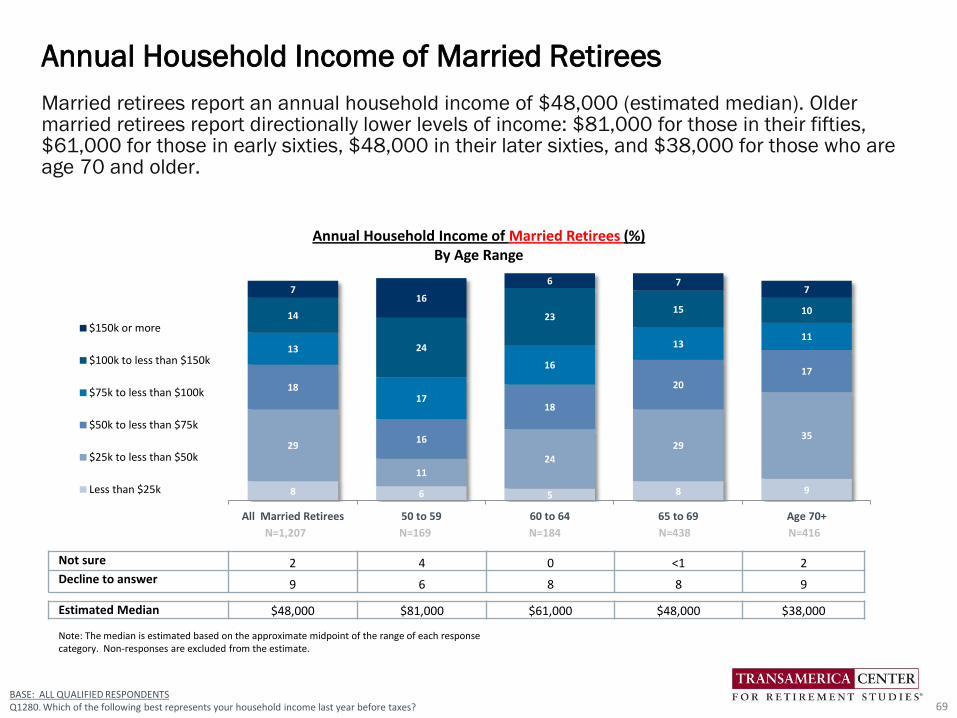
Married retirees report an annual household income of $48,000 (estimated median). Older married retirees report directionally lower levels of income: $81,000 for those in their fifties, $61,000 for those in early sixties, $48,000 in their later sixties, and $38,000 for those who are age 70 and older.
Annual Household Income of Married Retirees
69
8 6 5 8 9
29
11
24
2935
18
16
18
20
17
13
17
16
1311
14
24
2315 10
716
6 77
All Married Retirees 50 to 59 60 to 64 65 to 69 Age 70+
$150k or more
$100k to less than $150k
$75k to less than $100k
$50k to less than $75k
$25k to less than $50k
Less than $25k
Not sure 2 4 0 <1 2Decline to answer 9 6 8 8 9
Estimated Median $48,000 $81,000 $61,000 $48,000 $38,000
Note: The median is estimated based on the approximate midpoint of the range of each response category. Non-responses are excluded from the estimate.
Annual Household Income of Married Retirees (%)By Age Range
BASE: ALL QUALIFIED RESPONDENTSQ1280. Which of the following best represents your household income last year before taxes?
N=169 N=184 N=438 N=416N=1,207
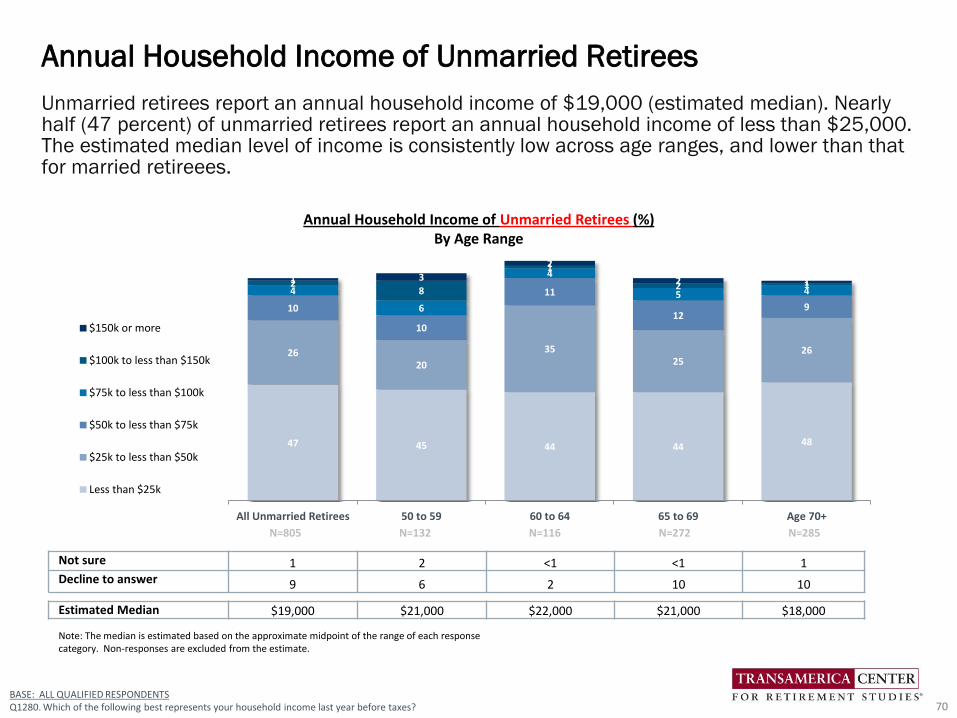
Unmarried retirees report an annual household income of $19,000 (estimated median). Nearly half (47 percent) of unmarried retirees report an annual household income of less than $25,000. The estimated median level of income is consistently low across age ranges, and lower than that for married retireees.
Annual Household Income of Unmarried Retirees
70
47 45 44 44 48
2620
3525
26
10
10
11
129
4
6
4
5 42
8
1
2 11 3
2
2 1
All Unmarried Retirees 50 to 59 60 to 64 65 to 69 Age 70+
$150k or more
$100k to less than $150k
$75k to less than $100k
$50k to less than $75k
$25k to less than $50k
Less than $25k
Not sure 1 2 <1 <1 1Decline to answer 9 6 2 10 10
Estimated Median $19,000 $21,000 $22,000 $21,000 $18,000
Note: The median is estimated based on the approximate midpoint of the range of each response category. Non-responses are excluded from the estimate.
Annual Household Income of Unmarried Retirees (%)By Age Range
BASE: ALL QUALIFIED RESPONDENTSQ1280. Which of the following best represents your household income last year before taxes?
N=132 N=116 N=272 N=285N=805
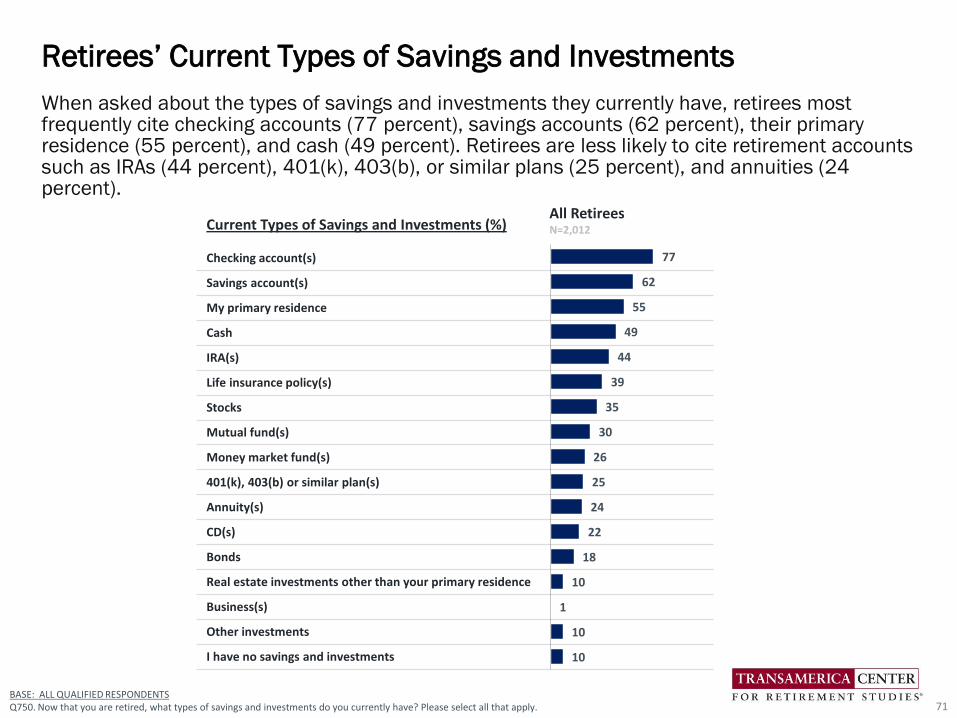
Checking account(s)
Savings account(s)
My primary residence
Cash
IRA(s)
Life insurance policy(s)
Stocks
Mutual fund(s)
Money market fund(s)
401(k), 403(b) or similar plan(s)
Annuity(s)
CD(s)
Bonds
Real estate investments other than your primary residence
Business(s)
Other investments
I have no savings and investments
When asked about the types of savings and investments they currently have, retirees most frequently cite checking accounts (77 percent), savings accounts (62 percent), their primary residence (55 percent), and cash (49 percent). Retirees are less likely to cite retirement accounts such as IRAs (44 percent), 401(k), 403(b), or similar plans (25 percent), and annuities (24 percent).
Retirees’ Current Types of Savings and Investments
71
77
62
55
49
44
39
35
30
26
25
24
22
18
10
1
10
10
BASE: ALL QUALIFIED RESPONDENTSQ750. Now that you are retired, what types of savings and investments do you currently have? Please select all that apply.
All RetireesN=2,012Current Types of Savings and Investments (%)
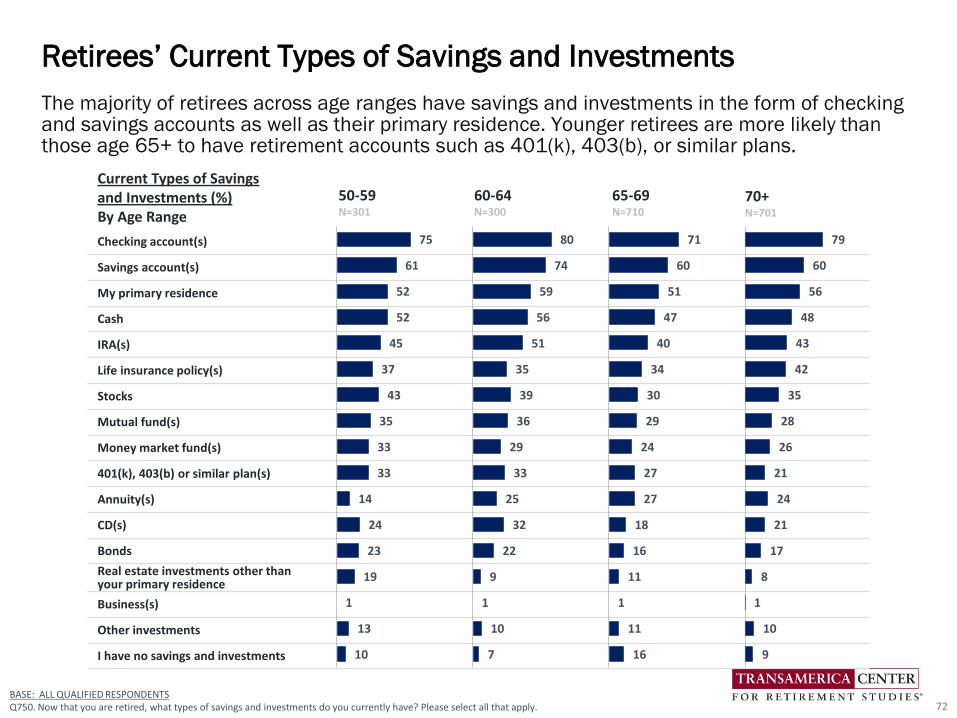
Checking account(s)
Savings account(s)
My primary residence
Cash
IRA(s)
Life insurance policy(s)
Stocks
Mutual fund(s)
Money market fund(s)
401(k), 403(b) or similar plan(s)
Annuity(s)
CD(s)
Bonds
Real estate investments other than your primary residence
Business(s)
Other investments
I have no savings and investments
The majority of retirees across age ranges have savings and investments in the form of checking and savings accounts as well as their primary residence. Younger retirees are more likely than those age 65+ to have retirement accounts such as 401(k), 403(b), or similar plans.
Retirees’ Current Types of Savings and Investments
72
50-59N=301
60-64N=300
65-69N=710
70+N=701
75
61
52
52
45
37
43
35
33
33
14
24
23
19
1
13
10
79
60
56
48
43
42
35
28
26
21
24
21
17
8
1
10
9
71
60
51
47
40
34
30
29
24
27
27
18
16
11
1
11
16
80
74
59
56
51
35
39
36
29
33
25
32
22
9
1
10
7
BASE: ALL QUALIFIED RESPONDENTSQ750. Now that you are retired, what types of savings and investments do you currently have? Please select all that apply.
Current Types of Savings and Investments (%)By Age Range
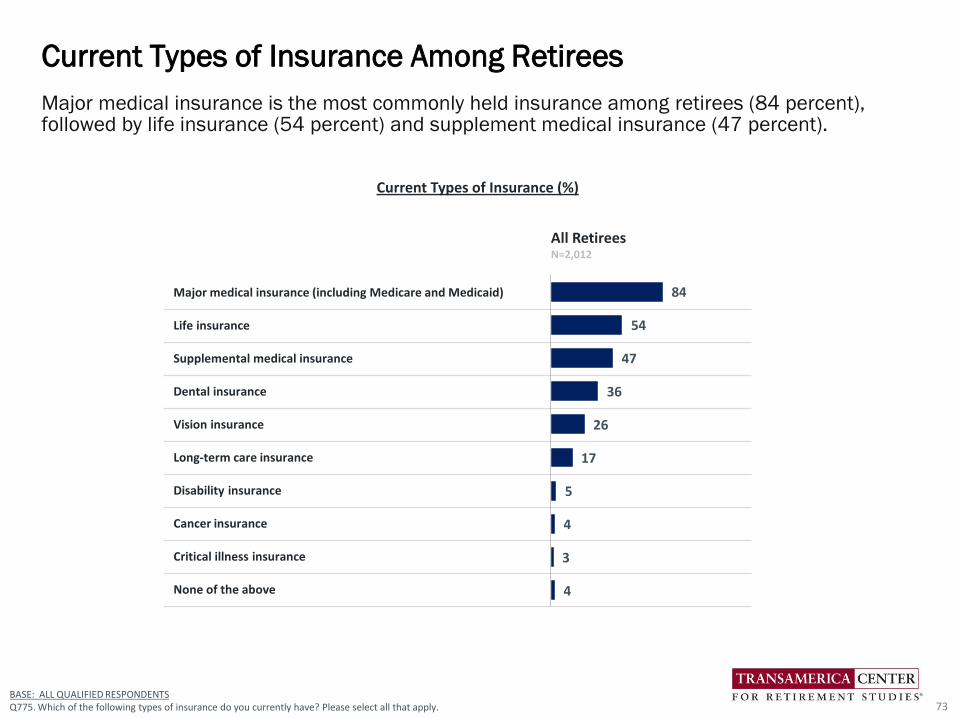
Major medical insurance is the most commonly held insurance among retirees (84 percent), followed by life insurance (54 percent) and supplement medical insurance (47 percent).
Current Types of Insurance Among Retirees
73
Major medical insurance (including Medicare and Medicaid)
Life insurance
Supplemental medical insurance
Dental insurance
Vision insurance
Long-term care insurance
Disability insurance
Cancer insurance
Critical illness insurance
None of the above
84
54
47
36
26
17
5
4
3
4
All RetireesN=2,012
BASE: ALL QUALIFIED RESPONDENTSQ775. Which of the following types of insurance do you currently have? Please select all that apply.
Current Types of Insurance (%)
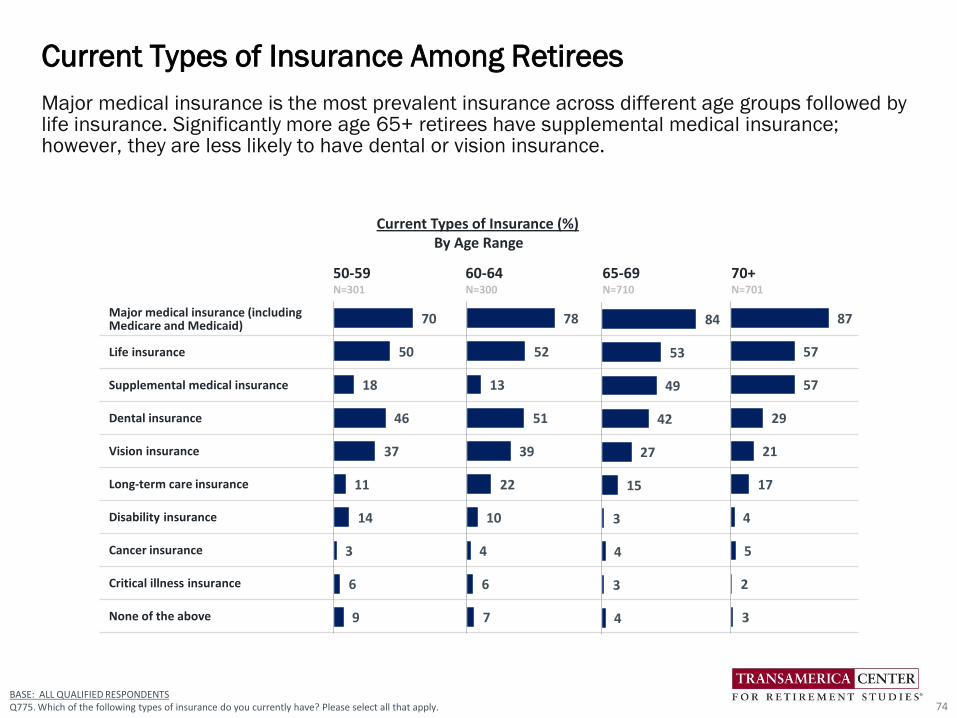
Major medical insurance is the most prevalent insurance across different age groups followed by life insurance. Significantly more age 65+ retirees have supplemental medical insurance; however, they are less likely to have dental or vision insurance.
Current Types of Insurance Among Retirees
74
Major medical insurance (including Medicare and Medicaid)
Life insurance
Supplemental medical insurance
Dental insurance
Vision insurance
Long-term care insurance
Disability insurance
Cancer insurance
Critical illness insurance
None of the above
70
50
18
46
37
11
14
3
6
9
50-59N=301
60-64N=300
65-69N=710
70+N=701
BASE: ALL QUALIFIED RESPONDENTSQ775. Which of the following types of insurance do you currently have? Please select all that apply.
87
57
57
29
21
17
4
5
2
3
84
53
49
42
27
15
3
4
3
4
78
52
13
51
39
22
10
4
6
7
Current Types of Insurance (%)By Age Range
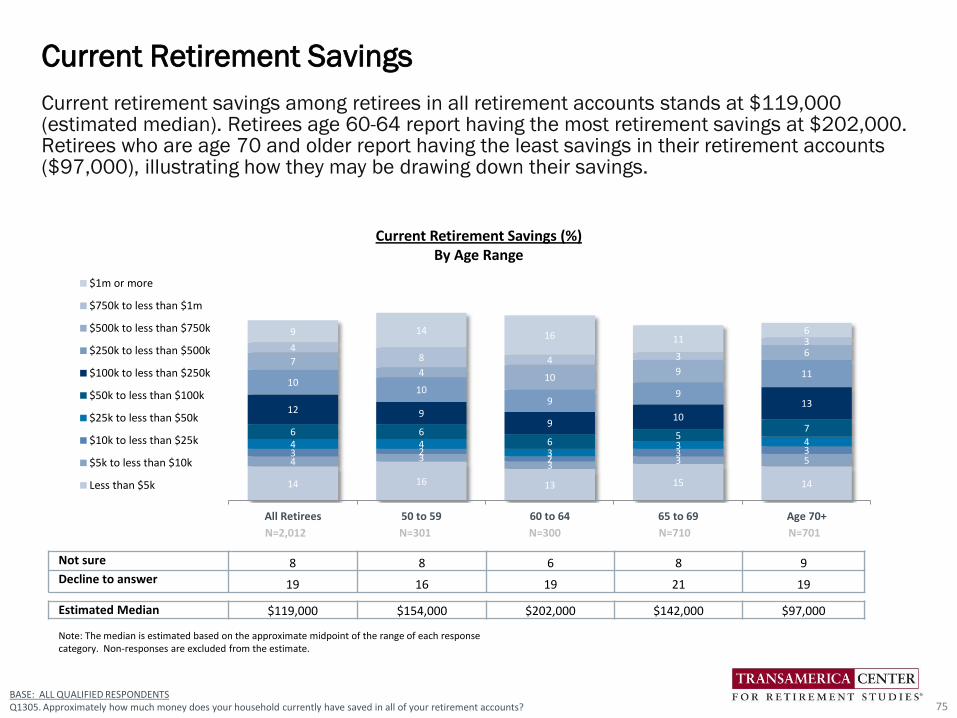
Current retirement savings among retirees in all retirement accounts stands at $119,000 (estimated median). Retirees age 60-64 report having the most retirement savings at $202,000. Retirees who are age 70 and older report having the least savings in their retirement accounts ($97,000), illustrating how they may be drawing down their savings.
Current Retirement Savings
75
14 16 13 15 14
4 33 3 5
3 22
3 34 4
33 4
6 66
57
12 99
10
13
1010
99
117
4 109
648 4 3
39 14 16 11
6
All Retirees 50 to 59 60 to 64 65 to 69 Age 70+
$1m or more
$750k to less than $1m
$500k to less than $750k
$250k to less than $500k
$100k to less than $250k
$50k to less than $100k
$25k to less than $50k
$10k to less than $25k
$5k to less than $10k
Less than $5k
Not sure 8 8 6 8 9Decline to answer 19 16 19 21 19
Estimated Median $119,000 $154,000 $202,000 $142,000 $97,000
Note: The median is estimated based on the approximate midpoint of the range of each response category. Non-responses are excluded from the estimate.
Current Retirement Savings (%)By Age Range
N=301 N=300 N=710 N=701N=2,012
BASE: ALL QUALIFIED RESPONDENTSQ1305. Approximately how much money does your household currently have saved in all of your retirement accounts?
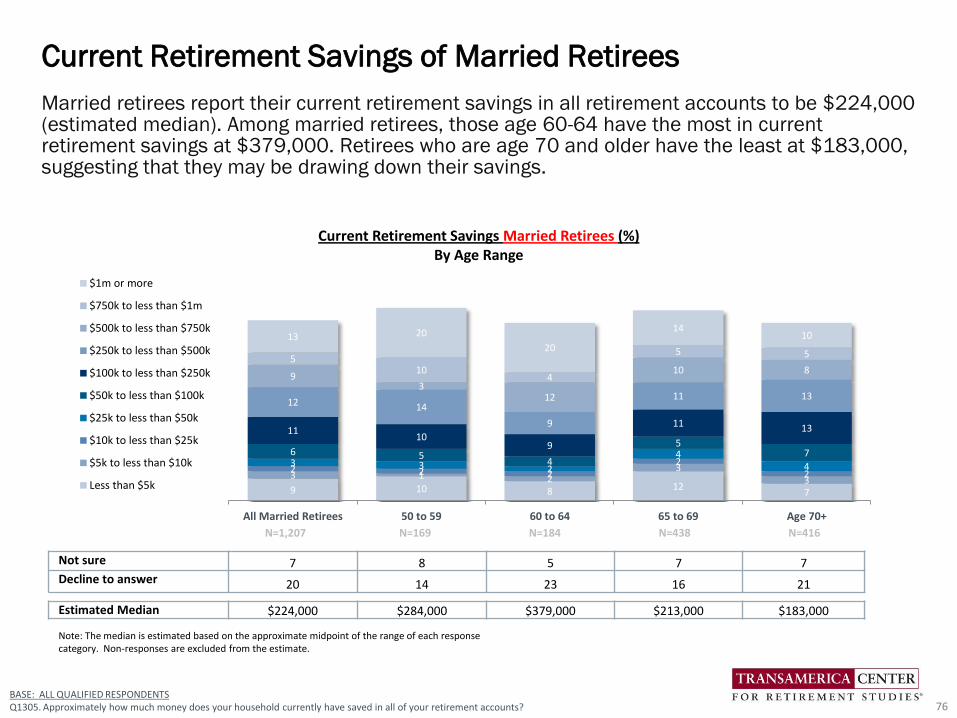
Married retirees report their current retirement savings in all retirement accounts to be $224,000 (estimated median). Among married retirees, those age 60-64 have the most in current retirement savings at $379,000. Retirees who are age 70 and older have the least at $183,000, suggesting that they may be drawing down their savings.
Current Retirement Savings of Married Retirees
76
9 10 8 127
3 1 23
32 2 2
22
3 3 2
44
6 54
57
1110
9
11 13
12 14
9
11 13
93
12
10 85
104
5 5
13 20
20
1410
All Married Retirees 50 to 59 60 to 64 65 to 69 Age 70+
$1m or more
$750k to less than $1m
$500k to less than $750k
$250k to less than $500k
$100k to less than $250k
$50k to less than $100k
$25k to less than $50k
$10k to less than $25k
$5k to less than $10k
Less than $5k
Not sure 7 8 5 7 7Decline to answer 20 14 23 16 21
Estimated Median $224,000 $284,000 $379,000 $213,000 $183,000
Note: The median is estimated based on the approximate midpoint of the range of each response category. Non-responses are excluded from the estimate.
Current Retirement Savings Married Retirees (%)By Age Range
N=169 N=184 N=438 N=416N=1,207
BASE: ALL QUALIFIED RESPONDENTSQ1305. Approximately how much money does your household currently have saved in all of your retirement accounts?
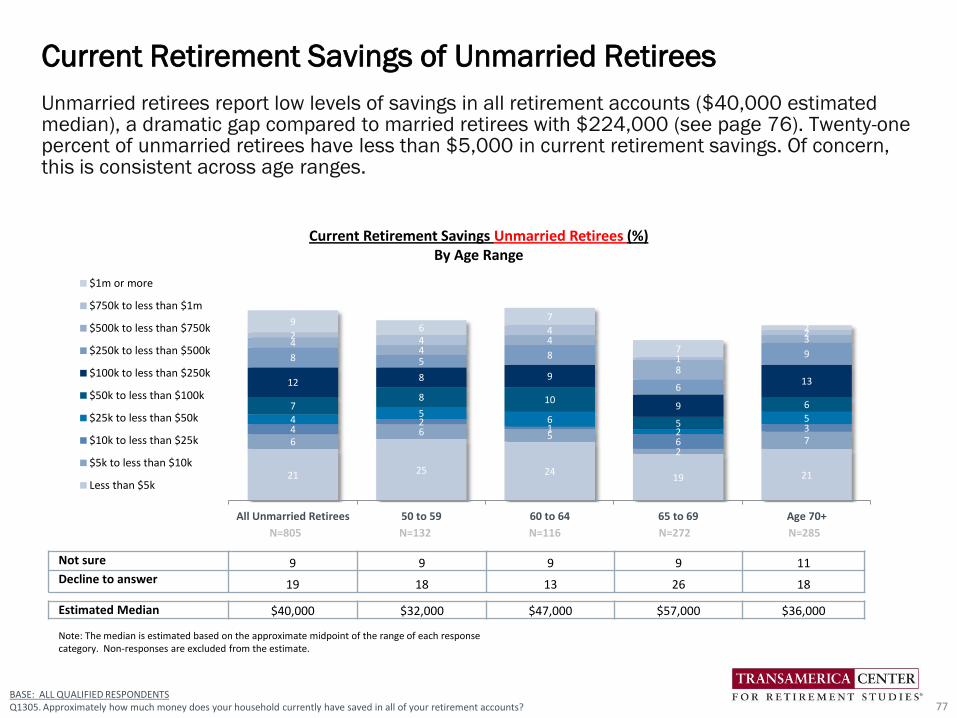
Unmarried retirees report low levels of savings in all retirement accounts ($40,000 estimated median), a dramatic gap compared to married retirees with $224,000 (see page 76). Twenty-one percent of unmarried retirees have less than $5,000 in current retirement savings. Of concern, this is consistent across age ranges.
Current Retirement Savings of Unmarried Retirees
77
21 25 2419 21
66 5
27
42
1
6
34
56
2
57
8 10
5
6
12 8 9
9
13
8 58
6
94
44
8
32 44
1
29
67
7
2
All Unmarried Retirees 50 to 59 60 to 64 65 to 69 Age 70+
$1m or more
$750k to less than $1m
$500k to less than $750k
$250k to less than $500k
$100k to less than $250k
$50k to less than $100k
$25k to less than $50k
$10k to less than $25k
$5k to less than $10k
Less than $5k
Not sure 9 9 9 9 11Decline to answer 19 18 13 26 18
Estimated Median $40,000 $32,000 $47,000 $57,000 $36,000
Note: The median is estimated based on the approximate midpoint of the range of each response category. Non-responses are excluded from the estimate.
Current Retirement Savings Unmarried Retirees (%)By Age Range
N=132 N=116 N=272 N=285N=805
BASE: ALL QUALIFIED RESPONDENTSQ1305. Approximately how much money does your household currently have saved in all of your retirement accounts?
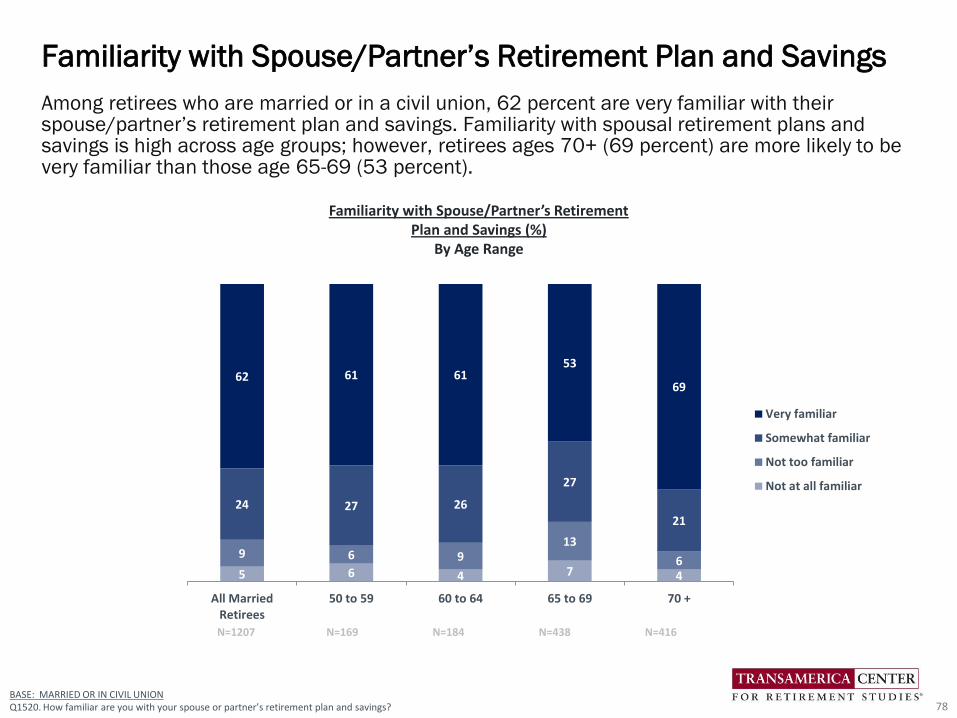
Among retirees who are married or in a civil union, 62 percent are very familiar with their spouse/partner’s retirement plan and savings. Familiarity with spousal retirement plans and savings is high across age groups; however, retirees ages 70+ (69 percent) are more likely to be very familiar than those age 65-69 (53 percent).
Familiarity with Spouse/Partner’s Retirement Plan and Savings
78BASE: MARRIED OR IN CIVIL UNIONQ1520. How familiar are you with your spouse or partner’s retirement plan and savings?
Familiarity with Spouse/Partner’s Retirement Plan and Savings (%)
By Age Range
5 6 4 7 4
9 6 913
6
24 27 26
27
21
62 61 6153
69
All MarriedRetirees
50 to 59 60 to 64 65 to 69 70 +
Very familiar
Somewhat familiar
Not too familiar
Not at all familiar
N=169 N=184 N=438 N=416N=1207
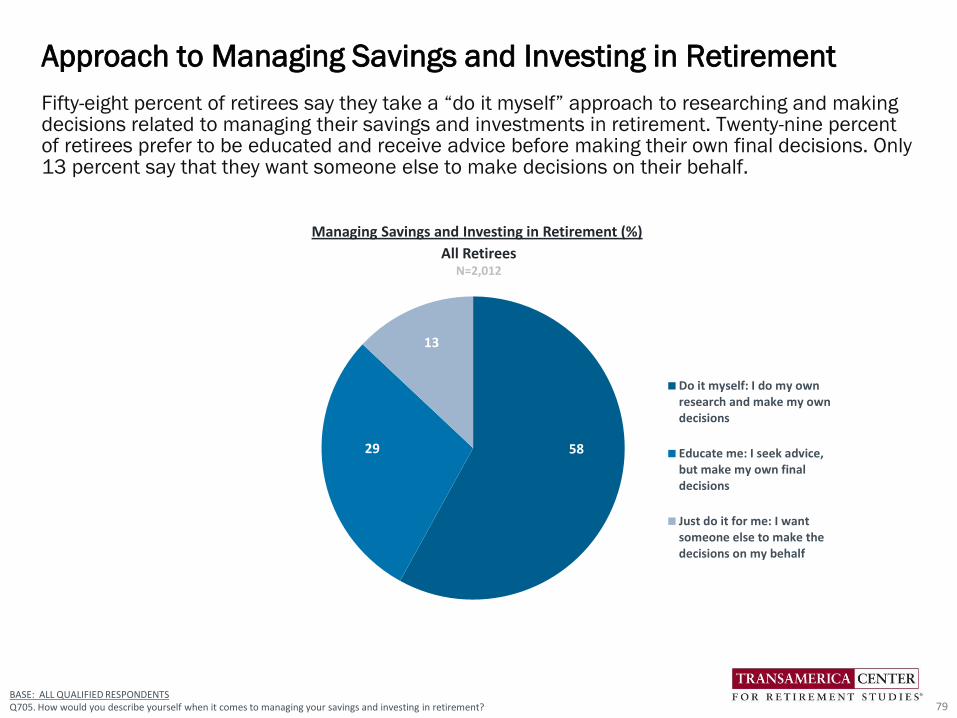
BASE: ALL QUALIFIED RESPONDENTSQ705. How would you describe yourself when it comes to managing your savings and investing in retirement?
Fifty-eight percent of retirees say they take a “do it myself” approach to researching and making decisions related to managing their savings and investments in retirement. Twenty-nine percent of retirees prefer to be educated and receive advice before making their own final decisions. Only 13 percent say that they want someone else to make decisions on their behalf.
Approach to Managing Savings and Investing in Retirement
79
5829
13
Do it myself: I do my ownresearch and make my owndecisions
Educate me: I seek advice,but make my own finaldecisions
Just do it for me: I wantsomeone else to make thedecisions on my behalf
All RetireesN=2,012
Managing Savings and Investing in Retirement (%)
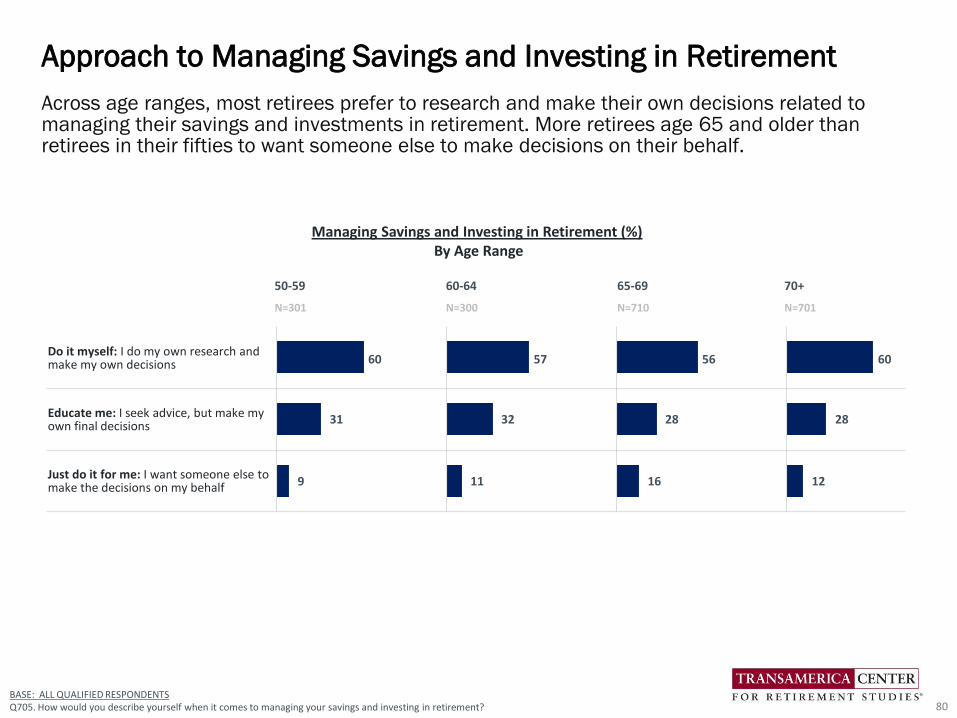
Across age ranges, most retirees prefer to research and make their own decisions related to managing their savings and investments in retirement. More retirees age 65 and older than retirees in their fifties to want someone else to make decisions on their behalf.
Approach to Managing Savings and Investing in Retirement
80
50-59 60-64 65-69 70+
N=301 N=300 N=710 N=701
Do it myself: I do my own research and make my own decisions
Educate me: I seek advice, but make my own final decisions
Just do it for me: I want someone else to make the decisions on my behalf
60
31
9
60
28
12
56
28
16
57
32
11
BASE: ALL QUALIFIED RESPONDENTSQ705. How would you describe yourself when it comes to managing your savings and investing in retirement?
Managing Savings and Investing in Retirement (%)By Age Range
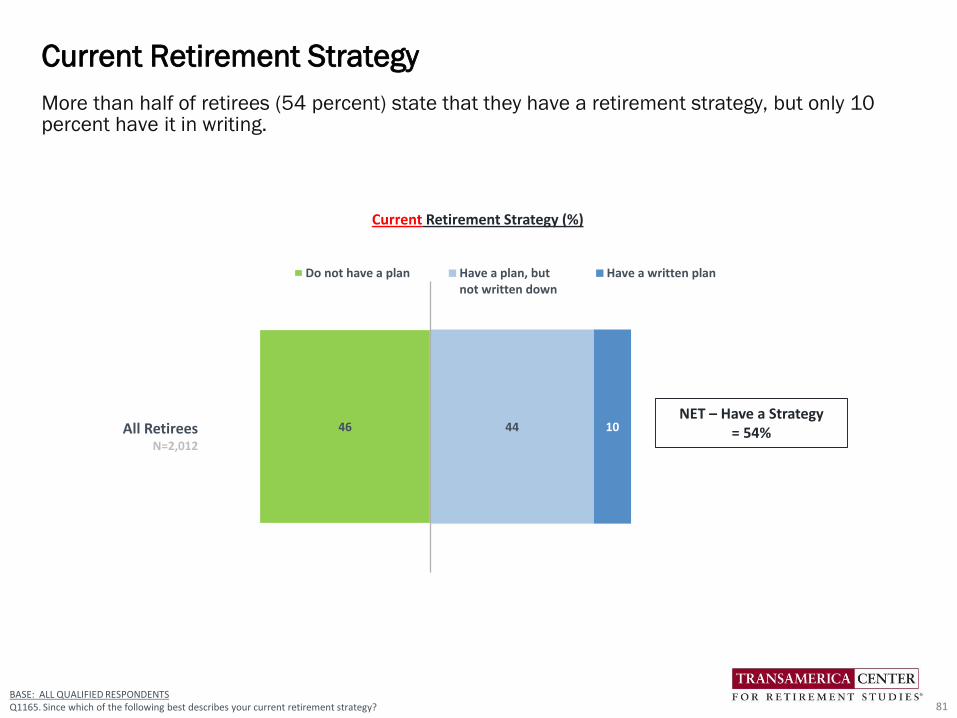
All RetireesN=2,012
46 44 10
Do not have a plan Have a plan, butnot written down
Have a written plan
NET – Have a Strategy= 54%
BASE: ALL QUALIFIED RESPONDENTSQ1165. Since which of the following best describes your current retirement strategy?
More than half of retirees (54 percent) state that they have a retirement strategy, but only 10 percent have it in writing.
Current Retirement Strategy
81
Current Retirement Strategy (%)
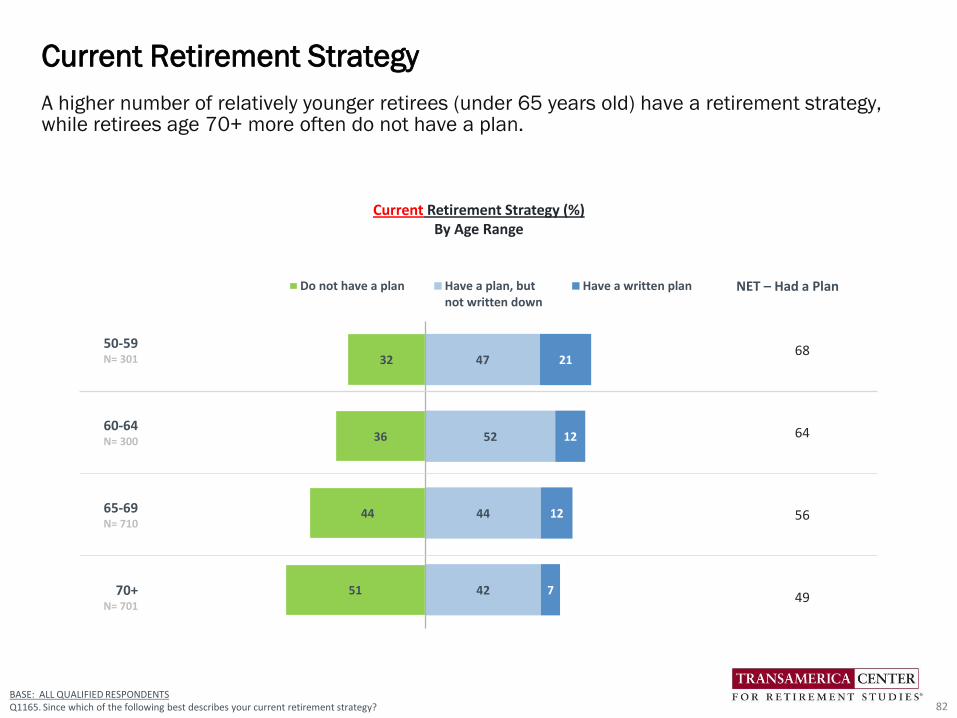
51
44
36
32
42
44
52
47
7
12
12
21
Do not have a plan Have a plan, butnot written down
Have a written plan
A higher number of relatively younger retirees (under 65 years old) have a retirement strategy, while retirees age 70+ more often do not have a plan.
Current Retirement Strategy
82BASE: ALL QUALIFIED RESPONDENTSQ1165. Since which of the following best describes your current retirement strategy?
Current Retirement Strategy (%)By Age Range
NET – Had a Plan
50-59N= 301
68
60-64N= 300
64
65-69N= 710
56
70+N= 701
49
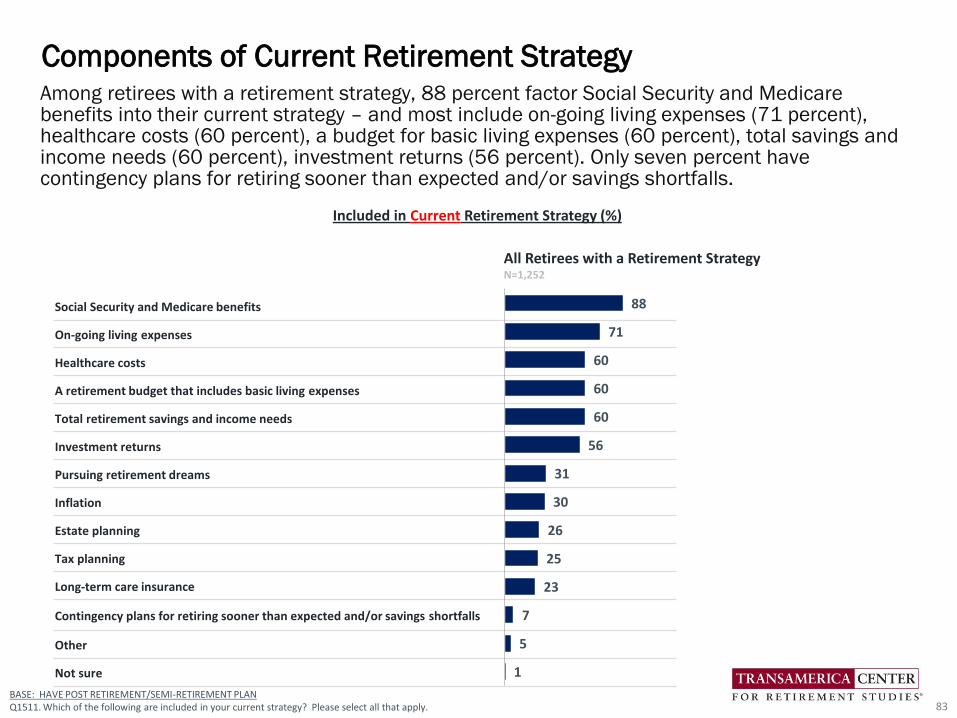
Among retirees with a retirement strategy, 88 percent factor Social Security and Medicare benefits into their current strategy – and most include on-going living expenses (71 percent), healthcare costs (60 percent), a budget for basic living expenses (60 percent), total savings and income needs (60 percent), investment returns (56 percent). Only seven percent have contingency plans for retiring sooner than expected and/or savings shortfalls.
Components of Current Retirement Strategy
83
Social Security and Medicare benefits
On-going living expenses
Healthcare costs
A retirement budget that includes basic living expenses
Total retirement savings and income needs
Investment returns
Pursuing retirement dreams
Inflation
Estate planning
Tax planning
Long-term care insurance
Contingency plans for retiring sooner than expected and/or savings shortfalls
Other
Not sure
88
71
60
60
60
56
31
30
26
25
23
7
5
1
All Retirees with a Retirement StrategyN=1,252
BASE: HAVE POST RETIREMENT/SEMI-RETIREMENT PLANQ1511. Which of the following are included in your current strategy? Please select all that apply.
Included in Current Retirement Strategy (%)
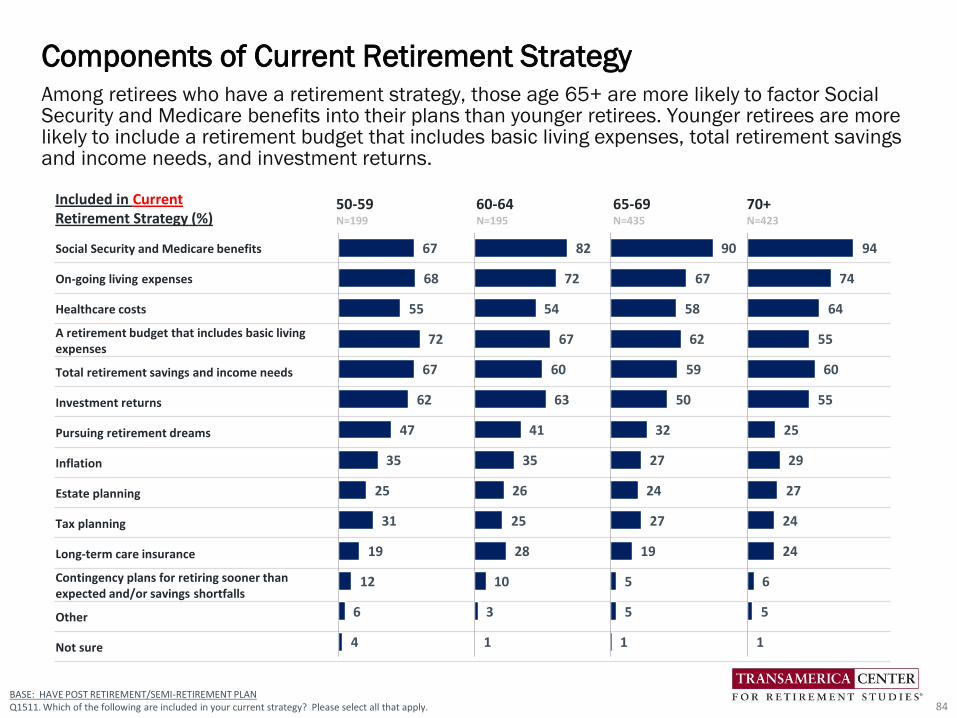
Among retirees who have a retirement strategy, those age 65+ are more likely to factor Social Security and Medicare benefits into their plans than younger retirees. Younger retirees are more likely to include a retirement budget that includes basic living expenses, total retirement savings and income needs, and investment returns.
Components of Current Retirement Strategy
84
Social Security and Medicare benefits
On-going living expenses
Healthcare costs
A retirement budget that includes basic living expenses
Total retirement savings and income needs
Investment returns
Pursuing retirement dreams
Inflation
Estate planning
Tax planning
Long-term care insurance
Contingency plans for retiring sooner than expected and/or savings shortfalls
Other
Not sure
67
68
55
72
67
62
47
35
25
31
19
12
6
4
82
72
54
67
60
63
41
35
26
25
28
10
3
1
90
67
58
62
59
50
32
27
24
27
19
5
5
1
94
74
64
55
60
55
25
29
27
24
24
6
5
1
BASE: HAVE POST RETIREMENT/SEMI-RETIREMENT PLANQ1511. Which of the following are included in your current strategy? Please select all that apply.
50-59N=199
60-64N=195
65-69N=435
70+N=423
Included in CurrentRetirement Strategy (%)
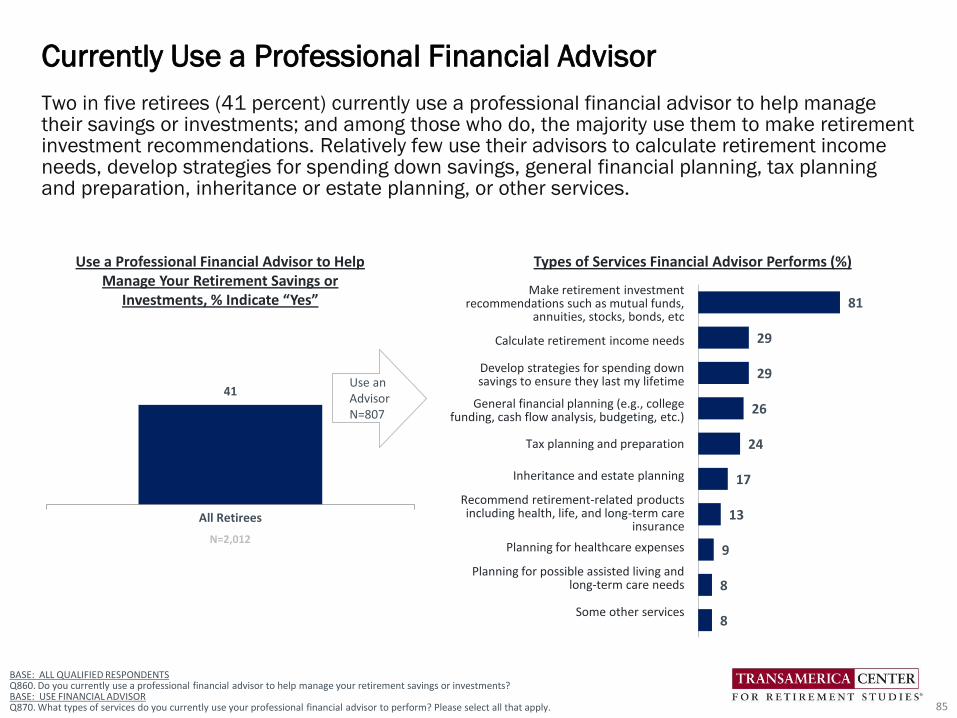
41
All Retirees
BASE: ALL QUALIFIED RESPONDENTSQ860. Do you currently use a professional financial advisor to help manage your retirement savings or investments?BASE: USE FINANCIAL ADVISORQ870. What types of services do you currently use your professional financial advisor to perform? Please select all that apply.
N=2,012
Make retirement investment recommendations such as mutual funds,
annuities, stocks, bonds, etc
Calculate retirement income needs
Develop strategies for spending down savings to ensure they last my lifetime
General financial planning (e.g., college funding, cash flow analysis, budgeting, etc.)
Tax planning and preparation
Inheritance and estate planning
Recommend retirement-related products including health, life, and long-term care
insurance
Planning for healthcare expenses
Planning for possible assisted living and long-term care needs
Some other services
Two in five retirees (41 percent) currently use a professional financial advisor to help manage their savings or investments; and among those who do, the majority use them to make retirement investment recommendations. Relatively few use their advisors to calculate retirement income needs, develop strategies for spending down savings, general financial planning, tax planning and preparation, inheritance or estate planning, or other services.
Currently Use a Professional Financial Advisor
85
Use a Professional Financial Advisor to Help Manage Your Retirement Savings or
Investments, % Indicate “Yes”
Types of Services Financial Advisor Performs (%)
Use an Advisor N=807
81
29
29
26
24
17
13
9
8
8
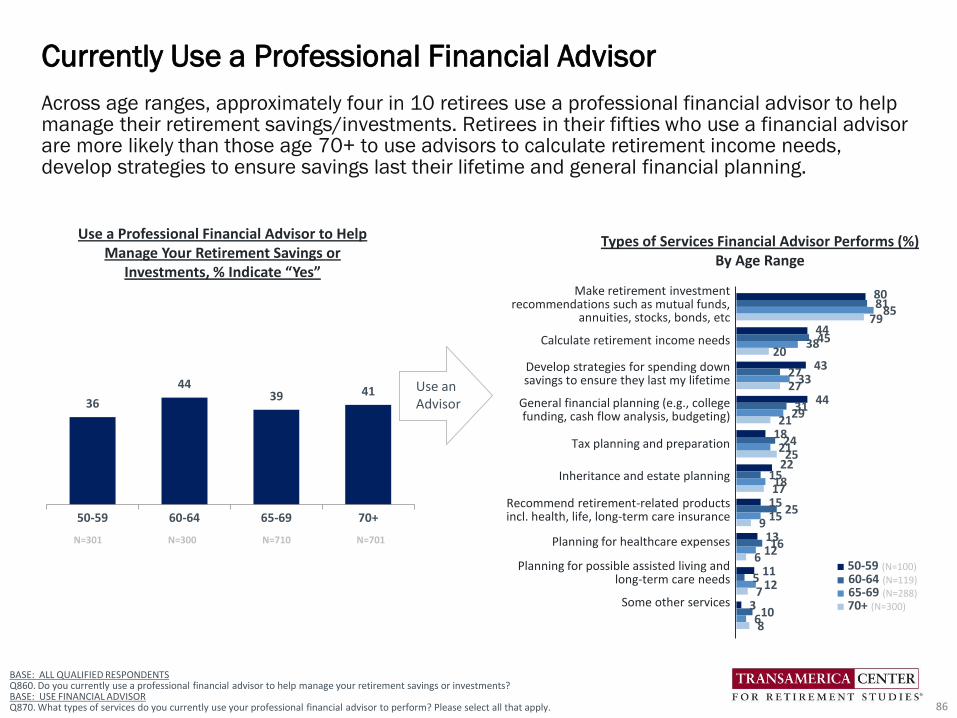
36
4439 41
50-59 60-64 65-69 70+
80
44
43
44
18
22
15
13
11
3
81
45
27
31
24
15
25
16
5
10
85
38
33
29
21
18
15
12
12
6
79
20
27
21
25
17
9
6
7
8
BASE: ALL QUALIFIED RESPONDENTS Q860. Do you currently use a professional financial advisor to help manage your retirement savings or investments?BASE: USE FINANCIAL ADVISOR Q870. What types of services do you currently use your professional financial advisor to perform? Please select all that apply.
N=301 N=300 N=710 N=701
■ 50-59 (N=100)
■ 60-64 (N=119)■ 65-69 (N=288)■ 70+ (N=300)
Across age ranges, approximately four in 10 retirees use a professional financial advisor to help manage their retirement savings/investments. Retirees in their fifties who use a financial advisor are more likely than those age 70+ to use advisors to calculate retirement income needs, develop strategies to ensure savings last their lifetime and general financial planning.
Currently Use a Professional Financial Advisor
86
Use a Professional Financial Advisor to Help Manage Your Retirement Savings or
Investments, % Indicate “Yes”
Types of Services Financial Advisor Performs (%)By Age Range
Make retirement investment recommendations such as mutual funds,
annuities, stocks, bonds, etc
Calculate retirement income needs
Develop strategies for spending down savings to ensure they last my lifetime
General financial planning (e.g., college funding, cash flow analysis, budgeting)
Tax planning and preparation
Inheritance and estate planning
Recommend retirement-related productsincl. health, life, long-term care insurance
Planning for healthcare expenses
Planning for possible assisted living and long-term care needs
Some other services
Use an Advisor
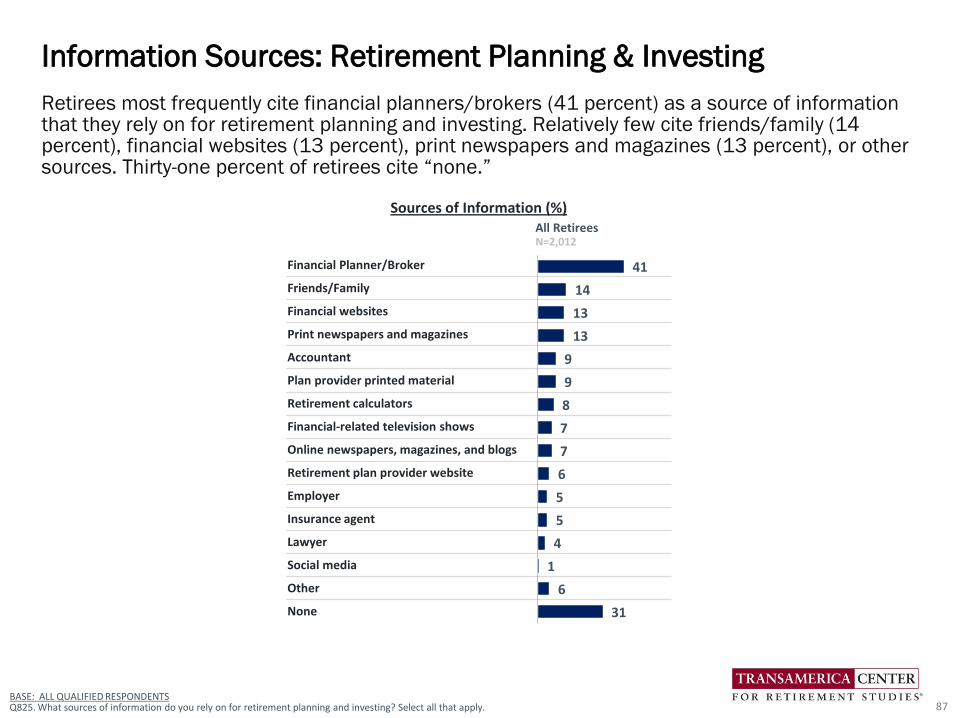
Sources of Information (%)All RetireesN=2,012
Financial Planner/Broker
Friends/Family
Financial websites
Print newspapers and magazines
Accountant
Plan provider printed material
Retirement calculators
Financial-related television shows
Online newspapers, magazines, and blogs
Retirement plan provider website
Employer
Insurance agent
Lawyer
Social media
Other
None
41
14
13
13
9
9
8
7
7
6
5
5
4
1
6
31
BASE: ALL QUALIFIED RESPONDENTS Q825. What sources of information do you rely on for retirement planning and investing? Select all that apply.
Retirees most frequently cite financial planners/brokers (41 percent) as a source of information that they rely on for retirement planning and investing. Relatively few cite friends/family (14 percent), financial websites (13 percent), print newspapers and magazines (13 percent), or other sources. Thirty-one percent of retirees cite “none.”
Information Sources: Retirement Planning & Investing
87
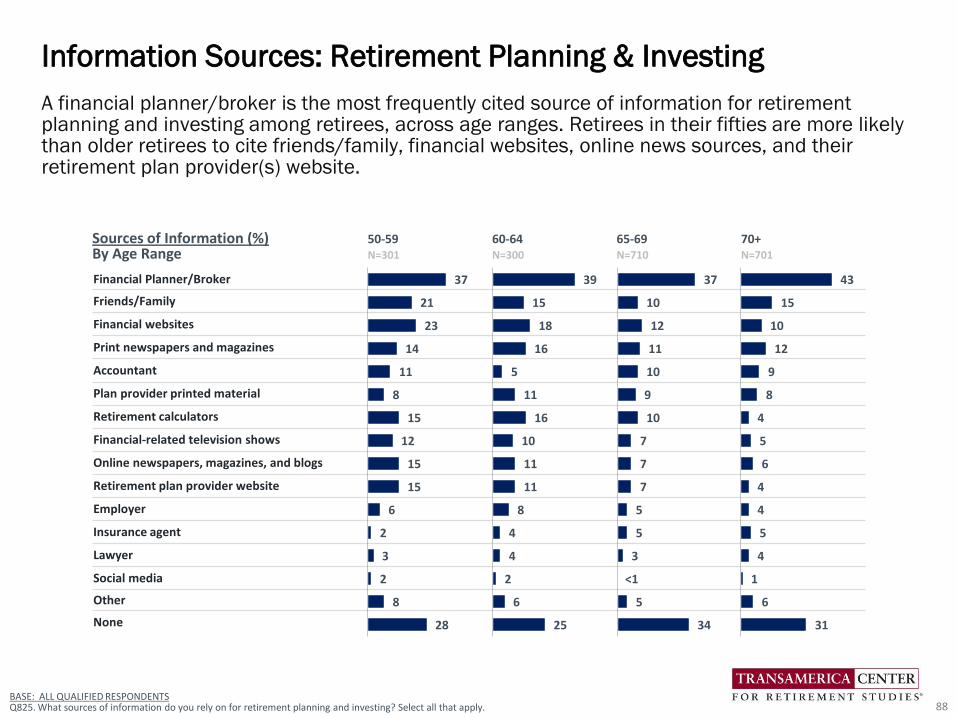
Sources of Information (%) 50-59 60-64 65-69 70+By Age Range N=301 N=300 N=710 N=701
Financial Planner/Broker
Friends/Family
Financial websites
Print newspapers and magazines
Accountant
Plan provider printed material
Retirement calculators
Financial-related television shows
Online newspapers, magazines, and blogs
Retirement plan provider website
Employer
Insurance agent
Lawyer
Social media
Other
None
43
15
10
12
9
8
4
5
6
4
4
5
4
1
6
31
39
15
18
16
5
11
16
10
11
11
8
4
4
2
6
25
37
21
23
14
11
8
15
12
15
15
6
2
3
2
8
28
BASE: ALL QUALIFIED RESPONDENTS Q825. What sources of information do you rely on for retirement planning and investing? Select all that apply.
A financial planner/broker is the most frequently cited source of information for retirement planning and investing among retirees, across age ranges. Retirees in their fifties are more likely than older retirees to cite friends/family, financial websites, online news sources, and their retirement plan provider(s) website.
Information Sources: Retirement Planning & Investing
88
37
10
12
11
10
9
10
7
7
7
5
5
3
<1
5
34
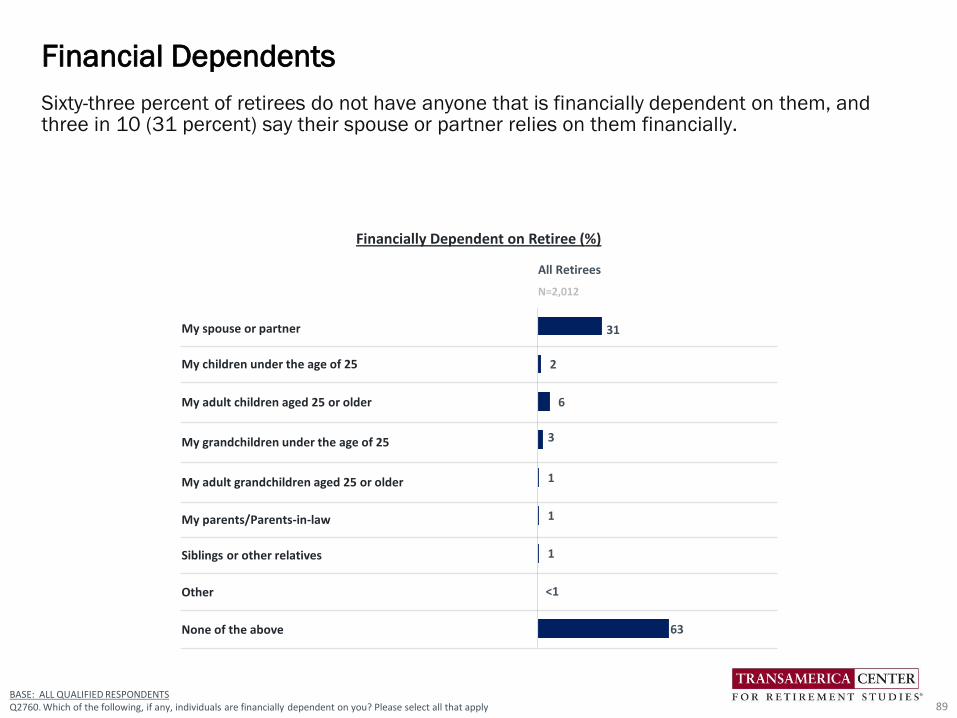
All Retirees
N=2,012
My spouse or partner
My children under the age of 25
My adult children aged 25 or older
My grandchildren under the age of 25
My adult grandchildren aged 25 or older
My parents/Parents-in-law
Siblings or other relatives
Other
None of the above
Sixty-three percent of retirees do not have anyone that is financially dependent on them, and three in 10 (31 percent) say their spouse or partner relies on them financially.
Financial Dependents
89BASE: ALL QUALIFIED RESPONDENTS Q2760. Which of the following, if any, individuals are financially dependent on you? Please select all that apply
31
2
6
3
1
1
1
<1
63
Financially Dependent on Retiree (%)
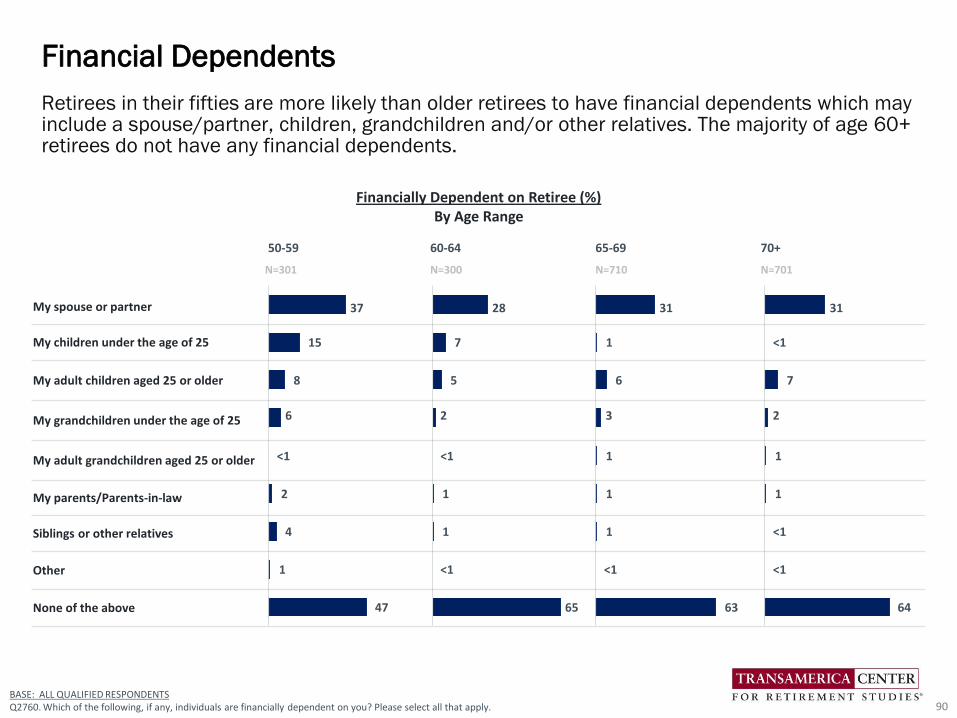
50-59 60-64 65-69 70+
N=301 N=300 N=710 N=701
My spouse or partner
My children under the age of 25
My adult children aged 25 or older
My grandchildren under the age of 25
My adult grandchildren aged 25 or older
My parents/Parents-in-law
Siblings or other relatives
Other
None of the above
Retirees in their fifties are more likely than older retirees to have financial dependents which may include a spouse/partner, children, grandchildren and/or other relatives. The majority of age 60+ retirees do not have any financial dependents.
Financial Dependents
90BASE: ALL QUALIFIED RESPONDENTS Q2760. Which of the following, if any, individuals are financially dependent on you? Please select all that apply.
37
15
8
6
<1
2
4
1
47
Financially Dependent on Retiree (%) By Age Range
28
7
5
2
<1
1
1
<1
65
31
1
6
3
1
1
1
<1
63
31
<1
7
2
1
1
<1
<1
64
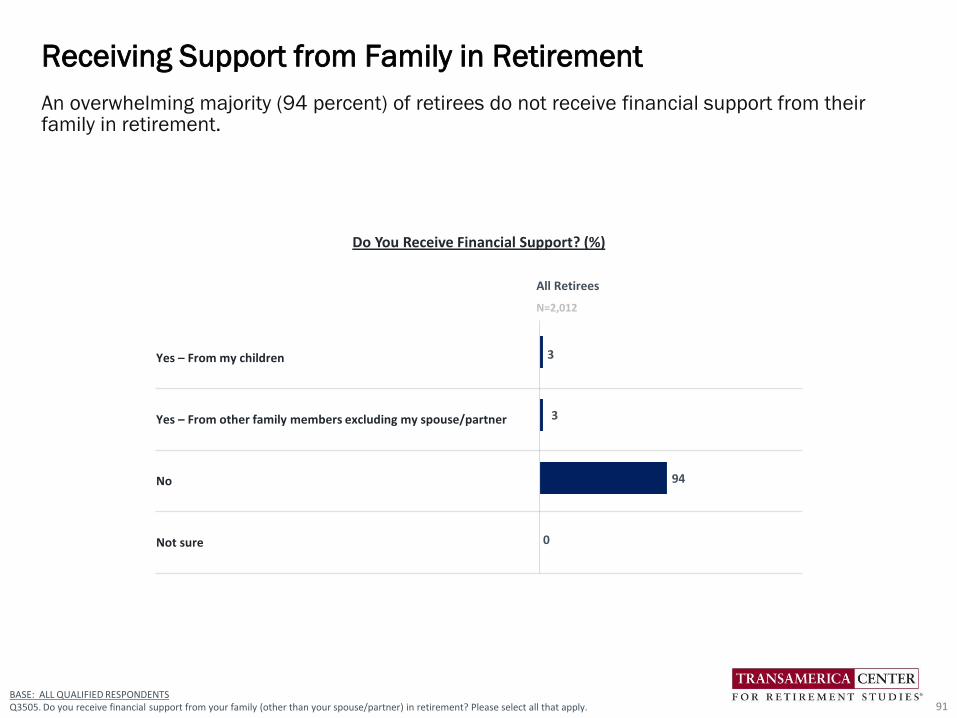
BASE: ALL QUALIFIED RESPONDENTSQ3505. Do you receive financial support from your family (other than your spouse/partner) in retirement? Please select all that apply.
An overwhelming majority (94 percent) of retirees do not receive financial support from their family in retirement.
Receiving Support from Family in Retirement
91
Do You Receive Financial Support? (%)
All Retirees
N=2,012
Yes – From my children
Yes – From other family members excluding my spouse/partner
No
Not sure
3
3
94
0
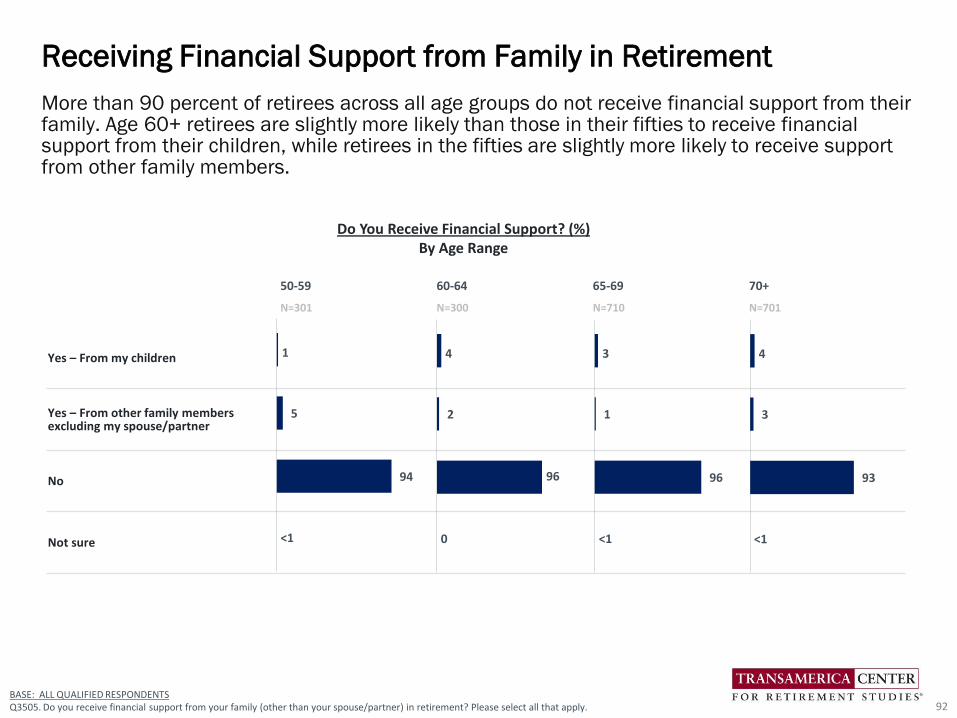
More than 90 percent of retirees across all age groups do not receive financial support from their family. Age 60+ retirees are slightly more likely than those in their fifties to receive financial support from their children, while retirees in the fifties are slightly more likely to receive support from other family members.
Receiving Financial Support from Family in Retirement
92
50-59 60-64 65-69 70+
N=301 N=300 N=710 N=701
Yes – From my children
Yes – From other family members excluding my spouse/partner
No
Not sure
1
5
94
<1
4
2
96
0
3
1
96
<1
4
3
93
<1
BASE: ALL QUALIFIED RESPONDENTSQ3505. Do you receive financial support from your family (other than your spouse/partner) in retirement? Please select all that apply.
Do You Receive Financial Support? (%)By Age Range
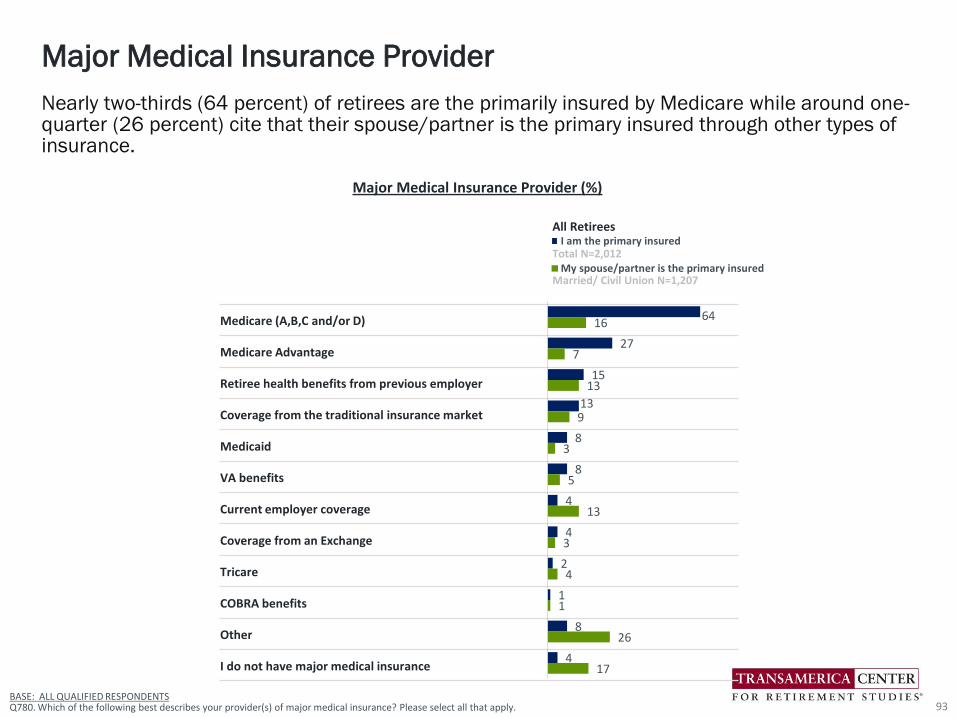
Nearly two-thirds (64 percent) of retirees are the primarily insured by Medicare while around one-quarter (26 percent) cite that their spouse/partner is the primary insured through other types of insurance.
Major Medical Insurance Provider
93BASE: ALL QUALIFIED RESPONDENTSQ780. Which of the following best describes your provider(s) of major medical insurance? Please select all that apply.
All Retirees
Total N=2,012
Married/ Civil Union N=1,207
Medicare (A,B,C and/or D)
Medicare Advantage
Retiree health benefits from previous employer
Coverage from the traditional insurance market
Medicaid
VA benefits
Current employer coverage
Coverage from an Exchange
Tricare
COBRA benefits
Other
I do not have major medical insurance
Major Medical Insurance Provider (%)
64
27
15
13
8
8
4
4
2
1
8
4
16
7
13
9
3
5
13
3
4
1
26
17
I am the primary insured
My spouse/partner is the primary insured
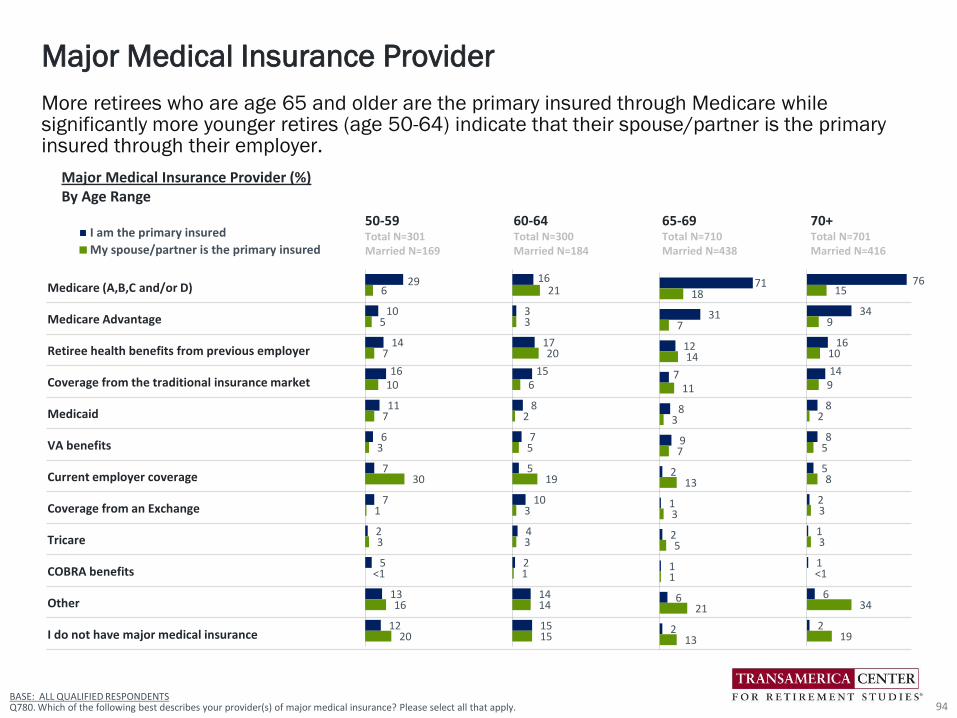
More retirees who are age 65 and older are the primary insured through Medicare while significantly more younger retires (age 50-64) indicate that their spouse/partner is the primary insured through their employer.
Major Medical Insurance Provider
94
50-59Total N=301Married N=169
60-64Total N=300Married N=184
65-69Total N=710Married N=438
70+Total N=701Married N=416
Medicare (A,B,C and/or D)
Medicare Advantage
Retiree health benefits from previous employer
Coverage from the traditional insurance market
Medicaid
VA benefits
Current employer coverage
Coverage from an Exchange
Tricare
COBRA benefits
Other
I do not have major medical insurance
BASE: ALL QUALIFIED RESPONDENTSQ780. Which of the following best describes your provider(s) of major medical insurance? Please select all that apply.
Major Medical Insurance Provider (%)By Age Range
I am the primary insured
My spouse/partner is the primary insured
29
10
14
16
11
6
7
7
2
5
13
12
6
5
7
10
7
3
30
1
3
<1
16
20
16
3
17
15
8
7
5
10
4
2
14
15
21
3
20
6
2
5
19
3
3
1
14
15
71
31
12
7
8
9
2
1
2
1
6
2
18
7
14
11
3
7
13
3
5
1
21
13
76
34
16
14
8
8
5
2
1
1
6
2
15
9
10
9
2
5
8
3
3
<1
34
19
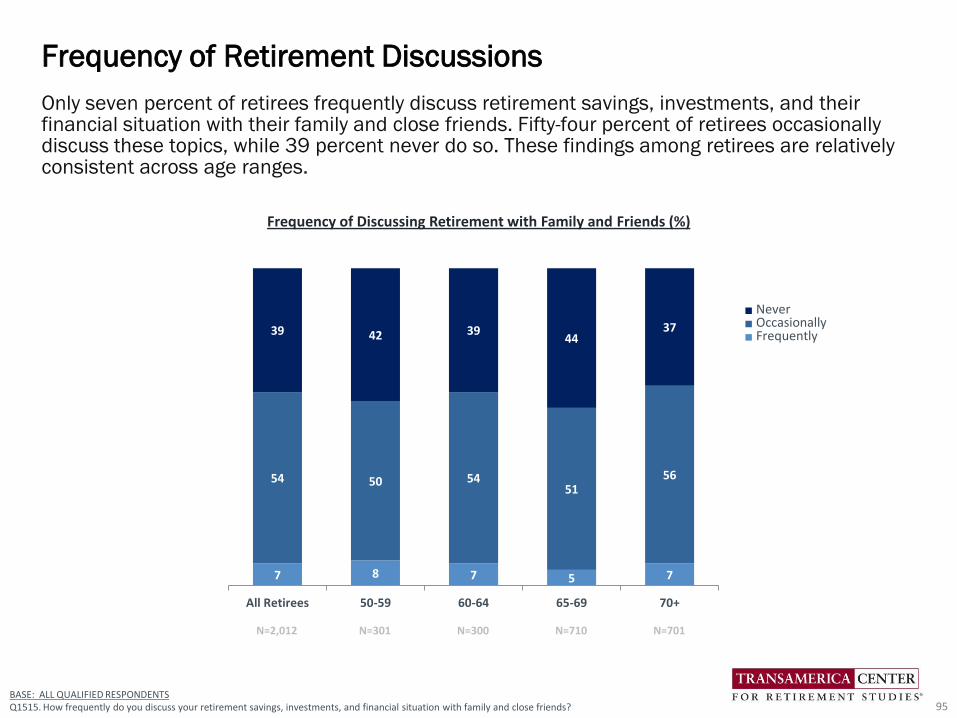
Only seven percent of retirees frequently discuss retirement savings, investments, and their financial situation with their family and close friends. Fifty-four percent of retirees occasionally discuss these topics, while 39 percent never do so. These findings among retirees are relatively consistent across age ranges.
Frequency of Retirement Discussions
95
75787
5651
545054
3744
394239
70+65-6960-6450-59All Retirees
BASE: ALL QUALIFIED RESPONDENTS Q1515. How frequently do you discuss your retirement savings, investments, and financial situation with family and close friends?
Frequency of Discussing Retirement with Family and Friends (%)
■ Never■ Occasionally■ Frequently
N=2,012 N=301 N=300 N=710 N=701
Detailed Findings
Looking Back on Retirement Preparations &
Lessons Learned
96
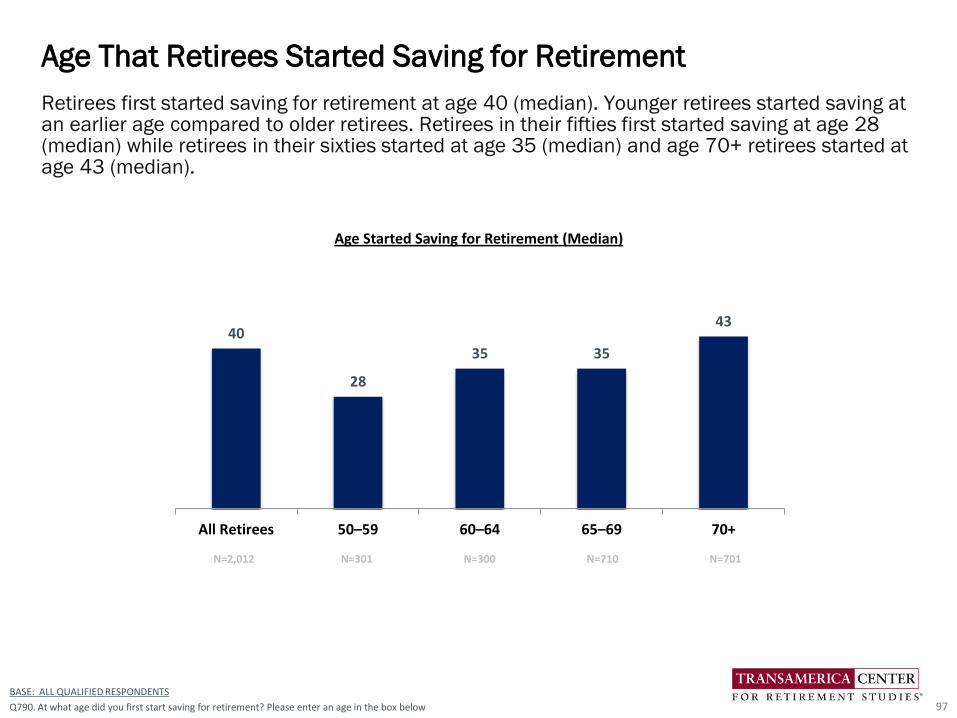
Retirees first started saving for retirement at age 40 (median). Younger retirees started saving at an earlier age compared to older retirees. Retirees in their fifties first started saving at age 28 (median) while retirees in their sixties started at age 35 (median) and age 70+ retirees started at age 43 (median).
Age That Retirees Started Saving for Retirement
97
BASE: ALL QUALIFIED RESPONDENTS
Q790. At what age did you first start saving for retirement? Please enter an age in the box below
40
28
35 35
43
All Retirees 50–59 60–64 65–69 70+
Age Started Saving for Retirement (Median)
N=301 N=300 N=710 N=701N=2,012
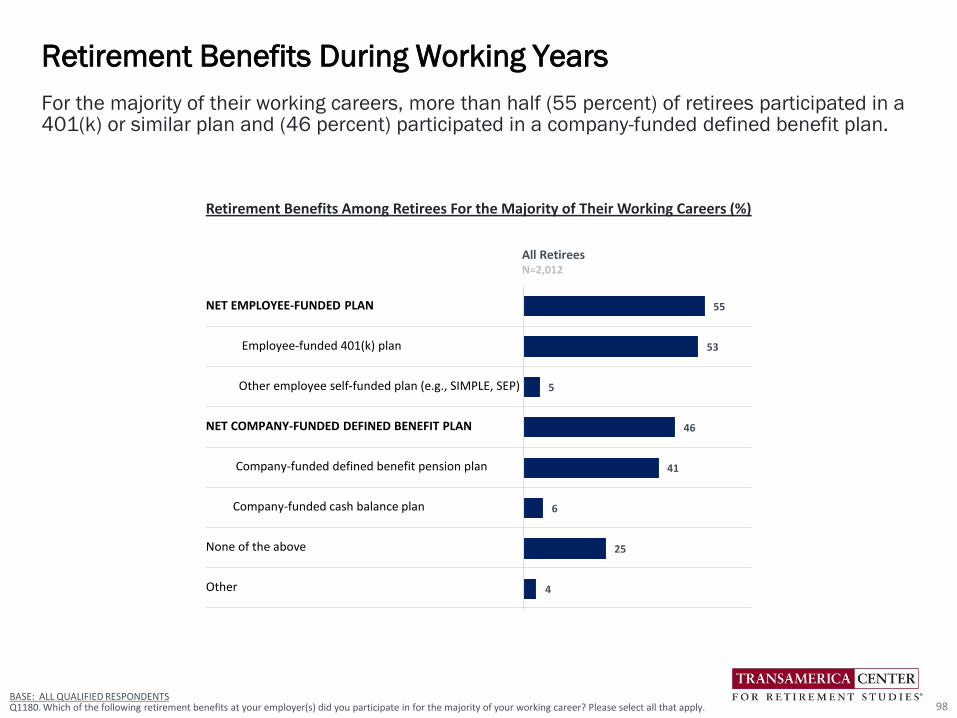
For the majority of their working careers, more than half (55 percent) of retirees participated in a 401(k) or similar plan and (46 percent) participated in a company-funded defined benefit plan.
Retirement Benefits During Working Years
98BASE: ALL QUALIFIED RESPONDENTSQ1180. Which of the following retirement benefits at your employer(s) did you participate in for the majority of your working career? Please select all that apply.
All RetireesN=2,012
NET EMPLOYEE-FUNDED PLAN
Employee-funded 401(k) plan
Other employee self-funded plan (e.g., SIMPLE, SEP)
NET COMPANY-FUNDED DEFINED BENEFIT PLAN
Company-funded defined benefit pension plan
Company-funded cash balance plan
None of the above
Other
Retirement Benefits Among Retirees For the Majority of Their Working Careers (%)
55
53
5
46
41
6
25
4
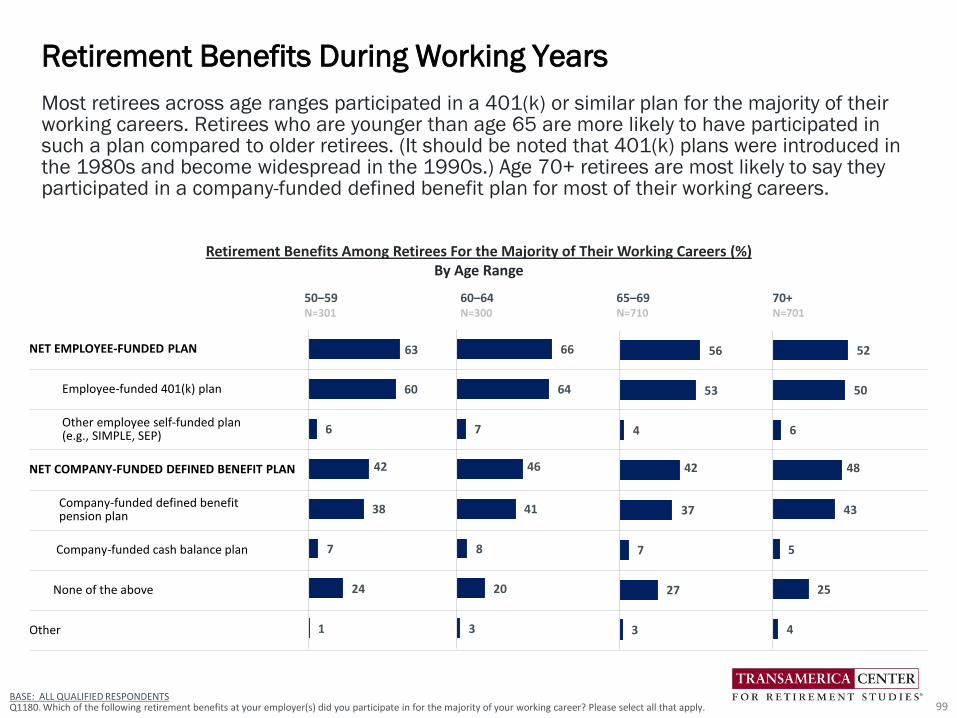
Most retirees across age ranges participated in a 401(k) or similar plan for the majority of their working careers. Retirees who are younger than age 65 are more likely to have participated in such a plan compared to older retirees. (It should be noted that 401(k) plans were introduced in the 1980s and become widespread in the 1990s.) Age 70+ retirees are most likely to say they participated in a company-funded defined benefit plan for most of their working careers.
Retirement Benefits During Working Years
99BASE: ALL QUALIFIED RESPONDENTSQ1180. Which of the following retirement benefits at your employer(s) did you participate in for the majority of your working career? Please select all that apply.
Retirement Benefits Among Retirees For the Majority of Their Working Careers (%)By Age Range
50–59 60–64 65–69 70+N=301 N=300 N=710 N=701
NET EMPLOYEE-FUNDED PLAN
Employee-funded 401(k) plan
Other employee self-funded plan (e.g., SIMPLE, SEP)
NET COMPANY-FUNDED DEFINED BENEFIT PLAN
Company-funded defined benefit pension plan
Company-funded cash balance plan
None of the above
Other
56
53
4
42
37
7
27
3
52
50
6
48
43
5
25
4
66
64
7
46
41
8
20
3
63
60
6
42
38
7
24
1
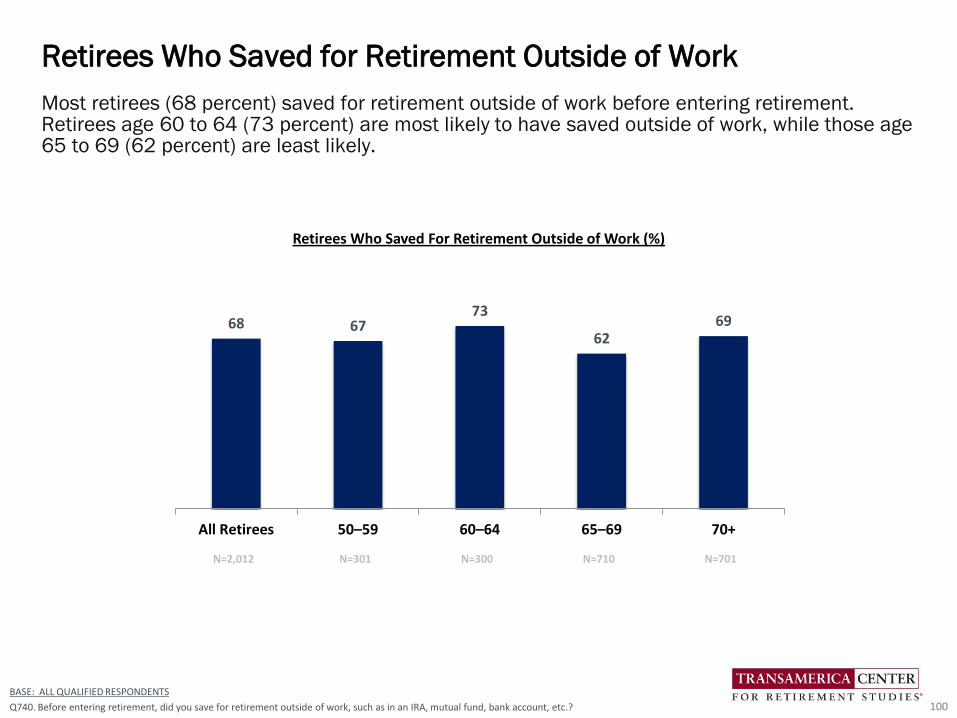
Most retirees (68 percent) saved for retirement outside of work before entering retirement. Retirees age 60 to 64 (73 percent) are most likely to have saved outside of work, while those age 65 to 69 (62 percent) are least likely.
Retirees Who Saved for Retirement Outside of Work
100
BASE: ALL QUALIFIED RESPONDENTS
Q740. Before entering retirement, did you save for retirement outside of work, such as in an IRA, mutual fund, bank account, etc.?
68 6773
6269
All Retirees 50–59 60–64 65–69 70+
Retirees Who Saved For Retirement Outside of Work (%)
N=301 N=300 N=710 N=701N=2,012
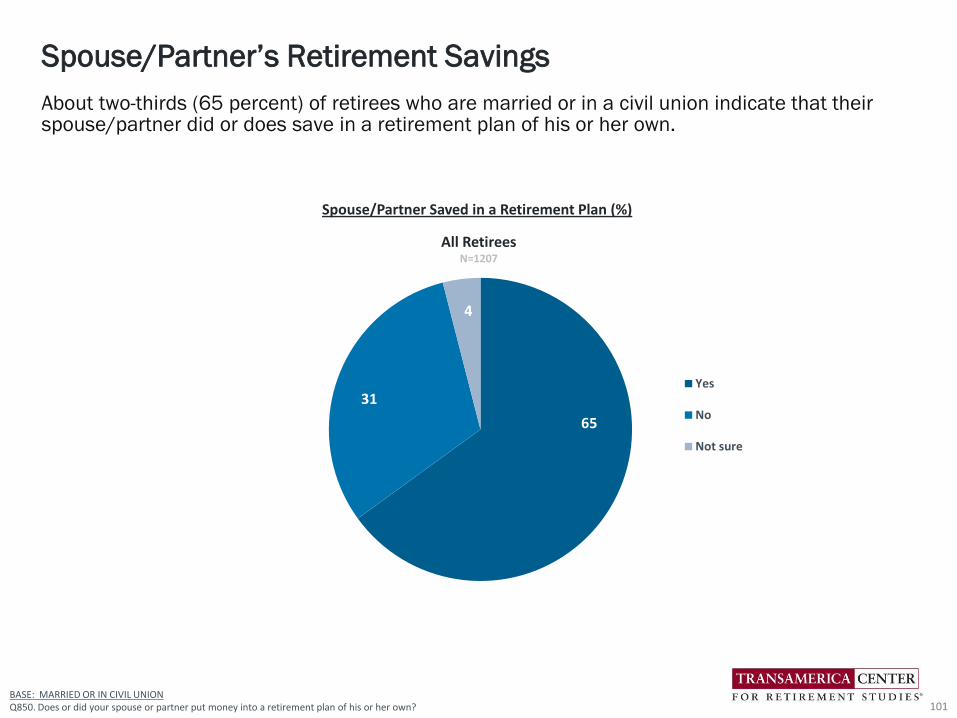
BASE: MARRIED OR IN CIVIL UNIONQ850. Does or did your spouse or partner put money into a retirement plan of his or her own?
About two-thirds (65 percent) of retirees who are married or in a civil union indicate that their spouse/partner did or does save in a retirement plan of his or her own.
Spouse/Partner’s Retirement Savings
101
Spouse/Partner Saved in a Retirement Plan (%)
65
31
4
Yes
No
Not sure
All RetireesN=1207
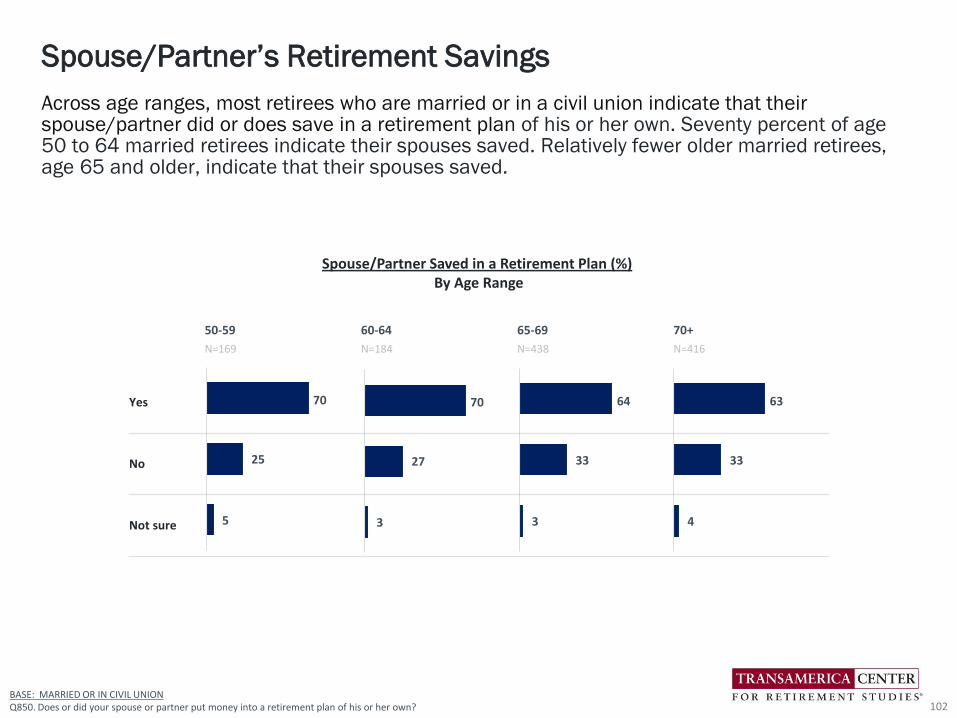
Across age ranges, most retirees who are married or in a civil union indicate that their spouse/partner did or does save in a retirement plan of his or her own. Seventy percent of age 50 to 64 married retirees indicate their spouses saved. Relatively fewer older married retirees, age 65 and older, indicate that their spouses saved.
Spouse/Partner’s Retirement Savings
102
50-59 60-64 65-69 70+
N=169 N=184 N=438 N=416
Yes
No
Not sure
BASE: MARRIED OR IN CIVIL UNIONQ850. Does or did your spouse or partner put money into a retirement plan of his or her own?
70
25
5
70
27
3
64
33
3
63
33
4
Spouse/Partner Saved in a Retirement Plan (%)By Age Range
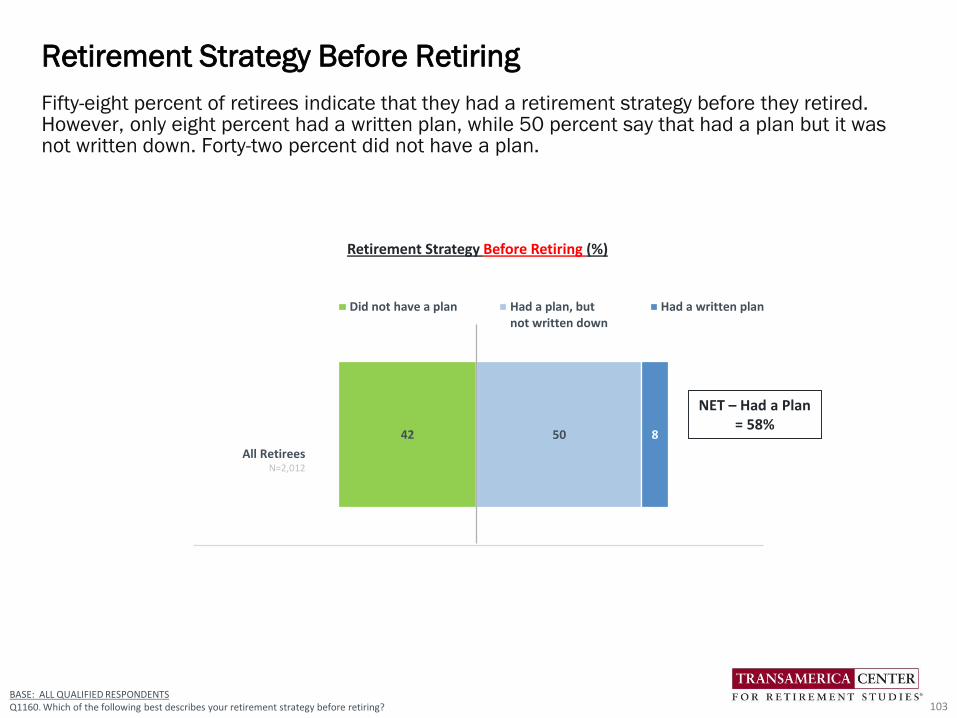
All RetireesN=2,012
42 50 8
Did not have a plan Had a plan, butnot written down
Had a written plan
BASE: ALL QUALIFIED RESPONDENTSQ1160. Which of the following best describes your retirement strategy before retiring?
Fifty-eight percent of retirees indicate that they had a retirement strategy before they retired. However, only eight percent had a written plan, while 50 percent say that had a plan but it was not written down. Forty-two percent did not have a plan.
Retirement Strategy Before Retiring
103
Retirement Strategy Before Retiring (%)
NET – Had a Plan= 58%
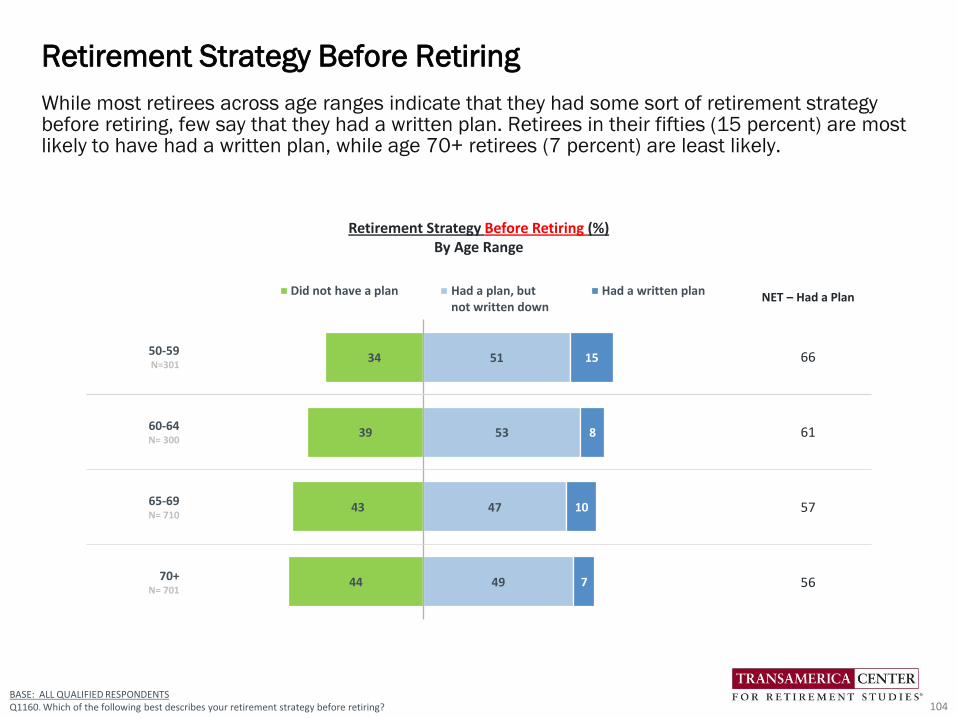
44
43
39
34
49
47
53
51
7
10
8
15
Did not have a plan Had a plan, butnot written down
Had a written plan
While most retirees across age ranges indicate that they had some sort of retirement strategy before retiring, few say that they had a written plan. Retirees in their fifties (15 percent) are most likely to have had a written plan, while age 70+ retirees (7 percent) are least likely.
Retirement Strategy Before Retiring
104
Retirement Strategy Before Retiring (%)By Age Range
BASE: ALL QUALIFIED RESPONDENTSQ1160. Which of the following best describes your retirement strategy before retiring?
NET – Had a Plan
50-59N=301
66
60-64N= 300
61
65-69N= 710
57
70+N= 701
56
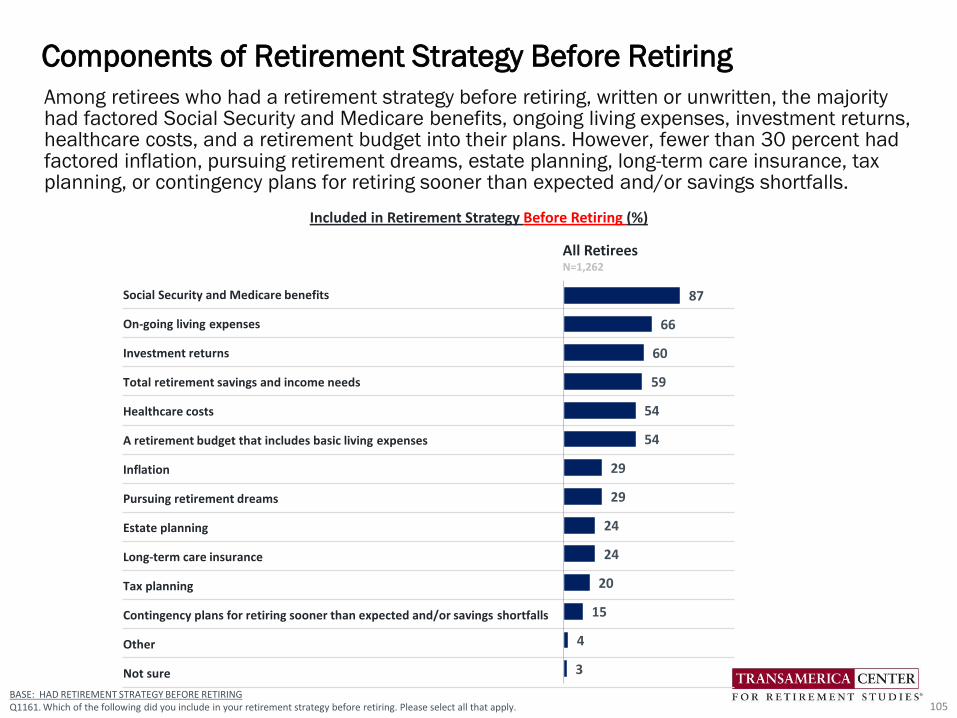
Among retirees who had a retirement strategy before retiring, written or unwritten, the majority had factored Social Security and Medicare benefits, ongoing living expenses, investment returns, healthcare costs, and a retirement budget into their plans. However, fewer than 30 percent had factored inflation, pursuing retirement dreams, estate planning, long-term care insurance, tax planning, or contingency plans for retiring sooner than expected and/or savings shortfalls.
Components of Retirement Strategy Before Retiring
105
Social Security and Medicare benefits
On-going living expenses
Investment returns
Total retirement savings and income needs
Healthcare costs
A retirement budget that includes basic living expenses
Inflation
Pursuing retirement dreams
Estate planning
Long-term care insurance
Tax planning
Contingency plans for retiring sooner than expected and/or savings shortfalls
Other
Not sure
87
66
60
59
54
54
29
29
24
24
20
15
4
3
All RetireesN=1,262
BASE: HAD RETIREMENT STRATEGY BEFORE RETIRINGQ1161. Which of the following did you include in your retirement strategy before retiring. Please select all that apply.
Included in Retirement Strategy Before Retiring (%)
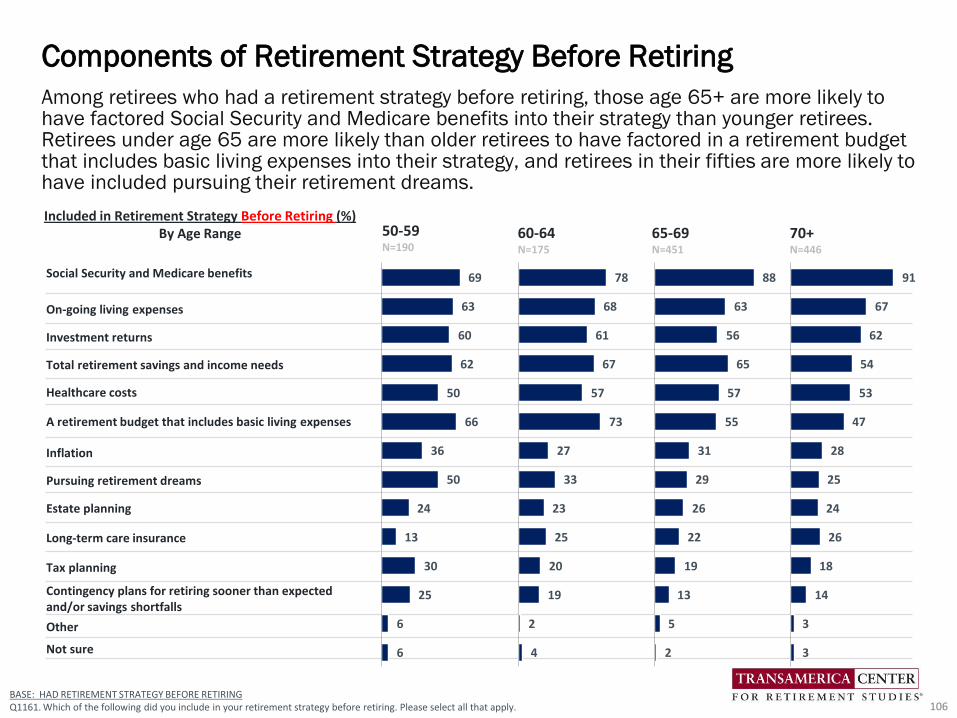
Among retirees who had a retirement strategy before retiring, those age 65+ are more likely to have factored Social Security and Medicare benefits into their strategy than younger retirees. Retirees under age 65 are more likely than older retirees to have factored in a retirement budget that includes basic living expenses into their strategy, and retirees in their fifties are more likely to have included pursuing their retirement dreams.
Components of Retirement Strategy Before Retiring
106
Social Security and Medicare benefits
On-going living expenses
Investment returns
Total retirement savings and income needs
Healthcare costs
A retirement budget that includes basic living expenses
Inflation
Pursuing retirement dreams
Estate planning
Long-term care insurance
Tax planning
Contingency plans for retiring sooner than expected and/or savings shortfalls
Other
Not sure
69
63
60
62
50
66
36
50
24
13
30
25
6
6
BASE: HAD RETIREMENT STRATEGY BEFORE RETIRINGQ1161. Which of the following did you include in your retirement strategy before retiring. Please select all that apply.
78
68
61
67
57
73
27
33
23
25
20
19
2
4
88
63
56
65
57
55
31
29
26
22
19
13
5
2
91
67
62
54
53
47
28
25
24
26
18
14
3
3
50-59N=190
60-64N=175
65-69N=451
70+N=446
Included in Retirement Strategy Before Retiring (%)By Age Range
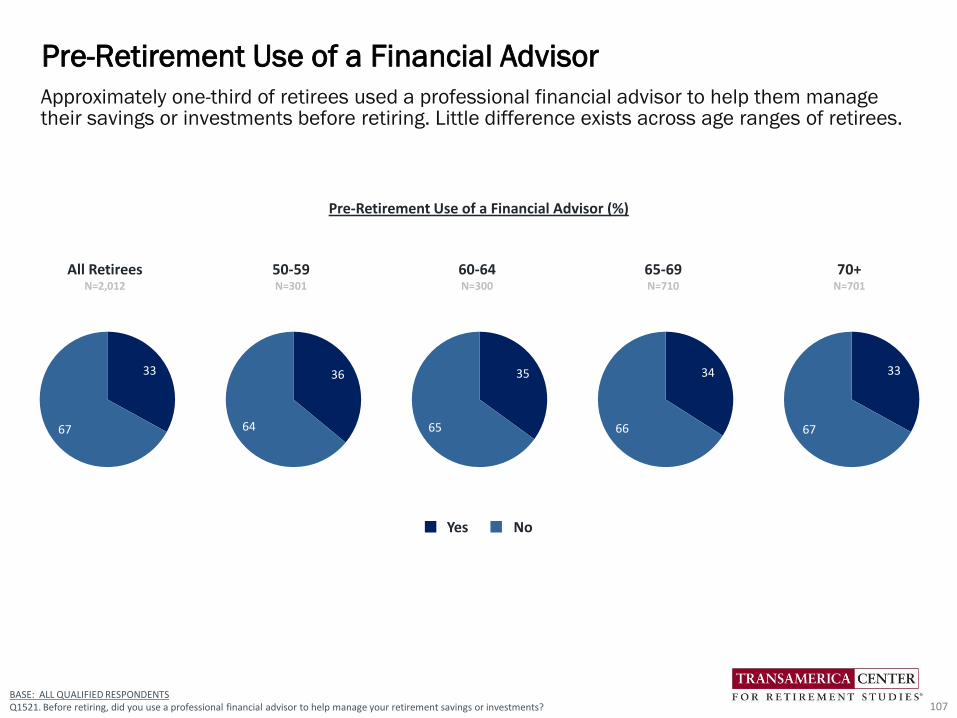
Approximately one-third of retirees used a professional financial advisor to help them manage their savings or investments before retiring. Little difference exists across age ranges of retirees.
Pre-Retirement Use of a Financial Advisor
107
Yes No
50-59N=301
36
64
65-69N=710
34
66
70+N=701
33
67
60-64N=300
35
65
BASE: ALL QUALIFIED RESPONDENTSQ1521. Before retiring, did you use a professional financial advisor to help manage your retirement savings or investments?
Pre-Retirement Use of a Financial Advisor (%)
All RetireesN=2,012
33
67
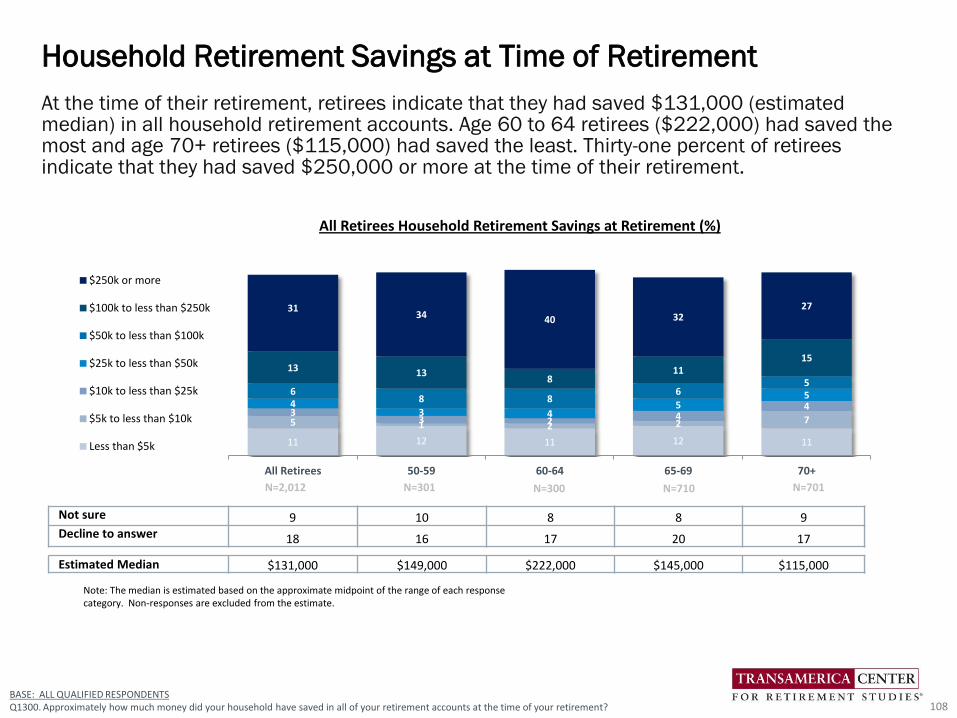
At the time of their retirement, retirees indicate that they had saved $131,000 (estimated median) in all household retirement accounts. Age 60 to 64 retirees ($222,000) had saved the most and age 70+ retirees ($115,000) had saved the least. Thirty-one percent of retirees indicate that they had saved $250,000 or more at the time of their retirement.
Household Retirement Savings at Time of Retirement
108
11 12 11 12 11
5 1 2 2 73
3 2 444
3 45
568 8
65
13 138
1115
3134 40 32
27
All Retirees 50-59 60-64 65-69 70+
$250k or more
$100k to less than $250k
$50k to less than $100k
$25k to less than $50k
$10k to less than $25k
$5k to less than $10k
Less than $5k
Not sure 9 10 8 8 9Decline to answer 18 16 17 20 17
Estimated Median $131,000 $149,000 $222,000 $145,000 $115,000
Note: The median is estimated based on the approximate midpoint of the range of each response category. Non-responses are excluded from the estimate.
All Retirees Household Retirement Savings at Retirement (%)
BASE: ALL QUALIFIED RESPONDENTSQ1300. Approximately how much money did your household have saved in all of your retirement accounts at the time of your retirement?
N=301 N=300 N=710 N=701N=2,012
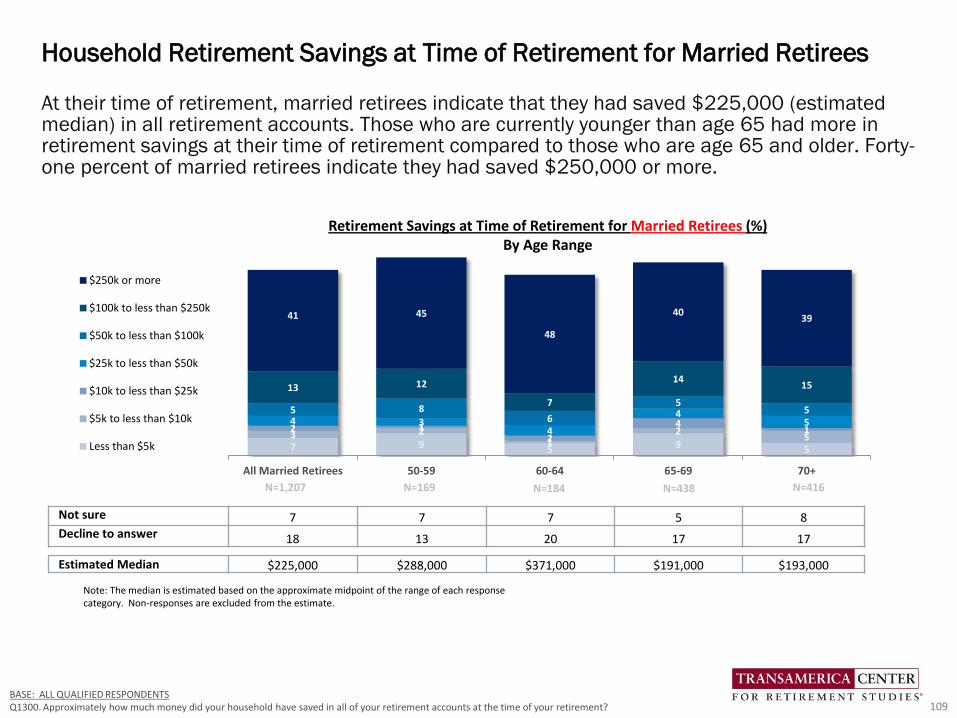
At their time of retirement, married retirees indicate that they had saved $225,000 (estimated median) in all retirement accounts. Those who are currently younger than age 65 had more in retirement savings at their time of retirement compared to those who are age 65 and older. Forty-one percent of married retirees indicate they had saved $250,000 or more.
Household Retirement Savings at Time of Retirement for Married Retirees
109
7 9 5 9 5
3 21
25
2 12
41
4 34
45
5 86
55
13 12
7
1415
41 45
48
4039
All Married Retirees 50-59 60-64 65-69 70+
$250k or more
$100k to less than $250k
$50k to less than $100k
$25k to less than $50k
$10k to less than $25k
$5k to less than $10k
Less than $5k
Not sure 7 7 7 5 8Decline to answer 18 13 20 17 17
Estimated Median $225,000 $288,000 $371,000 $191,000 $193,000
Note: The median is estimated based on the approximate midpoint of the range of each response category. Non-responses are excluded from the estimate.
Retirement Savings at Time of Retirement for Married Retirees (%)By Age Range
BASE: ALL QUALIFIED RESPONDENTSQ1300. Approximately how much money did your household have saved in all of your retirement accounts at the time of your retirement?
N=169 N=184 N=438 N=416N=1,207
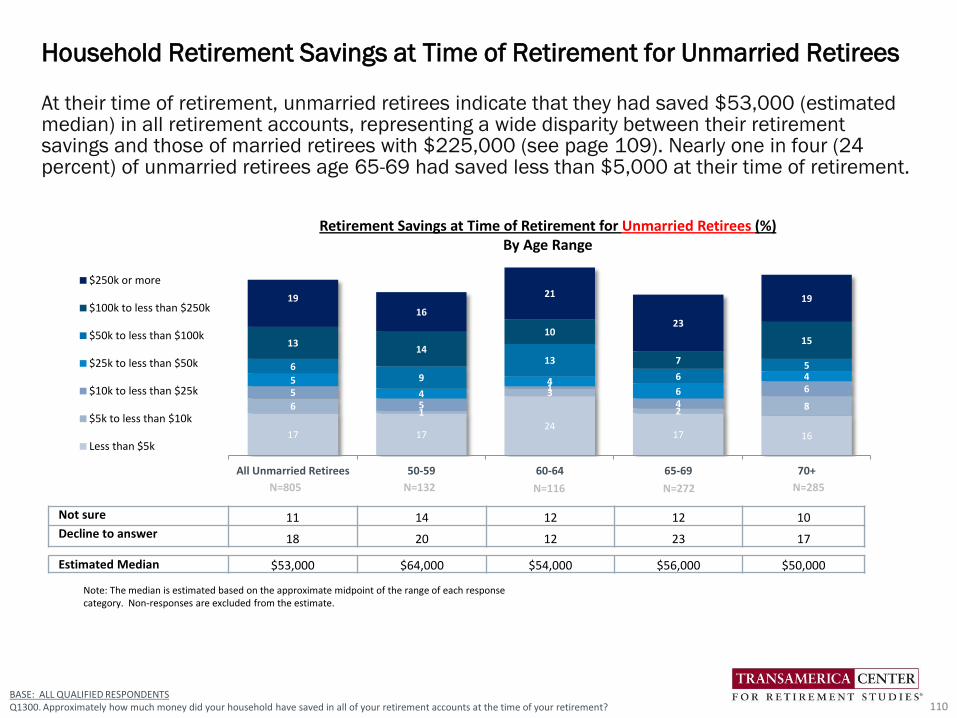
At their time of retirement, unmarried retirees indicate that they had saved $53,000 (estimated median) in all retirement accounts, representing a wide disparity between their retirement savings and those of married retirees with $225,000 (see page 109). Nearly one in four (24 percent) of unmarried retirees age 65-69 had saved less than $5,000 at their time of retirement.
Household Retirement Savings at Time of Retirement for Unmarried Retirees
110
17 1724
17 16
61
3
2 8
55
1
4
65
44
6
46
9
13
65
1314
10
7
15
19
16
21
23
19
All Unmarried Retirees 50-59 60-64 65-69 70+
$250k or more
$100k to less than $250k
$50k to less than $100k
$25k to less than $50k
$10k to less than $25k
$5k to less than $10k
Less than $5k
Not sure 11 14 12 12 10Decline to answer 18 20 12 23 17
Estimated Median $53,000 $64,000 $54,000 $56,000 $50,000
Note: The median is estimated based on the approximate midpoint of the range of each response category. Non-responses are excluded from the estimate.
Retirement Savings at Time of Retirement for Unmarried Retirees (%)By Age Range
BASE: ALL QUALIFIED RESPONDENTSQ1300. Approximately how much money did your household have saved in all of your retirement accounts at the time of your retirement?
N=132 N=116 N=272 N=285N=805
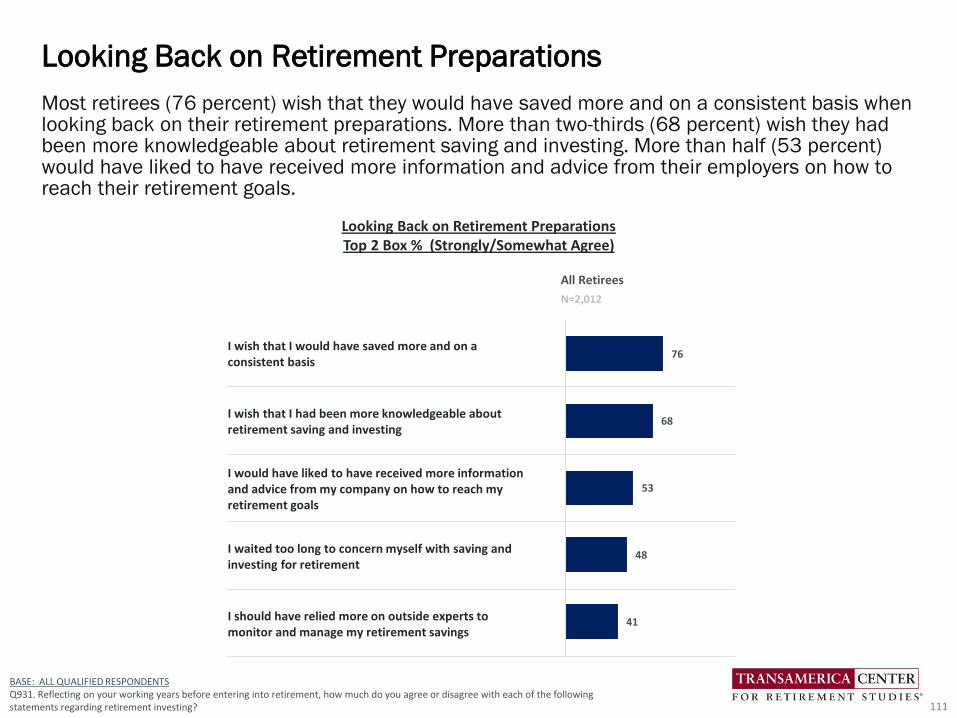
Most retirees (76 percent) wish that they would have saved more and on a consistent basis when looking back on their retirement preparations. More than two-thirds (68 percent) wish they had been more knowledgeable about retirement saving and investing. More than half (53 percent) would have liked to have received more information and advice from their employers on how to reach their retirement goals.
Looking Back on Retirement Preparations
111
All Retirees
N=2,012
I wish that I would have saved more and on a consistent basis
I wish that I had been more knowledgeable about retirement saving and investing
I would have liked to have received more information and advice from my company on how to reach my retirement goals
I waited too long to concern myself with saving and investing for retirement
I should have relied more on outside experts to monitor and manage my retirement savings
BASE: ALL QUALIFIED RESPONDENTSQ931. Reflecting on your working years before entering into retirement, how much do you agree or disagree with each of the following statements regarding retirement investing?
Looking Back on Retirement PreparationsTop 2 Box % (Strongly/Somewhat Agree)
76
68
53
48
41
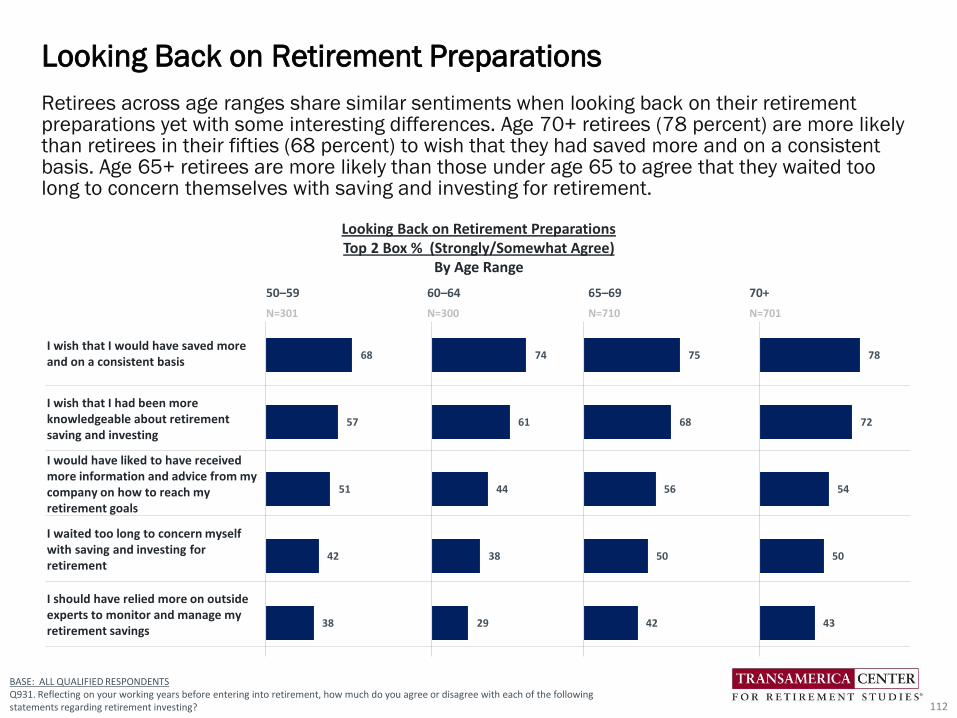
Retirees across age ranges share similar sentiments when looking back on their retirement preparations yet with some interesting differences. Age 70+ retirees (78 percent) are more likely than retirees in their fifties (68 percent) to wish that they had saved more and on a consistent basis. Age 65+ retirees are more likely than those under age 65 to agree that they waited too long to concern themselves with saving and investing for retirement.
Looking Back on Retirement Preparations
112
BASE: ALL QUALIFIED RESPONDENTSQ931. Reflecting on your working years before entering into retirement, how much do you agree or disagree with each of the following statements regarding retirement investing?
Looking Back on Retirement PreparationsTop 2 Box % (Strongly/Somewhat Agree)
By Age Range
50–59 60–64 65–69 70+
N=301 N=300 N=710 N=701
I wish that I would have saved more and on a consistent basis
I wish that I had been more knowledgeable about retirement saving and investing
I would have liked to have received more information and advice from my company on how to reach my retirement goals
I waited too long to concern myself with saving and investing for retirement
I should have relied more on outside experts to monitor and manage my retirement savings
68
57
51
42
38
74
61
44
38
29
75
68
56
50
42
78
72
54
50
43
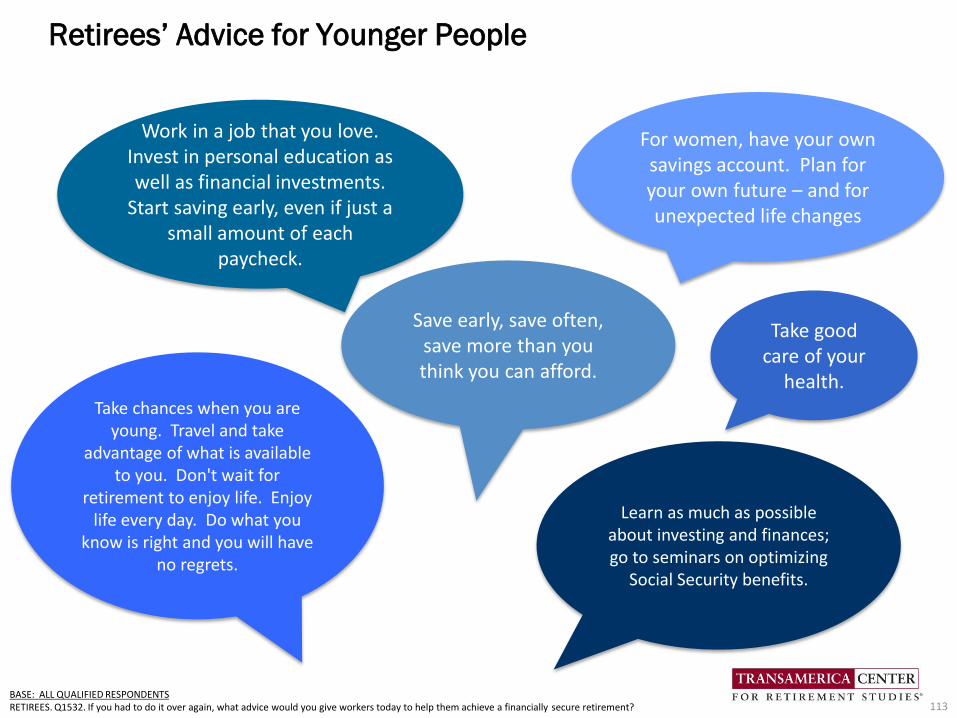
Retirees’ Advice for Younger People
113BASE: ALL QUALIFIED RESPONDENTSRETIREES. Q1532. If you had to do it over again, what advice would you give workers today to help them achieve a financially secure retirement?
Save early, save often, save more than you think you can afford.
Take chances when you are young. Travel and take
advantage of what is available to you. Don't wait for
retirement to enjoy life. Enjoy life every day. Do what you
know is right and you will have no regrets.
Work in a job that you love. Invest in personal education as well as financial investments.
Start saving early, even if just a small amount of each
paycheck.
For women, have your own savings account. Plan for your own future – and for unexpected life changes
Take good care of your
health.
Learn as much as possible about investing and finances; go to seminars on optimizing
Social Security benefits.
Appendix: A Demographic Portrait of Retirees
114
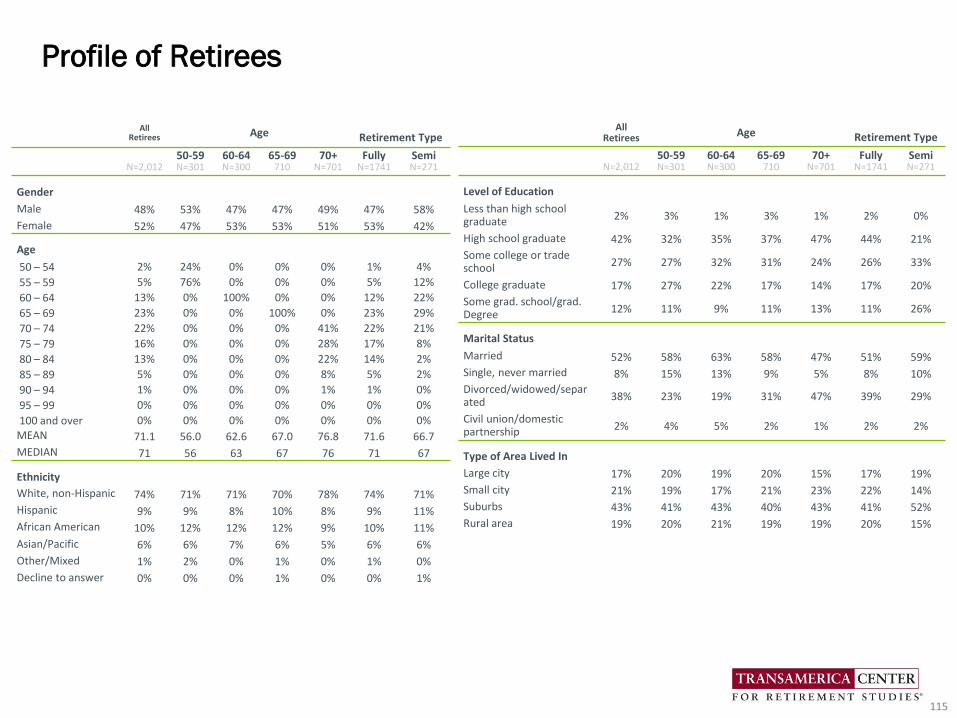
Profile of Retirees
115
All Retirees Age Retirement Type
N=2,01250-59N=301
60-64N=300
65-69710
70+N=701
FullyN=1741
SemiN=271
Gender
Male 48% 53% 47% 47% 49% 47% 58%
Female 52% 47% 53% 53% 51% 53% 42%
Age
50 – 54 2% 24% 0% 0% 0% 1% 4%
55 – 59 5% 76% 0% 0% 0% 5% 12%
60 – 64 13% 0% 100% 0% 0% 12% 22%
65 – 69 23% 0% 0% 100% 0% 23% 29%
70 – 74 22% 0% 0% 0% 41% 22% 21%
75 – 79 16% 0% 0% 0% 28% 17% 8%
80 – 84 13% 0% 0% 0% 22% 14% 2%
85 – 89 5% 0% 0% 0% 8% 5% 2%
90 – 94 1% 0% 0% 0% 1% 1% 0%
95 – 99 0% 0% 0% 0% 0% 0% 0%
100 and over 0% 0% 0% 0% 0% 0% 0%MEAN 71.1 56.0 62.6 67.0 76.8 71.6 66.7
MEDIAN 71 56 63 67 76 71 67
Ethnicity
White, non-Hispanic 74% 71% 71% 70% 78% 74% 71%
Hispanic 9% 9% 8% 10% 8% 9% 11%
African American 10% 12% 12% 12% 9% 10% 11%
Asian/Pacific 6% 6% 7% 6% 5% 6% 6%
Other/Mixed 1% 2% 0% 1% 0% 1% 0%
Decline to answer 0% 0% 0% 1% 0% 0% 1%
All Retirees Age Retirement Type
N=2,01250-59N=301
60-64N=300
65-69710
70+N=701
FullyN=1741
SemiN=271
Level of Education
Less than high school graduate 2% 3% 1% 3% 1% 2% 0%
High school graduate 42% 32% 35% 37% 47% 44% 21%
Some college or trade school 27% 27% 32% 31% 24% 26% 33%
College graduate 17% 27% 22% 17% 14% 17% 20%
Some grad. school/grad. Degree 12% 11% 9% 11% 13% 11% 26%
Marital Status
Married 52% 58% 63% 58% 47% 51% 59%
Single, never married 8% 15% 13% 9% 5% 8% 10%
Divorced/widowed/separated 38% 23% 19% 31% 47% 39% 29%
Civil union/domestic partnership 2% 4% 5% 2% 1% 2% 2%
Type of Area Lived In
Large city 17% 20% 19% 20% 15% 17% 19%
Small city 21% 19% 17% 21% 23% 22% 14%
Suburbs 43% 41% 43% 40% 43% 41% 52%
Rural area 19% 20% 21% 19% 19% 20% 15%
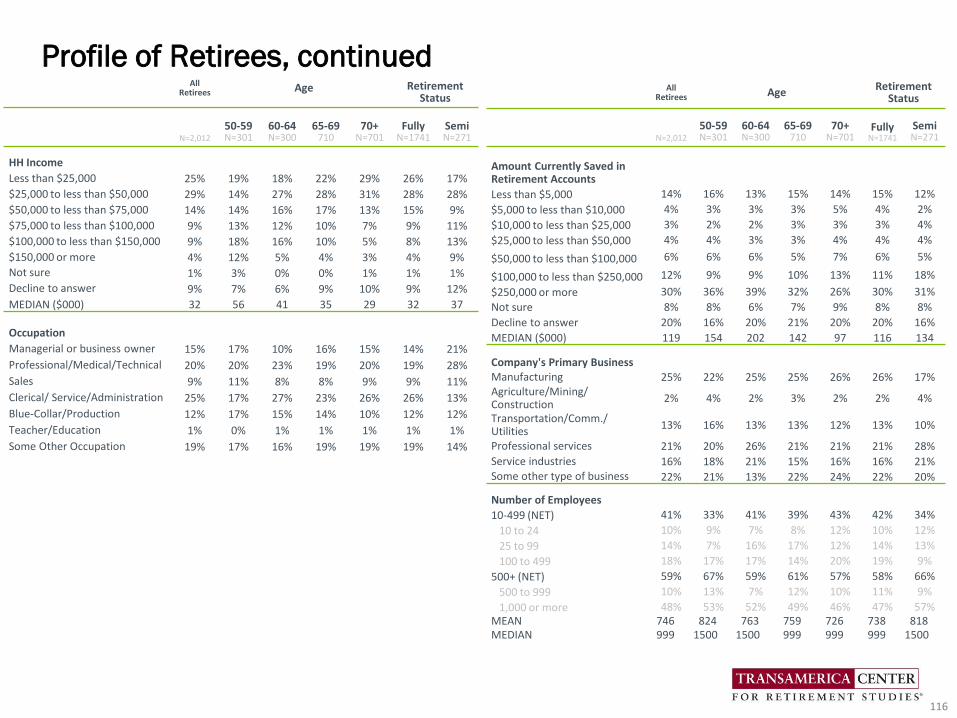
Profile of Retirees, continued
116
All Retirees Age
Retirement Status
N=2,01250-59N=301
60-64N=300
65-69710
70+N=701
FullyN=1741
SemiN=271
Amount Currently Saved in Retirement Accounts
Less than $5,000 14% 16% 13% 15% 14% 15% 12%
$5,000 to less than $10,000 4% 3% 3% 3% 5% 4% 2%
$10,000 to less than $25,000 3% 2% 2% 3% 3% 3% 4%
$25,000 to less than $50,000 4% 4% 3% 3% 4% 4% 4%
$50,000 to less than $100,000 6% 6% 6% 5% 7% 6% 5%
$100,000 to less than $250,000 12% 9% 9% 10% 13% 11% 18%
$250,000 or more 30% 36% 39% 32% 26% 30% 31%
Not sure 8% 8% 6% 7% 9% 8% 8%
Decline to answer 20% 16% 20% 21% 20% 20% 16%
MEDIAN ($000) 119 154 202 142 97 116 134
Company's Primary BusinessManufacturing 25% 22% 25% 25% 26% 26% 17%Agriculture/Mining/Construction
2% 4% 2% 3% 2% 2% 4%
Transportation/Comm./Utilities
13% 16% 13% 13% 12% 13% 10%
Professional services 21% 20% 26% 21% 21% 21% 28%
Service industries 16% 18% 21% 15% 16% 16% 21%Some other type of business 22% 21% 13% 22% 24% 22% 20%
Number of Employees
10-499 (NET) 41% 33% 41% 39% 43% 42% 34%
10 to 24 10% 9% 7% 8% 12% 10% 12%
25 to 99 14% 7% 16% 17% 12% 14% 13%
100 to 499 18% 17% 17% 14% 20% 19% 9%
500+ (NET) 59% 67% 59% 61% 57% 58% 66%
500 to 999 10% 13% 7% 12% 10% 11% 9%
1,000 or more 48% 53% 52% 49% 46% 47% 57%MEAN 746 824 763 759 726 738 818MEDIAN 999 1500 1500 999 999 999 1500
All Retirees Age Retirement
Status
N=2,01250-59N=301
60-64N=300
65-69710
70+N=701
FullyN=1741
SemiN=271
HH Income
Less than $25,000 25% 19% 18% 22% 29% 26% 17%
$25,000 to less than $50,000 29% 14% 27% 28% 31% 28% 28%
$50,000 to less than $75,000 14% 14% 16% 17% 13% 15% 9%
$75,000 to less than $100,000 9% 13% 12% 10% 7% 9% 11%
$100,000 to less than $150,000 9% 18% 16% 10% 5% 8% 13%
$150,000 or more 4% 12% 5% 4% 3% 4% 9%
Not sure 1% 3% 0% 0% 1% 1% 1%
Decline to answer 9% 7% 6% 9% 10% 9% 12%
MEDIAN ($000) 32 56 41 35 29 32 37
Occupation
Managerial or business owner 15% 17% 10% 16% 15% 14% 21%
Professional/Medical/Technical 20% 20% 23% 19% 20% 19% 28%
Sales 9% 11% 8% 8% 9% 9% 11%
Clerical/ Service/Administration 25% 17% 27% 23% 26% 26% 13%
Blue-Collar/Production 12% 17% 15% 14% 10% 12% 12%
Teacher/Education 1% 0% 1% 1% 1% 1% 1%
Some Other Occupation 19% 17% 16% 19% 19% 19% 14%
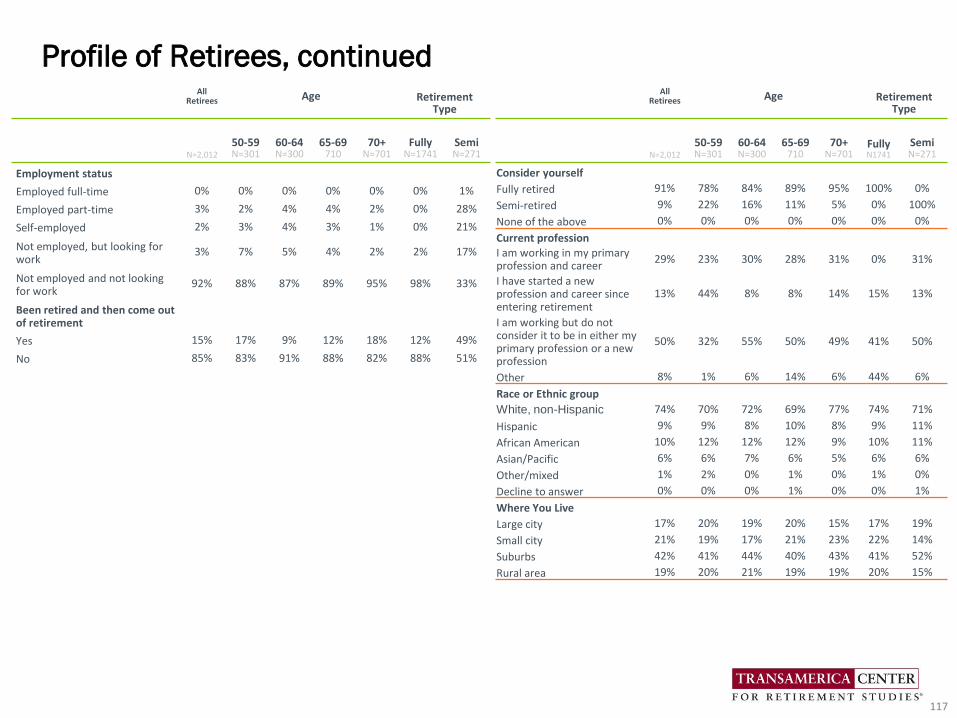
All Retirees Age Retirement
Type
N=2,01250-59N=301
60-64N=300
65-69710
70+N=701
FullyN=1741
SemiN=271
Employment status
Employed full-time 0% 0% 0% 0% 0% 0% 1%
Employed part-time 3% 2% 4% 4% 2% 0% 28%
Self-employed 2% 3% 4% 3% 1% 0% 21%
Not employed, but looking for work
3% 7% 5% 4% 2% 2% 17%
Not employed and not looking for work
92% 88% 87% 89% 95% 98% 33%
Been retired and then come out of retirement
Yes 15% 17% 9% 12% 18% 12% 49%
No 85% 83% 91% 88% 82% 88% 51%
Profile of Retirees, continued
117
All Retirees Age Retirement
Type
N=2,01250-59N=301
60-64N=300
65-69710
70+N=701
FullyN1741
SemiN=271
Consider yourself
Fully retired 91% 78% 84% 89% 95% 100% 0%
Semi-retired 9% 22% 16% 11% 5% 0% 100%
None of the above 0% 0% 0% 0% 0% 0% 0%
Current professionI am working in my primary profession and career
29% 23% 30% 28% 31% 0% 31%
I have started a new profession and career since entering retirement
13% 44% 8% 8% 14% 15% 13%
I am working but do not consider it to be in either my primary profession or a new profession
50% 32% 55% 50% 49% 41% 50%
Other 8% 1% 6% 14% 6% 44% 6%
Race or Ethnic group
White, non-Hispanic 74% 70% 72% 69% 77% 74% 71%
Hispanic 9% 9% 8% 10% 8% 9% 11%
African American 10% 12% 12% 12% 9% 10% 11%
Asian/Pacific 6% 6% 7% 6% 5% 6% 6%
Other/mixed 1% 2% 0% 1% 0% 1% 0%
Decline to answer 0% 0% 0% 1% 0% 0% 1%
Where You Live
Large city 17% 20% 19% 20% 15% 17% 19%
Small city 21% 19% 17% 21% 23% 22% 14%
Suburbs 42% 41% 44% 40% 43% 41% 52%
Rural area 19% 20% 21% 19% 19% 20% 15%