Embed Size (px)
Citation preview
T R S – C A R E R E T I R E E H E A L T H C A R E P L A N
T E A C H E R R E T I R E M E N T S Y S T E M O F T E X A S
A C T U A R I A L V A L U A T I O N R E P O R T
F O R T H E Y E A R E N D I N G A U G U S T 3 1 , 2 0 1 2
November 7, 2012
Board of Trustees
Teacher Retirement System of Texas
1000 Red River Street
Austin, TX 78701-2698
Subject: GASB 43 Actuarial Valuation as of August 31, 2012 for TRS-Care
Submitted in this report are the results of an Actuarial Valuation of the liabilities associated with
the employer financed retiree health benefits provided through TRS-Care, a benefit program
designed to provide post retirement medical benefits for certain members of the Teacher
Retirement System of Texas (TRS). The date of the valuation was August 31, 2012. This report
was prepared at the request of TRS.
The actuarial calculations were prepared for purposes of complying with the requirements of
Statements 43 and 45 of the Governmental Accounting Standards Board (GASB). The
calculations reported herein have been made on a basis consistent with our understanding of
these accounting standards. Determinations of the liability associated with the benefits described
in this report for purposes other than satisfying the financial reporting requirements of TRS-Care
and participating employers may produce significantly different results.
The valuation was based upon information, furnished by TRS, concerning retiree health benefits,
members’ census, and financial data. Data was checked for internal consistency but was not
otherwise audited. Certain demographic and economic assumptions are identical to the set of
demographic and economic assumptions adopted by the Board based on the 2010 Experience
Study of TRS. Assumptions applicable only to TRS-Care have changed since the prior report,
and they are disclosed in the assumptions section of this report.
To the best of our knowledge, this report is complete and accurate and was made in accordance
with generally recognized actuarial methods.
One or more of the undersigned are members of the American Academy of Actuaries and meet
the Qualification Standards of the Academy of Actuaries to render the actuarial opinion herein.
Respectfully submitted,
William J. Hickman Joseph P. Newton, FSA, MAAA Mehdi Riazi, ASA, EA, MAAA
Senior Consultant Senior Consultant Consultant
K:\2551\2012\OPEB\Report\2012 OPEB Report DRAFT.doc
Teacher Retirement System of Texas Table of Contents
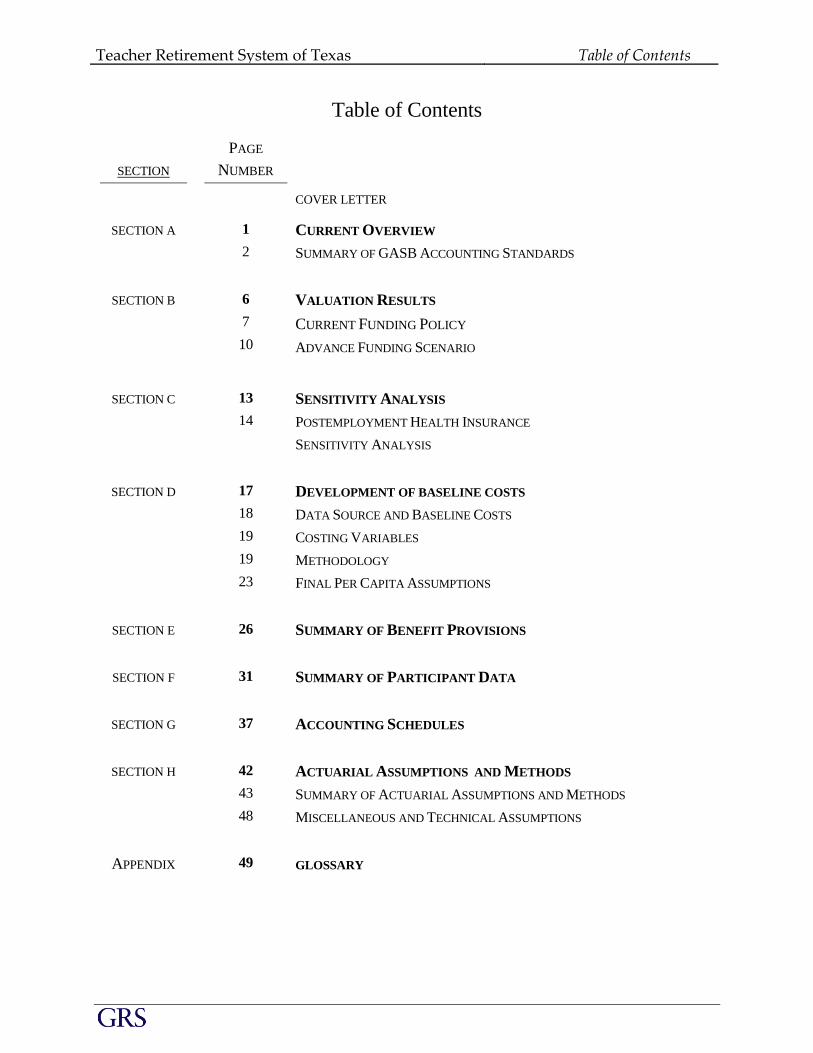
Table of Contents
PAGE
SECTION NUMBER
COVER LETTER
SECTION A 1
2
CURRENT OVERVIEW
SUMMARY OF GASB ACCOUNTING STANDARDS
SECTION B 6
7
10
VALUATION RESULTS
CURRENT FUNDING POLICY
ADVANCE FUNDING SCENARIO
SECTION C 13
14
SENSITIVITY ANALYSIS
POSTEMPLOYMENT HEALTH INSURANCE
SENSITIVITY ANALYSIS
SECTION D 17
18
19
19
23
DEVELOPMENT OF BASELINE COSTS
DATA SOURCE AND BASELINE COSTS
COSTING VARIABLES
METHODOLOGY
FINAL PER CAPITA ASSUMPTIONS
SECTION E 26 SUMMARY OF BENEFIT PROVISIONS
SECTION F 31 SUMMARY OF PARTICIPANT DATA
SECTION G 37 ACCOUNTING SCHEDULES
SECTION H 42
43
48
ACTUARIAL ASSUMPTIONS AND METHODS
SUMMARY OF ACTUARIAL ASSUMPTIONS AND METHODS
MISCELLANEOUS AND TECHNICAL ASSUMPTIONS
APPENDIX 49 GLOSSARY

SECTION A
C U R R EN T O VERV IEW
Teacher Retirement System of Texas Section A
2
SUMMARY OF GASB ACCOUNTING STANDARDS
OTHER POST EMPLOYMENT BENEFITS
SPONSORED BY THE
TEACHER RETIREMENT SYSTEM OF TEXAS
AS OF AUGUST 31, 2012
Introduction
Accounting standards Statements 43 and 45 issued by the Government Accounting Standards
Board (GASB), determine the financial recognition of Other Post Employment Benefits (OPEB).
For the participating members of TRS-Care, these benefits primarily include medical and
prescription drug insurance benefits provided to eligible public school retirees. Any other OPEB
benefits offered to the members of the Teacher Retirement System of Texas are outside the scope
of this report. This would include OPEB benefits offered by the local school districts such as
vision, dental, or life insurance.
The liabilities and schedule of funding progress provided in this report should be applied to the
Comprehensive Annual Financial Report (CAFR) issued for the period September 1, 2011
through August 31, 2012 for TRS-Care.
The purpose of this Report is to provide: (a) results of the actuarial calculations necessary for
financial reporting pursuant to GASB Statements 43 and 45, and (b) various other actuarial,
statistical and benefit information useful for the operation of TRS-Care.
Funded and Unfunded Plans
Currently, the benefits of TRS-Care are financed through a combination of retiree premiums and
percentage of payroll contributions from active employees, local school districts, and the State
(currently 0.65% of payroll for active employees, 0.55% for local employers and 1.00% for the
State). For FY 2013, the State’s contribution will be reduced to 0.50% of payroll. The current
objective is to fund the Trust in order to maintain benefits through individual biennial periods.
Furthermore, there is no arrangement into which the participating employers would make
contributions to advance-fund the obligation. However, a Trust does exist into which
participating employers are making contributions that roughly equal the annual expected net
claim payments. This trust has an asset balance of $741 million as of August 31, 2012. ($741
million represents roughly $50 million less than one year of employer provided benefits). These
assets are invested in cash and other short-term investments according to the current investment
policy.
Consequently, according to GASB Statement 43, the interest discount rate used to calculate the
present values and costs of the OPEB must be the long-range expected return on such short-term
fixed income instruments. The Board has selected an interest discount rate of 5.25% for this
purpose. An explanation of this assumption can be found in the “Actuarial Assumptions and
Methods” section of this report.
Teacher Retirement System of Texas Section A (continued)
3
There is no current requirement by the GASB, by State or Federal Statute or regulation, or by
any rating agencies to pre-fund the OPEB obligations with real cash in a Trust. This accounting
standard only requires participating employers to measure the obligation, and to recognize it and
disclose it in their financial statements, as applicable.
However, if the OPEB Plan were a funded plan and if its assets were invested in a trust with a
longer term investment horizon, then a higher interest discount rate could be used. This would
result in lower Annual OPEB Costs and lower liabilities. We have provided the liability and
Annual OPEB Cost calculations in this report for illustrative purposes, utilizing the same 8.0%
investment return assumption the Board has adopted for the pension plan. If advanced funding
were to be adopted, we would revisit this assumption if the Board were to adopt a more
aggressive or conservative investment policy for this pool of money.
Results of the Study
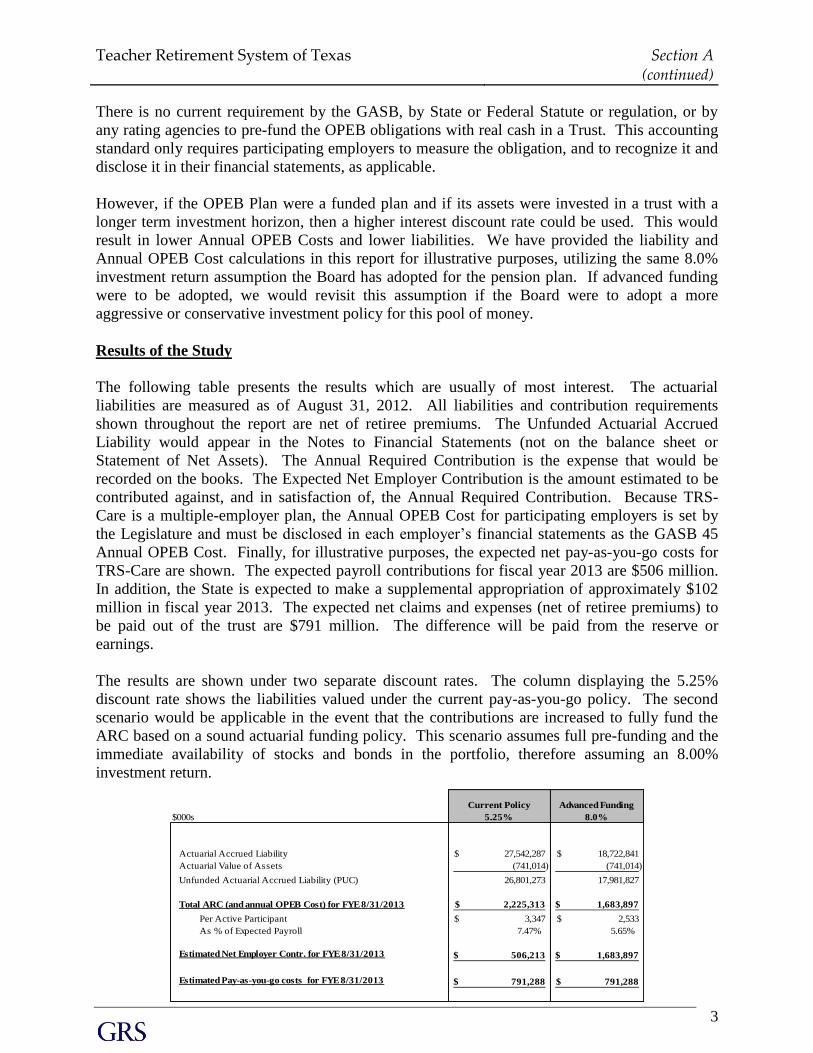
The following table presents the results which are usually of most interest. The actuarial
liabilities are measured as of August 31, 2012. All liabilities and contribution requirements
shown throughout the report are net of retiree premiums. The Unfunded Actuarial Accrued
Liability would appear in the Notes to Financial Statements (not on the balance sheet or
Statement of Net Assets). The Annual Required Contribution is the expense that would be
recorded on the books. The Expected Net Employer Contribution is the amount estimated to be
contributed against, and in satisfaction of, the Annual Required Contribution. Because TRS-
Care is a multiple-employer plan, the Annual OPEB Cost for participating employers is set by
the Legislature and must be disclosed in each employer’s financial statements as the GASB 45
Annual OPEB Cost. Finally, for illustrative purposes, the expected net pay-as-you-go costs for
TRS-Care are shown. The expected payroll contributions for fiscal year 2013 are $506 million.
In addition, the State is expected to make a supplemental appropriation of approximately $102
million in fiscal year 2013. The expected net claims and expenses (net of retiree premiums) to
be paid out of the trust are $791 million. The difference will be paid from the reserve or
earnings.
The results are shown under two separate discount rates. The column displaying the 5.25%
discount rate shows the liabilities valued under the current pay-as-you-go policy. The second
scenario would be applicable in the event that the contributions are increased to fully fund the
ARC based on a sound actuarial funding policy. This scenario assumes full pre-funding and the
immediate availability of stocks and bonds in the portfolio, therefore assuming an 8.00%
investment return.
$000s
Actuarial Accrued Liability 27,542,287$ 18,722,841$
Actuarial Value of Assets (741,014) (741,014)
Unfunded Actuarial Accrued Liability (PUC) 26,801,273 17,981,827
Total ARC (and annual OPEB Cost) for FYE 8/31/2013 2,225,313$ 1,683,897$
Per Active Participant 3,347$ 2,533$
As % of Expected Payroll 7.47% 5.65%
506,213$ 1,683,897$
791,288$ 791,288$
Estimated Net Employer Contr. for FYE 8/31/2013
Current Policy
5.25%
Advanced Funding
8.0%
Estimated Pay-as-you-go costs for FYE 8/31/2013
Teacher Retirement System of Texas Section A (continued)
4
For illustrative purposes in the above chart, the Net Employer Contribution is the expected
contributions based on the current contribution policy. If an advanced funding policy were
implemented, the actual contributions used in the GASB exhibits would be equal to the ARC.
Any additional contributions above the pay-as-you-go costs are available for investment in the
trust and help decrease costs in the future.
Please note, the expected pay-as-you-go costs are expected to exceed the employer contributions
in fiscal year 2013. The current contribution policy equal to 2.20% (1.70% for 2013) of payroll
cannot sustain the current benefit provisions and reserve levels. In addition, when the
contributions are less than the ARC the UAAL will grow from year to year because the
amortization schedule will not be met.
Cost Sharing Multiple-Employer Plans under GASB 43 & 45
Under GASB 43, a Cost-sharing multiple-employer plan is defined as a single plan with
pooling (cost-sharing) arrangements for the participating employers. All risks, rewards, and
costs, including benefit costs, are shared and are not attributed individually to the employers. A
single actuarial valuation covers all plan members, and the same contribution rate(s) applies for
each employer.
Under paragraph 22 of GASB 45, a cost sharing multiple employer postretirement benefit
program must meet the following requirements:
1) The plan is administered as a formal trust or equivalent arrangement;
2) Employer contributions are irrevocable;
3) Plan assets are dedicated for providing postretirement benefits; and
4) Plan assets are legally protected from creditors of employers and of the plan
administrator.
If the multiple employer plan does not satisfy the preceding conditions, then it is must be
classified as an agent multiple employer plan for financial reporting purposes, and the
participating employers should apply the requirements of an agent plan.
Furthermore, the glossary of GASB 45 and paragraph 127 of the GASB 43 and 45
Implementation Guide provides additional information on the definition of cost sharing plans as
follows:
1) The intent of the cost sharing plan is to pool risks, rewards and costs among all
participating employers,
2) A single valuation is performed and the same contribution rate applies to each
participating employer, and
3) The cost sharing plan is administered as a legal trust or equivalent trust that makes the
risk pooling mechanism possible.
We believe TRS-Care satisfies the conditions of a cost sharing multi-employer plan, and
therefore, each employer is required to recognize OPEB expense for their contractually required
contributions to the plan, currently 0.55% of payroll. Each employer is required to disclose how
the contractually required contribution rate is determined (for example, by statute or contract or
Teacher Retirement System of Texas Section A (continued)
5
on an actuarially determined basis) and no balance sheet liability will be generated, provided that
the contractually prescribed contributions are made by the school districts.
It should be noted, however, that to be definitive such a determination should be made by the
State’s auditors, not the entity administering the Plan or by the Plan’s actuary.
Actuarial Assumptions
In any long-term Actuarial Valuation (such as for Pensions and OPEBs), certain demographic,
economic and behavioral assumptions are made concerning the population, the investment
discount rates and the benefits provided. These Actuarial Assumptions form the basis for the
actuarial model which is used to project the future population, the future benefits provided, and
the future contributions collected. Then the investment discount rate assumption is used to
discount those projected net OPEB benefits to a present value. This and other related present
values are used to calculate the Annual Required Contribution that will be expensed and the
Unfunded Actuarial Accrued Liability that will be disclosed in the financial statements.
This actuarial valuation of TRS-Care is similar to the actuarial valuations performed for the
TRS’ pension plan, except that the OPEB Valuation is more complex. The demographic
assumptions (rates of retirement, termination and disability) used in this OPEB valuation were
identical to those used in the latest TRS valuation.
Certain economic and behavioral assumptions, of course, are unique to medical benefits. It
would be instructive to review the Section of this Report titled, “Actuarial Assumptions and
Methods” for a detailed discussion and disclosure of all the relevant Actuarial Assumptions used
in this Valuation.
Actuarial Cost Methods
GASB Statement 43 gives a good amount of flexibility to governmental employers (and their
actuaries) in the use of various actuarial cost methods. Several of such acceptable actuarial cost
methods were investigated. The Projected Unit Credit Cost Method was used in this valuation.
This is both an acceptable and reasonable cost method for OPEB valuations. Furthermore, the
amortization of any Unfunded Actuarial Accrued Liabilities was calculated using a level percent
of pay over a 30 year period.
SECTION B
VA LU ATIO N R ES U LTS – TRS C A R E
Teacher Retirement System of Texas Section B
7
VALUATION RESULTS
CURRENT FUNDING POLICY
OTHER POST EMPLOYMENT BENEFITS
ADMINISTERED BY THE
TEACHER RETIREMENT SYSTEM OF TEXAS
AS OF AUGUST 31, 2012
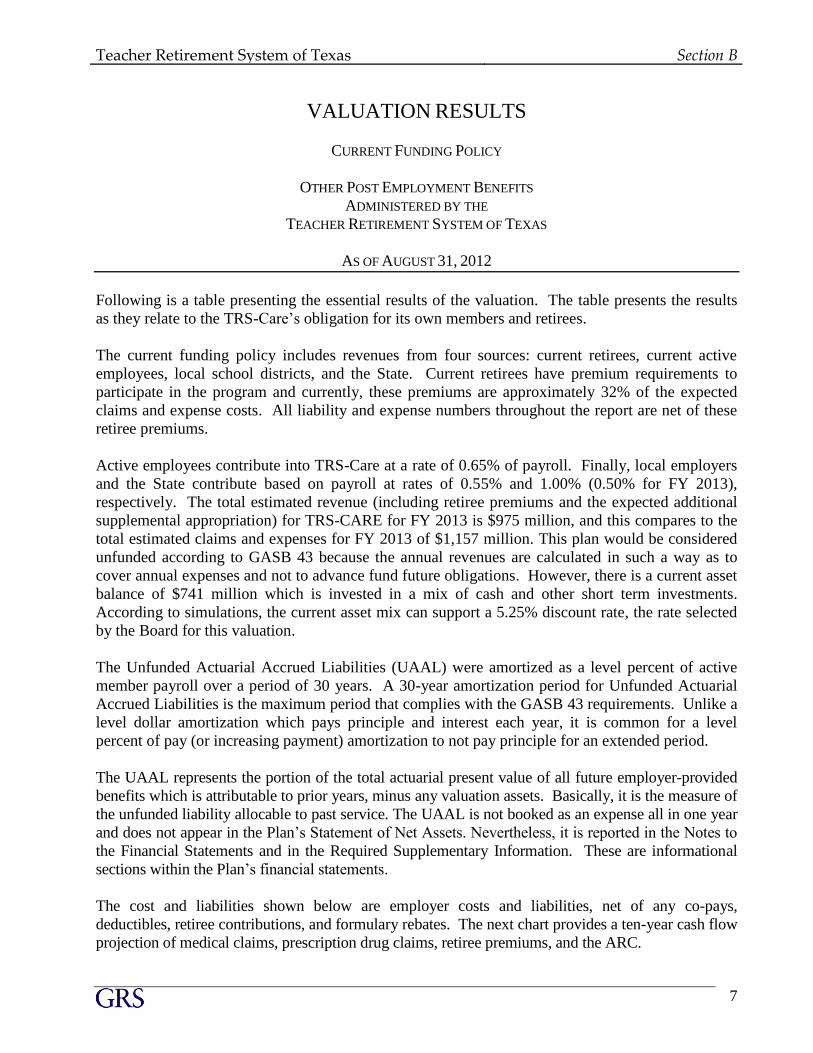
Following is a table presenting the essential results of the valuation. The table presents the results
as they relate to the TRS-Care’s obligation for its own members and retirees.
The current funding policy includes revenues from four sources: current retirees, current active
employees, local school districts, and the State. Current retirees have premium requirements to
participate in the program and currently, these premiums are approximately 32% of the expected
claims and expense costs. All liability and expense numbers throughout the report are net of these
retiree premiums.
Active employees contribute into TRS-Care at a rate of 0.65% of payroll. Finally, local employers
and the State contribute based on payroll at rates of 0.55% and 1.00% (0.50% for FY 2013),
respectively. The total estimated revenue (including retiree premiums and the expected additional
supplemental appropriation) for TRS-CARE for FY 2013 is $975 million, and this compares to the
total estimated claims and expenses for FY 2013 of $1,157 million. This plan would be considered
unfunded according to GASB 43 because the annual revenues are calculated in such a way as to
cover annual expenses and not to advance fund future obligations. However, there is a current asset
balance of $741 million which is invested in a mix of cash and other short term investments.
According to simulations, the current asset mix can support a 5.25% discount rate, the rate selected
by the Board for this valuation.
The Unfunded Actuarial Accrued Liabilities (UAAL) were amortized as a level percent of active
member payroll over a period of 30 years. A 30-year amortization period for Unfunded Actuarial
Accrued Liabilities is the maximum period that complies with the GASB 43 requirements. Unlike a
level dollar amortization which pays principle and interest each year, it is common for a level
percent of pay (or increasing payment) amortization to not pay principle for an extended period.
The UAAL represents the portion of the total actuarial present value of all future employer-provided
benefits which is attributable to prior years, minus any valuation assets. Basically, it is the measure of
the unfunded liability allocable to past service. The UAAL is not booked as an expense all in one year
and does not appear in the Plan’s Statement of Net Assets. Nevertheless, it is reported in the Notes to
the Financial Statements and in the Required Supplementary Information. These are informational
sections within the Plan’s financial statements.
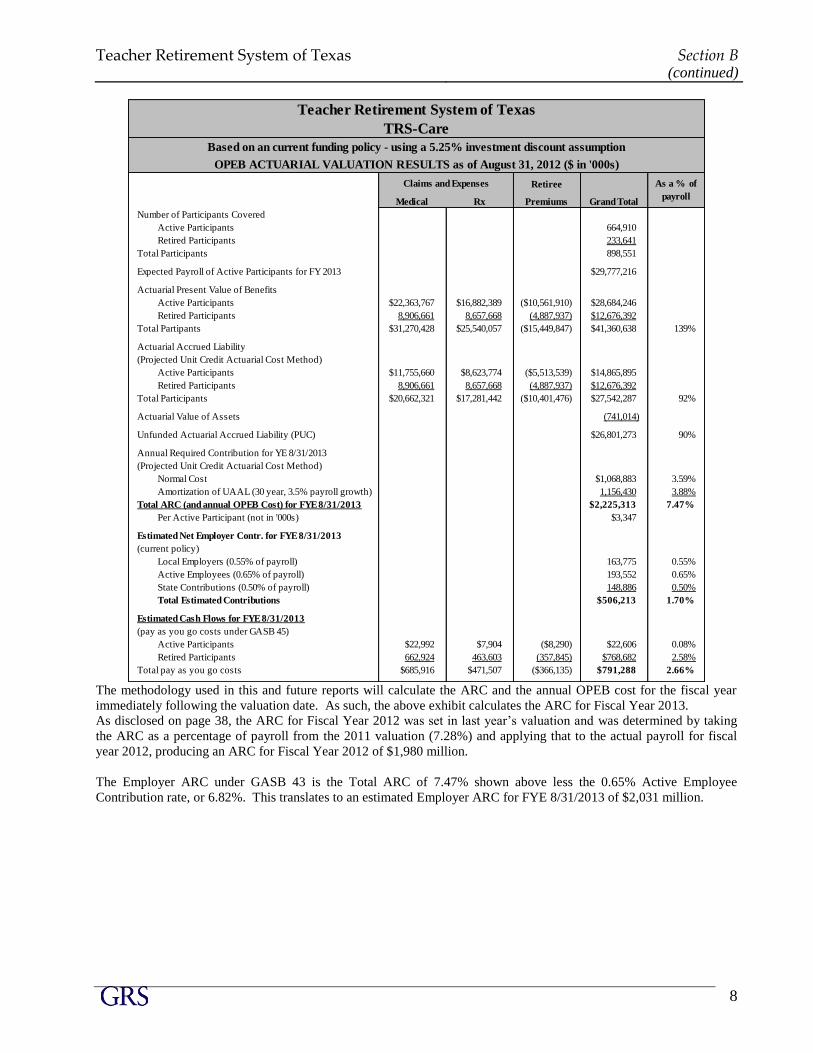
The cost and liabilities shown below are employer costs and liabilities, net of any co-pays,
deductibles, retiree contributions, and formulary rebates. The next chart provides a ten-year cash flow
projection of medical claims, prescription drug claims, retiree premiums, and the ARC.
Teacher Retirement System of Texas Section B (continued)
8
Retiree
Medical Rx Premiums
Number of Participants Covered
Active Participants 664,910
Retired Participants 233,641
Total Participants 898,551
Expected Payroll of Active Participants for FY 2013 $29,777,216
Actuarial Present Value of Benefits
Active Participants $22,363,767 $16,882,389 ($10,561,910) $28,684,246
Retired Participants 8,906,661 8,657,668 (4,887,937) $12,676,392
Total Partipants $31,270,428 $25,540,057 ($15,449,847) $41,360,638 139%
Actuarial Accrued Liability
(Projected Unit Credit Actuarial Cost Method)
Active Participants $11,755,660 $8,623,774 ($5,513,539) $14,865,895
Retired Participants 8,906,661 8,657,668 (4,887,937) $12,676,392
Total Participants $20,662,321 $17,281,442 ($10,401,476) $27,542,287 92%
Actuarial Value of Assets (741,014)
Unfunded Actuarial Accrued Liability (PUC) $26,801,273 90%
Annual Required Contribution for YE 8/31/2013
(Projected Unit Credit Actuarial Cost Method)
Normal Cost $1,068,883 3.59%
Amortization of UAAL (30 year, 3.5% payroll growth) 1,156,430 3.88%
Total ARC (and annual OPEB Cost) for FYE 8/31/2013 $2,225,313 7.47%
Per Active Participant (not in '000s) $3,347
Estimated Net Employer Contr. for FYE 8/31/2013
(current policy)
Local Employers (0.55% of payroll) 163,775 0.55%
Active Employees (0.65% of payroll) 193,552 0.65%
State Contributions (0.50% of payroll) 148,886 0.50%
Total Estimated Contributions $506,213 1.70%
(pay as you go costs under GASB 45)
Active Participants $22,992 $7,904 ($8,290) $22,606 0.08%
Retired Participants 662,924 463,603 (357,845) $768,682 2.58%
Total pay as you go costs $685,916 $471,507 ($366,135) $791,288 2.66%
Estimated Cash Flows for FYE 8/31/2013
Teacher Retirement System of Texas
OPEB ACTUARIAL VALUATION RESULTS as of August 31, 2012 ($ in '000s)
Grand Total
Based on an current funding policy - using a 5.25% investment discount assumption
Claims and Expenses As a % of
payroll
TRS-Care
The methodology used in this and future reports will calculate the ARC and the annual OPEB cost for the fiscal year
immediately following the valuation date. As such, the above exhibit calculates the ARC for Fiscal Year 2013.
As disclosed on page 38, the ARC for Fiscal Year 2012 was set in last year’s valuation and was determined by taking
the ARC as a percentage of payroll from the 2011 valuation (7.28%) and applying that to the actual payroll for fiscal
year 2012, producing an ARC for Fiscal Year 2012 of $1,980 million.
The Employer ARC under GASB 43 is the Total ARC of 7.47% shown above less the 0.65% Active Employee
Contribution rate, or 6.82%. This translates to an estimated Employer ARC for FYE 8/31/2013 of $2,031 million.
Teacher Retirement System of Texas Section B (continued)
9
Expected Expected Net Expected Total Projected
Fiscal Medical RX Benefits & Retiree PayGo Total
Year Claims Claims Expenses Premiums Costs ARC*
(1) (2) (3) (4) (5) (6) (7)
2013 685,916$ 471,507$ 1,157,423$ (366,135)$ 791,288$ 2,225,313$
2014 749,052 527,378 1,276,430 (366,182) 910,248 2,338,129
2015 846,422 590,530 1,436,952 (404,835) 1,032,117 2,445,552
2016 940,975 654,080 1,595,055 (443,748) 1,151,307 2,554,486
2017 1,034,609 716,940 1,751,549 (480,738) 1,270,811 2,664,699
2018 1,134,858 780,997 1,915,855 (519,013) 1,396,842 2,775,807
2019 1,245,452 845,656 2,091,108 (569,343) 1,521,765 2,887,232
2020 1,346,611 909,880 2,256,491 (623,594) 1,632,897 2,999,068
2021 1,435,543 973,409 2,408,952 (663,563) 1,745,389 3,111,095
2022 1,511,237 1,037,601 2,548,838 (702,203) 1,846,635 3,223,537
* based on current asset levels and expectation that annual revenues will equal annual net benefits & expenses
$ in 000s
This projection assumes an open group and that all assumptions are exactly met.
TRS-CAREProjected Health Claims, Premiums and Revenue Collected
Teacher Retirement System of Texas
Teacher Retirement System of Texas Section B (continued)
10
VALUATION RESULTS ADVANCED-FUNDING SCENARIO
OTHER POST EMPLOYMENT BENEFITS
ADMINISTERED BY THE
TEACHER RETIREMENT SYSTEM OF TEXAS
AS OF AUGUST 31, 2012
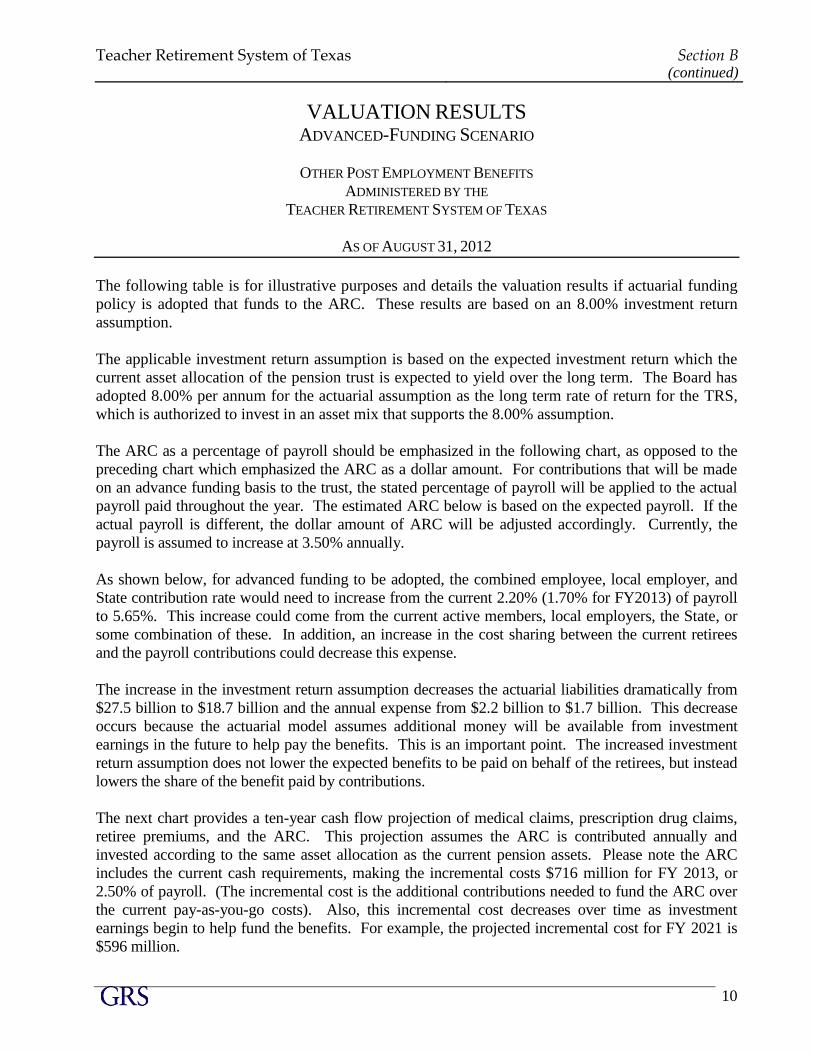
The following table is for illustrative purposes and details the valuation results if actuarial funding
policy is adopted that funds to the ARC. These results are based on an 8.00% investment return
assumption.
The applicable investment return assumption is based on the expected investment return which the
current asset allocation of the pension trust is expected to yield over the long term. The Board has
adopted 8.00% per annum for the actuarial assumption as the long term rate of return for the TRS,
which is authorized to invest in an asset mix that supports the 8.00% assumption.
The ARC as a percentage of payroll should be emphasized in the following chart, as opposed to the
preceding chart which emphasized the ARC as a dollar amount. For contributions that will be made
on an advance funding basis to the trust, the stated percentage of payroll will be applied to the actual
payroll paid throughout the year. The estimated ARC below is based on the expected payroll. If the
actual payroll is different, the dollar amount of ARC will be adjusted accordingly. Currently, the
payroll is assumed to increase at 3.50% annually.
As shown below, for advanced funding to be adopted, the combined employee, local employer, and
State contribution rate would need to increase from the current 2.20% (1.70% for FY2013) of payroll
to 5.65%. This increase could come from the current active members, local employers, the State, or
some combination of these. In addition, an increase in the cost sharing between the current retirees
and the payroll contributions could decrease this expense.
The increase in the investment return assumption decreases the actuarial liabilities dramatically from
$27.5 billion to $18.7 billion and the annual expense from $2.2 billion to $1.7 billion. This decrease
occurs because the actuarial model assumes additional money will be available from investment
earnings in the future to help pay the benefits. This is an important point. The increased investment
return assumption does not lower the expected benefits to be paid on behalf of the retirees, but instead
lowers the share of the benefit paid by contributions.
The next chart provides a ten-year cash flow projection of medical claims, prescription drug claims,
retiree premiums, and the ARC. This projection assumes the ARC is contributed annually and
invested according to the same asset allocation as the current pension assets. Please note the ARC
includes the current cash requirements, making the incremental costs $716 million for FY 2013, or
2.50% of payroll. (The incremental cost is the additional contributions needed to fund the ARC over
the current pay-as-you-go costs). Also, this incremental cost decreases over time as investment
earnings begin to help fund the benefits. For example, the projected incremental cost for FY 2021 is
$596 million.
Teacher Retirement System of Texas Section B (continued)
11
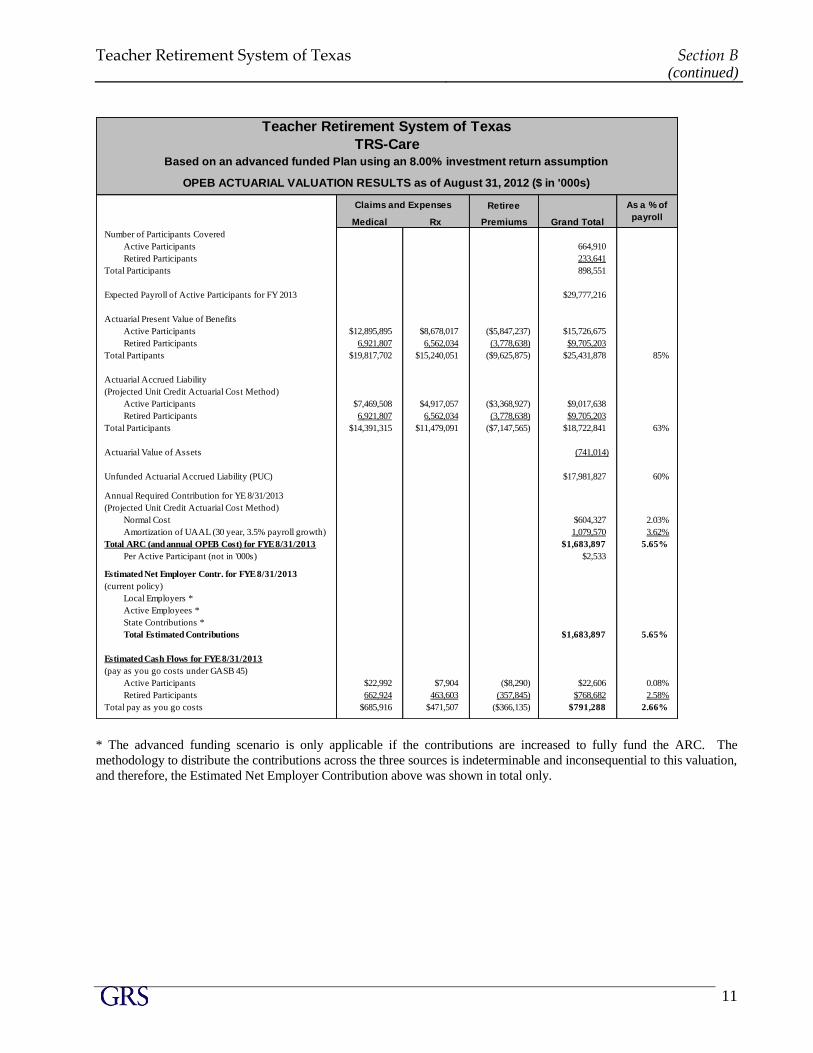
Retiree
Medical Rx Premiums
Number of Participants Covered
Active Participants 664,910
Retired Participants 233,641
Total Participants 898,551
Expected Payroll of Active Participants for FY 2013 $29,777,216
Actuarial Present Value of Benefits
Active Participants $12,895,895 $8,678,017 ($5,847,237) $15,726,675
Retired Participants 6,921,807 6,562,034 (3,778,638) $9,705,203
Total Partipants $19,817,702 $15,240,051 ($9,625,875) $25,431,878 85%
Actuarial Accrued Liability
(Projected Unit Credit Actuarial Cost Method)
Active Participants $7,469,508 $4,917,057 ($3,368,927) $9,017,638
Retired Participants 6,921,807 6,562,034 (3,778,638) $9,705,203
Total Participants $14,391,315 $11,479,091 ($7,147,565) $18,722,841 63%
Actuarial Value of Assets (741,014)
Unfunded Actuarial Accrued Liability (PUC) $17,981,827 60%
Annual Required Contribution for YE 8/31/2013
(Projected Unit Credit Actuarial Cost Method)
Normal Cost $604,327 2.03%
Amortization of UAAL (30 year, 3.5% payroll growth) 1,079,570 3.62%
Total ARC (and annual OPEB Cost) for FYE 8/31/2013 $1,683,897 5.65%
Per Active Participant (not in '000s) $2,533
Estimated Net Employer Contr. for FYE 8/31/2013
(current policy)
Local Employers *
Active Employees *
State Contributions *
Total Estimated Contributions $1,683,897 5.65%
(pay as you go costs under GASB 45)
Active Participants $22,992 $7,904 ($8,290) $22,606 0.08%
Retired Participants 662,924 463,603 (357,845) $768,682 2.58%
Total pay as you go costs $685,916 $471,507 ($366,135) $791,288 2.66%
Estimated Cash Flows for FYE 8/31/2013
Teacher Retirement System of Texas
OPEB ACTUARIAL VALUATION RESULTS as of August 31, 2012 ($ in '000s)
Grand Total
Based on an advanced funded Plan using an 8.00% investment return assumption
Claims and Expenses As a % of
payroll
TRS-Care
* The advanced funding scenario is only applicable if the contributions are increased to fully fund the ARC. The
methodology to distribute the contributions across the three sources is indeterminable and inconsequential to this valuation,
and therefore, the Estimated Net Employer Contribution above was shown in total only.
Teacher Retirement System of Texas Section B (continued)
12
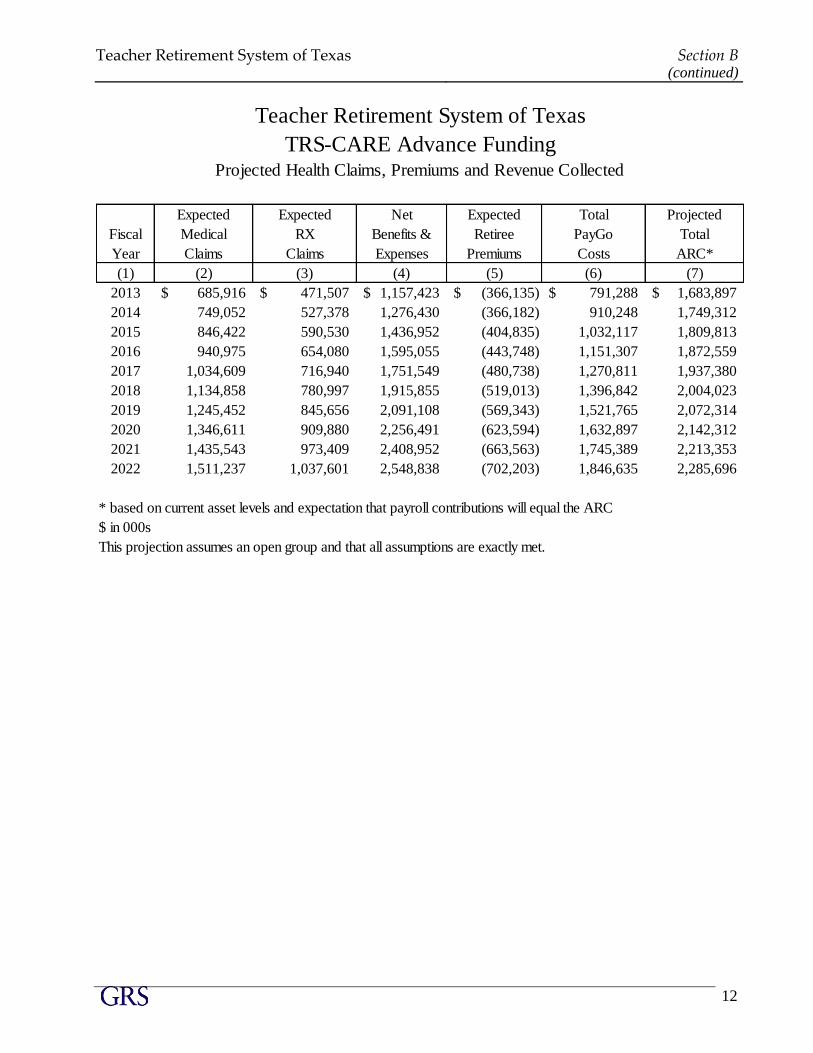
Expected Expected Net Expected Total Projected
Fiscal Medical RX Benefits & Retiree PayGo Total
Year Claims Claims Expenses Premiums Costs ARC*
(1) (2) (3) (4) (5) (6) (7)
2013 685,916$ 471,507$ 1,157,423$ (366,135)$ 791,288$ 1,683,897$
2014 749,052 527,378 1,276,430 (366,182) 910,248 1,749,312
2015 846,422 590,530 1,436,952 (404,835) 1,032,117 1,809,813
2016 940,975 654,080 1,595,055 (443,748) 1,151,307 1,872,559
2017 1,034,609 716,940 1,751,549 (480,738) 1,270,811 1,937,380
2018 1,134,858 780,997 1,915,855 (519,013) 1,396,842 2,004,023
2019 1,245,452 845,656 2,091,108 (569,343) 1,521,765 2,072,314
2020 1,346,611 909,880 2,256,491 (623,594) 1,632,897 2,142,312
2021 1,435,543 973,409 2,408,952 (663,563) 1,745,389 2,213,353
2022 1,511,237 1,037,601 2,548,838 (702,203) 1,846,635 2,285,696
* based on current asset levels and expectation that payroll contributions will equal the ARC
$ in 000s
This projection assumes an open group and that all assumptions are exactly met.
Projected Health Claims, Premiums and Revenue Collected
Teacher Retirement System of Texas
TRS-CARE Advance Funding
SECTION C
S EN S ITIV ITY A N A LY S IS
Teacher Retirement System of Texas Section C
14
POSTEMPLOYMENT HEALTH INSURANCE
SENSITIVITY ANALYSIS
Actuarial valuations deal with the cost of benefits to be paid in the future. The payments
considered will range from one month in the future to decades from the valuation date (for a
young, newly hired employee who may retire many years from now and live for many years in the
future). In order to establish a present day cost for these future benefit obligations, the actuary
bases the valuation on a number of assumptions about future occurrences. The occurrences that
must be considered include employee turnover, pay increases, disablement, retirements, deaths,
and investment income on anticipated plan assets.
When the benefits being valued are health care benefits, a key factor is the future cost of the
medical benefits being promised. Our projections not only include the current cost of the System's
health care benefits, but also include future health care cost increases. The final cost of providing
retiree health care benefits will depend upon how the charges for health care services actually
increase in the future.
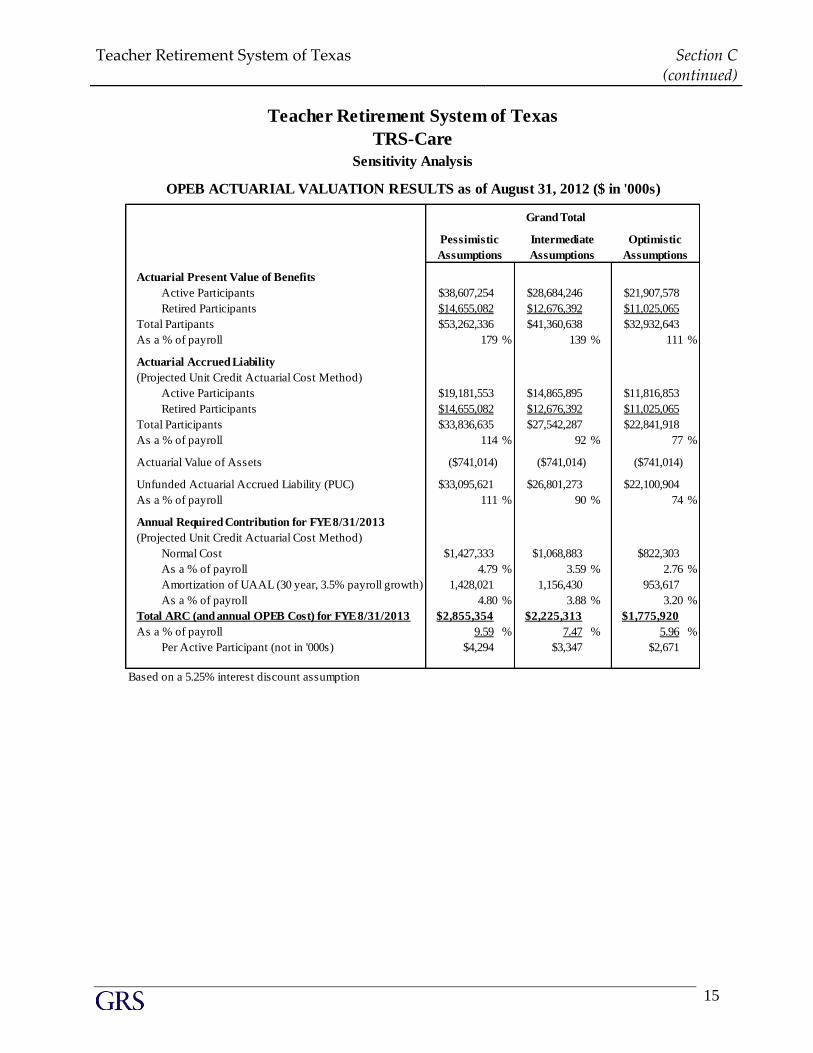
In order to demonstrate how the cost of these benefits can vary depending upon future health care
cost increases, we have performed additional valuations based upon alternative health care cost
increase assumptions. The schedule on page 15 compares (i) the computed cost of the retiree health
care benefits using the valuation (Intermediate) assumptions to (ii) results of alternate valuations.
One of the alternate valuations is based upon a pessimistic health care cost increase assumption.
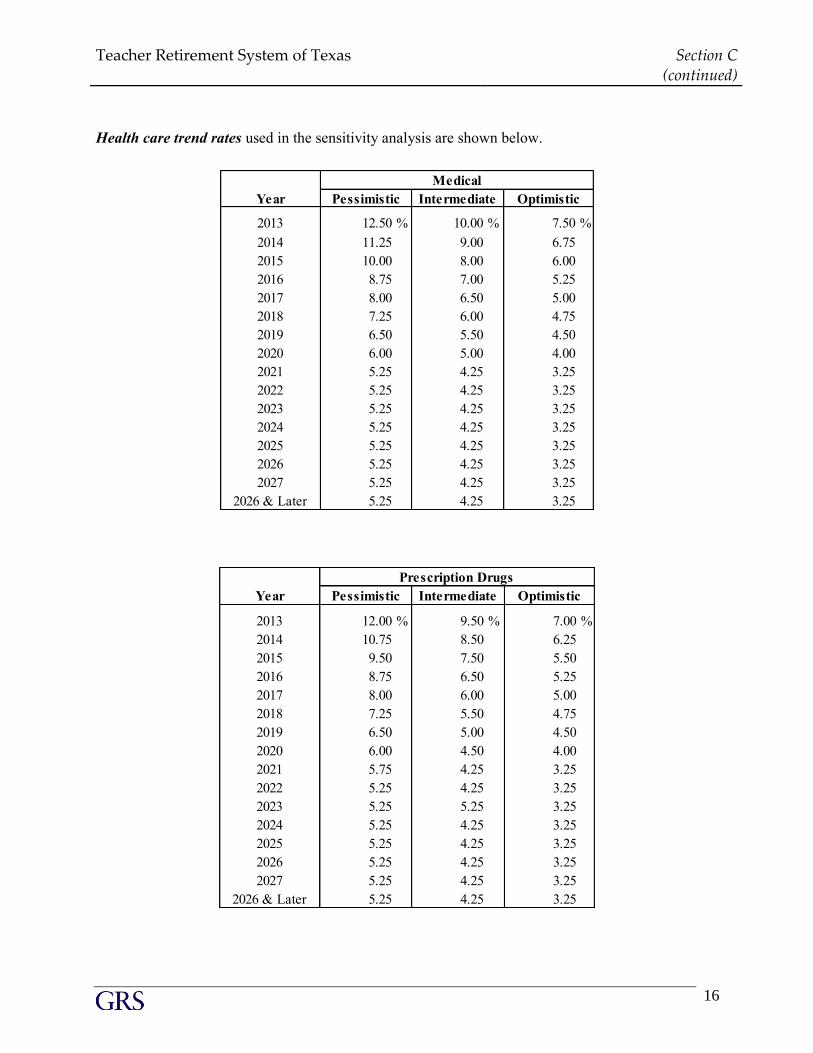
The other is based upon a more optimistic health care cost increase assumption. The schedule on
page 16 exhibits the health care cost increase assumptions used in each of the valuations.
Teacher Retirement System of Texas Section C (continued)
15
Actuarial Present Value of Benefits
Active Participants $38,607,254 $28,684,246 $21,907,578
Retired Participants $14,655,082 $12,676,392 $11,025,065
Total Partipants $53,262,336 $41,360,638 $32,932,643
As a % of payroll 179 % 139 % 111 %
Actuarial Accrued Liability
(Projected Unit Credit Actuarial Cost Method)
Active Participants $19,181,553 $14,865,895 $11,816,853
Retired Participants $14,655,082 $12,676,392 $11,025,065
Total Participants $33,836,635 $27,542,287 $22,841,918
As a % of payroll 114 % 92 % 77 %
Actuarial Value of Assets ($741,014) ($741,014) ($741,014)
Unfunded Actuarial Accrued Liability (PUC) $33,095,621 $26,801,273 $22,100,904
As a % of payroll 111 % 90 % 74 %
Annual Required Contribution for FYE 8/31/2013
(Projected Unit Credit Actuarial Cost Method)
Normal Cost $1,427,333 $1,068,883 $822,303
As a % of payroll 4.79 % 3.59 % 2.76 %
Amortization of UAAL (30 year, 3.5% payroll growth) 1,428,021 1,156,430 953,617
As a % of payroll 4.80 % 3.88 % 3.20 %
Total ARC (and annual OPEB Cost) for FYE 8/31/2013 $2,855,354 $2,225,313 $1,775,920
As a % of payroll 9.59 % 7.47 % 5.96 %
Per Active Participant (not in '000s) $4,294 $3,347 $2,671
Based on a 5.25% interest discount assumption
Grand Total
TRS-Care
Sensitivity Analysis
Teacher Retirement System of Texas
AssumptionsAssumptionsAssumptions
OPEB ACTUARIAL VALUATION RESULTS as of August 31, 2012 ($ in '000s)
Pessimistic Intermediate Optimistic
Teacher Retirement System of Texas Section C (continued)
16
Health care trend rates used in the sensitivity analysis are shown below.
Year
2013 12.50 % 10.00 % 7.50 %
2014 11.25 9.00 6.75
2015 10.00 8.00 6.00
2016 8.75 7.00 5.25
2017 8.00 6.50 5.00
2018 7.25 6.00 4.75
2019 6.50 5.50 4.50
2020 6.00 5.00 4.00
2021 5.25 4.25 3.25
2022 5.25 4.25 3.25
2023 5.25 4.25 3.25
2024 5.25 4.25 3.25
2025 5.25 4.25 3.25
2026 5.25 4.25 3.25
2027 5.25 4.25 3.25
2026 & Later 5.25 4.25 3.25
Medical
Pessimistic Intermediate Optimistic
Year
2013 12.00 % 9.50 % 7.00 %
2014 10.75 8.50 6.25
2015 9.50 7.50 5.50
2016 8.75 6.50 5.25
2017 8.00 6.00 5.00
2018 7.25 5.50 4.75
2019 6.50 5.00 4.50
2020 6.00 4.50 4.00
2021 5.75 4.25 3.25
2022 5.25 4.25 3.25
2023 5.25 5.25 3.25
2024 5.25 4.25 3.25
2025 5.25 4.25 3.25
2026 5.25 4.25 3.25
2027 5.25 4.25 3.25
2026 & Later 5.25 4.25 3.25
Prescription Drugs
Pessimistic Intermediate Optimistic
SECTION D
D EV ELO P MEN T O F B A S EL IN E C O S T S
Teacher Retirement System of Texas Section D
18
DEVELOPMENT OF BASELINE COSTS
Other Post Employment Benefits
Sponsored by the
Teacher Retirement System of Texas
As of August 31, 2012
Data Source
TRS-Care maintains a substantial amount of data for all its covered members for many years of
coverage. Substantial data maintained by the Retirement System was also provided for the
purpose of this OPEB Valuation. Claims and exposures for the three years ending August 31,
2012 were used for the development of the Baseline Costs. These were compared to industry
data for reasonableness. The actual claims and exposures were available by age, sex, status,
member type, plan coverage, years since retirement, etc. The actual claims and exposure data
were reliable and credible for the development of reasonable Baseline Costs.
Baseline Costs
An OPEB Valuation is a projection of long term benefit costs. So as a starting point, initial,
current year costs must be developed. Projections of future costs, many years ahead, are based
upon these initial current year costs. Care must be taken to ensure that reasonable Baseline Costs
are developed for each relevant Costing Variable.
Baseline Costs for this OPEB Valuation take the form of tables of current costs of benefits for
retirees (and their dependents and survivors), separately by:
age (20 through 110),
sex (M and F),
benefit type (medical, prescription drug),
health status (disabled and non-disabled),
TRS Plan choice
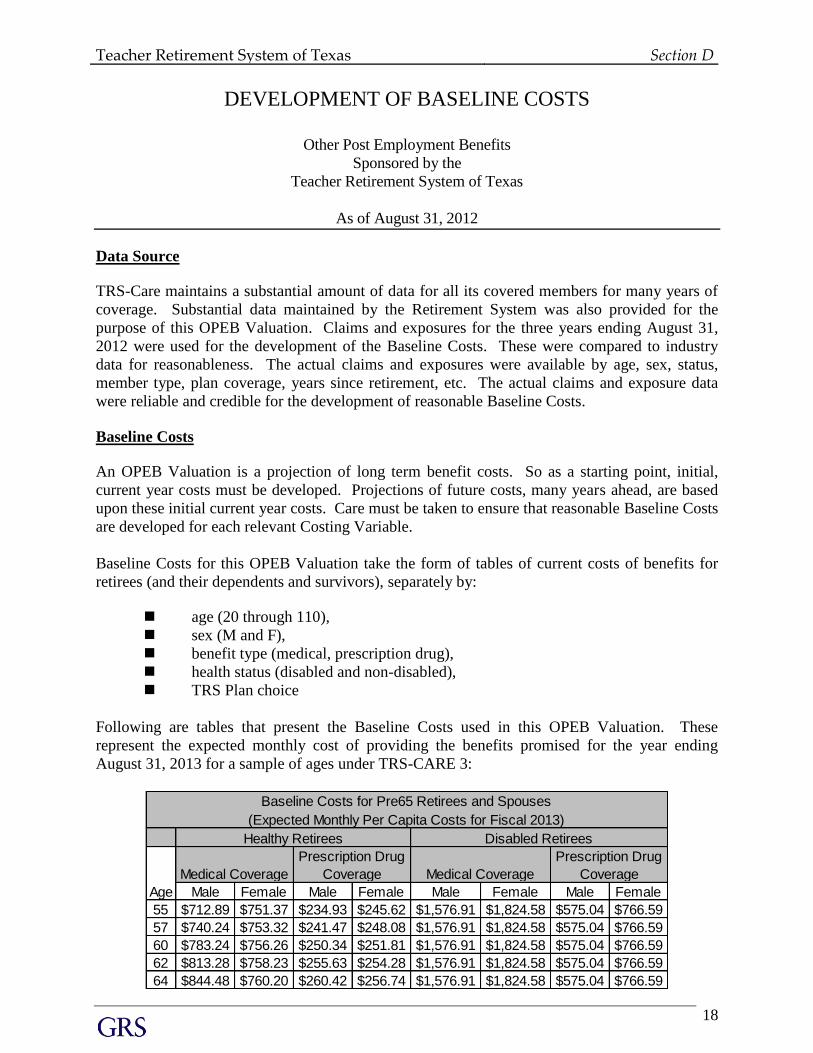
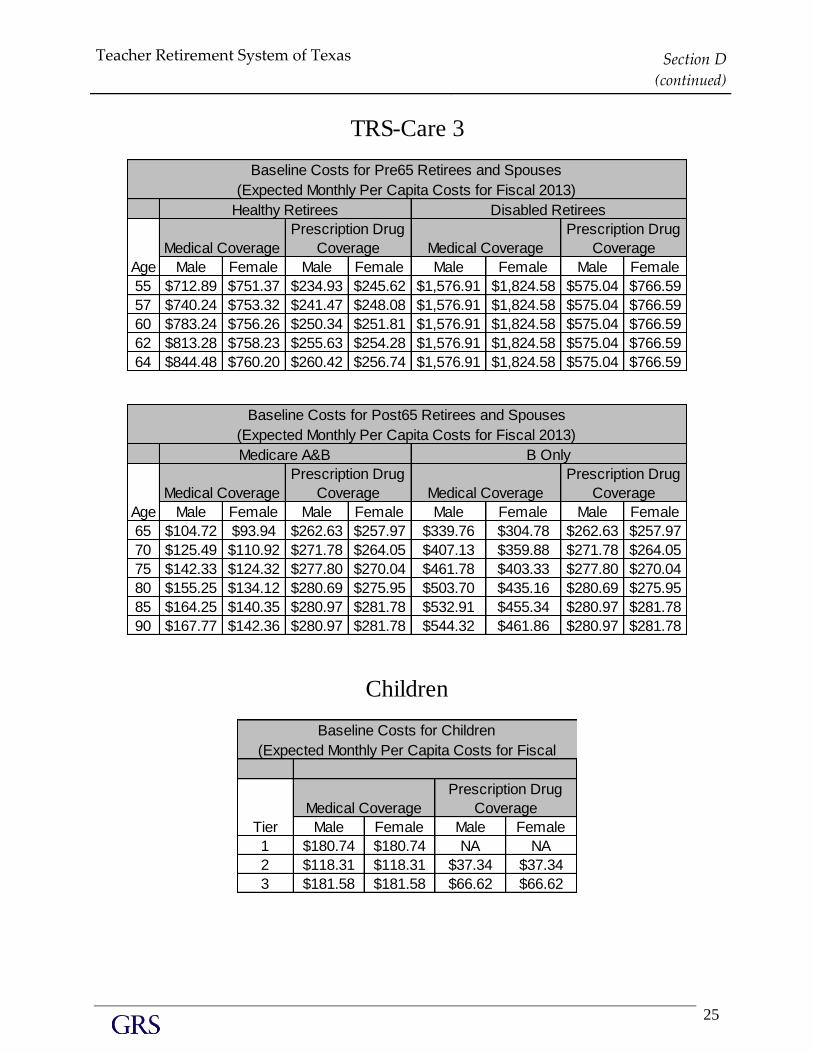
Following are tables that present the Baseline Costs used in this OPEB Valuation. These
represent the expected monthly cost of providing the benefits promised for the year ending
August 31, 2013 for a sample of ages under TRS-CARE 3:
Male Female Male Female Male Female Male Female
55 $712.89 $751.37 $234.93 $245.62 $1,576.91 $1,824.58 $575.04 $766.59
57 $740.24 $753.32 $241.47 $248.08 $1,576.91 $1,824.58 $575.04 $766.59
60 $783.24 $756.26 $250.34 $251.81 $1,576.91 $1,824.58 $575.04 $766.59
62 $813.28 $758.23 $255.63 $254.28 $1,576.91 $1,824.58 $575.04 $766.59
64 $844.48 $760.20 $260.42 $256.74 $1,576.91 $1,824.58 $575.04 $766.59
Baseline Costs for Pre65 Retirees and Spouses
(Expected Monthly Per Capita Costs for Fiscal 2013)
Healthy Retirees Disabled Retirees
Prescription Drug
Coverage
Age
Medical Coverage
Prescription Drug
Coverage Medical Coverage
Teacher Retirement System of Texas Section D
(continued)
19
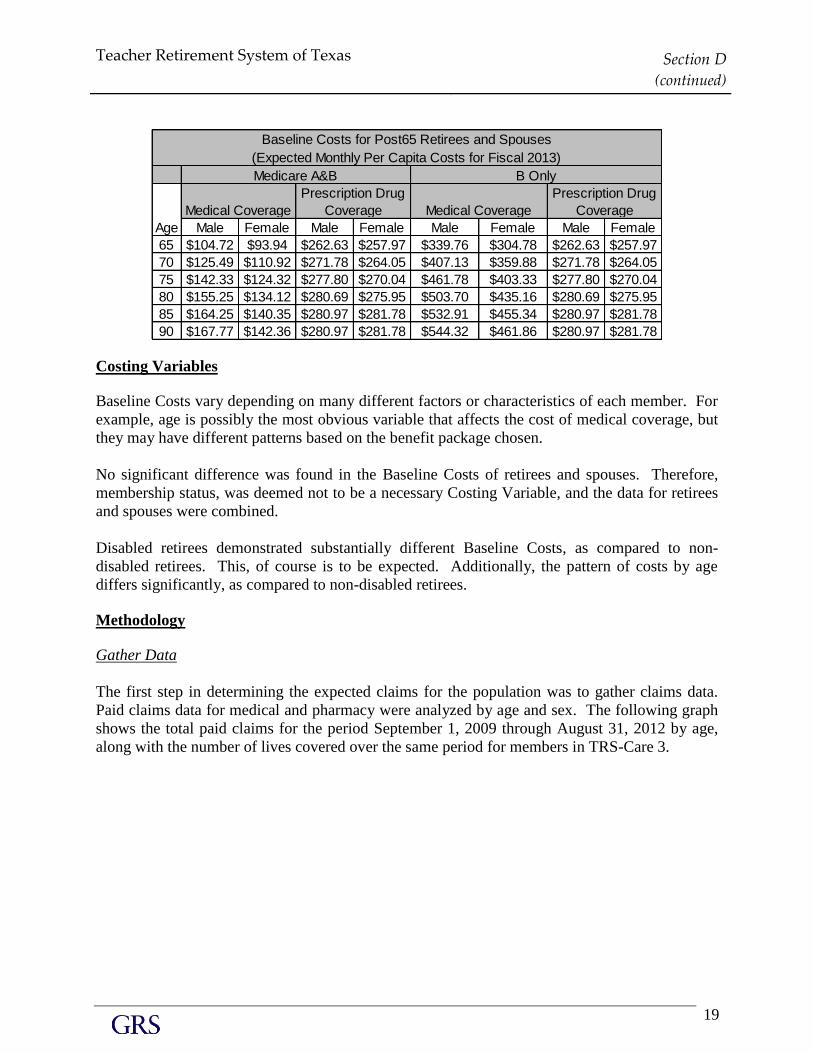
Male Female Male Female Male Female Male Female
65 $104.72 $93.94 $262.63 $257.97 $339.76 $304.78 $262.63 $257.97
70 $125.49 $110.92 $271.78 $264.05 $407.13 $359.88 $271.78 $264.05
75 $142.33 $124.32 $277.80 $270.04 $461.78 $403.33 $277.80 $270.04
80 $155.25 $134.12 $280.69 $275.95 $503.70 $435.16 $280.69 $275.95
85 $164.25 $140.35 $280.97 $281.78 $532.91 $455.34 $280.97 $281.78
90 $167.77 $142.36 $280.97 $281.78 $544.32 $461.86 $280.97 $281.78
Baseline Costs for Post65 Retirees and Spouses
(Expected Monthly Per Capita Costs for Fiscal 2013)
Medicare A&B B Only
Prescription Drug
Coverage
Age
Medical Coverage
Prescription Drug
Coverage Medical Coverage
Costing Variables
Baseline Costs vary depending on many different factors or characteristics of each member. For
example, age is possibly the most obvious variable that affects the cost of medical coverage, but
they may have different patterns based on the benefit package chosen.
No significant difference was found in the Baseline Costs of retirees and spouses. Therefore,
membership status, was deemed not to be a necessary Costing Variable, and the data for retirees
and spouses were combined.
Disabled retirees demonstrated substantially different Baseline Costs, as compared to non-
disabled retirees. This, of course is to be expected. Additionally, the pattern of costs by age
differs significantly, as compared to non-disabled retirees.
Methodology
Gather Data
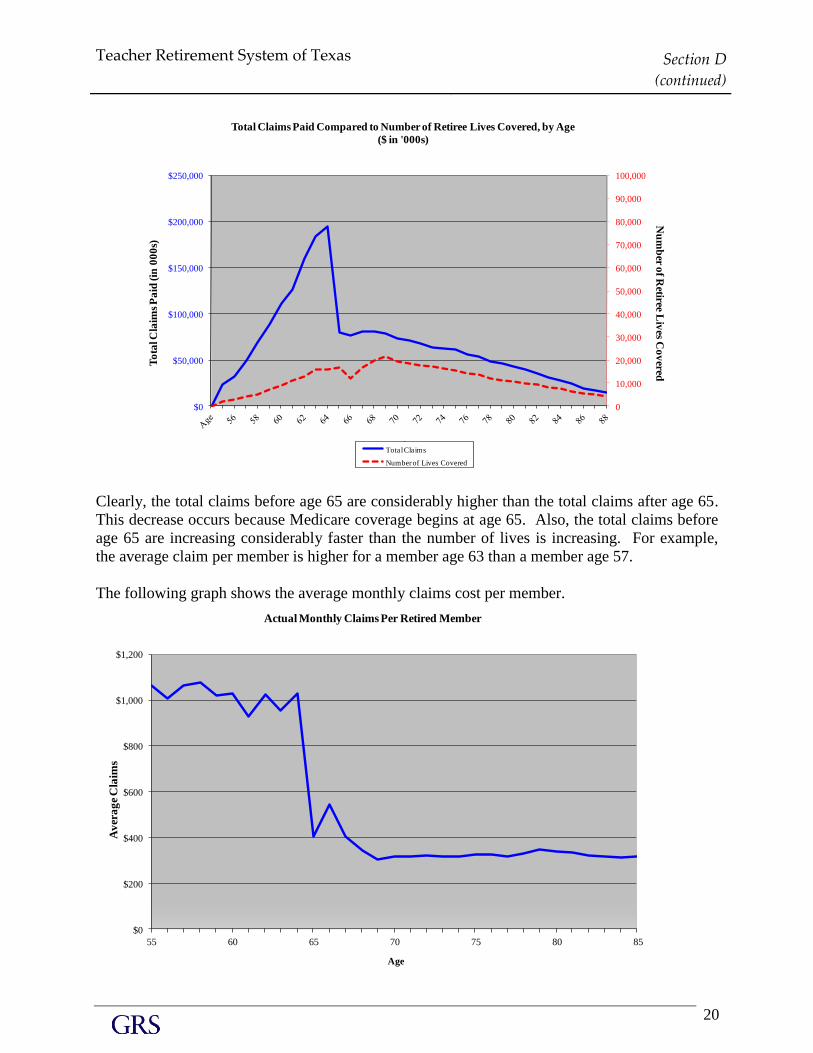
The first step in determining the expected claims for the population was to gather claims data.
Paid claims data for medical and pharmacy were analyzed by age and sex. The following graph
shows the total paid claims for the period September 1, 2009 through August 31, 2012 by age,
along with the number of lives covered over the same period for members in TRS-Care 3.
Teacher Retirement System of Texas Section D
(continued)
20
0
10,000
20,000
30,000
40,000
50,000
60,000
70,000
80,000
90,000
100,000
$0
$50,000
$100,000
$150,000
$200,000
$250,000
Nu
mb
er of R
etiree Liv
es Co
vered
To
tal C
laim
s P
aid
(in
00
0s)
Age
Total Claims Paid Compared to Number of Retiree Lives Covered, by Age
($ in '000s)
Total Claims
Number of Lives Covered
Clearly, the total claims before age 65 are considerably higher than the total claims after age 65.
This decrease occurs because Medicare coverage begins at age 65. Also, the total claims before
age 65 are increasing considerably faster than the number of lives is increasing. For example,
the average claim per member is higher for a member age 63 than a member age 57.
The following graph shows the average monthly claims cost per member.
$0
$200
$400
$600
$800
$1,000
$1,200
55 60 65 70 75 80 85
Av
era
ge
Cla
ims
Age
Actual Monthly Claims Per Retired Member
Teacher Retirement System of Texas Section D
(continued)
21
These two graphs show a need to model the increasing claims cost by age in the valuation. This
is consistent with other health care experience. This assumption is referred to as the aging factor
table. However, the aging experience for TRS-CARE is substantially less impactful when
compared to other healthcare populations. The reason for this is unknown. Because TRS has
enough credible experience, we were able to develop an aging table to model this dampened
impact of aging.
Develop Aging Table
The second step in determining the expected claims for the population was to develop the aging
factor table. In preparing the 2007 valuation, we developed an aging table based on the claims
history for fiscal years 2005-2007. We feel it is appropriate to use this aging table for the next
few valuations, revisiting the experience every 4-5 years in an experience study. The average
increases at each age were developed and smoothed based on the actual experience. Separate
aging factor tables were developed for medical and pharmacy, as well as by sex and health
status.
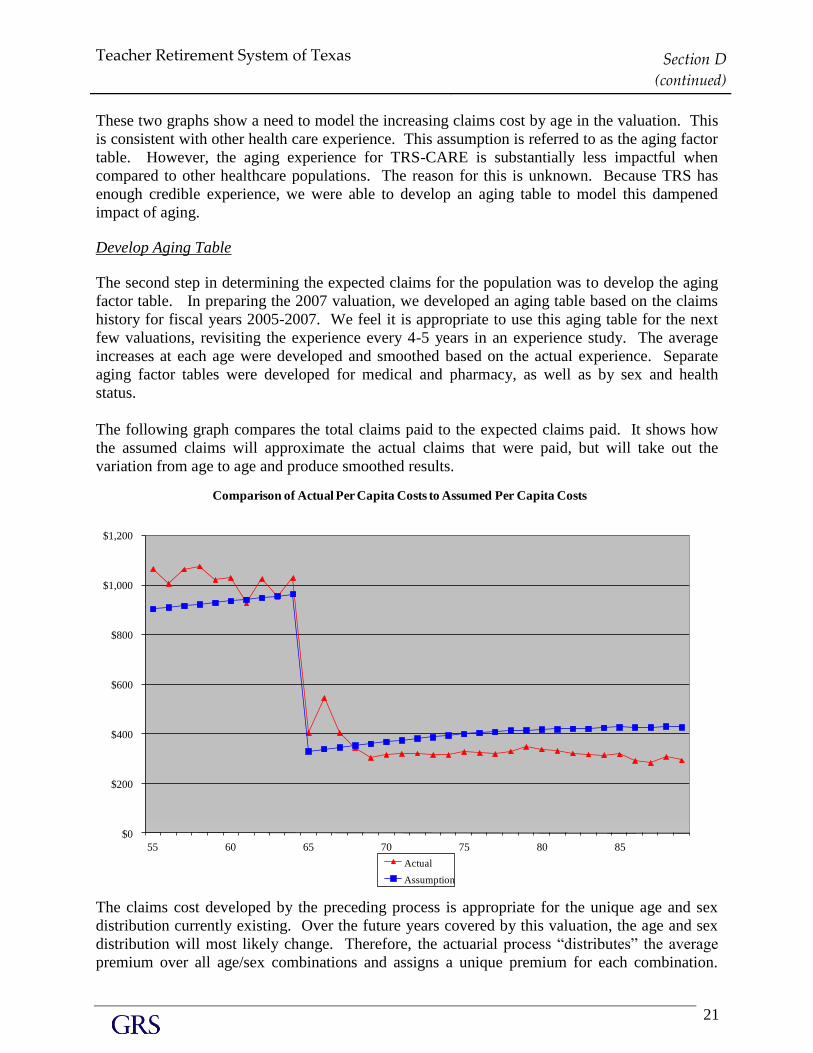
The following graph compares the total claims paid to the expected claims paid. It shows how
the assumed claims will approximate the actual claims that were paid, but will take out the
variation from age to age and produce smoothed results.
$0
$200
$400
$600
$800
$1,000
$1,200
55 60 65 70 75 80 85
Comparison of Actual Per Capita Costs to Assumed Per Capita Costs
Actual
Assumption
The claims cost developed by the preceding process is appropriate for the unique age and sex
distribution currently existing. Over the future years covered by this valuation, the age and sex
distribution will most likely change. Therefore, the actuarial process “distributes” the average
premium over all age/sex combinations and assigns a unique premium for each combination.
Teacher Retirement System of Texas Section D
(continued)
22
This process more accurately reflects health care costs in the retired population over the
projection period.
Adjust from Paid to Incurred
The next step is to make a slight adjustment to convert from paid to incurred. The expected per
capita costs need to be adjusted to recognize the trend increase in the incurred but not paid at the
end of the year in comparison to the claims paid in the first part of the year that were incurred in
the last part of the year before.
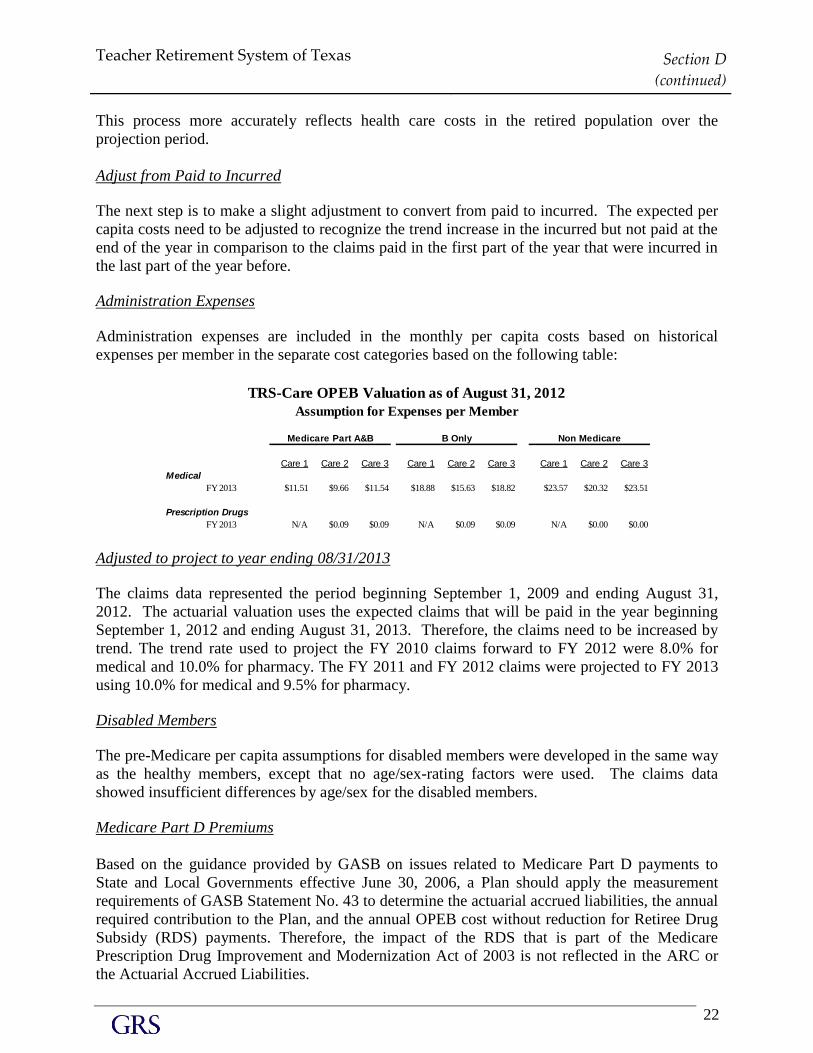
Administration Expenses
Administration expenses are included in the monthly per capita costs based on historical
expenses per member in the separate cost categories based on the following table:
Care 1 Care 2 Care 3 Care 1 Care 2 Care 3 Care 1 Care 2 Care 3
Medical
FY 2013 $11.51 $9.66 $11.54 $18.88 $15.63 $18.82 $23.57 $20.32 $23.51
Prescription Drugs
FY 2013 N/A $0.09 $0.09 N/A $0.09 $0.09 N/A $0.00 $0.00
TRS-Care OPEB Valuation as of August 31, 2012
Assumption for Expenses per Member
Medicare Part A&B B Only Non Medicare
Adjusted to project to year ending 08/31/2013
The claims data represented the period beginning September 1, 2009 and ending August 31,
2012. The actuarial valuation uses the expected claims that will be paid in the year beginning
September 1, 2012 and ending August 31, 2013. Therefore, the claims need to be increased by
trend. The trend rate used to project the FY 2010 claims forward to FY 2012 were 8.0% for
medical and 10.0% for pharmacy. The FY 2011 and FY 2012 claims were projected to FY 2013
using 10.0% for medical and 9.5% for pharmacy.
Disabled Members
The pre-Medicare per capita assumptions for disabled members were developed in the same way
as the healthy members, except that no age/sex-rating factors were used. The claims data
showed insufficient differences by age/sex for the disabled members.
Medicare Part D Premiums
Based on the guidance provided by GASB on issues related to Medicare Part D payments to
State and Local Governments effective June 30, 2006, a Plan should apply the measurement
requirements of GASB Statement No. 43 to determine the actuarial accrued liabilities, the annual
required contribution to the Plan, and the annual OPEB cost without reduction for Retiree Drug
Subsidy (RDS) payments. Therefore, the impact of the RDS that is part of the Medicare
Prescription Drug Improvement and Modernization Act of 2003 is not reflected in the ARC or
the Actuarial Accrued Liabilities.
Teacher Retirement System of Texas Section D
(continued)
23
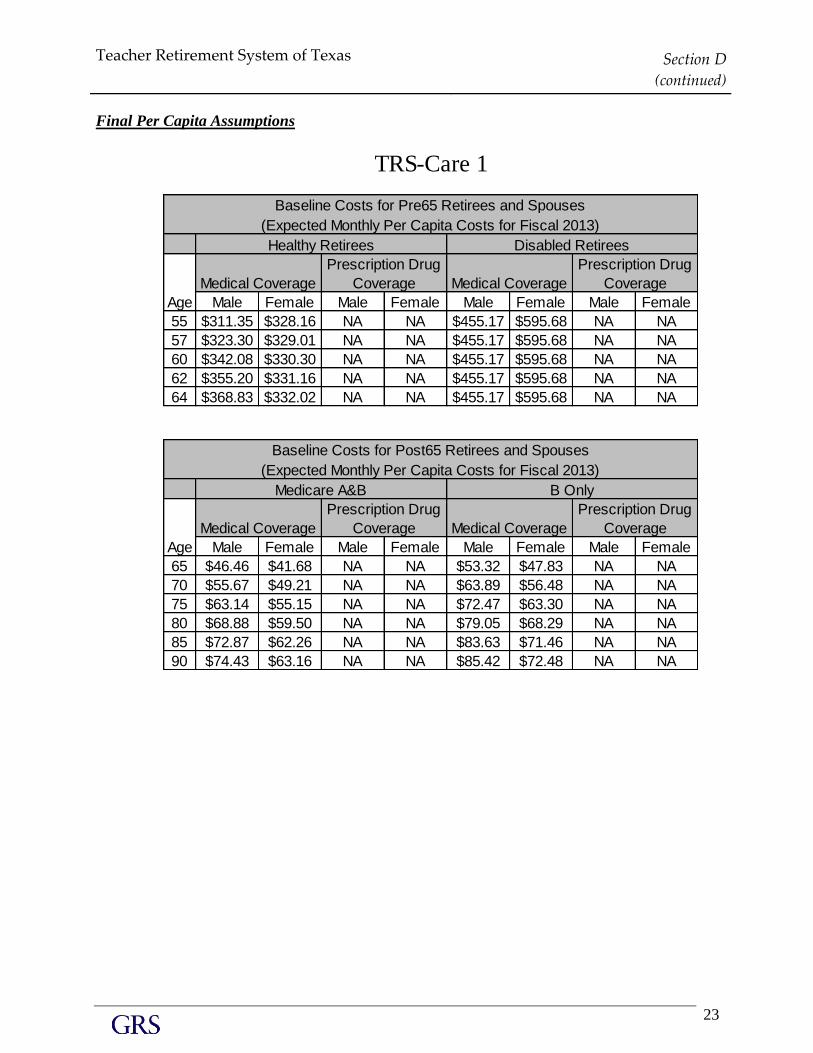
Final Per Capita Assumptions
Male Female Male Female Male Female Male Female
55 $311.35 $328.16 NA NA $455.17 $595.68 NA NA
57 $323.30 $329.01 NA NA $455.17 $595.68 NA NA
60 $342.08 $330.30 NA NA $455.17 $595.68 NA NA
62 $355.20 $331.16 NA NA $455.17 $595.68 NA NA
64 $368.83 $332.02 NA NA $455.17 $595.68 NA NA
Male Female Male Female Male Female Male Female
65 $46.46 $41.68 NA NA $53.32 $47.83 NA NA
70 $55.67 $49.21 NA NA $63.89 $56.48 NA NA
75 $63.14 $55.15 NA NA $72.47 $63.30 NA NA
80 $68.88 $59.50 NA NA $79.05 $68.29 NA NA
85 $72.87 $62.26 NA NA $83.63 $71.46 NA NA
90 $74.43 $63.16 NA NA $85.42 $72.48 NA NA
Age
Medical Coverage
Prescription Drug
Coverage Medical Coverage
Baseline Costs for Post65 Retirees and Spouses
(Expected Monthly Per Capita Costs for Fiscal 2013)
Medicare A&B B Only
Prescription Drug
Coverage
Age
Medical Coverage
Prescription Drug
Coverage Medical Coverage
Healthy Retirees Disabled Retirees
Prescription Drug
Coverage
TRS-Care 1
Baseline Costs for Pre65 Retirees and Spouses
(Expected Monthly Per Capita Costs for Fiscal 2013)
Teacher Retirement System of Texas Section D
(continued)
24
Male Female Male Female Male Female Male Female
55 $494.17 $520.85 $135.66 $141.83 $1,147.57 $1,427.24 $328.73 $483.79
57 $513.13 $522.20 $139.43 $143.25 $1,147.57 $1,427.24 $328.73 $483.79
60 $542.94 $524.24 $144.56 $145.41 $1,147.57 $1,427.24 $328.73 $483.79
62 $563.77 $525.60 $147.61 $146.83 $1,147.57 $1,427.24 $328.73 $483.79
64 $585.39 $526.97 $150.38 $148.25 $1,147.57 $1,427.24 $328.73 $483.79
Male Female Male Female Male Female Male Female
65 $71.45 $64.09 $151.65 $148.96 $201.84 $181.05 $151.65 $148.96
70 $85.61 $75.68 $156.94 $152.47 $241.85 $213.78 $156.94 $152.47
75 $97.10 $84.81 $160.41 $155.93 $274.32 $239.60 $160.41 $155.93
80 $105.92 $91.51 $162.08 $159.34 $299.22 $258.50 $162.08 $159.34
85 $112.06 $95.75 $162.24 $162.71 $316.57 $270.49 $162.24 $162.71
90 $114.46 $97.12 $162.24 $162.71 $323.35 $274.37 $162.24 $162.71
Healthy Retirees Disabled Retirees
Age
Medical Coverage
Prescription Drug
Coverage Medical Coverage
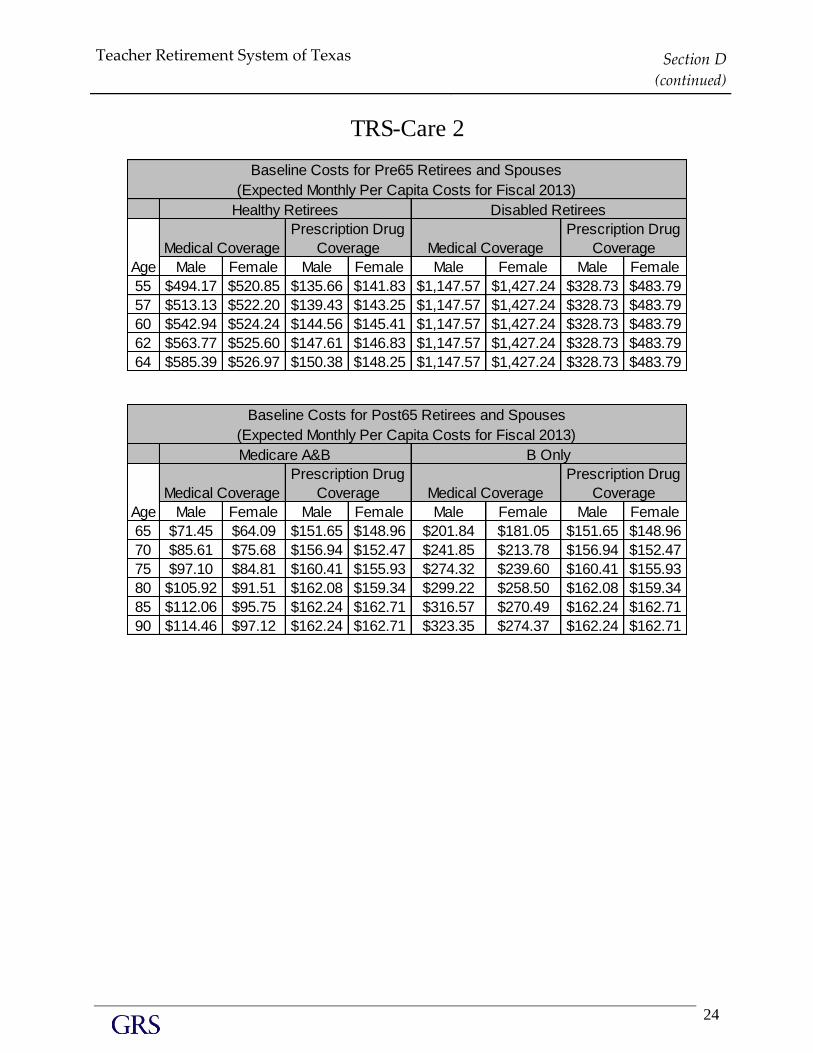
TRS-Care 2
Baseline Costs for Pre65 Retirees and Spouses
(Expected Monthly Per Capita Costs for Fiscal 2013)
Age
Medical Coverage
Prescription Drug
Coverage Medical Coverage
Prescription Drug
Coverage
Baseline Costs for Post65 Retirees and Spouses
(Expected Monthly Per Capita Costs for Fiscal 2013)
Medicare A&B B Only
Prescription Drug
Coverage
Teacher Retirement System of Texas Section D
(continued)
25
Male Female Male Female Male Female Male Female
55 $712.89 $751.37 $234.93 $245.62 $1,576.91 $1,824.58 $575.04 $766.59
57 $740.24 $753.32 $241.47 $248.08 $1,576.91 $1,824.58 $575.04 $766.59
60 $783.24 $756.26 $250.34 $251.81 $1,576.91 $1,824.58 $575.04 $766.59
62 $813.28 $758.23 $255.63 $254.28 $1,576.91 $1,824.58 $575.04 $766.59
64 $844.48 $760.20 $260.42 $256.74 $1,576.91 $1,824.58 $575.04 $766.59
Male Female Male Female Male Female Male Female
65 $104.72 $93.94 $262.63 $257.97 $339.76 $304.78 $262.63 $257.97
70 $125.49 $110.92 $271.78 $264.05 $407.13 $359.88 $271.78 $264.05
75 $142.33 $124.32 $277.80 $270.04 $461.78 $403.33 $277.80 $270.04
80 $155.25 $134.12 $280.69 $275.95 $503.70 $435.16 $280.69 $275.95
85 $164.25 $140.35 $280.97 $281.78 $532.91 $455.34 $280.97 $281.78
90 $167.77 $142.36 $280.97 $281.78 $544.32 $461.86 $280.97 $281.78
TRS-Care 3
Baseline Costs for Pre65 Retirees and Spouses
(Expected Monthly Per Capita Costs for Fiscal 2013)
Healthy Retirees Disabled Retirees
Prescription Drug
Coverage
Baseline Costs for Post65 Retirees and Spouses
(Expected Monthly Per Capita Costs for Fiscal 2013)
Medicare A&B B Only
Age
Medical Coverage
Prescription Drug
Coverage Medical Coverage
Prescription Drug
Coverage
Age
Medical Coverage
Prescription Drug
Coverage Medical Coverage
Male Female Male Female
1 $180.74 $180.74 NA NA
2 $118.31 $118.31 $37.34 $37.34
3 $181.58 $181.58 $66.62 $66.62
Tier
Medical Coverage
Prescription Drug
Coverage
Children
Baseline Costs for Children
(Expected Monthly Per Capita Costs for Fiscal
SECTION E
S U MMA RY OF B EN EF IT P R O V IS IO N S
Teacher Retirement System of Texas Section E
27
SUMMARY OF THE
TRS-Care Retiree Health Care Plan Provisions
Other Post Employment Benefits
Sponsored by the
Teacher Retirement System of Texas
As of August 31, 2012
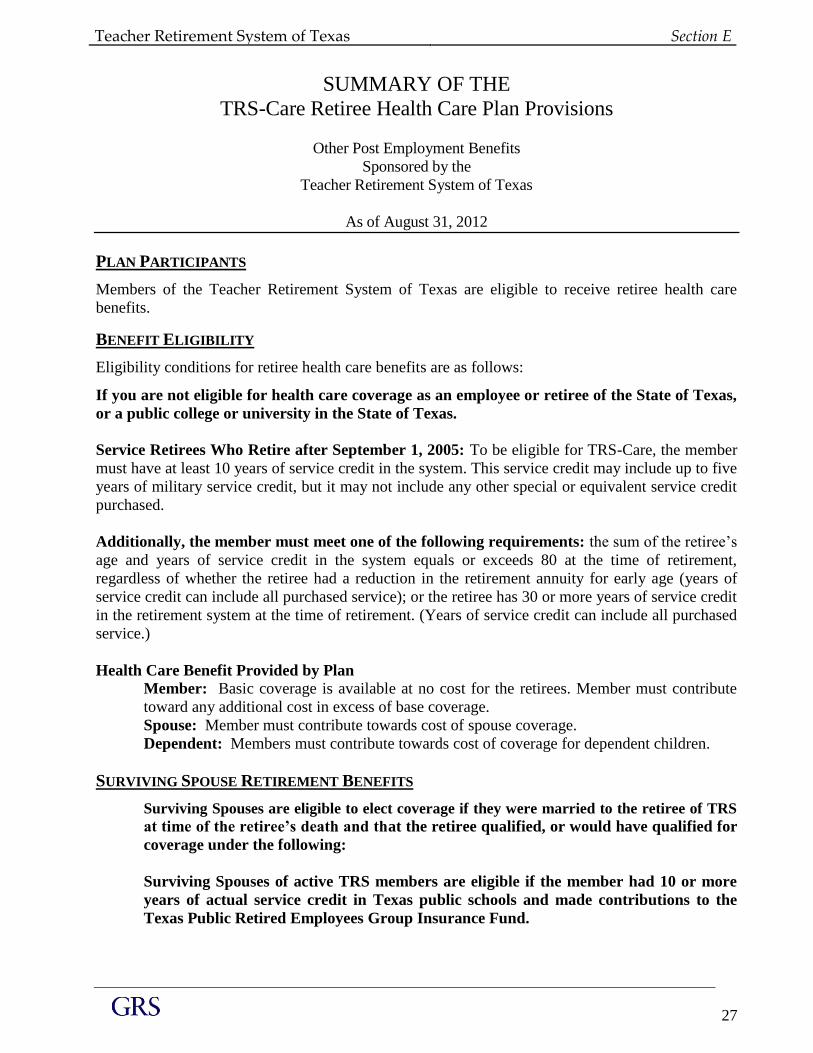
PLAN PARTICIPANTS
Members of the Teacher Retirement System of Texas are eligible to receive retiree health care
benefits.
BENEFIT ELIGIBILITY
Eligibility conditions for retiree health care benefits are as follows:
If you are not eligible for health care coverage as an employee or retiree of the State of Texas,
or a public college or university in the State of Texas.
Service Retirees Who Retire after September 1, 2005: To be eligible for TRS-Care, the member
must have at least 10 years of service credit in the system. This service credit may include up to five
years of military service credit, but it may not include any other special or equivalent service credit
purchased.
Additionally, the member must meet one of the following requirements: the sum of the retiree’s
age and years of service credit in the system equals or exceeds 80 at the time of retirement,
regardless of whether the retiree had a reduction in the retirement annuity for early age (years of
service credit can include all purchased service); or the retiree has 30 or more years of service credit
in the retirement system at the time of retirement. (Years of service credit can include all purchased
service.)
Health Care Benefit Provided by Plan Member: Basic coverage is available at no cost for the retirees. Member must contribute
toward any additional cost in excess of base coverage.
Spouse: Member must contribute towards cost of spouse coverage.
Dependent: Members must contribute towards cost of coverage for dependent children.
SURVIVING SPOUSE RETIREMENT BENEFITS
Surviving Spouses are eligible to elect coverage if they were married to the retiree of TRS
at time of the retiree’s death and that the retiree qualified, or would have qualified for
coverage under the following:
Surviving Spouses of active TRS members are eligible if the member had 10 or more
years of actual service credit in Texas public schools and made contributions to the
Texas Public Retired Employees Group Insurance Fund.
Teacher Retirement System of Texas Section E (continued)
28
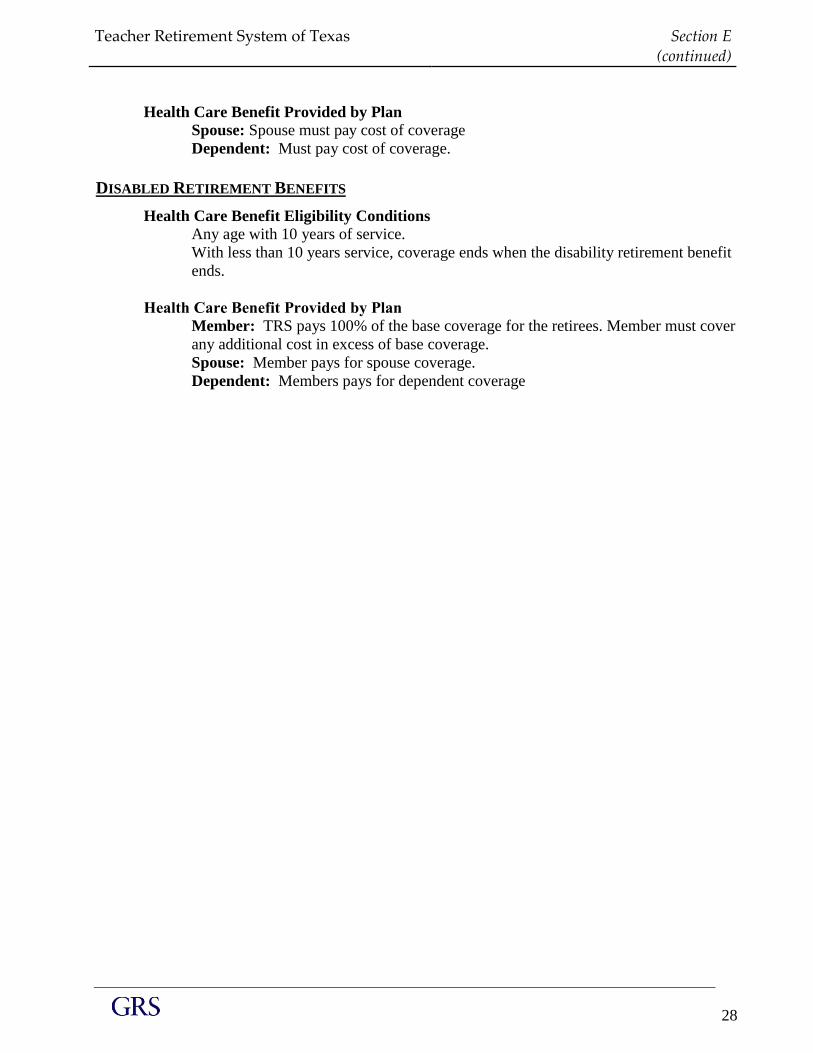
Health Care Benefit Provided by Plan Spouse: Spouse must pay cost of coverage
Dependent: Must pay cost of coverage.
DISABLED RETIREMENT BENEFITS
Health Care Benefit Eligibility Conditions
Any age with 10 years of service.
With less than 10 years service, coverage ends when the disability retirement benefit
ends.
Health Care Benefit Provided by Plan
Member: TRS pays 100% of the base coverage for the retirees. Member must cover
any additional cost in excess of base coverage.
Spouse: Member pays for spouse coverage.
Dependent: Members pays for dependent coverage
Teacher Retirement System of Texas Section E (continued)
29
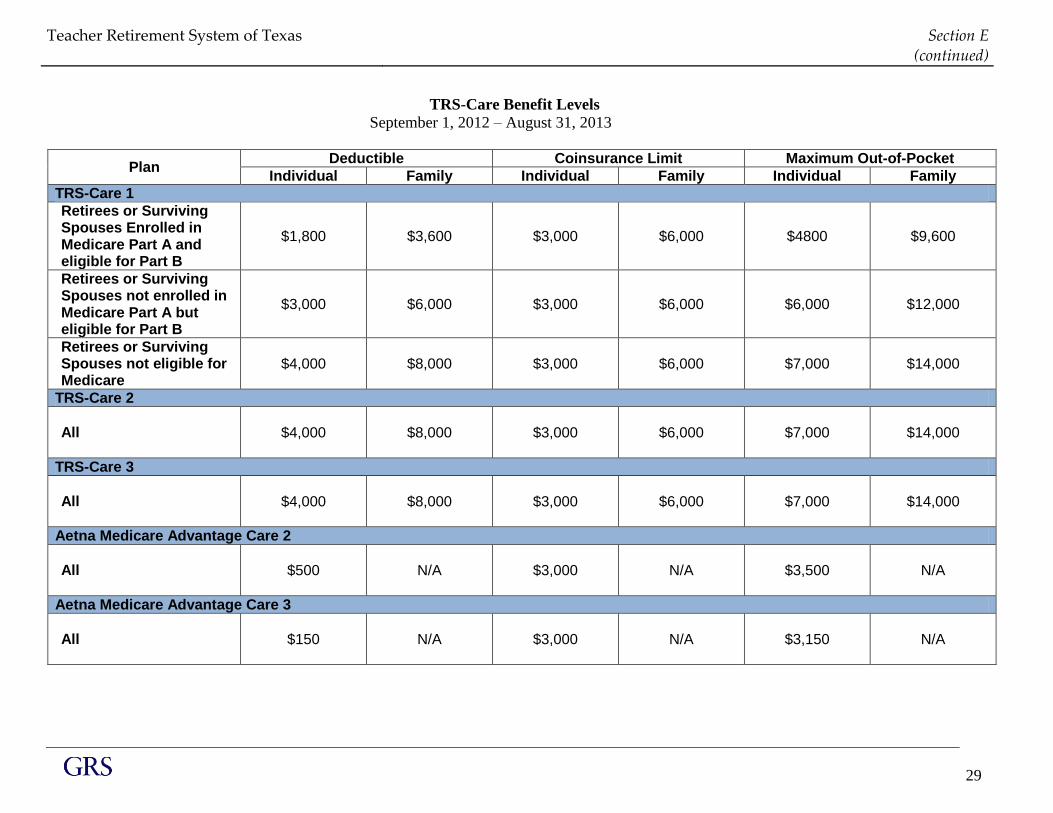
TRS-Care Benefit Levels
September 1, 2012 – August 31, 2013
Plan Deductible Coinsurance Limit Maximum Out-of-Pocket
Individual Family Individual Family Individual Family
TRS-Care 1
Retirees or Surviving Spouses Enrolled in Medicare Part A and eligible for Part B
$1,800 $3,600 $3,000 $6,000 $4800 $9,600
Retirees or Surviving Spouses not enrolled in Medicare Part A but eligible for Part B
$3,000 $6,000 $3,000 $6,000 $6,000 $12,000
Retirees or Surviving Spouses not eligible for Medicare
$4,000 $8,000 $3,000 $6,000 $7,000 $14,000
TRS-Care 2
All $4,000 $8,000 $3,000 $6,000 $7,000 $14,000
TRS-Care 3
All $4,000 $8,000 $3,000 $6,000 $7,000 $14,000
Aetna Medicare Advantage Care 2
All $500 N/A $3,000 N/A $3,500 N/A
Aetna Medicare Advantage Care 3
All $150 N/A $3,000 N/A $3,150 N/A
Teacher Retirement System of Texas Section E (continued)
30
Retiree
Premium
TRS-Care 1
<20 20-29 30+ <20 20-29 30+
Retiree or Surviving Spouse Only
With Part A&B of Medicare $0 $80 $70 $60 $110 $100 $90
With Part B of Medicare Only $0 $165 $155 $145 $245 $230 $215
Not Eligible for Medicare $0 $210 $200 $190 $310 $295 $280
Retiree and Spoouse
Both with Part A&B of Medicare $20 $190 $175 $160 $275 $255 $235
Both with Part B Only of Medicare $75 $360 $340 $320 $535 $505 $475
Neither Eligible for Medicare $140 $450 $430 $410 $665 $635 $605
Retiree with A&B/Spouse with B Only $60 $275 $255 $235 $400 $375 $350
Retiree with A&B/Spouse not Eligible for Medicare $90 $320 $300 $280 $465 $440 $415
Retiree with B Only/Spouse not Eligible for Medicare $120 $405 $385 $365 $600 $570 $540
Retiree with B Only/Spouse with A&B $25 $275 $260 $245 $410 $385 $360
Retiree not Eligible for Medicare/Spouse with A&B $30 $320 $305 $290 $475 $450 $425
Retiree not Eligible for Medicare/ Spouse with B Only $80 $405 $385 $365 $600 $570 $540
Retiree or Suviving Spouse and Child(ren)
With Part A&B of Medicare $41 $142 $132 $122 $192 $182 $172
With Part B of Medicare Only $34 $227 $217 $207 $327 $312 $297
Not Eligible for Medicare $28 $272 $262 $252 $392 $377 $362
Retiree, Spouse and Child(ren)
Retiree and Spouse with Medicare A&B $61 $252 $237 $222 $357 $337 $317
Retiree and Spouse with Medicare B Only $109 $422 $402 $382 $617 $587 $557
Retiree and Spouse not Eligible for Medicare $168 $512 $492 $472 $747 $717 $687
Retiree with A&B/Spouse with B Only $101 $337 $317 $297 $482 $457 $432
Retiree with A&B/Spouse not Eligible for Medicare $131 $382 $362 $342 $547 $522 $497
Retiree with B Only/Spouse not Eligible for Medicare $154 $467 $447 $427 $682 $652 $622
Retiree with B Only/Spouse with A&B $59 $337 $322 $307 $492 $467 $442
Retiree not Eligible for Medicare/Spouse with A&B $58 $382 $367 $352 $557 $532 $507
Retiree not Eligible for Medicare/ Spouse with B Only $108 $467 $447 $427 $682 $652 $622
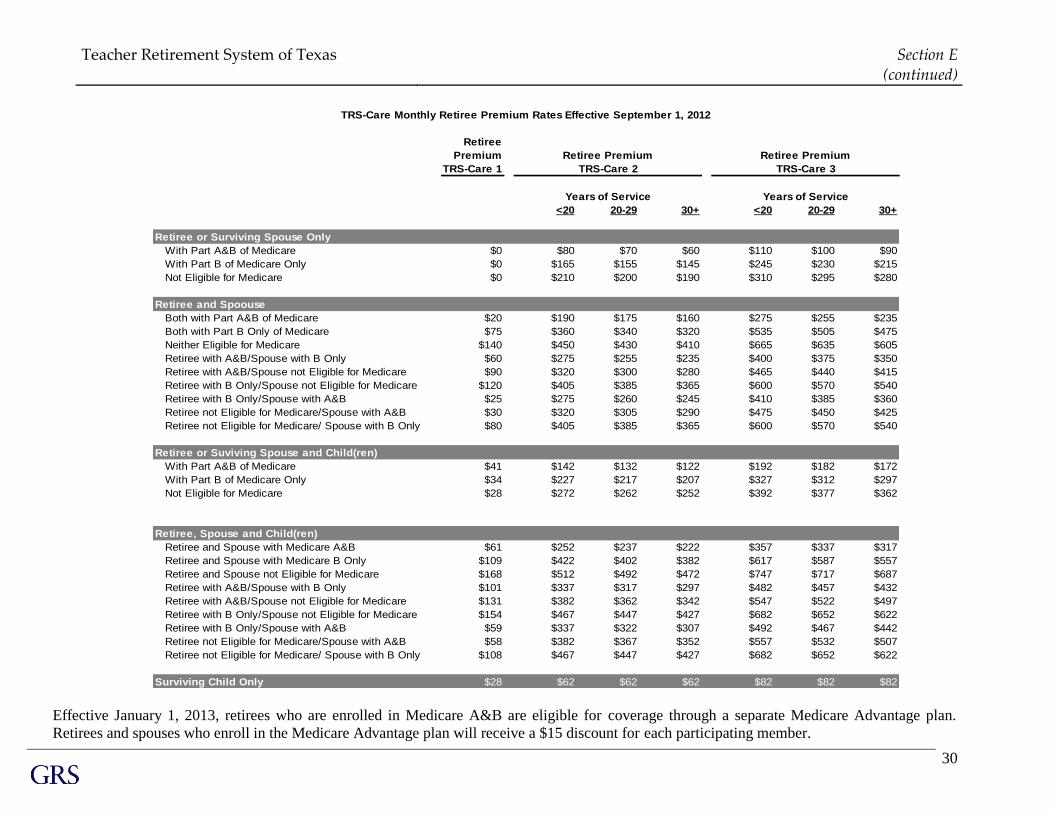
Surviving Child Only $28 $62 $62 $62 $82 $82 $82
TRS-Care Monthly Retiree Premium Rates Effective September 1, 2012
Retiree Premium
TRS-Care 2
Years of Service
Retiree Premium
TRS-Care 3
Years of Service
Effective January 1, 2013, retirees who are enrolled in Medicare A&B are eligible for coverage through a separate Medicare Advantage plan.
Retirees and spouses who enroll in the Medicare Advantage plan will receive a $15 discount for each participating member.
SECTION F
S U MMA RY OF PA RTIC IPA N T D ATA
Teacher Retirement System of Texas Section F
32
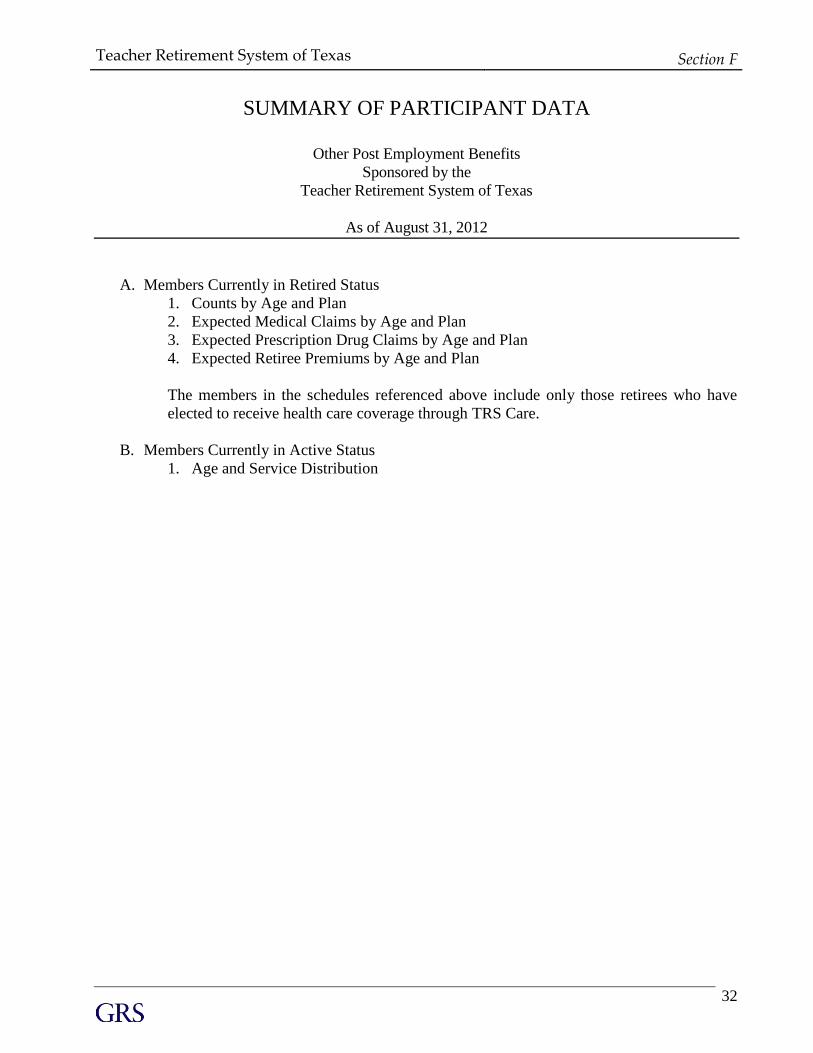
SUMMARY OF PARTICIPANT DATA
Other Post Employment Benefits
Sponsored by the
Teacher Retirement System of Texas
As of August 31, 2012
A. Members Currently in Retired Status
1. Counts by Age and Plan
2. Expected Medical Claims by Age and Plan
3. Expected Prescription Drug Claims by Age and Plan
4. Expected Retiree Premiums by Age and Plan
The members in the schedules referenced above include only those retirees who have
elected to receive health care coverage through TRS Care.
B. Members Currently in Active Status
1. Age and Service Distribution
Teacher Retirement System of Texas Section F
(continued)
33
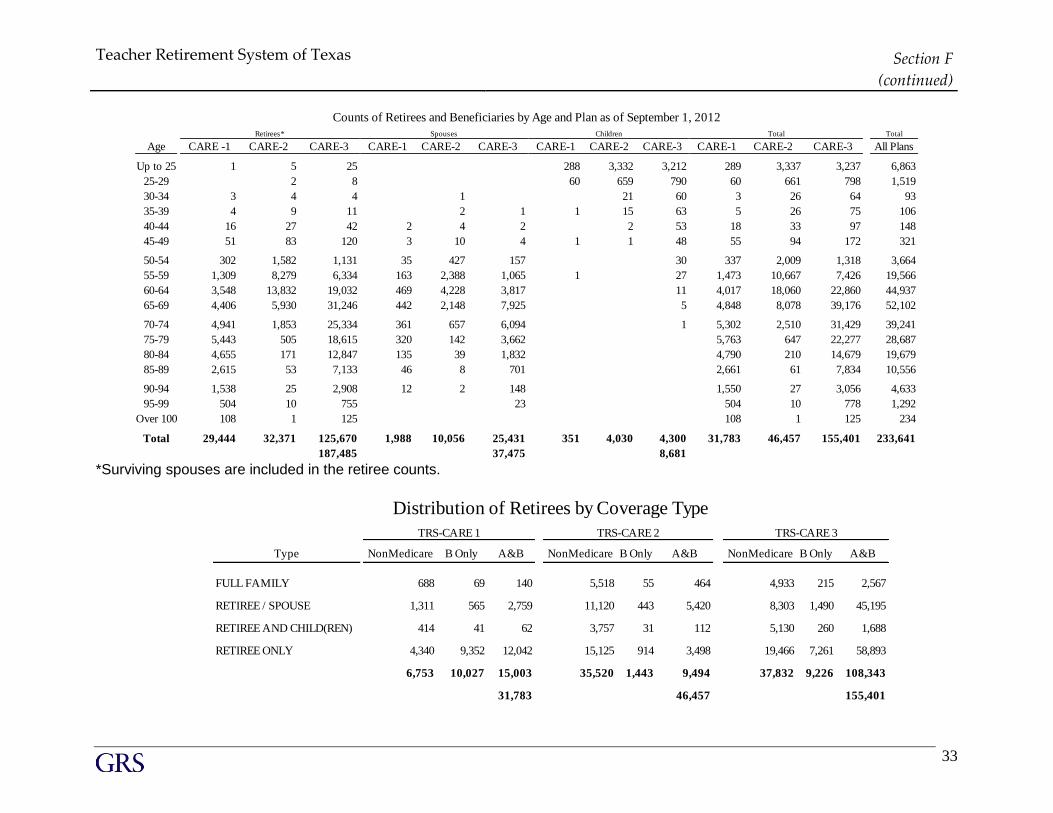
Total
Age CARE -1 CARE-2 CARE-3 CARE-1 CARE-2 CARE-3 CARE-1 CARE-2 CARE-3 CARE-1 CARE-2 CARE-3 All Plans
Up to 25 1 5 25 288 3,332 3,212 289 3,337 3,237 6,863
25-29 2 8 60 659 790 60 661 798 1,519
30-34 3 4 4 1 21 60 3 26 64 93
35-39 4 9 11 2 1 1 15 63 5 26 75 106
40-44 16 27 42 2 4 2 2 53 18 33 97 148
45-49 51 83 120 3 10 4 1 1 48 55 94 172 321
50-54 302 1,582 1,131 35 427 157 30 337 2,009 1,318 3,664
55-59 1,309 8,279 6,334 163 2,388 1,065 1 27 1,473 10,667 7,426 19,566
60-64 3,548 13,832 19,032 469 4,228 3,817 11 4,017 18,060 22,860 44,937
65-69 4,406 5,930 31,246 442 2,148 7,925 5 4,848 8,078 39,176 52,102
70-74 4,941 1,853 25,334 361 657 6,094 1 5,302 2,510 31,429 39,241
75-79 5,443 505 18,615 320 142 3,662 5,763 647 22,277 28,687
80-84 4,655 171 12,847 135 39 1,832 4,790 210 14,679 19,679
85-89 2,615 53 7,133 46 8 701 2,661 61 7,834 10,556
90-94 1,538 25 2,908 12 2 148 1,550 27 3,056 4,633
95-99 504 10 755 23 504 10 778 1,292
Over 100 108 1 125 108 1 125 234
Total 29,444 32,371 125,670 1,988 10,056 25,431 351 4,030 4,300 31,783 46,457 155,401 233,641
187,485 37,475 8,681
Retirees* Spouses Children Total
Counts of Retirees and Beneficiaries by Age and Plan as of September 1, 2012
*Surviving spouses are included in the retiree counts.
Type NonMedicare B Only A&B NonMedicare B Only A&B NonMedicare B Only A&B
FULL FAMILY 688 69 140 5,518 55 464 4,933 215 2,567
RETIREE / SPOUSE 1,311 565 2,759 11,120 443 5,420 8,303 1,490 45,195
RETIREE AND CHILD(REN) 414 41 62 3,757 31 112 5,130 260 1,688
RETIREE ONLY 4,340 9,352 12,042 15,125 914 3,498 19,466 7,261 58,893
6,753 10,027 15,003 35,520 1,443 9,494 37,832 9,226 108,343
31,783 46,457 155,401
TRS-CARE 1 TRS-CARE 2 TRS-CARE 3
Distribution of Retirees by Coverage Type
Teacher Retirement System of Texas Section F
(continued)
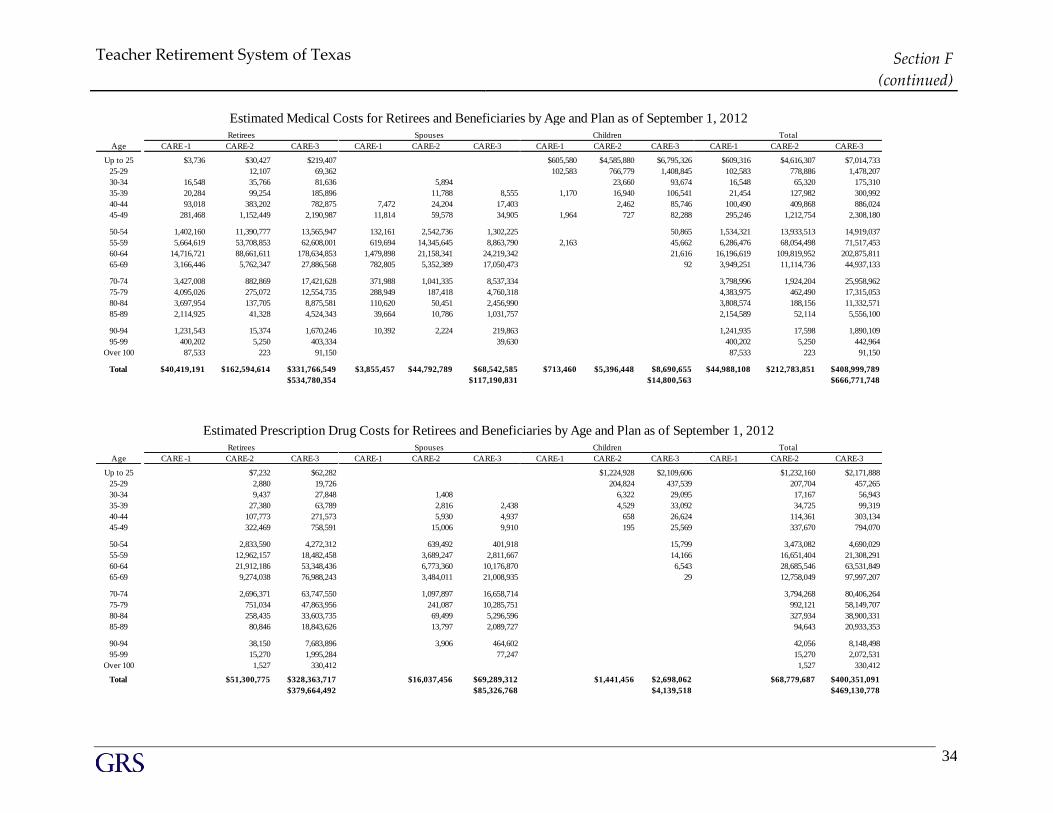
34
Age CARE -1 CARE-2 CARE-3 CARE-1 CARE-2 CARE-3 CARE-1 CARE-2 CARE-3 CARE-1 CARE-2 CARE-3
Up to 25 $3,736 $30,427 $219,407 $605,580 $4,585,880 $6,795,326 $609,316 $4,616,307 $7,014,733
25-29 12,107 69,362 102,583 766,779 1,408,845 102,583 778,886 1,478,207
30-34 16,548 35,766 81,636 5,894 23,660 93,674 16,548 65,320 175,310
35-39 20,284 99,254 185,896 11,788 8,555 1,170 16,940 106,541 21,454 127,982 300,992
40-44 93,018 383,202 782,875 7,472 24,204 17,403 2,462 85,746 100,490 409,868 886,024
45-49 281,468 1,152,449 2,190,987 11,814 59,578 34,905 1,964 727 82,288 295,246 1,212,754 2,308,180
50-54 1,402,160 11,390,777 13,565,947 132,161 2,542,736 1,302,225 50,865 1,534,321 13,933,513 14,919,037
55-59 5,664,619 53,708,853 62,608,001 619,694 14,345,645 8,863,790 2,163 45,662 6,286,476 68,054,498 71,517,453
60-64 14,716,721 88,661,611 178,634,853 1,479,898 21,158,341 24,219,342 21,616 16,196,619 109,819,952 202,875,811
65-69 3,166,446 5,762,347 27,886,568 782,805 5,352,389 17,050,473 92 3,949,251 11,114,736 44,937,133
70-74 3,427,008 882,869 17,421,628 371,988 1,041,335 8,537,334 3,798,996 1,924,204 25,958,962
75-79 4,095,026 275,072 12,554,735 288,949 187,418 4,760,318 4,383,975 462,490 17,315,053
80-84 3,697,954 137,705 8,875,581 110,620 50,451 2,456,990 3,808,574 188,156 11,332,571
85-89 2,114,925 41,328 4,524,343 39,664 10,786 1,031,757 2,154,589 52,114 5,556,100
90-94 1,231,543 15,374 1,670,246 10,392 2,224 219,863 1,241,935 17,598 1,890,109
95-99 400,202 5,250 403,334 39,630 400,202 5,250 442,964
Over 100 87,533 223 91,150 87,533 223 91,150
Total $40,419,191 $162,594,614 $331,766,549 $3,855,457 $44,792,789 $68,542,585 $713,460 $5,396,448 $8,690,655 $44,988,108 $212,783,851 $408,999,789
$534,780,354 $117,190,831 $14,800,563 $666,771,748
Spouses Children TotalRetirees
Estimated Medical Costs for Retirees and Beneficiaries by Age and Plan as of September 1, 2012
Age CARE -1 CARE-2 CARE-3 CARE-1 CARE-2 CARE-3 CARE-1 CARE-2 CARE-3 CARE-1 CARE-2 CARE-3
Up to 25 $7,232 $62,282 $1,224,928 $2,109,606 $1,232,160 $2,171,888
25-29 2,880 19,726 204,824 437,539 207,704 457,265
30-34 9,437 27,848 1,408 6,322 29,095 17,167 56,943
35-39 27,380 63,789 2,816 2,438 4,529 33,092 34,725 99,319
40-44 107,773 271,573 5,930 4,937 658 26,624 114,361 303,134
45-49 322,469 758,591 15,006 9,910 195 25,569 337,670 794,070
50-54 2,833,590 4,272,312 639,492 401,918 15,799 3,473,082 4,690,029
55-59 12,962,157 18,482,458 3,689,247 2,811,667 14,166 16,651,404 21,308,291
60-64 21,912,186 53,348,436 6,773,360 10,176,870 6,543 28,685,546 63,531,849
65-69 9,274,038 76,988,243 3,484,011 21,008,935 29 12,758,049 97,997,207
70-74 2,696,371 63,747,550 1,097,897 16,658,714 3,794,268 80,406,264
75-79 751,034 47,863,956 241,087 10,285,751 992,121 58,149,707
80-84 258,435 33,603,735 69,499 5,296,596 327,934 38,900,331
85-89 80,846 18,843,626 13,797 2,089,727 94,643 20,933,353
90-94 38,150 7,683,896 3,906 464,602 42,056 8,148,498
95-99 15,270 1,995,284 77,247 15,270 2,072,531
Over 100 1,527 330,412 1,527 330,412
Total $51,300,775 $328,363,717 $16,037,456 $69,289,312 $1,441,456 $2,698,062 $68,779,687 $400,351,091
$379,664,492 $85,326,768 $4,139,518 $469,130,778
Retirees TotalSpouses Children
Estimated Prescription Drug Costs for Retirees and Beneficiaries by Age and Plan as of September 1, 2012
Teacher Retirement System of Texas Section F
(continued)
35
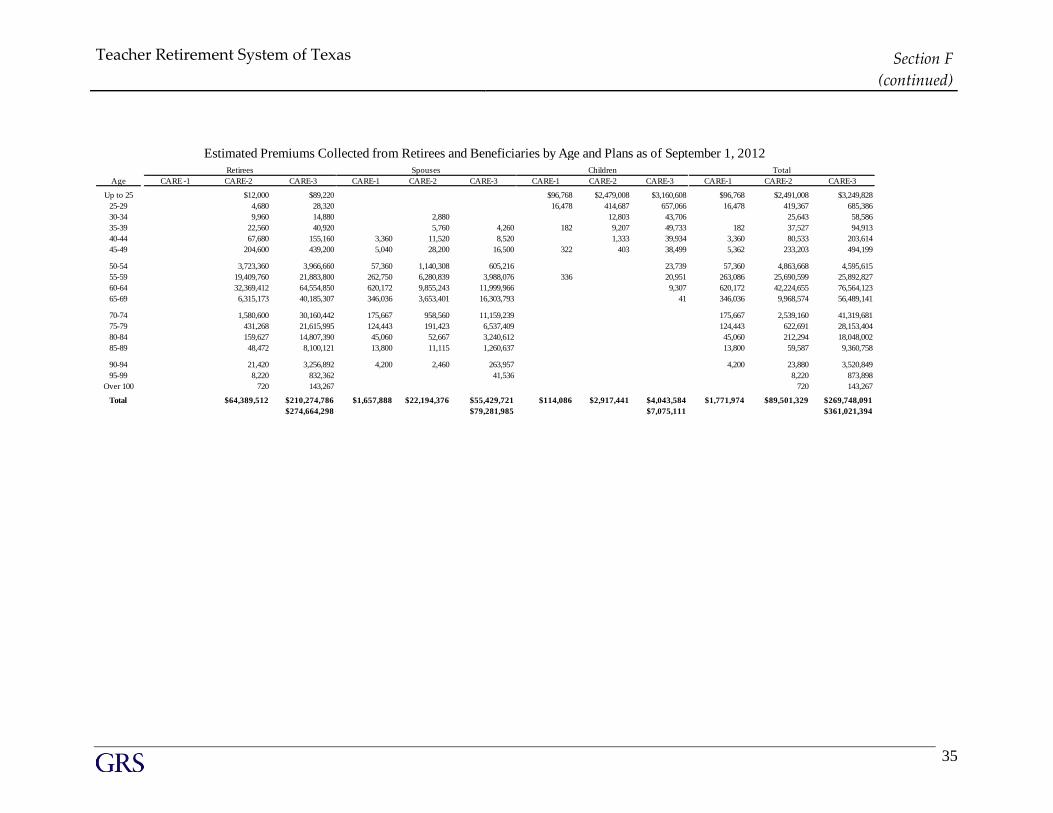
Age CARE -1 CARE-2 CARE-3 CARE-1 CARE-2 CARE-3 CARE-1 CARE-2 CARE-3 CARE-1 CARE-2 CARE-3
Up to 25 $12,000 $89,220 $96,768 $2,479,008 $3,160,608 $96,768 $2,491,008 $3,249,828
25-29 4,680 28,320 16,478 414,687 657,066 16,478 419,367 685,386
30-34 9,960 14,880 2,880 12,803 43,706 25,643 58,586
35-39 22,560 40,920 5,760 4,260 182 9,207 49,733 182 37,527 94,913
40-44 67,680 155,160 3,360 11,520 8,520 1,333 39,934 3,360 80,533 203,614
45-49 204,600 439,200 5,040 28,200 16,500 322 403 38,499 5,362 233,203 494,199
50-54 3,723,360 3,966,660 57,360 1,140,308 605,216 23,739 57,360 4,863,668 4,595,615
55-59 19,409,760 21,883,800 262,750 6,280,839 3,988,076 336 20,951 263,086 25,690,599 25,892,827
60-64 32,369,412 64,554,850 620,172 9,855,243 11,999,966 9,307 620,172 42,224,655 76,564,123
65-69 6,315,173 40,185,307 346,036 3,653,401 16,303,793 41 346,036 9,968,574 56,489,141
70-74 1,580,600 30,160,442 175,667 958,560 11,159,239 175,667 2,539,160 41,319,681
75-79 431,268 21,615,995 124,443 191,423 6,537,409 124,443 622,691 28,153,404
80-84 159,627 14,807,390 45,060 52,667 3,240,612 45,060 212,294 18,048,002
85-89 48,472 8,100,121 13,800 11,115 1,260,637 13,800 59,587 9,360,758
90-94 21,420 3,256,892 4,200 2,460 263,957 4,200 23,880 3,520,849
95-99 8,220 832,362 41,536 8,220 873,898
Over 100 720 143,267 720 143,267
Total $64,389,512 $210,274,786 $1,657,888 $22,194,376 $55,429,721 $114,086 $2,917,441 $4,043,584 $1,771,974 $89,501,329 $269,748,091
$274,664,298 $79,281,985 $7,075,111 $361,021,394
TotalRetirees Spouses Children
Estimated Premiums Collected from Retirees and Beneficiaries by Age and Plans as of September 1, 2012
Teacher Retirement System of Texas Section F (continued)
36
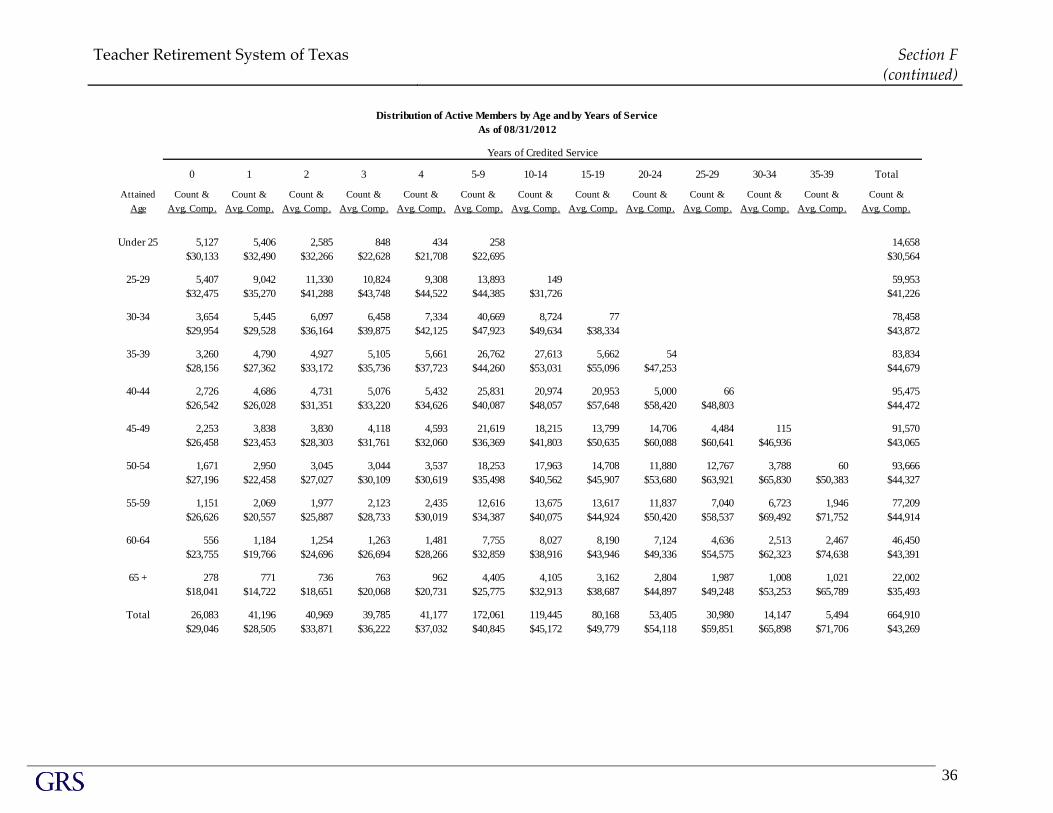
0 1 2 3 4 5-9 10-14 15-19 20-24 25-29 30-34 35-39 Total
Attained Count & Count & Count & Count & Count & Count & Count & Count & Count & Count & Count & Count & Count &
Age Avg. Comp. Avg. Comp. Avg. Comp. Avg. Comp. Avg. Comp. Avg. Comp. Avg. Comp. Avg. Comp. Avg. Comp. Avg. Comp. Avg. Comp. Avg. Comp. Avg. Comp.
Under 25 5,127 5,406 2,585 848 434 258 14,658
$30,133 $32,490 $32,266 $22,628 $21,708 $22,695 $30,564
25-29 5,407 9,042 11,330 10,824 9,308 13,893 149 59,953
$32,475 $35,270 $41,288 $43,748 $44,522 $44,385 $31,726 $41,226
30-34 3,654 5,445 6,097 6,458 7,334 40,669 8,724 77 78,458
$29,954 $29,528 $36,164 $39,875 $42,125 $47,923 $49,634 $38,334 $43,872
35-39 3,260 4,790 4,927 5,105 5,661 26,762 27,613 5,662 54 83,834
$28,156 $27,362 $33,172 $35,736 $37,723 $44,260 $53,031 $55,096 $47,253 $44,679
40-44 2,726 4,686 4,731 5,076 5,432 25,831 20,974 20,953 5,000 66 95,475
$26,542 $26,028 $31,351 $33,220 $34,626 $40,087 $48,057 $57,648 $58,420 $48,803 $44,472
45-49 2,253 3,838 3,830 4,118 4,593 21,619 18,215 13,799 14,706 4,484 115 91,570
$26,458 $23,453 $28,303 $31,761 $32,060 $36,369 $41,803 $50,635 $60,088 $60,641 $46,936 $43,065
50-54 1,671 2,950 3,045 3,044 3,537 18,253 17,963 14,708 11,880 12,767 3,788 60 93,666
$27,196 $22,458 $27,027 $30,109 $30,619 $35,498 $40,562 $45,907 $53,680 $63,921 $65,830 $50,383 $44,327
55-59 1,151 2,069 1,977 2,123 2,435 12,616 13,675 13,617 11,837 7,040 6,723 1,946 77,209
$26,626 $20,557 $25,887 $28,733 $30,019 $34,387 $40,075 $44,924 $50,420 $58,537 $69,492 $71,752 $44,914
60-64 556 1,184 1,254 1,263 1,481 7,755 8,027 8,190 7,124 4,636 2,513 2,467 46,450
$23,755 $19,766 $24,696 $26,694 $28,266 $32,859 $38,916 $43,946 $49,336 $54,575 $62,323 $74,638 $43,391
65 + 278 771 736 763 962 4,405 4,105 3,162 2,804 1,987 1,008 1,021 22,002
$18,041 $14,722 $18,651 $20,068 $20,731 $25,775 $32,913 $38,687 $44,897 $49,248 $53,253 $65,789 $35,493
Total 26,083 41,196 40,969 39,785 41,177 172,061 119,445 80,168 53,405 30,980 14,147 5,494 664,910
$29,046 $28,505 $33,871 $36,222 $37,032 $40,845 $45,172 $49,779 $54,118 $59,851 $65,898 $71,706 $43,269
Distribution of Active Members by Age and by Years of Service
As of 08/31/2012
Years of Credited Service
SECTION G
A C C O U N TING S C H ED U LES
Teacher Retirement System of Texas Section G
38
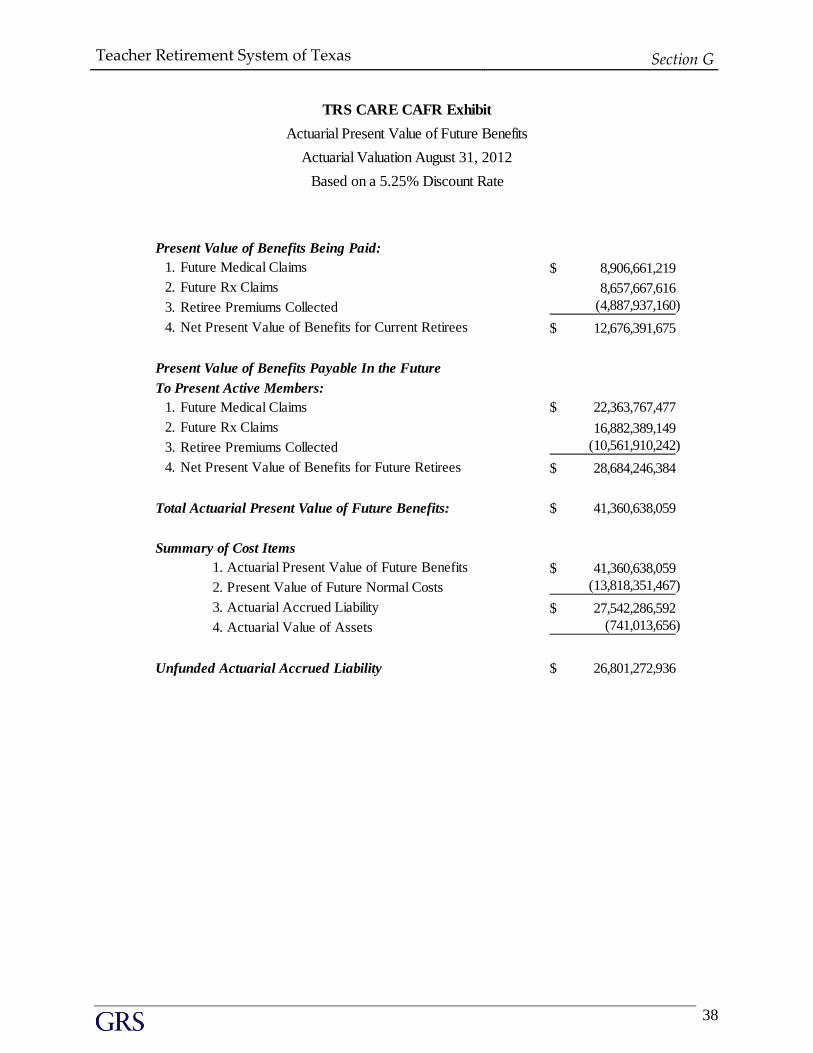
Present Value of Benefits Being Paid:
1. Future Medical Claims 8,906,661,219$
2. Future Rx Claims 8,657,667,616
3. Retiree Premiums Collected (4,887,937,160)
4. Net Present Value of Benefits for Current Retirees 12,676,391,675$
Present Value of Benefits Payable In the Future
To Present Active Members:
1. Future Medical Claims 22,363,767,477$
2. Future Rx Claims 16,882,389,149
3. Retiree Premiums Collected (10,561,910,242)
4. Net Present Value of Benefits for Future Retirees 28,684,246,384$
Total Actuarial Present Value of Future Benefits: 41,360,638,059$
Summary of Cost Items
1. Actuarial Present Value of Future Benefits 41,360,638,059$
2. Present Value of Future Normal Costs (13,818,351,467)
3. Actuarial Accrued Liability 27,542,286,592$
4. Actuarial Value of Assets (741,013,656)
Unfunded Actuarial Accrued Liability 26,801,272,936$
Based on a 5.25% Discount Rate
TRS CARE CAFR Exhibit
Actuarial Present Value of Future Benefits
Actuarial Valuation August 31, 2012
Teacher Retirement System of Texas Section G
(continued)
39
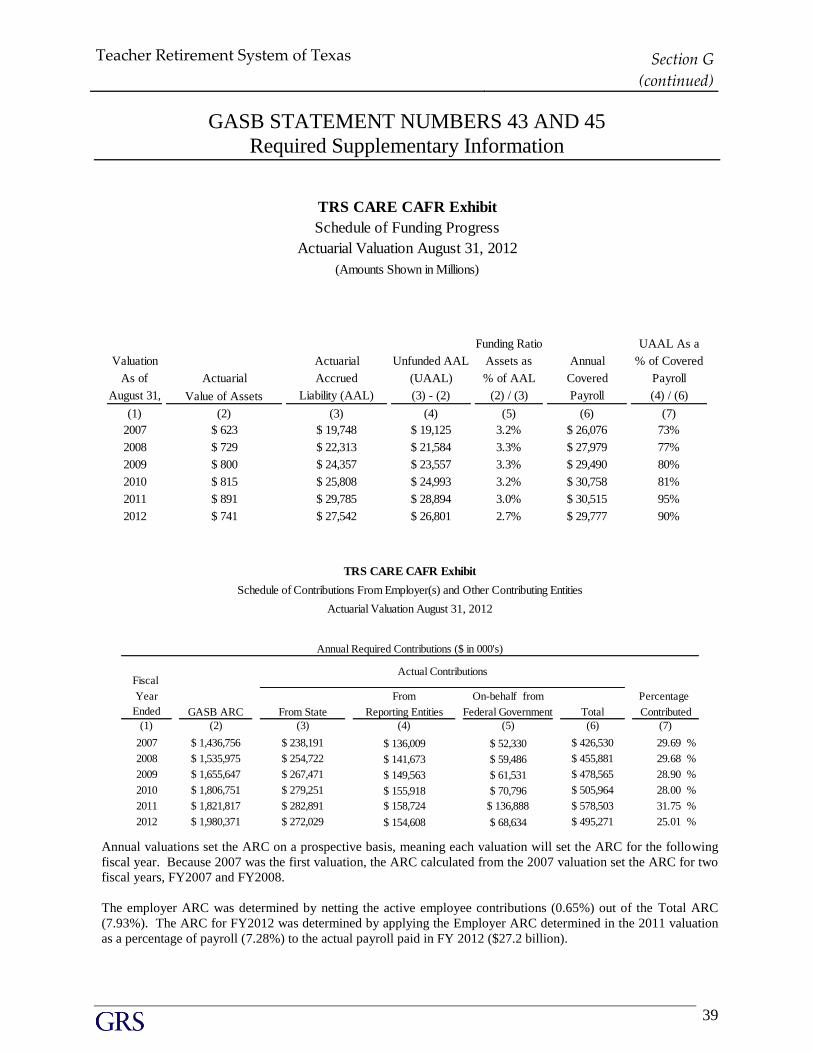
GASB STATEMENT NUMBERS 43 AND 45
Required Supplementary Information
Funding Ratio UAAL As a
Valuation Actuarial Unfunded AAL Assets as Annual % of Covered
As of Actuarial Accrued (UAAL) % of AAL Covered Payroll
August 31, Value of Assets Liability (AAL) (3) - (2) (2) / (3) Payroll (4) / (6)
(1) (2) (3) (4) (5) (6) (7)
2007 $ 623 $ 19,748 $ 19,125 3.2% $ 26,076 73%
2008 $ 729 $ 22,313 $ 21,584 3.3% $ 27,979 77%
2009 $ 800 $ 24,357 $ 23,557 3.3% $ 29,490 80%
2010 $ 815 $ 25,808 $ 24,993 3.2% $ 30,758 81%
2011 $ 891 $ 29,785 $ 28,894 3.0% $ 30,515 95%
2012 $ 741 $ 27,542 $ 26,801 2.7% $ 29,777 90%
TRS CARE CAFR Exhibit
Schedule of Funding Progress
Actuarial Valuation August 31, 2012
(Amounts Shown in Millions)
Fiscal
Year From On-behalf from
Ended GASB ARC From State Reporting Entities Federal Government Total
(1) (2) (3) (4) (5) (6)
2007 $ 1,436,756 $ 238,191 $ 136,009 $ 52,330 $ 426,530 29.69 %
2008 $ 1,535,975 $ 254,722 $ 141,673 $ 59,486 $ 455,881 29.68 %
2009 $ 1,655,647 $ 267,471 $ 149,563 $ 61,531 $ 478,565 28.90 %
2010 $ 1,806,751 $ 279,251 $ 155,918 $ 70,796 $ 505,964 28.00 %
2011 $ 1,821,817 $ 282,891 $ 158,724 $ 136,888 $ 578,503 31.75 %
2012 $ 1,980,371 $ 272,029 $ 154,608 $ 68,634 $ 495,271 25.01 %
TRS CARE CAFR Exhibit
Schedule of Contributions From Employer(s) and Other Contributing Entities
Percentage
Contributed
(7)
Annual Required Contributions ($ in 000's)
Actual Contributions
Actuarial Valuation August 31, 2012
Annual valuations set the ARC on a prospective basis, meaning each valuation will set the ARC for the following
fiscal year. Because 2007 was the first valuation, the ARC calculated from the 2007 valuation set the ARC for two
fiscal years, FY2007 and FY2008.
The employer ARC was determined by netting the active employee contributions (0.65%) out of the Total ARC
(7.93%). The ARC for FY2012 was determined by applying the Employer ARC determined in the 2011 valuation
as a percentage of payroll (7.28%) to the actual payroll paid in FY 2012 ($27.2 billion).
Teacher Retirement System of Texas Section G
(continued)
40
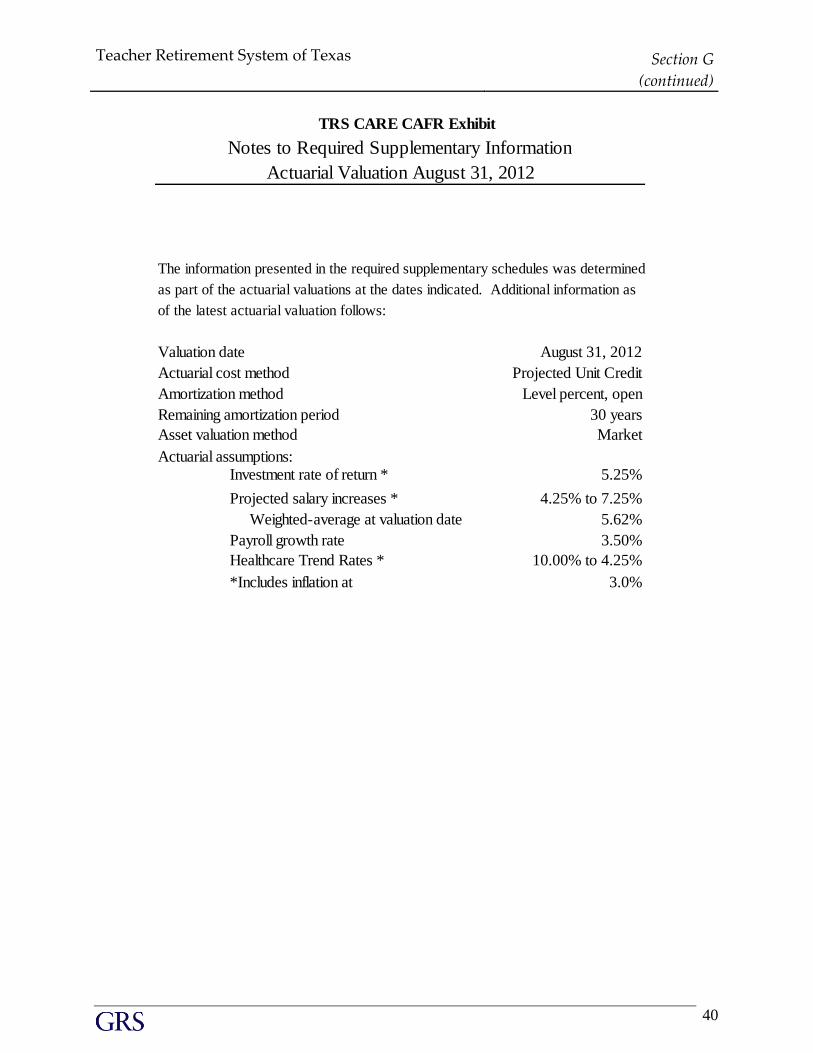
The information presented in the required supplementary schedules was determined
as part of the actuarial valuations at the dates indicated. Additional information as
of the latest actuarial valuation follows:
Valuation date August 31, 2012
Actuarial cost method Projected Unit Credit
Amortization method Level percent, open
Remaining amortization period 30 years
Asset valuation method Market
Actuarial assumptions:Investment rate of return * 5.25%
Projected salary increases * 4.25% to 7.25%
Weighted-average at valuation date 5.62%
Payroll growth rate 3.50%
Healthcare Trend Rates * 10.00% to 4.25%
*Includes inflation at 3.0%
TRS CARE CAFR Exhibit
Notes to Required Supplementary Information
Actuarial Valuation August 31, 2012
Teacher Retirement System of Texas Section G
(continued)
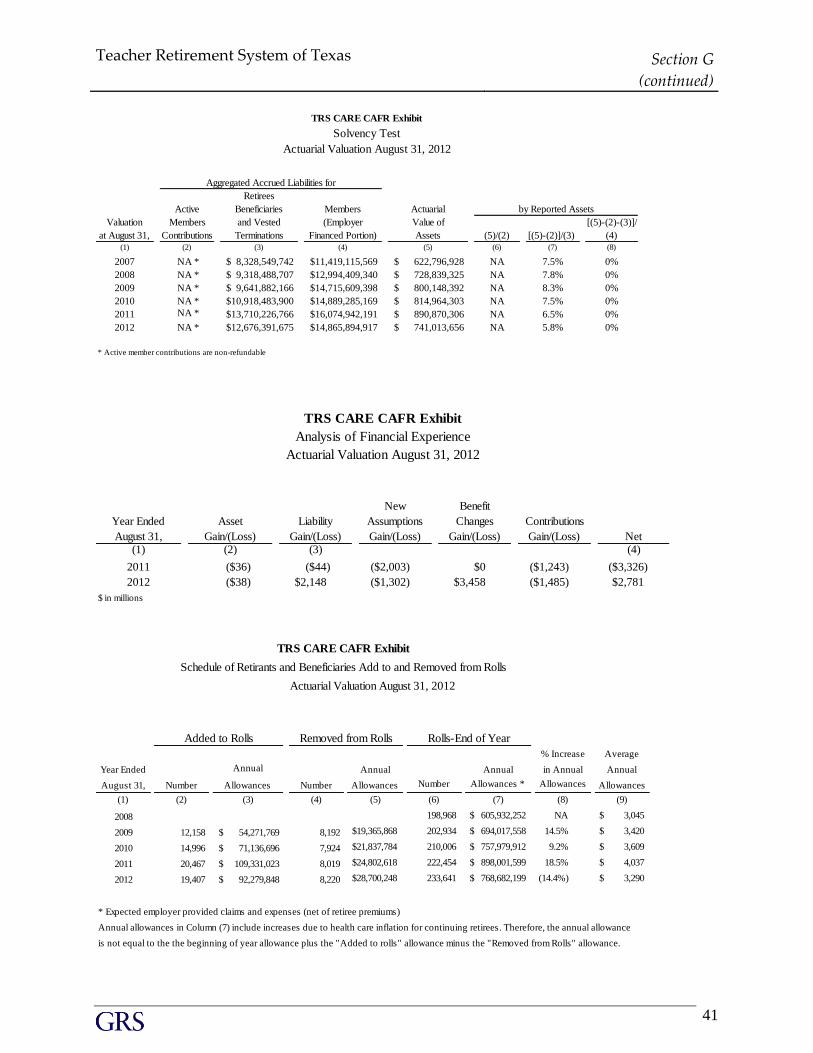
41
Active
Retirees
Beneficiaries Members Actuarial
Valuation Members and Vested (Employer Value of [(5)-(2)-(3)]/
at August 31, Contributions Terminations Financed Portion) Assets (5)/(2) [(5)-(2)]/(3) (4)(1) (2) (3) (4) (5) (6) (7) (8)
2007 NA * $ 8,328,549,742 $11,419,115,569 $ 622,796,928 NA 7.5% 0%
2008 NA * $ 9,318,488,707 $12,994,409,340 $ 728,839,325 NA 7.8% 0%
2009 NA * $ 9,641,882,166 $14,715,609,398 $ 800,148,392 NA 8.3% 0%
2010 NA * $10,918,483,900 $14,889,285,169 $ 814,964,303 NA 7.5% 0%
2011 NA * $13,710,226,766 $16,074,942,191 $ 890,870,306 NA 6.5% 0%
2012 NA * $12,676,391,675 $14,865,894,917 $ 741,013,656 NA 5.8% 0%
Actuarial Valuation August 31, 2012
TRS CARE CAFR Exhibit
Solvency Test
* Active member contributions are non-refundable
by Reported Assets
Aggregated Accrued Liabilities for
Gain/(Loss) Gain/(Loss) Gain/(Loss) Gain/(Loss) Gain/(Loss) Net (1) (2) (3) (4)
2011 ($36) ($44) ($2,003) $0 ($1,243) ($3,326)
2012 ($38) $2,148 ($1,302) $3,458 ($1,485) $2,781
$ in millions
TRS CARE CAFR Exhibit
Benefit
Changes ContributionsYear Ended
August 31,
Analysis of Financial Experience
Actuarial Valuation August 31, 2012
Asset Liability
New
Assumptions
% Increase Average
Year Ended Annual Annual Annual in Annual Annual
August 31, Number Allowances Number Allowances Number Allowances * Allowances Allowances
(1) (2) (3) (4) (5) (6) (7) (8) (9)
2008 198,968 $ 605,932,252 NA $ 3,045
2009 12,158 $ 54,271,769 8,192 $19,365,868 202,934 $ 694,017,558 14.5% $ 3,420
2010 14,996 $ 71,136,696 7,924 $21,837,784 210,006 $ 757,979,912 9.2% $ 3,609
2011 20,467 $ 109,331,023 8,019 $24,802,618 222,454 $ 898,001,599 18.5% $ 4,037
2012 19,407 $ 92,279,848 8,220 $28,700,248 233,641 $ 768,682,199 (14.4%) $ 3,290
* Expected employer provided claims and expenses (net of retiree premiums)
Annual allowances in Column (7) include increases due to health care inflation for continuing retirees. Therefore, the annual allowance
is not equal to the the beginning of year allowance plus the "Added to rolls" allowance minus the "Removed from Rolls" allowance.
Actuarial Valuation August 31, 2012
TRS CARE CAFR Exhibit
Schedule of Retirants and Beneficiaries Add to and Removed from Rolls
Added to Rolls Removed from Rolls Rolls-End of Year
SECTION H
A C TU A R IA L A S S U MP TIO N S A N D METH O D S
Teacher Retirement System of Texas Section H
43
SUMMARY OF ACTUARIAL ASSUMPTIONS AND METHODS
Demographic and Certain Economic Assumptions
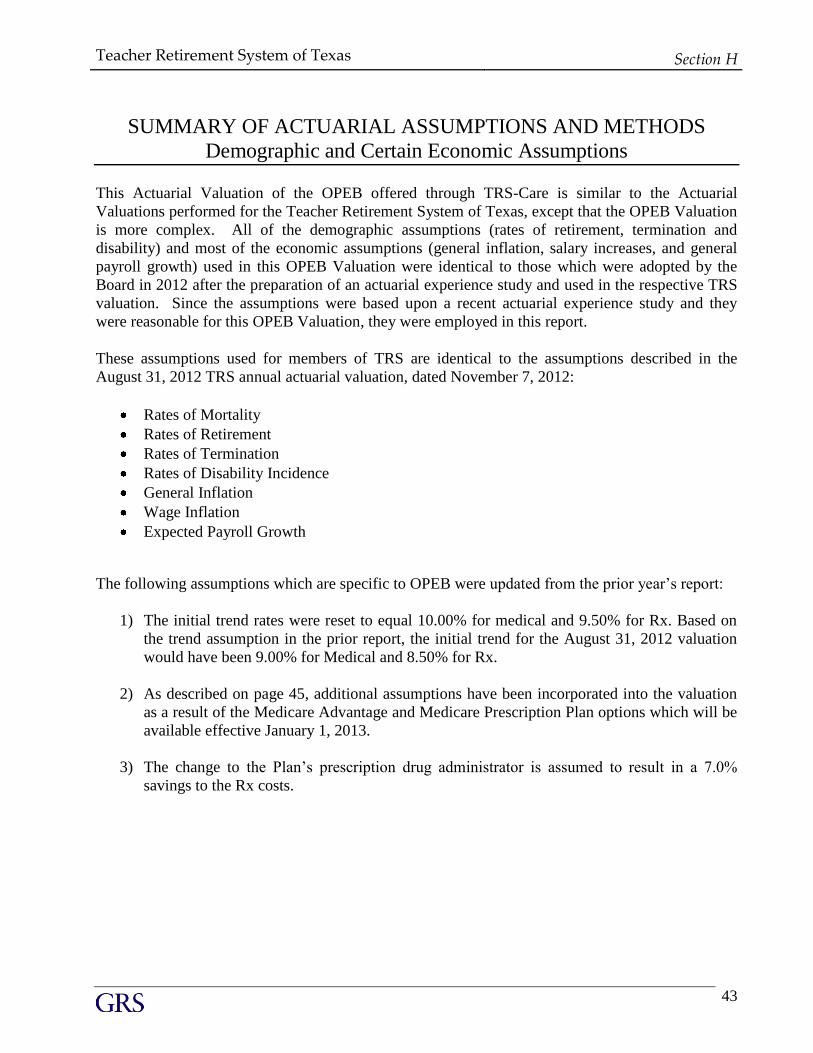
This Actuarial Valuation of the OPEB offered through TRS-Care is similar to the Actuarial
Valuations performed for the Teacher Retirement System of Texas, except that the OPEB Valuation
is more complex. All of the demographic assumptions (rates of retirement, termination and
disability) and most of the economic assumptions (general inflation, salary increases, and general
payroll growth) used in this OPEB Valuation were identical to those which were adopted by the
Board in 2012 after the preparation of an actuarial experience study and used in the respective TRS
valuation. Since the assumptions were based upon a recent actuarial experience study and they
were reasonable for this OPEB Valuation, they were employed in this report.
The following assumptions which are specific to OPEB were updated from the prior year’s report:
1) The initial trend rates were reset to equal 10.00% for medical and 9.50% for Rx. Based on
the trend assumption in the prior report, the initial trend for the August 31, 2012 valuation
would have been 9.00% for Medical and 8.50% for Rx.
2) As described on page 45, additional assumptions have been incorporated into the valuation
as a result of the Medicare Advantage and Medicare Prescription Plan options which will be
available effective January 1, 2013.
3) The change to the Plan’s prescription drug administrator is assumed to result in a 7.0%
savings to the Rx costs.
These assumptions used for members of TRS are identical to the assumptions described in the
August 31, 2012 TRS annual actuarial valuation, dated November 7, 2012:
Rates of Mortality
Rates of Retirement
Rates of Termination
Rates of Disability Incidence
General Inflation
Wage Inflation
Expected Payroll Growth
Teacher Retirement System of Texas Section H
(continued)
44
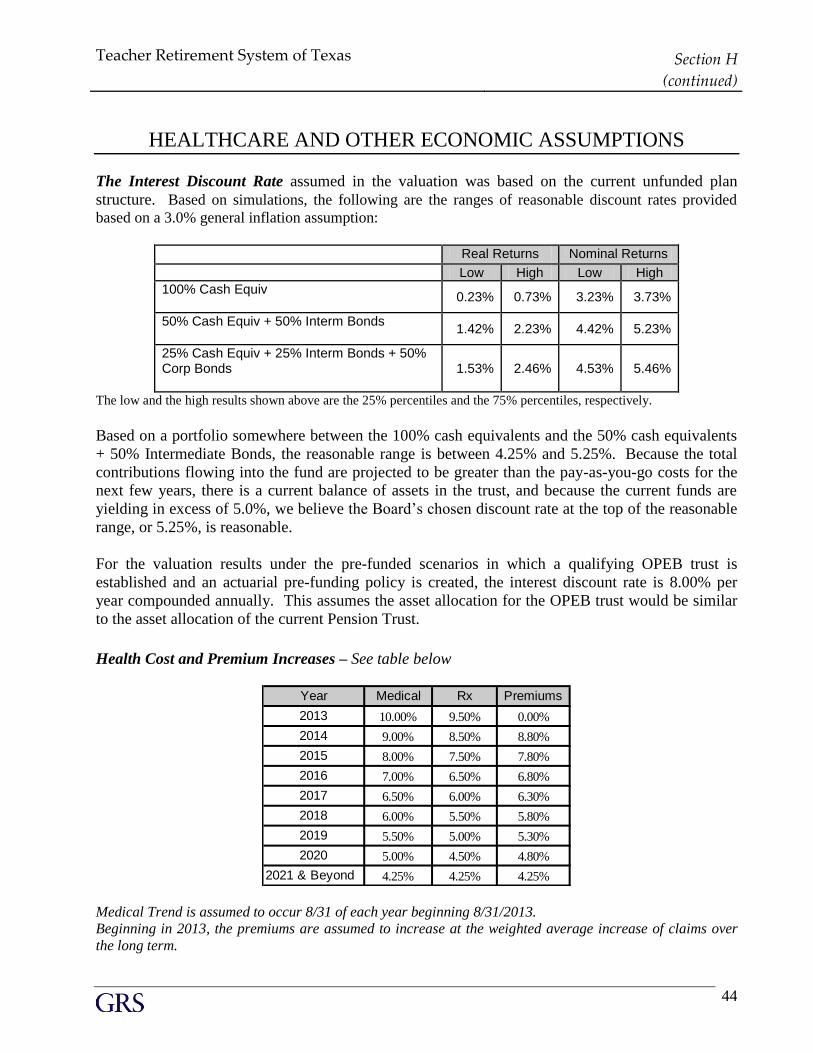
HEALTHCARE AND OTHER ECONOMIC ASSUMPTIONS
The Interest Discount Rate assumed in the valuation was based on the current unfunded plan
structure. Based on simulations, the following are the ranges of reasonable discount rates provided
based on a 3.0% general inflation assumption:
Real Returns Nominal Returns
Low High Low High 100% Cash Equiv
0.23% 0.73% 3.23% 3.73%
50% Cash Equiv + 50% Interm Bonds
1.42% 2.23% 4.42% 5.23%
25% Cash Equiv + 25% Interm Bonds + 50% Corp Bonds
1.53% 2.46% 4.53% 5.46%
The low and the high results shown above are the 25% percentiles and the 75% percentiles, respectively.
Based on a portfolio somewhere between the 100% cash equivalents and the 50% cash equivalents
+ 50% Intermediate Bonds, the reasonable range is between 4.25% and 5.25%. Because the total
contributions flowing into the fund are projected to be greater than the pay-as-you-go costs for the
next few years, there is a current balance of assets in the trust, and because the current funds are
yielding in excess of 5.0%, we believe the Board’s chosen discount rate at the top of the reasonable
range, or 5.25%, is reasonable.
For the valuation results under the pre-funded scenarios in which a qualifying OPEB trust is
established and an actuarial pre-funding policy is created, the interest discount rate is 8.00% per
year compounded annually. This assumes the asset allocation for the OPEB trust would be similar
to the asset allocation of the current Pension Trust.
Health Cost and Premium Increases – See table below
Year Medical Rx Premiums
2013 10.00% 9.50% 0.00%
2014 9.00% 8.50% 8.80%
2015 8.00% 7.50% 7.80%
2016 7.00% 6.50% 6.80%
2017 6.50% 6.00% 6.30%
2018 6.00% 5.50% 5.80%
2019 5.50% 5.00% 5.30%
2020 5.00% 4.50% 4.80%
2021 & Beyond 4.25% 4.25% 4.25%
Medical Trend is assumed to occur 8/31 of each year beginning 8/31/2013.
Beginning in 2013, the premiums are assumed to increase at the weighted average increase of claims over
the long term.
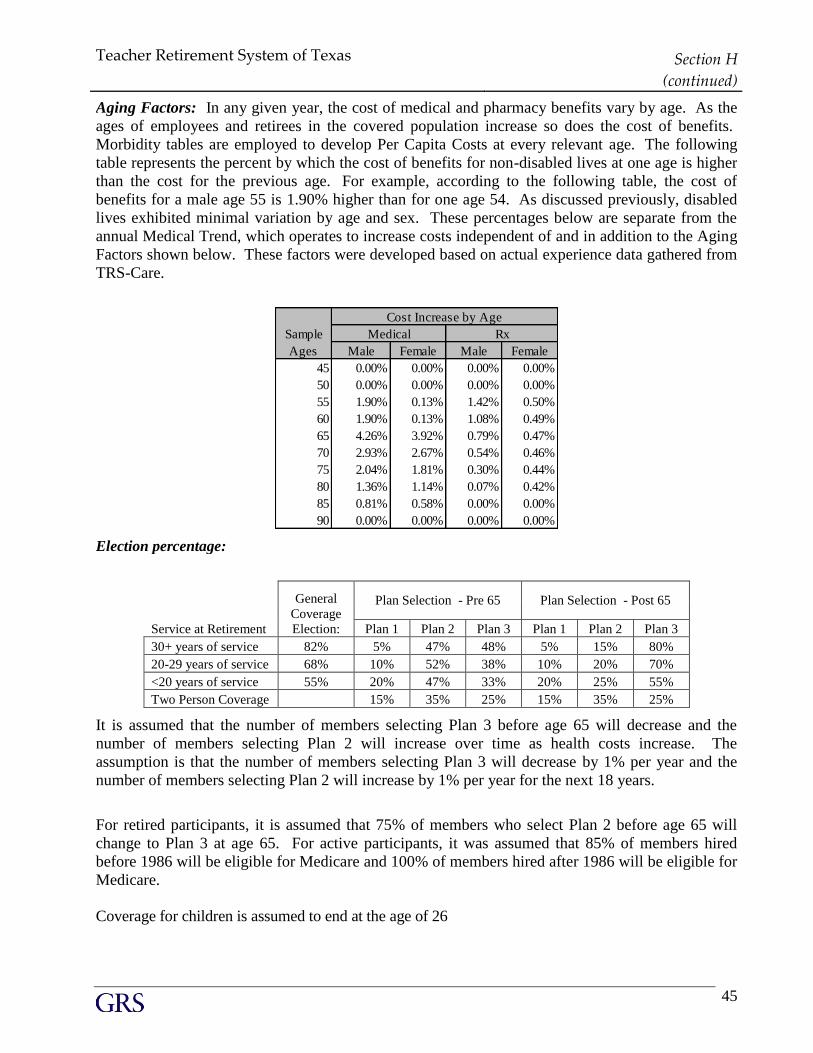
Teacher Retirement System of Texas Section H
(continued)
45
Sample
Ages Male Female Male Female
45 0.00% 0.00% 0.00% 0.00%
50 0.00% 0.00% 0.00% 0.00%
55 1.90% 0.13% 1.42% 0.50%
60 1.90% 0.13% 1.08% 0.49%
65 4.26% 3.92% 0.79% 0.47%
70 2.93% 2.67% 0.54% 0.46%
75 2.04% 1.81% 0.30% 0.44%
80 1.36% 1.14% 0.07% 0.42%
85 0.81% 0.58% 0.00% 0.00%
90 0.00% 0.00% 0.00% 0.00%
Medical
Cost Increase by Age
Rx
General
Coverage
Election:
Plan Selection - Pre 65 Plan Selection - Post 65
Service at Retirement Plan 1 Plan 2 Plan 3 Plan 1 Plan 2 Plan 3
30+ years of service 82% 5% 47% 48% 5% 15% 80%
20-29 years of service 68% 10% 52% 38% 10% 20% 70%
<20 years of service 55% 20% 47% 33% 20% 25% 55%
Two Person Coverage 15% 35% 25% 15% 35% 25%
It is assumed that the number of members selecting Plan 3 before age 65 will decrease and the
number of members selecting Plan 2 will increase over time as health costs increase. The
assumption is that the number of members selecting Plan 3 will decrease by 1% per year and the
number of members selecting Plan 2 will increase by 1% per year for the next 18 years.
For retired participants, it is assumed that 75% of members who select Plan 2 before age 65 will
change to Plan 3 at age 65. For active participants, it was assumed that 85% of members hired
before 1986 will be eligible for Medicare and 100% of members hired after 1986 will be eligible for
Medicare.
Coverage for children is assumed to end at the age of 26
Aging Factors: In any given year, the cost of medical and pharmacy benefits vary by age. As the
ages of employees and retirees in the covered population increase so does the cost of benefits.
Morbidity tables are employed to develop Per Capita Costs at every relevant age. The following
table represents the percent by which the cost of benefits for non-disabled lives at one age is higher
than the cost for the previous age. For example, according to the following table, the cost of
benefits for a male age 55 is 1.90% higher than for one age 54. As discussed previously, disabled
lives exhibited minimal variation by age and sex. These percentages below are separate from the
annual Medical Trend, which operates to increase costs independent of and in addition to the Aging
Factors shown below. These factors were developed based on actual experience data gathered from
TRS-Care.
Election percentage:
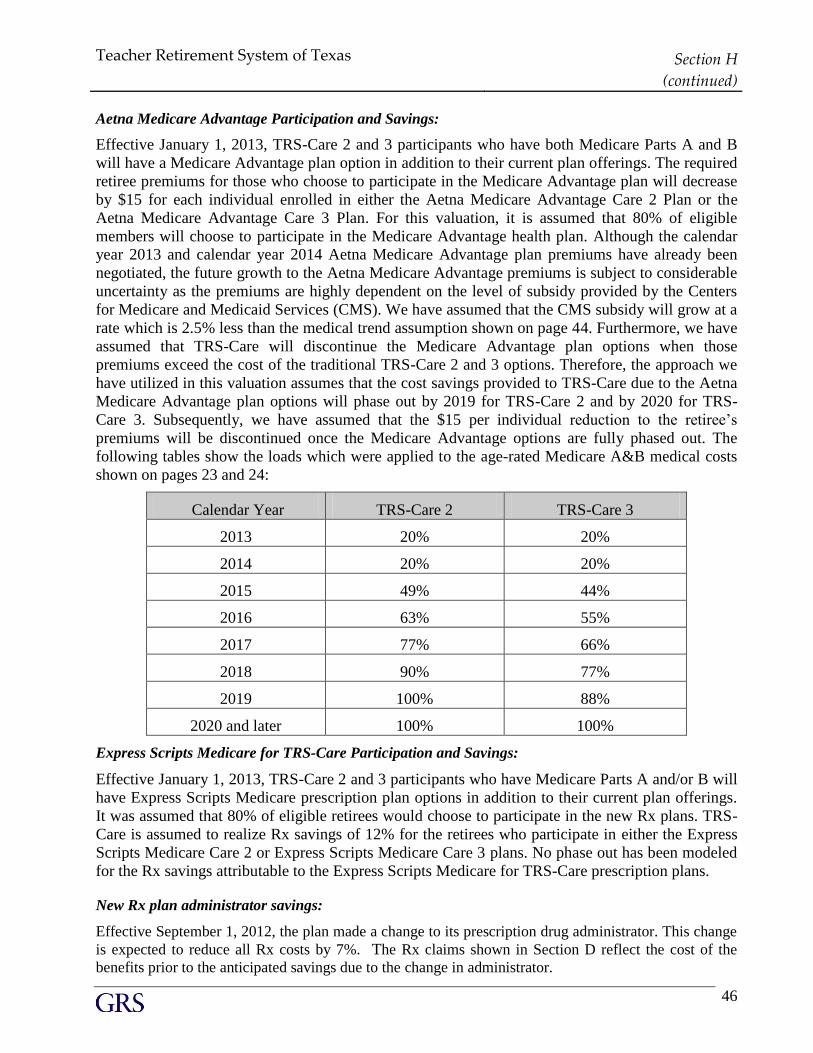
Teacher Retirement System of Texas Section H
(continued)
46
Aetna Medicare Advantage Participation and Savings:
Effective January 1, 2013, TRS-Care 2 and 3 participants who have both Medicare Parts A and B
will have a Medicare Advantage plan option in addition to their current plan offerings. The required
retiree premiums for those who choose to participate in the Medicare Advantage plan will decrease
by $15 for each individual enrolled in either the Aetna Medicare Advantage Care 2 Plan or the
Aetna Medicare Advantage Care 3 Plan. For this valuation, it is assumed that 80% of eligible
members will choose to participate in the Medicare Advantage health plan. Although the calendar
year 2013 and calendar year 2014 Aetna Medicare Advantage plan premiums have already been
negotiated, the future growth to the Aetna Medicare Advantage premiums is subject to considerable
uncertainty as the premiums are highly dependent on the level of subsidy provided by the Centers
for Medicare and Medicaid Services (CMS). We have assumed that the CMS subsidy will grow at a
rate which is 2.5% less than the medical trend assumption shown on page 44. Furthermore, we have
assumed that TRS-Care will discontinue the Medicare Advantage plan options when those
premiums exceed the cost of the traditional TRS-Care 2 and 3 options. Therefore, the approach we
have utilized in this valuation assumes that the cost savings provided to TRS-Care due to the Aetna
Medicare Advantage plan options will phase out by 2019 for TRS-Care 2 and by 2020 for TRS-
Care 3. Subsequently, we have assumed that the $15 per individual reduction to the retiree’s
premiums will be discontinued once the Medicare Advantage options are fully phased out. The
following tables show the loads which were applied to the age-rated Medicare A&B medical costs
shown on pages 23 and 24:
Calendar Year TRS-Care 2 TRS-Care 3
2013 20% 20%
2014 20% 20%
2015 49% 44%
2016 63% 55%
2017 77% 66%
2018 90% 77%
2019 100% 88%
2020 and later 100% 100%
Express Scripts Medicare for TRS-Care Participation and Savings:
Effective January 1, 2013, TRS-Care 2 and 3 participants who have Medicare Parts A and/or B will
have Express Scripts Medicare prescription plan options in addition to their current plan offerings.
It was assumed that 80% of eligible retirees would choose to participate in the new Rx plans. TRS-
Care is assumed to realize Rx savings of 12% for the retirees who participate in either the Express
Scripts Medicare Care 2 or Express Scripts Medicare Care 3 plans. No phase out has been modeled
for the Rx savings attributable to the Express Scripts Medicare for TRS-Care prescription plans.
New Rx plan administrator savings:
Effective September 1, 2012, the plan made a change to its prescription drug administrator. This change
is expected to reduce all Rx costs by 7%. The Rx claims shown in Section D reflect the cost of the
benefits prior to the anticipated savings due to the change in administrator.
Teacher Retirement System of Texas Section H
(continued)
47
ACTUARIAL METHODS
The Projected Unit Credit actuarial cost method of valuation was used in determining liabilities
and normal cost. A method under which the benefits of each individual included in an Actuarial
Valuation are allocated by a consistent formula to valuation years. All benefits are projected
according to healthcare trends and aging factors as disclosed above.
The Actuarial Present Value of benefits allocated to a valuation year is called the Normal Cost. The
Actuarial Present Value of benefits allocated to all periods prior to a valuation year is called the
Actuarial Accrued Liability.
Differences between assumed experience and actual experience (“actuarial gains and/or losses”)
become part of actuarial accrued liabilities.
Unfunded actuarial accrued liabilities are amortized to produce payments (principal & interest)
which are a level percent of payroll.
Teacher Retirement System of Texas Section H
(continued)
48
MISCELLANEOUS AND TECHNICAL ASSUMPTIONS
Marriage Assumption: 100% of males and 100% of females are assumed to be
married for purposes of death-in-service benefits. Male
spouses are assumed to be three years older than female
spouses.
Pay Increase Timing: Beginning of (fiscal) year. This is equivalent to assuming that
reported pays represent amounts paid to members during the
year ended on the valuation date.
Decrement Timing: Retirement decrements are assumed to occur at the end of the
year. All other decrements are assumed to occur mid-year.
Eligibility Testing: Eligibility for benefits is determined based upon the age
nearest birthday and service nearest whole year on the date
the decrement is assumed to occur.
Decrement Operation: Disability and mortality decrements are added to the
termination decrements during the first 5 years. Disability is
added to the retirement decrement during retirement
eligibility.
Incidence of ARC
Contributions:
The ARC is assumed to be received once a year at the middle
of the year.
Administrative Expenses: The expenses are represented in the monthly expected claims.
Prescription Drug Rebates It was assumed the Trust would receive rebates equaling 7%
of claims. The rebates are used as a credit in the liability and
contribution calculations. The Rx claims shown in Section D
reflect the cost of the benefits prior to the rebate.
`
APPENDIX
G LO S S A RY
Teacher Retirement System of Texas Appendix
50
GLOSSARY
Accrued Service. The service credited under the plan which was rendered before the date of the
actuarial valuation.
Actuarial Accrued Liability. The difference between (i) the actuarial present value of future plan
benefits, and (ii) the actuarial present value of future normal cost. Sometimes referred to as
"accrued liability" or "past service liability."
Actuarial Assumptions. Estimates of future plan experience with respect to rates of mortality,
disability, turnover, retirement, rate or rates of investment income and salary increases. Decrement
assumptions (rates of mortality, disability, turnover and retirement) are generally based on past
experience, often modified for projected changes in conditions. Economic assumptions (salary
increases and investment income) consist of an underlying rate in an inflation-free environment plus
a provision for a long-term average rate of inflation.
Actuarial Cost Method. A mathematical budgeting procedure for allocating the dollar amount of
the "actuarial present value of future plan benefits" between the actuarial present value of future
normal cost and the actuarial accrued liability. Sometimes referred to as the "actuarial funding
method."
Actuarial Equivalent. A single amount or series of amounts of equal value to another single
amount or series of amounts, computed on the basis of the rate(s) of interest and mortality tables
used by the plan.
Actuarial Present Value. The amount of funds presently required to provide a payment or series
of payments in the future. It is determined by discounting the future payments at a predetermined
rate of interest, taking into account the probability of payment.
Amortization. Paying off an interest-bearing liability by means of periodic payments of interest
and principal, as opposed to paying it off with a lump sum payment.
Annual Required Contribution (ARC). The ARC is the normal cost plus the portion of the
unfunded actuarial accrued liability to be amortized in the current period. The ARC is an amount
that is actuarially determined in accordance with the requirements so that, if paid on an ongoing
basis, it would be expected to provide sufficient resources to fund both the normal cost for each
year and the amortized unfunded liability.
Governmental Accounting Standards Board (GASB). GASB is the private, nonpartisan,
nonprofit organization that works to create and improve the rules U.S. state and local governments
follow when accounting for their finances and reporting them to the public.
Teacher Retirement System of Texas Appendix
(continued)
51
Medical Trend Rate (Health Inflation). The increase in the plan’s cost over time. Trend includes
all elements that may influence a plan’s cost, assuming that enrollments and the plan benefits do not
change. Trend includes such elements as, pure price inflation, changes in utilization, advances in
medical technology, and cost shifting.
Normal Cost. The annual cost assigned, under the actuarial funding method, to current and
subsequent plan years. Sometimes referred to as "current service cost." Any payment toward the
unfunded actuarial accrued liability is not part of the normal cost.
Other PostEmployment Employee Benefits (OPEB). OPEB are postemployment benefits other
than pensions. OPEB generally takes the form of health insurance and dental, vision, prescription
drugs or other healthcare benefits.
Reserve Account. An account used to indicate that funds have been set aside for a specific purpose
and are not generally available for other uses.
Unfunded Actuarial Accrued Liability. The difference between the actuarial accrued liability and
valuation assets. Sometimes referred to as "unfunded accrued liability."
Valuation Assets. The value of current plan assets recognized for valuation purposes.