Embed Size (px)
Citation preview
`
COPYRIGHT: No part of this document may be reproduced without the explicit written permission of QNBFS Page 1 of 5
Daily Technical Trader – KSA
Tuesday, 27 September 2016
Today’s Coverage
Ticker Price (SAR) 1st
Target
ALINMA 12.46 12.85
TASI All Share Index
Level % Ch. Vol. (mn)
Last 5,956.59 0.74 103.0
Resistance/Support
Levels 1st
2nd
3rd
Resistance 6,000 6,100 6,200
Support 5,900 5,870 5,700
TASI All Share Index Commentary
Overview:
The Index created a Double-Bottom
formation (as seen on the 30-minute
chart), which is a bullish pattern.
Moreover, we notice positive divergence
on the RSI and the MACD vs the
movement of the Index. That indicates a
possible bounce off the 61.8% Fibonacci
retracement (seen on the daily chart).
Expected Resistance Level: 6,000
Expected Support Level: 5,900
TASI (Daily)
Source: Bloomberg, QNBFS Research
TASI Summary
Market Indicators 26 Sep 25 Sep %Ch.
Value (SAR bn) 2.1 2.1 0.6
Volume (mn) 115.1 122.9 -6.4
Market Breadth 116:43 43:123 –
Saudi Equity Indices
Market Indices Close 1D% RSI
Banking 13,004.74 1.29 40.85
Petrochem 4,426.42 0.44 46.19
Cement 3,690.51 0.61 38.27
Retail 8,806.74 0.53 31.62
Energy and Utilities 6,552.31 0.96 41.81
Agriculture and Food 7,064.90 1.53 47.63
Telecom 1,318.11 -0.30 41.47
Insurance 1,102.96 0.88 35.21
Multi-Investment 2,426.02 0.35 42.18
Industrial Invest. 5,490.26 0.02 30.70
Building and Const. 1,762.82 0.57 32.85
RE Development 5,864.21 0.29 34.82
Transportation 5,933.05 0.11 33.05
Media & Publishing 1,919.76 0.00 30.79
Hotel and Tourism 8,266.71 -0.28 37.46
RSI 14 (Overbought) From Page 3 Table
Name Close 1D% RSI
RSI 14 (Oversold) From Page 3 Table
Name Close 1D% RSI
ALANDALUS
PROPER 16.92 0.2 21.1
JABAL OMAR DEVEL 55.67 -1.0 26.7
THIMAR 25.84 0.1 27.0
SAUDI CERAMIC CO 29.92 -0.5 28.2
ASH-SHARQIYAH DE 31.79 0.4 28.7
TASI (30min)
Source: Bloomberg, QNBFS Research
COPYRIGHT: No part of this document may be reproduced without the explicit written permission of QNBFS Page 2 of 5
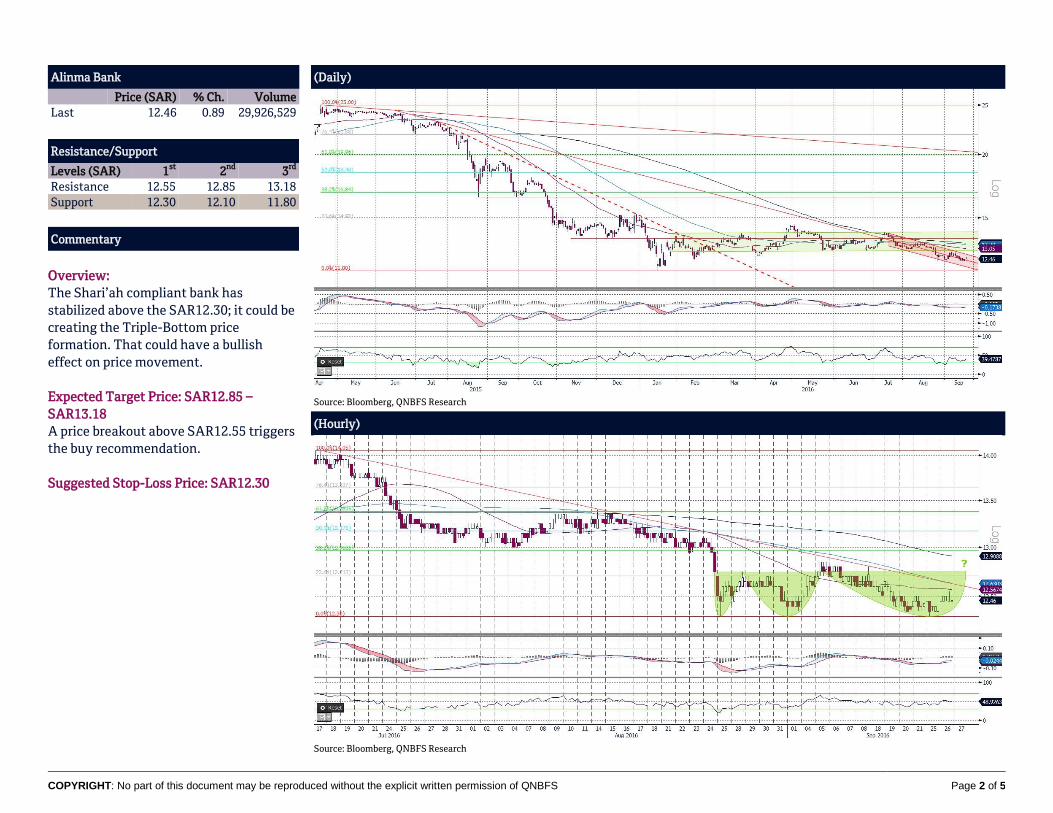
Alinma Bank
Price (SAR) % Ch. Volume
Last 12.46 0.89 29,926,529
Resistance/Support
Levels (SAR) 1st
2nd
3rd
Resistance 12.55 12.85 13.18
Support 12.30 12.10 11.80
Commentary
Overview:
The Shari’ah compliant bank has
stabilized above the SAR12.30; it could be
creating the Triple-Bottom price
formation. That could have a bullish
effect on price movement.
Expected Target Price: SAR12.85 –
SAR13.18
A price breakout above SAR12.55 triggers
the buy recommendation.
Suggested Stop-Loss Price: SAR12.30
(Daily)
Source: Bloomberg, QNBFS Research
(Hourly)
Source: Bloomberg, QNBFS Research
COPYRIGHT: No part of this document may be reproduced without the explicit written permission of QNBFS Page 3 of 5
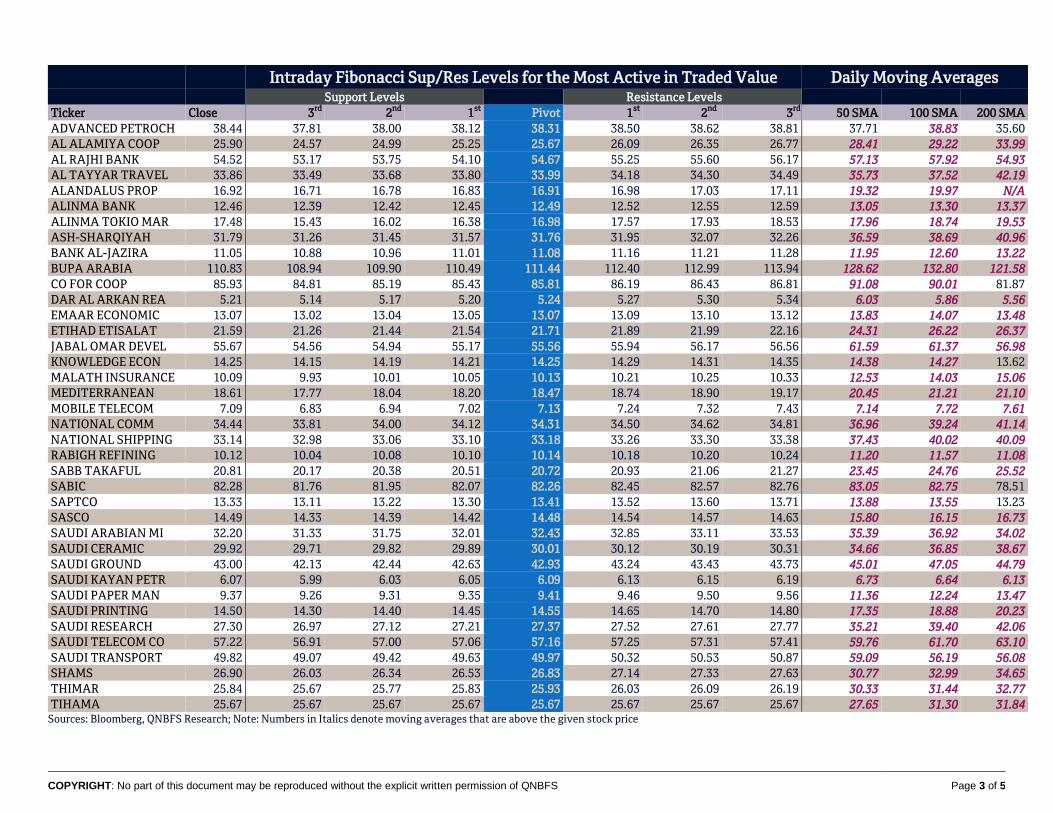
Intraday Fibonacci Sup/Res Levels for the Most Active in Traded Value Daily Moving Averages Support Levels Resistance Levels
Ticker Close 3rd
2nd
1st
Pivot 1st
2nd
3rd
50 SMA 100 SMA 200 SMA
ADVANCED PETROCH 38.44 37.81 38.00 38.12 38.31 38.50 38.62 38.81 37.71 38.83 35.60
AL ALAMIYA COOP 25.90 24.57 24.99 25.25 25.67 26.09 26.35 26.77 28.41 29.22 33.99
AL RAJHI BANK 54.52 53.17 53.75 54.10 54.67 55.25 55.60 56.17 57.13 57.92 54.93
AL TAYYAR TRAVEL 33.86 33.49 33.68 33.80 33.99 34.18 34.30 34.49 35.73 37.52 42.19
ALANDALUS PROP 16.92 16.71 16.78 16.83 16.91 16.98 17.03 17.11 19.32 19.97 N/A
ALINMA BANK 12.46 12.39 12.42 12.45 12.49 12.52 12.55 12.59 13.05 13.30 13.37
ALINMA TOKIO MAR 17.48 15.43 16.02 16.38 16.98 17.57 17.93 18.53 17.96 18.74 19.53
ASH-SHARQIYAH 31.79 31.26 31.45 31.57 31.76 31.95 32.07 32.26 36.59 38.69 40.96
BANK AL-JAZIRA 11.05 10.88 10.96 11.01 11.08 11.16 11.21 11.28 11.95 12.60 13.22
BUPA ARABIA 110.83 108.94 109.90 110.49 111.44 112.40 112.99 113.94 128.62 132.80 121.58
CO FOR COOP 85.93 84.81 85.19 85.43 85.81 86.19 86.43 86.81 91.08 90.01 81.87
DAR AL ARKAN REA 5.21 5.14 5.17 5.20 5.24 5.27 5.30 5.34 6.03 5.86 5.56
EMAAR ECONOMIC 13.07 13.02 13.04 13.05 13.07 13.09 13.10 13.12 13.83 14.07 13.48
ETIHAD ETISALAT 21.59 21.26 21.44 21.54 21.71 21.89 21.99 22.16 24.31 26.22 26.37
JABAL OMAR DEVEL 55.67 54.56 54.94 55.17 55.56 55.94 56.17 56.56 61.59 61.37 56.98
KNOWLEDGE ECON 14.25 14.15 14.19 14.21 14.25 14.29 14.31 14.35 14.38 14.27 13.62
MALATH INSURANCE 10.09 9.93 10.01 10.05 10.13 10.21 10.25 10.33 12.53 14.03 15.06
MEDITERRANEAN 18.61 17.77 18.04 18.20 18.47 18.74 18.90 19.17 20.45 21.21 21.10
MOBILE TELECOM 7.09 6.83 6.94 7.02 7.13 7.24 7.32 7.43 7.14 7.72 7.61
NATIONAL COMM 34.44 33.81 34.00 34.12 34.31 34.50 34.62 34.81 36.96 39.24 41.14
NATIONAL SHIPPING 33.14 32.98 33.06 33.10 33.18 33.26 33.30 33.38 37.43 40.02 40.09
RABIGH REFINING 10.12 10.04 10.08 10.10 10.14 10.18 10.20 10.24 11.20 11.57 11.08
SABB TAKAFUL 20.81 20.17 20.38 20.51 20.72 20.93 21.06 21.27 23.45 24.76 25.52
SABIC 82.28 81.76 81.95 82.07 82.26 82.45 82.57 82.76 83.05 82.75 78.51
SAPTCO 13.33 13.11 13.22 13.30 13.41 13.52 13.60 13.71 13.88 13.55 13.23
SASCO 14.49 14.33 14.39 14.42 14.48 14.54 14.57 14.63 15.80 16.15 16.73
SAUDI ARABIAN MI 32.20 31.33 31.75 32.01 32.43 32.85 33.11 33.53 35.39 36.92 34.02
SAUDI CERAMIC 29.92 29.71 29.82 29.89 30.01 30.12 30.19 30.31 34.66 36.85 38.67
SAUDI GROUND 43.00 42.13 42.44 42.63 42.93 43.24 43.43 43.73 45.01 47.05 44.79
SAUDI KAYAN PETR 6.07 5.99 6.03 6.05 6.09 6.13 6.15 6.19 6.73 6.64 6.13
SAUDI PAPER MAN 9.37 9.26 9.31 9.35 9.41 9.46 9.50 9.56 11.36 12.24 13.47
SAUDI PRINTING 14.50 14.30 14.40 14.45 14.55 14.65 14.70 14.80 17.35 18.88 20.23
SAUDI RESEARCH 27.30 26.97 27.12 27.21 27.37 27.52 27.61 27.77 35.21 39.40 42.06
SAUDI TELECOM CO 57.22 56.91 57.00 57.06 57.16 57.25 57.31 57.41 59.76 61.70 63.10
SAUDI TRANSPORT 49.82 49.07 49.42 49.63 49.97 50.32 50.53 50.87 59.09 56.19 56.08
SHAMS 26.90 26.03 26.34 26.53 26.83 27.14 27.33 27.63 30.77 32.99 34.65
THIMAR 25.84 25.67 25.77 25.83 25.93 26.03 26.09 26.19 30.33 31.44 32.77
TIHAMA 25.67 25.67 25.67 25.67 25.67 25.67 25.67 25.67 27.65 31.30 31.84 Sources: Bloomberg, QNBFS Research; Note: Numbers in Italics denote moving averages that are above the given stock price
COPYRIGHT: No part of this document may be reproduced without the explicit written permission of QNBFS Page 4 of 5
Definitions:
Candlestick: A chart that displays the high, low, opening and closing prices for a security in a single period. The body of the candle is made up by the opening and
the closing prices, i.e., the taller the body the greater the range between these two prices and vice versa. A colored candle denotes a closing price that is lower
than the opening price, while a white candle shows the opposite. The candlestick's shadows or wicks show the period's high and low prices and how they
compare to the opening and closing price. In general, the shape of the candle will vary upon the positions of the period's high, low, opening and closing prices.
Support: A level that could cause more buyers to step in in order to prevent the security from falling or causing the security price to head higher.
Resistance: An inverse of a support level. A resistance area or level could cause more sellers to step in in order to prevent the security from rising or causing the
security price to head lower.
SMA (Simple Moving Average): Is an arithmetic average, which calculates the average price of a security over a defined number of periods and is thus considered
a lagging indicator. SMAs used in our analysis refer to closing prices. In general, SMAs serve many purposes, such as a smoothing tool, an indicative price
direction and potential support/resistance levels.
Market Breadth: Breadth indicates the number of securities that have closed higher vs. the number of decliners in a particular exchange.
MACD (Moving Average Convergence/Divergence): Is a trading indicator, which shows changes in the strength, direction, momentum and duration of a trend in
a stock's price through a collection of three time series calculated from historical closing price data.
RSI (Relative Strength Index): Is a momentum indicator that compares a security’s price gains to its losses for a predetermined number of periods (we generally
use 14 periods). The RSI attempts to point out how a security, in relative terms, is in the overbought/oversold zone. Securities with a RSI above 70 could be
considered as overbought, and below 30 could be considered as oversold.
Pattern/Formation: Is a graphical presentation of a security’s price activity over a certain period of time. Formations come in different shapes (such as, head &
shoulders, triangles, flags, and so on). They can be used to identify potential trends, reversal of trends, price targets, entry and exit points, etc.
Fibonacci Retracements: Are horizontal lines that indicate expected areas of support/resistance for a security based on a predetermined price movement. These
levels are usually indicated by Fibonacci ratios of 23.6%, 38.2%, 50.0%, 61.8% and 100% from that particular movement.
Fibonacci Pivot and Intraday Support/Resistance: A Pivot Point is generally used to formulate expected future support/resistance levels. From the base Pivot
Point, Fibonacci multiples of the high-low differential are added to form resistance levels and subtracted to form support levels.
COPYRIGHT: No part of this document may be reproduced without the explicit written permission of QNBFS Page 5 of 5
Contacts:
Zaid al-Nafoosi, CMT, CFTe Saugata Sarkar Shahan Keushgerian
Senior Research Analyst Head of Research Senior Research Analyst
Tel: (+974) 4476 6535 Tel: (+974) 4476 6534 Tel: (+974) 4476 6509
[email protected] [email protected] [email protected]
Sahbi Kasraoui Youssef Elboghdady QNB Financial Service
Acting Head of Trading Head of Institutional Sales & Trading Contact Center: (+974) 4476 6666
Tel: (+974) 4476 6544 Tel: (+974) 4476 6542 PO Box 24025
[email protected] [email protected] Doha, Qatar
Disclaimer and Copyright Notice: This publication has been prepared by QNB Financial Services. Co WLL One Person Company (“QNBFS”) a wholly-owned subsidiary of QNB SAQ (“QNB”). QNBFS is
regulated by the Qatar Financial Markets Authority and the Qatar Exchange QNB SAQ is regulated by the Qatar Central Bank. This publication expresses the views and opinions of QNBFS at a given
time only. It is not an offer, promotion or recommendation to buy or sell securities or other investments, nor is it intended to constitute legal, tax, accounting, or financial advice. QNBFS accepts no
liability whatsoever for any direct or indirect losses arising from use of this report. Any investment decision should depend on the individual circumstances of the investor and be based on specifically
engaged investment advice. We therefore strongly advise potential investors to seek independent professional advice before making any investment decision. Although the information in this report
has been obtained from sources that QNBFS believes to be reliable, we have not independently verified such information and it may not be accurate or complete. QNBFS does not make any
representations or warranties as to the accuracy and completeness of the information it may contain, and declines any liability in that respect. For reports dealing with Technical Analysis, expressed
opinions and/or recommendations may be different or contrary to the opinions/recommendations of QNBFS Fundamental Research as a result of depending solely on the historical technical data (price
and volume). QNBFS reserves the right to amend the views and opinions expressed in this publication at any time. It may also express viewpoints or make investment decisions that differ significantly
from, or even contradict, the views and opinions included in this report. This report may not be reproduced in whole or in part without permission from QNBFS.