Embed Size (px)
Citation preview

It’s more than work.Manpower Inc. 2001 Annual Report

It’smorethan atitle.
It’s more than a paycheck.

plac
e to
min
gle.
It’s
mor
eth
an a

It’s more than a routine.

It’s morethan
movingpaper.
It’s more than a place to sit.

It’s more than the passage of time.

It’s about life.It’s more than work.

rew
arde
dfo
r eff
ort.
It’s
abou
tbe
ing

It’s about updating skills for today’s environment.
It’s aboutlearning
somethingnew
every day.

It’s about being on ateam that truly cares
for one another.

It’saboutpride.
It’s about setting a good example for others.

you
mad
e a
diff
eren
ce.
It’s
abou
tk
now
ing

At Manpower, it’s about the 2 million
well-trained, intelligent, motivated, reliable
people who make a difference to our customers.
And in the process, they lead productive lives for
themselves, and create shareholder value for you.
It’s about Manpower.
– 24 – – 25 –
Dear Shareholders —
As you know, 2001 was a tough year for businesses world-
wide and, consequently, for the staffing companies that
serve them. While it was difficult for us to show growth in
that environment, we know from past history that recoveries
usually offer an early opportunity to grow revenues and
profits. With this potential opportunity in mind, we used
the year to solidify both our operating and financial
strengths, focusing on the key strategic areas that we have
been building on over the past three years.
For example, our gross profit margin improved by 70 basis
points during the year, reflecting the value our customers
place on the services we provide. In the major geographies
in which we operate, we were able to reduce operating and
overhead expenses, and we did so thoughtfully and
strategically – by improving our service-delivery process,
rather than by eliminating elements that will drive our
future growth. We generated more than $193 million in
free cash flow – a 49% increase over 2000. This is due, in
part, to the fact that our cash flow runs counter to the
business cycle; so, as the revenues decreased, the receivables
from a higher revenue stream were collected. Even so, we
made improvements that went beyond economic cycles,
L e t t e r t o ou r Sh a r eho ld e r s
reflecting the underlying strength of our business. One
such area was a two-day reduction in the collection period
for our outstanding receivables.
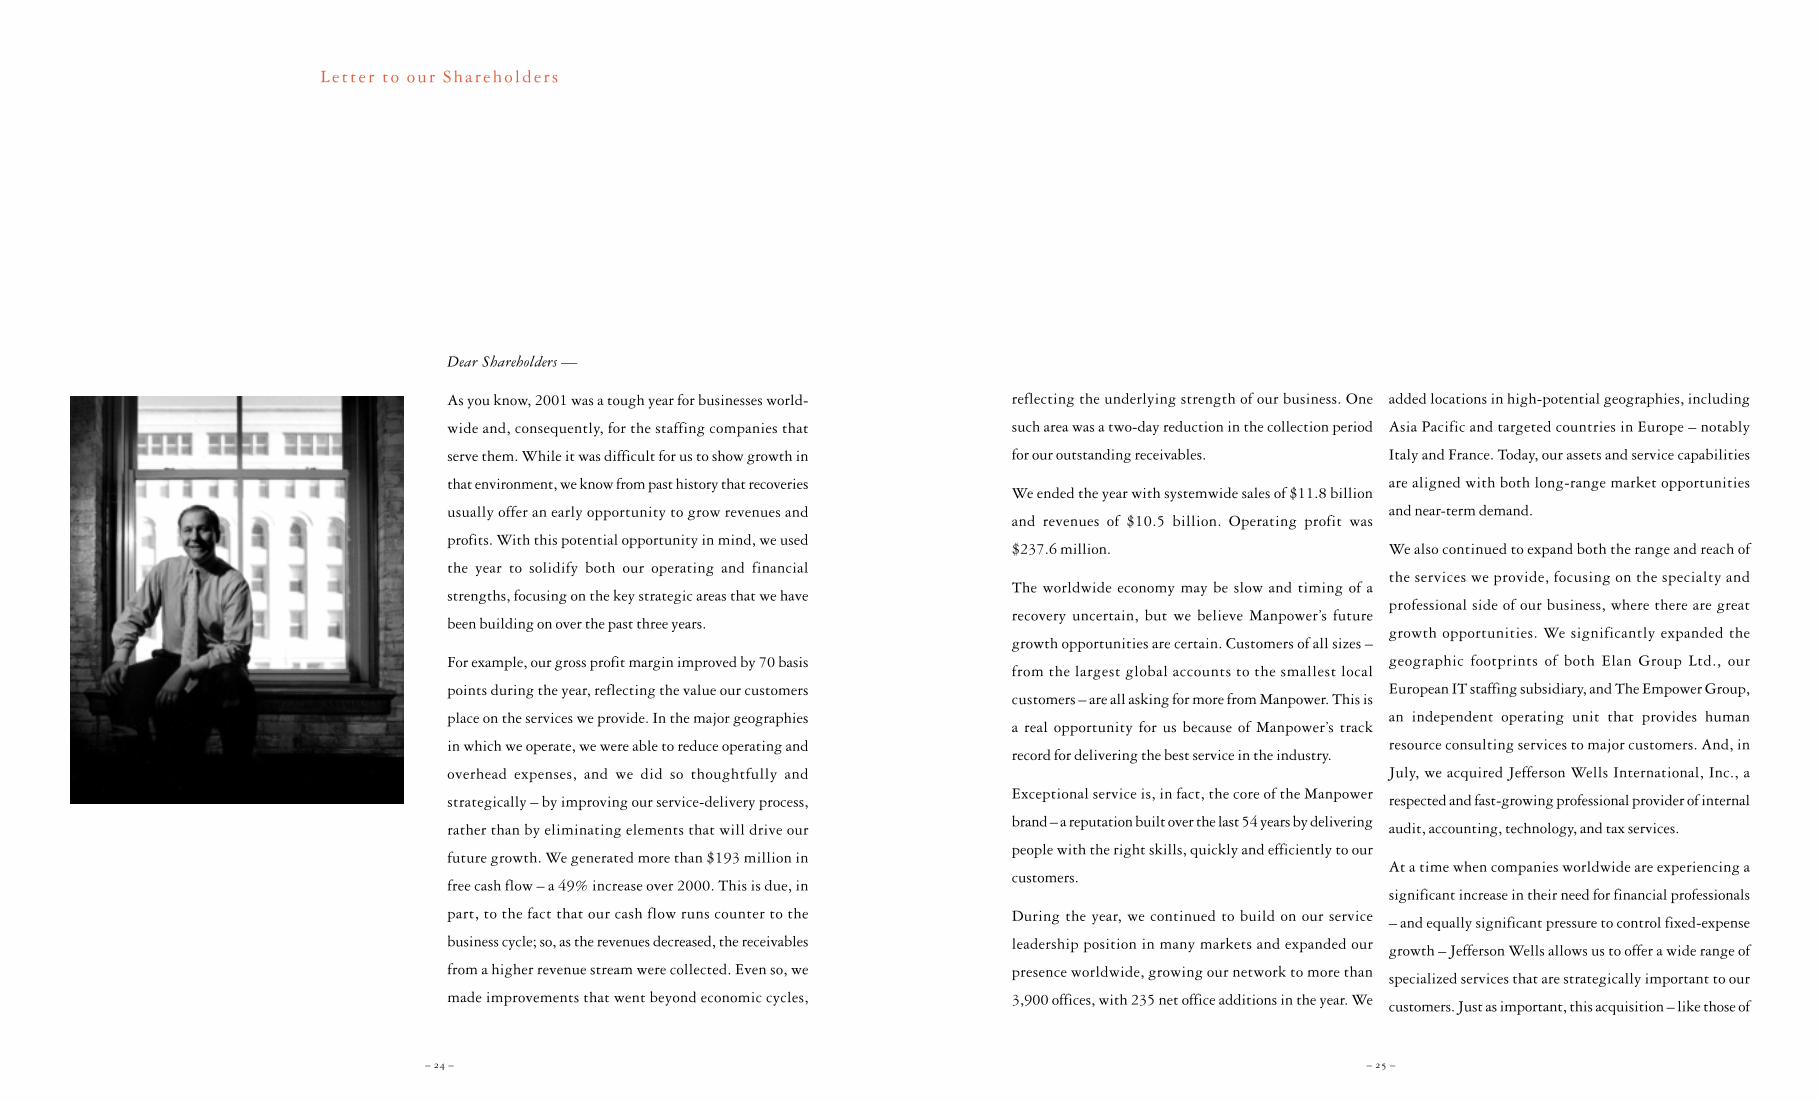
We ended the year with systemwide sales of $11.8 billion
and revenues of $10.5 billion. Operating profit was
$237.6 million.
The worldwide economy may be slow and timing of a
recovery uncertain, but we believe Manpower’s future
growth opportunities are certain. Customers of all sizes –
from the largest global accounts to the smallest local
customers – are all asking for more from Manpower. This is
a real opportunity for us because of Manpower’s track
record for delivering the best service in the industry.
Exceptional service is, in fact, the core of the Manpower
brand – a reputation built over the last 54 years by delivering
people with the right skills, quickly and efficiently to our
customers.
During the year, we continued to build on our service
leadership position in many markets and expanded our
presence worldwide, growing our network to more than
3,900 offices, with 235 net office additions in the year. We
added locations in high-potential geographies, including
Asia Pacific and targeted countries in Europe – notably
Italy and France. Today, our assets and service capabilities
are aligned with both long-range market opportunities
and near-term demand.
We also continued to expand both the range and reach of
the services we provide, focusing on the specialty and
professional side of our business, where there are great
growth opportunities. We significantly expanded the
geographic footprints of both Elan Group Ltd., our
European IT staffing subsidiary, and The Empower Group,
an independent operating unit that provides human
resource consulting services to major customers. And, in
July, we acquired Jefferson Wells International, Inc., a
respected and fast-growing professional provider of internal
audit, accounting, technology, and tax services.
At a time when companies worldwide are experiencing a
significant increase in their need for financial professionals
– and equally significant pressure to control fixed-expense
growth – Jefferson Wells allows us to offer a wide range of
specialized services that are strategically important to our
customers. Just as important, this acquisition – like those of

– 27 –
And, above all, it translates into performance – a company
with the willingness, ability, and capacity to deal with
change, without losing sight of long-range goals, and
create lasting value.
It is our leadership in service, coupled with our values,
which will, again, steady us in 2002, through whatever
economic challenges may occur in the unpredictable days
and months that lie ahead.
Make no mistake: we are confident in our prospects. If the
world economy recovers in 2002, as many believe it will,
we are better positioned to benefit from the surge in
staffing demand that historically follows downturns, and
to move aggressively down a growth track in 2003. But,
even if the environment remains as sluggish as it is at this
writing, we are positioned to perform, thanks to our focus
on productivity, profit margins, and strong cash flows.
In closing, I want to thank our customers and shareholders
for the support and encouragement they provided
throughout the year, and to express our appreciation to our
Board of Directors for their contributions. In particular,
I want to thank Dudley Godfrey and Marvin Goodman,
who will retire from our board this year, for their years of
dedicated service and counsel. I want to thank Terry
Hueneke, who retired as Executive Vice President and head
of the Americas and Asia Pacific operations, after 28 years
of service. Fortunately, Terry will continue as a Director,
and our Board will continue to benefit from his experience
and insight. In addition, after a short tenure on our Board,
I want to wish Nancy Brinker well in her new assignment
as Ambassador to Hungary, which she began in August.
Above all, I want to thank the 22,400 people of Manpower
worldwide for their efforts throughout 2001. While we
accomplished much, we know that looking back is never as
important as looking ahead. The difficult year challenged
our character and commitment, and without hesitation
I can say that we are now a stronger company than we were,
even a year ago. All of us clearly understand that what we
do every day is much more than work.
Jeffrey A. Joerres
Chairman, Chief Executive Officer & President
March 1, 2002
– 26 –
Elan and The Empower Group in the past – demonstrates
our overall approach to growth. In making acquisitions,
we’re not interested in simply piling on assets or revenues.
Instead, we focus on opportunities that will both energize
and enrich our core business over the long term and provide
an immediate business “fit” – companies that can respond
to our customers’ business requirements immediately,
without major integration efforts, expenses, or disruptions
required by our existing organization.
A similar service focus drives our approach to technology,
which we deploy with a straightforward goal: making
Manpower the best staffing company to do business with
worldwide.
As a result, we continued our investments in 2001 – making
substantial progress on our integrated back office in the
United States, developing a new front-office system for
Europe, and providing access to our capabilities over the
Internet. And our customers are responding. Our second
generation global e-commerce offering is winning business
at a rapid pace as it offers ease-of-use and a dynamic array of
features, built on the best industry knowledge available in
the world – right here at Manpower.
As important as our strategies and accomplishments are,
however, one prevailing fact remains. It takes talented,
determined people to accomplish our goals. That’s why
one of our major focuses has been on forging a high-
performance organization – one that deeply understands
its markets, lives up to its promises, and uses its uniquely
entrepreneurial culture to capitalize on the opportunities
that our changing industry continually presents.
At the core of this effort is alignment – of our strategies to the
demands of our customers and our marketplace, and of
the daily decisions made by Manpower employees, working
in different countries and different cultures – to a shared
and global set of values focused on people, knowledge, and
innovation. These principles guide and support us every day
in achieving the best solutions for our employees and
our customers.
In fact, the alignment of our strategies and values translates
directly into market leadership with sustainable competitive
advantages. It translates into operating leadership –
the creation of value by combining productivity, scale,
and the sharing of best practices across all of our locations
throughout the 61 countries in which we operate.
– 29 –
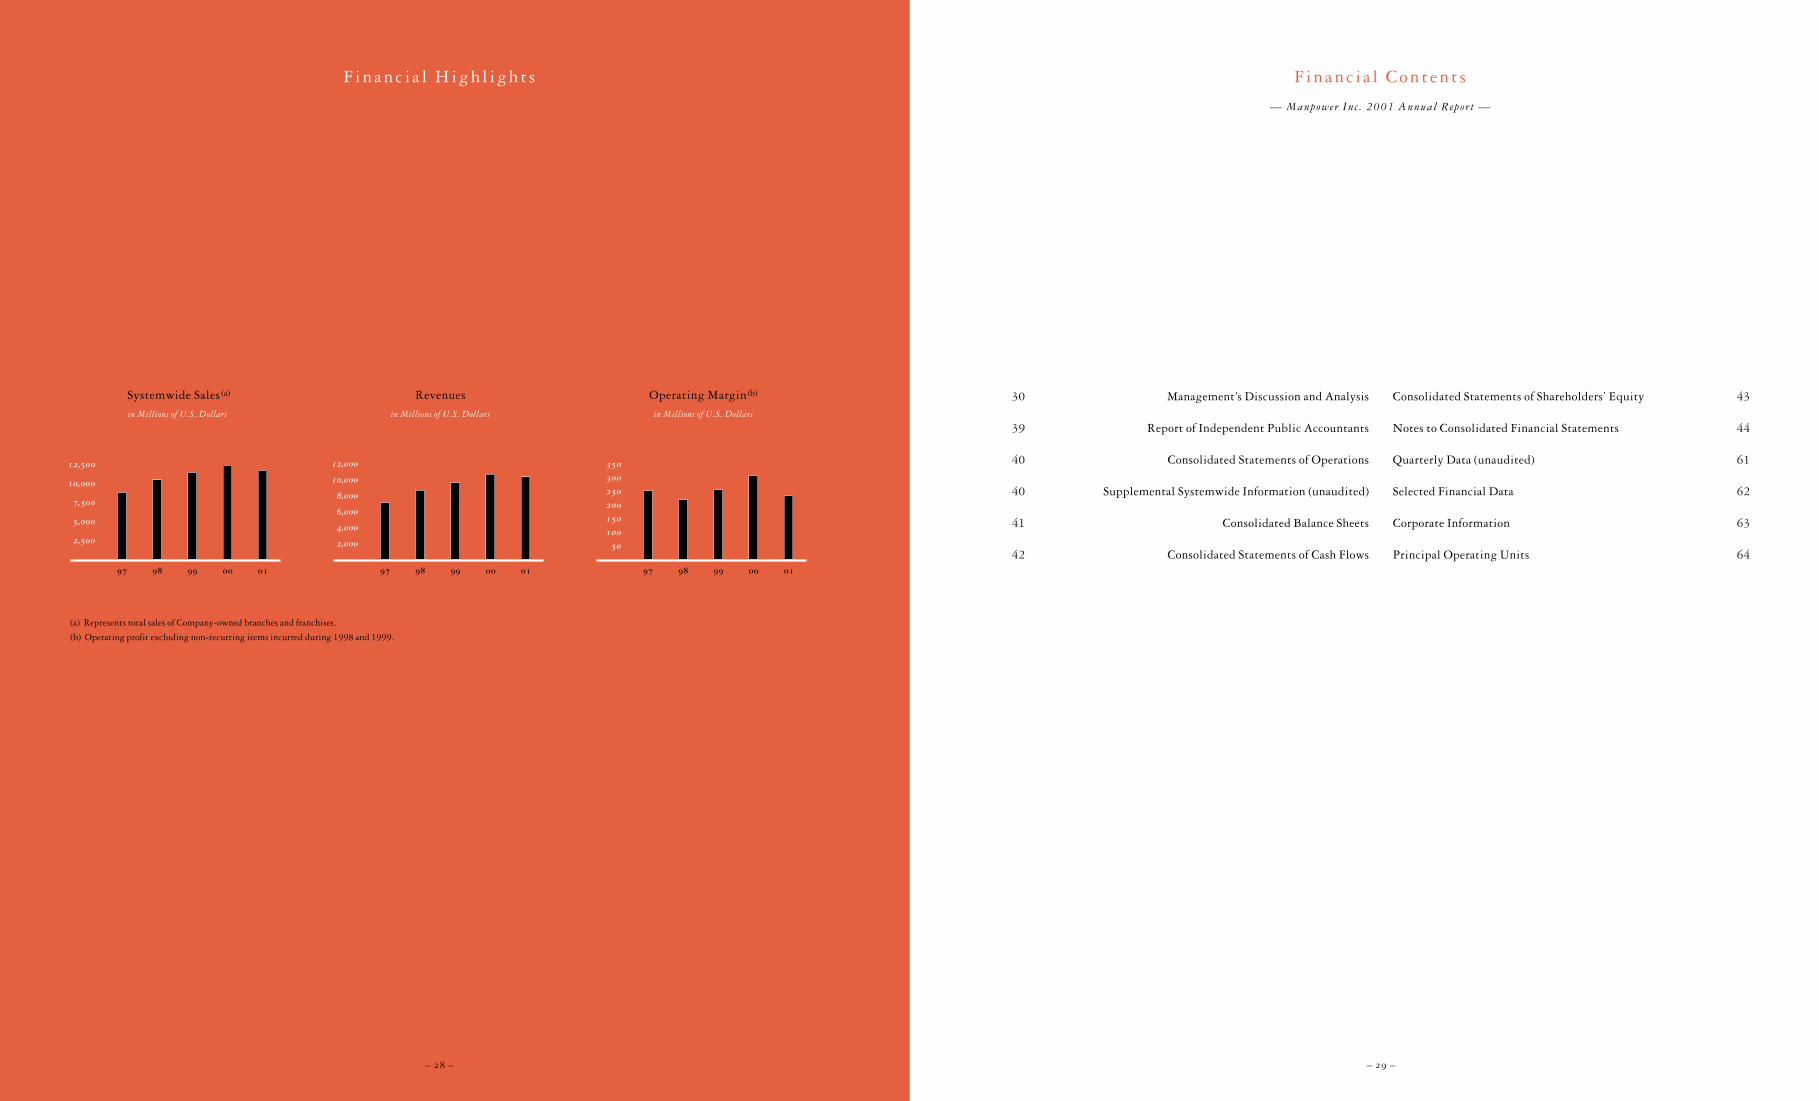
F inanc i a l Con t en t s
— Manpower In c . 2001 Annual Repor t —
30 Management’s Discussion and Analysis
39 Report of Independent Public Accountants
40 Consolidated Statements of Operations
40 Supplemental Systemwide Information (unaudited)
41 Consolidated Balance Sheets
42 Consolidated Statements of Cash Flows
Consolidated Statements of Shareholders’ Equity 43
Notes to Consolidated Financial Statements 44
Quarterly Data (unaudited) 61
Selected Financial Data 62
Corporate Information 63
Principal Operating Units 64
– 28 –
97 98 99 00 01
Systemwide Sales (a)
in Millions of U.S. Dollars
12,500
10,000
7,500
5,000
2,500
F inanc i a l H igh l i gh t s
97 98 99 00 01
Revenues
in Millions of U.S. Dollars
12,000
10,000
8,000
6,000
4,000
2,000
97 98 99 00 01
Operating Margin(b)
in Millions of U.S. Dollars
350
300
250
200
150
100
50
(a) Represents total sales of Company-owned branches and franchises.
(b) Operating profit excluding non-recurring items incurred during 1998 and 1999.
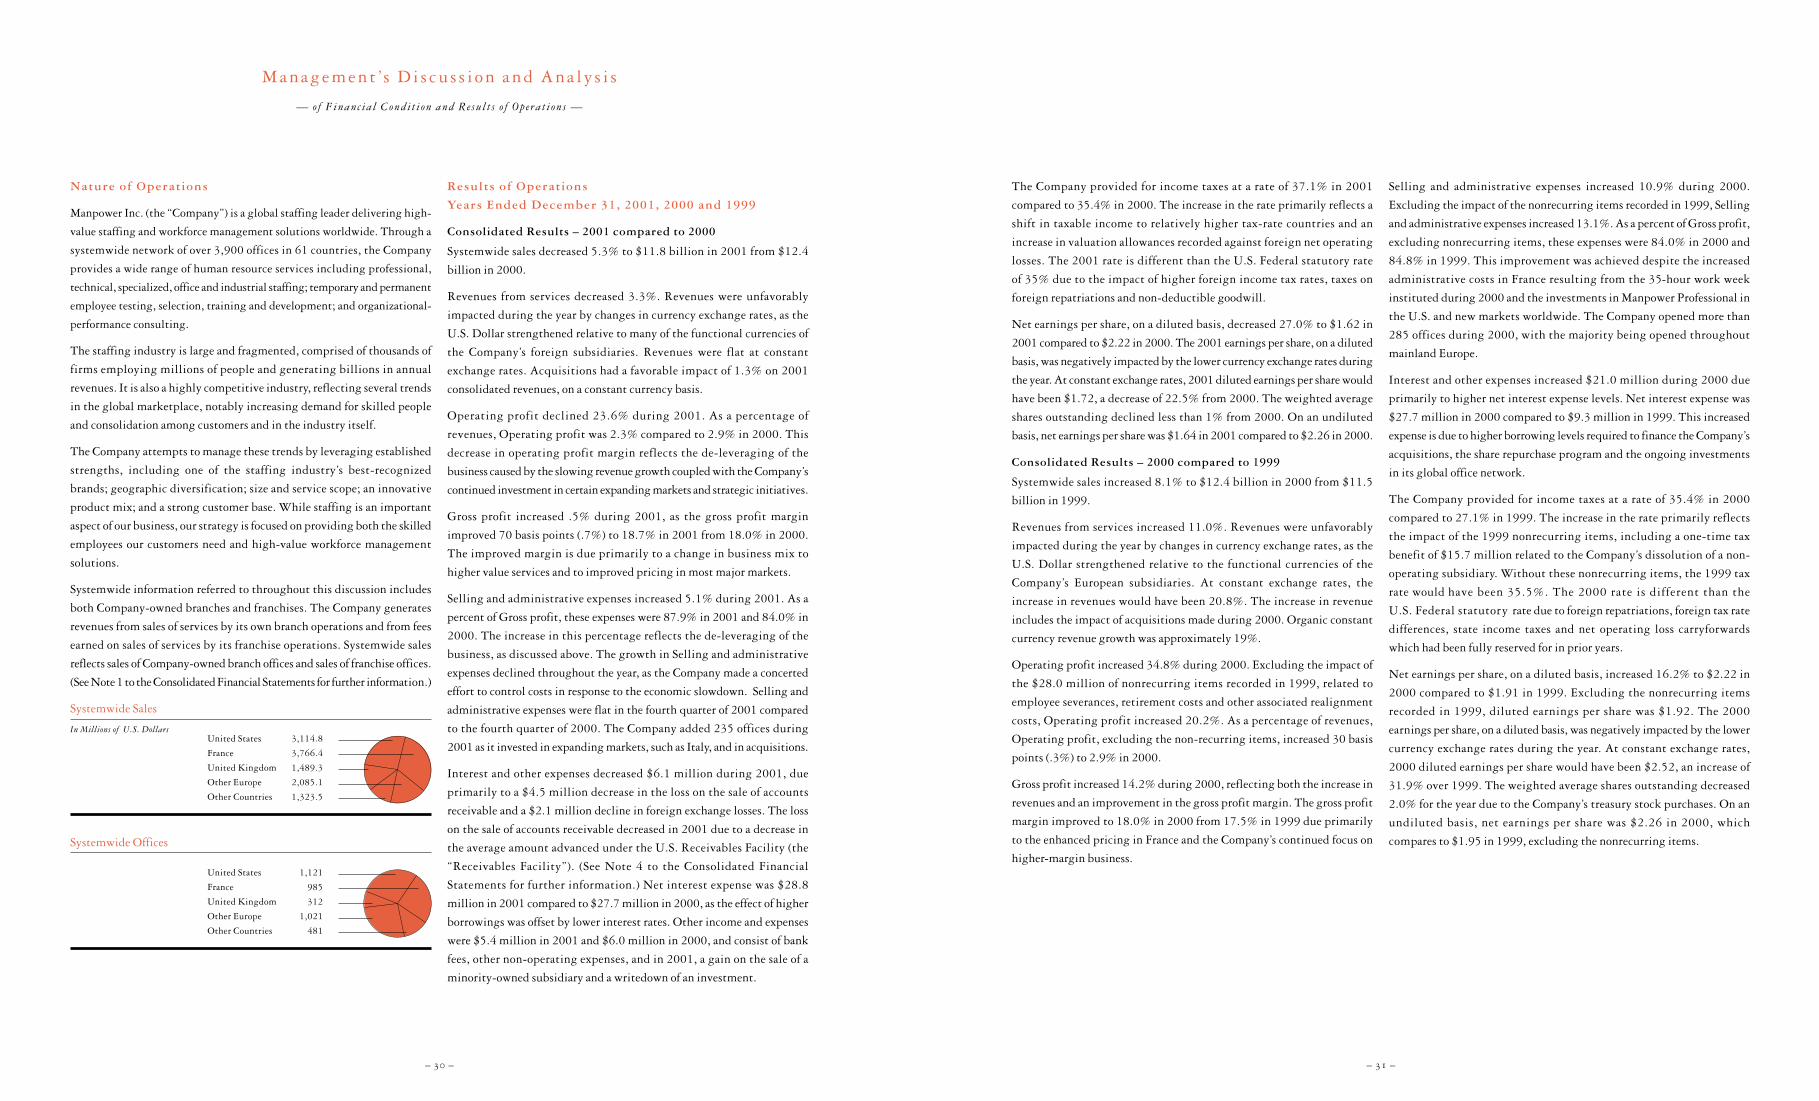
United States 3,114.8
France 3,766.4
United Kingdom 1,489.3
Other Europe 2,085.1
Other Countries 1,323.5
– 31 –– 30 –
The Company provided for income taxes at a rate of 37.1% in 2001
compared to 35.4% in 2000. The increase in the rate primarily reflects a
shift in taxable income to relatively higher tax-rate countries and an
increase in valuation allowances recorded against foreign net operating
losses. The 2001 rate is different than the U.S. Federal statutory rate
of 35% due to the impact of higher foreign income tax rates, taxes on
foreign repatriations and non-deductible goodwill.
Net earnings per share, on a diluted basis, decreased 27.0% to $1.62 in
2001 compared to $2.22 in 2000. The 2001 earnings per share, on a diluted
basis, was negatively impacted by the lower currency exchange rates during
the year. At constant exchange rates, 2001 diluted earnings per share would
have been $1.72, a decrease of 22.5% from 2000. The weighted average
shares outstanding declined less than 1% from 2000. On an undiluted
basis, net earnings per share was $1.64 in 2001 compared to $2.26 in 2000.
Consolidated Results – 2000 compared to 1999
Systemwide sales increased 8.1% to $12.4 billion in 2000 from $11.5
billion in 1999.
Revenues from services increased 11.0%. Revenues were unfavorably
impacted during the year by changes in currency exchange rates, as the
U.S. Dollar strengthened relative to the functional currencies of the
Company’s European subsidiaries. At constant exchange rates, the
increase in revenues would have been 20.8%. The increase in revenue
includes the impact of acquisitions made during 2000. Organic constant
currency revenue growth was approximately 19%.
Operating profit increased 34.8% during 2000. Excluding the impact of
the $28.0 million of nonrecurring items recorded in 1999, related to
employee severances, retirement costs and other associated realignment
costs, Operating profit increased 20.2%. As a percentage of revenues,
Operating profit, excluding the non-recurring items, increased 30 basis
points (.3%) to 2.9% in 2000.
Gross profit increased 14.2% during 2000, reflecting both the increase in
revenues and an improvement in the gross profit margin. The gross profit
margin improved to 18.0% in 2000 from 17.5% in 1999 due primarily
to the enhanced pricing in France and the Company’s continued focus on
higher-margin business.
Selling and administrative expenses increased 10.9% during 2000.
Excluding the impact of the nonrecurring items recorded in 1999, Selling
and administrative expenses increased 13.1%. As a percent of Gross profit,
excluding nonrecurring items, these expenses were 84.0% in 2000 and
84.8% in 1999. This improvement was achieved despite the increased
administrative costs in France resulting from the 35-hour work week
instituted during 2000 and the investments in Manpower Professional in
the U.S. and new markets worldwide. The Company opened more than
285 offices during 2000, with the majority being opened throughout
mainland Europe.
Interest and other expenses increased $21.0 million during 2000 due
primarily to higher net interest expense levels. Net interest expense was
$27.7 million in 2000 compared to $9.3 million in 1999. This increased
expense is due to higher borrowing levels required to finance the Company’s
acquisitions, the share repurchase program and the ongoing investments
in its global office network.
The Company provided for income taxes at a rate of 35.4% in 2000
compared to 27.1% in 1999. The increase in the rate primarily reflects
the impact of the 1999 nonrecurring items, including a one-time tax
benefit of $15.7 million related to the Company’s dissolution of a non-
operating subsidiary. Without these nonrecurring items, the 1999 tax
rate would have been 35.5%. The 2000 rate is different than the
U.S. Federal statutory rate due to foreign repatriations, foreign tax rate
differences, state income taxes and net operating loss carryforwards
which had been fully reserved for in prior years.
Net earnings per share, on a diluted basis, increased 16.2% to $2.22 in
2000 compared to $1.91 in 1999. Excluding the nonrecurring items
recorded in 1999, diluted earnings per share was $1.92. The 2000
earnings per share, on a diluted basis, was negatively impacted by the lower
currency exchange rates during the year. At constant exchange rates,
2000 diluted earnings per share would have been $2.52, an increase of
31.9% over 1999. The weighted average shares outstanding decreased
2.0% for the year due to the Company’s treasury stock purchases. On an
undiluted basis, net earnings per share was $2.26 in 2000, which
compares to $1.95 in 1999, excluding the nonrecurring items.
Nature of Operations
Manpower Inc. (the “Company”) is a global staffing leader delivering high-
value staffing and workforce management solutions worldwide. Through a
systemwide network of over 3,900 offices in 61 countries, the Company
provides a wide range of human resource services including professional,
technical, specialized, office and industrial staffing; temporary and permanent
employee testing, selection, training and development; and organizational-
performance consulting.
The staffing industry is large and fragmented, comprised of thousands of
firms employing millions of people and generating billions in annual
revenues. It is also a highly competitive industry, reflecting several trends
in the global marketplace, notably increasing demand for skilled people
and consolidation among customers and in the industry itself.
The Company attempts to manage these trends by leveraging established
strengths, including one of the staffing industry’s best-recognized
brands; geographic diversification; size and service scope; an innovative
product mix; and a strong customer base. While staffing is an important
aspect of our business, our strategy is focused on providing both the skilled
employees our customers need and high-value workforce management
solutions.
Systemwide information referred to throughout this discussion includes
both Company-owned branches and franchises. The Company generates
revenues from sales of services by its own branch operations and from fees
earned on sales of services by its franchise operations. Systemwide sales
reflects sales of Company-owned branch offices and sales of franchise offices.
(See Note 1 to the Consolidated Financial Statements for further information.)
Systemwide Sales
In Millions of U.S. Dollars
Systemwide Offices
Results of Operations
Years Ended December 31, 2001, 2000 and 1999
Consolidated Results – 2001 compared to 2000
Systemwide sales decreased 5.3% to $11.8 billion in 2001 from $12.4
billion in 2000.
Revenues from services decreased 3.3%. Revenues were unfavorably
impacted during the year by changes in currency exchange rates, as the
U.S. Dollar strengthened relative to many of the functional currencies of
the Company’s foreign subsidiaries. Revenues were flat at constant
exchange rates. Acquisitions had a favorable impact of 1.3% on 2001
consolidated revenues, on a constant currency basis.
Operating profit declined 23.6% during 2001. As a percentage of
revenues, Operating profit was 2.3% compared to 2.9% in 2000. This
decrease in operating profit margin reflects the de-leveraging of the
business caused by the slowing revenue growth coupled with the Company’s
continued investment in certain expanding markets and strategic initiatives.
Gross profit increased .5% during 2001, as the gross profit margin
improved 70 basis points (.7%) to 18.7% in 2001 from 18.0% in 2000.
The improved margin is due primarily to a change in business mix to
higher value services and to improved pricing in most major markets.
Selling and administrative expenses increased 5.1% during 2001. As a
percent of Gross profit, these expenses were 87.9% in 2001 and 84.0% in
2000. The increase in this percentage reflects the de-leveraging of the
business, as discussed above. The growth in Selling and administrative
expenses declined throughout the year, as the Company made a concerted
effort to control costs in response to the economic slowdown. Selling and
administrative expenses were flat in the fourth quarter of 2001 compared
to the fourth quarter of 2000. The Company added 235 offices during
2001 as it invested in expanding markets, such as Italy, and in acquisitions.
Interest and other expenses decreased $6.1 million during 2001, due
primarily to a $4.5 million decrease in the loss on the sale of accounts
receivable and a $2.1 million decline in foreign exchange losses. The loss
on the sale of accounts receivable decreased in 2001 due to a decrease in
the average amount advanced under the U.S. Receivables Facility (the
“Receivables Facility”). (See Note 4 to the Consolidated Financial
Statements for further information.) Net interest expense was $28.8
million in 2001 compared to $27.7 million in 2000, as the effect of higher
borrowings was offset by lower interest rates. Other income and expenses
were $5.4 million in 2001 and $6.0 million in 2000, and consist of bank
fees, other non-operating expenses, and in 2001, a gain on the sale of a
minority-owned subsidiary and a writedown of an investment.
Managemen t ’s D i s cu s s i on and Ana l y s i s
— o f Financ ia l Condi t i on and Re su l t s o f Operat i on s —
United States 1,121
France 985
United Kingdom 312
Other Europe 1,021
Other Countries 481

– 33 –– 32 –
The operating profit margin declined 20 basis points (.2%) during the
year primarily as a result of expense de-leveraging in the second half of
the year as revenue levels began to trail the prior year.
United Kingdom revenue operating profit
In Millions of U.S. Dollars
Other Europe — Revenues in the Other Europe segment grew 7% in
constant currency during 2001, totaling $1.9 billion. The revenue
growth rate has slowed from prior year levels, reflecting the softening
European economy experienced during the last six months of the year.
Operating profit declined 12% in constant currency during 2001
primarily as a result of the de-leveraging effect caused by the slowing
revenue growth in many of the European countries, and the Company’s
continued investment in faster growing markets, such as Italy. Operating
profit increases exceeded 14% in the Netherlands, Israel and Spain despite
the declining revenues in those countries.
During 2001, the Company opened almost 100 offices in the Other
Europe markets, most of which were in Italy. Over 700 offices have been
opened in the Other Europe markets during the past five years.
Other Europe revenue operating profit
In Millions of U.S. Dollars
Other Countries — Revenues in the Other Countries segment were $1.3
billion, increasing 22% in constant currency. The Company’s largest
operation within this segment is Japan, which represents approximately
43% of the segment’s 2001 revenues. Revenues in Japan increased 34% in
local currency, or 25% excluding acquisitions. This strong revenue growth
was achieved despite the weak economy as secular trends toward flexible
staffing remain very positive. The Company continues to invest in Japan
and is well positioned to take advantage of future growth opportunities.
Also included in this segment are Jefferson Wells International, Inc.
(“Jefferson Wells”) and The Empower Group (“Empower”). Jefferson
Wells, which was acquired in July 2001, is a professional services
provider of internal audit, accounting, technology and tax services. It
operates a network of offices throughout the United States and Canada.
Empower, which was formed in 2000, provides added-value human
resource solutions and consulting services through a network of global
offices. During 2001, the Company added to the strength of its Empower
service offering with the integration of a number of smaller acquisitions.
In total, Jefferson Wells and the newly acquired Empower companies
added over $90 million of revenue in 2001.
Operations in Mexico and Asia, excluding Japan, posted local currency
revenue growth of 11% and 42%, respectively, in 2001 while improving
operating profit margins. These results reflect the benefit of our continued
investment in these regions, where we added 33 offices during the past
two years.
The operating profit margin for the segment overall declined during
the year, due to the economic softening in many of these markets along with
the Company’s continued investments in this segment.
Other Countries revenue operating profit
In Millions of U.S. Dollars
Cash Sources
Excluding the impact of the Receivables Facility, cash provided by oper-
ating activities was $281.0 million in 2001 and $212.9 million in 2000
compared to a $25.5 million use of cash in 1999. Including the impact of
the Receivables Facility, cash provided by operating activities was
$136.0 million in 2001 and $157.9 million in 2000 compared to a
$.5 million use of cash in 1999. Changes in working capital significantly
impacted cash flow. Cash provided by changes in working capital,
excluding the Receivables Facility, was $59.8 million in 2001 compared
to cash used to support working capital needs during 2000 and 1999 of
$31.0 million and $275.2 million, respectively. The changes from 2000
to 2001 and from 1999 to 2000 are the result of the Company ’s
continued focus on working capital management, evidenced by a
reduction in consolidated Days Sales Outstanding (DSO) levels for
99
+4%
00
+4%
01
-4%
99
150
125
100
75
50
25
+31%
00
+29%
01
+4%
99
2,500
2,000
1,500
1,000
500
+5%
00
+7%
01
-17%
99
90
75
60
45
30
15
+3%
00
+5%
01
-65%
99
1,500
1,250
1,000
750
500
250
+8%
00
+24%
01
+2%
99
50
40
30
20
10
-5%
00
+15%
01
-4%
99
1,500
1,200
900
600
300
+40%
00
+26%
01
+13%
99
15
12
9
6
3
-36%
00
+24%
01
-32%
99
2,000
1,600
1,200
800
400
+29%
00
+14%
01
+2%
99
100
80
60
40
20
+29%
00
+31%
01
-15%
4,000
3,200
2,400
1,600
800
Segment Results
The Company is organized and managed primarily on a geographical
basis. Each country has its own distinct operations, is managed locally by
its own management team and maintains its own financial reports. Each
country reports directly, or indirectly through a regional manager, to a
member of executive management. Given this reporting structure, all of
the Company’s operations have been segregated into the following segments
– United States, France, United Kingdom, Other Europe and Other
Countries. (See Note 13 to the Consolidated Financial Statements for
further information.)
Revenues from Services
In Millions of U.S. Dollars
United States — Systemwide sales in the United States were $3.1 billion, a
decrease of 18% from 2000. Revenues decreased 17% to $2.0 billion.
These declines reflect a significant decrease in demand for our services in
response to the deteriorating U.S. economy. The rate of revenue contraction
compared to prior year grew during the year, with revenues down 3% in the
first quarter and 25% in the fourth quarter. During the last five months of
the year, the contraction appeared to stabilize with revenues trailing prior
year by approximately 25%.
In response to the declining revenue trends, the U.S. organization
implemented a number of cost control initiatives. These initiatives resulted
in a 7% decrease in selling and administrative expenses in 2001, or a $48
million reduction on an annualized run-rate basis, beginning with the
second half of the year.
Despite these cost reduction initiatives, the rate of expense reduction (-7%)
lagged the decline in revenues (-17%) as management is committed to
preserving a quality network of offices which will be necessary to fully
benefit from anticipated revenue growth when the economy improves.
Operating profit decreased 65% to $29.5 million in 2001, while the
operating profit margin declined to 1.5% from 3.5% in 2000. This
decline primarily reflects the impact of the selling and administrative
expense de-leveraging caused by the revenue decline.
The Company acquired two U.S. franchises during the year, adding
approximately $38 million of revenue. The impact of these acquisitions
on Operating profit was negligible.
United States revenue operating profit
In Millions of U.S. Dollars
France — Revenues in France decreased 2% in local currency to K4.2
billion ($3.8 billion) in 2001 from K4.3 billion ($3.9 billion) in 2000.
During the year the Company experienced slowing demand for its
services as the French economy continued to weaken. Revenue growth in
the fourth quarter contracted 11.0% from the prior year level.
Despite this decrease in revenues, our French organization was able to
achieve improved operating profit margins. Operating profit margins
improved to 3.6% in 2001, representing a 30 basis point (.3%) improvement
over 2000 and a 90 basis point (.9%) improvement over 1999. Operating
profit increased 7% in local currency in 2001, following a 49% improvement
in 2000. These improvements are the result of enhanced pricing initiatives
and effective cost control in response to the slowing French economy.
France revenue operating profit
In Millions of U.S. Dollars
United Kingdom — The United Kingdom segment includes Manpower
which provides services though 160 offices, Brook Street which provides
services through 126 offices and Elan, a specialty IT staffing business,
which provides services throughout Europe through 22 offices.
Revenues for the U.K. segment grew 8% in constant currency reaching
$1.5 billion for 2001. While demand for our services was not as strong in
the second half of the year, the U.K. economy was stronger than many of
the other markets in which the Company operates.
The gross profit margin improved substantially during the year, increasing
190 basis points (1.9%). This reflects an improvement in business mix to
more higher-value services and enhanced pricing.
United States 2,003.4
France 3,766.4
United Kingdom 1,489.3
Other Europe 1,939.4
Other Countries 1,285.3
Managemen t ’s D i s cu s s i on and Ana l y s i s ( c o n t i n u e d )
— o f Financ ia l Condi t i on and Re su l t s o f Operat i on s —

Total Capitalization
In Millions of U.S. Dollars
Capital Resources
In August 2001, the Company received $240.0 million in gross proceeds
related to the issuance of $435.4 million in aggregate principal amount at
maturity of unsecured zero-coupon convertible debentures, due August
17, 2021 (the “Debentures”). These Debentures were issued at a discount
to yield an effective interest rate of 3% per year and rank equally with all
existing and future senior unsecured indebtedness of the Company. Gross
proceeds were used to repay borrowings under the Company’s unsecured
revolving credit agreement and advances under the Receivables Facility. There
are no scheduled cash interest payments associated with the Debentures.
The Debentures are convertible into shares of the Company’s common
stock at an initial price of $39.50 per share if the closing price of the
Company’s common stock on the New York Stock Exchange exceeds
specified levels or in certain other circumstances.
The Company may call the Debentures beginning August 17, 2004
for cash at the issue price, plus accreted original issue discount. Holders
of the Debentures may require the Company to purchase the Debentures
at the issue price, plus accreted original issue discount, on the first, third,
fifth, tenth and fifteenth anniversary dates. The Company may purchase
these Debentures for either cash, the Company’s common stock, or
combinations thereof.
The Company has K150.0 million in unsecured notes due March 2005
and K200.0 million in unsecured notes due July 2006.
During November 2001, the Company entered into new revolving credit
agreements with a syndicate of commercial banks. The new agreements
consist of a $450.0 million five-year revolving credit facility (the “Five-year
Facility”) and a $300.0 million 364-day revolving credit facility (the
“364-day Facility”).
The revolving credit agreements allow for borrowings in various currencies
and up to $100.0 million of the Five-year Facility may be used for the
issuance of standby letters of credit. Outstanding letters of credit totaled
$65.5 million and $62.1 million as of December 31, 2001 and 2000,
respectively. Additional borrowings of $449.9 million were available to
the Company under these agreements at December 31, 2001.
The interest rate and facility fee on both agreements, and the issuance fee
paid for the issuance of letters of credit on the Five-year Facility, vary
based on the Company’s debt rating and borrowing level. Currently, on the
Five-year Facility, the interest rate is LIBOR plus .725% and the facility
and issuance fees are .15% and .725%, respectively. On the 364-day
Facility, the interest rate is LIBOR plus .75% and the facility fee is
.125%. The Five-year Facility expires in November 2006. The 364-day
Facility expires in November 2002.
The agreements require, among other things, that the Company comply
with a Debt-to-EBITDA ratio of less than 3.75 to 1 in 2002 (less than 3.25
to 1 beginning in March 2003) and a fixed charge ratio of greater than 2.00
to 1. As defined in the agreement, the Company had a Debt-to-EBITDA ratio
of 2.69 to 1 and a fixed charge ratio of 2.52 to 1 as of December 31, 2001.
Borrowings of $57.1 million were outstanding under the Company’s
$125.0 million U.S. commercial paper program. Commercial paper
borrowings, which are backed by the Five-year Facility, have been
classified as long-term debt due to the availability to refinance them on a
long-term basis under this facility.
In addition to the above, the Company and some of its foreign subsidiaries
maintain separate lines of credit with local financial institutions to meet
working capital needs. As of December 31, 2001, such lines totaled
$163.0 million, of which $152.8 million was unused.
A wholly-owned U.S. subsidiary of the Company has an agreement to
sell, on an ongoing basis, up to $200.0 million of an undivided interest in
its accounts receivable. There were no receivables sold under this
agreement at December 31, 2001. Unless extended by amendment, the
agreement expires in December 2002. (See Note 4 to the Consolidated
Financial Statements for further information.)
The Company’s principal ongoing cash needs are to finance working
capital, capital expenditures, acquisitions and the share repurchase
program. Working capital is primarily in the form of trade receivables,
which increase as revenues increase. The amount of financing necessary to
support revenue growth depends on receivable turnover, which differs in
each market in which the Company operates.
The Company believes that its internally generated funds and its existing
credit facilities are sufficient to cover its near-term projected cash needs.
With revenue increases or additional acquisitions or share repurchases,
additional borrowings under the existing facilities would be necessary to
finance the Company’s cash needs.
– 35 –– 34 –
much of 2001 and 2000. In addition, the change from 2000 to 2001 was
also partially due to the decrease in working capital needs because of the
declining revenue levels. Cash provided by operating activities before
working capital changes was $221.2 million, $243.9 million and
$249.7 million during 2001, 2000 and 1999, respectively.
Accounts receivable decreased to $1,917.8 million at December 31, 2001
from $2,094.4 million at December 31, 2000. This decrease is primarily
due to the declining revenue levels in many of our countries and a two-day
reduction in DSO on a consolidated basis. These declines were offset
somewhat by a $145.0 million reduction in the amount of accounts receivable
sold under the Receivables Facility. The accounts receivable balance is also
impacted by currency exchange rates. At constant exchange rates, the
receivables balance would have been $102.8 million higher than reported.
The Company records an Allowance for doubtful accounts as a reserve
against the outstanding Accounts receivable balance. This allowance is
calculated on a country-by-country basis with consideration for historical
write-off experience, the current aging of receivables and a specific review
for potential bad debts. The Allowance for doubtful accounts was $61.8
million and $55.3 million at December 31, 2001 and 2000, respectively.
Net cash provided by borrowings was $313.0 million and $71.8 million
in 2001 and 2000, respectively. Borrowings in 2001 and 2000 were used
for acquisitions, investments in new and expanding markets, capital
expenditures and repurchases of the Company’s common stock.
Cash Uses
Capital expenditures were $87.3 million, $82.6 million and $74.7 million
during 2001, 2000 and 1999, respectively. These expenditures are
primarily comprised of purchases of computer equipment, office
furniture and other costs related to office openings and refurbishments,
as well as capitalized software costs of $19.1 million, $6.9 million and
$3.0 million in 2001, 2000 and 1999, respectively.
In July 2001, the Company acquired Jefferson Wells for total consideration
of approximately $174.0 million, including assumed debt. The acquisition
of Jefferson Wells was originally financed through the Company’s existing
credit facilities.
In January 2000, the Company acquired Elan Group Ltd. for total
consideration of approximately $146.2 million, the remaining $30.0
million of which was paid during 2001.
The Company has also acquired or invested in other companies throughout
the world. The total consideration paid for such transactions, excluding
the acquisitions of Jefferson Wells and Elan, was $95.8 million, $56.2
million and $18.8 million in 2001, 2000 and 1999, respectively.
The Board of Directors has authorized the repurchase of 15 million shares
under the Company’s share repurchase program. Share repurchases may
be made from time to time and may be implemented through a variety of
methods, including open market purchases, block transactions, privately
negotiated transactions, accelerated share repurchase programs, forward
repurchase agreements or similar facilities. At December 31, 2001, 9.0
million shares at a cost of $253.1 million have been repurchased under
the program, $3.3 million of which were repurchased during 2001.
During September 2000, the Company entered into a forward repurchase
agreement to purchase shares of its common stock under its share
repurchase program. Under the agreement, over a two-year period, the
Company is required to repurchase a total of one million shares at a current
price of approximately $34 per share, which approximates the market
price at the inception of the agreement, plus a financing charge. The
Company may choose the method by which it settles the agreement (i.e.,
cash or shares). As of December 31, 2001, 100,000 shares have been
purchased under this agreement, leaving 900,000 shares to be purchased
by September 2002.
The Company paid dividends of $15.2 million, $15.1 million and $15.3
million in 2001, 2000 and 1999, respectively.
Cash and cash equivalents increased by $64.1million in 2001 compared to a
decrease of $60.0 million in 2000 and an increase of $61.2 million in 1999.
The Company has aggregate commitments related to debt, the forward
repurchase agreement and operating leases as follows:
there-In Millions of U.S. Dollars 2002 2003 2004 2005 2006 after
Long-term debt 13.5 6.5 8.6 135.1 413.5 247.4
Short-term borrowings 10.2 – – – – –
Forward repurchase agreement 30.5 – – – – –
Operating leases 67.5 55.2 40.2 31.1 22.9 48.0
121.7 61.7 48.8 166.2 436.4 295.4
Capitalization
Total capitalization at December 31, 2001 was $1,649.1 million,
comprised of $834.8 million of debt and $814.3 million of equity. Debt
as a percentage of total capitalization was 51% at December 31, 2001
compared to 43% in 2000.
97
1,800
1,500
1,200
900
600
300
98 99 00 01
equitydebt
Managemen t ’s D i s cu s s i on and Ana l y s i s ( c o n t i n u e d )
— o f Financ ia l Condi t i on and Re su l t s o f Operat i on s —
– 37 –– 36 –
Signif icant Matters Affect ing
Results of Operations
Market Risks
The Company is exposed to the impact of foreign currency fluctuations
and interest rate changes.
Exchange Rates
The Company’s exposure to exchange rates relates primarily to its foreign
subsidiaries and its Euro and Yen denominated borrowings. For its foreign
subsidiaries, exchange rates impact the U.S. Dollar value of their reported
earnings, the Company’s investments in the subsidiaries and the inter-
company transactions with the subsidiaries.
Approximately 80% and 90% of the Company’s revenues and operating
profits, respectively, are generated outside of the United States, the
majority of which are in Europe. As a result, fluctuations in the value of
foreign currencies against the dollar may have a significant impact on the
reported results of the Company. Revenues and expenses denominated in
foreign currencies are translated into U.S. Dollars at the weighted average
exchange rate for the year. Consequently, as the value of the dollar
strengthens relative to other currencies in the Company’s major markets,
as it did in the European markets during 2001, the resulting translated
revenues, expenses and operating profits are lower. Using constant
exchange rates, 2001 revenues and operating profits would have been
approximately 3% and 4% higher than reported, respectively.
Fluctuations in currency exchange rates also impact the U.S. Dollar
amount of Shareholders’ equity of the Company. The assets and liabilities
of the Company’s non-U.S. subsidiaries are translated into United States
Dollars at the exchange rates in effect at year-end. The resulting translation
adjustments are recorded in Shareholders’ equity as a component of
Accumulated other comprehensive income (loss). The dollar was stronger
relative to many of the foreign currencies at December 31, 2001 compared
to December 31, 2000. Consequently, the Accumulated other
comprehensive income (loss) component of Shareholders’ equity decreased
$35.4 million during the year. Using the year-end exchange rates, the
total amount permanently invested in non-U.S. subsidiaries at December
31, 2001 is approximately $1.6 billion.
As of December 31, 2001, the Company had $488.8 million of long-term
borrowings denominated in Euro ($397.6 million) and Yen ($91.2 million).
These borrowings provide a hedge of the Company’s net investment in
subsidiaries with the related functional currencies. Since the Company’s
net investment in these subsidiaries exceeds the respective amount of the
borrowings, all translation gains or losses related to these borrowings are
included as a component of Accumulated other comprehensive income
(loss). The Accumulated other comprehensive income (loss) component
of Shareholders’ equity increased $32.0 million during the year due to
the currency impact on these borrowings.
Although currency fluctuations impact the Company’s reported results and
Shareholders’ equity, such fluctuations generally do not affect the Company’s
cash flow or result in actual economic gains or losses. Substantially all of
the Company’s subsidiaries derive revenues and incur expenses within a
single country and consequently, do not generally incur currency risks in
connection with the conduct of their normal business operations. The
Company generally has few cross border transfers of funds, except for
transfers to the United States for payment of license fees and interest
expense on intercompany loans, and working capital loans made from
the United States to the Company’s foreign subsidiaries. To reduce the
currency risk related to the loans, the Company may borrow funds under
the revolving credit agreements in the foreign currency to lend to the
subsidiary, or alternatively, may enter into a forward contract to hedge the
loan. Foreign exchange gains and losses recognized on any transactions are
included in the Consolidated Statements of Operations and historically
have been immaterial. The Company generally does not engage in hedging
activities, except as discussed above. As of December 31, 2001, there were no
such hedges in place. The only derivative instruments held by the Company
were interest rate swap agreements.
The Company holds a 49% interest in its Swiss franchise, which holds an
investment portfolio of approximately $73.5 million as of December 31,
2001. This portfolio is invested in a wide diversity of European and U.S.
debt and equity securities as well as various professionally managed
funds. To the extent that there are realized gains or losses related to this
portfolio, the Company’s ownership share is included in its Consolidated
Statements of Operations.
Interest Rates
The Company’s exposure to market risk for changes in interest rates
relates primarily to the Company’s variable rate long-term debt
obligations. The Company has historically managed interest rates
through the use of a combination of fixed and variable rate borrowings
and interest rate swap agreements. Excluding the impact of the swap
agreements, the Company has $244.8 million in variable rate borrowings
at a weighted average interest rate of 2.53% and $590.0 million in fixed
rate borrowings at a weighted average interest rate of 4.74% as of
December 31, 2001.
The Company has various interest rate swap agreements in order to fix its
interest costs on a portion of its Euro and Yen denominated variable rate
borrowings. The Euro interest rate swap agreements have a notional value
of K100.0 million ($89.0 million) which fix the interest rate, on a weighted-
average basis, at 5.7% and expire in 2010. The Yen interest rate swap
agreements have a notional value of ¥8,150.0 million ($61.8 million),
¥4,000.0 million ($30.3 million) of which fixes the interest rate at .9%
and expires in 2003 and ¥4,150.0 million ($31.5 million) of which fixes
the interest rate at .8% and expires in 2006. The Company also had an
interest rate swap agreement that expired in January 2001, which fixed the
interest rate at 6.0% on $50.0 million of the Company’s U.S. Dollar-based
borrowings. At December 31, 2001, including the impact of the interest
rate swap agreements, the Company effectively had $94.0 million and
$740.8 million in variable and fixed rate borrowings, respectively, at a
weighted average interest rate of 2.08% and 4.53%, respectively. The
impact on interest expense recorded during 2001 was not material.
A 21 basis point (.21%) move in interest rates on the Company’s variable
rate borrowings (10% of the weighted average variable interest rate,
including the impact of the swap agreements) would have an immaterial
impact on the Company’s earnings before income taxes and cash flows in
each of the next five years.
Impact of Economic Conditions
One of the principal attractions of using temporary staffing solutions is to
maintain a flexible supply of labor to meet changing economic conditions,
therefore, the industry has been and remains sensitive to economic cycles.
To help minimize the effects of these economic cycles, the Company
provides a wide range of human resource services including professional,
technical, specialized, office and industrial staffing; temporary and
permanent employee testing, selection, training, and development; and
organizational-development consulting. The Company believes that the
breadth of its operations and the diversity of its service mix cushions it
against the impact of an adverse economic cycle in any single country or
industry. However, adverse economic conditions in any of its three largest
markets, as was seen during much of 2001, would likely have a material
impact on the Company’s consolidated operating results.
The Euro
Twelve of the fifteen member countries of the European Union (the
“participating countries”) have established fixed conversion rates between
their existing sovereign currencies (the “legacy currencies”) and the Euro.
Beginning on January 1, 2002, Euro-denominated bills and coins were
issued and legacy currencies are being withdrawn from circulation.
The Company has significant operations in many of the participating
countries. Since the Company’s labor costs and prices are generally
determined on a local basis, the impact of the Euro has been primarily
related to making internal information systems modifications to meet
employee payroll, customer invoicing and financial reporting requirements.
Such modifications related to converting currency values and to operating
in a dual currency environment during the transition period. Modifications
of internal information systems occurred throughout the transition period
and were mainly coordinated with other system-related upgrades and
enhancements. All modifications have now been completed. The Company
accounted for all such system modification costs in accordance with
its existing policy and such costs were not material to the Company’s
Consolidated Financial Statements.
The Company did not experience any significant problems associated
with the conversion to the Euro currency on January 1, 2002 in any of the
participating countries.
Legal Regulations and Union Relationships
The temporary employment services industry is closely regulated in all of
the major markets in which the Company operates except the United
States and Canada. Many countries impose licensing or registration
requirements, substantive restrictions on temporary employment services,
either on the temporary staffing company or the ultimate client company
or minimum benefits to be paid to the temporary employee either during
or following the temporary assignment. Countries also may restrict
the length of temporary assignments, the type of work permitted for
temporary workers or the occasions on which temporary workers may be
used. Changes in applicable laws or regulations have occurred in the past
and are expected in the future to affect the extent to which temporary
employment services firms may operate. These changes could impose
additional costs or taxes, additional record keeping or reporting
requirements; restrict the tasks to which temporaries may be assigned;
limit the duration of or otherwise impose restrictions on the nature of the
temporary relationship (with the Company or the customer) or otherwise
adversely affect the industry.
In many markets, the existence or absence of collective bargaining
agreements with labor organizations has a significant impact on the
Company’s operations and the ability of customers to utilize the Company’s
services. In some markets, labor agreements are structured on a national
or industry-wide (rather than a company) basis. Changes in these collective
labor agreements have occurred in the past, are expected to occur in the
future, and may have a material impact on the operations of temporary
staffing firms, including the Company.
Managemen t ’s D i s cu s s i on and Ana l y s i s ( c o n t i n u e d )
— o f Financ ia l Condi t i on and Re su l t s o f Operat i on s —
– 39 –– 38 –
Forward-Looking Statements
Statements made in this Annual Report that are not statements of
historical fact are forward-looking statements. All forward-looking
statements involve risks and uncertainties. The information under the
heading “Forward-Looking Statements” in the Company’s Annual
Report on Form 10-K for the year ended December 31, 2001, which is
incorporated herein by reference, provides cautionary statements
identifying, for purposes of the safe harbor provisions of the Private
Securities Litigation Reform Act of 1995, important factors that could
cause the Company’s actual results to differ materially from those
contained in the forward-looking statements. Some or all of the factors
identified in the Company’s Report on Form 10-K may be beyond the
Company’s control. Forward-looking statements can be identified by
words such as “expect”, “anticipate”, “intend”, “plan”, “may”, “will”,
“believe”, “seek”, “estimate”, and similar expressions. The Company
cautions that any forward-looking statement reflects only the Company’s
belief at the time the statement is made. The Company undertakes
no obligation to update any forward-looking statements to reflect
subsequent events or circumstances.
Accounting Changes
Since June 1998, the Financial Accounting Standards Board (“FASB”)
has issued SFAS Nos. 133, 137, and 138 related to “Accounting for
Derivative Instruments and Hedging Activities” (“SFAS No. 133, as
amended” or “Statements”). These Statements establish accounting and
reporting standards requiring that every derivative instrument be
recorded on the balance sheet as either an asset or liability measured at its
fair value. If the derivative is designated as a fair value hedge, the changes
in the fair value of the derivative and of the hedged item attributable to
the hedged risk are recognized in earnings. If the derivative is designated
as a cash flow hedge, the effective portions of the changes in the fair value
of the derivative are recorded as a component of Accumulated other
comprehensive income (loss) and are recognized in the Consolidated
Statements of Operations when the hedged item affects earnings.
Ineffective portions of changes in the fair value of cash flow hedges are
recognized in earnings.
On January 1, 2001, the Company adopted SFAS No. 133, as amended.
As a result of adopting this standard, the Company recognized the fair
value of all derivative contracts as a net liability of $3.4 million on
the balance sheet at January 1, 2001. This amount was recorded as
an adjustment to Shareholders’ equity through Accumulated other
comprehensive income (loss). There was no impact on Net earnings.
During June 2001, the FASB issued SFAS No. 141, “Business Combinations,”
which requires all business combinations completed subsequent to June
30, 2001 to be accounted for using the purchase method. Although the
purchase method generally remains unchanged, this standard also requires
that acquired intangible assets should be separately recognized if the benefit
of the intangible assets are obtained through contractual or other legal
rights, or if the intangible assets can be sold, transferred, licensed, rented or
exchanged, regardless of the acquirer’s intent to do so. Intangible assets
separately identified must be amortized over their estimated economic life.
This statement was adopted by the Company on July 1, 2001. The
Company has accounted for previous acquisitions under the purchase
method and the related excess of purchase price over net assets was mainly
goodwill, therefore, the adoption of this statement did not have a material
impact on the Consolidated Financial Statements.
During June 2001, the FASB issued SFAS No. 142, “Goodwill and Other
Intangible Assets,” which prohibits the amortization of goodwill or
identifiable intangible assets with an indefinite life beginning January 1,
2002. In addition, goodwill or identifiable intangible assets with an
indefinite life resulting from business combinations completed between
July 1, 2001 and December 31, 2001 are no longer required to be
amortized. Rather, goodwill will be subject to impairment reviews by
applying a fair-value-based test at the reporting unit level, which
generally represents operations one level below the segments reported by
the Company. An impairment loss will be recorded for any goodwill that
is determined to be impaired.
The impairment testing provisions of this statement are effective for the
Company on January 1, 2002. Within six months of adoption, the Company
will perform an impairment test on all existing goodwill, which will be
updated at least annually. The Company has not yet determined the extent
of any impairment losses on its existing goodwill, however, any such losses
are not expected to be material to the Consolidated Financial Statements.
The non-amortization provisions of this statement related to goodwill
resulting from business combinations between July 1, 2001 and December
31, 2001 were adopted as of July 1, 2001. The remaining non-amortization
provisions of this statement were adopted as of January 1, 2002. Under the
provisions of this statement, $16.8 million of the 2001 Amortization of
intangible assets would not have been recorded.
To the Board of Directors and
Shareholders of Manpower Inc.:
We have audited the accompanying consolidated balance sheets of Manpower Inc. (a Wisconsin corporation) and subsidiaries as of December 31, 2001
and 2000, and the related consolidated statements of operations, cash flows and shareholders’ equity for each of the three years in the period ended
December 31, 2001. These consolidated financial statements are the responsibility of the Company’s management. Our responsibility is to express an
opinion on these consolidated financial statements based on our audits.
We conducted our audits in accordance with auditing standards generally accepted in the United States. Those standards require that we plan and perform
the audit to obtain reasonable assurance about whether the financial statements are free of material misstatement. An audit includes examining, on a
test basis, evidence supporting the amounts and disclosures in the financial statements. An audit also includes assessing the accounting principles
used and significant estimates made by management, as well as evaluating the overall financial statement presentation. We believe that our audits
provide a reasonable basis for our opinion.
In our opinion, the consolidated financial statements referred to above present fairly, in all material respects, the financial position of Manpower Inc.
and subsidiaries as of December 31, 2001 and 2000, and the results of their operations and their cash flows for each of the three years in the period ended
December 31, 2001, in conformity with accounting principles generally accepted in the United States.
ARTHUR ANDERSEN LLP
Milwaukee, Wisconsin
January 28, 2002
Repo r t o f I ndependen t Pub l i c Ac coun t an t sManagemen t ’s D i s cu s s i on and Ana l y s i s ( c o n t i n u e d )
— o f Financ ia l Condi t i on and Re su l t s o f Operat i on s —

– 41 –– 40 –
year ended december 31 2001 2000 1999
Revenues from services $ 10,483.8 $ 10,842.8 $ 9,770.1
Cost of services 8,527.3 8,896.1 8,065.2
Gross profit 1,956.5 1,946.7 1,704.9
Selling and administrative expenses 1,718.9 1,635.7 1,474.3
Operating profit 237.6 311.0 230.6
Interest and other expense 39.7 45.8 24.8
Earnings before income taxes 197.9 265.2 205.8
Provision for income taxes 73.4 94.0 55.8
Net earnings $ 124.5 $ 171.2 $ 150.0
Net earnings per share $ 1.64 $ 2.26 $ 1.94
Net earnings per share – diluted $ 1.62 $ 2.22 $ 1.91
The accompanying Notes to Consolidated Financial Statements are an integral part of these statements.
year ended december 31 2001 2000 1999
Systemwide sales $ 11,779.1 $ 12,444.9 $ 11,511.4
Systemwide offices at year-end 3,920 3,685 3,396
Systemwide information represents total of Company-owned branches and franchises.
december 31 2001 2000
Assets
Current Assets
Cash and cash equivalents $ 245.8 $ 181.7
Accounts receivable, less allowance for doubtful accounts of $61.8 and $55.3, respectively 1,917.8 2,094.4
Prepaid expenses and other assets 77.0 51.8
Future income tax benefits 73.8 68.8
Total current assets 2,314.4 2,396.7
Other Assets
Intangible assets, less accumulated amortization of $42.4 and $27.2, respectively 480.8 247.6
Investments in licensees 44.7 41.8
Other assets 204.7 163.9
Total other assets 730.2 453.3
Property and Equipment
Land, buildings, leasehold improvements and equipment 465.4 440.9
Less: accumulated depreciation and amortization 271.4 249.3
Net property and equipment 194.0 191.6
Total assets $ 3,238.6 $ 3,041.6
Liabilities and Shareholders’ Equity
Current Liabilities
Accounts payable $ 382.1 $ 453.1
Employee compensation payable 93.2 81.2
Accrued liabilities 234.9 269.2
Accrued payroll taxes and insurance 300.8 341.8
Value added taxes payable 255.9 311.0
Short-term borrowings and current maturities of long-term debt 23.7 65.9
Total current liabilities 1,290.6 1,522.2
Other Liabilities
Long-term debt 811.1 491.6
Other long-term liabilities 322.6 287.4
Total other liabilities 1,133.7 779.0
Shareholders’ Equity
Preferred stock, $.01 par value, authorized 25,000,000 shares, none issued – –
Common stock, $.01 par value, authorized 125,000,000 shares,
issued 85,173,961 and 84,717,834 shares, respectively .9 .8
Capital in excess of par value 1,644.9 1,631.4
Accumulated deficit (387.6) (496.9)
Accumulated other comprehensive income (loss) (190.8) (145.1)
Treasury stock at cost, 9,045,200 and 8,945,200 shares, respectively (253.1) (249.8)
Total shareholders’ equity 814.3 740.4
Total liabilities and shareholders’ equity $ 3,238.6 $ 3,041.6
The accompanying Notes to Consolidated Financial Statements are an integral part of these balance sheets.
C on so l i d a t ed S t a t emen t s o f Ope r a t i on s
— in millions, except per share data —
Supp l emen t a l S y s t emwide In f o rma t i on ( u n a u d i t e d )
— dollars in millions —
Conso l i d a t ed Ba l an c e Sh e e t s
— in millions, except share data —

– 43 –– 42 –
year ended december 31 2001 2000 1999
Cash Flows from Operating Activities
Net earnings $ 124.5 $ 171.2 $ 150.0
Adjustments to reconcile net earnings to net cash provided (used) by operating activities:
Depreciation and amortization 80.2 66.8 63.7
Deferred income taxes (7.3) (15.8) 15.3
Provision for doubtful accounts 23.8 21.7 20.7
Change in operating assets and liabilities:
Amounts advanced under the Receivables Facility (145.0) (55.0) 25.0
Accounts receivable, net of sale 217.3 (261.2) (457.4)
Other assets (69.1) (32.6) (51.7)
Other liabilities (88.4) 262.8 233.9
Cash provided (used) by operating activities 136.0 157.9 (.5)
Cash Flows from Investing Activities
Capital expenditures (87.3) (82.6) (74.7)
Acquisitions of businesses, net of cash acquired (295.9) (172.4) (18.8)
Proceeds from the sale of property and equipment 16.1 7.3 14.9
Cash used by investing activities (367.1) (247.7) (78.6)
Cash Flows from Financing Activities
Net change in payable to banks (49.1) (76.4) 45.5
Proceeds from long-term debt 1,089.9 259.3 460.4
Repayment of long-term debt (727.8) (111.1) (259.3)
Proceeds from stock option and purchase plans 13.6 10.0 18.7
Repurchase of common stock (3.3) (20.0) (100.8)
Dividends paid (15.2) (15.1) (15.3)
Cash provided by financing activities 308.1 46.7 149.2
Effect of exchange rate changes on cash (12.9) (16.9) (8.9)
Net increase (decrease) in cash and cash equivalents 64.1 (60.0) 61.2
Cash and cash equivalents, beginning of year 181.7 241.7 180.5
Cash and cash equivalents, end of year $ 245.8 $ 181.7 $ 241.7
Supplemental Cash Flow Information
Interest paid $ 38.0 $ 27.1 $ 12.4
Income taxes paid $ 117.9 $ 83.2 $ 66.9
The accompanying Notes to Consolidated Financial Statements are an integral part of these statements.
accumulatedcapital in other
common excess of accumulated comprehensive treasurystock par value deficit income (loss) stock total
Balance, December 31, 1998 $ .8 $ 1,602.7 $ (787.7) $ (17.9) $ (129.0) $ 668.9
Comprehensive Income:
Net earnings 150.0
Foreign currency translation (70.9)
Total comprehensive income 79.1
Issuances under option and purchase plans – 18.7 18.7
Dividends ($.20 per share) (15.3) (15.3)
Repurchases of common stock (100.8) (100.8)
Balance, December 31, 1999 .8 1,621.4 (653.0) (88.8) (229.8) 650.6
Comprehensive Income:
Net earnings 171.2
Foreign currency translation (50.6)
Unrealized loss on investments, net of tax (5.7)
Total comprehensive income 114.9
Issuances under option and purchase plans – 10.0 10.0
Dividends ($.20 per share) (15.1) (15.1)
Repurchases of common stock (20.0) (20.0)
Balance, December 31, 2000 .8 1,631.4 (496.9) (145.1) (249.8) 740.4
Comprehensive Income:
Net earnings 124.5
Foreign currency translation (35.4)
Unrealized loss on derivatives, net of tax (5.7)
Unrealized loss on investments, net of tax (2.8)
Reclassification adjustment for losses
included in net earnings, net of tax 5.7
Minimum pension liability adjustment, net of tax (7.5)
Total comprehensive income 78.8
Issuances under option and purchase plans .1 13.5 13.6
Dividends ($.20 per share) (15.2) (15.2)
Repurchases of common stock (3.3) (3.3)
Balance, December 31, 2001 $ .9 $ 1,644.9 $ (387.6) $ (190.8) $ (253.1) $ 814.3
The accompanying Notes to Consolidated Financial Statements are an integral part of these statements.
Con so l i d a t ed S t a t emen t s o f Ca sh F l ows
— in millions —
Conso l i d a t ed S t a t emen t s o f Sh a r eho ld e r s ’ Equ i t y
— in millions, except per share data —

– 45 –– 44 –
01 Summary of Signif icant Accounting Pol icies
Nature of Operations
Manpower Inc. (the “Company”) is a global staffing leader with over 3,900 systemwide offices in 61 countries. The Company’s largest operations,
based on revenues, are located in the United States, France and the United Kingdom. The Company provides a wide range of human resource services,
including professional, technical, specialized, office and industrial staffing; temporary and permanent employee testing, selection, training and
development; and organizational-performance consulting. The Company provides services to a wide variety of customers, none of which individually
comprise a significant portion of revenues within a given geographic region or for the Company as a whole.
Basis of Consolidation
The Consolidated Financial Statements include the accounts of the Company and all subsidiaries. For subsidiaries in which the Company has an ownership
interest of 50% or less, but more than 20%, the Consolidated Financial Statements reflect the Company’s ownership share of those earnings using the
equity method of accounting. These investments are included as Investments in licensees in the Consolidated Balance Sheets. Included in Shareholders’
equity at December 31, 2001 are $38.0 of unremitted earnings from investments accounted for using the equity method. All significant intercompany
accounts and transactions have been eliminated in consolidation.
Revenues
The Company generates revenues from sales of services by its own branch operations and from fees earned on sales of services by its franchise operations.
Revenues from services are recognized as the services are rendered and revenues from franchise fees are recognized as earned. Franchise fees, which are
included in revenues from services, were $28.1, $37.4 and $37.7 for the years ended December 31, 2001, 2000 and 1999, respectively.
Derivative Financial Instruments
The Company accounts for its derivative instruments in accordance with Statements of Financial Accounting Standards (“SFAS”) Nos. 133, 137, and
138 related to “Accounting for Derivative Instruments and Hedging Activities” (“SFAS No. 133, as amended” or “Statements”). Derivative instruments
are recorded on the balance sheet as either an asset or liability measured at its fair value. If the derivative is designated as a fair value hedge, the changes
in the fair value of the derivative and of the hedged item attributable to the hedged risk are recognized in earnings. If the derivative is designated as a
cash flow hedge, the effective portions of the changes in the fair value of the derivative are recorded as a component of Accumulated other comprehensive
income (loss) and recognized in the Consolidated Statements of Operations when the hedged item affects earnings. Ineffective portions of changes in
the fair value of cash flow hedges are recognized in earnings. The Company adopted SFAS No. 133, as amended, on January 1, 2001.
Accounts Receivable Securitization
The Company accounts for the securitization of accounts receivable in accordance with SFAS No. 140, “Accounting for Transfers and Servicing of
Financial Assets and Extinguishments of Liabilities.” At the time the receivables are sold, the balances are removed from the Consolidated Balance
Sheets. Costs associated with the sale of receivables, primarily related to the discount and loss on sale, are included in Other expense in the Consolidated
Statements of Operations.
Foreign Currency Translation
The financial statements of the Company’s non-U.S. subsidiaries have been translated in accordance with SFAS No. 52. Under SFAS No. 52, asset and
liability accounts are translated at the current exchange rate and income statement items are translated at the weighted average exchange rate for the
year. The resulting translation adjustments are recorded as a component of Accumulated other comprehensive income (loss), which is included in
Shareholders’ equity. In accordance with SFAS No. 109, no deferred taxes have been recorded related to the cumulative translation adjustments.
The Company’s various foreign currency denominated borrowings are accounted for as a hedge of the Company’s net investment in its subsidiaries
with the related functional currencies. Since the Company’s net investment in these subsidiaries exceeds the amount of the related borrowings, all
translation gains or losses related to these borrowings are included as a component of Accumulated other comprehensive income (loss).
Translation adjustments for those operations in highly inflationary economies and certain other transaction adjustments are included in earnings.
Historically these adjustments have been immaterial to the Consolidated Financial Statements.
Capitalized Software
The Company capitalizes purchased software as well as internally developed software. Internal software development costs are capitalized from the
time the internal use software is considered probable of completion until the software is ready for use. Business analysis, system evaluation, selection
and software maintenance costs are expensed as incurred. Capitalized software costs are amortized using the straight-line method over the estimated
useful life of the software. The Company regularly reviews the carrying value of all capitalized software and recognizes a loss when the carrying value
is considered unrealizable. The net capitalized software balance of $26.0 and $10.8 as of December 31, 2001 and 2000, respectively, is included in
Other assets in the Consolidated Balance Sheets.
Intangible Assets
Intangible assets consist primarily of the excess of cost over the fair value of net assets acquired (i.e. goodwill). Goodwill resulting from business
combinations completed prior to July 1, 2001 was amortized on a straight-line basis over its useful life, estimated based on the facts and circumstances
surrounding each individual acquisition, not to exceed twenty years. The intangible asset and related accumulated amortization are removed from the
Consolidated Balance Sheets when the intangible asset becomes fully amortized. The Company regularly reviews the carrying value of all intangible
assets and recognizes a loss when the unamortized balance is considered unrealizable. Amortization expense was $17.0, $13.3 and $6.9 in 2001, 2000
and 1999, respectively.
During June 2001, the Financial Accounting Standards Board (“FASB”) issued SFAS No. 141, “Business Combinations,” which requires all business
combinations completed subsequent to June 30, 2001 to be accounted for using the purchase method. Although the purchase method generally
remains unchanged, this standard also requires that acquired intangible assets should be separately recognized if the benefit of the intangible assets are
obtained through contractual or other legal rights, or if the intangible assets can be sold, transferred, licensed, rented or exchanged, regardless of the
acquirer’s intent to do so. Intangible assets separately identified must be amortized over their estimated economic life.
This statement was adopted by the Company on July 1, 2001. The Company has accounted for previous acquisitions under the purchase method and
the related excess of purchase price over net assets was mainly goodwill, therefore, the adoption of this statement did not have a material impact on the
Consolidated Financial Statements.
During June 2001, the FASB issued SFAS No. 142, “Goodwill and Other Intangible Assets,” which prohibits the amortization of goodwill or identifiable
intangible assets with an indefinite life beginning January 1, 2002. In addition, goodwill or identifiable intangible assets with an indefinite life
resulting from business combinations completed between July 1, 2001 and December 31, 2001 are no longer required to be amortized. Rather, goodwill
will be subject to impairment reviews by applying a fair-value-based test at the reporting unit level, which generally represents operations one level
below the segments reported by the Company. An impairment loss will be recorded for any goodwill that is determined to be impaired.
The impairment testing provisions of this statement are effective for the Company on January 1, 2002. The Company will perform an impairment
test on all existing goodwill before June 30, 2002, which will be updated at least annually. The Company has not yet determined the extent of any
impairment losses on its existing goodwill, however, any such losses are not expected to be material to the Consolidated Financial Statements.
The non-amortization provisions of this statement related to goodwill resulting from business combinations completed between July 1, 2001 and
December 31, 2001 were adopted on July 1, 2001. The remaining non-amortization provisions of this statement were adopted on January 1, 2002.
Under the provisions of this statement, $16.8 of the 2001 Amortization of intangible assets would not have been recorded.
No t e s t o Con so l i d a t ed F in anc i a l S t a t emen t s
— in millions, except per share data —

– 47 –– 46 –
Property and Equipment
A summary of property and equipment at December 31 is as follows:
2001 2000
Land $ 1.8 $ 1.6
Buildings 24.4 23.2
Furniture, fixtures and autos 170.9 170.5
Computer equipment 124.7 110.3
Leasehold improvements 143.6 135.3
$ 465.4 $ 440.9
Property and equipment are stated at cost and depreciated using the straight-line method over the following estimated useful lives: buildings – up to
40 years; leasehold improvements – lesser of life of asset or lease term; furniture and equipment – 3 to 10 years. Expenditures for renewals and betterments
are capitalized whereas expenditures for repairs and maintenance are charged to income as incurred. Upon sale or disposition of properties, the difference
between unamortized cost and the proceeds is charged or credited to income.
Shareholders’ Equity
The Board of Directors has authorized the repurchase of up to fifteen million shares of stock under the Company’s share repurchase program. Share
repurchases may be made from time to time and may be implemented through a variety of methods, including open market purchases, block transactions,
privately negotiated transactions, accelerated share repurchase programs, forward repurchase agreements or similar facilities. Total shares repurchased
under the program at December 31, 2001 and 2000, were 9.0 million and 8.9 million shares, respectively, at a cost of $253.1 and $249.8, respectively.
The Company has a forward repurchase agreement to purchase shares of its common stock under its share repurchase program, which expires in
September 2002. Under the agreement, the Company will repurchase a total of one million shares at a current price of approximately $34 per share,
which represents the market price at the inception of the agreement plus a financing charge. The Company may choose the method by which it settles
the agreement (i.e., cash or shares). Shares purchased under this agreement as of December 31, 2001 were .1 million at a total cost of $3.3 million. No
shares were purchased under this agreement as of December 31, 2000.
Advertising Costs
The Company generally expenses production costs of media advertising as they are incurred. Advertising expenses were $40.1, $44.0 and $39.6 in
2001, 2000, and 1999, respectively.
Statement of Cash Flows
The Company considers all highly liquid investments with a maturity of three months or less when purchased to be cash equivalents.
Use of Estimates
The preparation of financial statements in conformity with accounting principles generally accepted in the United States requires management to
make estimates and assumptions that affect the reported amounts of assets and liabilities and disclosure of contingent assets and liabilities at the date of
the financial statements and the reported amounts of revenues and expenses during the reporting period. Actual results could differ from these estimates.
Reclassifications
Certain amounts in the 2000 and 1999 Notes to Consolidated Financial Statements have been reclassified to be consistent with the current year presentation.
02 Earnings per Share
The calculation of Net earnings per share for the years ended December 31, is as follows:
2001 2000 1999
Net earnings available to common shareholders $ 124.5 $ 171.2 $ 150.0
Weighted average common shares outstanding (in millions) 75.9 75.9 77.3
$ 1.64 $ 2.26 $ 1.94
The calculation of Net earnings per share – diluted for the years ended December 31, is as follows:
2001 2000 1999
Net earnings available to common shareholders $ 124.5 $ 171.2 $ 150.0
Weighted average common shares outstanding (in millions) 75.9 75.9 77.3
Effect of dilutive securities – Stock options (in millions) 1.1 1.2 1.4
77.0 77.1 78.7
$ 1.62 $ 2.22 $ 1.91
The calculation of Net earnings per share – diluted for the years ended December 31, 2001, 2000 and 1999 does not include certain stock option grants
because the exercise price for these options is greater than the average market price of the common shares during that year. The number, exercise prices
and weighted average remaining life of these antidilutive options is as follows:
2001 2000 1999
Shares (in thousands) 1,218 535 1,146
Exercise price ranges $32-$41 $35-$41 $27-$49
Weighted average remaining life 7.4 years 8.0 years 7.9 years
In addition, the calculation of Net earnings per share – diluted for the year ended December 31, 2001 does not include 6.1 million shares of common
stock related to convertible debt securities because their impact is antidilutive, as calculated under the “if-converted” method.
No t e s t o Con so l i d a t ed F in anc i a l S t a t emen t s ( c o n t i n u e d )
— in millions, except per share data —

– 49 –– 48 –
03 Income Taxes
The provision for income taxes consists of:
2001 2000 1999
Current
United States:
Federal $ 11.3 $ 24.0 $ 6.0
State (.3) 1.8 5.6
Foreign 75.2 86.4 28.9
Total current 86.2 112.2 40.5
Deferred
United States:
Federal (10.4) (9.5) (15.1)
State .4 – ( . 6 )
Foreign (2.8) (8.7) 31.0
Total deferred (12.8) (18.2) 15.3
Total provision $ 73.4 $ 94.0 $ 55.8
A reconciliation between taxes computed at the United States Federal statutory tax rate of 35% and the consolidated effective tax rate is as follows:
2001 2000 1999
Income tax based on statutory rate $ 69.3 $ 92.8 $ 72.0
Increase (decrease) resulting from:
Foreign tax rate differences 3.6 5.0 3.9
State income taxes – 1.2 2.6
Benefit on dissolution (a) – – (15.7)
Tax effect of foreign repatriations (2.3) (1.6) (11.3)
Change in valuation reserve .6 (4.0) 5.0
Other, net 2.2 .6 (.7)
Total provision $ 73.4 $ 94.0 $ 55.8
(a) The Benefit on dissolution of $15.7 represents the one-time tax benefit realized during 1999 related to the dissolution of a non-operating subsidiary.
Deferred income taxes are recorded on temporary differences at the tax rate expected to be in effect when the temporary differences reverse. Temporary
differences, which gave rise to the deferred tax assets at December 31, are as follows:
2001 2000
Current Future Income Tax Benefits
Accrued payroll taxes and insurance $ 19.8 $ 22.4
Employee compensation payable 16.6 13.7
Pension and postretirement benefits 8.5 4.5
Other 30.4 30.0
Valuation allowance (1.5) (1.8)
73.8 68.8
Noncurrent Future Income Tax Benefits
Accrued payroll taxes and insurance 27.4 24.3
Pension and postretirement benefits 27.1 23.0
Net operating losses and other 22.9 23.7
Valuation allowance (26.2) (25.3)
51.2 45.7
Total future tax benefits $ 125.0 $ 114.5
The noncurrent future income tax benefits have been classified as Other assets in the Consolidated Balance Sheets.
The Company has U.S. Federal and foreign net operating loss carryforwards totaling $95.1 that expire as follows: 2002 – $.1, 2003 – $.5, 2004 – $2.6,
2005 – $14.5, 2006 – $12.0, 2007 and thereafter – $25.2 and $40.2 with no expiration. The Company has U.S. State net operating loss carryforwards
totaling $180.2 that expire as follows: 2004 – $71.2, 2005 – $68.2, 2006 – $11.0, 2007 and thereafter – $29.8. The Company has recorded a deferred
tax asset of $43.2 at December 31, 2001, for the benefit of these net operating losses. Realization of this asset is dependent on generating sufficient
taxable income prior to the expiration of the loss carryforwards. A valuation allowance of $24.4 has been recorded at December 31, 2001, as
management believes that realization of certain loss carryforwards is unlikely.
Pretax income of foreign operations was $163.6, $174.8 and $118.8 in 2001, 2000 and 1999, respectively. United States income taxes have not been
provided on unremitted earnings of foreign subsidiaries that are considered to be permanently invested. If such earnings were remitted, foreign tax
credits would substantially offset any resulting United States income tax. At December 31, 2001, the estimated amount of unremitted earnings of the
foreign subsidiaries totaled $722.4.
04 Accounts Receivable Securit izat ion
The Company and certain of its U.S. subsidiaries entered into an agreement (the “Receivables Facility”) in December 1998 with a financial institution
whereby it sells on a continuous basis an undivided interest in all eligible trade accounts receivable. In December 2001, the Company extended the
agreement to expire in December 2002 and the agreement may be extended further with the financial institution’s consent. Pursuant to the
Receivables Facility, the Company formed Ironwood Capital Corporation, a wholly owned, special purpose, bankruptcy-remote subsidiary (“ICC”)
that is fully consolidated in the Company’s financial statements. ICC was formed for the sole purpose of buying and selling receivables generated by
the Company and certain subsidiaries of the Company. Under the Receivables Facility, the Company and certain subsidiaries, irrevocably and without
recourse, transfer all of their accounts receivable to ICC. ICC, in turn, has sold and, subject to certain conditions, may from time to time sell an undi-
vided interest in these receivables and is permitted to receive advances of up to $200.0 for the sale of such undivided interest.
No t e s t o Con so l i d a t ed F in anc i a l S t a t emen t s ( c o n t i n u e d )
— in millions, except per share data —

– 51 –– 50 –
This two-step transaction is accounted for as a sale of receivables under the provisions of SFAS No. 140, “Accounting for Transfers and Servicing of
Financial Assets and Extinguishment of Liabilities.” There was no amount advanced under the Receivables Facility at December 31, 2001. There
was $145.0 advanced under the Receivables Facility at December 31, 2000, and accordingly, that amount of accounts receivable has been removed
from the Consolidated Balance Sheet. Costs associated with the sale of receivables, primarily related to the discount and loss on sale, were $5.3, $9.8
and $9.8 in 2001, 2000 and 1999, respectively, and are included in Other expenses in the Consolidated Statements of Operations.
05 Debt
Information concerning short-term borrowings at December 31, is as follows:
2001 2000
Short-term borrowings $ 10.2 $ 60.7
Weighted-average interest rates 5.0% 6.6%
The Company and some of its foreign subsidiaries maintain lines of credit with foreign financial institutions to meet short-term working capital
needs. Such lines totaled $163.0 at December 31, 2001, of which $152.8 was unused. The Company has no significant compensating balance
requirements or commitment fees related to these lines.
A summary of long-term debt at December 31, is as follows:
2001 2000
Zero-coupon convertible debentures $ 242.7 $ –
Euro denominated notes, at a rate of 5.7% 177.9 188.0
Euro denominated notes, at a rate of 6.3% 133.4 141.0
Commercial paper, maturing within 90 days, at weighted
average interest rates of 2.3% and 7.0%, respectively 57.1 4.6
Revolving credit agreement:
Euro denominated borrowings, at a rate of 4.2% and 5.4%, respectively 86.3 83.7
Yen denominated borrowings, at a rate of .8% and 1.4%, respectively 91.2 54.7
Other 36.0 24.8
824.6 496.8
Less—Current maturities 13.5 5.2
Long-term debt $ 811.1 $ 491.6
Convertible Debentures
During August 2001, the Company issued $435.4 in aggregate principal amount at maturity of unsecured zero-coupon convertible debentures, due
August 17, 2021 (the “Debentures”). These Debentures were issued at a discount to yield an effective interest rate of 3% per year and rank equally with
all existing and future senior unsecured indebtedness of the Company. Gross proceeds of $240.0 were used to repay borrowings under the Company’s
unsecured revolving credit agreement and advances under the Receivables Facility. At December 31, 2001, the unamortized discount was $192.7.
During 2001, $2.7 of the discount was amortized and is included in Interest expense in the Consolidated Statements of Operations. There are no scheduled
cash interest payments associated with the Debentures.
The Debentures are convertible into shares of the Company’s common stock at an initial price of $39.50 per share if the closing price of the Company’s
common stock on the New York Stock Exchange exceeds specified levels, or in certain other circumstances.
The Company may call the Debentures beginning August 17, 2004 for cash at the issue price, plus accreted original issue discount. Holders of the
Debentures may require the Company to purchase the Debentures at the issue price, plus accreted original issue discount, on the first, third, fifth, tenth
and fifteenth anniversary dates. The Company may purchase these Debentures for either cash, the Company’s common stock, or combinations thereof.
Euro Notes
In March 2000, the Company issued K150.0 in unsecured notes due March 2005. Net proceeds of $143.1 from the issuance were used to repay
amounts under the Company’s unsecured revolving credit agreement.
The Company also has K200.0 in unsecured notes due July 2006.
Revolving Credit Agreements
During November 2001, the Company entered into new revolving credit agreements with a syndicate of commercial banks. The new agreements consist of
a $450.0 million five-year revolving credit facility (the “Five-year Facility”) and a $300.0 million 364-day revolving credit facility (the “364-day Facility”).
The revolving credit agreements allow for borrowings in various currencies and up to $100.0 million of the Five-year Facility may be used for the
issuance of standby letters of credit. Outstanding letters of credit totaled $65.5 million and $62.1 million as of December 31, 2001 and 2000,
respectively. Additional borrowings of $449.9 million were available to the Company under these agreements at December 31, 2001.
The interest rate and facility fee on both agreements, and the issuance fee paid for the issuance of letters of credit on the Five-year Facility, vary based
on the Company’s debt rating and borrowing level. Currently, on the Five-year Facility, the interest rate is LIBOR plus .725% and the facility and
issuance fees are .15% and .725%, respectively. On the 364-day Facility, the interest rate is LIBOR plus .75% and the facility fee is .125%. The Five-year
Facility expires in November 2006. The 364-day Facility expires in November 2002.
The agreements require, among other things, that the Company comply with a maximum Debt-to-EBITDA ratio and a minimum fixed charge ratio.
Borrowings of $57.1 were outstanding under the company’s U.S. commercial paper program. Commercial paper borrowings, which are backed by the
Five-year Facility, have been classified as long-term debt due to the availability to refinance them on a long-term basis under this facility.
Interest Rate Swaps
During April 2001, the Company entered into a Yen denominated interest rate swap agreement with a notional value of ¥4,150.0 ($31.5) to fix a
portion of its Yen denominated variable rate borrowings at .8%, which expires in 2006. In addition, during June 2000, the Company entered into
various interest rate swap agreements in order to fix its interest costs on a portion of its Euro and Yen denominated variable rate borrowings.
The Euro interest rate swap agreements have a notional value of K100.0 ($89.0) which fix the interest rate, on a weighted-average basis, at 5.7% and
expire in 2010. The Yen interest rate swap agreement has a notional value of ¥4,000.0 ($30.3) which fixes the interest rate at .9% and expires in 2003.
These swap agreements have had an immaterial impact on the recorded interest expense during the years ended December 31, 2001 and 2000.
The Company also had an interest rate swap agreement that expired in January 2001. This agreement fixed the interest rate at 6.0% on $50.0 of the
Company’s U.S. Dollar-based borrowings and it had an immaterial impact on the recorded interest expense during the years ended December 31,
2001, 2000 and 1999.
No t e s t o Con so l i d a t ed F in anc i a l S t a t emen t s ( c o n t i n u e d )
— in millions, except per share data —

– 53 –– 52 –
Fair Value of Debt
Due to the availability of long-term financing, commercial paper borrowings have been classified as Long-term debt. The carrying value of Long-term
debt approximates fair value, except for the Euro denominated notes and the Debentures, which had a fair value at December 31, as follows:
2001 2000
Euro denominated notes $ 312.4 $ 327.6
Zero-coupon convertible debentures 255.0 –
Debt Maturities
The maturities of long-term debt payable within each of the four years subsequent to December 31, 2002 are as follows: 2003 – $6.5, 2004 – $8.6,
2005 – $135.1 and 2006 – $413.5 and thereafter – $247.4.
06 Stock Compensation Plans
The Company accounts for all of its fixed stock option plans and the 1990 Employee Stock Purchase Plan in accordance with APB Opinion No. 25 and
related Interpretations. Accordingly, no compensation cost related to these plans was charged against earnings in 2001, 2000, and 1999. Had the
Company determined compensation cost consistent with the method of SFAS No. 123, the Company’s Net earnings and Net earnings per share would
have been reduced to the pro forma amounts indicated as follows:
2001 2000 1999
Net earnings:
As reported $ 124.5 $ 171.2 $ 150.0
Pro forma 119.4 167.9 146.4
Net earnings per share:
As reported $ 1.64 $ 2.26 $ 1.94
Pro forma 1.58 2.22 1.90
Net earnings per share – diluted:
As reported $ 1.62 $ 2.22 $ 1.91
Pro forma 1.56 2.18 1.86
The fair value of each option grant is estimated on the date of grant using the Black-Scholes option-pricing model with the following weighted-average
assumptions used for grants in 2001, 2000 and 1999, respectively: risk-free interest rates of 4.6%, 5.8% and 5.6%; expected volatility of 17.7%,
19.2% and 17.2%; dividend yield of .5% in all years; and expected lives of 7.2 years, 5.8 years and 7.6 years. The weighted-average fair value of
options granted was $7.16, $6.46 and $6.16 in 2001, 2000 and 1999, respectively.
Fixed Stock Option Plans
The Company has reserved 11,375,000 shares of common stock for issuance under the Executive Stock Option and Restricted Stock Plans. Under the plans,
all full-time employees of the Company and non-employee directors are eligible to receive stock options, stock appreciation rights, cash equivalent
rights, purchase rights and restricted stock.
The options, rights and stock are granted to eligible employees at the discretion of a committee appointed by the Board of Directors. All options have
generally been granted at a price equal to the fair market value of the Company’s common stock at the date of grant. The purchase price per share
pursuant to a stock appreciation right is determined by the committee. The committee also determines the period during which options and rights are
exercisable. Generally, options are granted with a vesting period of up to five years and expire ten years from the date of grant. As of December 31,
2001, no stock appreciation rights, cash equivalent rights or purchase rights were outstanding.
All non-employee directors of the Company may receive an option to purchase shares of the Company’s common stock in lieu of cash compensation.
The number of shares covered by the option is determined pursuant to a formula set forth in the plan. The directors also receive an annual option grant
as additional compensation for service. The per share purchase price for each option awarded is equal to the fair market value of the Company’s common
stock at the date of grant. Options are exercisable for the vested portion during the director’s tenure and a limited period thereafter.
The value of restricted stock granted under the plans is charged to equity and amortized to expense over the restriction period. There were 24,301 and
10,000 restricted shares granted during 2001 and 2000, respectively. As of December 31, 2001 there were 30,301 restricted shares not vested.
The Company has reserved 698,398 shares of common stock for issuance under the 1991 Directors Stock Option Plan. The Company no longer grants
options under this plan.
The Company also has the Savings Related Share Option Scheme for United Kingdom employees with at least one year of service. The employees are
offered the opportunity to obtain an option for a specified number of shares of common stock at not less than 85% of their market value on the day
prior to the offer to participate in the plan. Options vest after either 3, 5, or 7 years, but may lapse earlier. Funds used to purchase the shares are
accumulated through specified payroll deductions over a 60-month period.
Information related to options outstanding under the plans, and the related weighted-average exercise prices, is as follows:
2001 2000 1999
shares (000) price shares (000) price shares (000) price
Options outstanding, beginning of period 5,341 $ 25 4,371 $ 23 3,840 $ 21
Granted 722 31 1,385 30 1,119 26
Exercised (357) 16 (279) 19 (496) 17
Expired or cancelled (269) 28 (136) 32 (92) 25
Options outstanding, end of period 5,437 $ 26 5,341 $ 25 4,371 $ 23
Options exercisable, end of period 3,280 $ 24 2,268 $ 21 2,055 $ 20
Options outstanding as of December 31, 2001 are as follows:
options outstanding options exercisable
weighted -average
remaining weighted - weighted -contractual average average
exercise prices shares (000) life exercise price shares (000) exercise price
$10-$20 1,126 2.1 $ 16 1,126 $ 16
21-25 1,316 7.0 23 897 23
26-30 1,767 8.3 29 695 28
31-41 1,228 7.4 34 562 35
5,437 6.5 $ 26 3,280 $ 24
Other Stock Plans
The Company has reserved 2,250,000 shares of common stock for issuance under the 1990 Employee Stock Purchase Plan. Under the plan, designated
Manpower employees meeting certain service requirements may purchase shares of the Company’s common stock through payroll deductions. These
shares may be purchased at the lesser of 85% of their fair market value at the beginning or end of each year. During 2001, 2000 and 1999, 67,000,
80,000 and 138,500 shares, respectively, were purchased under the plan.
No t e s t o Con so l i d a t ed F in anc i a l S t a t emen t s ( c o n t i n u e d )
— in millions, except per share data —

– 55 –– 54 –
07 Retirement Plans
Defined benefit plans
The Company sponsors several qualified and nonqualified pension plans covering substantially all permanent employees. The reconciliation of the
changes in the plans’ benefit obligations and the fair value of plan assets and the statement of the funded status of the plans are as follows:
u.s. plans non-u.s. plans
2001 2000 2001 2000
Change in Benefit Obligation
Benefit obligation, beginning of year $ 43.3 $ 38.2 $ 60.1 $ 58.2
Service cost .2 .4 3.2 4.1
Interest cost 3.0 3.0 3.3 3.0
Curtailment loss – 3.7 – –
Actuarial (gain) loss (2.5) .8 5.6 .5
Plan participant contributions – – .7 1.0
Benefits paid (3.3) (2.8) (2.8) (1.9)
Currency exchange rate changes – – (2.6) (4.8)
Benefit obligation, end of year $ 40.7 $ 43.3 $ 67.5 $ 60.1
Change in Plan Assets
Fair value of plan assets, beginning of year $ 30.4 $ 30.9 $ 51.0 $ 53.4
Actual return on plan assets 4.1 .7 (2.9) (.1)
Plan participant contributions – – .7 .9
Company contributions 1.7 1.6 3.4 3.0
Benefits paid (3.3) (2.8) (2.8) (1.9)
Currency exchange rate changes – – (2.1) (4.3)
Fair value of plan assets, end of year $ 32.9 $ 30.4 $ 47.3 $ 51.0
Funded Status
Funded status of plan $ (7.8) $ (12.9) $ (20.2) $ (9.1)
Unrecognized net (gain) loss (11.4) (8.2) 19.7 8.9
Unrecognized prior service cost – – .3 .3
Unrecognized transitional asset (.3) (.4) .1 .1
Net amount recognized $ (19.5) $ (21.5) $ (.1) $ .2
Amounts Recognized
Prepaid benefit cost $ – $ – $ – $ 3.5
Accrued benefit liability (19.8) (21.5) (11.7) (3.3)
Intangible asset – – .5 –
Accumulated other comprehensive loss .3 – 11.1 –
Net amount recognized $ (19.5) $ (21.5) $ (.1) $ .2
The accumulated benefit obligation exceeded the fair value of plan assets for one of the U.S. defined benefit pension plans and two of the Non-U.S.
defined benefit plans at December 31, 2001.
The components of the net periodic benefit cost for all plans are as follows:
2001 2000 1999
Service cost $ 3.4 $ 4.5 $ 5.6
Interest cost 6.3 6.0 5.1
Expected return on assets (5.5) (5.7) (5.0)
Amortization of:
unrecognized (gain) loss (.7) (.1) .1
unrecognized transitional asset (.2) (.2) (.2)
Curtailment loss – 3.7 –
Special termination benefits – – 8.0
Total benefit cost $ 3.3 $ 8.2 $ 13.6
The weighted-average assumptions used in the measurement of the benefit obligation are as follows:
u.s. plans non-u.s. plans
2001 2000 2001 2000
Discount rate 7.5% 7.5% 5.4% 5.6%
Expected return on assets 8.5% 8.5% 6.1% 6.7%
Rate of compensation increase 6.0% 6.0% 4.1% 4.2%
Projected salary levels utilized in the determination of the projected benefit obligation for the pension plans are based upon historical experience. The
unrecognized transitional asset is being amortized over the estimated remaining service lives of the employees. Plan assets are primarily comprised
of common stocks and U.S. government and agency securities.
In April 1999, the Company amended a U.S. plan to allow for special termination benefits related to senior executives. This amendment resulted in
a one-time expense of $8.0 in 1999.
Retiree Health Care Plan
The Company provides medical and dental benefits to certain eligible retired employees in the United States. Due to the nature of the plan, there are
no plan assets. The reconciliation of the changes in the plan’s benefit obligation and the statement of the funded status of the plan are as follows:
2001 2000
Benefit obligation, beginning of year $ 22.5 $ 26.6
Service cost .4 .7
Interest cost 1.3 1.7
Actuarial gain (2.5) (1.1)
Benefits paid (1.2) (1.3)
Curtailment gain – (4.1)
Benefit obligation, end of year 20.5 22.5
Unrecognized net gain 8.2 5.9
Accrued liability recognized $ 28.7 $ 28.4
No t e s t o Con so l i d a t ed F in anc i a l S t a t emen t s ( c o n t i n u e d )
— in millions, except per share data —
– 57 –– 56 –
The discount rate used in the measurement of the benefit obligation was 7.5% in both 2001 and 2000. The components of net periodic benefit cost
(gain) for this plan are as follows:
2001 2000 1999
Service cost $ .4 $ .7 $ 2.4
Interest cost 1.3 1.7 1.9
Amortization of unrecognized gain (.9) (.3) –
Curtailment gain – (4.1) –
$ .8 $ (2.0) $ 4.3
The health care cost trend rate was assumed to be 12.0% for 2001, decreasing gradually to 5.5% for the years 2009 and beyond. Assumed health care
cost trend rates have a significant effect on the amounts reported. A one-percentage point change in the assumed health care cost trend rate would have
the following effects:
1% increase 1% decrease
Effect on total of service and interest cost components $ .2 $ (.2)
Effect on postretirement benefit obligation 2.8 (2.5)
Curtailments
On February 29, 2000, the Company froze all benefits in each of its U.S. defined benefit pension plans. The Company also offered a voluntary early
retirement package and certain other benefits to eligible employees. These benefits are expected to be paid from the respective defined benefit pension
plans. In addition, the Company no longer provides medical and dental benefits under its U.S. retiree health care plan to certain employees retiring
after March 1, 2000. The net impact of these plan changes was not material to the Consolidated Financial Statements.
Defined Contribution Plans
The Company has defined contribution plans covering substantially all permanent U.S. employees. Under the plans, employees may elect to
contribute a portion of their salary to the plans. Effective January 1, 2000, the Company amended its defined contribution plans to include a mandatory
matching contribution. In addition, profit sharing contributions are made if a targeted earnings level is reached in the U.S. The total expense was $2.9,
$3.2 and $.4 for 2001, 2000 and 1999, respectively. As of December 31, 2001, less than 3% of the plans’ assets were invested in the Company’s stock.
08 Leases
The Company leases property and equipment primarily under operating leases. Renewal options exist for substantially all leases.
Future minimum payments, by year and in the aggregate, under noncancelable operating leases with initial or remaining terms of one year or more
consist of the following at December 31, 2001:
year
2002 $ 67.5
2003 55.2
2004 40.2
2005 31.1
2006 22.9
Thereafter 48.0
Total minimum lease payments $ 264.9
Rental expense for all operating leases was $136.6, $118.0 and $108.5 for the years ended December 31, 2001, 2000 and 1999, respectively.
09 Interest and Other Expense
Interest and other expense consists of the following:
2001 2000 1999
Interest expense $ 39.1 $ 35.0 $ 17.3
Interest income (10.3) (7.3) (8.0)
Foreign exchange losses .2 2.3 1.9
Loss on sale of accounts receivable 5.3 9.8 9.8
Miscellaneous, net 5.4 6.0 3.8
Interest and other expense $ 39.7 $ 45.8 $ 24.8
10 Acquisit ions of Businesses
In July 2001, the Company acquired Jefferson Wells International, Inc. (“Jefferson Wells”), a professional services provider of internal audit, accounting,
technology and tax services, for total consideration of approximately $174.0 million, including assumed debt. The acquisition of Jefferson Wells was
originally financed through the Company’s existing credit facilities. Jefferson Wells operates a network of offices throughout the United States
and Canada. Approximately $153.4 was recorded as goodwill. No other significant intangible assets were recorded.
In January 2000, the Company acquired Elan Group Ltd. (“Elan”), a European specialty IT staffing company with significant operations in the U.K.
and ten other countries throughout the world. The total consideration paid for Elan was approximately $146.2, the remaining $30.0 of which was paid
during 2001. This transaction was accounted for as a purchase, and the excess of the purchase price over the fair value of net assets acquired was recorded
as goodwill.
From time to time, the Company acquires and invests in companies throughout the world. The total consideration paid for such transactions, excluding
the acquisitions of Jefferson Wells and Elan, was $95.8, $56.2 and $18.8 in 2001, 2000 and 1999, respectively, the majority of which was recorded
as goodwill.
11 Derivative Financial Instruments
On January 1, 2001, the Company adopted SFAS No. 133, as amended. As a result of adopting the Statements, the Company recognized the fair
value of all derivative contracts as a net liability of $3.4 on the Consolidated Balance Sheets at January 1, 2001. This amount was recorded as an
adjustment to Shareholders’ equity through Accumulated other comprehensive income (loss). There was no impact on Net earnings.
The Company enters into various derivative financial instruments to manage certain of its foreign currency exchange rate and interest rate risks.
The Company does not use derivative financial instruments for trading or speculative purposes.
No t e s t o Con so l i d a t ed F in anc i a l S t a t emen t s ( c o n t i n u e d )
— in millions, except per share data —
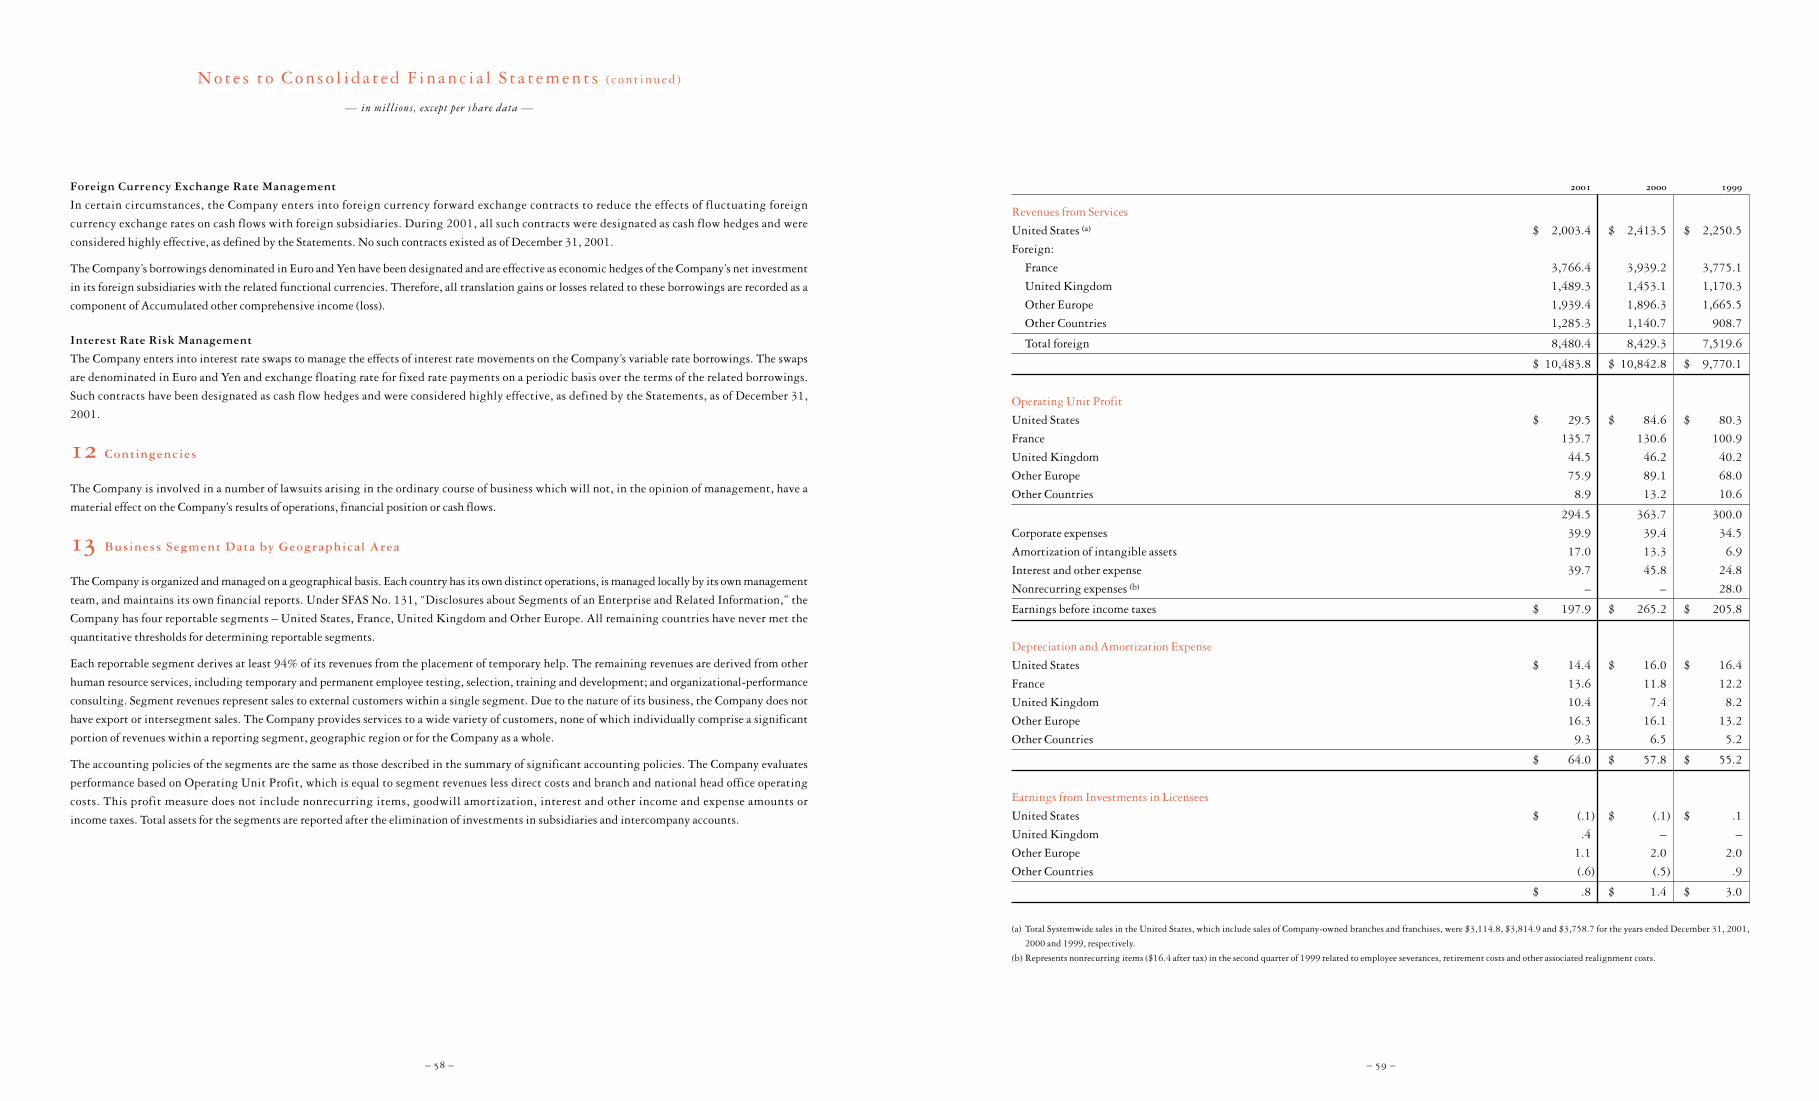
– 59 –– 58 –
Foreign Currency Exchange Rate Management
In certain circumstances, the Company enters into foreign currency forward exchange contracts to reduce the effects of fluctuating foreign
currency exchange rates on cash flows with foreign subsidiaries. During 2001, all such contracts were designated as cash flow hedges and were
considered highly effective, as defined by the Statements. No such contracts existed as of December 31, 2001.
The Company’s borrowings denominated in Euro and Yen have been designated and are effective as economic hedges of the Company’s net investment
in its foreign subsidiaries with the related functional currencies. Therefore, all translation gains or losses related to these borrowings are recorded as a
component of Accumulated other comprehensive income (loss).
Interest Rate Risk Management
The Company enters into interest rate swaps to manage the effects of interest rate movements on the Company’s variable rate borrowings. The swaps
are denominated in Euro and Yen and exchange floating rate for fixed rate payments on a periodic basis over the terms of the related borrowings.
Such contracts have been designated as cash flow hedges and were considered highly effective, as defined by the Statements, as of December 31,
2001.
12 Contingencies
The Company is involved in a number of lawsuits arising in the ordinary course of business which will not, in the opinion of management, have a
material effect on the Company’s results of operations, financial position or cash flows.
13 Business Segment Data by Geographical Area
The Company is organized and managed on a geographical basis. Each country has its own distinct operations, is managed locally by its own management
team, and maintains its own financial reports. Under SFAS No. 131, “Disclosures about Segments of an Enterprise and Related Information,” the
Company has four reportable segments – United States, France, United Kingdom and Other Europe. All remaining countries have never met the
quantitative thresholds for determining reportable segments.
Each reportable segment derives at least 94% of its revenues from the placement of temporary help. The remaining revenues are derived from other
human resource services, including temporary and permanent employee testing, selection, training and development; and organizational-performance
consulting. Segment revenues represent sales to external customers within a single segment. Due to the nature of its business, the Company does not
have export or intersegment sales. The Company provides services to a wide variety of customers, none of which individually comprise a significant
portion of revenues within a reporting segment, geographic region or for the Company as a whole.
The accounting policies of the segments are the same as those described in the summary of significant accounting policies. The Company evaluates
performance based on Operating Unit Profit, which is equal to segment revenues less direct costs and branch and national head office operating
costs. This profit measure does not include nonrecurring items, goodwill amortization, interest and other income and expense amounts or
income taxes. Total assets for the segments are reported after the elimination of investments in subsidiaries and intercompany accounts.
2001 2000 1999
Revenues from Services
United States (a) $ 2,003.4 $ 2,413.5 $ 2,250.5
Foreign:
France 3,766.4 3,939.2 3,775.1
United Kingdom 1,489.3 1,453.1 1,170.3
Other Europe 1,939.4 1,896.3 1,665.5
Other Countries 1,285.3 1,140.7 908.7
Total foreign 8,480.4 8,429.3 7,519.6
$ 10,483.8 $ 10,842.8 $ 9,770.1
Operating Unit Profit
United States $ 29.5 $ 84.6 $ 80.3
France 135.7 130.6 100.9
United Kingdom 44.5 46.2 40.2
Other Europe 75.9 89.1 68.0
Other Countries 8.9 13.2 10.6
294.5 363.7 300.0
Corporate expenses 39.9 39.4 34.5
Amortization of intangible assets 17.0 13.3 6.9
Interest and other expense 39.7 45.8 24.8
Nonrecurring expenses (b) – – 28.0
Earnings before income taxes $ 197.9 $ 265.2 $ 205.8
Depreciation and Amortization Expense
United States $ 14.4 $ 16.0 $ 16.4
France 13.6 11.8 12.2
United Kingdom 10.4 7.4 8.2
Other Europe 16.3 16.1 13.2
Other Countries 9.3 6.5 5.2
$ 64.0 $ 57.8 $ 55.2
Earnings from Investments in Licensees
United States $ (.1) $ (.1) $ .1
United Kingdom .4 – –
Other Europe 1.1 2.0 2.0
Other Countries (.6) (.5) .9
$ .8 $ 1.4 $ 3.0
(a) Total Systemwide sales in the United States, which include sales of Company-owned branches and franchises, were $3,114.8, $3,814.9 and $3,758.7 for the years ended December 31, 2001,
2000 and 1999, respectively.
(b) Represents nonrecurring items ($16.4 after tax) in the second quarter of 1999 related to employee severances, retirement costs and other associated realignment costs.
No t e s t o Con so l i d a t ed F in anc i a l S t a t emen t s ( c o n t i n u e d )
— in millions, except per share data —

– 61 –– 60 –
2001 2000 1999
Total Assets
United States $ 644.5 $ 384.8 $ 364.4
France 1,017.5 1,204.6 1,140.0
United Kingdom 455.2 438.8 269.9
Other Europe 589.3 674.1 609.7
Other Countries 423.6 255.1 250.5
Corporate (a) 108.5 84.2 84.2
$ 3,238.6 $ 3,041.6 $ 2,718.7
Investments in Licensees
United States $ .4 $ .6 $ .9
United Kingdom .6 – –
Other Europe 37.6 38.5 34.0
Other Countries 6.1 2.7 2.1
$ 44.7 $ 41.8 $ 37.0
Long-Lived Assets
United States $ 48.4 $ 40.1 $ 44.2
Foreign:
France 63.8 57.6 51.4
United Kingdom 33.2 30.7 26.2
Other Europe 44.0 57.7 47.9
Other Countries 31.1 17.6 19.7
Total foreign 172.1 163.6 145.2
Corporate (a) .6 1.3 2.1
$ 221.1 $ 205.0 $ 191.5
Additions to Long-Lived Assets
United States $ 25.9 $ 15.0 $ 16.7
France 24.2 22.2 16.9
United Kingdom 11.3 9.7 4.9
Other Europe 16.4 22.2 27.4
Other Countries 10.9 15.0 10.0
Corporate (a) .2 .7 1.0
$ 88.9 $ 84.8 $ 76.9
(a) Corporate assets include assets that are not used in the operations of any geographical segment.
first second third fourthquarter quarter quarter quarter total
Year Ended December 31, 2001
Revenues from services $ 2,651.9 $ 2,620.1 $ 2,675.4 $ 2,536.4 $ 10,483.8
Gross profit 483.9 489.1 504.6 478.9 1,956.5
Net earnings 26.8 34.6 37.1 26.0 124.5
Net earnings per share $ .35 $ .46 $ .49 $ .34 $ 1.64
Net earnings per share – diluted $ .35 $ .45 $ .48 $ .34 $ 1.62
Dividends per share $ – $ .10 $ – $ .10 $ .20
Market price:
High $ 37.56 $ 35.77 $ 32.71 $ 34.68
Low 27.95 27.57 24.35 25.00
Year Ended December 31, 2000
Revenues from services $ 2,568.3 $ 2,714.1 $ 2,820.9 $ 2,739.5 $ 10,842.8
Gross profit 446.0 477.8 507.4 515.5 1,946.7
Net earnings 25.6 38.0 54.1 53.5 171.2
Net earnings per share $ .34 $ .50 $ .71 $ .71 $ 2.26
Net earnings per share – diluted $ .33 $ .49 $ .70 $ .70 $ 2.22
Dividends per share $ – $ .10 $ – $ .10 $ .20
Market price:
High $ 36.81 $ 39.81 $ 39.50 $ 38.75
Low 26.75 30.63 30.63 28.69
No t e s t o Con so l i d a t ed F in anc i a l S t a t emen t s ( c o n t i n u e d )
— in millions, except per share data —
Quar t e r l y Da t a ( u n a u d i t e d )
— in millions, except per share data —

– 63 –– 62 –
as of and for the year ended december 31 2001 2000 1999 1998 1997
Operations Data
Revenues from services $ 10,483.8 $ 10,842.8 $ 9,770.1 $ 8,814.3 $ 7,258.5
Gross profit 1,956.5 1,946.7 1,704.9 1,503.0 1,310.2
Write-down of capitalized software – – – (92.1) –
Operating profit 237.6 311.0 230.6 130.4 255.4
Net earnings 124.5 171.2 150.0 75.7 163.9
Per Share Data
Net earnings $ 1.64 $ 2.26 $ 1.94 $ .94 $ 2.01
Net earnings – diluted 1.62 2.22 1.91 .93 1.97
Dividends .20 .20 .20 .19 .17
Balance Sheet Data
Total assets $ 3,238.6 $ 3,041.6 $ 2,718.7 $ 2,391.7 $ 2,047.0
Long-term debt 811.1 491.6 357.5 154.6 189.8
The Notes to Consolidated Financial Statements should be read in conjunction with the above summary.
S e l e c t ed F in anc i a l Da t a
— in millions, except per share data —
World Headquarters
P.O. Box 2053
5301 N. Ironwood Rd.
Milwaukee, WI 53201
414 .961.1000
www.manpower.com
Transfer Agent and Registrar
Mellon Investor Services LLC
P.O. Box 3315
South Hackensack, NJ 07606
www.mellon-investor.com
Stock Exchange Listing
NYSE Symbol: MAN
10-K Report
A copy of Form 10-K filed with the Securities
and Exchange Commission for the year ended
December 31, 2001 is available without
charge after March 31, 2002 by writing to:
Michael J. Van Handel
Manpower Inc.
P.O. Box 2053
5301 N. Ironwood Rd.
Milwaukee, WI 53201
Annual Meeting of Shareholders
April 30, 2002
10:00 a.m.
Marcus Center for the Performing Arts
929 N. Water St.
Milwaukee, WI 53202
Shareholders
As of February 28, 2002, Manpower Inc.
common stock was held by 7,438
record holders.
Directors
Jeffrey A. Joerres
Chairman, CEO & President
Manpower Inc.
J. Thomas Bouchard
Retired Senior Vice President,
Human Resources
IBM
Willie D. Davis
President
All Pro Broadcasting Inc.
Dudley J. Godfrey, Jr.
Senior Partner
Godfrey & Kahn, S.C.
Marvin B. Goodman
Retired shareholder and officer of Manpower
Services (Toronto) Limited, formerly a
Company franchise
J. Ira Harris
Chairman of J.I. Harris & Associates and
Vice Chairman of The Pritzker
Organization, L.L.C.
Terry A. Hueneke
Retired Executive Vice President
Manpower Inc.
Rozanne L. Ridgway
Former Assistant Secretary of State
for Europe and Canada
Dennis Stevenson
Chairman of HBOS plc and Pearson plc
John R. Walter
Retired President and COO of AT&T Corp.
Former Chairman, President & CEO
R.R. Donnelley & Sons
Edward J. Zore
President & CEO
Northwestern Mutual
Officers
Jeffrey A. Joerres
Chairman, CEO & President
Michael J. Van Handel
Senior Vice President &
Chief Financial Officer
Executive Management
Yoav Michaely
Senior Vice President
Europe, Middle East and Africa
(Excluding France)
Bertrand Denis
Managing Director
France & Region
Barbara J. Beck
Executive Vice President
United States & Canadian Operations
Dominique Turcq
Senior Vice President
Strategic Planning
Tammy Johns
Vice President
Global Sales
Michael Lynch
Vice President
International Support and General Counsel
David Arkless
Senior Vice President
Manpower Inc. and
Chief Executive
The Empower Group
Don Bobo
President and CEO
Jefferson Wells International
Co rpo r a t e I n f o rma t i on
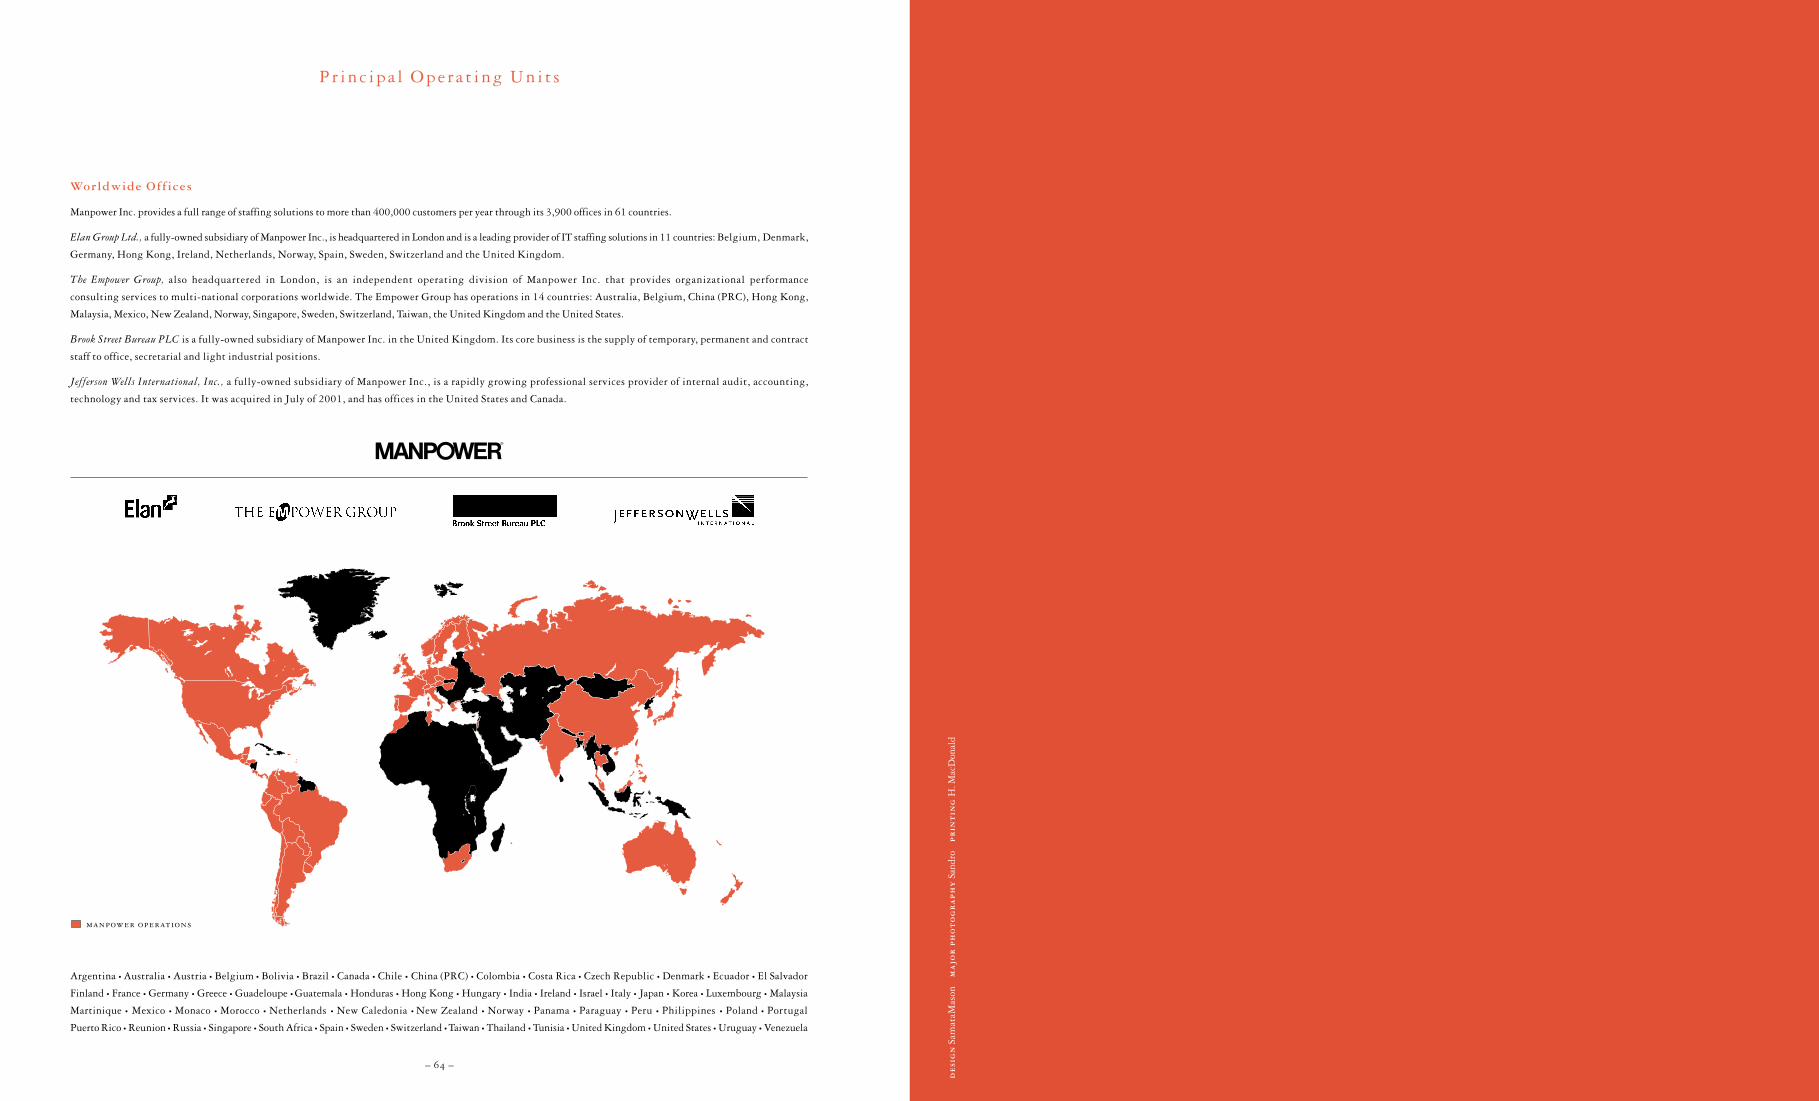
de
sig
nSa
mat
aMas
onm
ajo
r p
ho
to
gr
ap
hy
Sand
rop
rin
tin
gH
. Mac
Don
ald
– 64 –
Argentina • Australia • Austria • Belgium • Bolivia • Brazil • Canada • Chile • China (PRC) • Colombia • Costa Rica • Czech Republic • Denmark • Ecuador • El Salvador
Finland • France • Germany • Greece • Guadeloupe • Guatemala • Honduras • Hong Kong • Hungary • India • Ireland • Israel • Italy • Japan • Korea • Luxembourg • Malaysia
Martinique • Mexico • Monaco • Morocco • Netherlands • New Caledonia • New Zealand • Norway • Panama • Paraguay • Peru • Philippines • Poland • Portugal
Puerto Rico • Reunion • Russia • Singapore • South Africa • Spain • Sweden • Switzerland • Taiwan • Thailand • Tunisia • United Kingdom • United States • Uruguay • Venezuela
Worldwide Off ices
Manpower Inc. provides a full range of staffing solutions to more than 400,000 customers per year through its 3,900 offices in 61 countries.
Elan Group Ltd., a fully-owned subsidiary of Manpower Inc., is headquartered in London and is a leading provider of IT staffing solutions in 11 countries: Belgium, Denmark,
Germany, Hong Kong, Ireland, Netherlands, Norway, Spain, Sweden, Switzerland and the United Kingdom.
The Empower Group, also headquartered in London, is an independent operating division of Manpower Inc. that provides organizational performance
consulting services to multi-national corporations worldwide. The Empower Group has operations in 14 countries: Australia, Belgium, China (PRC), Hong Kong,
Malaysia, Mexico, New Zealand, Norway, Singapore, Sweden, Switzerland, Taiwan, the United Kingdom and the United States.
Brook Street Bureau PLC is a fully-owned subsidiary of Manpower Inc. in the United Kingdom. Its core business is the supply of temporary, permanent and contract
staff to office, secretarial and light industrial positions.
Jefferson Wells International, Inc., a fully-owned subsidiary of Manpower Inc., is a rapidly growing professional services provider of internal audit, accounting,
technology and tax services. It was acquired in July of 2001, and has offices in the United States and Canada.
P r i n c ip a l Ope r a t i ng Un i t s
manpower operations

P.O. Box 2053
5301 N. Ironwood Rd.
Milwaukee, WI 53201
414.961.1000
www.manpower.com
A R -105 (3/02) ©2002 Manpower Inc.