Embed Size (px)
Citation preview

People. Solutions. Value.
Manpower Inc. 1999 Annual Report

Table of Contents page
Letter to Shareholders 2
People. 6
Solutions. 12
Value. 16
Management Discussion and Analysis of 20Financial Condition and Results of Operations
Report of Independent Public Accountants 28
Consolidated Financial Statements 29
Notes to Consolidated Financial Statements 34
Corporate Information 47
Principal Operating Units 48
Financial Highlights
(a) Represents total sales of Company-owned branches and franchises.
(b) For 1999, Operating Margin does not include the $28.0 of nonrecurring items, related to employee severances, retirement costs and
other associated realignment costs. For 1998, Operating Margin does not include the $92.1 million write-down of capitalized software.
Year ’95 ’97’96 ’98 ’99
Operating Margin (b)(in millions of U.S. dollars)
300
240
180
120
60
Year ’95 ’97’96 ’98 ’99
Revenues(in millions of U.S. dollars)
10,000
8,000
6,000
4,000
2,000
Year ’95 ’97’96 ’98 ’99
Systemwide Sales (a)(in millions of U.S. dollars)
12,500
10,000
7,500
5,000
2,500

1
Company Profile
Manpower is a world leader in staffing and workforce management solutions, serving more than 400,000
customers around the globe and distinguished by a series of significant strengths. We are the leading global
staffing brand, a name that stands for quality, service and innovation to employers and employees
worldwide. We have geographic diversification, meeting customer needs through a network spanning
almost 3,400 offices in 52 countries. We have a vast and growing employee base, currently comprised of
2.1 million skilled people. We offer a diversified service mix, including office, industrial, professional and call
center resources and expertise. And we provide a broad range of proprietary assessment, selection and
training programs that give us the industry’s highest-quality service delivery system.
People are what we’re about. Solutions set us apart. And that combination is how we deliver
value — to our customers, our employees and our shareholders.

2
To Our Shareholders
The year 1999 was one of significant and meaningful progress at Manpower. Throughout the year,
our mission was simple: to execute our plan with urgency and improve profitability. Here’s our scorecard.
Systemwide sales increased to $11.5 billion, with all of the nearly $1 billion increase coming from
organic growth. This growth has strengthened our position as the most recognized global brand in the
industry, and was achieved with a watchful eye on profitability. Operating margin reached a record
$258.7 million, up 16 percent from 1998.
In sum, we set and achieved several aggressive goals. As we enter 2000, we are advancing in all
geographies with a clear purpose and intense energy, supported by the strength, depth and continuity of our
office network that allows us to set the bar high and have the confidence to achieve. Our vision of being the
pre-eminent global provider of higher-value workforce management services and solutions is unlocking
additional value for our shareholders and further securing
our place as the thought leader in the staffing industry.
Achieving our financial goals begins with our
brand, the leading “name” in the industry. In a world that is
moving at web speed and creating new companies through
mergers, acquisitions and quick start ups, it is my firm belief
that great brands will win. Winning, of course, is based on
opportunity and execution. And both of those exist for us.
The tightness of the labor market in virtually
all of the 52 countries in which we operate is imposing
a considerable challenge on the business world. The
combination of a strong global economy, mounting
competition and advancing technology have created both a critical shortage of skilled workers and the need
for businesses to operate efficiently, productively and as flexibly as possible. These global developments
are driving a growing demand for the staffing services that Manpower provides.
Jeffrey A. JoerresPresident & Chief Executive Officer

3
But structural changes are taking place in our industry as well. Our customers, and businesses in
general, are asking for a staffing firm to supply more than just people for seasonal or short-term
assignments. They need staffing partners to identify and
implement effective workforce solutions directed at their
strategic objectives. This is the value Manpower can deliver
today to more than 400,000 customers worldwide and it is
the market position we intend to own going forward.
It is this need for flexible staffing solutions that will
drive our revenue growth — a key element in our future success. This growth, however, must be in the right
geographies, the right industries and with companies where the opportunities are greatest to deliver higher-
value services and solutions.
This focus was exemplified in 1999 by the expansion of our office network. We opened more than
200 offices in high-potential markets, and our investments are paying off handsomely. Germany, Italy and
Spain are just a few examples of our aggressive office openings. In Germany, we grew revenues organically
at an impressive 28 percent rate — well above the growth rate for the German market overall — and brought
even greater gains to the bottom line. And nowhere in our network is there a better example of margin
improvement than in France. Here, we achieved substantial improvements in gross margin while maintaining
our market position.
Technology is also a major focus for us. The Internet opens up vast opportunities to advance
our offerings and further add to the Manpower brand. We have already put in place several e-commerce
applications — from the Global Learning Center, which delivers e-training and development to our
employees, to UltraSource™, a leading–edge web–based order management system for our customers.
These two applications are only a few examples of what we already have, and only the beginning of
the e-commerce solutions we will offer our customers, as we are committed to “e-thinking” every aspect
of our business.
Our vision of being the pre-eminent global
provider of higher-value workforce manage-
ment services and solutions is unlocking
additional value for our shareholders and
further securing our place as the thought
leader in the staffing industry.

4
Improving our efficiency is a key element to enhancing shareholder value. There is tremendous
leverage opportunity in Manpower, with even a modest increase in productivity translating into gains in value
for our customers and shareholders. And we are looking for much more than modest productivity
improvements. We are looking at every element of our business, from the service desk to the corporate
headquarters, to improve our processes and streamline service delivery. Efficiency, however, does not
mean simply cutting costs or constraining investment. In the year 2000, we expect to increase our
capital expenditures to invest in the right opportunities for Manpower’s long-term growth.
We are also advancing more aggressively in the professional and specialty staffing business.
Our target: to make professional and specialty services account for a third of our revenue over the next five
years. To that end, we re-branded Manpower® Technical, our former U.S. specialty business, as Manpower®
Professional and reorganized this group to capitalize on our unique offerings and exceed the expectations
of our customers. Today, Manpower Professional is our fastest growing business unit in the U.S., achieving
12 percent sales growth in 1999.
We have also looked to strengthen our position in the specialty staffing area in Europe with the
strategic acquisition of Elan Group Ltd. in the United Kingdom. Beyond positioning the combined company
as the United Kingdom’s IT staffing leader, the acquisition creates a firm foothold for expansion throughout
continental Europe under the Elan brand.
Acquisitions are an element of our plan, but we are not interested in buying revenues, earnings
and the integration issues that size-driven acquisitions can entail. Our goal is straightforward: to identify and
pursue opportunities that have the potential to energize and
enrich our current business. Our organic growth model will
remain our focus, but we are open to strategic acquisitions
that will add value for our customers and our shareholders.
In a world that is moving at web speed and
creating new companies through mergers,
acquisitions and quick start ups, it is my firm
belief that great brands will win. Winning,
of course, is based on opportunity and
execution. And both of those exist for us.
5
Great things happen when — and only when —
an organization’s interests are aligned with those of its
customers and its shareholders, and at Manpower our
objectives are aligned. Today, across our company, a
common understanding is shared of what Manpower is trying to do and how each individual can contribute
to our success. We are working together to build revenue, to improve efficiency and productivity, and to take
quality to ever-higher levels.
The fact that we are so well positioned is due in no small measure to the contributions of all
the dedicated Manpower people worldwide who made 1999 a successful year for our company by
demonstrating what happens when we plan our work and execute our plan together. We had a good
year in 1999. We will all be working hard to ensure that 2000 is even better. I also want to acknowledge
John R. Walter who, after serving on our Board for a year, took on the additional responsibility of serving
as non-executive Chairman in May. John’s business knowledge, gained as Chairman, President and CEO
of R.R. Donnelley & Sons Company and, more recently, as President of AT&T is already helping Manpower
move forward.
Special recognition is in order for Mitchell S. Fromstein who, after 23 years as Chairman, President
and CEO, retired in May 1999. Mitchell’s commitment to improving Manpower every day is a model for the
entire company and industry. I would also like to express my personal gratitude to Mitchell for supporting
and assisting me into my role as CEO.
Respectfully,
Jeffrey A. JoerresPresident & Chief Executive OfficerMarch 1, 2000
Great things happen when — and only when —
an organization’s interests are aligned with
those of its customers and its shareholders,
and at Manpower our objectives are aligned.
Today, across our company, a common
understanding is shared of what Manpower
is trying to do and how each individual can
contribute to our success.
* * * * *

People are what we’re about.

7
Discovering strengths. Developing skills. Building careers. In today’s competitive
marketplace, companies worldwide are turning to Manpower for insight, innovation,
and creativity to meet their recruiting, retention and workforce management
requirements. We have our industry’s most advanced skill evaluation and development
tools to match employee experience, talents and interests to business needs.
But more importantly, we are committed to building long-term relationships with our
employees through continuous training and skill development, which helps them
expand their capabilities, discover new strengths and build rewarding careers.
In 1999, we took our leadership to new levels in building strong employee relation-
ships and expanding the pool of skilled workers we can provide to customers.
We streamlined our proprietary Predictable Performance System, which provides
in-depth assessment of employees’ experience, skills, attitudes and interests, as
well as an analysis of customer work environments and job requirements. The result:
we’ve made sourcing and assigning qualified people even more efficient. We also
employed advanced technology to strengthen our ability to recruit, train and develop
employees. For example, we established relationships with major Internet job banks,
allowing us to capitalize on this resource to better serve our customers’ needs and
the candidates’ ambitions. At the same time, we continued to deploy our prototype
virtual recruiting capabilities, enabling us to contact, interview, screen and assign
new employees with unparalleled efficiency. We continued to fortify our Global Learning
Center (GLC), our Internet-based “virtual campus” which offers about 1,000 educational
courses online, to help employees stay on the cutting edge of their careers through
e-learning. At last count, the GLC had more than 10,000 English-language users in
the U.S., the U.K., Sweden, Norway, France, Australia, New Zealand, Singapore,
Hong Kong, Japan, Korea, Malaysia, Thailand and Taiwan. And we will be introducing
additional language versions in 2000. We also helped customers worldwide meet the
mounting demand for skilled workers through our retraining and career re-engineering
capabilities. Mergers, acquisitions, and other business events mean that companies
increasingly must retrain or outplace talented, committed people. At Manpower,
we’re helping employees turn these challenges into opportunities by expanding their
skills and finding paths to promising new careers in an ever-changing economy.
8
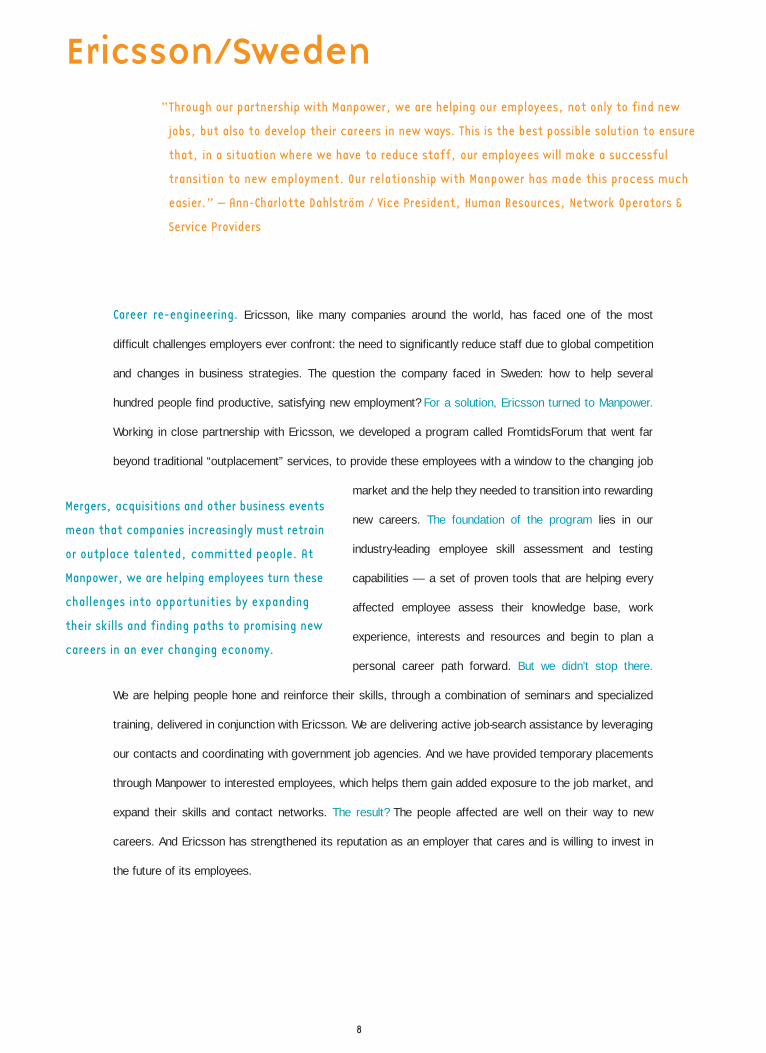
Ericsson/Sweden
Career re-engineering. Ericsson, like many companies around the world, has faced one of the most
difficult challenges employers ever confront: the need to significantly reduce staff due to global competition
and changes in business strategies. The question the company faced in Sweden: how to help several
hundred people find productive, satisfying new employment? For a solution, Ericsson turned to Manpower.
Working in close partnership with Ericsson, we developed a program called FromtidsForum that went far
beyond traditional “outplacement” services, to provide these employees with a window to the changing job
market and the help they needed to transition into rewarding
new careers. The foundation of the program lies in our
industry-leading employee skill assessment and testing
capabilities — a set of proven tools that are helping every
affected employee assess their knowledge base, work
experience, interests and resources and begin to plan a
personal career path forward. But we didn’t stop there.
We are helping people hone and reinforce their skills, through a combination of seminars and specialized
training, delivered in conjunction with Ericsson. We are delivering active job-search assistance by leveraging
our contacts and coordinating with government job agencies. And we have provided temporary placements
through Manpower to interested employees, which helps them gain added exposure to the job market, and
expand their skills and contact networks. The result? The people affected are well on their way to new
careers. And Ericsson has strengthened its reputation as an employer that cares and is willing to invest in
the future of its employees.
Mergers, acquisitions and other business events
mean that companies increasingly must retrain
or outplace talented, committed people. At
Manpower, we are helping employees turn these
challenges into opportunities by expanding
their skills and finding paths to promising new
careers in an ever changing economy.
“Through our partnership with Manpower, we are helping our employees, not only to find new
jobs, but also to develop their careers in new ways. This is the best possible solution to ensure
that, in a situation where we have to reduce staff, our employees will make a successful
transition to new employment. Our relationship with Manpower has made this process much
easier.” — Ann-Charlotte Dahlström / Vice President, Human Resources, Network Operators &
Service Providers


11
Unisys/France
Creating a skilled labor pool. In today’s electronic world, business is being redefined every day, and
often the impact is felt most keenly by technology companies themselves. This was the case with Unisys,
one of the world’s leading computer information and technology firms. As demand for the company’s
services in France mounted, Unisys needed to recruit rising numbers of entry-level high-tech employees —
more people, in fact, than it could access on its own. To address this challenge, Unisys called on Manpower.
Our solution: we concentrated on attracting recent college
graduates with degrees in the sciences, such as physics,
chemistry, biology, and math. These graduates have the
same basic skills and profiles as graduates with IT degrees,
but in France they often have difficulty finding jobs in their
fields. Working with Unisys, we developed a comprehensive
solution to recruit, screen, evaluate and select high-potential
science graduates at the beginning of their careers,
coordinate training tailored to the company’s requirements,
and manage their integration into Unisys assignments. One
key: in addition to working with the candidates themselves, we also help Unisys managers to successfully
transition the new employees into line assignments. The result of this innovative program: Unisys gains the
talented IT employees it needs, and new science graduates who faced an uncertain future obtain the skills
and experience they need to build promising careers in a changing world.
Employers want access to qualified workers —
employees with the education, experience,
interests, and portfolio of skills needed to
get the job done right. Employees want
opportunities to advance their careers. At
Manpower, we bring business and employee
interests together, with innovative thinking,
advanced recruiting, skill-identification, and
performance tracking systems, and the best
continuing training and development programs
in the business.
“Unisys has relied upon Manpower to provide IT workers, technicians and office administration
staff in many countries around the world. We continue to expand our relationship with
Manpower because they are able to deliver creative solutions that ensure we have the people
we need to get the job done, despite the critical labor and skill shortages that currently
exist worldwide.” — Terry Laudal / Vice President, Resource Planning and Recruiting

Solutions set us apart.

13
Informed thinking. Innovative services. Proven results. The business world is changing,
and so is the world of work. Where companies once thought of temporary staffing
in terms of finding fill-in workers, today they view it as a mission-critical means of
managing their workforces on a flexible, just-in-time basis. Businesses are looking
for intelligent, innovative approaches to urgent issues, and they count on Manpower
to provide them. Our range of services matters, of course. But what sets us apart is
the way we think. Rather than selling a set of “off-the-shelf” services, we deliver
the ideas and perspectives that employers need to develop effective workforce
management solutions. Demand is growing worldwide for workforce solutions to meet
the need for high-end professional staff, and Manpower is focused on meeting that
demand. In 1999, we made a major commitment to dedicate more resources to the
full range of IT, telecommunications, engineering, scientific, financial and other
professional staffing services we provide worldwide. Beyond access to flexible
staffing on a project basis, Manpower’s professional and specialty staffing brands
provide customers with state-of-the-art recruiting and retention capabilities, and a
full range of continuous training services to ensure our talented pool of professional
contractors are capable of handling the most challenging assignment. We give
employees access to online training, technical certification and on-the-job
experience with the world’s leading companies. The result: professional and specialty
staffing services are one of our fastest-growing business segments. Call centers
represent another important Manpower focus, as the demand for these services
grows exponentially worldwide. With the rapid rise of e-commerce, call centers and
customer care centers play a vital role in the customer relationship-management
equation. Many of the world’s leading companies rely on Manpower for the large-scale
recruiting, selection and training needed to deliver customer service excellence.
Today, more than 50,000 Manpower employees staff call centers and customer care
centers around the globe. We also took strategic outsourcing to new levels, from
on-site human resource management to total outsourcing of customer functions and
operations. Some of these challenging initiatives involved taking our major-project
planning, staffing and management capabilities in important new directions, such
as supporting brand introductions and new-product rollouts in South America.

14
Elizabeth Arden/U.S.
The power of partnership. Every year, Elizabeth Arden’s operations in Roanoke, Virginia assemble more
than 15 million promotional gift sets. While assembly was an important aspect of the cosmetic maker’s
operations, it also was a highly seasonal activity that tended to disrupt the manufacturing process because
of the peaks and valleys in the assembly workload. To make the assembly process more efficient, the
company considered outsourcing these operations to an out-of-state packaging firm, an action that would
have added significant shipping charges, moved hundreds
of jobs out of Roanoke, and made it harder to handle rushed
or special orders. That’s where Manpower’s comprehensive
and creative workforce-management solutions came in. In a
step beyond our role in supplying temporary assembly staff
for the company, we worked collaboratively with Elizabeth
Arden to help redefine its processes through strategic
assembly outsourcing. It took thought, planning, and a
willingness to work as a long-term partner. And it paid off in results. We now manage Elizabeth Arden’s entire
assembly operation, providing everything from the assembly workforce, supervisory and management team,
to the facility in which they work. The efficiency we provide translates into significant annual savings and
a superior customer service level for Elizabeth Arden. Just as important, by keeping the assembly operation
in Roanoke, the company can closely monitor process quality. And it prevented the loss of local jobs that
would have occurred if this work had been sent out of state.
For employers worldwide, managing
workforces at single sites or across countries
and continents is an increasingly complex
challenge, and one that is central to success.
In addressing these issues, Manpower is
delivering the resources, perspectives,
and innovative solutions employers need
to meet the challenges and capitalize on
the opportunities of today’s marketplace.
“This is a value-added relationship for us. Manpower isn’t just supplying us with a variable
workforce, but has been able to absorb ownership of the entire assembly portion of our
process. I think this differentiates them from others in their business. They are the perfect
partner for us.” — Roy C. Drilon / Vice President, Operations


Value is our standard.

17
Advanced technology. Forward thinking. Aligned interests. As globalization redefines
the scope of business and the Internet reshapes business practices from the ground
up, companies are rethinking the value of everything they do. The challenges
presented by the worldwide shortage of skilled labor have made human resources a
top business priority. At Manpower, we’re helping employers navigate these changes
by partnering with them in new, innovative ways to deliver the flexible workforce
solutions that are essential to creating real value. In 1999, we helped customers
worldwide re-evaluate their workforce management strategies and find new ways
to serve their customers and gain a competitive edge. By integrating our services
with the customer’s business requirements, we delivered the solutions they needed
to manage business transitions and staffing fluctuations in ways that made massive
organizational change a seamless process for their customers. We also provided
large-scale global solutions to some of the world’s most prominent companies,
ranging from on-site management to outsourcing that ensured a predictable, quality
workforce was getting the job done right. The importance of technology in delivering
these value-added solutions begins in our own operations, with the ability to share
ideas and best practices, support global and regional customers, improve productivity,
increase efficiency and drive continuing growth. In 1999, we upgraded our
information technology capabilities by implementing powerful new systems to meet
changing operating demands. These efforts were enhanced by the introduction of
technology-driven solutions that help employers better manage their workforces,
whether they depend on Manpower alone or deal with multiple suppliers. UltraSource,
our leading-edge web-based order management system, is a prime example. With
UltraSource, customers get a complete vendor management solution incorporating
not just technology but also effective Manpower-led workflow processes. Staff
requisition, order status review, order deployment to multiple suppliers, resume
review and interview scheduling are all handled online. Customers can track every
stage of the process electronically, with automated e-mail notification to proactively
keep all parties informed. Just as important, UltraSource captures relevant metrics
to allow Manpower and its customers to monitor process performance and drive
continuous improvement.


19
Millennium Dome/U.K.
Innovation for the New Millennium. At this pivotal point in history, a revolution is underway in the
worldwide workplace, and Manpower is offering a glimpse into the future of work with our sponsorship of
the Work Zone at the Millennium Dome in Greenwich, England. The Work Zone is one of 14 discovery zones
housed in the 2.5 million square-foot complex and it is expected to host 12 million visitors this year, to
explore the possibilities that the future holds. But we’re doing more than just thinking about the future of
work. We’re putting our ideas into action as the company selected to handle human resources management
for the New Millennium Experience Company (NMEC), the company that created the Millennium Dome itself.
Our job went far beyond recruiting and placing the 2,000-
plus hosts and assistant visitor service managers the Dome
requires. Despite its scale, the Millennium Dome is a start-up
enterprise, and we called on our full range of capabilities —
from strategic project planning to training, administration
and on-site management — to give NMEC a world-class HR
program. Systems support also was essential. Although the
Dome’s staff is employed directly by NMEC, we help the
company manage payroll and staffing levels simultaneously
through a customized IT solution that not only captures
attendance and wage data, but also helps monitor staffing levels across the Dome, to ensure they are
attuned to visitor demand. And our global resources, local staffing connections, and skill development tools
are critical as well. Not only do we give NMEC the best people and the best support systems; we also give
them the knowledge that we can help their employees continue their careers after the year 2000.
“The breadth and depth of Manpower’s service has enabled us to develop and deliver a truly
world-class HR programme. Not only do we have the best-quality people, but the best support
systems and the knowledge that Manpower will help our people continue their careers at
the end of the Year 2000.” — Raj Pragasam / Director, Human Resources, New Millennium
Experience Company
For Manpower, success means delivering real
value to our customers, our employees, and
our shareholders. We create value for our
customers by helping them achieve their
business objectives. For employees, we make
work more meaningful and more rewarding.
For investors, we improve productivity and
efficiency, and generate profitable growth.
And, in everything we do, the speed,
flexibility, and new ideas driven by advanced
technology are the keys to value creation.

Nature of Operations Manpower Inc. (the “Company”) is a
leading non-governmental employment services organization,
providing staffing and workforce management services and
solutions to a wide variety of
customers. Through a global
network of almost 3,400
systemwide offices in 52
countries, the Company provides
temporary staffing services,
contract services and training
and testing of temporary and
permanent workers.
Systemwide information
referred to throughout this dis-
cussion includes both Company-
owned branches and franchises.
The Company generates rev-
enues from sales of services by
its own branch operations and from fees earned on sales of
services by its franchise operations. (See Note 1 to the
Consolidated Financial Statements for further information.)
Results of Operations—Years Ended December 31,1999, 1998 and 1997 Consolidated Results—1999 compared
to 1998 The Company achieved a record Systemwide Sales
level of $11.5 billion during 1999, increasing 9.4% over the
1998 level of $10.5 billion and more than doubling the sales level
of just five years ago.
Revenues from services increased 10.8%. Revenues were
unfavorably impacted during the year by changes in currency
exchange rates, as the U.S. Dollar strengthened relative to the
currencies in most of the Company’s non-U.S. markets. At
constant exchange rates, the increase in revenues would have
been 13.2%. Volume, as measured by billable hours of branch
operations, increased 10.2%.
Operating profit increased 76.9% during 1999. Excluding
the impact of the $28.0 million of nonrecurring items recorded
in 1999, related to employee severances, retirement costs and
other associated realignment costs, and the $92.1 million
write-down of capitalized software in 1998, operating profit
increased 16.3%. As a percentage of revenues, operating profit
increased to 2.6% in 1999 from 2.5% in 1998.
Gross profit increased 13.4% during 1999, reflecting both
the increase in revenues and an improvement in the gross profit
margin. The gross profit margin improved to 17.5% in 1999 from
17.1% in 1998 due primarily to the enhanced pricing of our
business in France.
Selling and administrative expenses increased 15.1% during
1999. Excluding the impact of the nonrecurring items recorded in
1999, selling and administrative expenses increased 12.9%. As
a percent of revenue, these expenses were 14.8% in 1999 and
14.5% in 1998. This increase is due primarily to an increase in
France’s business tax (taxe professionnelle) and to the continued
investment in new or expanding markets. On a worldwide basis,
the Company opened more than 200 new offices during 1999,
with the majority being opened in mainland Europe.
Interest and other expense increased $8.2 million during
1999 primarily due to the higher borrowing levels required
to finance the Company’s share repurchase program and the
ongoing investments in our global office network.
The Company provided for income taxes at a rate of 27.1%
in 1999 compared to 33.5% in 1998. The decrease in the rate
primarily reflects the nonrecurring items, including a one-time tax
benefit of $15.7 million related to the Company’s dissolution of a
non-operating subsidiary, incurred in the second quarter of 1999.
Without these nonrecurring items, the tax rate would have been
35.5%, which is different than the U.S. Federal statutory rate due to
foreign repatriations, foreign tax rate differences and net operating
loss carryforwards which had been fully reserved for in prior years.
Net earnings per share, on a fully diluted basis, was $1.91
in 1999 compared to $.93 in 1998. Excluding the nonrecurring
items recorded in 1999 and the write-down of capitalized
software in 1998, diluted earnings per share was $1.92 in 1999
compared to $1.64 in 1998. The 1999 earnings were negatively
impacted $.05 per share due to the lower currency exchange
rates during the year. The weighted average shares outstanding
decreased 3.0% due to the Company’s treasury stock purchases.
On an undiluted basis, net earnings per share was $1.94 in 1999
($1.95 excluding the nonrecurring items) and $.94 in 1998
($1.66 excluding the write-down of capitalized software).
Consolidated Results—1998 compared to 1997 Systemwide
sales increased 18.2% during 1998. Revenues from services
increased 21.4%. Revenues were unfavorably impacted by
changes in currency exchange rates during 1998 as the U.S.
Dollar strengthened relative to the currencies in most of the
Management’s Discussion and Analysisof Financial Condition and Results of Operations
20
Systemwide Offices((December 31, 1999)
United States
1,162
France
849
Other Europe
722
Other Countries
380
United Kingdom
283
Company’s non-U.S. markets. At constant exchange rates, the
increase in revenues would have been 23.0%. Volume, as
measured by billable hours of branch operations, increased 16.5%.
Operating profit declined 48.9% during 1998 due primarily
to the write-down of capitalized software. Excluding this write-
down, operating profit declined 12.9% from the 1997 level. The
operating profit margin was 2.5% of revenues in 1998 compared
to 3.5% of revenues in 1997. This decline in operating margins is
primarily attributable to a 1% decline in the gross profit margin,
precipitated by a change in the French payroll tax legislation.
In certain of the Company’s European markets, government
employment incentive programs are in place to encourage
employment by providing a credit against payroll taxes otherwise
payable. In France, legislation was enacted in late 1997 that
reduced the amount of such payroll tax credits beginning in
January 1998. This reduction resulted in higher payroll taxes and
thus a higher cost of service.
Selling and administrative expenses were 14.5% of
revenues in 1998 and 1997. The Company was able to maintain
overhead costs at a constant percentage of revenue in 1998
despite a significant investment in new markets and
infrastructure enhancements.
In December 1998, the Company recorded a $92.1 million
($57.1 million after-tax) non-cash charge to write off the carrying
value of software costs and certain hardware and network
infrastructure costs related to the development of a complex and
proprietary information system for its North American branch
office administration, invoicing and payroll processing.
Interest and other expense includes net interest expense of
$10.8 million and $3.1 million in 1998 and 1997, respectively. Net
interest expense was primarily impacted by changes in worldwide
borrowing levels needed to finance the Company’s share repur-
chase program and the investments in our global office network.
The Company provided for income taxes at a rate of 33.5%
in 1998 compared to 34.2% in 1997. The decrease in the rate
relates primarily to the increased utilization of net operating loss
carryforwards. In 1998 and 1997, the Company’s effective
income tax rate is lower than the U.S. Federal statutory rate due
to the utilization of capital and net operating loss carryforwards
that had been fully reserved for in prior years.
Net earnings per share, on a diluted basis, was $.93 in
1998 ($1.64 per share excluding the write-down of capitalized
software) and $1.97 in 1997. The 1998 earnings were negatively
impacted $.07 per share due to lower currency exchange rates
during the year. The weighted average shares outstanding
decreased 2.6% in 1998 compared to 1997 due to the
Company’s treasury stock purchases and a smaller effect of
dilutive stock options caused by the lower average share price
during 1998. (See Note 2 to the Consolidated Financial
Statements for further information.) On an undiluted basis, net
earnings per share was $.94 in 1998 ($1.66 excluding the write-
down of capitalized software) and $2.01 in 1997.
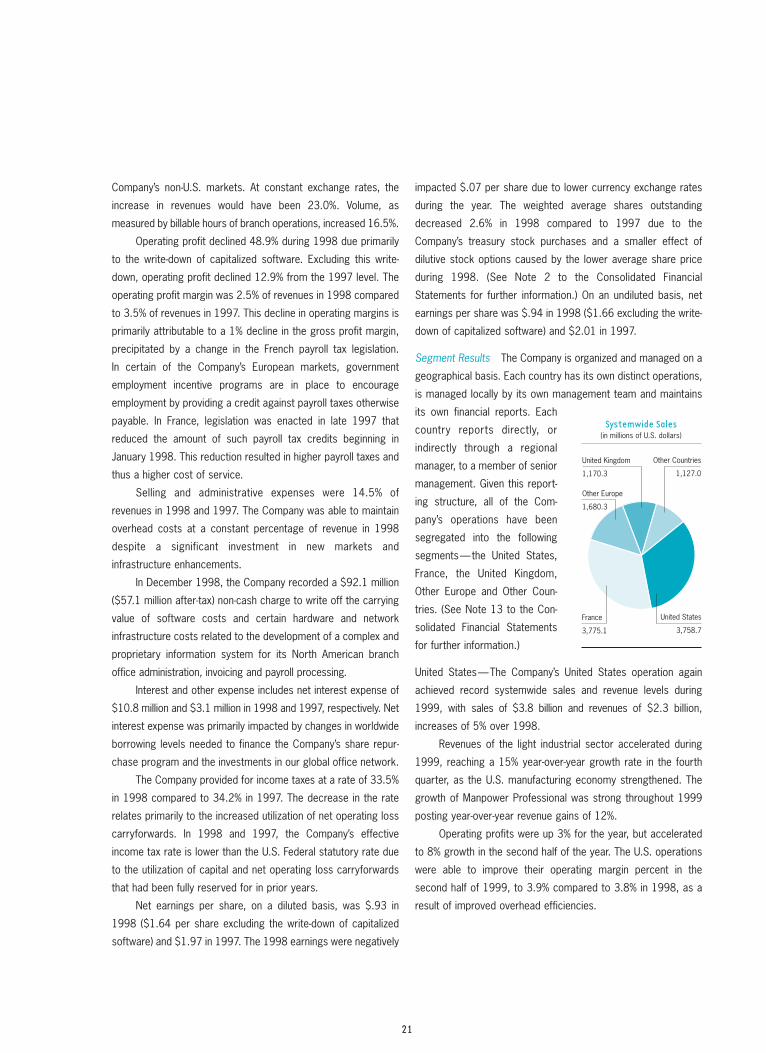
Segment Results The Company is organized and managed on a
geographical basis. Each country has its own distinct operations,
is managed locally by its own management team and maintains
its own financial reports. Each
country reports directly, or
indirectly through a regional
manager, to a member of senior
management. Given this report-
ing structure, all of the Com-
pany’s operations have been
segregated into the following
segments— the United States,
France, the United Kingdom,
Other Europe and Other Coun-
tries. (See Note 13 to the Con-
solidated Financial Statements
for further information.)
United States—The Company’s United States operation again
achieved record systemwide sales and revenue levels during
1999, with sales of $3.8 billion and revenues of $2.3 billion,
increases of 5% over 1998.
Revenues of the light industrial sector accelerated during
1999, reaching a 15% year-over-year growth rate in the fourth
quarter, as the U.S. manufacturing economy strengthened. The
growth of Manpower Professional was strong throughout 1999
posting year-over-year revenue gains of 12%.
Operating profits were up 3% for the year, but accelerated
to 8% growth in the second half of the year. The U.S. operations
were able to improve their operating margin percent in the
second half of 1999, to 3.9% compared to 3.8% in 1998, as a
result of improved overhead efficiencies.
21
Systemwide Sales((
United States
3,758.7
France
3,775.1
Other Europe
1,680.3
Other Countries
1,127.0
United Kingdom
1,170.3
(in millions of U.S. dollars)

France—Revenues in France grew 9% in local currency to
FFR23.3 billion ($3.8 billion) for 1999, reflecting a doubling of
business since 1996.
Revenue growth accelerated in the second half of 1999,
reaching year-over-year gains of 16% in the fourth quarter. These
gains were fueled by an improving French economy and strong
industrial production.
More importantly, we were able to achieve these revenue
gains and maintain our market position while realizing a
significant improvement in operating profit margins. Operating
profits increased 39% in local currency to FFR629.3 million
during 1999, on an operating profit margin improvement to 2.7%
in 1999 from 2.1% in 1998. This improvement was the result of
enhanced pricing initiatives designed to recover our payroll tax
cost increases. These cost increases were the direct result of
a reduction in payroll tax subsidies offered by the French
government under their employment incentive programs, which
became effective January 1, 1998.
United Kingdom—Revenues in the U.K. grew 10% in local
currency, reaching $1.2 billion in 1999. Operating profit margins
declined during the year, reflecting continued intense price
competition on the large account business. The U.K. operation
expects to continue shifting its revenue mix to achieve a greater
balance between retail and large account business. Gross profit
margins improved each quarter throughout 1999 and year-over-
year gains were realized in the fourth quarter.
In January 2000, the Company acquired Elan Group
Limited, a European specialty IT staffing company with significant
operations in the U.K. (See Note 11 to the Consolidated Financial
Statements for further information.) We believe that this
acquisition strengthens the Company’s position as a leading
staffing provider in the U.K. market and that it will provide a
platform for rapid expansion of the IT business in Europe.
Other Europe—Revenues in the Other Europe segment grew an
impressive 38% in constant currency during 1999, exceeding
the $1.5 billion mark. 1999 represents the third consecutive year
of constant currency revenue growth in excess of 30%. This
revenue growth is almost entirely organic and has been fueled
by the Company’s significant investment in new office openings
in Europe’s rapidly expanding markets, including Germany, Italy,
Spain and Sweden.
During 1999, the Company opened more than 100 offices
in the Other European markets and has opened more than 450
offices since 1996. Operating profits also increased 29% during
1999 to $63.2 million, as our investments in these new offices
began producing positive results.
Management’s Discussion and Analysis (continued)of Financial Condition and Results of Operations
22
4,000
3,200
2,400
1,600
800
Year ’97 ’98 ’99
France(Revenues
(in millions of U.S. dollars)
+4%+34%
+19%
100
80
60
40
20
Year ’97 ’98 ’99
France(Operating Profits
(in millions of U.S. dollars)
+24%
–16%
+31%
1,500
1,200
900
600
300
Year ’97 ’98 ’99
United Kingdom(Revenues
(in millions of U.S. dollars)
+14%+10%
+8%
50
40
30
20
10
Year ’97 ’98 ’99
United Kingdom(Operating Profits
(in millions of U.S. dollars)
–5%+6%
+20%
4,000
3,200
2,400
1,600
800
Year ’97 ’98 ’99
United States(Systemwide Sales
(in millions of U.S. dollars)
+14%+7%
+5%100
80
60
40
20
Year ’97 ’98 ’99
United States(Operating Profits
(in millions of U.S. dollars)
+3%–16%
+5%

Other Countries—Revenues in the Other Countries segment
exceeded the $1.0 billion mark, increasing 35% during 1999, or
24% in constant currency. This revenue increase was driven
primarily by Australia, Canada, Japan and Mexico.
The Company’s largest operation within this segment is Japan,
where revenues were up 6% in local currency during 1999 despite
the recession. Revenue growth improved modestly throughout
the year, accelerating to 9% in the fourth quarter of 1999.
The operating profit margin declined during the year
primarily as a result of gross margin declines related to the
recessionary environment in Japan.
Liquidity and Capital Resources Cash sources Cash used
by operating activities was $.5 million during 1999. Cash provided
by operating activities was $265.2 million and $25.3 million in
1998 and 1997, respectively. Included in 1999 and 1998 is
$25.0 million and $175.0 million of cash received from the sale
of accounts receivable in the U.S. (See “Capital resources” for a
discussion of this program). Cash from operating activities was
also significantly impacted by changes in working capital.
Excluding the sale of accounts receivable in 1999 and 1998,
cash used to support net working capital needs was $275.2
million, $107.7 million and $198.0 million in 1999, 1998 and
1997, respectively. The revenue growth in France and Italy is the
primary reason for the increasing working capital needs, as it is
normal in these markets to have Days Sales Outstanding in
excess of 70 days. Cash provided by operating activities before
working capital changes was $249.7 million, $197.8 million and
$223.3 million in 1999, 1998 and 1997, respectively.
Accounts receivable increased to $1,897.6 million at
December 31, 1999 from $1,674.7 million at December 31,
1998. This change is due to the increased sales levels in all of
the Company’s major markets, offset by the sale of accounts
receivable and the impact of currency exchange rates. Without
the sale of accounts receivable and at constant exchange rates,
receivables would have increased an additional $25.0 million and
$162.1 million, respectively.
Net cash provided by borrowings was $246.6 million in
1999 and $137.8 million in 1997. The additional borrowings
were primarily used for working capital growth and investments
in new markets, capital expenditures, acquisitions and
repurchases of the Company’s common stock. Cash from
operating activities in 1998 was used to repay borrowings
of $9.8 million, for investments in new markets, capital
expenditures and acquisitions, and to repurchase shares of the
Company’s common stock.
Cash uses Capital expenditures decreased to $74.7 million in
1999 from $140.8 million in 1998 and $98.6 million in 1997.
These expenditures are primarily comprised of purchases of
computer equipment, office furniture and other costs related to
office openings and refurbishments, as well as capitalized
software costs of $3.0 million, $40.1 million and $37.6 million in
1999, 1998 and 1997, respectively.
From time to time, the Company acquires certain franchises
and other unrelated companies throughout the world. The total
cash consideration paid for acquisitions, net of cash acquired,
was $18.8 million in 1999, $31.7 million in 1998 and $16.5
million in 1997.
Subsequent to December 31, 1999, the Company acquired
Elan Group Limited (“Elan”) and several other companies
23
2,000
1,600
1,200
800
400
Year ’97 ’98 ’99
Other Europe(Revenues
(in millions of U.S. dollars)
+32%
+35%
+26%
75
60
45
30
15
Year ’97 ’98 ’99
Other Europe(Operating Profits
(in millions of U.S. dollars)
+29%
+27%
+1%
1,500
1,200
900
600
300
Year ’97 ’98 ’99
Other Countries(Revenues
(in millions of U.S. dollars)
+35%
+11%+45%
50
40
30
20
10
Year ’97 ’98 ’99
Other Countries(Operating Profits
(in millions of U.S. dollars)
–21%
–32%
+37%

throughout the world. The total cost of these acquisitions was
$121.7 million, the majority of which was recorded as intangible
assets. In addition, the Elan acquisition includes approximately
$44.0 million of deferred consideration expected to be paid
during 2000 and 2001.
The Board of Directors has authorized the repurchase of
15 million shares under the Company’s share repurchase program.
Share repurchases may be made from time to time and may
be implemented through a variety of methods, including open
market purchases, block transactions, privately negotiated
transactions, accelerated share repurchase programs, forward
repurchase agreements or similar facilities. At December 31,
1999, 8.3 million shares at a cost of $229.8 million have been
repurchased under the program, $100.8 million of which were
repurchased during 1999.
The Company paid dividends of $15.3 million, $15.2 million
and $13.8 million in 1999, 1998 and 1997, respectively.
Cash and cash equivalents increased $61.2 million in 1999
and $38.2 million in 1998 compared to a decrease of $38.3
million in 1997.
Capitalization Total capitalization at December 31, 1999 was
$1,139.6 million, comprised of $489.0 million of debt and
$650.6 million of equity. Debt as a percentage of total
capitalization increased to 43%
in 1999 from 28% in 1998, due
primarily to the repurchases of
the Company’s common stock
during the year.
Capital resources In July 1999,
the Company issued €200.0
million of 7-year unsecured
notes with an effective interest
rate of 5.7%. Net proceeds
of $200.9 million from the
issuance of these notes were
used to repay amounts out-
standing under the Company’s unsecured revolving credit
agreement and commercial paper program.
The Company has a $415.0 million unsecured revolving
credit agreement that includes a $90.0 million commitment to be
used exclusively for standby letters of credit. Borrowings of
$133.7 million and letters of credit of $57.9 million were
outstanding under the facility at December 31, 1999. The facility
matures on November 25, 2002 and may be increased to a
maximum of $500.0 million or extended for an additional year
with the lenders’ consent. The agreement requires, among other
things, that the Company comply with an interest coverage ratio
of not less than 3.0 to 1, a debt-to-capitalization ratio of less than
.60 to 1 and a maximum subsidiary debt level of $50.0 million.
As of December 31, 1999, the Company had an interest
coverage ratio of 17.4 to 1, a debt-to-capitalization ratio (as
defined under the agreement) of .46 to 1 and a subsidiary debt
level of $49.0 million.
In November 1999, the Company entered into a $300.0
million revolving credit agreement. The facility matures on
November 22, 2000, and may be extended for an additional year
with the lenders’ consent. This agreement has similar restrictive
covenants to the Company’s $415.0 million revolving credit
agreement. As of December 31, 1999, the Company had no
borrowings under this agreement.
Borrowings of $14.8 million were outstanding under the
Company’s $75.0 million U.S. commercial paper program.
Commercial paper borrowings, which are backed by the $415.0
million unsecured revolving credit agreement, have been
classified as long-term debt due to the availability to refinance
them on a long-term basis under the revolving credit facility.
During the first quarter of 2000, the Company issued
€150.0 million of 5-year unsecured notes with an effective
interest rate of 6.3%. Net proceeds from the issuance of these
notes were used to repay amounts outstanding under the
Company’s unsecured revolving credit agreement and
commercial paper program.
In addition to the above, the Company and some of its
foreign subsidiaries maintain separate lines of credit with local
financial institutions to meet working capital needs. As of
December 31, 1999, such lines totaled $160.4 million, of which
$32.5 million was unused.
A wholly owned subsidiary of the Company has an
agreement to sell, on an ongoing basis, up to $200.0 million of
an undivided interest in its accounts receivable. The amount of
receivables sold under this agreement totaled $200.0 million and
$175.0 million at December 31, 1999 and 1998, respectively.
Unless extended by amendment, the agreement expires in
December 2000. (See Note 4 to the Consolidated Financial
Statements for further information.)
Management’s Discussion and Analysis (continued)of Financial Condition and Results of Operations
24
1,200
960
720
480
240
Year ’95 ’97’96 ’98 ’99
Total Capitalization
Debt Equity
(in millions of U.S. dollars)

The Company’s principal ongoing cash needs are to finance
working capital, capital expenditures, acquisitions and the share
repurchase program. Working capital is primarily in the form
of trade receivables, which increase as revenues increase. The
amount of financing necessary to support revenue growth
depends on receivable turnover, which differs in each market in
which the Company operates.
The Company believes that its internally generated funds
and its existing credit facilities are sufficient to cover its near-
term projected cash needs. With continued revenue increases
or additional acquisitions or share repurchases, additional
borrowings under the existing facilities would be necessary to
finance the Company’s cash needs.
Significant Matters Affecting Results of OperationsMarket risks The Company is exposed to the impact of interest
rate changes and foreign currency fluctuations.
Interest Rates—The Company’s exposure to market risk for
changes in interest rates relates primarily to the Company’s
long-term debt obligations. The Company has historically managed
interest rates through the use of a combination of fixed and vari-
able rate borrowings. During 1999 and the first quarter of 2000,
the Company has replaced a total of €350.0 million of variable
rate financing with long-term, fixed rate notes. The Company
believes that the addition of these notes protects the Company
against the recent and anticipated interest rate increases.
In addition, interest rate swaps may be used to adjust
interest rate exposures when appropriate. Currently, the
Company has an interest rate swap agreement, expiring in 2001,
to fix the interest rate at 6.0% on $50.0 million of the Company’s
revolving credit borrowings under the revolving credit agreement.
The fair value of this agreement, the impact on cash flows and
the interest expense recorded during 1999 were not material.
A 41 basis point (.41%) move in interest rates on the
Company’s variable rate borrowings (10% of the weighted
average worldwide interest rate) would have an immaterial
impact on the Company’s earnings before income taxes and cash
flows in each of the next five years. In addition, a 41 basis point
move in interest rates would have an immaterial impact on
the fair value, interest expense and cash flows related to the
Company’s interest rate swap agreement.
Exchange Rates—The Company’s exposure to exchange rates
relates primarily to its foreign subsidiaries and its Euro-
denominated borrowings. Related to its foreign subsidiaries,
exchange rates impact the U.S. Dollar value of their reported
earnings, the Company’s investments in the subsidiaries and the
intercompany transactions with the subsidiaries.
Over 75% of the Company’s revenues are generated outside
of the United States. As a result, fluctuations in the value of
foreign currencies against the dollar may have a significant impact
on the reported results of the Company. Revenues and expenses
denominated in foreign currencies are translated into United
States dollars at the weighted average exchange rate for the year.
Consequently, as the value of the dollar strengthens relative to
other currencies in the Company’s major markets, as it did on
average in 1999, the resulting translated revenues, expenses and
operating profits are lower. Using constant exchange rates, 1999
revenues and operating profits would have been approximately
3% higher than reported.
Fluctuations in currency exchange rates also impact the
U.S. Dollar amount of shareholders’ equity of the Company.
The assets and liabilities of the Company’s non-U.S. subsidiaries
are translated into United States dollars at the exchange rates
in effect at year-end. The resulting translation adjustments are
recorded in shareholders’ equity as Accumulated other
comprehensive income (loss). The dollar was stronger relative to
many of the foreign currencies at December 31, 1999 compared
to December 31, 1998. Consequently, the Accumulated other
comprehensive income (loss) component of shareholders’ equity
decreased $70.9 million during the year. Using the year-end
exchange rates, the total amount permanently invested in non-U.S.
subsidiaries at December 31, 1999 is approximately $1.6 billion.
During 1999 and the first quarter of 2000, the Company
has issued €350.0 million of Euro-denominated notes. These
notes provide a hedge of the Company’s net investment in its
European subsidiaries with Euro functional currencies. Since the
Company’s net investment in these subsidiaries exceeds the
amount of the notes, all translation gains or losses related
to these notes is included as a component of Accumulated
other comprehensive income (loss). The Accumulated other
comprehensive income (loss) component of shareholders’ equity
increased $1.5 million during the year due to the currency
impact on these notes.
25

Although currency fluctuations impact the Company’s
reported results and shareholders’ equity, such fluctuations
generally do not affect the Company’s cash flow or result in
actual economic gains or losses. Each of the Company’s
subsidiaries derives revenues and incurs expenses within a single
country and consequently, does not generally incur currency
risks in connection with the conduct of its normal business
operations. The Company generally has few cross border
transfers of funds, except for transfers to the United States to
fund the expense of the Company’s international headquarters
and working capital loans made from the United States to the
Company’s foreign subsidiaries. To reduce the currency risk
related to the loans, the Company may borrow funds under the
Revolving Credit Agreement in the foreign currency to lend to the
subsidiary, or alternatively, may enter into a forward contract to
hedge the loan. Foreign exchange gains and losses recognized
on any transactions are included in the Consolidated Statements
of Operations and historically have been immaterial. The
Company generally does not engage in hedging activities, except
as discussed above. The Company did not hold any derivative
instruments, except the interest rate swap discussed above, at
December 31, 1999.
The Company holds a 49% interest in its Swiss franchise,
which holds an investment portfolio of approximately $66.3
million as of December 31, 1999. This portfolio is invested in a
wide diversity of European and U.S. debt and equity securities as
well as various professionally managed funds. To the extent that
there are gains or losses related to this portfolio, the Company’s
ownership share is included in its consolidated operating results.
Impact of economic conditions Because one of the principal
attractions of using temporary staffing solutions is to maintain a
flexible supply of labor to meet changing economic conditions, the
industry has been and remains sensitive to economic cycles. To
help counter the effects of these economic cycles, the Company
continues to provide a diversified service mix, including office,
industrial, professional and call center resources and expertise,
and a variety of workforce management solutions, including
recruiting, training and managing temporary and permanent
staff. While the Company believes that the wide spread of its
operations and the diversity of its service mix and solutions
cushions it against the impact of an adverse economic cycle in
any single country or industry, adverse economic conditions in
any of its three largest markets would likely have a material
impact on the Company’s consolidated operating results.
Year 2000 The Company has not encountered any significant
problems with its IT or non-IT systems due to the Year 2000
Issue. Likewise, no significant franchisees, vendors or customers
have encountered Year 2000 Issues that are expected to impact
the Company.
To address its potential Year 2000 Issues, the Company
used both external and internal resources for the assessment,
remediation and testing of its IT and non-IT systems. The
Company expensed a total of $11.6 million for external
resources. Hardware purchases directly related to the Year 2000
project were minimal.
The Euro On January 1, 1999, 11 of the 15 member countries
of the European Union (the “participating countries”) established
fixed conversion rates between their existing sovereign
currencies (the “legacy currencies”) and the Euro and have
agreed to adopt the Euro as their common legal currency. The
legacy currencies will remain legal tender in the participating
countries as denominations of the Euro between January 1,
1999 and January 1, 2002 (the “transition period”). During the
transition period, public and private parties may pay for goods
and services using either the Euro or the participating country’s
legacy currency.
The Company is currently assessing the impact of the Euro
in its business operations in all participating countries. Since the
Company’s labor costs and prices are generally determined on
a local basis, the near-term impact of the Euro is expected
to be primarily related to making internal information systems
modifications to meet customer invoicing and external reporting
requirements. Such modifications relate to converting currency
values and to operating in a dual currency environment during the
transition period. Modifications of internal information systems
will occur throughout the transition period and will be coordinated
with other system-related upgrades and enhancements. The
Company will expense all such system modification costs as
incurred and does not expect such costs to be material to the
Company’s financial results.
Legal regulations and union relationships The temporary
employment services industry is closely regulated in all of the
major markets in which the Company operates except the United
Management’s Discussion and Analysis (continued)of Financial Condition and Results of Operations
26

States and Canada. In addition to licensing or registration
requirements, many countries impose substantive restrictions
on temporary employment services, either on the temporary
staffing company or the ultimate client company. They may
restrict the length of temporary assignments, the type of work
permitted for temporary workers or the occasions on which
temporary workers may be used. Changes in applicable laws or
regulations have occurred in the past and are expected in the
future to affect the extent to which temporary employment
services firms may operate. These changes could impose
additional costs or taxes, additional record keeping or reporting
requirements; restrict the tasks to which temporaries may be
assigned; limit the duration of or otherwise impose restrictions
on the nature of the temporary relationship (with the Company or
the client) or otherwise adversely affect the industry.
In many markets, the existence or absence of collective
bargaining agreements with labor organizations has a significant
impact on the Company’s operations and the ability of customers
to utilize the Company’s services. In some markets, labor
agreements are structured on a national or industry-wide
(rather than a company) basis. Changes in these collective labor
agreements have occurred in the past and are expected in the
future and may have a material impact on the operations of
temporary staffing firms, including the Company.
Forward-looking statements Certain information included or
incorporated by reference in this filing and identified by use of
the words “expects,” “believes,” “plans” or the like constitutes
forward-looking statements, as such term is defined in Section
27A of the Securities Act of 1933 and Section 21E of the
Securities Exchange Act of 1934. In addition, any information
included or incorporated by reference in future filings by the
Company with the Securities and Exchange Commission, as well
as information contained in written material, releases and oral
statements issued by or on behalf of the Company may include
forward-looking statements. All statements which address
operating performance, events or developments that the
Company expects or anticipates will occur or future financial
performance are forward-looking statements.
These forward-looking statements speak only as of the date
on which they are made. They rely on a number of assumptions
concerning future events and are subject to a number of risks
and uncertainties, many of which are outside of the Company’s
control, that could cause actual results to differ materially from
such statements. These risks and uncertainties include, but are
not limited to:
– material changes in the demand from larger customers,including customers with which the Company has national orglobal arrangements
– availability of temporary workers or workers with the skillsrequired by customers
– increases in the wages paid to temporary workers
– competitive market pressures, including pricing pressures
– ability to successfully invest in and implement informationsystems
– unanticipated technological changes, including obsolescenceor impairment of information systems
– changes in customer attitudes toward the use of staffing services
– government, tax or regulatory policies adverse to theemployment services industry
– general economic conditions in international markets
– interest rate and exchange rate fluctuations
The Company disclaims any obligation to update publicly or
revise any forward-looking statements, whether as a result of
new information, future events or otherwise.
Accounting changes The Financial Accounting Standards Board
(“FASB”) issued Statement of Financial Accounting Standards
(“SFAS”) No. 133, “Accounting for Derivative Instruments and
Hedging Activities,” in June 1998. This statement establishes
accounting and reporting standards requiring that every derivative
instrument be recorded on the balance sheet as either an asset
or liability measured at its fair value. The statement requires that
changes in the derivative’s fair value be recognized currently in
earnings unless specific hedge accounting criteria are met, in
which case the gains or losses would offset the related results of
the hedged item. In June 1999, the FASB issued SFAS No. 137,
“Accounting for Derivative Instruments and Hedging Activities—
Deferral of the Effective Date of FASB Statement No. 133,” which
defers the required adoption date of SFAS No. 133 until 2001 for
the Company, however, early adoption is allowed. The Company
has not yet determined the timing or method of adoption or
quantified the impact of adopting this statement. While the
statement could increase volatility in earnings and other
comprehensive income, it is not expected to have a material
impact on the Consolidated Financial Statements.
27

To the Board of Directors and Shareholders of Manpower Inc.:
We have audited the accompanying consolidated balance sheets
of Manpower Inc. (a Wisconsin corporation) and subsidiaries as
of December 31, 1999 and 1998, and the related consolidated
statements of operations, cash flows and shareholders’ equity
for each of the three years in the period ended December 31,
1999. These consolidated financial statements are the
responsibility of the Company’s management. Our responsibility
is to express an opinion on these consolidated financial
statements based on our audits.
We conducted our audits in accordance with generally
accepted auditing standards. Those standards require that we plan
and perform the audit to obtain reasonable assurance about
whether the financial statements are free of material misstatement.
An audit includes examining, on a test basis, evidence supporting
the amounts and disclosures in the financial statements. An audit
also includes assessing the accounting principles used and
significant estimates made by management, as well as evaluating
the overall financial statement presentation. We believe that our
audits provide a reasonable basis for our opinion.
In our opinion, the consolidated financial statements
referred to above present fairly, in all material respects, the
financial position of Manpower Inc. and subsidiaries as of
December 31, 1999 and 1998, and the results of their
operations and their cash flows for each of the three years in the
period ended December 31, 1999, in conformity with generally
accepted accounting principles.
ARTHUR ANDERSEN LLP
Milwaukee, Wisconsin
February 3, 2000
Report of Independent Public Accountants
28
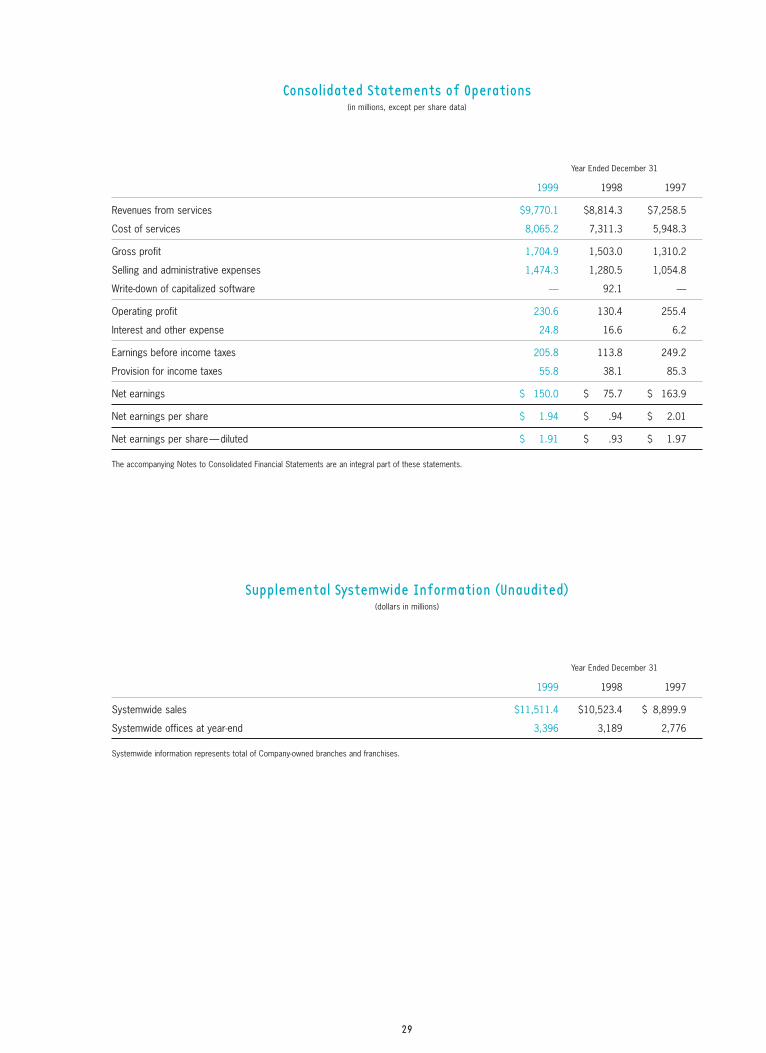
Consolidated Statements of Operations(in millions, except per share data)
Year Ended December 31
1999 1998 1997
Revenues from services $9,770.1 $8,814.3 $7,258.5
Cost of services 8,065.2 7,311.3 5,948.3
Gross profit 1,704.9 1,503.0 1,310.2
Selling and administrative expenses 1,474.3 1,280.5 1,054.8
Write-down of capitalized software — 92.1 —
Operating profit 230.6 130.4 255.4
Interest and other expense 24.8 16.6 6.2
Earnings before income taxes 205.8 113.8 249.2
Provision for income taxes 55.8 38.1 85.3
Net earnings $ 150.0 $ 75.7 $ 163.9
Net earnings per share $ 1.94 $ .94 $ 2.01
Net earnings per share—diluted $ 1.91 $ .93 $ 1.97
The accompanying Notes to Consolidated Financial Statements are an integral part of these statements.
Supplemental Systemwide Information (Unaudited)(dollars in millions)
Year Ended December 31
1999 1998 1997
Systemwide sales $11,511.4 $10,523.4 $ 8,899.9
Systemwide offices at year-end 3,396 3,189 2,776
Systemwide information represents total of Company-owned branches and franchises.
29

December 31
Assets 1999 1998
Current Assets:
Cash and cash equivalents $ 241.7 $ 180.5
Accounts receivable, less allowance for doubtful accounts of $47.1 and $39.5, respectively 1,897.6 1,674.7
Prepaid expenses and other assets 66.0 53.6
Future income tax benefits 52.0 52.8
Total current assets 2,257.3 1,961.6
Other Assets:
Investments in licensees 37.0 33.1
Other assets 242.0 205.7
Total other assets 279.0 238.8
Property and Equipment:
Land, buildings, leasehold improvements and equipment 416.1 411.4
Less: accumulated depreciation and amortization 233.7 220.1
Net property and equipment 182.4 191.3
Total assets $2,718.7 $2,391.7
Consolidated Balance Sheets(in millions, except share data)
30

December 31
Liabilities and Shareholders’ Equity 1999 1998
Current Liabilities:
Accounts payable $ 388.0 $ 347.9
Employee compensation payable 71.9 77.1
Accrued liabilities 180.2 172.0
Accrued payroll taxes and insurance 340.9 319.0
Value added taxes payable 305.6 291.7
Short-term borrowings and current maturities of long-term debt 131.5 103.4
Total current liabilities 1,418.1 1,311.1
Other Liabilities:
Long-term debt 357.5 154.6
Other long-term liabilities 292.5 257.1
Total other liabilities 650.0 411.7
Shareholders’ Equity:
Preferred stock, $.01 par value, authorized 25,000,000 shares, none issued — —
Common stock, $.01 par value, authorized 125,000,000 shares, issued 84,272,460 and 83,279,149 shares, respectively .8 .8
Capital in excess of par value 1,621.4 1,602.7
Accumulated deficit (653.0) (787.7)
Accumulated other comprehensive income (loss) (88.8) (17.9)
Treasury stock at cost, 8,286,400 and 4,349,400 shares, respectively (229.8) (129.0)
Total shareholders’ equity 650.6 668.9
Total liabilities and shareholders’ equity $2,718.7 $2,391.7
The accompanying Notes to Consolidated Financial Statements are an integral part of these balance sheets.
31

Year Ended December 31
1999 1998 1997
Cash Flows from Operating Activities:
Net earnings $ 150.0 $ 75.7 $ 163.9
Adjustments to reconcile net earnings to net cash provided by operating activities:
Depreciation and amortization 63.7 55.6 41.6
Deferred income taxes 15.3 (37.5) 2.0
Provision for doubtful accounts 20.7 12.0 15.9
Write-down of capitalized software — 92.1 —
Change in operating assets and liabilities:
Sale of accounts receivable 25.0 175.0 —
Accounts receivable, net of sale (457.4) (353.2) (398.8)
Other assets (51.7) 9.5 (20.2)
Other liabilities 233.9 236.0 220.9
Cash (used) provided by operating activities (.5) 265.2 25.3
Cash Flows from Investing Activities:
Capital expenditures (74.7) (140.8) (98.6)
Acquisitions of businesses, net of cash acquired (18.8) (31.7) (16.5)
Proceeds from the sale of property and equipment 14.9 1.0 2.8
Cash used by investing activities (78.6) (171.5) (112.3)
Cash Flows from Financing Activities:
Net change in payable to banks 45.5 23.1 50.2
Proceeds from long-term debt 460.4 22.7 90.2
Repayment of long-term debt (259.3) (55.6) (2.5)
Proceeds from stock option and purchase plans 18.7 12.0 10.8
Repurchase of common stock (100.8) (43.9) (81.9)
Dividends paid (15.3) (15.2) (13.8)
Cash provided (used) by financing activities 149.2 (56.9) 53.0
Effect of exchange rate changes on cash (8.9) 1.4 (4.3)
Net increase (decrease) in cash and cash equivalents 61.2 38.2 (38.3)
Cash and cash equivalents, beginning of year 180.5 142.3 180.6
Cash and cash equivalents, end of year $ 241.7 $ 180.5 $ 142.3
Supplemental Cash Flow Information:
Interest paid $ 12.4 $ 18.9 $ 11.3
Income taxes paid 66.9 69.0 92.8
The accompanying Notes to Consolidated Financial Statements are an integral part of these statements.
Consolidated Statements of Cash Flows(in millions)
32
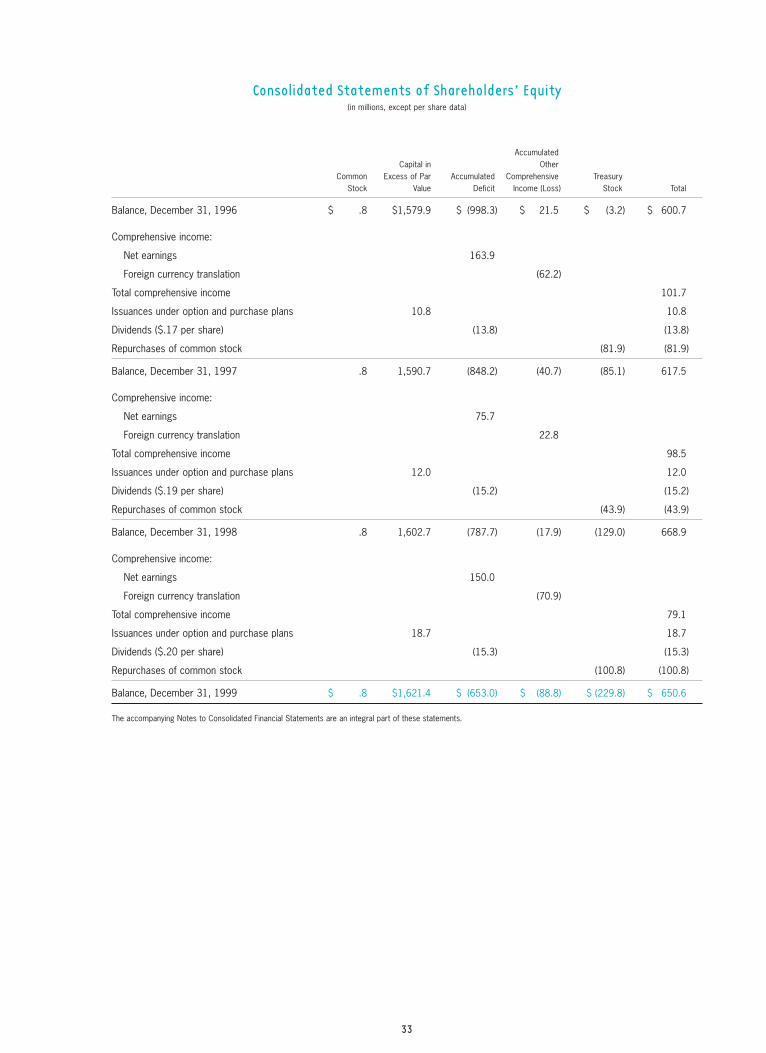
Consolidated Statements of Shareholders’ Equity(in millions, except per share data)
AccumulatedCapital in Other
Common Excess of Par Accumulated Comprehensive TreasuryStock Value Deficit Income (Loss) Stock Total
Balance, December 31, 1996 $ .8 $1,579.9 $ (998.3) $ 21.5 $ (3.2) $ 600.7
Comprehensive income:
Net earnings 163.9
Foreign currency translation (62.2)
Total comprehensive income 101.7
Issuances under option and purchase plans 10.8 10.8
Dividends ($.17 per share) (13.8) (13.8)
Repurchases of common stock (81.9) (81.9)
Balance, December 31, 1997 .8 1,590.7 (848.2) (40.7) (85.1) 617.5
Comprehensive income:
Net earnings 75.7
Foreign currency translation 22.8
Total comprehensive income 98.5
Issuances under option and purchase plans 12.0 12.0
Dividends ($.19 per share) (15.2) (15.2)
Repurchases of common stock (43.9) (43.9)
Balance, December 31, 1998 .8 1,602.7 (787.7) (17.9) (129.0) 668.9
Comprehensive income:
Net earnings 150.0
Foreign currency translation (70.9)
Total comprehensive income 79.1
Issuances under option and purchase plans 18.7 18.7
Dividends ($.20 per share) (15.3) (15.3)
Repurchases of common stock (100.8) (100.8)
Balance, December 31, 1999 $ .8 $1,621.4 $ (653.0) $ (88.8) $ (229.8) $ 650.6
The accompanying Notes to Consolidated Financial Statements are an integral part of these statements.
33
(1) Summary of Significant Accounting PoliciesNature of operations Manpower Inc. (the “Company”) is an
employment services organization with almost 3,400
systemwide offices in 52 countries. The Company’s largest
operations, based on revenues, are located in the United States,
France and the United Kingdom. The Company provides a range
of staffing and workplace management solutions, including
temporary help, contract services and training and testing of
temporary and permanent workers. The Company provides
employment services to a wide variety of customers, none of
which individually comprise a significant portion of revenues
within a given geographic region or for the Company as a whole.
Basis of consolidation The consolidated financial statements
include the accounts of the Company and all subsidiaries. For
subsidiaries in which the Company has an ownership interest
of 50% or less, but more than 20%, the consolidated financial
statements reflect the Company’s ownership share of those
earnings using the equity method of accounting. These
investments are included as Investments in licensees in the
Consolidated Balance Sheets. Included in shareholders’ equity
at December 31, 1999 are $32.0 of unremitted earnings from
investments accounted for using the equity method. All
significant intercompany accounts and transactions have been
eliminated in consolidation.
Revenues The Company generates revenues from sales of
services by its own branch operations and from fees earned on
sales of services by its franchise operations. Franchise fees,
which are included in Revenues from services, were $37.7, $37.8
and $37.5 for the years ended December 31, 1999, 1998 and
1997, respectively.
New accounting pronouncements The Financial Accounting
Standards Board (“FASB”) issued Statement of Financial
Accounting Standards (“SFAS”) No. 133, “Accounting for
Derivative Instruments and Hedging Activities” in June 1998.
This statement establishes accounting and reporting standards
requiring that every derivative instrument be recorded on the
balance sheet as either an asset or liability measured at its fair
value. The statement requires that changes in the derivative’s fair
value be recognized currently in earnings unless specific hedge
accounting criteria are met, in which case the gains or losses
would offset the related results of the hedged item. In June
1999, the FASB issued SFAS No. 137, “Accounting for Derivative
Instruments and Hedging Activities—Deferral of the Effective
Date of FASB Statement No. 133” which defers the required
adoption date of SFAS No. 133 until 2001 for the Company,
however, early adoption is allowed. The Company has not yet
determined the timing or method of adoption or quantified
the impact of adopting this statement. While the statement
could increase volatility in earnings and Accumulated other
comprehensive income (loss), it is not expected to have a
material impact on the Consolidated Financial Statements.
Accounts receivable securitization The Company accounts for
the securitization of accounts receivable in accordance with SFAS
No. 125, “Accounting for Transfers and Servicing of Financial Assets
and Extinguishment of Liabilities.” At the time the receivables are
sold, the balances are removed from the Consolidated Balance
Sheets. Costs associated with the sale of receivables, primarily
related to the discount and loss on sale, are included in other
expense in the Consolidated Statements of Operations.
Foreign currency translation The financial statements of the
Company’s non-U.S. subsidiaries have been translated in
accordance with SFAS No. 52. Under SFAS No. 52, asset and
liability accounts are translated at the current exchange rate and
income statement items are translated at the weighted average
exchange rate for the year. The resulting translation adjustments
are recorded as Accumulated other comprehensive income
(loss), which is a component of Shareholders’ Equity. In
accordance with SFAS No. 109, no deferred taxes have been
recorded related to the cumulative translation adjustments.
Translation adjustments for those operations in highly
inflationary economies and certain other transaction adjustments
are included in earnings. Historically these adjustments have
been immaterial to the Consolidated Financial Statements.
Capitalized software The Company capitalizes purchased
software as well as internally developed software. Internal
software development costs are capitalized from the time
Notes to Consolidated Financial Statements(in millions, except share data)
34

the internal use software is considered probable of completion
until the software is ready for use. Business analysis, system
evaluation, selection and software maintenance costs are
expensed as incurred. Capitalized software costs are amortized
using the straight-line method over the estimated useful life of the
software. The Company regularly reviews the carrying value of all
capitalized software and recognizes a loss when the carrying
value is considered unrealizable. (See Note 5 to the Consolidated
Financial Statements for further information.)
Intangible assets Intangible assets consist primarily of
trademarks and the excess of cost over the fair value of net
assets acquired. Trademarks are amortized on a straight-line
basis over their useful lives. The excess of cost over the fair value
of net assets acquired is amortized on a straight-line basis over
its useful life, estimated based on the facts and circumstances
surrounding each individual acquisition, not to exceed 20 years.
The intangible asset and related accumulated amortization are
removed from the Consolidated Balance Sheets when the
intangible asset becomes fully amortized. The Company regularly
reviews the carrying value of all intangible assets and recognizes
a loss when the unamortized balance is considered unrealizable.
Total intangible assets of $89.4 and $84.3, net of accumulated
amortization of $16.3 and $12.8 at December 31, 1999 and
1998, respectively, are included in Other assets in the
Consolidated Balance Sheets. Amortization expense was $6.9,
$5.4 and $4.4 in 1999, 1998 and 1997, respectively.
Property and equipment A summary of property and equipment
at December 31 is as follows:
1999 1998
Land $ 1.4 $ 1.4
Buildings 20.4 19.8
Other office furniture and equipment 266.3 261.1
Leasehold improvements 128.0 129.1
$416.1 $411.4
Property and equipment are stated at cost and depreciated
using the straight-line method over the following estimated useful
lives: buildings—up to 40 years; leasehold improvements—
lesser of life of asset or lease term; furniture and equipment—
three to ten years. Expenditures for renewals and betterments are
capitalized whereas expenditures for repairs and maintenance
are charged to income as incurred. Upon sale or disposition of
properties, the difference between unamortized cost and the
proceeds is charged or credited to income.
Shareholders’ equity The Board of Directors has authorized the
repurchase of up to 15 million shares of stock under the
Company’s share repurchase program. Share repurchases may be
made from time to time and may be implemented through a variety
of methods, including open market purchases, block transactions,
privately negotiated transactions, accelerated share repurchase
programs, forward repurchase agreements or similar facilities.
Total shares repurchased under the program at December 31,
1999 and 1998, were 8.3 million and 4.3 million shares,
respectively, at a cost of $229.8 and $129.0, respectively.
Advertising costs The Company generally expenses production
costs of media advertising as they are incurred. Advertising
expenses, including the sponsorship of the Millennium Dome and
the 1998 World Cup, were $39.6, $41.7 and $21.6 in 1999,
1998 and 1997, respectively.
Statement of cash flows The Company considers all highly
liquid investments with a maturity of three months or less when
purchased to be cash equivalents.
Use of estimates The preparation of financial statements in
conformity with generally accepted accounting principles requires
management to make estimates and assumptions that affect the
reported amounts of assets and liabilities, disclosure of contingent
assets and liabilities at the date of the financial statements and
the reported amounts of revenues and expenses during the
reporting period. Actual results could differ from these estimates.
Reclassifications Certain amounts in the 1998 and 1997
financial statements have been reclassified to be consistent with
the current year presentation.
35

(2) Earnings per Share The calculation of net earnings per
share for the years ended December 31, 1999, 1998 and 1997,
is as follows:
1999 1998 1997
Net earnings per share:
Net earnings available to common shareholders $150.0 $ 75.7 $163.9
Weighted average common shares outstanding (in millions) 77.3 80.1 81.6
$ 1.94 $ .94 $ 2.01
The calculation of net earnings per share—diluted for the
years ended December 31, 1999, 1998 and 1997, is as follows:
1999 1998 1997
Net earnings per share—diluted:
Net earnings available to common shareholders $150.0 $ 75.7 $163.9
Weighted average common shares outstanding (in millions) 77.3 80.1 81.6
Effect of dilutive securities—Stock options (in millions) 1.4 1.1 1.8
78.7 81.2 83.4
$ 1.91 $ .93 $ 1.97
The calculation of net earnings per share—diluted for the
years ended December 31, 1999, 1998 and 1997 does not
include certain stock option grants because the exercise price
for these options is greater than the average market price of the
common shares during that year. The number, exercise prices and
weighted average remaining life of these antidilutive options is
as follows:
1999 1998 1997
Shares (000) 1,146 625 10
Exercise prices $27–$49 $32–$49 $49
Weighted average remaining life 7.9 years 8.1 years 9.6 years
(3) Income Taxes The provision for income taxes consists of:
1999 1998 1997
Current:
United States:
Federal $ (4.0) $ 9.9 $ 14.4
State 5.6 3.3 2.1
Foreign 38.9 62.4 66.8
Total current 40.5 75.6 83.3
Deferred:
United States:
Federal (4.2) (21.3) 14.0
State (.6) (3.7) .8
Foreign 20.1 (12.5) (12.8)
Total deferred 15.3 (37.5) 2.0
Total provision $ 55.8 $ 38.1 $ 85.3
A reconciliation between taxes computed at the United
States Federal statutory tax rate of 35% and the consolidated
effective tax rate is as follows:
1999 1998 1997
Income tax based on statutory rate $ 72.0 $ 39.8 $ 87.2
Increase (decrease) resulting from:
Foreign tax rate differences 3.9 3.2 2.3
State income taxes 2.6 (.4) 2.9
Benefit on dissolution(a) (15.7) — —
Tax effect of foreign repatriations (11.3) 2.8 (1.1)
Change in valuation reserve 5.0 (7.6) (3.6)
Other, net (.7) .3 (2.4)
Total provision $ 55.8 $ 38.1 $ 85.3
(a) The Benefit on dissolution of $15.7 represents the one-time tax benefit realized
during 1999 related to the dissolution of a non-operating subsidiary.
Notes to Consolidated Financial Statements (continued)(in millions, except share data)
36

Deferred income taxes are recorded on temporary
differences at the tax rate expected to be in effect when the
temporary differences reverse. Temporary differences which gave
rise to the deferred tax assets at December 31 are as follows:
1999 1998
Current future income tax benefits:
Accrued payroll taxes and insurance $ 18.6 $ 18.7
Employee compensation payable 12.9 11.9
Other 21.8 24.7
Valuation allowance (1.3) (2.5)
52.0 52.8
Noncurrent future income tax benefits:
Accrued payroll taxes and insurance 29.6 24.7
Pension and postretirement benefits 20.7 16.6
Net operating losses and other 14.7 42.6
Valuation allowance (24.6) (18.4)
40.4 65.5
Total future tax benefits $ 92.4 $118.3
Noncurrent future income tax benefits have been classified
as Other assets in the Consolidated Balance Sheets.
The Company has foreign net operating loss carryforwards
totaling $59.5 that expire as follows: 2000–$.2, 2001–$.2,
2002–$.1, 2003–$.5, 2004–$1.0, 2005 and thereafter–
$51.8 and $5.7 with no expiration. The Company has U.S. State
net operating loss carryforwards totaling $190.7 that expire as
follows: 2003–$10.4, 2004–$80.6, 2005 and thereafter–
$99.7. The Company has recorded a deferred tax asset of $37.2
at December 31, 1999, for the benefit of these net operating
losses. Realization of this asset is dependent on generating
sufficient taxable income prior to the expiration of the loss
carryforwards. A valuation allowance of $23.5 has been
recorded at December 31, 1999, as management believes that
realization of certain loss carryforwards is unlikely.
Pretax income of foreign operations was $169.1, $145.2
and $166.9 in 1999, 1998 and 1997, respectively. United States
income taxes have not been provided on undistributed earnings
of foreign subsidiaries that are considered to be permanently
invested. If such earnings were remitted, foreign tax credits
would substantially offset any resulting United States income tax.
At December 31, 1999, the estimated amount of unremitted
earnings of the foreign subsidiaries totaled $557.5.
(4) Accounts Receivable Securitization The Company
and certain of its U.S. subsidiaries entered into an agreement (the
“Receivables Facility”) in December 1998 with a financial institution
whereby it sells on a continuous basis an undivided interest in all
eligible trade accounts receivable. Pursuant to the Receivables
Facility, the Company formed Ironwood Capital Corporation
(“ICC”), a wholly-owned, special purpose, bankruptcy-remote
subsidiary. ICC was formed for the sole purpose of buying and
selling receivables generated by the Company and certain
subsidiaries of the Company. Under the Receivables Facility, the
Company and certain subsidiaries, irrevocably and without
recourse, transfer all of their accounts receivables to ICC. ICC, in
turn, has sold and, subject to certain conditions, may from time
to time sell an undivided interest in these receivables and is
permitted to receive advances of up to $200.0 for the sale of such
undivided interest. The agreement expires in December 2000.
This two-step transaction is accounted for as a sale of
receivables under the provisions of SFAS No. 125, “Accounting
for Transfers and Servicing of Financial Assets and
Extinguishment of Liabilities.” There was $200.0 and $175.0
advanced under the Receivables Facility at December 31, 1999
and 1998, respectively, and accordingly, that amount of
accounts receivable has been removed from the Consolidated
Balance Sheets. Costs associated with the sale of receivables,
primarily related to the discount and loss on sale, were $9.8 and
$.7 in 1999 and 1998, respectively, and are included in other
expenses in the Consolidated Statements of Operations.
(5) Write-down of Capitalized Software In accordance
with its ongoing review of capitalized software, in December
1998 the Company recorded a $92.1 ($57.1 after tax, or $.70
per share on a diluted basis) non-cash charge to write off the
carrying value of software costs and certain hardware and
network infrastructure costs related to the development of a
complex and proprietary information system for its North
American branch office administration, invoicing and payroll
processing. This comprehensive information system had been
under development for several years and portions of the system
were in field testing and deployment.
After a period of field testing, management and the Board
of Directors decided in December 1998 that it was necessary to
significantly alter the technological architecture of the system in
order to reduce ongoing support, maintenance and communications
37

costs. This decision required the application software under
development to be abandoned and a new application to be
purchased or developed for the new architecture. In addition to the
developed software, certain hardware, network infrastructure
and software licenses were also abandoned as a result of the
change in system architecture. The non-cash charge included the
costs of abandoning all of these assets.
The net capitalized software balance of $6.3 and $6.7 as
of December 31, 1999 and 1998, respectively, is included in
Other assets in the Consolidated Balance Sheets.
(6) Debt Information concerning short-term borrowings at
December 31 is as follows:
1999 1998
Payable to banks $127.9 $ 99.3
Average interest rates 3.9% 3.5%
The Company and some of its foreign subsidiaries maintain
lines of credit with foreign financial institutions to meet short-term
working capital needs. Such lines totaled $160.4 at December 31,
1999, of which $32.5 was unused. The Company has no
significant compensating balance requirements or commitment
fees related to these lines.
A summary of long-term debt at December 31 is as follows:
1999 1998
Euro-denominated notes, at a rate of 5.7% $201.2 $ —
Commercial paper, maturing within 90 days, at average interest rates of 6.3% and 5.5%, respectively 14.8 72.0
Revolving credit agreements:
U.S. dollar-denominated borrowings, ata rate of 6.4% and 5.8%, respectively 95.0 40.0
Yen-denominated borrowings, ata rate of .5% and .6%, respectively 38.7 35.3
Other 11.4 11.4
361.1 158.7
Less—Current maturities 3.6 4.1
Long-term debt $357.5 $154.6
Euro Notes In July 1999, the Company issued €200.0 in
unsecured notes due in July 2006. Net proceeds of $200.9 from
the issuance of these notes were used to repay amounts
outstanding under the Company’s unsecured revolving credit
agreement and commercial paper program.
These notes provide a hedge of the Company’s net
investment in its European subsidiaries with Euro functional
currencies. Since the Company’s net investment in these
subsidiaries exceeds the amount of the notes, all translation
gains or losses related to these notes is included as a
component of Accumulated other comprehensive income (loss).
Revolving Credit Agreements The Company has a $415.0
unsecured revolving credit agreement that allows for borrowings
in various currencies and includes a $90.0 commitment to be
used exclusively for standby letters of credit. Outstanding letters
of credit totaled $57.9 and $48.2 as of December 31, 1999
and 1998, respectively. Approximately $176.5 of additional
borrowings were available to the Company under this agreement
at December 31, 1999.
The interest rate and facility fee on the entire line and
the issuance fee on the letter of credit commitment related to
this agreement vary based on the Company’s debt rating and
borrowing level. Currently, the interest rate is LIBOR plus .2%,
and the fees are .1% and .4%, respectively. The facility matures
on November 25, 2002, and may be increased to a maximum of
$500.0 or extended for an additional year with the lenders’
consent. The agreement requires, among other things, that the
Company comply with minimum interest coverage and debt-to-
capitalization ratios and a maximum subsidiary debt level.
In November 1999, the Company entered into a $300.0
revolving credit agreement. The interest rate and facility fee
on the entire line and the participation fee vary based on
the Company’s debt rating and borrowing level. Currently, the
fees are .1% and .1%, respectively. The facility matures on
November 22, 2000, and may be extended for an additional year
with the lenders’ consent. This agreement has similar restrictive
covenants to the Company’s $415.0 revolving credit agreement.
As of December 31, 1999, the Company had no borrowings
under this agreement.
The Company has an interest rate swap agreement,
expiring in 2001, to fix the interest rate at 6.0% on $50.0 of the
Company’s borrowings under the revolving credit agreements.
Notes to Consolidated Financial Statements (continued)(in millions, except share data)
38

The fair value of this agreement and the impact on the interest
expense recorded during 1999 and 1998 were not material.
Other Due to the availability of long-term financing, commercial
paper borrowings have been classified as long-term debt. The
carrying value of long-term debt approximates fair value, except for
the Euro-denominated notes, which have a fair value of $191.6.
The maturities of long-term debt payable within each of the
four years subsequent to December 31, 2000 are as follows:
2001–$2.2, 2002–$149.6, 2003–$.2, 2004–$.1 and
thereafter–$205.4.
(7) Stock Compensation Plans The Company accounts
for all of its fixed stock option plans and the 1990 Employee
Stock Purchase Plan in accordance with APB Opinion No. 25
and related Interpretations. Accordingly, no compensation cost
related to these plans was charged against earnings in 1999,
1998 and 1997. Had the Company determined compensation
cost consistent with the method of SFAS No. 123, the Company’s
net earnings and net earnings per share would have been
reduced to the pro forma amounts indicated as follows:
1999 1998 1997
Net earnings:
as reported $150.0 $ 75.7 $163.9
pro forma 146.4 74.4 162.5
Net earnings per share:
as reported $ 1.94 $ .94 $ 2.01
pro forma 1.90 .93 1.99
Net earnings per share–diluted:
as reported $ 1.91 $ .93 $ 1.97
pro forma 1.86 .92 1.95
The fair value of each option grant is estimated on the
date of grant using the Black-Scholes option-pricing model with
the following weighted-average assumptions used for grants in
1999, 1998 and 1997, respectively: risk-free interest rates of
5.6%, 4.5% and 5.8%; expected volatility of 17.2%, 24.4% and
14.4%; dividend yield of .5% in all years; and expected lives of
7.6 years, 5.7 years and 5.0 years. The weighted-average fair
value of options granted was $6.16, $4.36 and $5.48 in 1999,
1998 and 1997, respectively.
Fixed stock option plans The Company has reserved 7,625,000
shares of common stock for issuance under the Executive Stock
Option and Restricted Stock Plans. Under the plans, all full-time
employees of the Company are eligible to receive stock options,
purchase rights and restricted stock. The options, rights and
stock are granted to eligible employees at the discretion of a
committee appointed by the Board of Directors.
All options have generally been granted at a price equal to
the fair market value of the Company’s common stock at the date
of grant. The purchase price per share pursuant to a purchase
right is determined by the Board of Directors. The committee
also determines the period during which options and rights are
exercisable. Generally, options are granted with a vesting period of
up to five years and expire ten years from the date of grant. Rights
may generally be exercised for up to sixty days from the date of
grant. Under the plans, the committee may also authorize the
granting of stock appreciation rights and cash equivalent rights
in conjunction with the stock options and purchase rights,
respectively. As of December 31, 1999, no purchase rights, stock
appreciation rights or cash equivalent rights had been granted.
The Company has reserved 800,000 shares of common
stock for issuance under the 1991 Directors Stock Option Plan.
Under the plan, each non-employee director of the Company may
receive an option to purchase shares of the Company’s common
stock in lieu of cash compensation. The number of shares
covered by the option is determined pursuant to a formula set
forth in the plan. The per share purchase price for each option
awarded is equal to the fair market value of the Company’s
common stock at the date of grant. Options are exercisable for
the vested portion during the director’s tenure and a limited
period thereafter.
The Company also has the Savings Related Share Option
Scheme for United Kingdom employees with at least one year of
service. These employees are offered the opportunity to obtain
an option for a specified number of shares of common stock
at not less than 85% of the market value of the stock on the day
prior to the offer to participate in the plan. Options vest after
either 3, 5 or 7 years, but may lapse earlier. Funds used to
purchase the shares are accumulated through specified payroll
deductions over a 60-month period.
39

Information related to options outstanding under the plans,
and the related weighted-average exercise prices, is as follows:
1999 1998 1997
Shares Shares Shares(000) Price (000) Price (000) Price
Options outstanding, beginning of period 3,840 $21 3,362 $21 3,421 $19
Granted 1,119 26 930 24 384 35
Exercised (496) 17 (237) 15 (374) 17
Expired or cancelled (92) 25 (215) 35 (69) 24
Options outstanding, end of period 4,371 $23 3,840 $21 3,362 $21
Options exercisable, end of period 2,055 $20 2,354 $17 2,378 $16
Options outstanding as of December 31, 1999 are
as follows:
Options outstanding Options exercisable
Weighted-average Weighted- Weighted-
remaining average averageExercise Shares contractual exercise Shares exerciseprices (000) life price (000) price
$10–$15 456 1.7 $12 272 $13
16– 20 1,176 3.4 16 1,099 16
21– 30 1,815 8.5 24 424 24
31– 35 685 8.5 34 102 32
36– 49 239 7.0 38 158 37
4,371 6.3 $23 2,055 $20
Other stock plans The Company has reserved 2,250,000
shares of common stock for issuance under the 1990 Employee
Stock Purchase Plan. Under the plan, designated Manpower
employees meeting certain service requirements may purchase
shares of the Company’s common stock through payroll
deductions. These shares may be purchased at the lesser of
85% of their fair market value at the beginning or end of each
year. During 1999, 1998 and 1997, 138,500, 155,500 and
239,200 shares, respectively, were purchased under the plan.
(8) Retirement Plans Defined benefit plans The Company
sponsors several qualified and nonqualified pension plans cover-
ing substantially all permanent employees. The reconciliation of
the changes in the plans’ benefit obligations and the fair value of
plan assets and the statement of the funded status of the plans
are as follows:
U.S. Plans Non-U.S. Plans
1999 1998 1999 1998
Change in benefit obligation:
Benefit obligation, beginning of year $ 31.1 $26.8 $49.9 $35.9
Service cost 1.6 1.2 4.0 3.0
Interest cost 2.4 1.9 2.7 2.4
Special termination benefits 8.0 — — —
Actuarial (gain) loss (3.2) 2.3 3.3 8.0
Plan participant contributions — — 1.0 .9
Benefits paid (1.7) (1.1) (1.8) (1.8)
Currency exchange rate changes — — (.9) 1.5
Benefit obligation, end of year 38.2 31.1 58.2 49.9
Change in plan assets:
Fair value of plan assets, beginning of year 25.7 26.2 44.2 36.4
Actual return on plan assets 5.8 .2 7.3 4.6
Plan participant contributions — — 1.0 .9
Company contributions 1.1 .4 3.0 2.8
Benefits paid (1.7) (1.1) (1.8) (1.8)
Currency exchange rate changes — — (.3) 1.3
Fair value of plan assets, end of year 30.9 25.7 53.4 44.2
Funded status:
Funded status of plan (7.3) (5.4) (4.8) (5.7)
Unrecognized net (gain) loss (10.6) (3.6) 5.4 6.7
Unrecognized prior service cost — — .3 .3
Unrecognized transitional asset (.6) (.6) — —
Net amount recognized $(18.5) $ (9.6) $ .9 $ 1.3
Amounts recognized:
Prepaid benefit cost $ — $ — $ 3.8 $ 3.9
Accrued benefit liability (18.5) (9.6) (2.9) (2.6)
Net amount recognized $(18.5) $ (9.6) $ .9 $ 1.3
Notes to Consolidated Financial Statements (continued)(in millions, except share data)
40

The components of the net periodic benefit cost for all
plans are as follows:
1999 1998 1997
Service cost $ 5.6 $ 4.2 $ 3.5
Interest cost 5.1 4.3 4.0
Expected return on assets (5.0) (4.8) (8.8)
Amortization of:
unrecognized loss .1 — 4.4
unrecognized transition asset (.2) (.2) (.2)
Special termination benefits 8.0 — —
Total benefit cost $13.6 $ 3.5 $ 2.9
The weighted-average assumptions used in the measure-
ment of the benefit obligation are as follows:
U.S. Plans Non-U.S. Plans
1999 1998 1999 1998
Discount rate 7.5% 6.8% 5.5% 5.5%
Expected return on assets 8.5% 8.5% 6.8% 6.8%
Rate of compensation increase 6.0% 6.0% 4.2% 4.2%
Projected salary levels utilized in the determination of the
projected benefit obligation for the pension plans are based
upon historical experience. The unrecognized transitional asset
is being amortized over the estimated remaining service lives of
the employees. Plan assets are primarily comprised of common
stocks and U.S. government and agency securities.
In April 1999, the Company amended a U.S. plan to allow
for special termination benefits related to senior executives. This
amendment resulted in a one-time expense of $8.0 in 1999.
Effective February 29, 2000, the Company will freeze all
benefits in each of the U.S. retirement plans. In connection with this
change, a voluntary early retirement package and certain other
benefits were offered to eligible employees. The net gain or loss
associated with this plan freeze and voluntary early retirement
offering have not yet been determined but are not expected to
have a material impact on the Consolidated Financial Statements.
Retiree health care plan The Company provides medical and
dental benefits to eligible retired employees in the United States.
The reconciliation of the changes in the plan’s benefit obligation
and the statement of the funded status of the plan are as follows.
Due to the nature of the plan, there are no plan assets.
1999 1998
Change in benefit obligation:
Benefit obligation, beginning of year $28.8 $23.7
Service cost 2.4 1.9
Interest cost 1.9 1.7
Actuarial (gain) loss (6.2) 1.7
Benefits paid (.3) (.2)
Benefit obligation, end of year 26.6 28.8
Unrecognized net gain (loss) 6.1 (.2)
Accrued liability recognized $32.7 $28.6
The components of net periodic benefit cost for this plan
are as follows:
1999 1998 1997
Service cost $2.4 $1.9 $1.5
Interest cost 1.9 1.7 1.5
Total benefit cost $4.3 $3.6 $3.0
The discount rate used in the measurement of the benefit
obligation was 7.5% in 1999 and 6.8% in 1998.
The health care cost trend rate was assumed to be 7.0% for
1999 and decreases gradually to 6.0% for the years 2001 and
beyond. Assumed health care cost trend rates have a significant
effect on the amounts reported. A one-percentage point change
in the assumed health care cost trend rate would have the
following effects:
1% 1% increase decrease
Effect on total of service and interest cost components $1.1 $ (.9)
Effect on postretirement benefit obligation 5.7 (4.6)
41
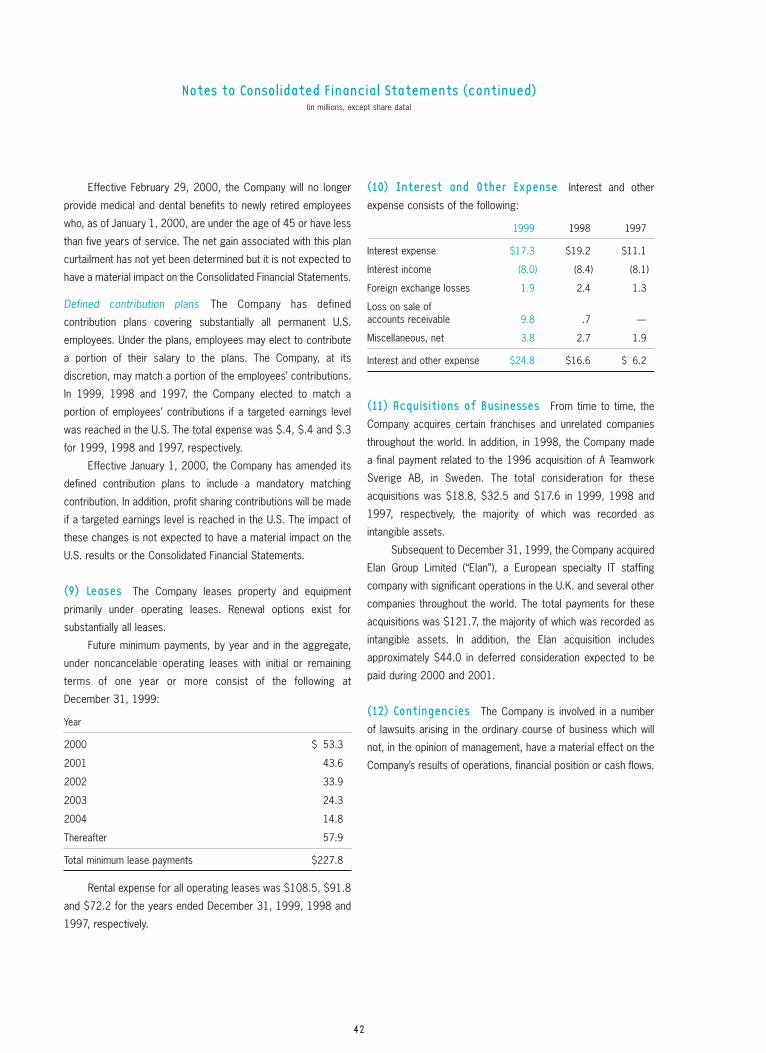
Effective February 29, 2000, the Company will no longer
provide medical and dental benefits to newly retired employees
who, as of January 1, 2000, are under the age of 45 or have less
than five years of service. The net gain associated with this plan
curtailment has not yet been determined but it is not expected to
have a material impact on the Consolidated Financial Statements.
Defined contribution plans The Company has defined
contribution plans covering substantially all permanent U.S.
employees. Under the plans, employees may elect to contribute
a portion of their salary to the plans. The Company, at its
discretion, may match a portion of the employees’ contributions.
In 1999, 1998 and 1997, the Company elected to match a
portion of employees’ contributions if a targeted earnings level
was reached in the U.S. The total expense was $.4, $.4 and $.3
for 1999, 1998 and 1997, respectively.
Effective January 1, 2000, the Company has amended its
defined contribution plans to include a mandatory matching
contribution. In addition, profit sharing contributions will be made
if a targeted earnings level is reached in the U.S. The impact of
these changes is not expected to have a material impact on the
U.S. results or the Consolidated Financial Statements.
(9) Leases The Company leases property and equipment
primarily under operating leases. Renewal options exist for
substantially all leases.
Future minimum payments, by year and in the aggregate,
under noncancelable operating leases with initial or remaining
terms of one year or more consist of the following at
December 31, 1999:
Year
2000 $ 53.3
2001 43.6
2002 33.9
2003 24.3
2004 14.8
Thereafter 57.9
Total minimum lease payments $227.8
Rental expense for all operating leases was $108.5, $91.8
and $72.2 for the years ended December 31, 1999, 1998 and
1997, respectively.
(10) Interest and Other Expense Interest and other
expense consists of the following:
1999 1998 1997
Interest expense $17.3 $19.2 $11.1
Interest income (8.0) (8.4) (8.1)
Foreign exchange losses 1.9 2.4 1.3
Loss on sale of accounts receivable 9.8 .7 —
Miscellaneous, net 3.8 2.7 1.9
Interest and other expense $24.8 $16.6 $ 6.2
(11) Acquisitions of Businesses From time to time, the
Company acquires certain franchises and unrelated companies
throughout the world. In addition, in 1998, the Company made
a final payment related to the 1996 acquisition of A Teamwork
Sverige AB, in Sweden. The total consideration for these
acquisitions was $18.8, $32.5 and $17.6 in 1999, 1998 and
1997, respectively, the majority of which was recorded as
intangible assets.
Subsequent to December 31, 1999, the Company acquired
Elan Group Limited (“Elan”), a European specialty IT staffing
company with significant operations in the U.K. and several other
companies throughout the world. The total payments for these
acquisitions was $121.7, the majority of which was recorded as
intangible assets. In addition, the Elan acquisition includes
approximately $44.0 in deferred consideration expected to be
paid during 2000 and 2001.
(12) Contingencies The Company is involved in a number
of lawsuits arising in the ordinary course of business which will
not, in the opinion of management, have a material effect on the
Company’s results of operations, financial position or cash flows.
Notes to Consolidated Financial Statements (continued)(in millions, except share data)
42

(13) Business Segment Data by Geographical AreaThe Company is organized and managed on a geographical
basis. Each country has its own distinct operations, is managed
locally by its own management team, and maintains its own
financial reports. Under SFAS No. 131, “Disclosures about
Segments of an Enterprise and Related Information,” the
Company has four reportable segments— the United States,
France, the United Kingdom and Other Europe. All remaining
countries have never met the quantitative thresholds for
determining reportable segments.
Each segment derives at least 97% of its revenues from
the placement of temporary help. The remaining revenues are
derived from other employment services, including contract
services and training and testing of temporary and permanent
workers. Segment revenues represent sales to external
customers within a single country. Due to the nature of its
business, the Company does not have export or intersegment
sales. The Company provides employment services to a wide
variety of customers, none of which individually comprise a
significant portion of revenues within a reporting segment,
geographic region or for the Company as a whole.
The accounting policies of the segments are the same
as those described in the summary of significant accounting
policies. The Company evaluates performance based on
Operating Unit Profit, which is equal to segment revenues less
direct costs and branch and national head office operating costs.
This profit measure does not include nonrecurring losses,
goodwill amortization, interest and other income and expense
amounts or income taxes. Total assets for the segments are
reported after the elimination of Investments in subsidiaries and
Intercompany accounts.
1999 1998 1997
Revenues from services:
United States(a) $2,250.5 $2,152.8 $1,993.7
Foreign:
France 3,775.1 3,639.5 2,716.7
United Kingdom 1,170.3 1,088.2 989.1
Other Europe 1,517.2 1,152.6 855.4
Other Countries 1,057.0 781.2 703.6
Total foreign 7,519.6 6,661.5 5,264.8
$9,770.1 $8,814.3 $7,258.5
Operating Unit Profit:
United States $ 80.3 $ 78.0 $ 92.6
France 100.9 77.0 91.2
United Kingdom 40.2 42.3 39.8
Other Europe 63.2 49.2 38.8
Other Countries 16.6 20.9 30.8
301.2 267.4 293.2
Nonrecurring expenses(b) 28.0 — —
Write-down of capitalized software(c) — 92.1 —
Corporate expenses 35.7 39.5 33.4
Amortization of intangible assets 6.9 5.4 4.4
Interest and other expense 24.8 16.6 6.2
Earnings before income taxes $ 205.8 $ 113.8 $ 249.2
(a) Total systemwide sales in the United States, which includes sales of Company-
owned branches and franchises, were $3,758.7, $3,577.2 and $3,340.2 for the
years ended December 31, 1999, 1998 and 1997, respectively.
(b) Represents nonrecurring items ($16.4 after tax) in the second quarter of
1999 related to employee severances, retirement costs and other associated
realignment costs.
(c) The write-down of capitalized software relates to the abandonment of an
information system that was being developed in the U.S. (See Note 5 to the
Consolidated Financial Statements for further information.)
43

1999 1998 1997
Depreciation and amortization expense:
United States $ 16.4 $ 14.4 $ 10.9
France 12.2 12.5 10.0
United Kingdom 8.2 8.1 6.8
Other Europe 12.1 9.0 5.9
Other Countries 6.3 4.3 2.8
$ 55.2 $ 48.3 $ 36.4
Earnings from investments in licensees:
United States $ .1 $ .2 $ .3
Other Europe 2.0 1.4 2.0
Other Countries .9 .9 .6
$ 3.0 $ 2.5 $ 2.9
Total assets:
United States $ 364.4 $ 285.8 $ 431.9
France 1,140.0 1,128.3 871.3
United Kingdom 269.9 230.2 201.9
Other Europe 566.3 427.6 307.3
Other Countries 293.9 253.3 190.2
Corporate(b) 84.2 66.5 44.4
$2,718.7 $2,391.7 $2,047.0
1999 1998 1997
Investments in licensees:
United States $ .9 $ .5 $ .3
Other Europe 34.0 31.5 30.1
Other Countries 2.1 1.1 2.4
$ 37.0 $ 33.1 $ 32.8
Long-lived assets:
United States(a) $ 44.2 $ 48.0 $ 82.3
Foreign:
France 51.4 66.3 42.0
United Kingdom 26.2 30.2 28.1
Other Europe 42.3 34.3 19.1
Other Countries 25.3 19.3 14.7
Total foreign 145.2 150.1 103.9
Corporate(b) 2.1 3.9 2.8
$191.5 $202.0 $189.0
Additions to long-lived assets:
United States $ 16.7 $ 64.0 $ 48.8
France 16.9 33.4 17.7
United Kingdom 4.9 10.0 11.3
Other Europe 25.2 24.1 14.7
Other Countries 12.2 9.4 8.5
Corporate(b) 1.0 .9 3.2
$ 76.9 $141.8 $104.2
(a) Long-lived assets reflect the write-down of capitalized software related to the
abandonment of an information system that was being developed in the U.S.
(See Note 5 to the Consolidated Financial Statements for further information.)
(b) Corporate assets include assets that are not used in the operations of any
geographical segment.
Notes to Consolidated Financial Statements (continued)(in millions, except share data)
44

Quarterly Data (Unaudited)(in millions, except per share data)
First Second Third FourthYear Ended December 31, 1999 Quarter Quarter Quarter Quarter Total
Revenues from services $2,175.2 $2,327.6 $2,606.8 $2,660.5 $9,770.1
Gross profit 380.2 404.7 451.8 468.2 1,704.9
Net earnings 20.6 31.8 48.9 48.7 150.0
Net earnings per share $ .26 $ .41 $ .64 $ .64 $ 1.94
Net earnings per share—diluted $ .26 $ .40 $ .63 $ .63 $ 1.91
Dividends per share $ — $ .10 $ — $ .10 $ .20
Market price—
High $ 28 $ 259⁄16 $ 2915⁄16 $ 3811⁄16
Low 221⁄4 21 213⁄16 287⁄16
Year Ended December 31, 1998
Revenues from services $1,872.9 $2,136.1 $2,377.8 $2,427.5 $8,814.3
Gross profit 327.4 360.4 398.1 417.1 1,503.0
Net earnings (loss) 21.7 26.2 42.9 (15.1) 75.7
Net earnings (loss) per share $ .27 $ .32 $ .54 $ (.19) $ .94
Net earnings (loss) per share—diluted $ .26 $ .32 $ .53 $ (.19) $ .93
Dividends per share $ — $ .09 $ — $ .10 $ .19
Market price—
High $ 429⁄16 $ 447⁄8 $ 301⁄8 $ 277⁄16
Low 335⁄8 2711⁄16 20 193⁄8
The Company’s common stock is listed for trading on the New York Stock Exchange, which is the principal exchange for trading in the Company’s shares.
45

Year Ended December 31 1999 1998 1997 1996 1995
Operations Data:
Revenues from services $9,770.1 $8,814.3 $7,258.5 $6,079.9 $5,484.2
Gross profit 1,704.9 1,503.0 1,310.2 1,148.0 1,000.8
Write-down of capitalized software — (92.1) — — —
Operating profit 230.6 130.4 255.4 227.0 211.7
Net earnings 150.0 75.7 163.9 162.3 128.0
Per Share Data:
Net earnings $ 1.94 $ .94 $ 2.01 $ 1.98 $ 1.68
Net earnings—diluted 1.91 .93 1.97 1.94 1.59
Dividends .20 .19 .17 .15 .13
Balance Sheet Data:
Total assets $2,718.7 $2,391.7 $2,047.0 $1,752.3 $1,517.8
Long-term debt 357.5 154.6 189.8 100.8 61.8
The Notes to Consolidated Financial Statements should be read in conjunction with the above summary, specifically Note 5 which discusses the write-down of
capitalized software.
Selected Financial Data(in millions, except per share data)
46

47
International HeadquartersP.O. Box 2053
5301 North Ironwood Road
Milwaukee, WI 53201 USA
414-961-1000
www.manpower.com
Transfer Agent and RegistrarChaseMellon Shareholder
Services, L.L.C.
New York, NY
www.chasemellon.com
Stock Exchange ListingNYSE Symbol: MAN
10-K ReportA copy of form 10-K filed with
the Securities and Exchange
Commission for the year ended
December 31, 1999 is available
without charge after March 31, 2000
by writing to:
Michael J. Van Handel
Manpower Inc.
P.O. Box 2053
5301 North Ironwood Road
Milwaukee, WI 53201 USA
Annual Meeting of ShareholdersApril 17, 2000
10:00 a.m.
Marcus Center for the Performing Arts
929 North Water Street
Milwaukee, WI 53202 USA
DirectorsJohn R. Walter, Chairman
Retired President and COO of
AT&T Corp. and Chairman
of Ashlin Management Corp.
Jeffrey A. Joerres
President & Chief Executive Officer
Manpower Inc.
Dudley J. Godfrey, Jr.
Senior Partner
Godfrey & Kahn, S.C.
Marvin B. Goodman
Retired principal shareholder and
officer of Manpower Services
(Toronto) Limited, a Company franchise
J. Ira Harris
Chairman of J.I. Harris & Associates
and Vice Chairman of The Pritzker
Organization, L.L.C.
Newton N. Minow
Counsel and former partner of
Sidley & Austin
Gilbert Palay
Retired Senior Executive
Vice President, Manpower Inc.
Dennis Stevenson
Chairman of AerFi Group,
Halifax plc and Pearson plc
Terry A. Hueneke
Executive Vice President
Manpower Inc.
Executive OfficersJeffrey A. Joerres
President & Chief Executive Officer
Terry A. Hueneke
Executive Vice President
The Americas, Japan, Australia
and the Far East
Michael J. Van Handel
Senior Vice President,
Chief Financial Officer and Secretary
Senior ManagementMichael Grunelius
Managing Director
France & Region
Yoav Michaely
Senior Vice President
Other Europe, Middle East
and Africa
Dominique Turcq
Senior Vice President
Strategic Planning
Corporate Information

Argentina
Australia
Austria
Belgium
Bolivia
Brazil
Canada
Chile
Colombia
Costa Rica
Czech Republic
Denmark
Ecuador
Finland
France
Germany
Greece
Guatemala
Hong Kong
Honduras
Hungary
India
Ireland
Israel
Italy
Japan
Korea
Luxembourg
Malaysia
Mexico
Monaco
Morocco
Netherlands
New Zealand
Norway
Panama
Paraguay
Peru
Portugal
Puerto Rico
Russia
Singapore
South Africa
Spain
Sweden
Switzerland
Taiwan
Thailand
United Kingdom
United States
Uruguay
Venezuela
Principal Operating Units
48

Des
ign:
Ede
lman
Wor
ldw
ide
Ph
otog
raph
y: K
evin
And
erso
n
Prin
ting:
Act
ive
Gra
phic
s

International Headquarters P.O. Box 2053, 5301 North Ironwood Road Milwaukee, Wisconsin 53201 USA
Telephone 414–961–1000 www.manpower.com
AR–100 (3/00) © 2000 Manpower Inc.