Embed Size (px)
Citation preview
Prepared by: Muhammad Muzzammil Basraa Research officer Bureau of Emigration & Overseas Employment.
SECTION III
TRENDS OF EXPORT OF MANPOWER This section presents the performance of Bureau (H.Q)’s and its regional offices namely
“Protectorates of Emigrants during the year 2016 (January to December) for the export of
Pakistani manpower to other countries. It highlights the patterns/trends of migration with
comparative analysis of 2015-16 as well as that of the month, country, regional, district
categorical and protector-wise analysis. Further, it discusses the skill composition of emigrants
with top countries of destination along with the remittances sent by overseas Pakistanis.
Moreover, it highlights the manpower analysis along with reasons of workforce decline
particularly in GCC Countries.
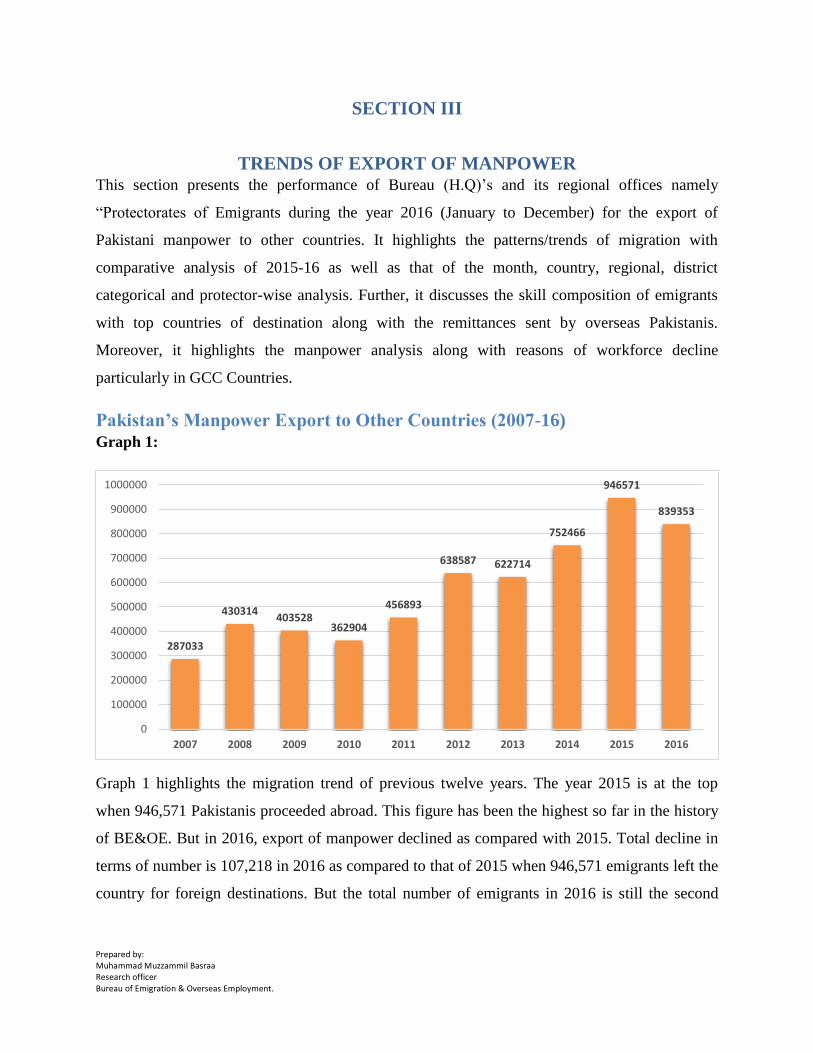
Pakistan’s Manpower Export to Other Countries (2007-16) Graph 1:
Graph 1 highlights the migration trend of previous twelve years. The year 2015 is at the top
when 946,571 Pakistanis proceeded abroad. This figure has been the highest so far in the history
of BE&OE. But in 2016, export of manpower declined as compared with 2015. Total decline in
terms of number is 107,218 in 2016 as compared to that of 2015 when 946,571 emigrants left the
country for foreign destinations. But the total number of emigrants in 2016 is still the second
287033
430314403528
362904
456893
638587 622714
752466
946571
839353
0
100000
200000
300000
400000
500000
600000
700000
800000
900000
1000000
2007 2008 2009 2010 2011 2012 2013 2014 2015 2016
Prepared by: Muhammad Muzzammil Basraa Research officer Bureau of Emigration & Overseas Employment.
highest as shown by the graph, thus showing a relative and not an absolute decline. Moreover,
the data of previous five years indicates the constantly increasing trend in overseas migration
Region Wise data of Pakistani Emigrants (1971-2016)
As a populous country whose population and work force is global in outlook, Pakistan has been
providing labour force to different parts of the world and the total number of Pakistani overseas
workers and their families all over the world is estimated to be 9.6 million registered through
formal channels. However, in recent years the countries of the Gulf have been their principal
destination.
With their high-income economies, the countries of the Gulf Cooperation Council (GCC) attract
work force from all over the world. As GCC countries continue to grow rapidly, potential
migrants worldwide are becoming more aware of countries such as Saudi Arabia and the United
Arab Emirates (UAE) as possible destinations to seek economic opportunities and employment.
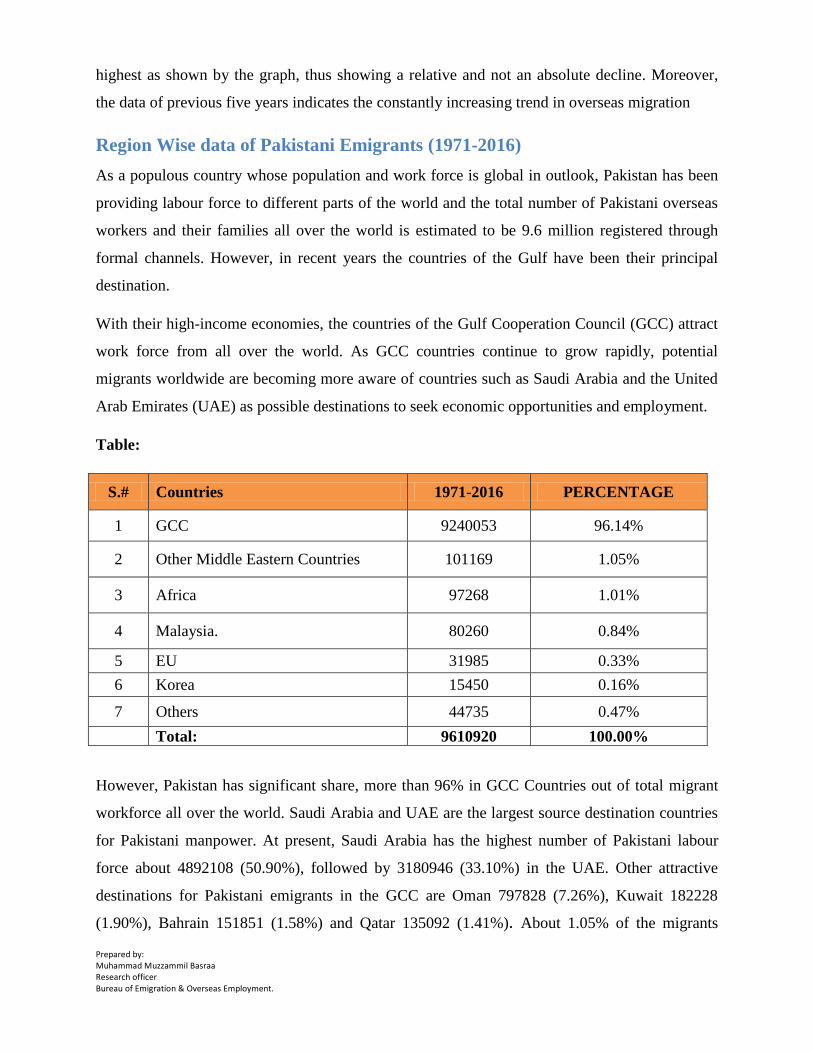
Table:
S.# Countries 1971-2016 PERCENTAGE
1 GCC 9240053 96.14%
2 Other Middle Eastern Countries 101169 1.05%
3 Africa 97268 1.01%
4 Malaysia. 80260 0.84%
5 EU 31985 0.33%
6 Korea 15450 0.16%
7 Others 44735 0.47%
Total: 9610920 100.00%
However, Pakistan has significant share, more than 96% in GCC Countries out of total migrant
workforce all over the world. Saudi Arabia and UAE are the largest source destination countries
for Pakistani manpower. At present, Saudi Arabia has the highest number of Pakistani labour
force about 4892108 (50.90%), followed by 3180946 (33.10%) in the UAE. Other attractive
destinations for Pakistani emigrants in the GCC are Oman 797828 (7.26%), Kuwait 182228
(1.90%), Bahrain 151851 (1.58%) and Qatar 135092 (1.41%). About 1.05% of the migrants
Prepared by: Muhammad Muzzammil Basraa Research officer Bureau of Emigration & Overseas Employment.
proceeded to other Middle Eastern countries, whereas, 1.01% Pakistanis went to African
countries for the purpose of employment.
Major shift of export of Pakistani manpower to especially to GCC Countries was seen in early
1970s. A number of pull and push factors were responsible for this movement. The demand for
manpower in the Gulf increased many fold due to the increasing role of oil in the world economy
and rise in its prices. Simultaneously, Pakistan was passing through a serious economic and
political crisis.
Malaysia is another important market where more Pakistani manpower can be absorbed. To get
the maximum benefit of emerging market, the Secretary, Ministry of Overseas Pakistanis and
Human Resource Development had paid visit to Malaysia when the OEPs are also trying their
level best to capture the Malaysian market. The manpower towards Malaysia is at rapid in many
sectors including construction, agriculture, furniture etc. Malaysian exports include:
Electronic equipments
Petroleum & LNG
Wood and Wood products
Palm oil
Rubber
Textile
Chemicals etc.
Moreover, Pakistani manpower is also inclined towards South Korea, as a large number of skills
jobs are available in it. European Union (EU) countries are not traditional manpower importing
countries. They used to hire Highly Qualified and Highly Skilled/Professional Pakistanis, whose
percentage is lower than unskilled. Furthermore, EU countries used to urge their 27 states
citizens to work within their union so that the pressure of immigration would be reduced.
The availability of large scale labour force from Pakistan owed to a combination of economic
social and institutional factors: modernization of agriculture in Central and Southern Punjab
which pushed out rural work force, the reversal of large scale industrialization which slowed
down the pulling capacity of urban centers like Karachi, and continuation of rapid population
growth. In terms of social structures, there already existed the social acceptability of sending
Prepared by: Muhammad Muzzammil Basraa Research officer Bureau of Emigration & Overseas Employment.
young males for extended periods of work to long distance destinations, while their families
were cared for in extended family arrangements at their ancestral places. (Dr. Ijaz Shafi Gilani
2008)
The Pull factors in the labour importing countries were equally powerful during the same period
and have been adequately documented elsewhere. Energy came to dominate global economic
growth. Oil became the major source of energy, its prices rose and provided large sums of
disposable money to countries which had extremely small population and whose physical as well
as economic infrastructure was rudimentary.
In 2016, a total decline is witnessed by 107,218 as compared to 2015 mainly due to declining of
oil prices which severely affected the economies of GCC Countries. The table 1 illustrates that
there is more room available other than GCC countries and drastic measures are required for
export of Pakistani manpower to other non-traditional countries. For this purpose, highly skilled
manpower is required to capture the other markets/avenues. Government of Pakistan is fully
aware of this fact and formulating the plans and policies accordingly. Training institutes’ i-e
NAVTEC/TEVTA are designing the course curriculum keeping in view the future market trends.
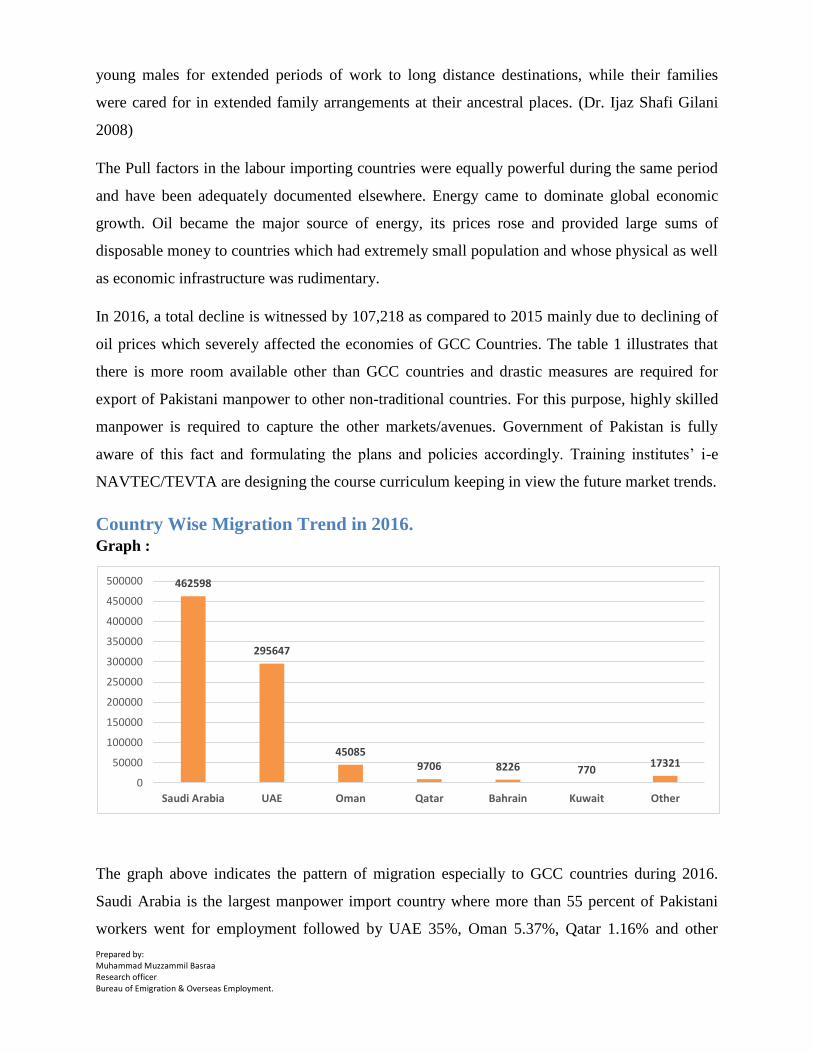
Country Wise Migration Trend in 2016. Graph :
The graph above indicates the pattern of migration especially to GCC countries during 2016.
Saudi Arabia is the largest manpower import country where more than 55 percent of Pakistani
workers went for employment followed by UAE 35%, Oman 5.37%, Qatar 1.16% and other
462598
295647
450859706 8226 770
17321
0
50000
100000
150000
200000
250000
300000
350000
400000
450000
500000
Saudi Arabia UAE Oman Qatar Bahrain Kuwait Other
Prepared by: Muhammad Muzzammil Basraa Research officer Bureau of Emigration & Overseas Employment.
countries 2.06 percent. GCC countries especially Saudi Arabia and UAE are traditional
manpower import countries and the large strata of unskilled and semi-skilled labor force get
employment opportunities specifically in infrastructure/ construction related activities. In other
countries, the number of Pakistani emigrants is very low which needs to increase in future. The
new market avenues for overseas employment other than Gulf Countries need to be discovered.
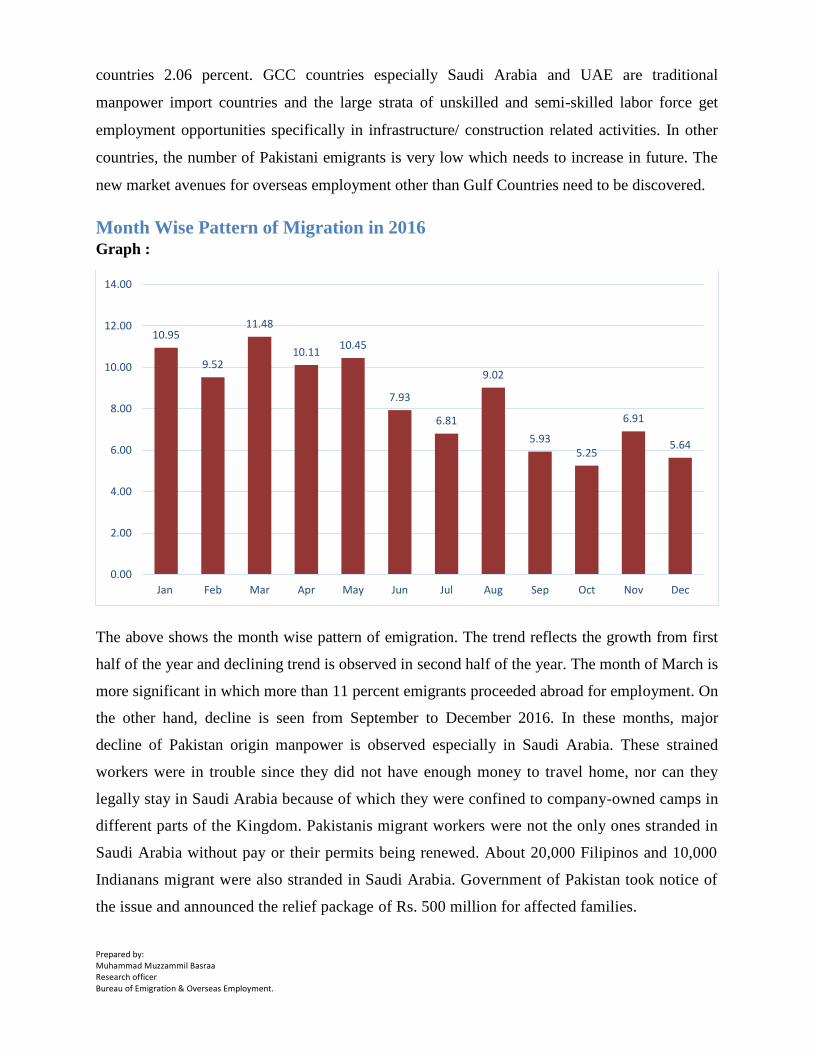
Month Wise Pattern of Migration in 2016 Graph :
The above shows the month wise pattern of emigration. The trend reflects the growth from first
half of the year and declining trend is observed in second half of the year. The month of March is
more significant in which more than 11 percent emigrants proceeded abroad for employment. On
the other hand, decline is seen from September to December 2016. In these months, major
decline of Pakistan origin manpower is observed especially in Saudi Arabia. These strained
workers were in trouble since they did not have enough money to travel home, nor can they
legally stay in Saudi Arabia because of which they were confined to company-owned camps in
different parts of the Kingdom. Pakistanis migrant workers were not the only ones stranded in
Saudi Arabia without pay or their permits being renewed. About 20,000 Filipinos and 10,000
Indianans migrant were also stranded in Saudi Arabia. Government of Pakistan took notice of
the issue and announced the relief package of Rs. 500 million for affected families.
10.95
9.52
11.48
10.1110.45
7.93
6.81
9.02
5.935.25
6.91
5.64
0.00
2.00
4.00
6.00
8.00
10.00
12.00
14.00
Jan Feb Mar Apr May Jun Jul Aug Sep Oct Nov Dec
Prepared by: Muhammad Muzzammil Basraa Research officer Bureau of Emigration & Overseas Employment.
In this connection a report was published in Daily Dawn on 7 th February, 2017 which
highlighted that 39000 Pakistani workers have been repatriated by Saudi Arabia in last four
months due to violating the rules of residence and work.
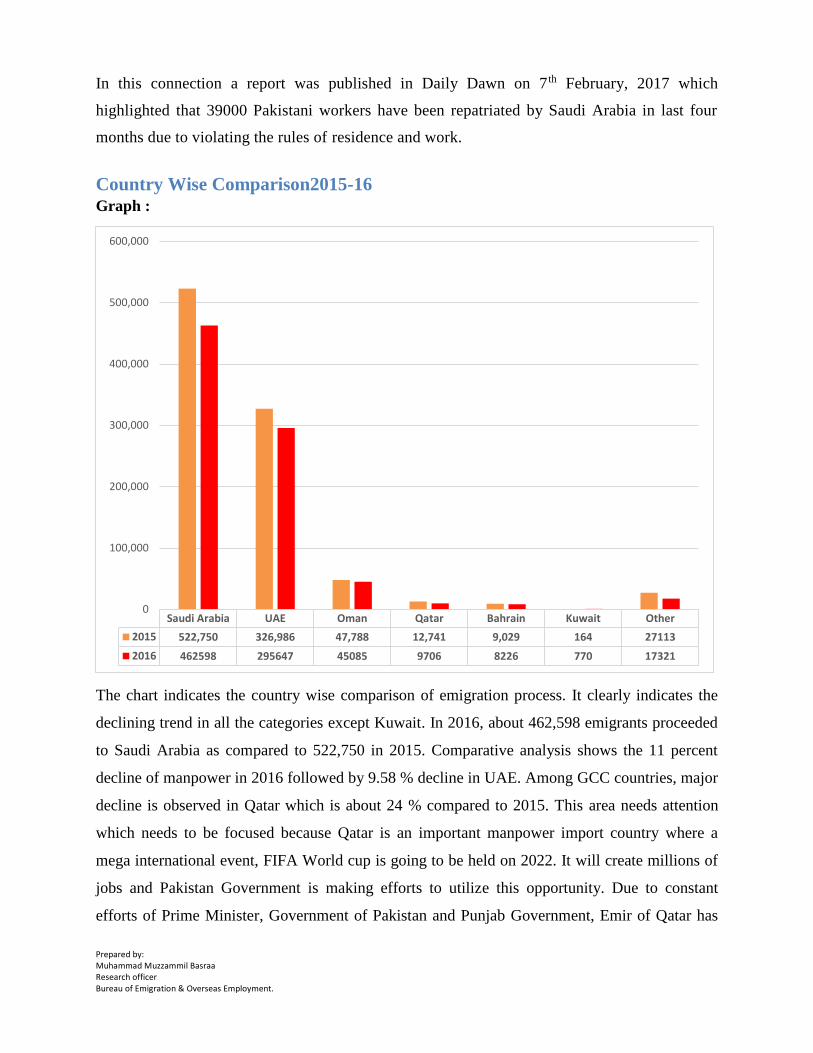
Country Wise Comparison2015-16 Graph :
The chart indicates the country wise comparison of emigration process. It clearly indicates the
declining trend in all the categories except Kuwait. In 2016, about 462,598 emigrants proceeded
to Saudi Arabia as compared to 522,750 in 2015. Comparative analysis shows the 11 percent
decline of manpower in 2016 followed by 9.58 % decline in UAE. Among GCC countries, major
decline is observed in Qatar which is about 24 % compared to 2015. This area needs attention
which needs to be focused because Qatar is an important manpower import country where a
mega international event, FIFA World cup is going to be held on 2022. It will create millions of
jobs and Pakistan Government is making efforts to utilize this opportunity. Due to constant
efforts of Prime Minister, Government of Pakistan and Punjab Government, Emir of Qatar has
Saudi Arabia UAE Oman Qatar Bahrain Kuwait Other
2015 522,750 326,986 47,788 12,741 9,029 164 27113
2016 462598 295647 45085 9706 8226 770 17321
0
100,000
200,000
300,000
400,000
500,000
600,000

Prepared by: Muhammad Muzzammil Basraa Research officer Bureau of Emigration & Overseas Employment.
announced the 100,000 jobs for Pakistani workforce. Technical training is essential for our future
labour force in GCC to fully utilize this opportunity. In this regard, BE&OE is in collaboration
with training institutes like NAVTTC/TEVTA for curriculum development of training courses.
Export of Manpower through Protectorate Offices 2015-16 Graph :
There are seven regional offices named as Protectorates of Emigrants. The overhead illustrates
the protector wise export of manpower to other countries during 2015-16. The percentage wise
protectors’ data are as follows:
S.No. Protector of Emigrant Manpower Export Percentage
1 Rawalpindi 206114 24.56%
2 Lahore 205861 24.53%
3 Karachi 134750 16.05%
4 Multan 112130 13.36%
5 Peshawar 109524 13.05%
Rawalpindi Lahore Karachi Multan Peshawar Malakand Quetta
2015 247729 233898 155204 107606 115540 80139 6455
2016 206114 205861 134750 112130 109524 66611 4363
0
50000
100000
150000
200000
250000
300000
Prepared by: Muhammad Muzzammil Basraa Research officer Bureau of Emigration & Overseas Employment.
6 Malakand 66611 7.94%
7 Quetta 4363 0.52%
Total: 839353 100.00
Quetta is on the lower side, in terms of manpower export to other countries as compared to other
protectorates. On the other hand Multan is the only protectorate where there was increase of
4524 (4.20%) as compared to 2015.
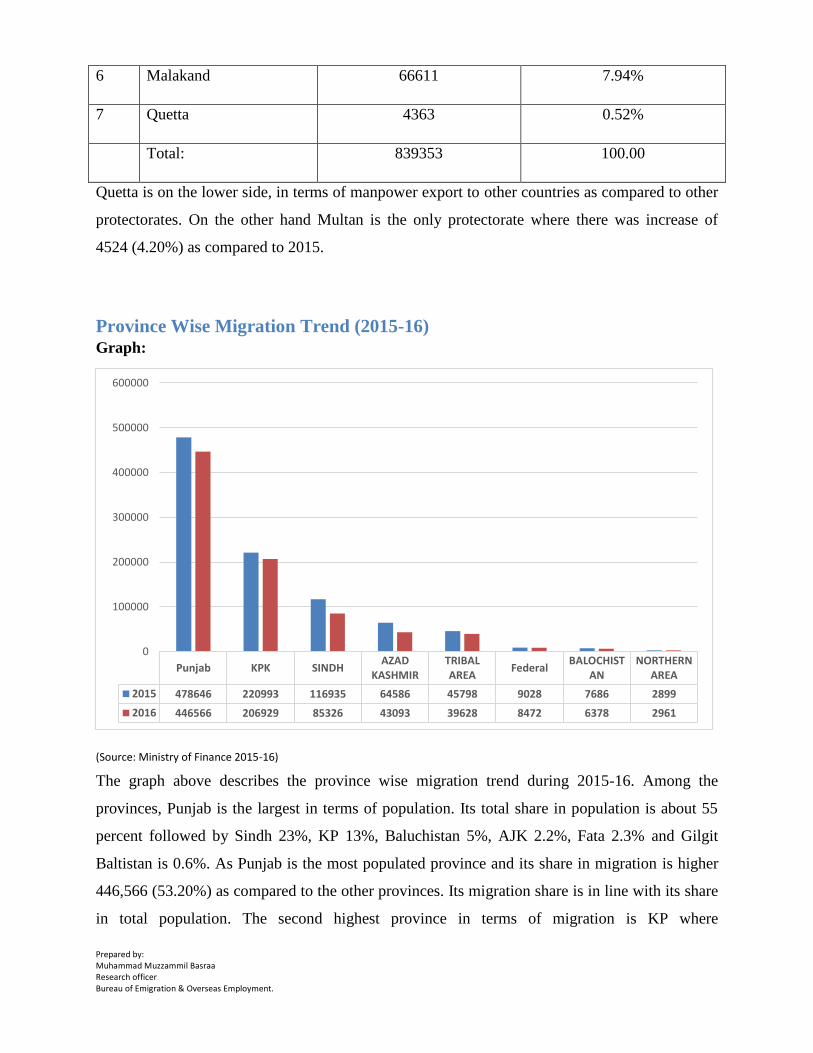
Province Wise Migration Trend (2015-16) Graph:
(Source: Ministry of Finance 2015-16)
The graph above describes the province wise migration trend during 2015-16. Among the
provinces, Punjab is the largest in terms of population. Its total share in population is about 55
percent followed by Sindh 23%, KP 13%, Baluchistan 5%, AJK 2.2%, Fata 2.3% and Gilgit
Baltistan is 0.6%. As Punjab is the most populated province and its share in migration is higher
446,566 (53.20%) as compared to the other provinces. Its migration share is in line with its share
in total population. The second highest province in terms of migration is KP where
Punjab KPK SINDHAZAD
KASHMIRTRIBALAREA
FederalBALOCHIST
ANNORTHERN
AREA
2015 478646 220993 116935 64586 45798 9028 7686 2899
2016 446566 206929 85326 43093 39628 8472 6378 2961
0
100000
200000
300000
400000
500000
600000
Prepared by: Muhammad Muzzammil Basraa Research officer Bureau of Emigration & Overseas Employment.
206929(24.65%) of emigrants proceeded abroad during 2016. It is interesting to note here that
KP’s share in total population is about 13 % but its share in migration is 24.65 % which shows
the inclination of KP’s people for overseas employment. Sindh stands on third where 85326(10
%) of the total emigrants proceeded abroad. The migration pattern is vice versa in Sindh and KP
when the share of both the provinces in total population and migration is compared. The trend of
overseas employment is quite positive in AJK and Tribal areas. The Baluchistan province is
lagging behind in terms of migration and the low number of emigrants directly correlates with
the low number of OEP’s working in Quetta. According to the latest figures of BE&OE
regarding active OEP’s there are only 4 OEP’s working in Quetta.
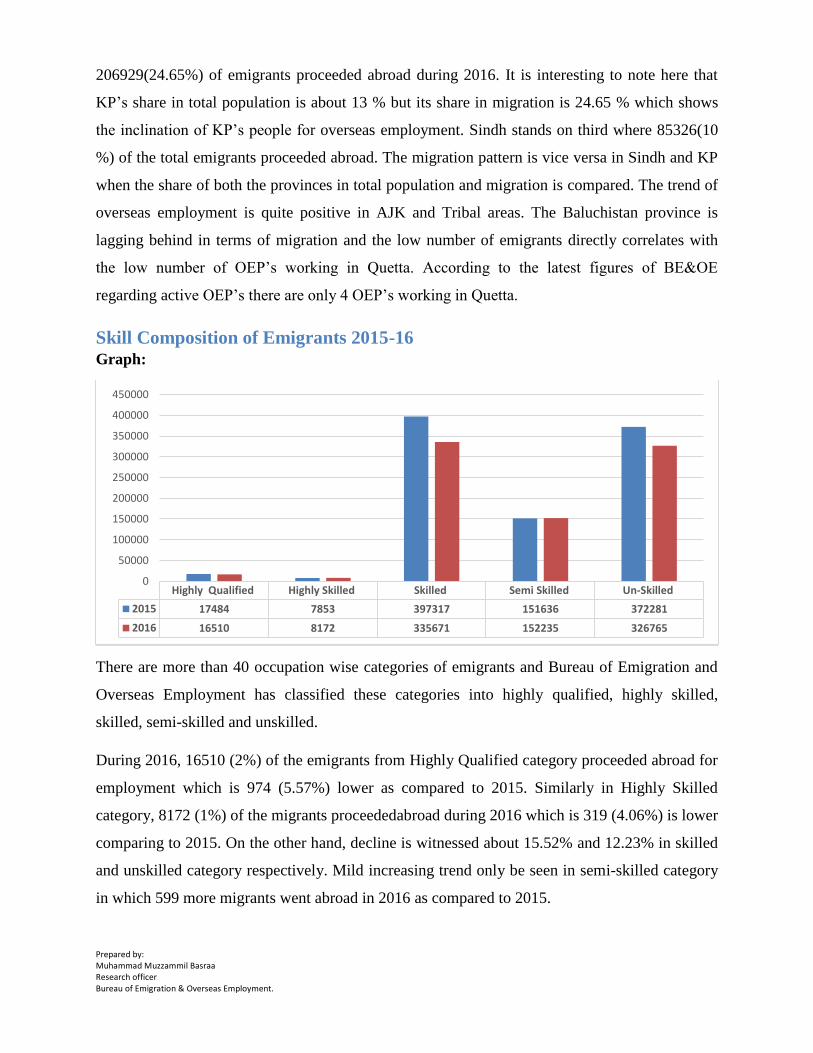
Skill Composition of Emigrants 2015-16 Graph:
There are more than 40 occupation wise categories of emigrants and Bureau of Emigration and
Overseas Employment has classified these categories into highly qualified, highly skilled,
skilled, semi-skilled and unskilled.
During 2016, 16510 (2%) of the emigrants from Highly Qualified category proceeded abroad for
employment which is 974 (5.57%) lower as compared to 2015. Similarly in Highly Skilled
category, 8172 (1%) of the migrants proceededabroad during 2016 which is 319 (4.06%) is lower
comparing to 2015. On the other hand, decline is witnessed about 15.52% and 12.23% in skilled
and unskilled category respectively. Mild increasing trend only be seen in semi-skilled category
in which 599 more migrants went abroad in 2016 as compared to 2015.
Highly Qualified Highly Skilled Skilled Semi Skilled Un-Skilled
2015 17484 7853 397317 151636 372281
2016 16510 8172 335671 152235 326765
0
50000
100000
150000
200000
250000
300000
350000
400000
450000
Prepared by: Muhammad Muzzammil Basraa Research officer Bureau of Emigration & Overseas Employment.
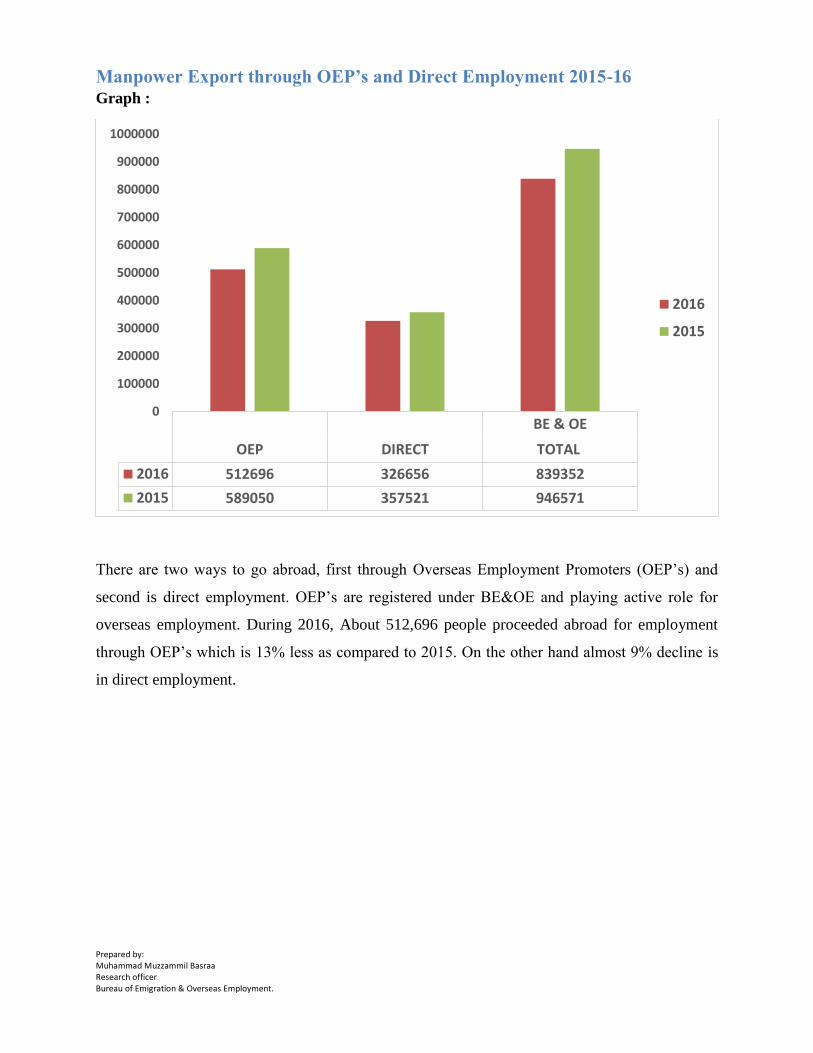
Manpower Export through OEP’s and Direct Employment 2015-16 Graph :
There are two ways to go abroad, first through Overseas Employment Promoters (OEP’s) and
second is direct employment. OEP’s are registered under BE&OE and playing active role for
overseas employment. During 2016, About 512,696 people proceeded abroad for employment
through OEP’s which is 13% less as compared to 2015. On the other hand almost 9% decline is
in direct employment.
BE & OE
OEP DIRECT TOTAL
2016 512696 326656 839352
2015 589050 357521 946571
0
100000
200000
300000
400000
500000
600000
700000
800000
900000
1000000
2016
2015
Prepared by: Muhammad Muzzammil Basraa Research officer Bureau of Emigration & Overseas Employment.
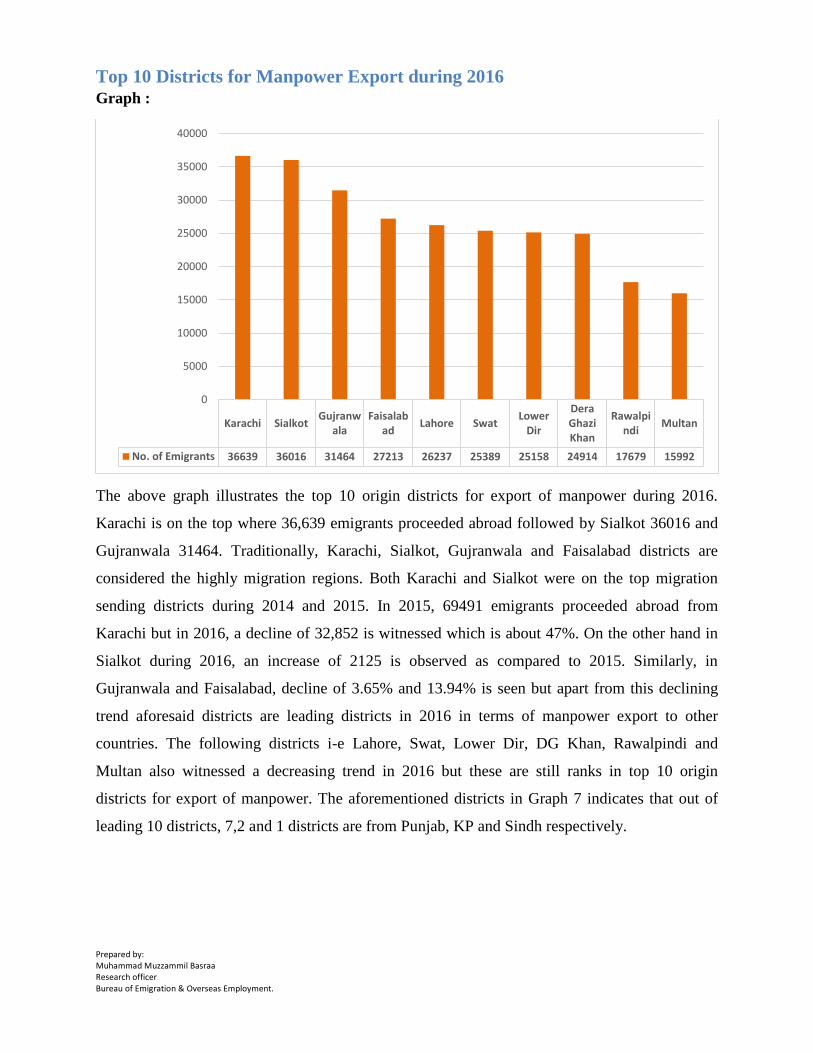
Top 10 Districts for Manpower Export during 2016 Graph :
The above graph illustrates the top 10 origin districts for export of manpower during 2016.
Karachi is on the top where 36,639 emigrants proceeded abroad followed by Sialkot 36016 and
Gujranwala 31464. Traditionally, Karachi, Sialkot, Gujranwala and Faisalabad districts are
considered the highly migration regions. Both Karachi and Sialkot were on the top migration
sending districts during 2014 and 2015. In 2015, 69491 emigrants proceeded abroad from
Karachi but in 2016, a decline of 32,852 is witnessed which is about 47%. On the other hand in
Sialkot during 2016, an increase of 2125 is observed as compared to 2015. Similarly, in
Gujranwala and Faisalabad, decline of 3.65% and 13.94% is seen but apart from this declining
trend aforesaid districts are leading districts in 2016 in terms of manpower export to other
countries. The following districts i-e Lahore, Swat, Lower Dir, DG Khan, Rawalpindi and
Multan also witnessed a decreasing trend in 2016 but these are still ranks in top 10 origin
districts for export of manpower. The aforementioned districts in Graph 7 indicates that out of
leading 10 districts, 7,2 and 1 districts are from Punjab, KP and Sindh respectively.
Karachi SialkotGujranw
alaFaisalab
adLahore Swat
LowerDir
DeraGhaziKhan
Rawalpindi
Multan
No. of Emigrants 36639 36016 31464 27213 26237 25389 25158 24914 17679 15992
0
5000
10000
15000
20000
25000
30000
35000
40000

Prepared by: Muhammad Muzzammil Basraa Research officer Bureau of Emigration & Overseas Employment.
Categorical Analysis of Emigrants in GCC Countries (2015-16)
There are various categories of overseas migrants. The increasing and declining trend is being
discussed in Table 2 and 3. The export of manpower in following occupational categories
increased during 2016.
(A) Top Increasing Categories During 2016
Table:
S.R # Category 2015 2016 Increase
1 Waiter/Br. 6524 10648 4124
2 Foreman/Sup 7797 11095 3298
3 Plumber 17433 20126 2693
4 Cook 7755 10406 2651
5 Fitter 16513 18783 2270
6 Surveyor 5594 7472 1878
7 Manager 5025 6698 1673
8 Painter 20336 21847 1511
9 Denter 3248 4717 1469
10 Agriculturist 28660 30104 1444
11 Tailor 7851 9286 1435
12 Draftsman 2149 3494 1345
13 Storekeeper 2197 3324 1127
14 Doctor 2074 2779 705
The above table shows the increasing trend in the mentioned categories during 2016. It indicates
that increasing trend is observed in the categories like Waiter, Cook, Tailor, Managers and
Doctors. Generally the increase is seen in skilled, semi-skilled and high skilled categories. In
coming years, demand of skilled workers will increase even in conservative manpower import
Prepared by: Muhammad Muzzammil Basraa Research officer Bureau of Emigration & Overseas Employment.
countries. The fall of oil prices has put pressure on oil based Gulf economies and they are
making plans to reduce their dependence on oil based earnings. The introduction of Saudi Vision
2030 is one such example to uplift their economy. It is a plan to reduce Saudi Arabia's
dependence on oil and rely on alternatives diverse resources economy and the development of
service sectors such as health, education, infrastructure, constructive, recreation, tourism and
many other sectors.
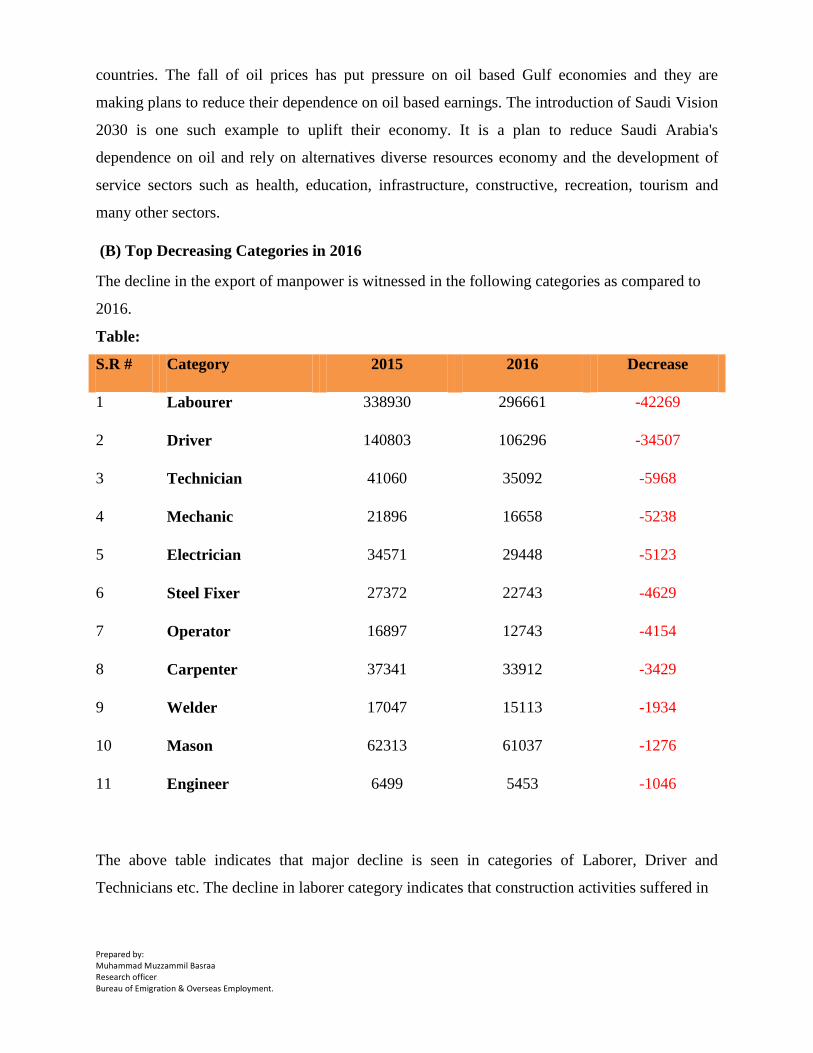
(B) Top Decreasing Categories in 2016
The decline in the export of manpower is witnessed in the following categories as compared to
2016.
Table:
S.R # Category 2015 2016 Decrease
1 Labourer 338930 296661 -42269
2 Driver 140803 106296 -34507
3 Technician 41060 35092 -5968
4 Mechanic 21896 16658 -5238
5 Electrician 34571 29448 -5123
6 Steel Fixer 27372 22743 -4629
7 Operator 16897 12743 -4154
8 Carpenter 37341 33912 -3429
9 Welder 17047 15113 -1934
10 Mason 62313 61037 -1276
11 Engineer 6499 5453 -1046
The above table indicates that major decline is seen in categories of Laborer, Driver and
Technicians etc. The decline in laborer category indicates that construction activities suffered in
Prepared by: Muhammad Muzzammil Basraa Research officer Bureau of Emigration & Overseas Employment.
GCC countries after fall of oil prices. Furthermore, the property business in GCC countries
particularly in UAE remained on decline. Now the competition will increase in Gulf Countries
especially in Saudi Arabia because Saudi Government is introducing various steps to increase the
job opportunities for Saudi Nationals. For this purpose KSA has launched the Saudization
program. It is the official national policy of Saudi Arabia in which there will be the replacement
of foreign workers with Saudi nationals in various sectors. The Saudi Government took the
decision to reduce unemployment among native Saudis, under the slogan 'Let's Put the Saudi in
Saudization. These sorts of steps from Saudi Government will create tough competition for
foreign workers in future.