Embed Size (px)
Citation preview
Energy [r]evolution, Carbon Transition
December 2016Paris Clean Energy Seminar
Global energy consumed will have tripled in 60 years
3.7 Mds hab5.0 Mds tep
6.0 Mds hab9.2 Mds tep
8.2 Mds hab15.3 Mds tep
+11% +27%
19701.35 tep/hab
20001.5 tep/hab
20301.9 tep/hab
Source : AIE / BP Stat ReviewPage 3
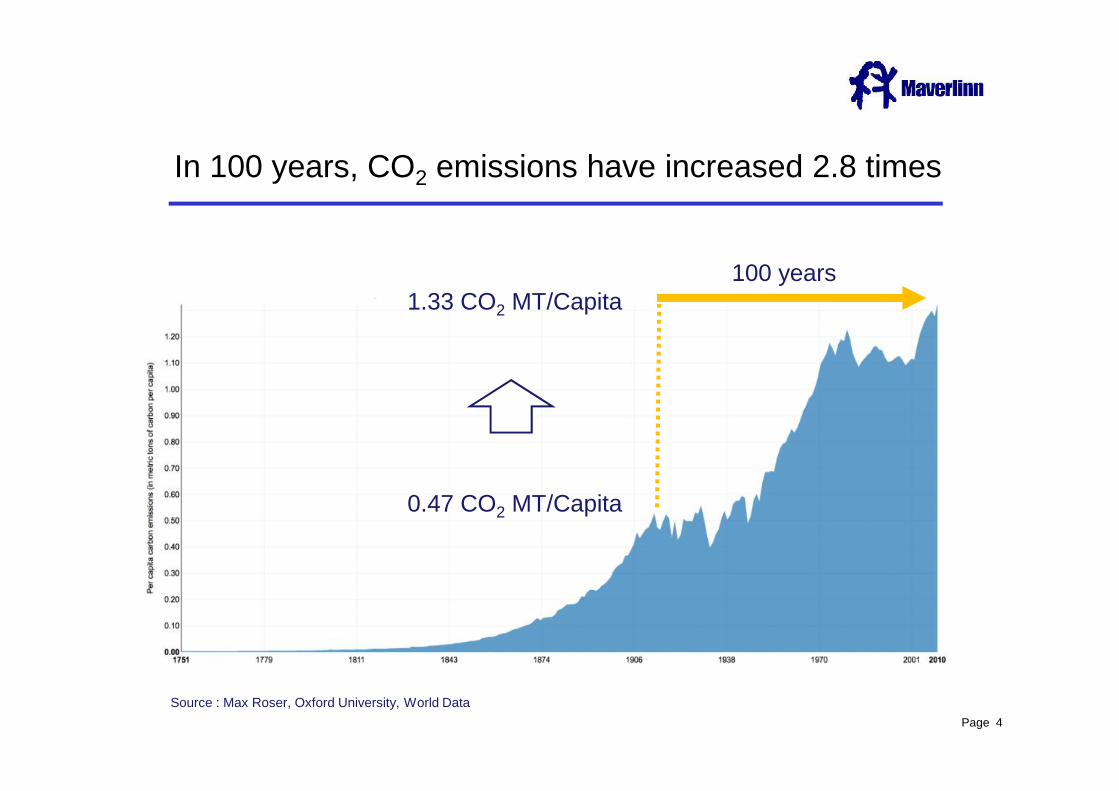
In 100 years, CO2 emissions have increased 2.8 times
1.33 CO2 MT/Capita100 years
Source : Max Roser, Oxford University, World Data
0.47 CO2 MT/Capita
Page 4
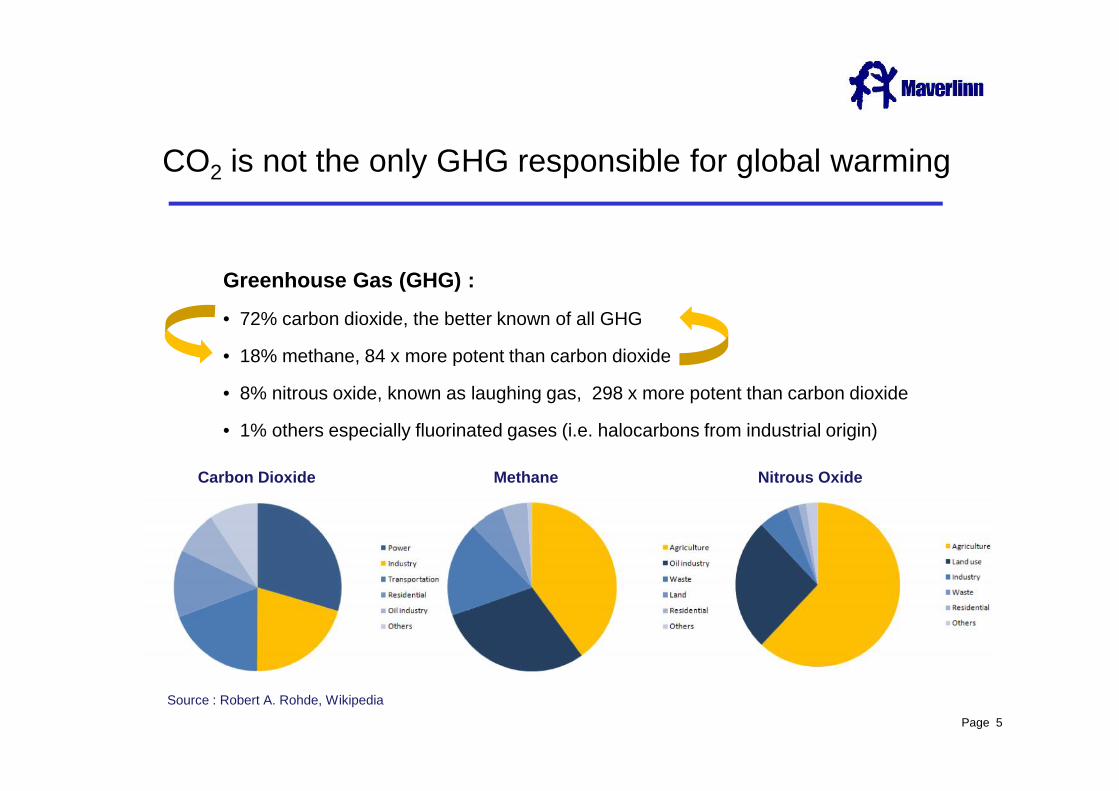
CO2 is not the only GHG responsible for global warming
Greenhouse Gas (GHG) :• 72% carbon dioxide, the better known of all GHG
• 18% methane, 84 x more potent than carbon dioxide
• 8% nitrous oxide, known as laughing gas, 298 x more potent than carbon dioxide
• 1% others especially fluorinated gases (i.e. halocarbons from industrial origin)
Source : Robert A. Rohde, Wikipedia
Greenhouse Gas (GHG) :• 72% carbon dioxide, the better known of all GHG
• 18% methane, 84 x more potent than carbon dioxide
• 8% nitrous oxide, known as laughing gas, 298 x more potent than carbon dioxide
• 1% others especially fluorinated gases (i.e. halocarbons from industrial origin)
Carbon Dioxide Methane Nitrous Oxide
Page 5

On a day-to-day basis our energy mix is based on carbo-hydrate worldwide, France is an exception (nuclear)
Energy Mix Worldwide2014
Energy Consumption Worldwide2014
Source: BP 2015 Energy Data, Eurostat
Fossil energy represents 86% of the energy mix T I H represents about 84% of the world consumption
Page 6
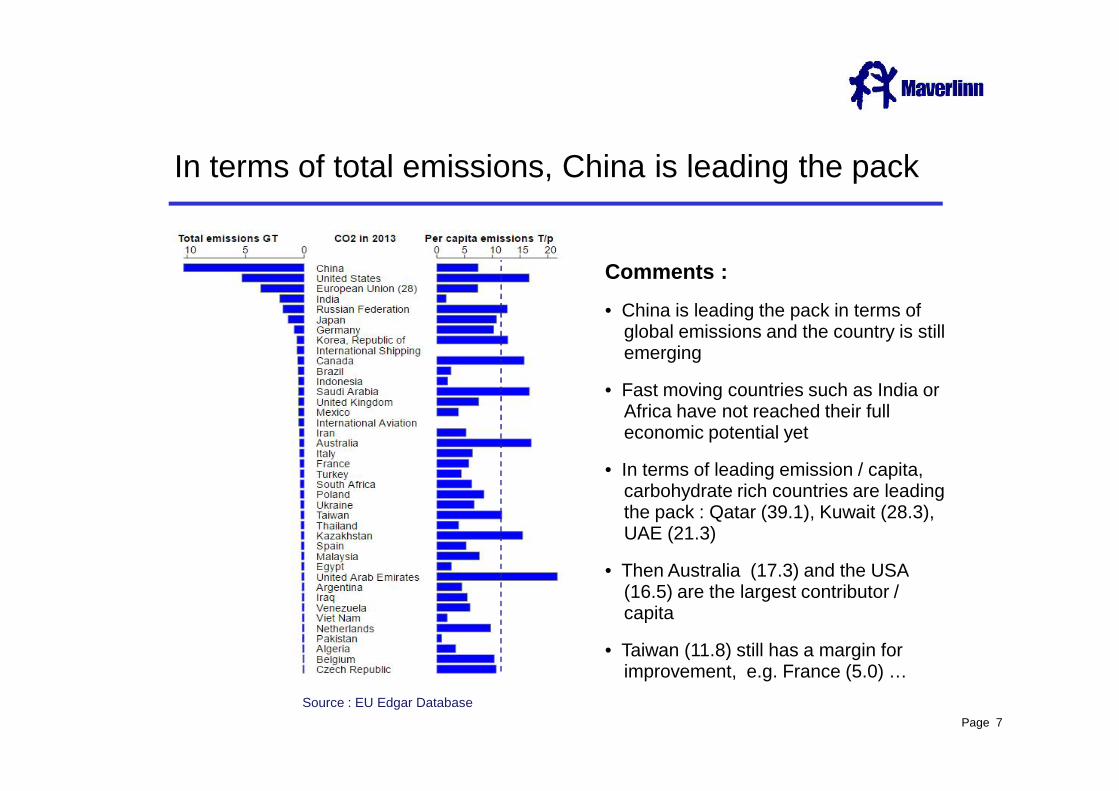
In terms of total emissions, China is leading the pack
Comments :• China is leading the pack in terms of
global emissions and the country is stillemerging
• Fast moving countries such as India orAfrica have not reached their fulleconomic potential yet
• In terms of leading emission / capita,carbohydrate rich countries are leadingthe pack : Qatar (39.1), Kuwait (28.3),UAE (21.3)
• Then Australia (17.3) and the USA(16.5) are the largest contributor /capita
• Taiwan (11.8) still has a margin forimprovement, e.g. France (5.0) …
Source : EU Edgar Database
Comments :• China is leading the pack in terms of
global emissions and the country is stillemerging
• Fast moving countries such as India orAfrica have not reached their fulleconomic potential yet
• In terms of leading emission / capita,carbohydrate rich countries are leadingthe pack : Qatar (39.1), Kuwait (28.3),UAE (21.3)
• Then Australia (17.3) and the USA(16.5) are the largest contributor /capita
• Taiwan (11.8) still has a margin forimprovement, e.g. France (5.0) …
Page 7
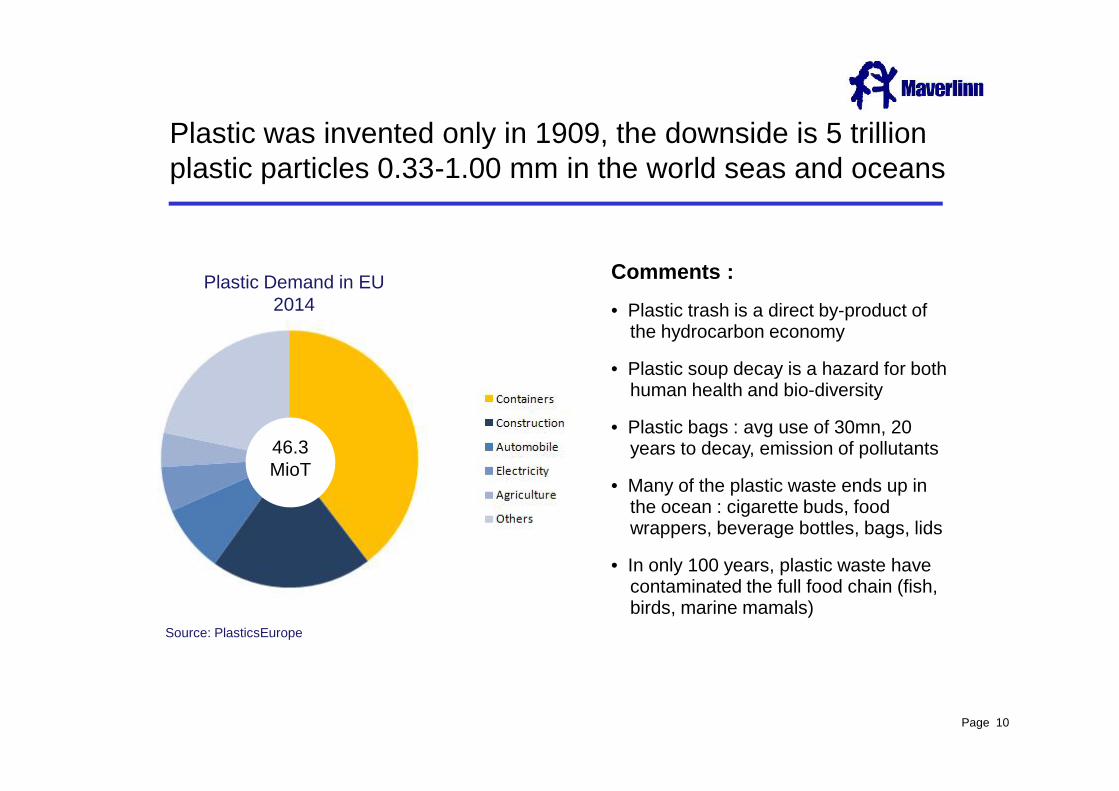
Plastic was invented only in 1909, the downside is 5 trillionplastic particles 0.33-1.00 mm in the world seas and oceans
Comments :• Plastic trash is a direct by-product of
the hydrocarbon economy
• Plastic soup decay is a hazard for bothhuman health and bio-diversity
• Plastic bags : avg use of 30mn, 20years to decay, emission of pollutants
• Many of the plastic waste ends up inthe ocean : cigarette buds, foodwrappers, beverage bottles, bags, lids
• In only 100 years, plastic waste havecontaminated the full food chain (fish,birds, marine mamals)
Plastic Demand in EU2014
Comments :• Plastic trash is a direct by-product of
the hydrocarbon economy
• Plastic soup decay is a hazard for bothhuman health and bio-diversity
• Plastic bags : avg use of 30mn, 20years to decay, emission of pollutants
• Many of the plastic waste ends up inthe ocean : cigarette buds, foodwrappers, beverage bottles, bags, lids
• In only 100 years, plastic waste havecontaminated the full food chain (fish,birds, marine mamals)
Page 10
Source: PlasticsEurope
46.3MioT
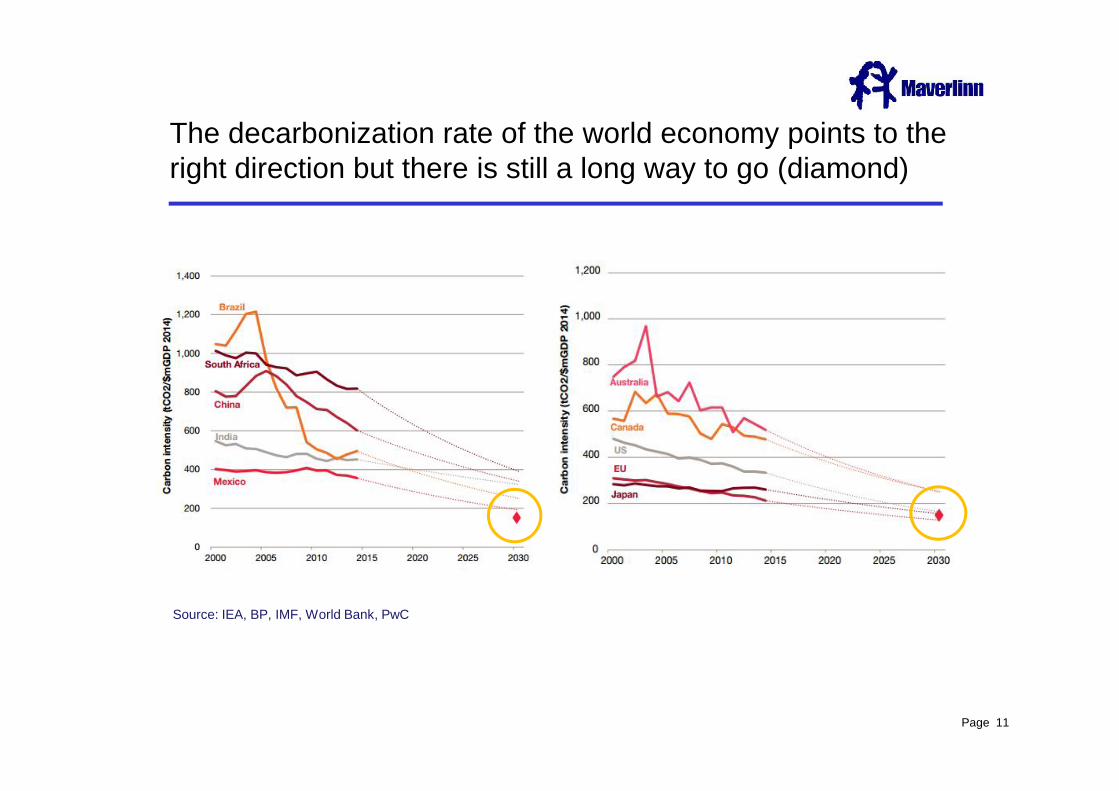
The decarbonization rate of the world economy points to theright direction but there is still a long way to go (diamond)
Source: IEA, BP, IMF, World Bank, PwC
Page 11
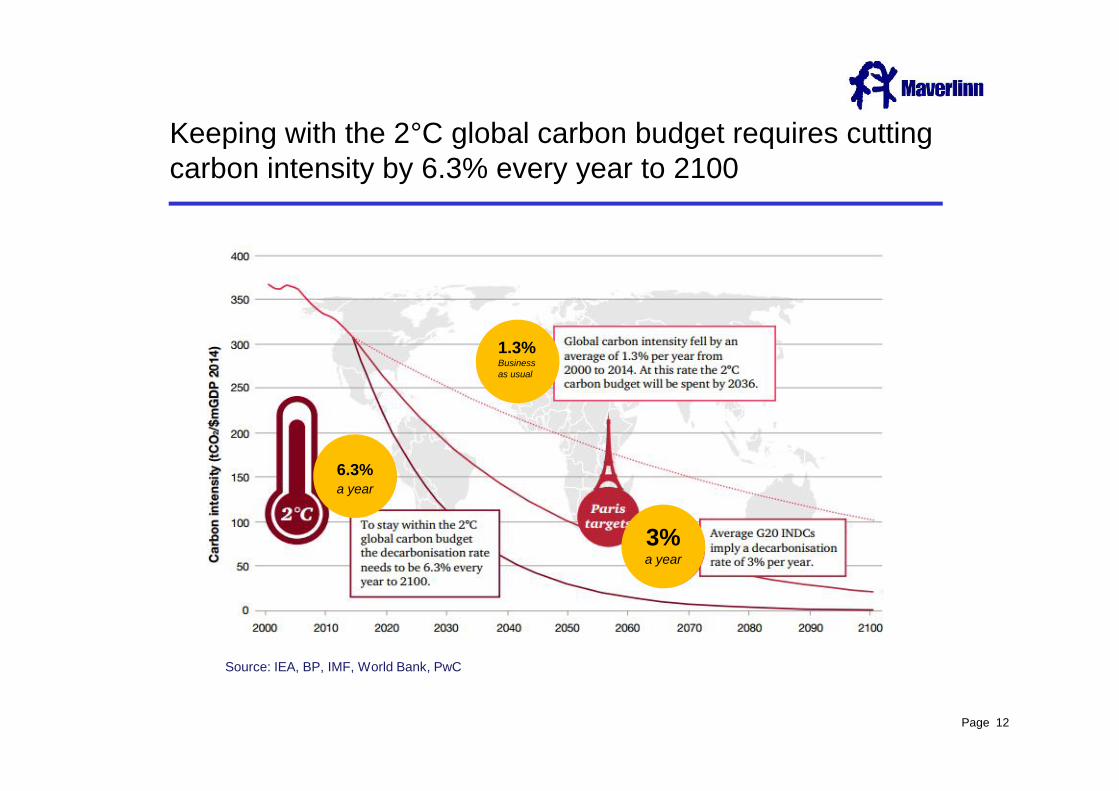
Keeping with the 2°C global carbon budget requires cuttingcarbon intensity by 6.3% every year to 2100
1.3%Businessas usual
Source: IEA, BP, IMF, World Bank, PwC
Page 12
3%a year
6.3%a year
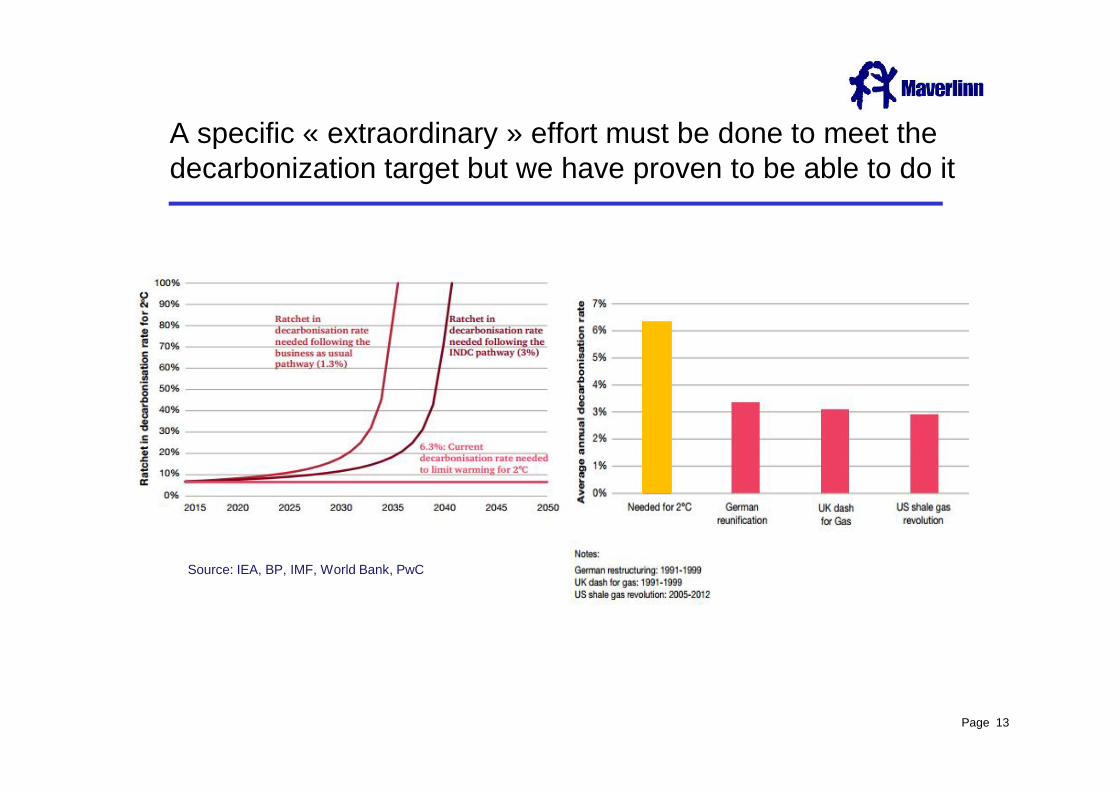
A specific « extraordinary » effort must be done to meet thedecarbonization target but we have proven to be able to do it
Source: IEA, BP, IMF, World Bank, PwC
Page 13
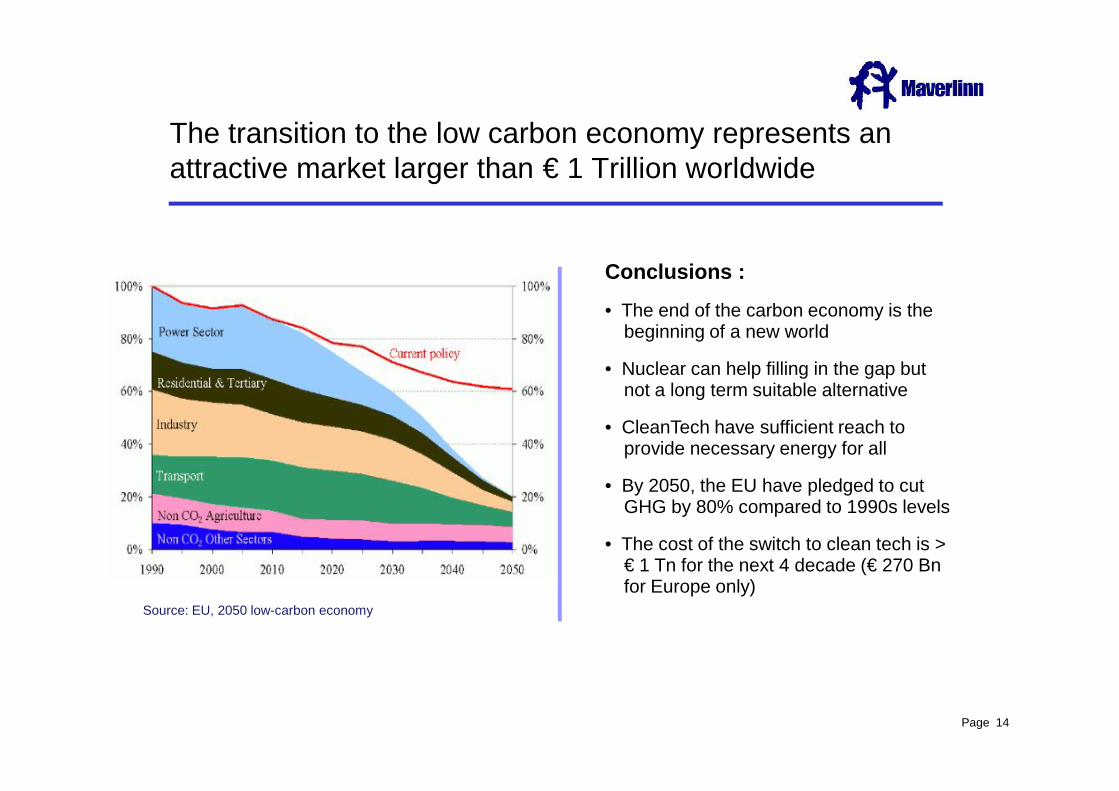
The transition to the low carbon economy represents anattractive market larger than € 1 Trillion worldwide
Conclusions :• The end of the carbon economy is the
beginning of a new world
• Nuclear can help filling in the gap butnot a long term suitable alternative
• CleanTech have sufficient reach toprovide necessary energy for all
• By 2050, the EU have pledged to cutGHG by 80% compared to 1990s levels
• The cost of the switch to clean tech is >€ 1 Tn for the next 4 decade (€ 270 Bnfor Europe only)
Page 14
Source: EU, 2050 low-carbon economy
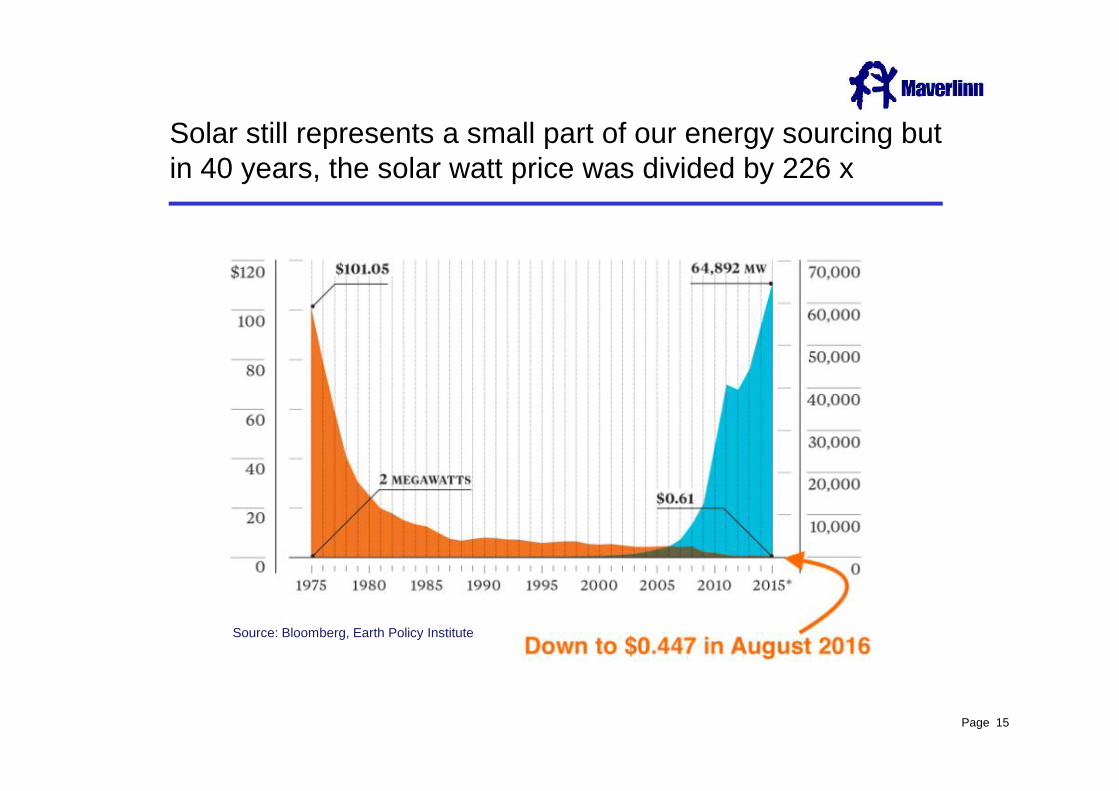
Solar still represents a small part of our energy sourcing butin 40 years, the solar watt price was divided by 226 x
Source: Bloomberg, Earth Policy Institute
Page 15
Greentech innovation and regulations will continue to be akey driver to curb carbon dioxide emissions worldwide
Page 16
• Encourage and finance cleantech innovation• Support transition regulation to ease the energy turnaround• Foster individual responsibility to protect our ecosystem
Leading a world of change, together