WILL CHILDREN BE ASKED TO WORK MORE AND LEARN LESS?
THE IMPACT OF AGRARIAN INCOMES ON EDUCATION IN TANZANIA
A Thesis
Submitted to the Faculty of the
Graduate School of Arts and Sciences
of Georgetown University
in partial fulfillment of the requirements for the
degree of
Master of Public Policy
By
Laura Caroline Recchie, B.A.
Washington, DC
April 15, 2010
ii
WILL CHILDREN BE ASKED TO WORK MORE AND LEARN LESS?
THE IMPACT OF AGRARIAN INCOMES ON EDUCATION IN TANZANIA
Laura Caroline Recchie, B.A.
Thesis Advisor: Daniel Hilliard, Ph.D.
ABSTRACT
Environmental conditions in Africa are favorable for a multitude of agricultural crops, making
economic growth through the agriculture sector an attractive choice for African leaders. Policy
makers are focusing efforts on agriculture in hopes of increasing household incomes and
providing the means for other development goals, including education. Still, farming requires
more labor hours than other means of income generation. If these poverty alleviation policies are
providing incentives for families to keep children home from school, the short term benefits of
increased income will be offset by the long term consequences of an uneducated generation.
Research exists showing the positive impact of education on human development and economic
prosperity. Research also illustrates the negative impact of child labor on educational attainment.
However, linking the effects of agrarian income on children’s labor hours and education has yet
to be established. This analysis attempts to fill this gap.
Using a robust probit regression analysis this work analyzes the effects of labor-intense agrarian
livelihood on child labor hours and school attendance in Tanzania. The study finds that income
has an impact on school attendance, and an increase in household responsibilities decreases the
probability that a child will attend school. The results of this study imply that economic policies
focused on improving the productivity of agriculture must be coupled with education policies to
offset the opportunity cost families face sending children to school.
iii
The research and writing of this thesis is dedicated to everyone who helped along the way. This
study would not have been possible without the endless support of my parents, the
encouragement and assistance from my friends and family, including Michael Nilo, Jennifer
Bires, Elizabeth Manney, Dave McGurl and Igor Kheyfets. I am especially grateful for the
superb editing skills of Benjamin Recchie and Elizabeth Brown and for the gracious guidance
from Drs. Donna Morrison and Jean Mitchell.
Many thanks,
Laura

iv
TABLE OF CONTENTS
INTRODUCTION ........................................................................................................................................ 1
BACKGROUND .......................................................................................................................................... 5
Tanzania .................................................................................................................................................... 5
Kagera Region .......................................................................................................................................... 7
Table 1: Agriculture Households by Type- Kagera .................................................................................. 8
LITERATURE REVIEW ............................................................................................................................. 9
Poverty Reduction ..................................................................................................................................... 9
Education ................................................................................................................................................ 10
Child Labor and Opportunity Costs........................................................................................................ 12
Child Labor and Labor Markets ............................................................................................................. 13
METHODOLOGY ..................................................................................................................................... 15
Data Description ..................................................................................................................................... 15
Model ...................................................................................................................................................... 16
Table 2: Variables of Interest and Purpose for Inclusion ........................................................................ 18
RESULTS ................................................................................................................................................... 20
Table 3: Summary Statistics ................................................................................................................... 20
Table 4: School Attendance .................................................................................................................... 21
Table 5: Working in Gardens or Shamba Fields ..................................................................................... 22
Table 6: Fetching Water or Collecting Firewood ................................................................................... 23
Findings .................................................................................................................................................. 24
Table 7: Estimated Marginal Effects (Standard Errors) for Probit Models Predicting the Probability of
School Attendance .................................................................................................................................. 24
Potential Errors ...................................................................................................................................... 26
Table 8: Percentage of Sales by Crop ..................................................................................................... 27
CONCLUSION ........................................................................................................................................... 28
Policy Implications ................................................................................................................................. 28
Suggestions for Further Research........................................................................................................... 30
REFERENCES ........................................................................................................................................... 32
INTRODUCTION
Many African nations have a comparative advantage in farming and other agricultural production
due to favorable environmental conditions for a multitude of different crops. This potential
means that leaders often focus policies and development efforts on promoting agricultural sector
growth in hopes of increasing household incomes and providing the means to reach other
development goals. However, the labor-intense activity of farming requires more labor hours
than other means of income generation. It is therefore possible that these policies will create an
opportunity cost for families who will choose to set children to work rather than send them to
school. While, these policies have the ultimate goal of poverty alleviation, if they provide
incentives for families to keep children home from school, the short-term benefits of increased
income may be offset by the long-term consequences of an uneducated generation. Thus, the
question is if policies that make farming more lucrative, will families choose to have their
children work more, in order to earn more income? Will children be asked to work more, and
learn less?
Education is considered by many to be an important component of sustainable growth and a
major contributor to both social and economic development. An educated population has a
positive impact on multiple areas of society. Studies show that one additional year of education
can raise the living wage of men and women by an average of 10%.1 The benefits of education
are not limited to health and economics: educated citizens are more likely to be engaged in the
1 Wedge, Joanna. Where Peace Begins: Education's Role in Conflict Prevention and Peacebuilding. Rep. Save the
Children, 2008.

2
political process and less likely to resort to violence as a form of conflict resolution. In fact,
every additional year of formal schooling for males reduces the risk of their becoming involved
in conflict by 20%.2 Furthermore, one additional year of school has the same stabilizing effect as
a 5% annual growth rate.3 The International Labor Organization found that the nations of Sub-
Saharan Africa, including the focus region for this research, would receive the greatest net gains
by expanding education for their people.4
Due to the importance of education, countries as disparate as the United States, and Kenya,
Tanzania’s neighbor, spend on average over 5% of their GDP on education.5 Regardless of its
proven significance for development and growth, however, Tanzania still only spends 2.2% of its
GDP on education. As a result, less than 70% of the population is literate and only 62% of
Tanzanian women are able to read and write in Kiswahili, English or Arabic.6
In Africa, child labor usually consists of unpaid work in family agriculture enterprises.7 Political
philosopher John Stuart Mills wrote:
"It is right that children should be protected from being overworked. Laboring for
too many hours in a day, or on work beyond their strength, should not be permitted to
them, for if permitted it may always be compelled. Freedom of contract, in the case of
children, is but another word for freedom of coercion. Education also, the best which
2 Wedge, Joanna. Where Peace Begins: Education's Role in Conflict Prevention and Peacebuilding. Rep. Save the
Children, 2008. 3 Wedge, Joanna. Where Peace Begins: Education's Role in Conflict Prevention and Peacebuilding. Rep. Save the
Children, 2008. Print. 4 International Labor Organization. Investing in Every Child: An economic study of the costs and benefits of
eliminating child labor. Rep. Geneva: International Labour Office, 2003. 5 Earth Trends World Resource Institute. January 2010.
http://earthtrends.wri.org/searchable_db/index.php?action=select_countries&theme=10&varibale_ID=643. 6 "Country Factbook: Tanzania." Country Factbook. CIA. Web. 15 Dec. 2009.
7 Canagarajah, S., H. Coulombe, and World Bank. Africa Regional Office. Human Development Technical Family.,
Child labor and schooling in Ghana. Policy research working paper. 1997, Washington, DC: World Bank, Human
Development Technical Family, Africa Region. 37 p.
3
circumstances admit of their receiving, is not a thing which parents or relatives should
have it in their power to withhold."8
Labor-intensive activities require more workers and more work hours than other activities. Even
with advanced technology, farming remains labor intensive; however, without advanced
technology, farming requires more people to complete the same farming tasks. In countries such
as Tanzania, farming can easily employ entire households in daily activities. Furthermore,
because adults often dedicate so much time to farming, the younger members of the family must
take care of household chores and perform the less physically grueling tasks, such as fetching
water, collecting firewood, and caring for younger children and smaller livestock.
National leaders often gear policies towards specific sectors in an attempt to promote economic
growth, hoping that increased household income will provide the means for other development
goals, such as encouraging education. However, if these poverty-alleviation policies are
providing incentives for families to keep children home from school, the short-term benefits of
increased productivity will be offset by the long-term consequences of an uneducated generation.
The International Labor Office found that eliminating child labor is a high-yield global
investment, but many families find the additional manpower invaluable in their daily work.9 For
short-term poverty-alleviation and long-term sustainable economic growth, policy makers need a
better understanding of the relationship between the two sectors. This research will attempt to
8 Mill, J.S., Principles of political economy with some of their applications to social philosophy. 1848, Boston,: C.C.
Little & J.Brown. 2 v. (pg. 952) 9 International Labor Organization. Investing in Every Child: An economic study of the costs and benefits of eliminating child
labor. Rep. Geneva: International Labour Office, 2003.

4
address that gap and provide a way to determine target areas for economic policies that will
address both short- and long-term development in African communities.
Through a multivariate probit regression analysis, I study the effects of income from labor-
intense agricultural activities on education in the Kagera region of Tanzania. Specifically, I
regress agrarian household income on child school attendance. My primary research question
examines whether an increase in household income from labor-intense economic activities such
as farming encourages child labor at the expense of school attendance and educational
attainment. My principal hypothesis is therefore that an increase in agrarian income creates an
opportunity cost for families that promotes child labor in the short term and reduces educational
attainment in the long term.
5
BACKGROUND
Tanzania
Tanzania is a particularly interesting case study for development policy research. Situated on the
east central coast of Africa, Tanzania borders several eastern, central and southern African
countries including: the Democratic Republic of Congo, Rwanda, Burundi, Uganda, Malawi,
Kenya, Zambia, and Mozambique. These countries share similar geographic, demographic and
economic characteristics. They are also all high priorities for development in the international
community.
The country’s average gross domestic product (GDP) has retained a steady average rate of
growth of about 6% over the past seven years, and since 1985 the agricultural component of the
country’s GDP has grown steadily at 3.3% per year.10
Still, the impact has not been enough to
affect the lives of average Tanzanians. In 2006, 36% of the population lived below the poverty
line, and today Tanzania remains in the bottom 10% of the world's economies in terms of per
capita income. The United Nations Development Program (UNDP) gave Tanzania a score of
0.530 on the Human Development Index ranking it 151 out of 182 countries with data.11
Although the economy of Tanzania has remained fairly stable, the efforts made to improve
education, develop infrastructure and expand social services have failed to provide dramatic
results. An analysis of the development conditions in Tanzania could explain the lack of results.
The Tanzanian government, in cooperation with international organizations like the World Bank
and UNDP, is targeting efforts on the agricultural sector in an effort to promote economic growth
10
"Country Factbook: Tanzania." Country Factbook. CIA. Web. 15 Dec. 2009. 11
"Human Development Report 2009 - Country Fact Sheets - Tanzania (United Republic of)." Statistics | Human
Development Reports (HDR) | United Nations Development Programme (UNDP). Web. 1 Dec. 2009.
<http://hdrstats.undp.org/en/countries/country_fact_sheets/cty_fs_TZA.html>.
6
that benefits the Tanzanian people. This focused effort is not surprising since Tanzania relies
heavily on its agricultural sector, which currently accounts for more than 40% of national GDP,
provides 85% of exports, and employs 80% of the work force. 12
Even Tanzania’s second most
important sector- industry- is primarily agricultural processing.13
In a concerted effort to improve
the agriculture market, the Tanzanian government issued the following priority actions in 2006:
1.) The pursuit of macroeconomic policies that encourage investment by small holders and large
commercial farmers
2.) Proactive support to private operators, farmer’s organizations, non government organizations
(NGOs) and central bank organizations (CBOs), supplying inputs and credit to farmers.
3.) Concentration of budgetary allocations in agriculture research and extension
4.) Provision of special support to investments in agricultural processing14
To achieve these goals, Tanzania created an Agricultural Sector Development Program (ASDP)
which published its strategy in 2006. The ASDP planned to spend a total of 2.5 trillion shillings
($1.85 billion) over the following seven years. After two years of the ASDP, Tanzania reports
significant improvements in its agricultural sector. From 2006 to 2007, Tanzania provided
technical support to Regional Secretariats (RS) and Local Government Authorities (LGAs) on
District Agricultural Development Plans (DADPs). The ASDP strengthened sector coordination,
monitoring and evaluation, as well as the Zonal Agricultural Research, Extension and Training
institutes. They developed irrigation, marketing and livestock infrastructure; coordinated policy
reforms and improved public-private sector partnerships. In order to create an environment that
encouraged the development of sustainable member-based cooperatives, the ASDP revised
12
“Tanzania Agriculture.” Republic of Tanzania.Web. 15 Nov. 2009. < www.tanzania.go.tz/agriculture.hml>. 13
Country Factbook: Tanzania." Country Factbook. CIA. Web. 15 Dec. 2009. 14
Tanzania -- Ministry Of Agriculture, Food and Cooperatives- Home Page. Web. 13 Dec. 2009.
<http://www.kilimo.go.tz>.

7
current agricultural legislation and created new policies.15
The ultimate goal of these reforms is
to strengthen the national economy by increasing the income of the average Tanzanian agrarian
household.
The coordinated efforts of the Tanzanian government and international donors to improve the
productivity of the agriculture sector make the potential impacts especially interesting to
policymakers and development practitioners, alike. The effect of increasing agrarian income on
social development could have implications for other policy goals, including the generation of
sustainable long term economic growth and the development of future human capital.
Kagera Region
This study focuses on the Kagera region of Tanzania. Located in the northwest corner of the
country, Kagera borders several foreign states, and boasts economic, geographic, and
demographic similarities to many countries that are also of interest to development practitioners
and regional policymakers.16
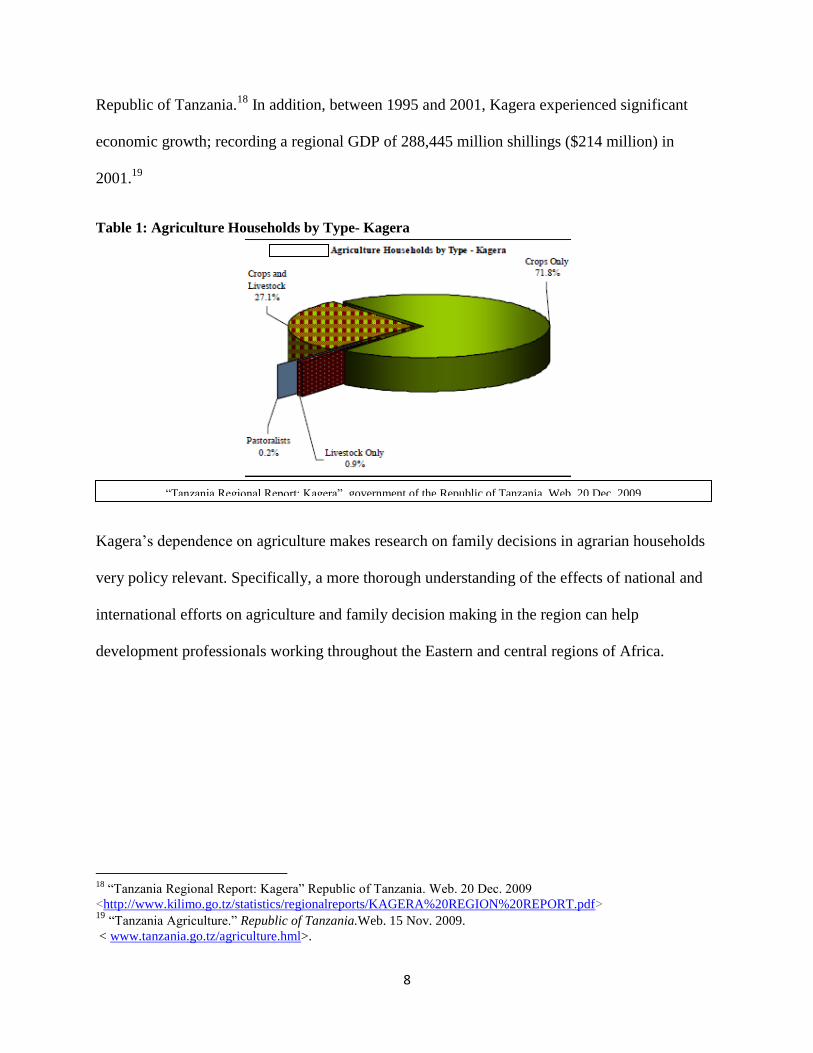
As in the rest of the country, agriculture dominates Kagera’s economy. Almost 90% of the
regional population is involved in the production of food and cash crops and more than 50% of
the region's GDP is derived from farming17
. The graph indicates the breakdown of the
agricultural households as reported in the most recent regional report by the government of the
15
Tanzania -- Ministry Of Agriculture, Food and Cooperatives- Home Page. Web. 13 Dec. 2009.
<http://www.kilimo.go.tz>. 16
http://www.inadev.org/images/maplarge_tanzania.gif> 17
Tanzania -- Ministry Of Agriculture, Food and Cooperatives- Home Page. Web. 13 Dec. 2009.
<http://www.kilimo.go.tz/statistics/regionalreports/KAGERA%20REGION%20REPORT.pdf>.
8
Republic of Tanzania.18
In addition, between 1995 and 2001, Kagera experienced significant
economic growth; recording a regional GDP of 288,445 million shillings ($214 million) in
2001.19
Table 1: Agriculture Households by Type- Kagera
Kagera’s dependence on agriculture makes research on family decisions in agrarian households
very policy relevant. Specifically, a more thorough understanding of the effects of national and
international efforts on agriculture and family decision making in the region can help
development professionals working throughout the Eastern and central regions of Africa.
18
“Tanzania Regional Report: Kagera” Republic of Tanzania. Web. 20 Dec. 2009
<http://www.kilimo.go.tz/statistics/regionalreports/KAGERA%20REGION%20REPORT.pdf> 19
“Tanzania Agriculture.” Republic of Tanzania.Web. 15 Nov. 2009.
< www.tanzania.go.tz/agriculture.hml>.
“Tanzania Regional Report: Kagera” government of the Republic of Tanzania. Web. 20 Dec. 2009
9
LITERATURE REVIEW
A significant body of research literature demonstrates both the positive impact of education on
human development and economic prosperity and the negative impact of child labor on
educational attainment. Detailed below are several researchers that have analyzed the various
aspects addressed in this research, including poverty alleviation, economic development, child
labor, and education. Linking the effects of agrarian income on children’s labor hours and thus
education has yet to be established. This research attempts to close this gap in order to draw
conclusions about the relationship between agricultural income and educational attainment; this
enables policymakers to create policies that have positive effects in short- and long-term
development and growth. Following is a brief introduction to the literature regarding the multiple
elements of the dynamic relationship analyzed in this study: poverty reduction, education, child
labor, opportunity costs and labor markets.
Poverty Reduction
Research on poverty reduction suggests that the most effective way to alleviate poverty is to
increase the access of the poor to productive assets. However, while land and capital are
fundamental for economic growth, they are not sufficient for substantial and sustainable
economic growth. To experience real long-term economic benefits, a country must also develop
human capital.20
R.E. Lucas (1998) states that human capital, or education, can increase the
economy’s capacity to innovate, which promotes growth through new inventions and
advancements in technology.21
In addition, N.G. Mankiw, D. Romer, and D. Weil (1992)
illustrate the manner in which education increases human capital already present in the labor
20
Von Witzke, Harald. (1984) “Poverty, agriculture, and economic development: A survey” European Review of
Agriculture Economies Vol. 11: pp. 439-453 21
Lucas, R.E. 1988. "On the mechanics of economic development." Journal of Monetary Economics 22(July):3-42.
10
force.22
This in turn increases labor productivity, thereby creating a higher equilibrium level of
output. R.R. Nelson and E. Phelps (1966) empirically illustrate the positive impact that
knowledge transfer has on economic growth, and show that education facilitates that transfer of
knowledge necessary to operate technologies invented by others.23
Finally, Joseph Bredie (1998) analyzes the impact of educational attainment on economic growth
using a cross-section of industrialized and newly industrialized nations to find patterns in
education. Bredie found a minimum level of education is necessary for a country to experience
economic growth. However, he also expressed concern about the trend of stagnation and
decrease of education in developing nations, which he attributes to the high costs and uncertain
benefits of schooling in these countries. Bredie alludes to an idea that families involved in labor
intensive activities face an opportunity cost by sending their children to school, but unfortunately
does not move beyond speculation in his theory. Instead, he leaves the issue an open question,
prescribing more in-depth study and stating that “to help reverse this stagnation, we need to
understand better what is happening.”24
Education
Studies by Bredie, Lucas, Nelson, etc that focus on the impact of education and poverty
alleviation conclude that developing human capital is necessary for economic growth and human
development. Research targeted to conflict areas show that additional benefits of education also
22
Mankiw, N.G., D. Romer, and D. Weil. 1992. "A contribution to the empirics of economic growth."Quarterly
Journal of Economics 107,no.2 (May):407-437. 23
Nelson, R.R., and E. Phelps. 1966. "Investment in humans, technology diffusion and economic
growth." American Economic Review 56,no.2 (May):69-75. 24
Bredie, Joseph W.B. and Girindre K. Beeharry. (1998) School Enrollment Decline in Sub-Saharan Africa: Beyond
the Supply Constraint World Bank Discussion Paper No. 395, The World Bank

11
include political and economic stability. In fact, one year of education can raise the living wage
of men and women by an average of 10% in what Save the Children has labeled conflict affected
fragile states (CAFS).25
Moreover, J. Wedge (2008) finds that every additional year of formal
schooling, for males particularly, reduces the risk of their becoming involved in conflict in these
CAFS.26
Traditionally, studies analyzing the impact of education look at indicators such as economic
status and region to show economic growth. Lant Pritchett (2004) uses asset possession as a
proxy for long- term wealth to find regional patterns in educational attainment.27
In particular, he
found generally smooth patterns of attainment across the transition from primary to secondary
levels of school. Rarely in his study did countries boast high dropout rates during this transition;
an exception to this, however, is Tanzania. While Tanzania is economically similar to its
neighbors and many of the other countries in Pritchett’s study, something has interrupted
children’s education for this particular country. Pritchett did not identify what caused this
interruption, but the age at which this interruption occurs is also around the age that a child
traditionally becomes able to undertake more physically intensive tasks, such as those involved
in agricultural production. Understanding this irregularity could help provide a clearer
understanding of family decision-making in agrarian households of developing countries with
agriculture-based economies.28
25
Wedge, J., Where Peace Begins: Education's Role in Conflict Prevention and Peacebuilding, in Save the
Children Rewrite the Future. 2008, Save the Children. 26
Wedge, J., Where Peace Begins: Education's Role in Conflict Prevention and Peacebuilding, in Save the
Children Rewrite the Future. 2008, Save the Children. 27
Pritchett, Lant. (2004) Towards a New Consensus for Addressing the Global Challenges of the Lack of Education
Copenhagen Consensus Challenge Paper, Copenhagen Consensus 2004 28
Pritchett, Lant. (2004) Towards a New Consensus for Addressing the Global Challenges of the Lack of Education
Copenhagen Consensus Challenge Paper, Copenhagen Consensus 2004

12
Child Labor and Opportunity Costs
Perceived or real opportunity costs can encourage families to keep children home from school to
participate in economic activities. John Cockburn (2000) found that household assets and other
household production variables play an important role in how families decide to use their time.29
His research also discovered a clear relationship between child labor and school participation
with respect to physical assets. Specifically, Cockburn found that families that own labor-
increasing physical assets are more likely to keep their children home from school to work.30
There is additional work illustrating the detrimental impact of child labor on educational
attainment. Harry Patrinos and George Psacharopoulos (1995) used school attainment to measure
the effect of child labor and found a negative correlation between the two.31
Other researchers
used test scores to measure the effect of child labor. For example, C. Heady (2003) found a
negative relationship between child labor and objective measures of reading and mathematics
ability in Ghana.32
Likewise, C. Cavilieri (2002) used propensity score matching to conclude
that child labor is associated with a 10% reduction in the probability of advancement to the next
grade level.33
29
Cockburn, John. (2000) Child Labor versus Education: Poverty Constraints or Income Opportunities? Oxford,
England, Nuffield College. 30
Cockburn, John. (2000) Child Labor versus Education: Poverty Constraints or Income Opportunities? Oxford,
England, Nuffield College 31
Patrinos, Harry A., and George Psacharopoulos (1995) “Educational Performance and Child Labor in Paraguay.”
International Journal of Educational Development 15: 47-60.
32 Heady, C. (2003) “The Effect of Child Labor on Learning Achievement.” World Development 31: 385-398.
33 Cavalieri, C. (2002) “The Impact of Child Labor on Educational Performance: An Evalutaion of Brazil.”
Manuscript.

13
By decreasing educational attainment, child labor impedes the positive impacts of education and
thus could potentially hurt the long term economic growth of a nation.34
One particular study by
the International Labor Organization found that eliminating child labor is a high yielding global
investment and that sub-Saharan Africa would receive the greatest net gains by expanding
education attainment.35
Child Labor and Labor Markets
There is some research analyzing the precise link between child labor and labor market
outcomes; however, this body of work is much less extensive than the fields mentioned
regarding education and economic growth. Kathleen Beegle, et. al (2008) researched the impact
of child labor on education and labor market outcomes. They used the occurrence of crop and
rainfall shocks as instrument variables for child labor and found that child labor negatively and
significantly impacted the probability of completing primary levels.36
Another study by Beegle,
et al. (2005) found that child labor is associated with a negative impact on school participation
and educational attainment, but also substantially higher immediate earnings for those who
worked as children. However, in the long-term, the forgone earnings attributed to lost schooling
exceed any earnings gain associated with child labor.37
The long-term consequences of child
labor therefore outweigh the short-term benefits.
34
Cavalieri, C. (2002) “The Impact of Child Labor on Educational Performance: An Evalutaion of Brazil.”
Manuscript.
35 International Labor Organization. (2003) Investing in Every Child: An economic study of the costs and benefits of
eliminating child labor. Rep. Geneva: International Labour Office, 2003. 36
Beegle, Kathleen, Rajeev Dehejia, Robert Gatti, and Sofya Krutikova (2008) “The Consequences of Child Labor:
Evidence from Logitudinal Data in Rural Tanzania.” World Bank Policy Research Working Paper 4677.
37 Beegle, Kathleen, Rajeev Dehejia, and Robert Gatti (2005) “Why Should We Care about Child Labor? The
Education, Labor Market, and Health Consequences of Child Labor.”” World Bank Policy Research Working Paper
3479. CEPR Discussion Paper 4443. NBER Working Paper No. 10980.

14
There is a considerable gap, however, in the literature attempting to explain the relationship
between agriculture economies and child labor, and thus educational attainment. Tyler Ahn
(2004) used a multivariate regression to analyze the impact of household-owned technologies on
educational attainment and child labor hours. His study found that time-saving technologies
allowed more time for children to go to school.38
My research builds upon Ahn’s work. I will
analyze the impact of agrarian income, using household income of agrarian-employed homes, on
school attendance to show household decisions regarding education.
38
Ahn, Tyler. (2004) “Children of Malawi: The Impact of Agricultural Technology on Educational Attainment and
Child Labor Hours.” GPPI Thesis
15
METHODOLOGY
Data Description
My research uses the Kagera Health and Development Survey dataset (KHDS) to analyze the
impact of agrarian income on education. The KHDS is a longitudinal household survey provided
by the World Bank in conjunction with the Living Standard Measurement Survey series. The
dataset was created for use in “Measuring the Economic Impact of Fatal Adult Illness in Sub-
Saharan Africa: An Annotated Household Questionnaire,” a study by Mead, Over, et al. (1992).
The KHDS samples the Kagera region located in the northwest region of Tanzania. To conduct
the survey, the World Bank and partners through the University of Dar es Salaam interviewed
over 800 households from nearly 50 communities in all five districts of Kagera. Households,
community leaders, health facilities, schools, and market vendors were interviewed in 6-7 month
intervals for up to four survey periods from 1991 to 1994. The researchers returned in 2004 to re-
interview subjects and were able to contact most of the previous households. In the 2004, 832
households were re-interviewed and 2,774 new households were added to the 2nd
round survey.
I will be using the most current round of interviews for my research.
The KHDS was able to capture a majority of child labor age groups, making it especially
relevant to this study. Key variables of interest for this study include those variables describing
children’s activities, agrarian household income, and household characteristics that would
explain a child’s attendance or absences at school. While the dataset was originally selected to
analyze household welfare in relation to HIV/AIDS mortality, I will be using the data to analyze
a different factor of household welfare. This ensures that the sample is unbiased for my particular
purpose.
16
Model
This research uses the KDHS dataset to analyze the impact of agrarian household income on
school attendance of school age children. The dependent variable is a binary variable that
expresses whether the school age child is currently attending school. The question of school
attendance was asked of everyone aged 6 and up, however, to be accurate for my model, only
responses from school aged children (ages 6-18) are used.
The primary independent variable measures the amount of income derived from agrarian
activities for each household. Agrarian activities include crop sales, livestock sales, and the sale
of products made from crops or livestock. This aggregate also includes any income earned
through shambas or gardens. These activities are high-intensity, demanding large amounts of
labor. Dummy variables denoting the proportion of income derived from agriculture activities in
relation to total income received in a year are included in the model as well. This analysis is
specifically looking to find a relationship between school attendance and the amount of agrarian
income a home earns.
Independent variables are included in the model to capture the influence of family
characteristics and economic activities on decisions regarding children’s schooling. Included in
this model are the age and sex of the child. As parents with an education often value their own
family’s education more than parents without any education, a variable measuring the percent of
adults within a household with education is included in the model. The number of adults in a
household is included in the descriptive statistics, because it is hypothesized that the more adults
in a household the less necessary a child's labor will be on daily activities. It is not included it in
the regression, however, due to collinearity issues. Furthermore, the model contains explanatory

17
variables regarding the number of children in each household because more children in a family
could lead to an increase in household work for families to undertake (more firewood to be
fetched, more child care needed, etc.). This variable could also have a reverse effect, however,
because there could also be more people to share the burden of work. A dummy variable is used
to denote whether or not the child spent time working in the family shamba field or garden.
Another variable measures how much time the child helped collect firewood or water for the
household in a week. These variables are included because research has shown that to free up
adults to work in labor-intensive activities like farming, school-age children are most often
expected to fulfill the household tasks of childcare, garden work, and firewood and water
collection. In addition, a number of households in Kagera that attempt to sell agricultural goods
for profit are unsuccessful. Therefore, the model contains a variable to illustrate the success rate
of crop and livestock sales in relation to total attempts.
OLS regression assumes that both y and xi are standard normal and related linearly. Because the
dependent variable in this analysis is binary, the more appropriate assumption is that the effect of
a given change in xi on the probability that a child will attend school changes as values of xi
change. For these reasons, this model is estimated as a probit. Robust standard errors are
estimated to correct for heteroskedasticy stemming from the presence of multiple children from
the same households within the sample. Table 2 outlines the variables of interest and the purpose
of including them in this model.

18
Table 2: Variables of Interest and Purpose for Inclusion
Variable Measures Reason for
Inclusion
Notes
School Attendance 1=school aged child is attending
school currently
0=0 school aged child is not
attending school currently
Dependent
Variable
School aged Child=
observations ages 6-18
Agrarian Income Income earned from agricultural
activities, including crop sales,
crop product sales, livestock
sale, livestock product sale, farm
equipment rental, products from
gardens and shambas
Main
Independent
Variable
Measured in Tanzanian
Shillings (TSh).
Logged
Sex 1=male
0=0 female
Measures Gender
Effect
Age Age; 6-18 Allows me to
analyze specific
subset of ages (6-
18)
Percentage of
Educated adults
Percentage of adults in
household that have any
education
Explanatory
Variable for
Value Household
places on
Education
Adult= observations
older than 18 regardless
of relation to children
Childinhh Number of children within
household
Explanatory
Variable for
Household
Decisions
Regarding Labor
Child= observations
younger than 19 years old
Firewoodwaterhours Number of hours observation
spends collecting firewood
and/or water for household
Explanatory
Variable for
Measuring
Alternative
Activities
In past week
Gardenfield 1=1 observation worked in a
field or garden for household
0=observation did not work in a
field or garden for the household
Explanatory
Variable for
Measuring
Alternative
Activities
In past week

19
Variable Measures Reason for
Inclusion
Notes
Successrate The rate of successful
transactions a household had in
selling crops at the market
Explanatory
Variable for
Measuring Profit
Earning Success
for Activities
Rate= amount of
successful sales/total
amount of sales attempts
in 12 months
Cataginc Proportion of income derived
from Agriculture
1= if 25% or less of income is
from agriculture
2= if 25%-50% of income is
from agriculture
3= if 50%-75% of income is
from agriculture
4= if 75%-99% of income is
from agriculture
5= if 100% of income is from
agriculture
Explanatory
variable for
measuring
difference among
farming incomes
A reduced form model is used to create a baseline for the research. The reduced-form simply
includes household characteristics and is specified below.
P(schoolattendance=1/x) =β0 + sexβ2+ ageβ3 +percentofadultseducβ4 +childreninhhβ5 + µ
The full model includes household characteristics, education characteristics and economic
activities. It is specified as follows,
P(schoolattendance=1/x) =β0 +lnagrarianincomeβ1 +sexβ2+ ageβ3 +percentofadultseducβ4
+childreninhhβ5 +firewoodwaterhoursβ6 +gardenfieldβ7 +sucessrateβ8 +incomeproportionβ9 +
µ

20
RESULTS
Raw Data
The summary statistics of the data used in this research are displayed in Table 3. The table
depicts means, and standard deviations of the variables included in the model.
Table 3: Summary Statistics
Variable Number Mean
(Standard Deviation)
School2 2261 .82
(.398)
Agrarian Income 2211 10.51
(3.6)
Gender 2261 .499
(.5)
Adult In Household 2261 2.77
(1.4)
Children in Household 2261 1.06
(1.05)
Percentage of Educated Adults in Household 2256 .82
(.31)
Firewood Hours 2195 5
(7.6)
Garden or Field Work 2207 .507
(.64)
Success Rate of Agriculture Sales 2207 .207
(.14)
Table 3 shows sample statistics for children who are and are not currently attending school.
Research has claimed that the gender and age of the child have a substantial impact on family
decisions regarding schooling, with girls receiving less school, and children dropping out as they
grow older. This summary data implies that the former is not the case in Kagera. The ratio of

21
boys to girls in both sub groups appears to be fairly equal. Still, the average age of children not
in school is slightly higher than the average age of children in school. This supports the common
belief that children do not continue with education as they grow older.
Table 4: School Attendance
Variable Not in school In school
Child Characteristics Age 15 11
Sex .45 .51
Household
Characteristics
Number of Kids .85 1.11
Number of Adults 3 2.71
Percentage of Educated Adults .85 .82
Economic Characteristics Garden .71 .46
Firewood Hours 6 4.74
Success rate .211 .20
The subgroups show little variation among household characteristics that often influence
families’ decisions regarding family acitivites. The number of kids and number of adults in
households are similar in both groups. The percentage of adults in a household with education is
fairly equal, as well. The apparent equality in these characteristics could imply that other factors
are influencing family decisions outside of the structure of the household.

22
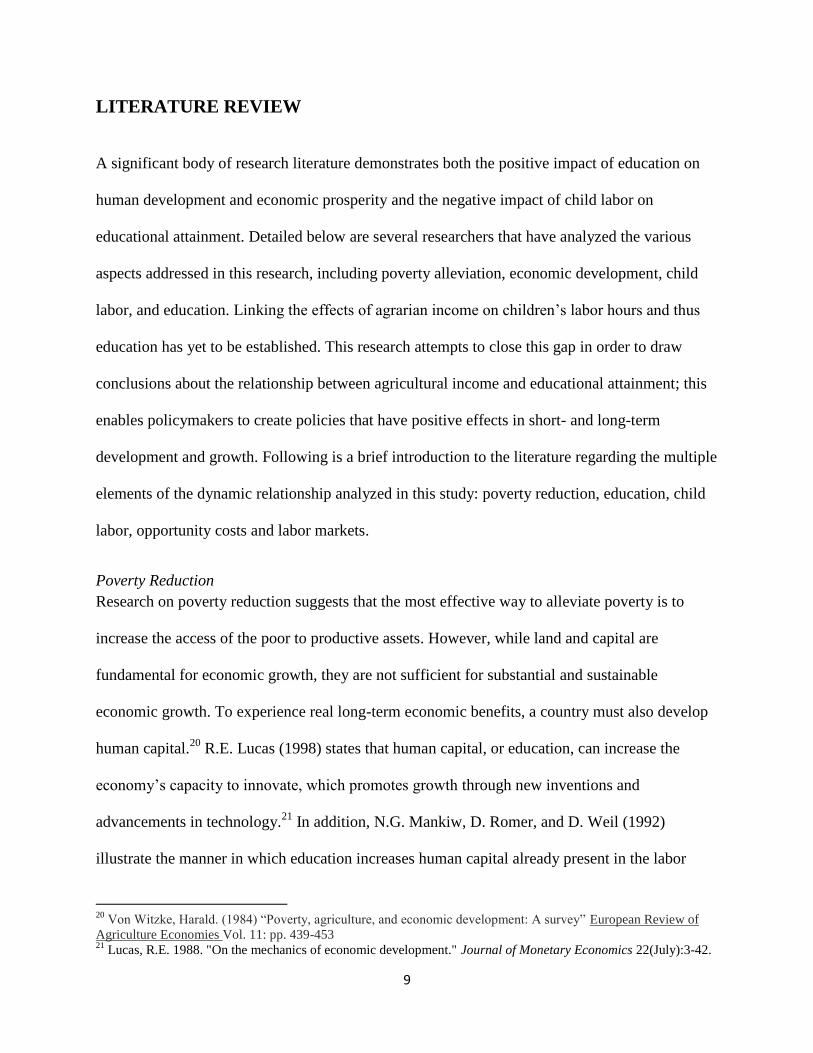
Table 5: Working in Gardens or Shamba Fields
The sample statistics for the economic characteristics of the household livelihood however
provide support for the assumptions used in creating the model for this hypothesis. While the
averages describe small variations among the families of children attending and not attending
school, the direction of the variation is interesting. Children who do not attend school, on
average, work more hours in gardens, shamba fields, and collecting firewood and fetching water
than children that do attend school. Tables 5 and 6 illustrate the ages at which children take on
these household responsibilities.
0
50
100
150
200
250
6 7 8 9 10 11 12 13 14 15 16 17 18
Works in A Garden or
Shamba Field
Does Not Work in a Garden
or Shamba Field

23
Table 6: Fetching Water or Collecting Firewood
As children grow older they take on more responsibilities around the home. Previous research
has claimed children are often expected to help out with daily household chores such as
collecting firewood for fuel and fetching water. Most children from the ages of seven and up
spend time collecting firewood and/or fetching water. And as children grow older they tend to
spend more time in family gardens and shambas with the largest proportion of work being done
by children in the 11-15 age range. This is particularly interesting, because this is also the age
children are able to participate in more physically demanding tasks. These statistics support the
hypothesis that they are dropping out of school to work for the household. Furthermore, the age
at which these children are assuming the household duties corresponds with the conclusions of
previous researchers regarding uneven transition patterns from primary to secondary school
levels. However, the analysis will test whether or not the extra responsibilities are having an
impact on their education.
0
50
100
150
200
250
6 7 8 9 10 11 12 13 14 15 16 17 18
Spends time fetching water
or collecting firewood
Does not spend time fetching
water or collecting firewood

24
Findings
Multiple stages of regression show little variation in significance or coefficients of explanatory
variables as additional independent variables are added to the model. All results are illustrated in
Table 4. Every stage of the regression included household and child characteristics. Results for
the baseline model are presented in the first column. As children in this study grow older they are
less likely to attend school. More specifically, every additional year of age is associated with a
5.9% decrease in the probability that the student will attend school. In addition, a boy is 3.2%
points more likely to attend school than a girl. The number of children in the family reduces
labor force participation, as expected, with each additional child decreasing the probability by
3.8%.
Table 7: Estimated Marginal Effects (Standard Errors) for Probit Models Predicting the
Probability of School Attendance
Variable Reduced form 2nd stage
(Economic
Activity)
3rd
Stage
(Income)
Final Stage
(Income
Proportion)
Children in household .014*
(.007)
.014*
(.007)
.013**
(.007)
.011
(.007)
Percent Educated Adults -.03
(.02)
-.03
(.019)
-.04**
(.02)
-.024
(.02)
Age -.05*
(.002)
-.05*
(.014)
-.05*
(.002)
-.043*
(.0022)
Sex .04*
(.014)
.038*
(.014)
.037*
(.013)
.03***
(.013)
Garden and Shamba Activity -.03*
(.011)
-.03*
(.011)
-.03*
(.011)
Firewood Hours -.001
(.007)
-.0009
(.0007)
-.001**
(.0007)
Rate of Success -.08
(.05)
-.096**
(.05)

25
Variable Reduced form 2nd stage
(Economic
Activity)
3rd
Stage
(Income)
Final Stage
(Income
Proportion)
Agrarian Income (log) .00657*
(.002)
.01*
(.005)
>25% of income is derived from
agriculture
-.066*
(.019)
25%< income derived from agriculture
<50%
-.07*
(.027)
50% < income derived from agriculture
<75%
-.04
(.031)
75%< income derived from agriculture <
99%
-.04
(.032)
*= p<.05 **= p<.10 ***= p<.01
Beginning with the second stage of regression, economic activities of the children are included to
account for opportunity costs a family bears by sending children to school. The probability that a
child who works in his family’s garden or shamba field will attend school is 3% points lower
than a child who is not responsible for such work. This suggests that a more labor-intensive
responsibility, such as gardening or field work has a negative impact on school attendance. The
activities of collecting firewood and fetching water are found to be marginally significant in this
model. Every additional hour a child spends retrieving water or gathering firewood is associated
with a 0.6% decrease in the probability that the student will attend school.
Stage 3 included the categorical variable of the logged agrarian household income. Its statistical
significance implies that agrarian based income does have an effect on a child’s attendance.
Contrary to the hypothesis of this research, a 1% increase in log agrarian income would be
associated with a 6.5 percent increase in the probability of school attendance. To test the impact
of the agrarian income on student attendance thoroughly, the final stage included dummy

26
variables measuring the proportion of household income derived from agriculture. The contrast
category is families with 100% agrarian income. If a family derives less than half but more than
a quarter of their income from agriculture, the probability that their children will attend school is
7% points less than a student from a household with purely agrarian income. Furthermore, if a
family derives less than 25% of their income from agricultural activities their child is 6.6%
points less likely to attend school than a child from a purely agrarian household.
The ratio of successful sales attempts to total sales attempts implies that most farmers in the
Kagera region do not, in fact, make a profit from their agricultural activities. Because of that the
final explanatory variable of my regression might illustrate the most accurate picture of family
decisions in regards to farming and school. According to the analysis, a 10% increase in the
success rate of agricultural sales by farmers is associated with a 9.6% decrease in the probability
that the student will attend school. Thus, as farming families find more success in their
agriculture sales, students attend school less.
Potential Errors
The negative impact of an increased percentage of educated adults on student attendance, and the
positive impact of the agrarian income on student attendance are both counterintuitive. The
former is contrary to previous research finding that the more educated a parent is the more value
they place on their own children’s education. The other explanatory variables in the model in this
study suggest the latter is incorrect. These results could imply that there is a specification error in
the model. If these variables are absorbing the effects of omitted variables, for instance the
model would display endogeonaity issues through omitted variable bias.

27
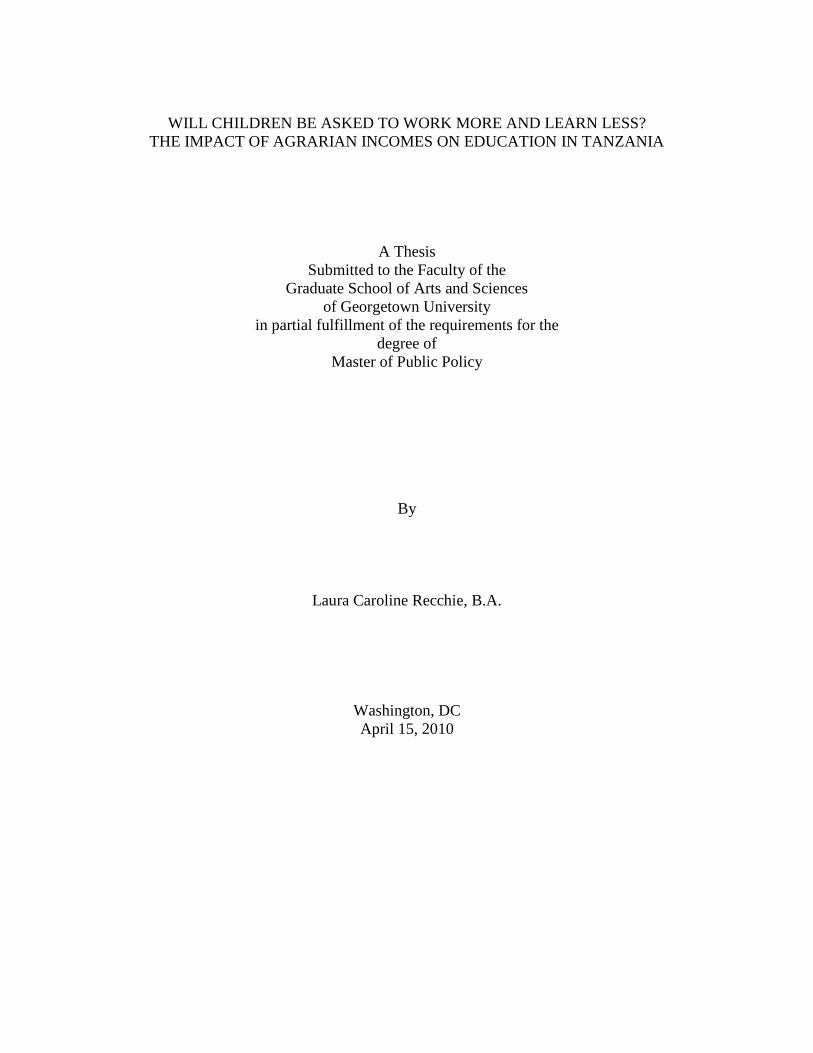
However, given the information contained in the data I believe the surprising results are not a
sign of specification errors, but instead a signal that a different measurement of agrarian impact
is necessary. The true constraint to this model is the main independent variable of agrarian
income. As portrayed in the following illustration, a considerable amount of attempts are made
by farmers to sell a variety of crops. However, only a small portion of those attempts are
successful, meaning that income is only representing a small number of families that are actively
participating in agrarian activities. The unsuccessful farmers, subsistence farmers, are not
earning income and thus could face even fewer options in regards to children’s education than
their profitable neighbors.
Table 8: Percentage of Sales by Crop
0
5
10
15
20
25
Total Sale Attempts
No Sales
Sale

28
CONCLUSION
While the final results of this analysis found that agrarian income actually a positive effect on
children’s school attendance some of the other statistics imply that to disregard agrarian activity
as a potential negative influence on educational attainment would still be a mistake. The
encouraging conclusion from these results is that when families have the resources, such as
increased income, they do choose to send their children to school. Unfortunately, the small, but
significant impact that successful agricultural sales has on children’s school attendance suggest
that agrarian activity does, indeed, have an effect on education. Moreover, the effect of
household activities suggests that school-aged children are spending increasing amounts of time
on household chores such as collecting firewood and fetching water. As children grow older,
they take on responsibilities that are more physically demanding, such as garden work and
shamba field work. The growing physical intensity of the work could still serve as a major factor
in the decision to keep children home from school.
Policy Implications
The effect of labor on the probability of student attendance implies that economic policies should
target crops and products that are high in profitability but low in labor demand. This would allow
families to maximize their profits, while minimizing the need for child labor. As shown in table 8
on page 27 farmers produce a wide variety of crops. A better awareness of the varying effects
among crops, livestock and products would also allow economic policy makers to make more
focused, and thus more effective, agricultural policy.

29
While a better understanding of the effects of agriculture on children’s lives can help create
improved policy, social development must be considered a goal of the economic policy to ensure
sustainability. To guarantee both short term economic growth as well as long term economic
sustainable development, human capital must be protected and encouraged. Therefore, a two
tiered policy coupling economic growth with human capital development is the optimal way to
address the present economic needs as well as the long term development of the Tanzanian
people. Tanzania should consider programs that provide families with financial incentives for
school attendance and parental involvement such as Mexico’s Opportunidas. Opportunidas is
empirically proven to keep children in school by offsetting the cost of lost labor at home.39
Another program that could be considered as a complement to agricultural policies is a food for
education program (FFE).40
Similar to Opportunidas, an FFE program provides children food in
return for school attendance. These programs have been proven to increase school attendance.
Furthermore, a program like FFE could provide local farmers a consumer for their product.
An efficient policy will match the incentive for attendance to the opportunity cost perceived by
the families. A publicly funded FFE program that purchases foods from local farmers to feed
local students creates a virtuous economic cycle. In the short-term, farmers profit from the sale
of products, but are also provided with the opportunity and incentive to send their children to
school. The children, in turn, immediately contribute to the household with the food they earn for
39
Molyneux, Maxine. Mothers at the Service of the New Poverty Agenda: Progresa/Oportunidades, Mexico's
Conditional Cash Transfer Programme. Rep. no. 0144–5596. 4th ed. Vol. 40. Social Policy and Administration,
2006. Print. 40 Adelman, Sarah W., Daniel O. Gilligan, and Kim Lehrer. How Effective Are Food For Education
Programs? A Critical Assessment of the Evidence from Developing Countries. Publication. 9th ed. Washington DC:
International Food Policy Research Institute, 2008. Print. Food Policy Review.

30
attending school which makes up for the labor lost by that attendance. In the long run, students
attain an education that then allows them to transfer farming knowledge, advance technologies,
increase productivity or even shift from agriculture to other enterprises – all of which ultimately
can increase profits. The higher levels of education produced by an FFE-like policy also allow
economies to evolve: expanding markets and job opportunities for future generations.
Suggestions for Further Research
Further research is necessary to conclusively determine the impact agrarian activity has on
education in developing countries. The main independent variable in this study, income, served
as a constraint for this model. As the success rate measurement illustrated, a majority of farmers
in Kagera do not make substantial profit from their farming activities. Because of this, much of a
household’s farming activities were not captured in household income. Two families could spend
similar time on growing bananas, but if one is able to sell the bananas and another is not- the
income earned will not provide an accurate measurement of family member’s activities or labor.
Because of this finding, it is suggested that future studies that build upon this research should use
a different measurement to serve as a proxy for agricultural activity. Given the significance of
the variables measuring household activities; labor hours versus school and studying hours might
serve as a rewarding direction for further research.
Alternatively, because the KHDS includes over thirty different types of crops and crop products
and dozens of livestock options and products made from livestock byproduct, the results of this
analysis imply that further studies should target the effect of specific crops, livelihood or
products on income and child labor hours. It is possible that such research would find that some

31
crops or products are more profitable than others, and some might also be more labor intensive
than others.
Summary
This study serves as an illustration of the relationship between agrarian income, economic
activities and school attendance by children in farming households. It helps bridge a gap in
development literature analyzing the impact of economics on education and provides further
support for research analyzing the impact of labor on education. This study found that families in
Tanzania will send their children to school when they possess the capability to do so. Moreover,
the largest impediment to school education is the opportunity cost of lost labor within the
household.
Based on this research, both economic policies and development policies need to provide the
poorest Tanzanian agrarian households with immediate benefits for sending children to school as
they will undoubtedly see the immediate cost of losing extra labor around the house. If
economic policies work in cooperation with development policies, however, economic growth
and human capital development can be generated simultaneously- increasing the sustainability of
both.

32
REFERENCES
Adelman, Sarah W., Daniel O. Gilligan, and Kim Lehrer. 2008. “How Effective Are Food For Education
Programs? A Critical Assessment of the Evidence from Developing Countries.” Food Policy
Review, no. 9. Washington D.C.: International Food Policy Research Institute.
Ahn, Tyler. "Children of Malawi: The Impact of Agricultural Technology on Educational Attainment
and Child Labor Hours." Thesis. Georgetown Policy Policy Institute, 2004. Print.
Ainsworth, Martha, Godlike Koda, George Lwihula, Phares Mujinja, Mead Over and Innocent Semali.
1992. "Measuring the Economic Impact of Fatal Adult Illness in Sub-Saharan Africa: An
Annotated Household Questionnaire". Living Standards Measurement Study Working Paper, no.
90. Washington, D.C.: The World Bank.
Beegle, Kathleen, Rajeev Dehejia, Robert Gatti, and Sofya Krutikova. 2008. “The Consequences of
Child Labor: Evidence from Logitudinal Data in Rural Tanzania.” World Bank Policy Working
Paper, no. 4677. Washington D.C.: World Bank.
Beegle, Kathleen, Rajeev Dehejia, and Robert Gatti. 2005. “Why Should We Care about Child Labor?
The Education, Labor Market, and Health Consequences of Child Labor.” World Bank Policy
Research Working Paper, no. 3479. Washington D.C.: World Bank.
Bredie, Joseph W.B. and Girindre K. Beeharry. 1998. “School Enrollment Decline in Sub-Saharan
Africa: Beyond the Supply Constraint” World Bank Discussion Paper, no. 395. Washington,
D.C.: The World Bank

33
Canagarajah, S., H. Coulombe, and World Bank. Africa Regional Office. Human Development
Technical Family. 1997. “Child labor and schooling in Ghana.” Policy research working paper.
Washington, D.C.: World Bank Human Development Technical Family.
Cavalieri, C. (2002) “The Impact of Child Labor on Educational Performance: An Evaluation of Brazil.”
Manuscript.
Cockburn, John. (2000) Child Labor versus Education: Poverty Constraints or Income Opportunities?
Oxford, England, Nuffield College.
"Corruption Perception Index (CPI) 2009 - Interactive World Map | EduTube Educational Videos."
EduTube Educational Videos | Learn something new every day. Web. 4 Dec. 2009.
<http://www.edutube.org/interactive/corruption-perception-index-cpi-2009-interactive-world-
map>.
"Country Factbook: Tanzania." Country Factbook. CIA. Web. 15 Dec. 2009.
”Earth Trends World Resource Institute.” Web. 20 Jan. 2010.
<http://earthtrends.wri.org/searchable_db/index.php?action=select_countries&theme=10&variab
le_ID=643>.
Heady, C. 2003. “The Effect of Child Labor on Learning Achievement.” World Development 31: 385-
398.
"Human Development Report 2009 - Country Fact Sheets - Tanzania (United Republic of)." Statistics |
Human Development Reports (HDR) | United Nations Development Programme (UNDP). Web.
1 Dec. 2009. <http://hdrstats.undp.org/en/countries/country_fact_sheets/cty_fs_TZA.html>.

34
"International Economics Glossary: C." U-M Personal World Wide Web Server. Web. 12 Dec. 2009.
<http://www-personal.umich.edu/~alandear/glossary/c.html>.
International Labor Organization. “Investing in Every Child: An economic study of the costs and
benefits of eliminating child labor.” Rep. Geneva: International Labor Office, 2003.
Kagera Health and Development Survey. Dataset. World Bank, Washington, D.C.
Lucas, R.E. 1988. "On the mechanics of economic development." Journal of Monetary Economics
22(July):3-42.
Mankiw, N.G., D. Romer, and D. Weil. 1992. "A Contribution to the Empirics of Economic
Growth."Quarterly Journal of Economics 107,no.2 (May):407-437.
Mill, J.S., Principles of Political Economy with Some of their Applications to Social Philosophy. 1848,
Boston,: C.C. Little & J.Brown. 2 v. (pg. 952)
Molyneux, Maxine. 2006. ”Mothers at the Service of the New Poverty Agenda: Progresa/Oportunidades,
Mexico's Conditional Cash Transfer Programme.” Rep. no. 0144–5596. 4th ed. Vol. 40. Social
Policy and Administration.
Nelson, R.R., and E. Phelps. 1966. "Investment in humans, technology diffusion and economic
growth." American Economic Review 56,no.2 (May):69-75.
Patrinos, Harry A., and George Psacharopoulos. 1995. “Educational Performance and Child Labor in
Paraguay.” International Journal of Educational Development 15: 4
35
Pritchett, Lant. 2004. “Towards a New Consensus for Addressing the Global Challenges of the Lack of
Education.” Copenhagen Consensus Challenge Paper, Copenhagen Consensus.
“Tanzania Agriculture.” Republic of Tanzania.Web. 15 Nov. 2009.
< www.tanzania.go.tz/agriculture.hml>.
Tanzania -- Ministry Of Agriculture, Food and Cooperatives- Home Page. Web. 13 Dec. 2009.
<http://www.kilimo.go.tz>
Tanzania -- Ministry Of Agriculture, Food and Cooperatives- Home Page. Web. 13 Dec. 2009.
<http://www.kilimo.go.tz/statistics/regionalreports/KAGERA%20REGION%20REPORT.pdf>.
Von Witzke, Harald. 1984. “Poverty, agriculture, and economic development: A survey”
European Review of Agriculture Economies Vol. 11: pp. 439-453
Wedge, J., Where Peace Begins: Education's Role in Conflict Prevention and Peacebuilding, in Save
the Children Rewrite the Future. 2008, Save the Children.
Recommended