Valvular Flow Quantification with Phase Contrast Imaging (2D, 4D)
Christopher J François, MD Associate Professor, Chief of Cardiovascular Imaging
Department of Radiology, Cardiovascular and Thoracic Sections University of Wisconsin-Madison
RSNA 2016
11:35AM November 29, 2016
RC303-14
RSN
A 2
01
6 –
RC
30
3-1
4
Val
vula
r Fl
ow
Qu
anti
fica
tio
n
wit
h M
RI
Learning Objectives
• Physics of imaging blood flow with MRI
• How phase contrast MRI is used in valve disease
• Role for 4D flow MRI in valve disease
RSN
A 2
01
6 –
RC
30
3-1
4
Val
vula
r Fl
ow
Qu
anti
fica
tio
n
wit
h M
RI
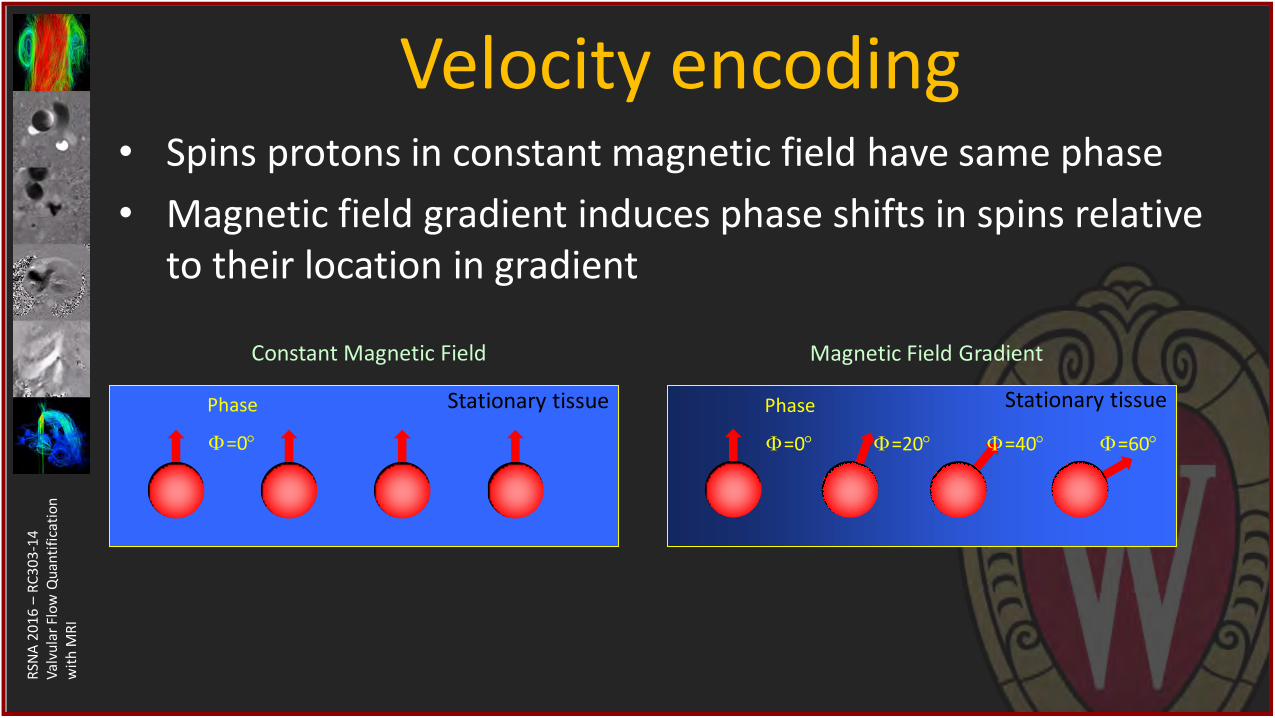
Velocity encoding • Spins protons in constant magnetic field have same phase
• Magnetic field gradient induces phase shifts in spins relative to their location in gradient
Phase
=0
Constant Magnetic Field
Stationary tissue Phase
=0
Magnetic Field Gradient
Stationary tissue
=20
=40
=60
RSN
A 2
01
6 –
RC
30
3-1
4
Val
vula
r Fl
ow
Qu
anti
fica
tio
n
wit
h M
RI
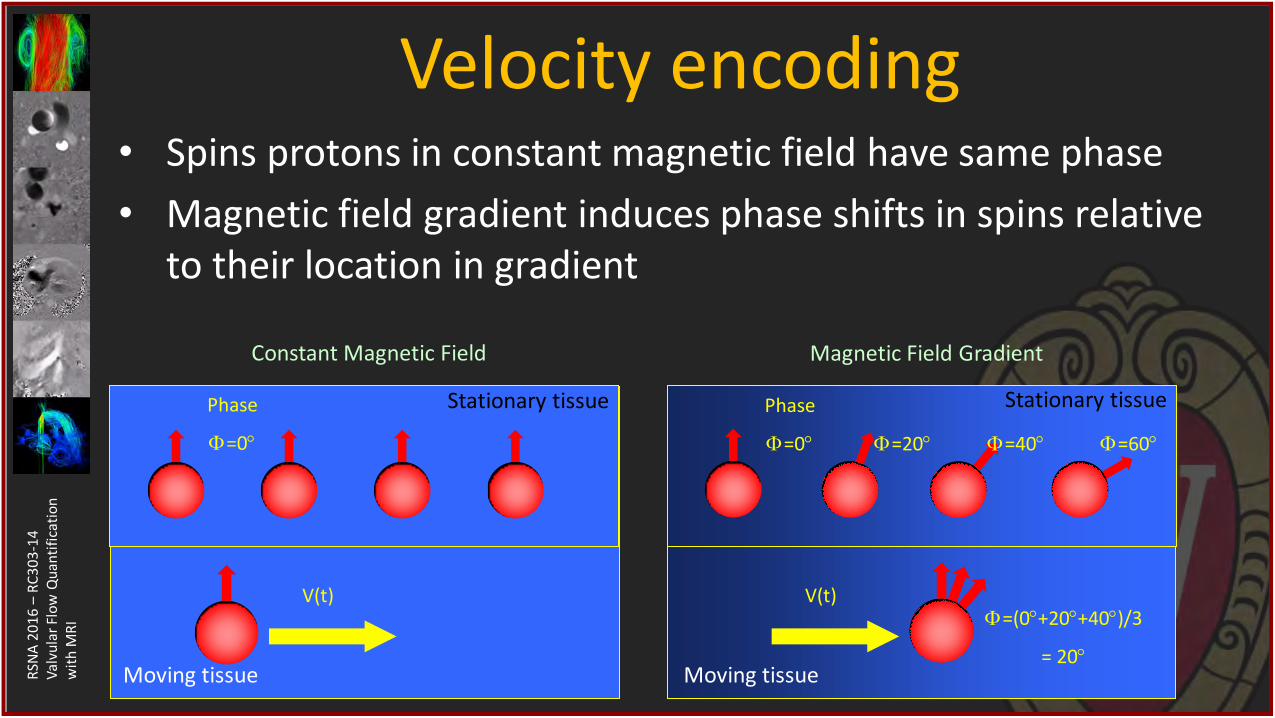
Velocity encoding • Spins protons in constant magnetic field have same phase
• Magnetic field gradient induces phase shifts in spins relative to their location in gradient
Phase
=0
Constant Magnetic Field
Stationary tissue Phase
=0
Magnetic Field Gradient
Stationary tissue
=20
=40
=60
V(t)
Moving tissue
V(t)
Moving tissue
=(0+20+40)/3
= 20
RSN
A 2
01
6 –
RC
30
3-1
4
Val
vula
r Fl
ow
Qu
anti
fica
tio
n
wit
h M
RI
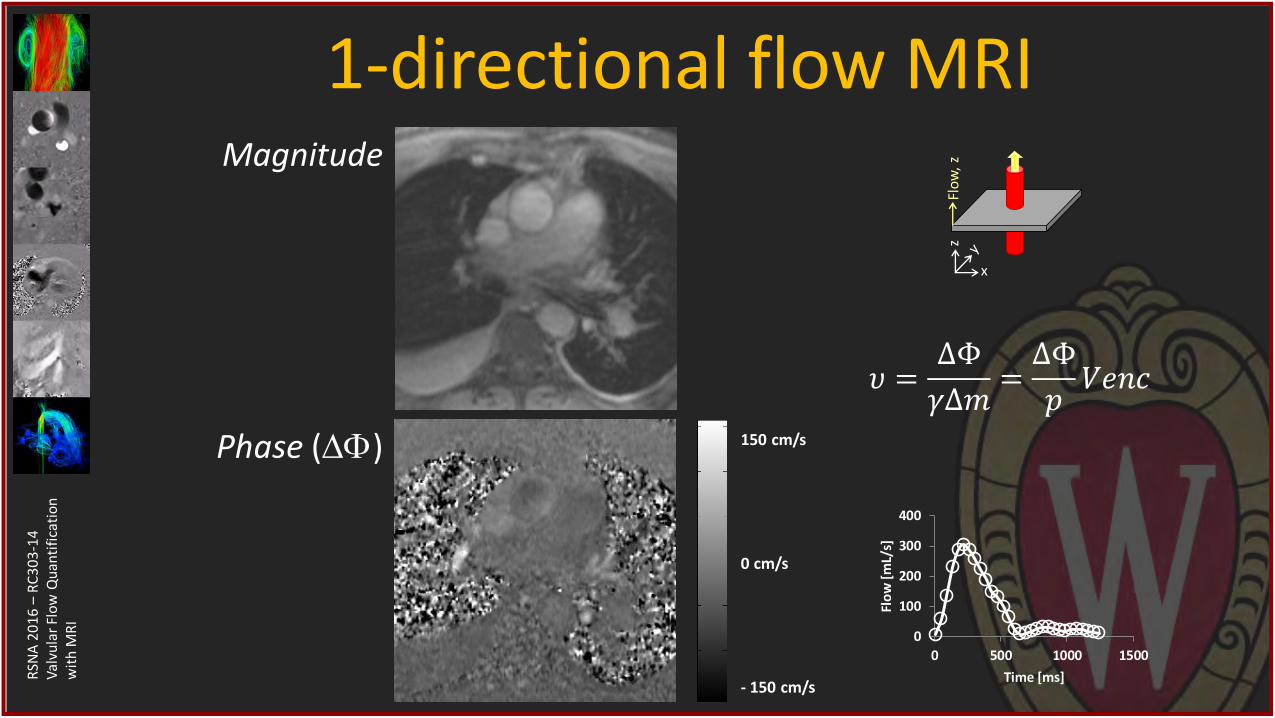
1-directional flow MRI Magnitude
Phase () 150 cm/s
0 cm/s
- 150 cm/s
0
100
200
300
400
0 500 1000 1500
Flo
w [
mL/
s]
Time [ms]
𝜐 =ΔΦ
𝛾Δ𝑚=ΔΦ
𝑝𝑉𝑒𝑛𝑐
Flo
w,
z
x
z
RSN
A 2
01
6 –
RC
30
3-1
4
Val
vula
r Fl
ow
Qu
anti
fica
tio
n
wit
h M
RI
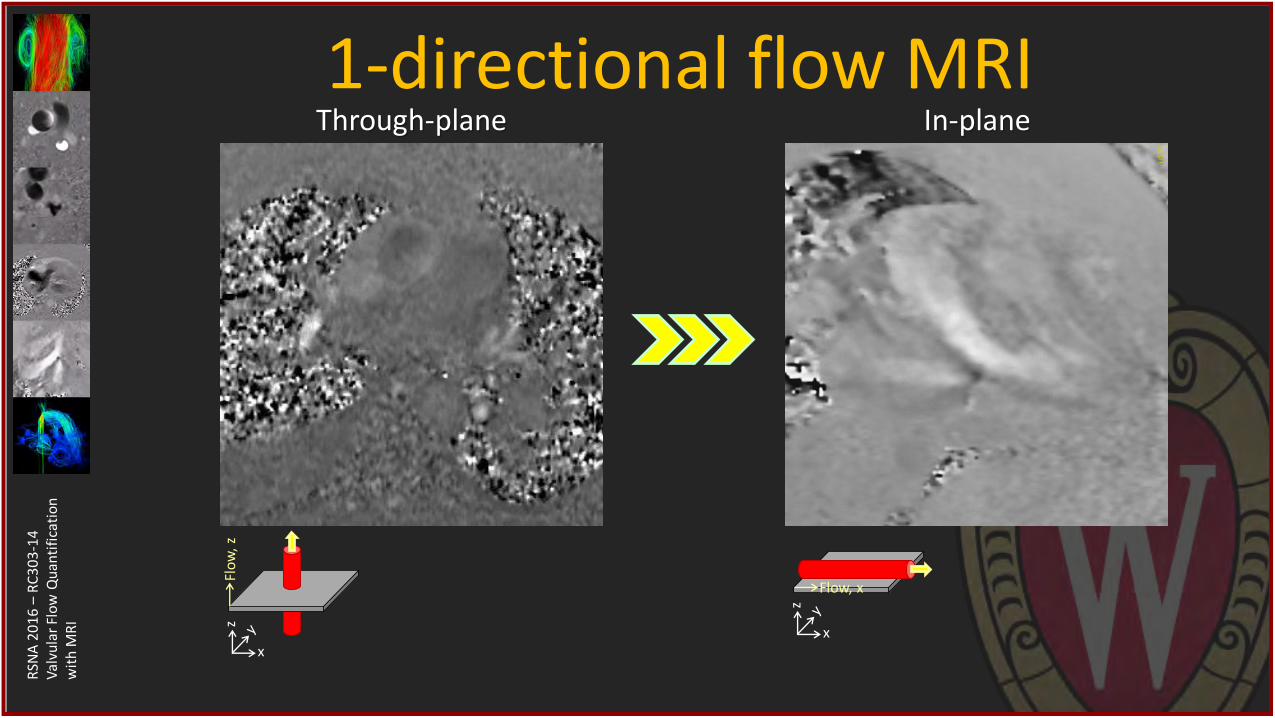
1-directional flow MRI Through-plane In-plane
Flo
w,
z
x
z
x
z
Flow, x
RSN
A 2
01
6 –
RC
30
3-1
4
Val
vula
r Fl
ow
Qu
anti
fica
tio
n
wit
h M
RI
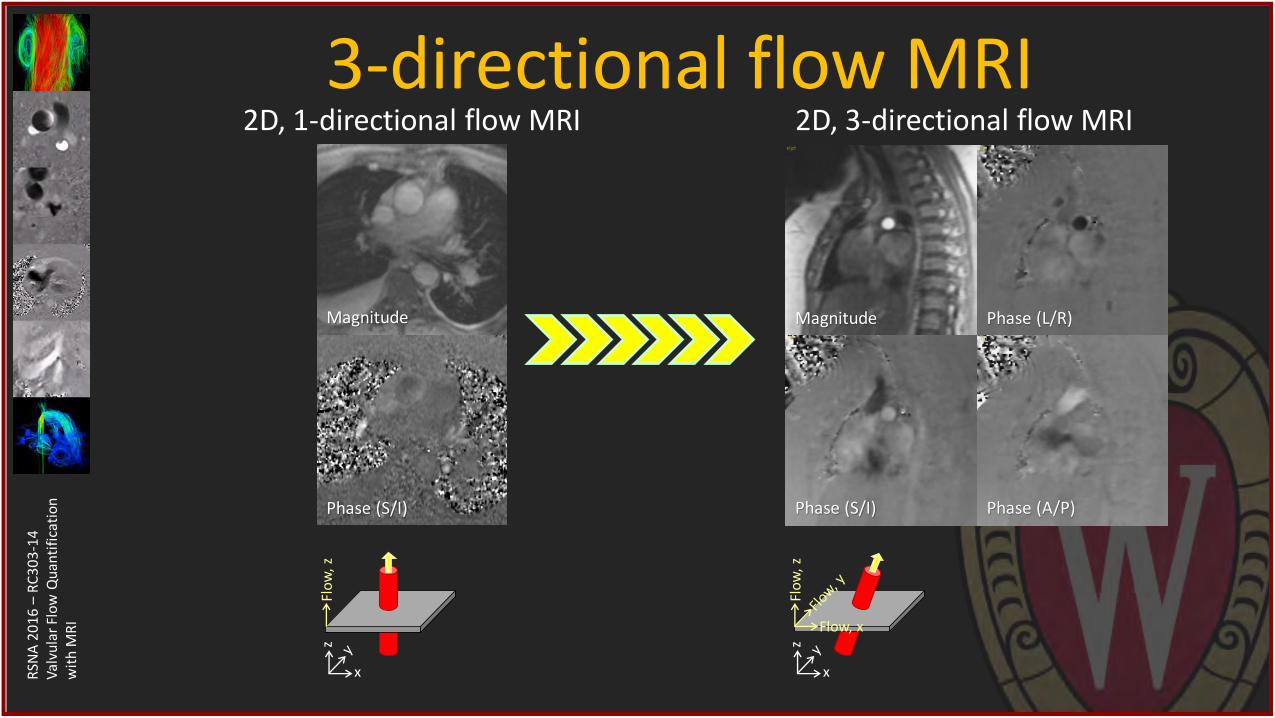
3-directional flow MRI 2D, 3-directional flow MRI
Magnitude
Phase (S/I) Phase (A/P)
Phase (L/R)
Flow, x
Flo
w,
z
x
z
2D, 1-directional flow MRI
Magnitude
Phase (S/I)
Flo
w,
z
x
z
RSN
A 2
01
6 –
RC
30
3-1
4
Val
vula
r Fl
ow
Qu
anti
fica
tio
n
wit
h M
RI
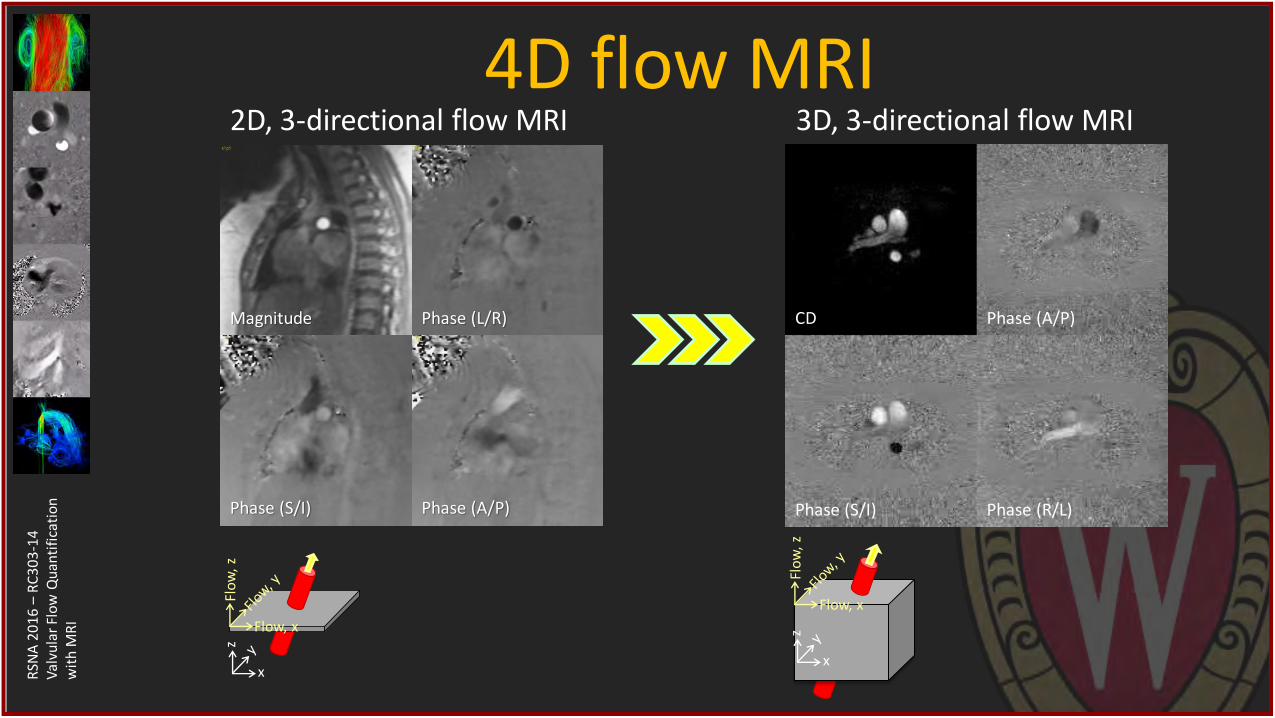
4D flow MRI 2D, 3-directional flow MRI
Magnitude
Phase (S/I) Phase (A/P)
Phase (L/R)
Flow, x
Flo
w,
z
x
z
Phase (R/L)
Phase (A/P)
Phase (S/I)
CD
3D, 3-directional flow MRI
Flow, x
Flo
w,
z
x
z
RSN
A 2
01
6 –
RC
30
3-1
4
Val
vula
r Fl
ow
Qu
anti
fica
tio
n
wit
h M
RI
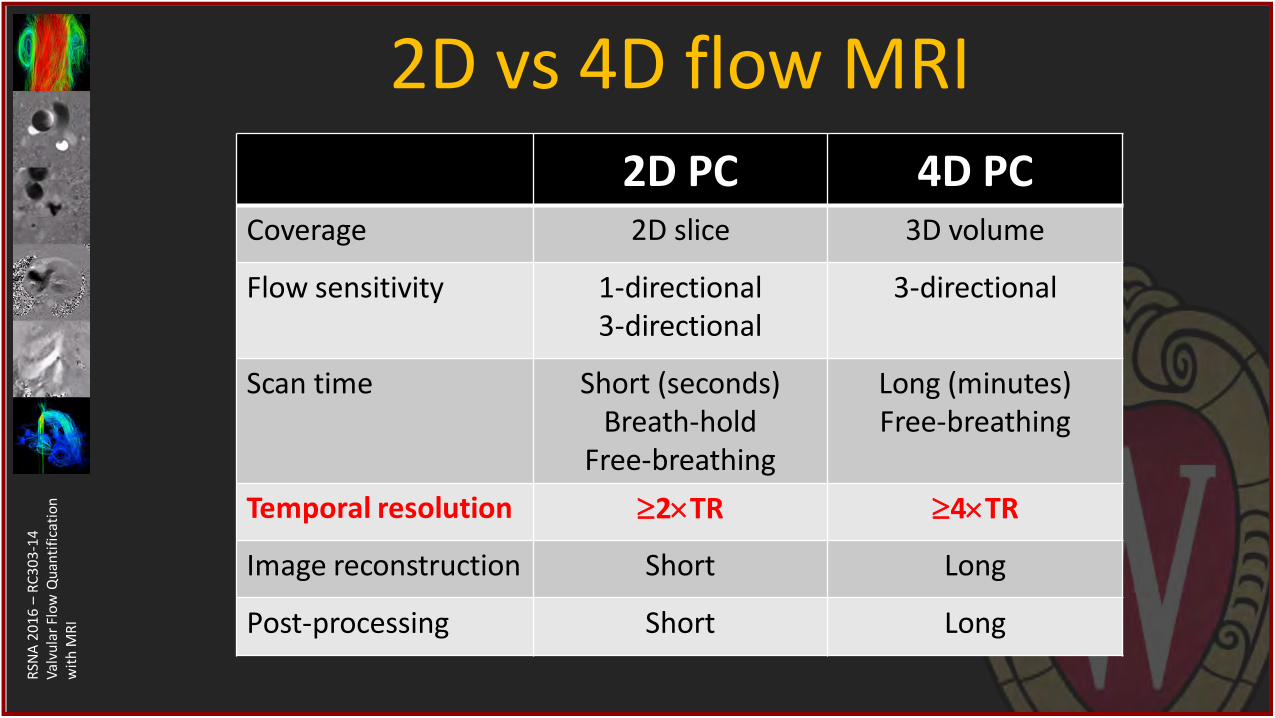
2D vs 4D flow MRI 2D PC 4D PC
Coverage 2D slice 3D volume
Flow sensitivity 1-directional 3-directional
3-directional
Scan time Short (seconds) Breath-hold
Free-breathing
Long (minutes) Free-breathing
Temporal resolution 2TR 4TR
Image reconstruction Short Long
Post-processing Short Long
RSN
A 2
01
6 –
RC
30
3-1
4
Val
vula
r Fl
ow
Qu
anti
fica
tio
n
wit
h M
RI
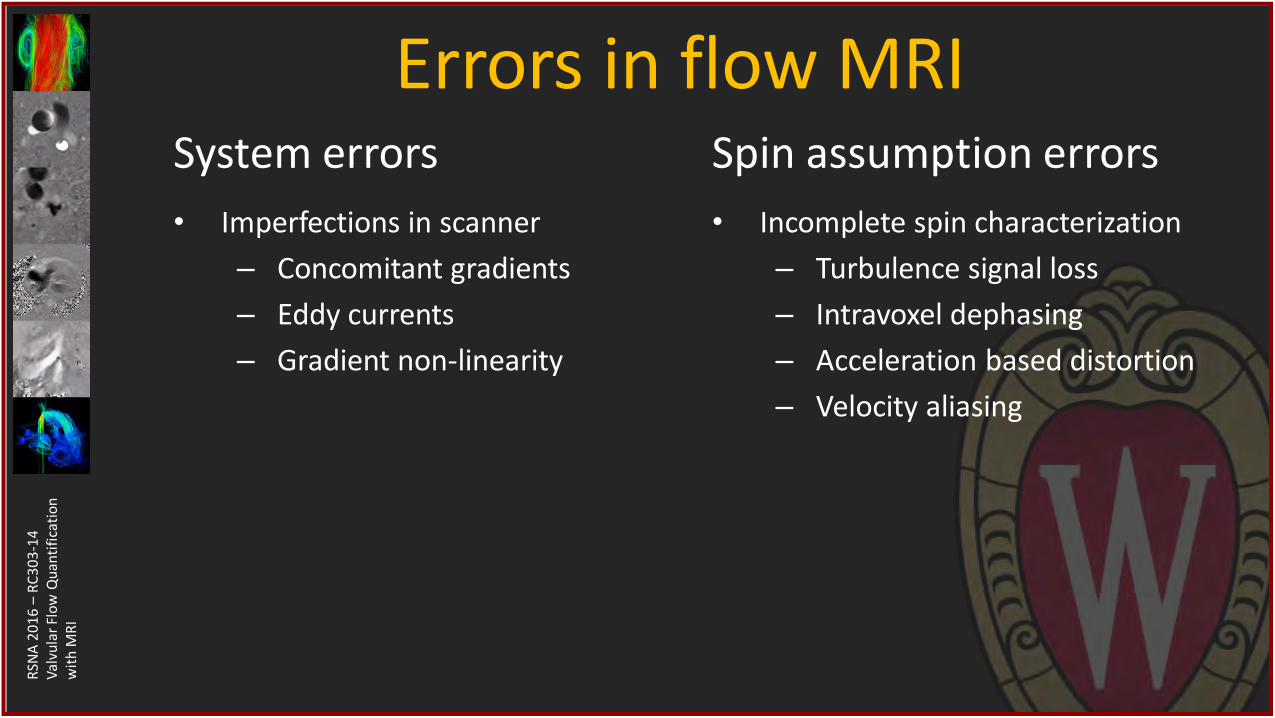
Errors in flow MRI System errors
• Imperfections in scanner
– Concomitant gradients
– Eddy currents
– Gradient non-linearity
Spin assumption errors
• Incomplete spin characterization
– Turbulence signal loss
– Intravoxel dephasing
– Acceleration based distortion
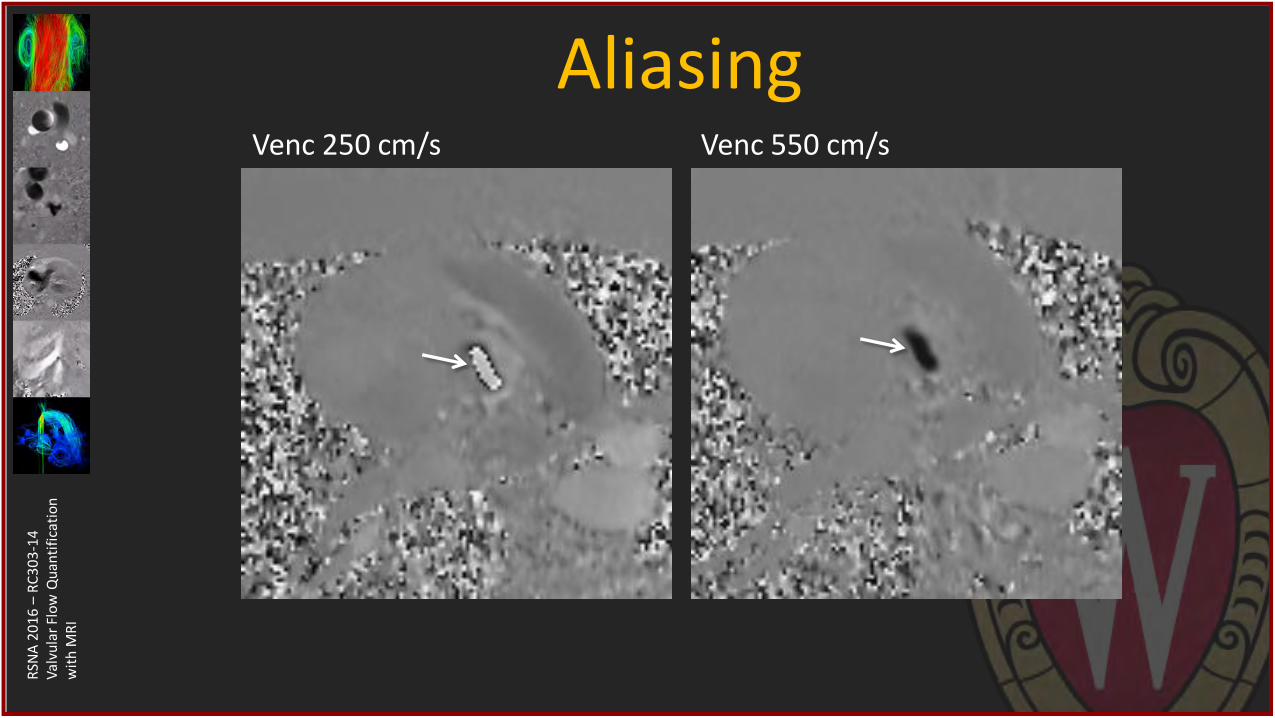
– Velocity aliasing
RSN
A 2
01
6 –
RC
30
3-1
4
Val
vula
r Fl
ow
Qu
anti
fica
tio
n
wit
h M
RI
Aliasing Venc 250 cm/s Venc 550 cm/s
RSN
A 2
01
6 –
RC
30
3-1
4
Val
vula
r Fl
ow
Qu
anti
fica
tio
n
wit
h M
RI
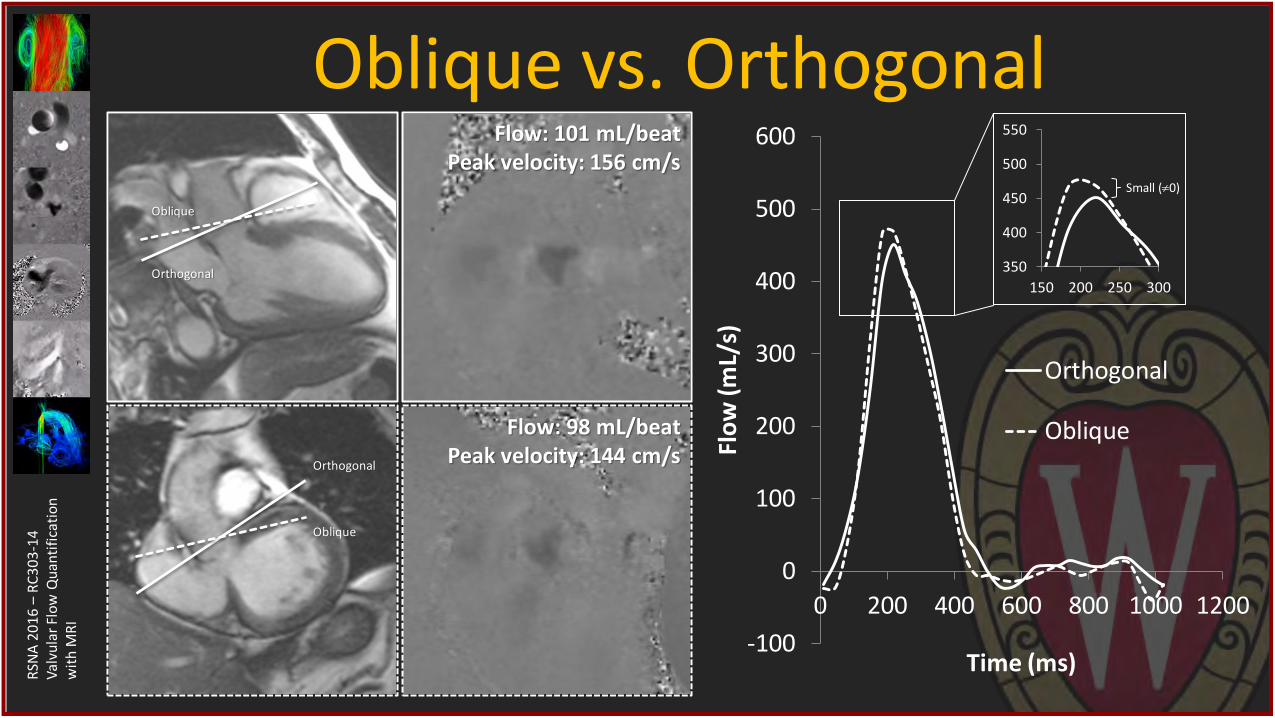
Oblique vs. Orthogonal
-100
0
100
200
300
400
500
600
0 200 400 600 800 1000 1200
Flo
w (m
L/s)
Time (ms)
Orthogonal
Oblique
Flow: 101 mL/beat Peak velocity: 156 cm/s
Flow: 98 mL/beat Peak velocity: 144 cm/s
Orthogonal
Oblique
Oblique
Orthogonal
350
400
450
500
550
150 200 250 300
Small (0)
RSN
A 2
01
6 –
RC
30
3-1
4
Val
vula
r Fl
ow
Qu
anti
fica
tio
n
wit
h M
RI
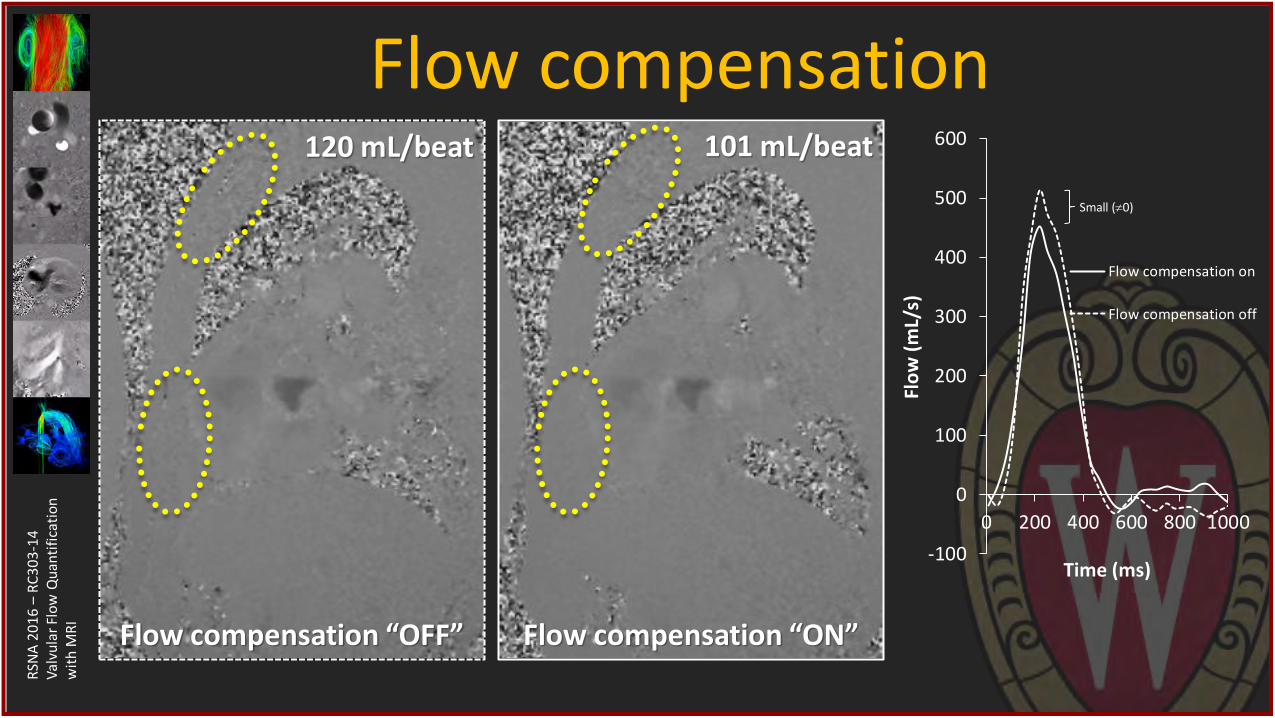
Flow compensation
-100
0
100
200
300
400
500
600
0 200 400 600 800 1000
Flo
w (
mL/
s)
Time (ms)
Flow compensation on
Flow compensation off
Flow compensation “OFF” Flow compensation “ON”
101 mL/beat 120 mL/beat
Small (0)
RSN
A 2
01
6 –
RC
30
3-1
4
Val
vula
r Fl
ow
Qu
anti
fica
tio
n
wit
h M
RI
325
350
375
100 150 200 250 300
-50
0
50
100
150
200
250
300
350
400
0 200 400 600 800Fl
ow
[m
L/s]
Time [ms]
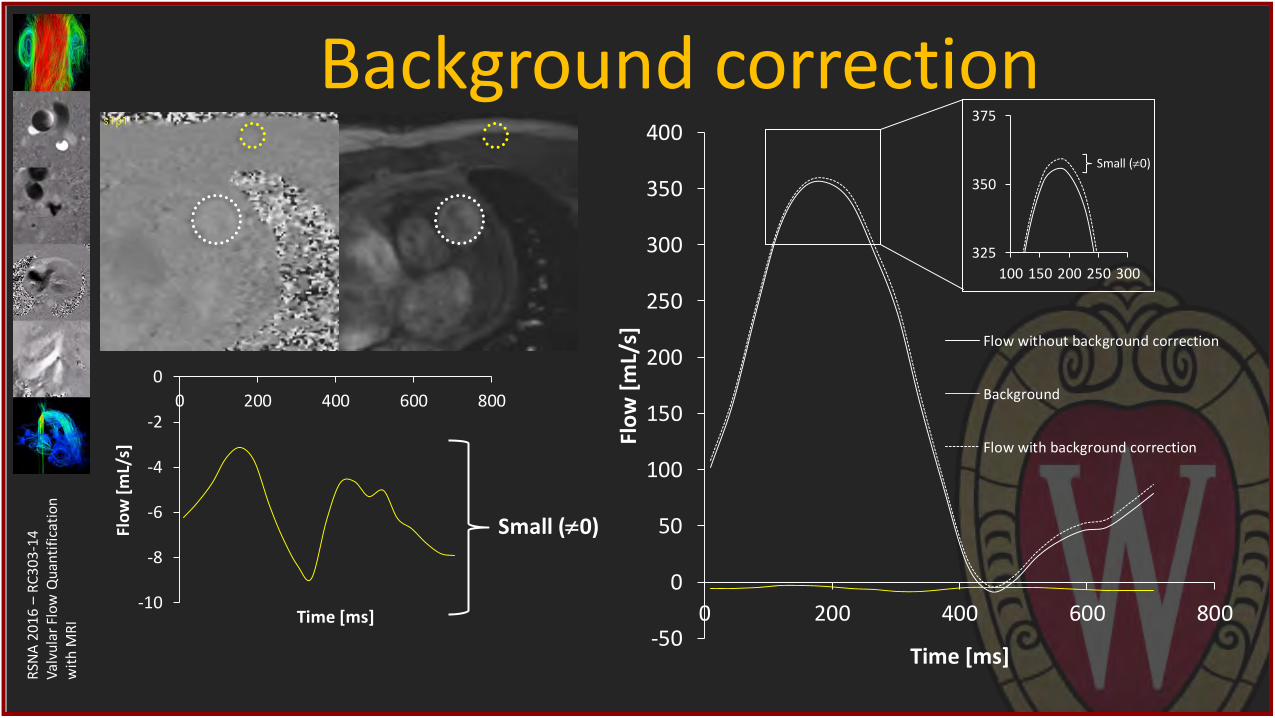
Flow without background correction
Background
Flow with background correction
Background correction
-10
-8
-6
-4
-2
0
0 200 400 600 800
Flo
w [
mL/
s]
Time [ms]
Small (0)
Small (0)
RSN
A 2
01
6 –
RC
30
3-1
4
Val
vula
r Fl
ow
Qu
anti
fica
tio
n
wit
h M
RI
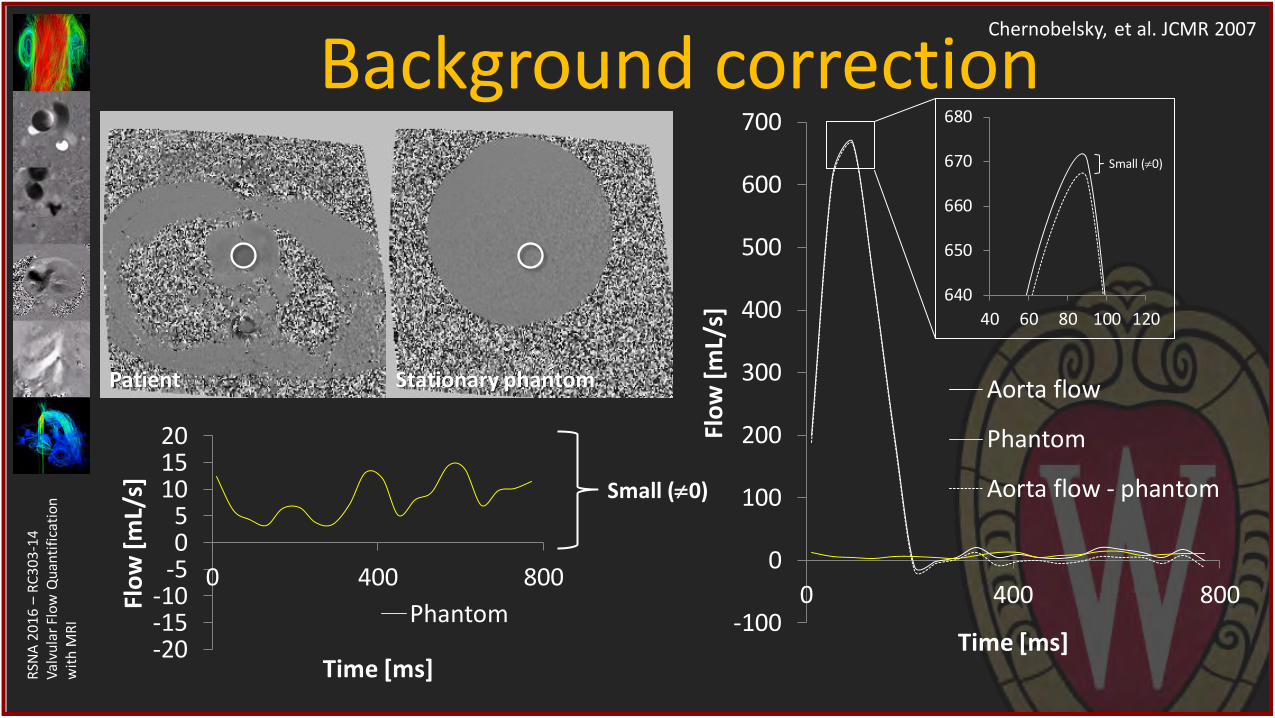
Background correction Chernobelsky, et al. JCMR 2007
Patient Stationary phantom
-100
0
100
200
300
400
500
600
700
0 400 800
Flo
w [
mL/
s]
Time [ms]
Aorta flow
Phantom
Aorta flow - phantom
640
650
660
670
680
40 60 80 100 120
-20-15-10
-505
101520
0 400 800
Flo
w [
mL/
s]
Time [ms]
Phantom
Small (0)
Small (0)
RSN
A 2
01
6 –
RC
30
3-1
4
Val
vula
r Fl
ow
Qu
anti
fica
tio
n
wit
h M
RI
Flow MRI for valve disease • Setting up planes for 2D flow MRI
• Flow quantification with 2D flow MRI
• Clinical examples using 2D flow MRI
• 4D flow MRI in valve disease
RSN
A 2
01
6 –
RC
30
3-1
4
Val
vula
r Fl
ow
Qu
anti
fica
tio
n
wit
h M
RI
Flow MRI for valve disease • Setting up planes for 2D flow MRI
• Flow quantification with 2D flow MRI
• Clinical examples using 2D flow MRI
• 4D flow MRI in valve disease
RSN
A 2
01
6 –
RC
30
3-1
4
Val
vula
r Fl
ow
Qu
anti
fica
tio
n
wit
h M
RI
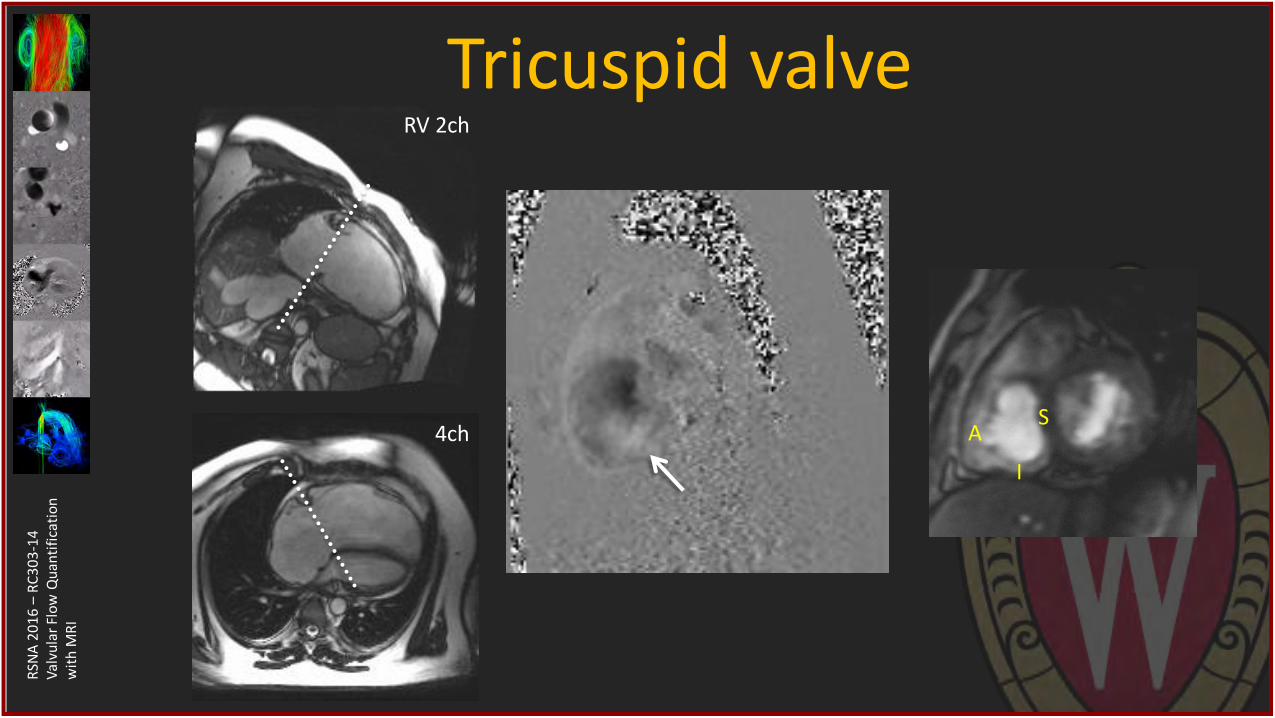
Tricuspid valve RV 2ch
4ch A S
I
RSN
A 2
01
6 –
RC
30
3-1
4
Val
vula
r Fl
ow
Qu
anti
fica
tio
n
wit
h M
RI
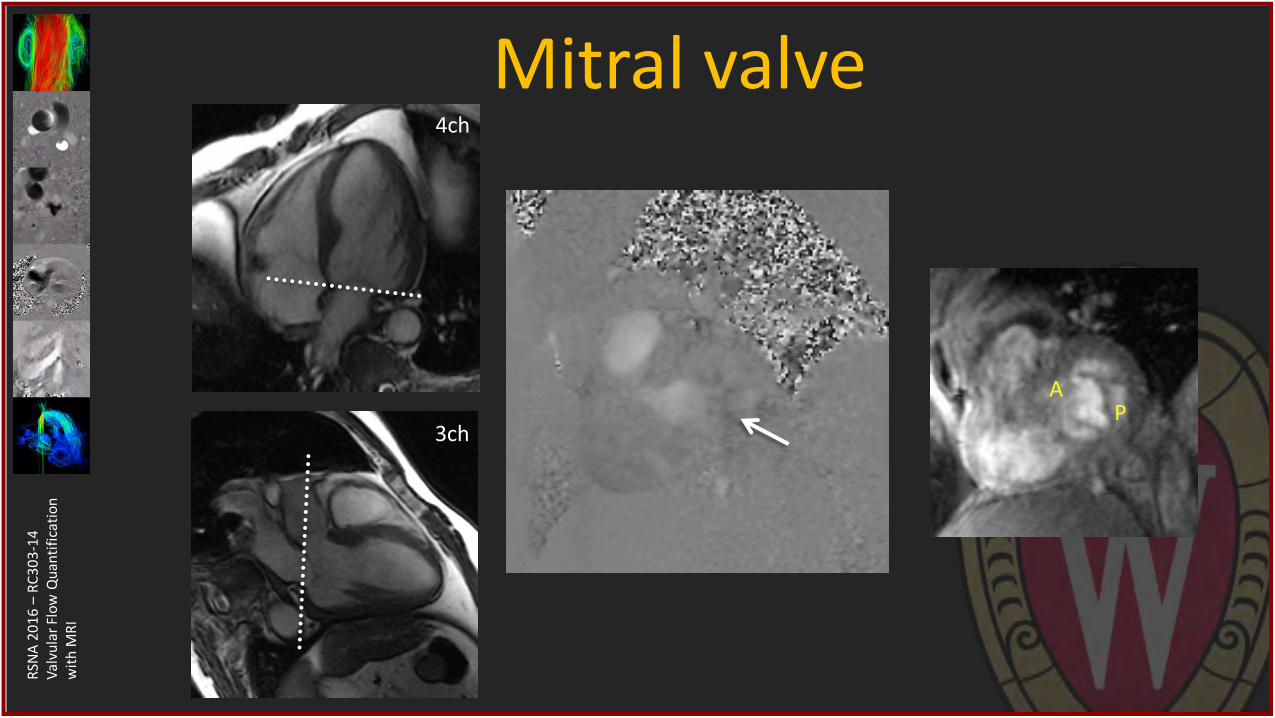
Mitral valve 4ch
3ch
A P
RSN
A 2
01
6 –
RC
30
3-1
4
Val
vula
r Fl
ow
Qu
anti
fica
tio
n
wit
h M
RI
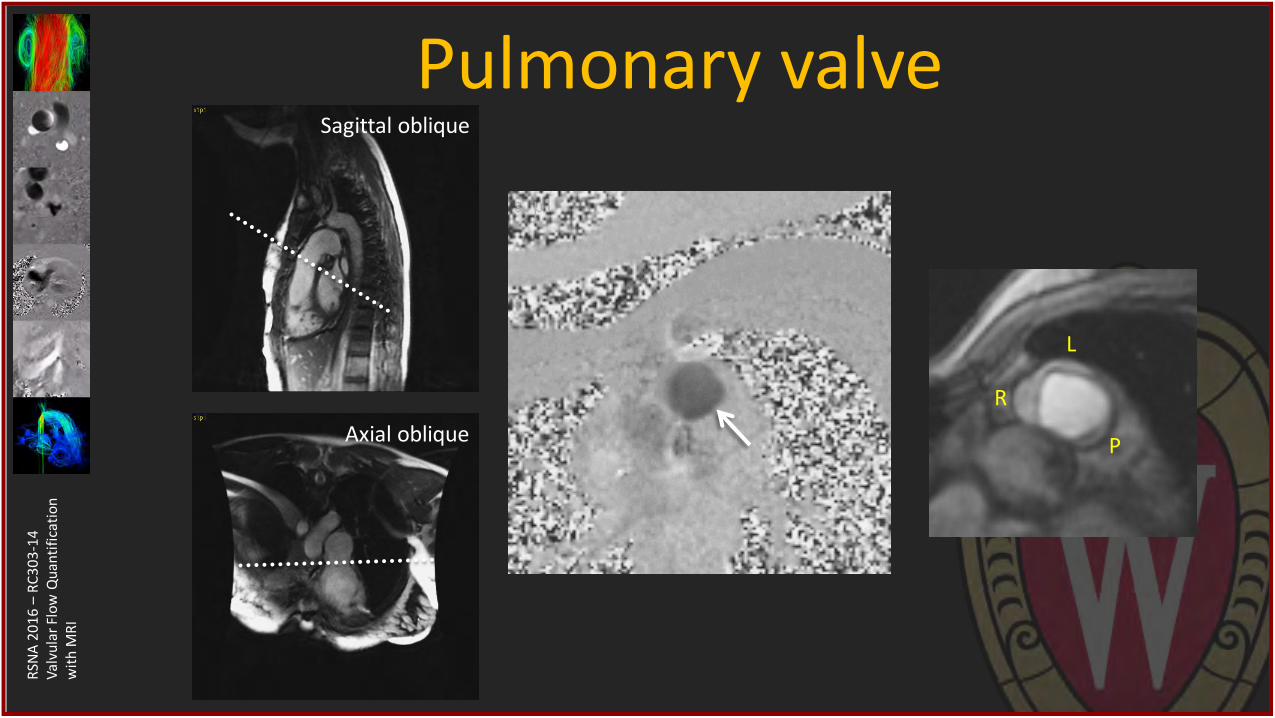
Pulmonary valve Sagittal oblique
Axial oblique
R
L
P
RSN
A 2
01
6 –
RC
30
3-1
4
Val
vula
r Fl
ow
Qu
anti
fica
tio
n
wit
h M
RI
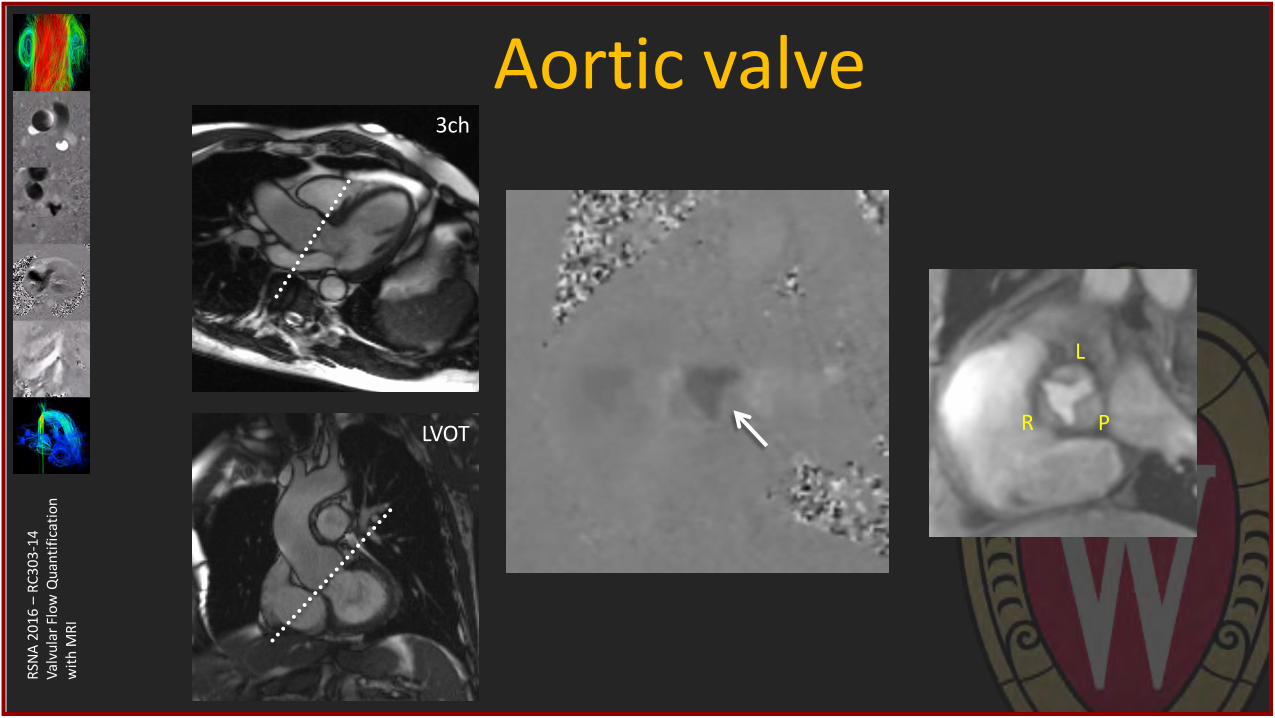
Aortic valve 3ch
LVOT R
L
P
RSN
A 2
01
6 –
RC
30
3-1
4
Val
vula
r Fl
ow
Qu
anti
fica
tio
n
wit
h M
RI
Flow MRI for valve disease • Setting up planes for 2D flow MRI
• Flow quantification with 2D flow MRI
• Clinical examples using 2D flow MRI
• 4D flow MRI in valve disease
RSN
A 2
01
6 –
RC
30
3-1
4
Val
vula
r Fl
ow
Qu
anti
fica
tio
n
wit
h M
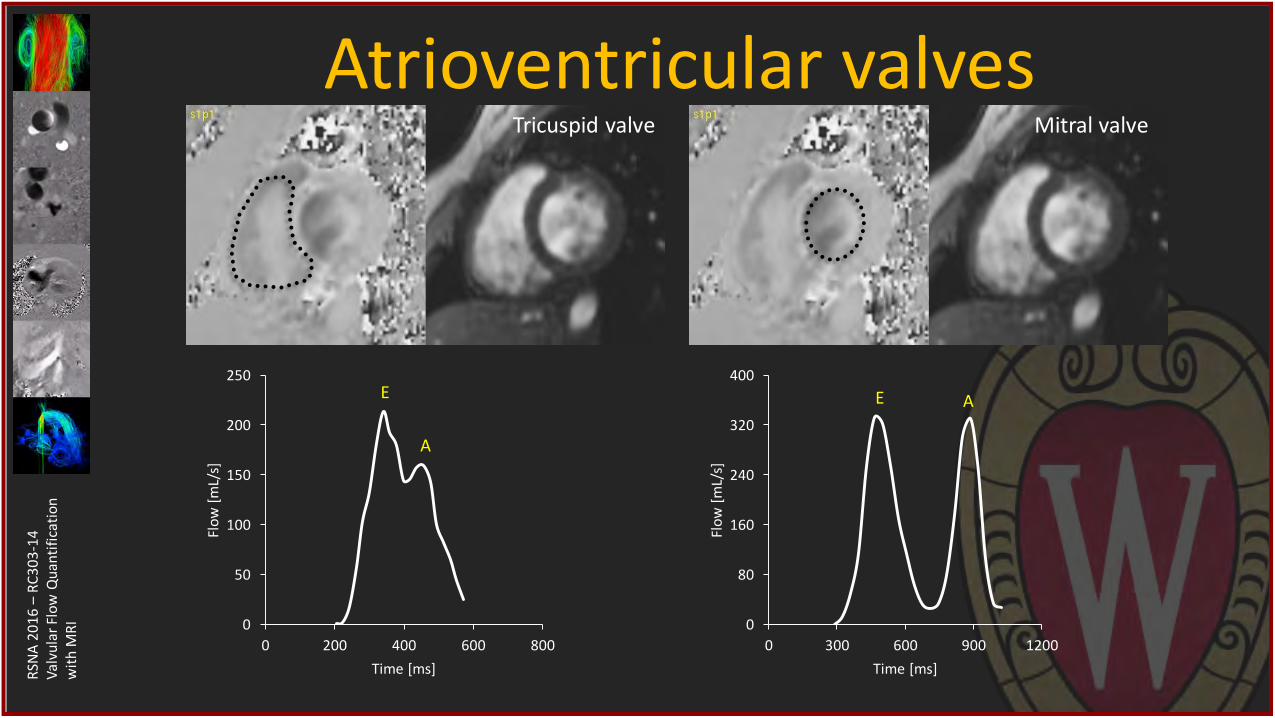
RI 0
80
160
240
320
400
0 300 600 900 1200
Flo
w [
mL/
s]
Time [ms]
E A
Atrioventricular valves
0
50
100
150
200
250
0 200 400 600 800
Flo
w [
mL/
s]
Time [ms]
E
A
Tricuspid valve Mitral valve
RSN
A 2
01
6 –
RC
30
3-1
4
Val
vula
r Fl
ow
Qu
anti
fica
tio
n
wit
h M
RI
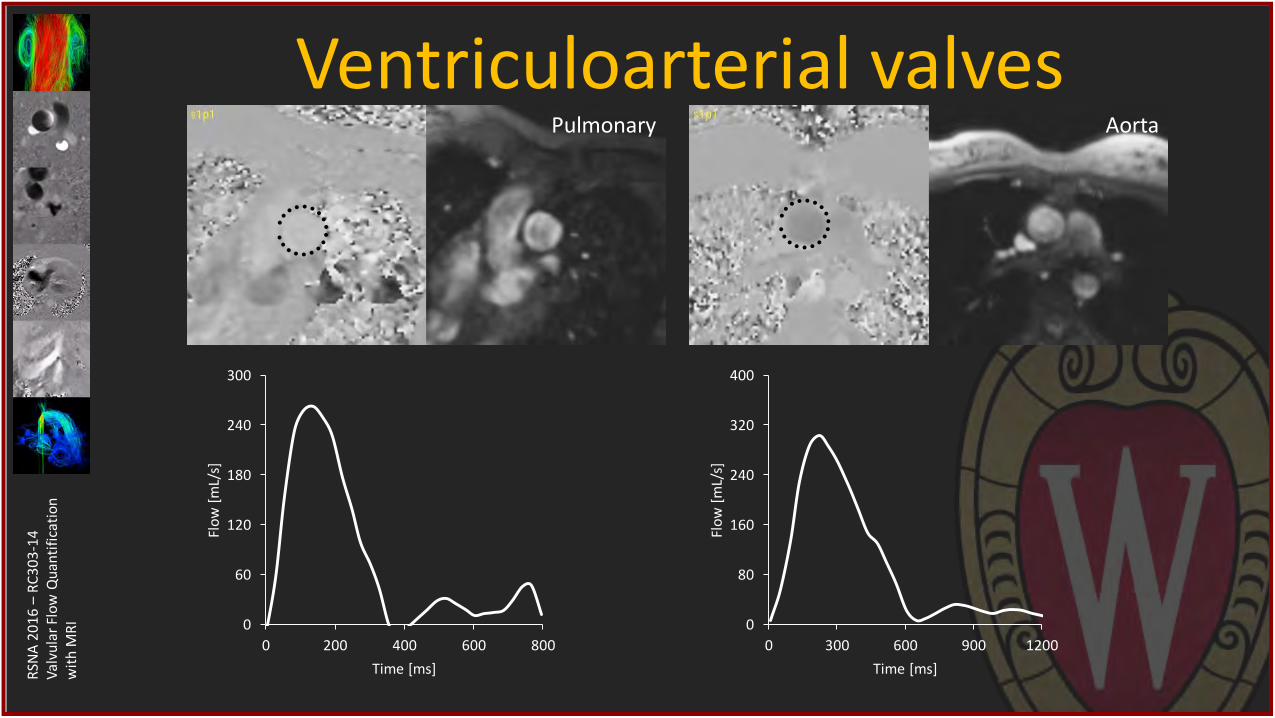
Ventriculoarterial valves
0
80
160
240
320
400
0 300 600 900 1200
Flo
w [
mL/
s]
Time [ms]
0
60
120
180
240
300
0 200 400 600 800
Flo
w [
mL/
s]
Time [ms]
Pulmonary Aorta
RSN
A 2
01
6 –
RC
30
3-1
4
Val
vula
r Fl
ow
Qu
anti
fica
tio
n
wit
h M
RI
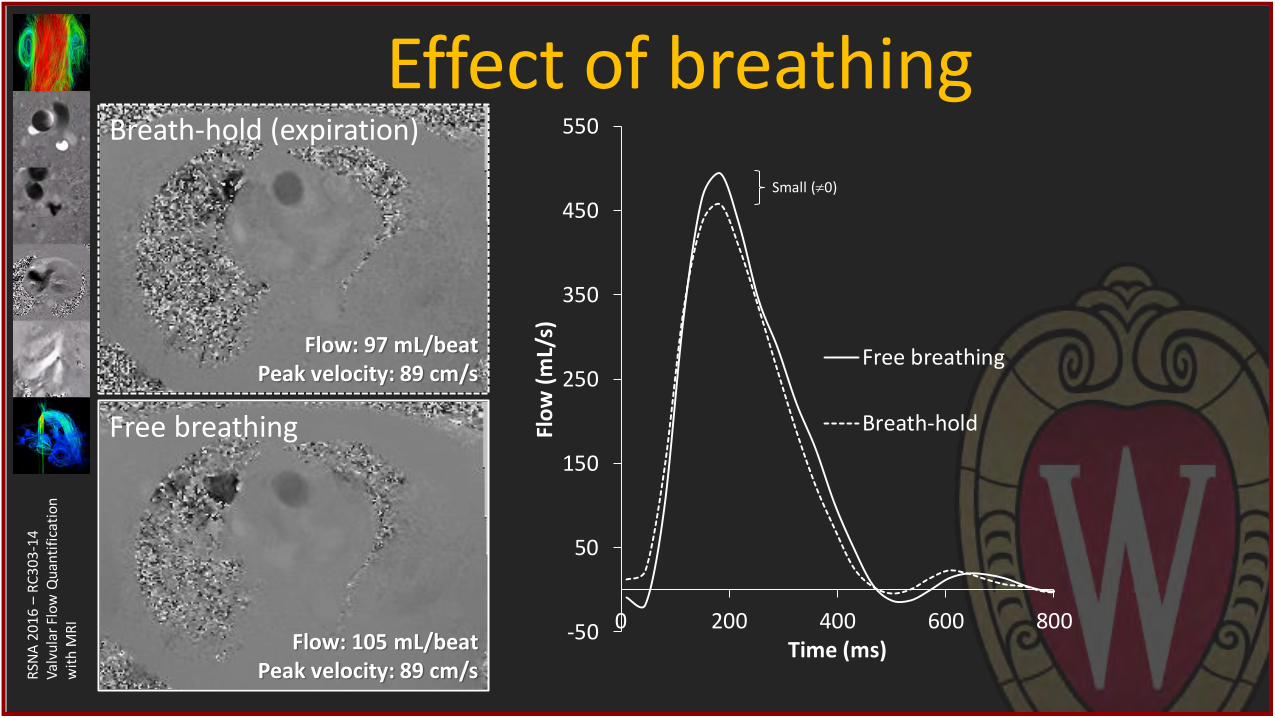
Effect of breathing
-50
50
150
250
350
450
550
0 200 400 600 800
Flo
w (
mL/
s)
Time (ms)
Free breathing
Breath-hold
Breath-hold (expiration)
Flow: 97 mL/beat Peak velocity: 89 cm/s
Free breathing
Flow: 105 mL/beat Peak velocity: 89 cm/s
Small (0)
RSN
A 2
01
6 –
RC
30
3-1
4
Val
vula
r Fl
ow
Qu
anti
fica
tio
n
wit
h M
RI
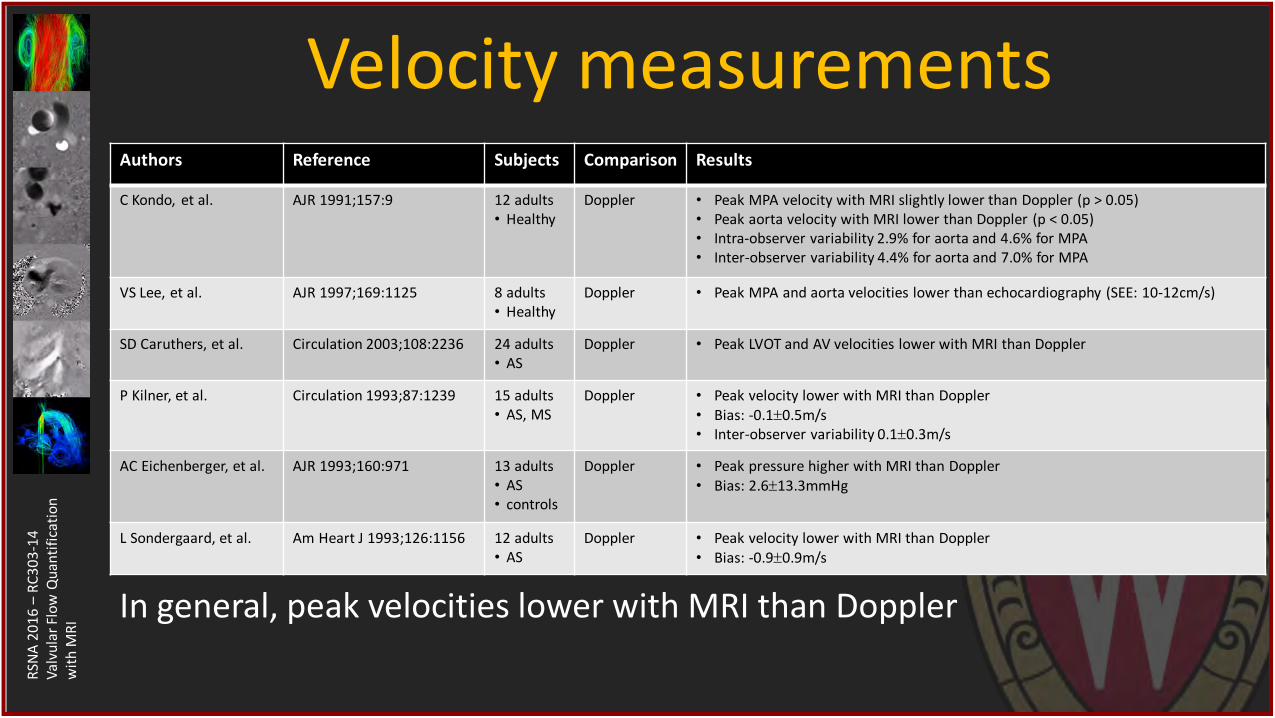
Velocity measurements Authors Reference Subjects Comparison Results
C Kondo, et al. AJR 1991;157:9 12 adults • Healthy
Doppler • Peak MPA velocity with MRI slightly lower than Doppler (p > 0.05) • Peak aorta velocity with MRI lower than Doppler (p < 0.05) • Intra-observer variability 2.9% for aorta and 4.6% for MPA • Inter-observer variability 4.4% for aorta and 7.0% for MPA
VS Lee, et al. AJR 1997;169:1125 8 adults • Healthy
Doppler • Peak MPA and aorta velocities lower than echocardiography (SEE: 10-12cm/s)
SD Caruthers, et al. Circulation 2003;108:2236 24 adults • AS
Doppler • Peak LVOT and AV velocities lower with MRI than Doppler
P Kilner, et al. Circulation 1993;87:1239 15 adults • AS, MS
Doppler • Peak velocity lower with MRI than Doppler • Bias: -0.10.5m/s • Inter-observer variability 0.10.3m/s
AC Eichenberger, et al. AJR 1993;160:971 13 adults • AS • controls
Doppler • Peak pressure higher with MRI than Doppler • Bias: 2.613.3mmHg
L Sondergaard, et al. Am Heart J 1993;126:1156 12 adults • AS
Doppler
• Peak velocity lower with MRI than Doppler • Bias: -0.90.9m/s
In general, peak velocities lower with MRI than Doppler
RSN
A 2
01
6 –
RC
30
3-1
4
Val
vula
r Fl
ow
Qu
anti
fica
tio
n
wit
h M
RI
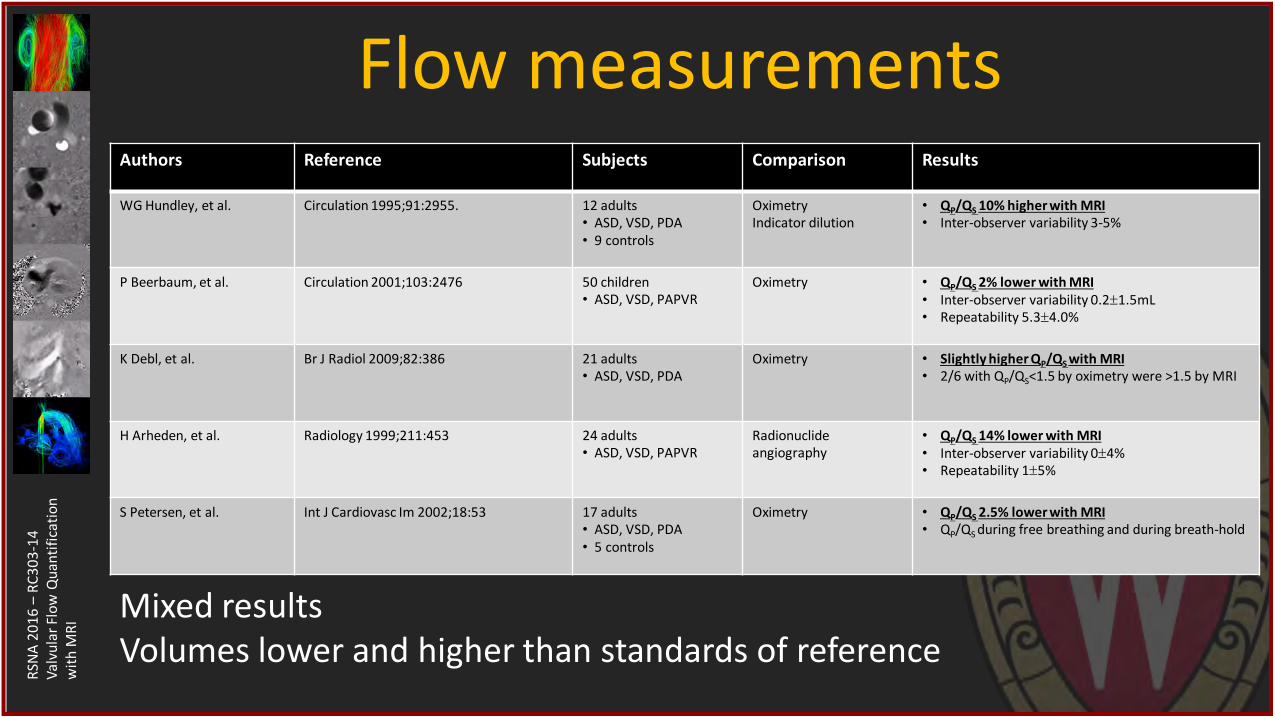
Flow measurements Authors Reference Subjects Comparison Results
WG Hundley, et al. Circulation 1995;91:2955. 12 adults • ASD, VSD, PDA • 9 controls
Oximetry Indicator dilution
• QP/QS 10% higher with MRI
• Inter-observer variability 3-5%
P Beerbaum, et al. Circulation 2001;103:2476 50 children • ASD, VSD, PAPVR
Oximetry • QP/QS 2% lower with MRI
• Inter-observer variability 0.21.5mL • Repeatability 5.34.0%
K Debl, et al. Br J Radiol 2009;82:386 21 adults • ASD, VSD, PDA
Oximetry • Slightly higher QP/QS with MRI
• 2/6 with QP/QS<1.5 by oximetry were >1.5 by MRI
H Arheden, et al. Radiology 1999;211:453 24 adults • ASD, VSD, PAPVR
Radionuclide angiography
• QP/QS 14% lower with MRI
• Inter-observer variability 04% • Repeatability 15%
S Petersen, et al. Int J Cardiovasc Im 2002;18:53 17 adults • ASD, VSD, PDA • 5 controls
Oximetry • QP/QS 2.5% lower with MRI
• QP/QS during free breathing and during breath-hold
Mixed results Volumes lower and higher than standards of reference
RSN
A 2
01
6 –
RC
30
3-1
4
Val
vula
r Fl
ow
Qu
anti
fica
tio
n
wit
h M
RI
Flow MRI for valve disease • Setting up planes for 2D flow MRI
• Flow quantification with 2D flow MRI
• Clinical examples using 2D flow MRI
• 4D flow MRI in valve disease
RSN
A 2
01
6 –
RC
30
3-1
4
Val
vula
r Fl
ow
Qu
anti
fica
tio
n
wit
h M
RI
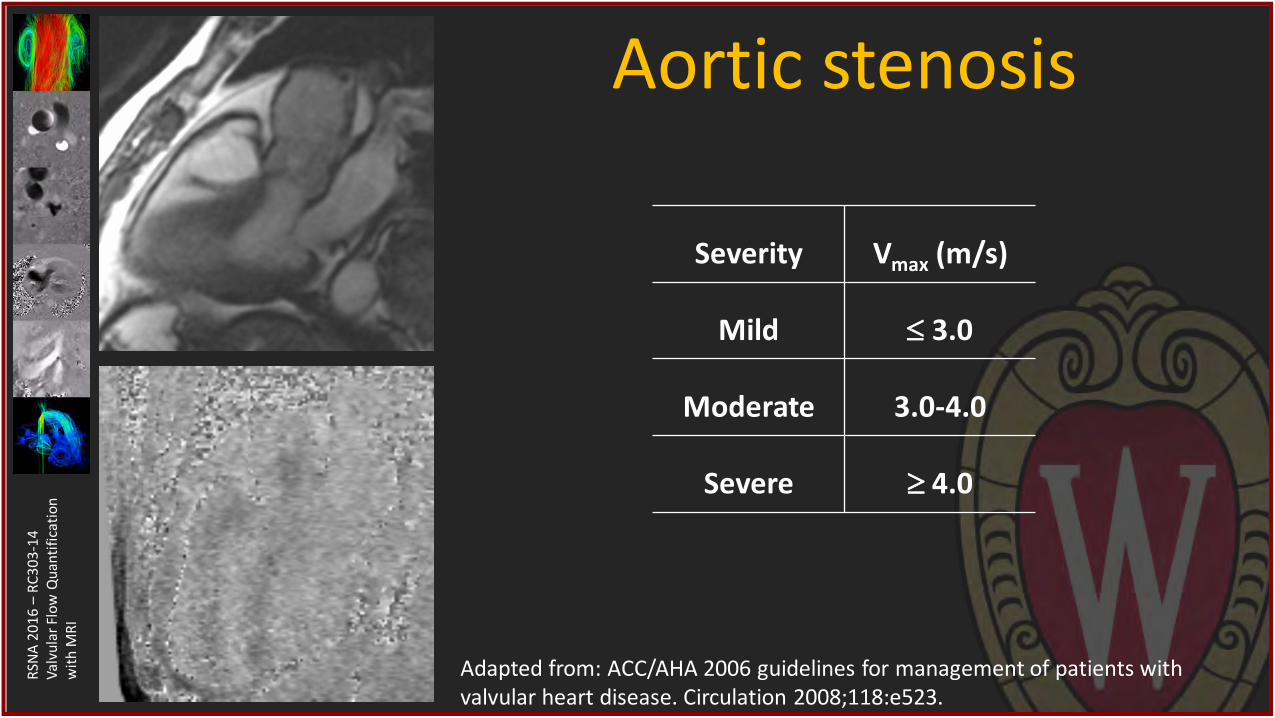
Aortic stenosis
Severity Vmax (m/s)
Mild 3.0
Moderate 3.0-4.0
Severe 4.0
Adapted from: ACC/AHA 2006 guidelines for management of patients with valvular heart disease. Circulation 2008;118:e523.
RSN
A 2
01
6 –
RC
30
3-1
4
Val
vula
r Fl
ow
Qu
anti
fica
tio
n
wit
h M
RI
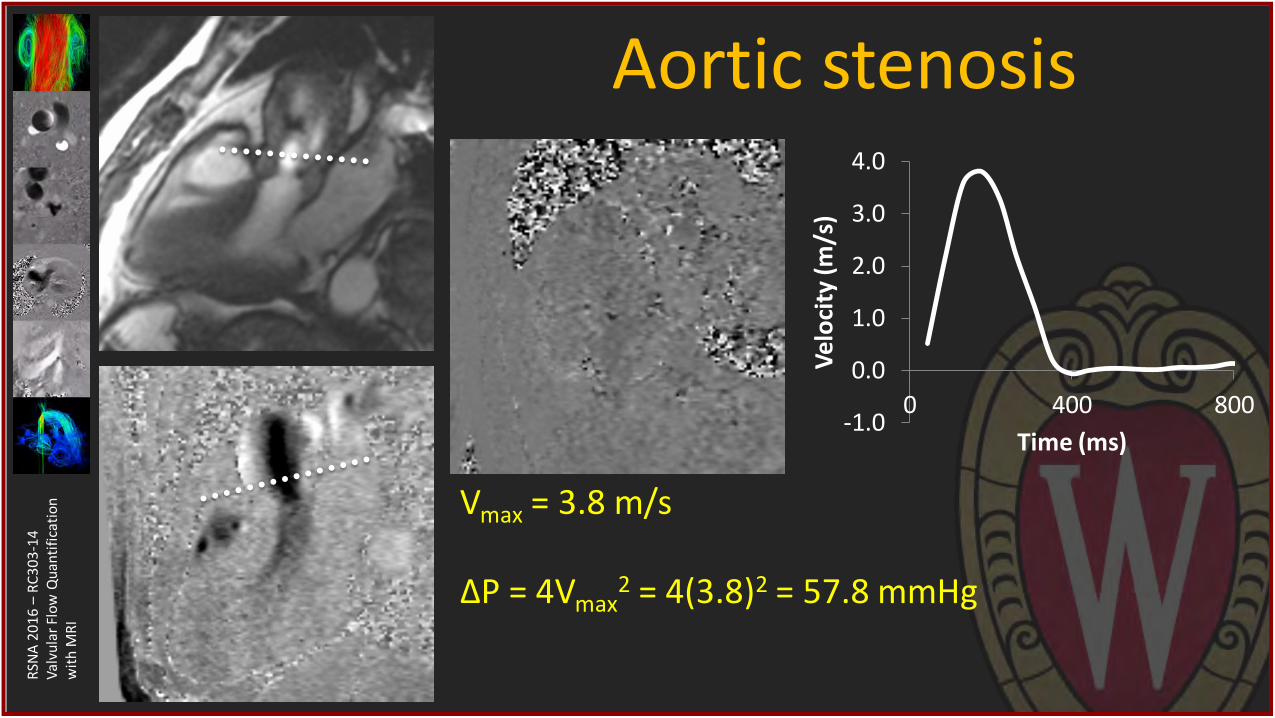
Aortic stenosis
-1.0
0.0
1.0
2.0
3.0
4.0
0 400 800
Vel
oci
ty (m
/s)
Time (ms)
Vmax = 3.8 m/s ΔP = 4Vmax
2 = 4(3.8)2 = 57.8 mmHg
RSN
A 2
01
6 –
RC
30
3-1
4
Val
vula
r Fl
ow
Qu
anti
fica
tio
n
wit
h M
RI
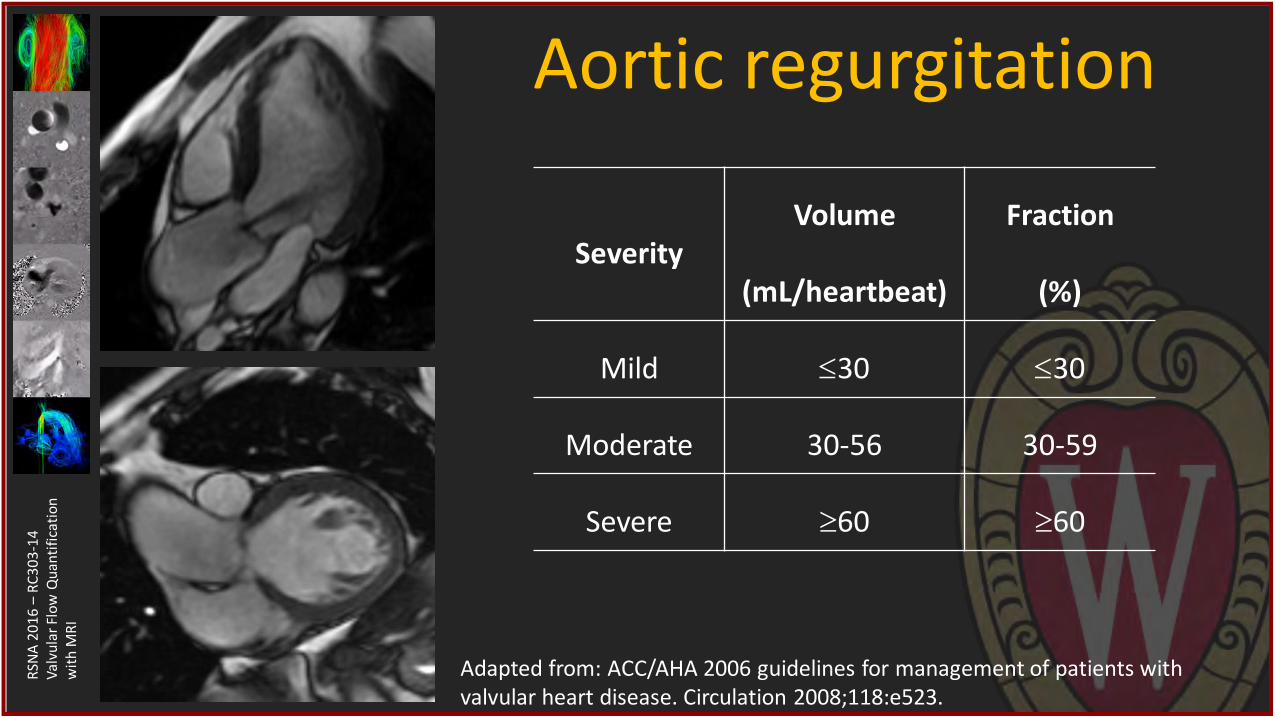
Aortic regurgitation
Severity Volume
(mL/heartbeat)
Fraction
(%)
Mild 30 30
Moderate 30-56 30-59
Severe 60 60
Adapted from: ACC/AHA 2006 guidelines for management of patients with valvular heart disease. Circulation 2008;118:e523.
RSN
A 2
01
6 –
RC
30
3-1
4
Val
vula
r Fl
ow
Qu
anti
fica
tio
n
wit
h M
RI
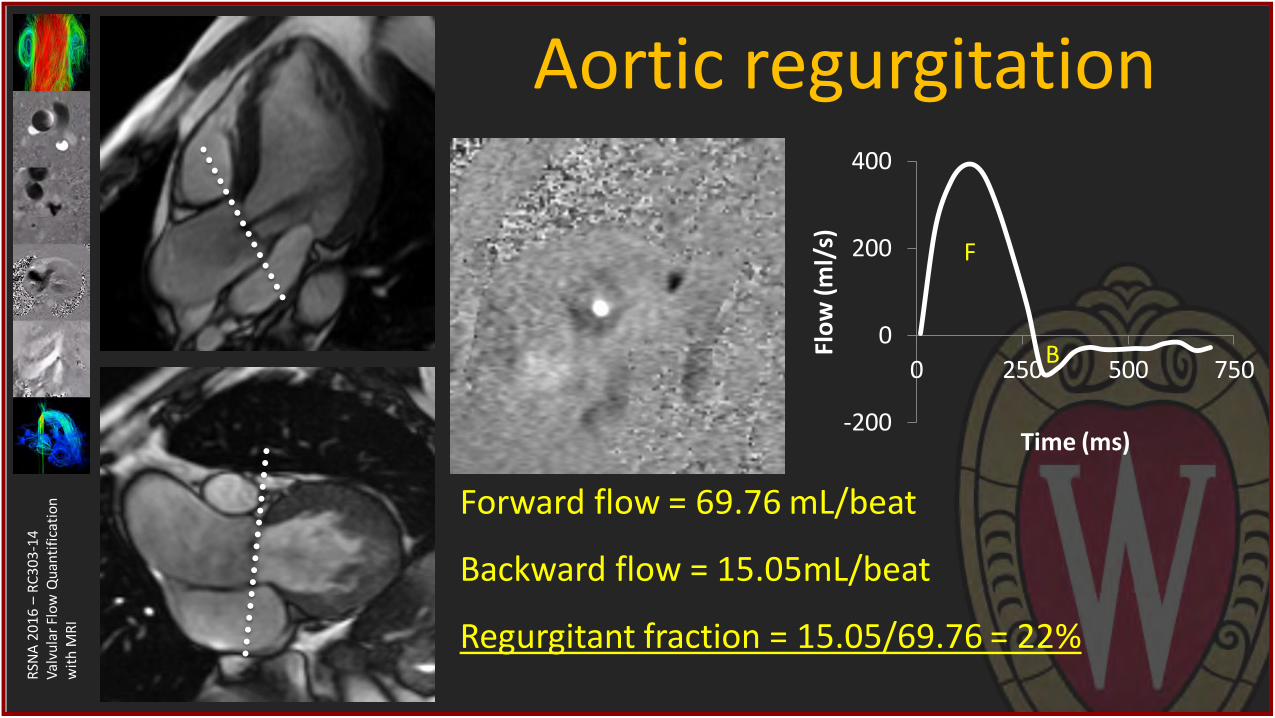
Aortic regurgitation
-200
0
200
400
0 250 500 750
Flo
w (
ml/
s)
Time (ms)
Forward flow = 69.76 mL/beat
Backward flow = 15.05mL/beat
Regurgitant fraction = 15.05/69.76 = 22%
F
B
RSN
A 2
01
6 –
RC
30
3-1
4
Val
vula
r Fl
ow
Qu
anti
fica
tio
n
wit
h M
RI
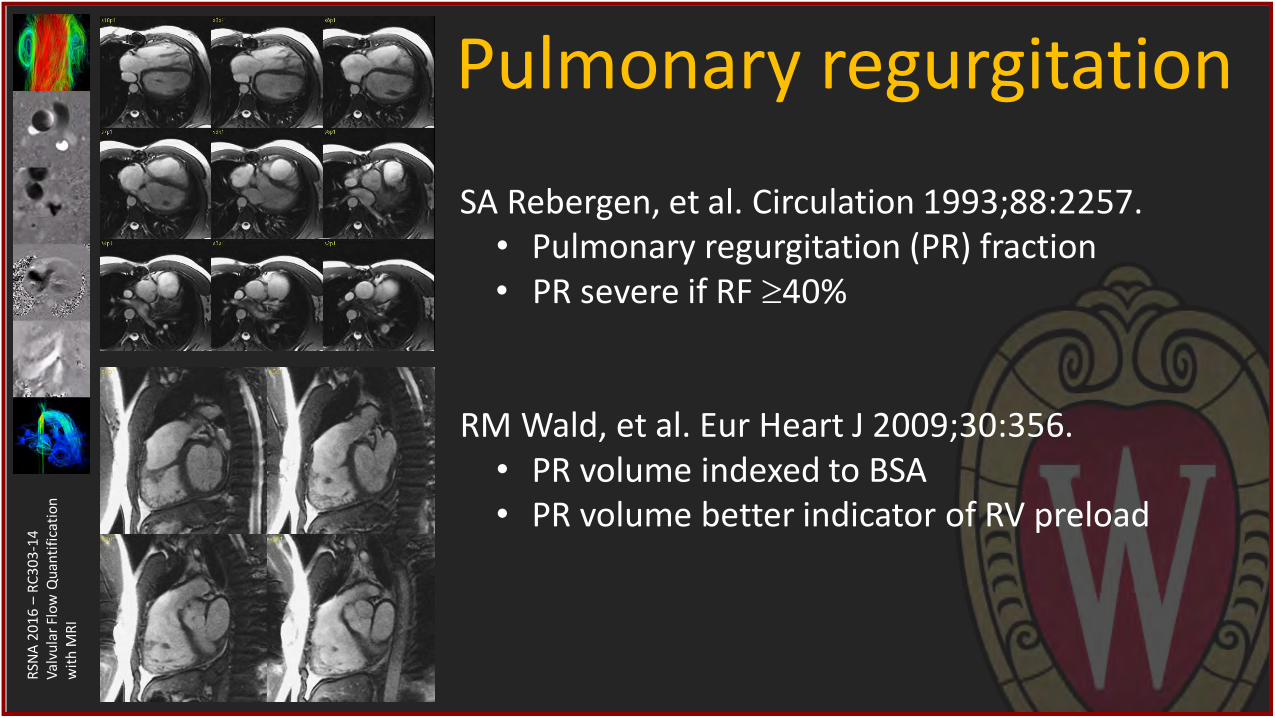
Pulmonary regurgitation
SA Rebergen, et al. Circulation 1993;88:2257. • Pulmonary regurgitation (PR) fraction • PR severe if RF 40%
RM Wald, et al. Eur Heart J 2009;30:356. • PR volume indexed to BSA • PR volume better indicator of RV preload
RSN
A 2
01
6 –
RC
30
3-1
4
Val
vula
r Fl
ow
Qu
anti
fica
tio
n
wit
h M
RI
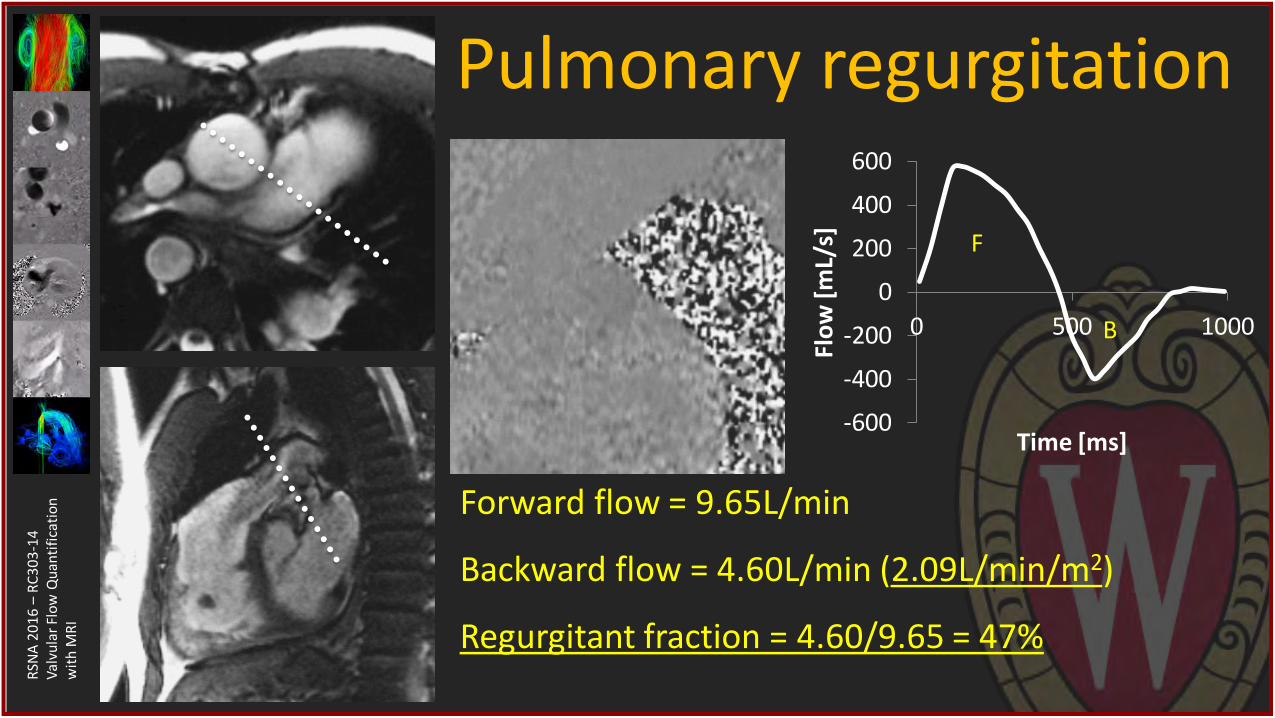
Pulmonary regurgitation
Forward flow = 9.65L/min
Backward flow = 4.60L/min (2.09L/min/m2)
Regurgitant fraction = 4.60/9.65 = 47%
-600
-400
-200
0
200
400
600
0 500 1000
Flo
w [
mL/
s]
Time [ms]
F
B
RSN
A 2
01
6 –
RC
30
3-1
4
Val
vula
r Fl
ow
Qu
anti
fica
tio
n
wit
h M
RI
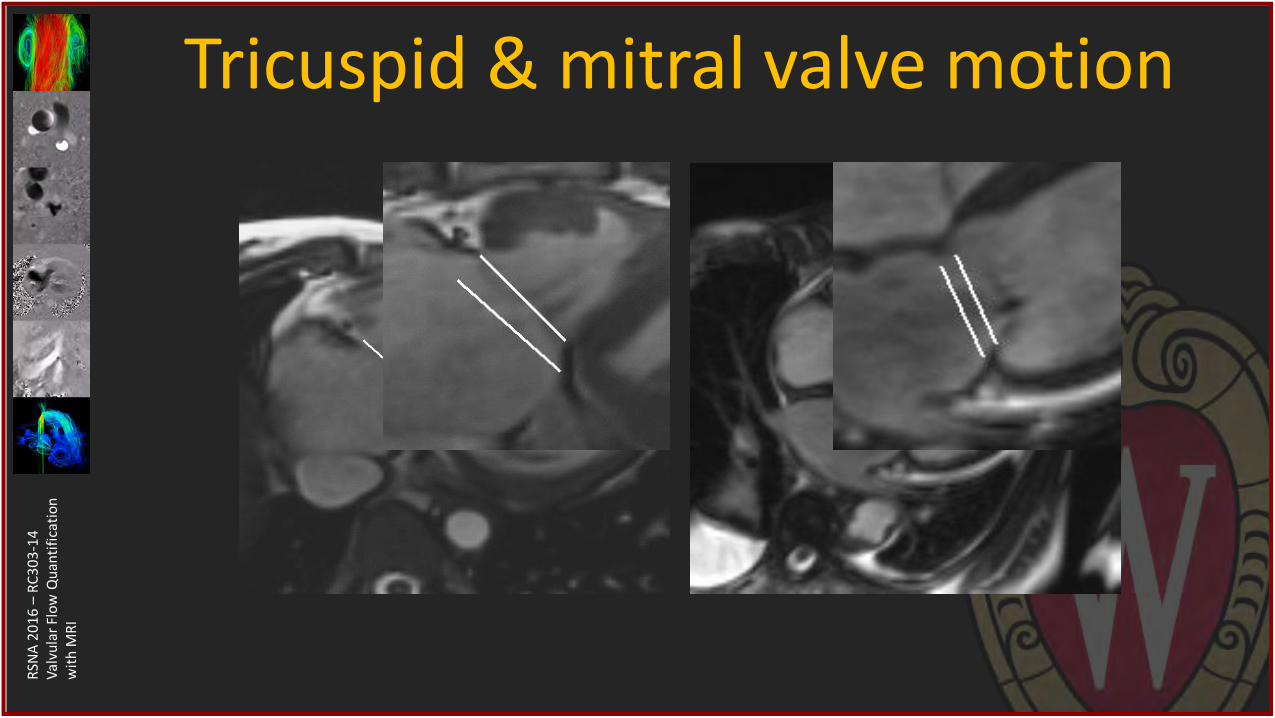
Tricuspid & mitral valve motion
RSN
A 2
01
6 –
RC
30
3-1
4
Val
vula
r Fl
ow
Qu
anti
fica
tio
n
wit
h M
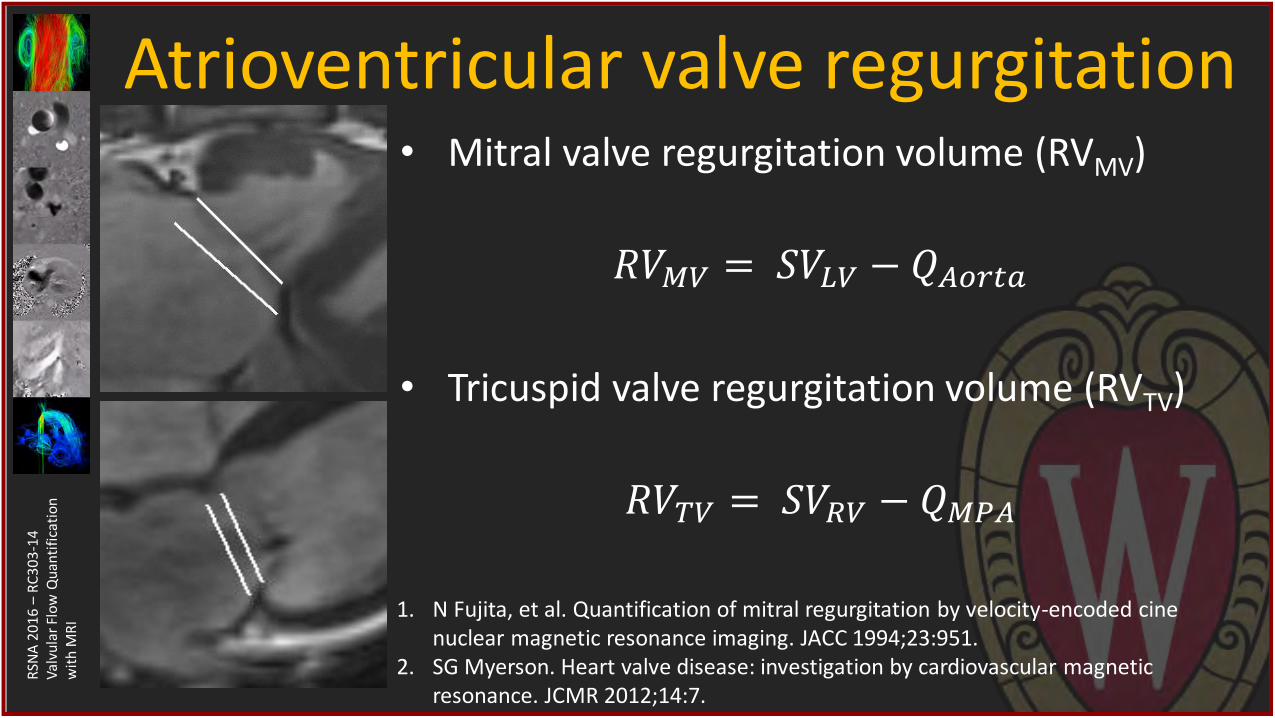
RI Atrioventricular valve regurgitation
• Mitral valve regurgitation volume (RVMV)
𝑅𝑉𝑀𝑉 = 𝑆𝑉𝐿𝑉 − 𝑄𝐴𝑜𝑟𝑡𝑎
• Tricuspid valve regurgitation volume (RVTV)
𝑅𝑉𝑇𝑉 = 𝑆𝑉𝑅𝑉 − 𝑄𝑀𝑃𝐴
1. N Fujita, et al. Quantification of mitral regurgitation by velocity-encoded cine nuclear magnetic resonance imaging. JACC 1994;23:951.
2. SG Myerson. Heart valve disease: investigation by cardiovascular magnetic resonance. JCMR 2012;14:7.
RSN
A 2
01
6 –
RC
30
3-1
4
Val
vula
r Fl
ow
Qu
anti
fica
tio
n
wit
h M
RI
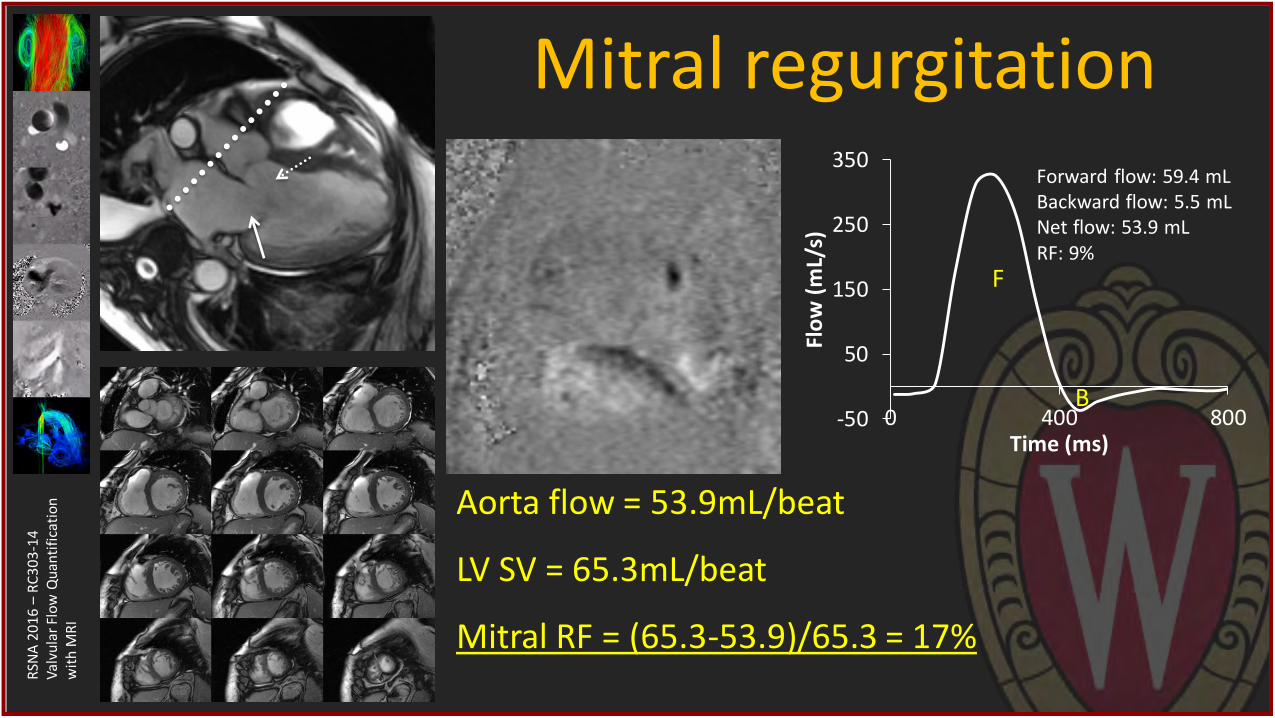
Mitral regurgitation
Aorta flow = 53.9mL/beat
LV SV = 65.3mL/beat
Mitral RF = (65.3-53.9)/65.3 = 17%
-50
50
150
250
350
0 400 800
Flo
w (
mL/
s)
Time (ms)
Forward flow: 59.4 mL Backward flow: 5.5 mL Net flow: 53.9 mL RF: 9%
F
B
RSN
A 2
01
6 –
RC
30
3-1
4
Val
vula
r Fl
ow
Qu
anti
fica
tio
n
wit
h M
RI
Flow MRI for valve disease • Setting up planes for 2D flow MRI
• Flow quantification with 2D flow MRI
• Clinical examples using 2D flow MRI
• 4D flow MRI in valve disease
RSN
A 2
01
6 –
RC
30
3-1
4
Val
vula
r Fl
ow
Qu
anti
fica
tio
n
wit
h M
RI
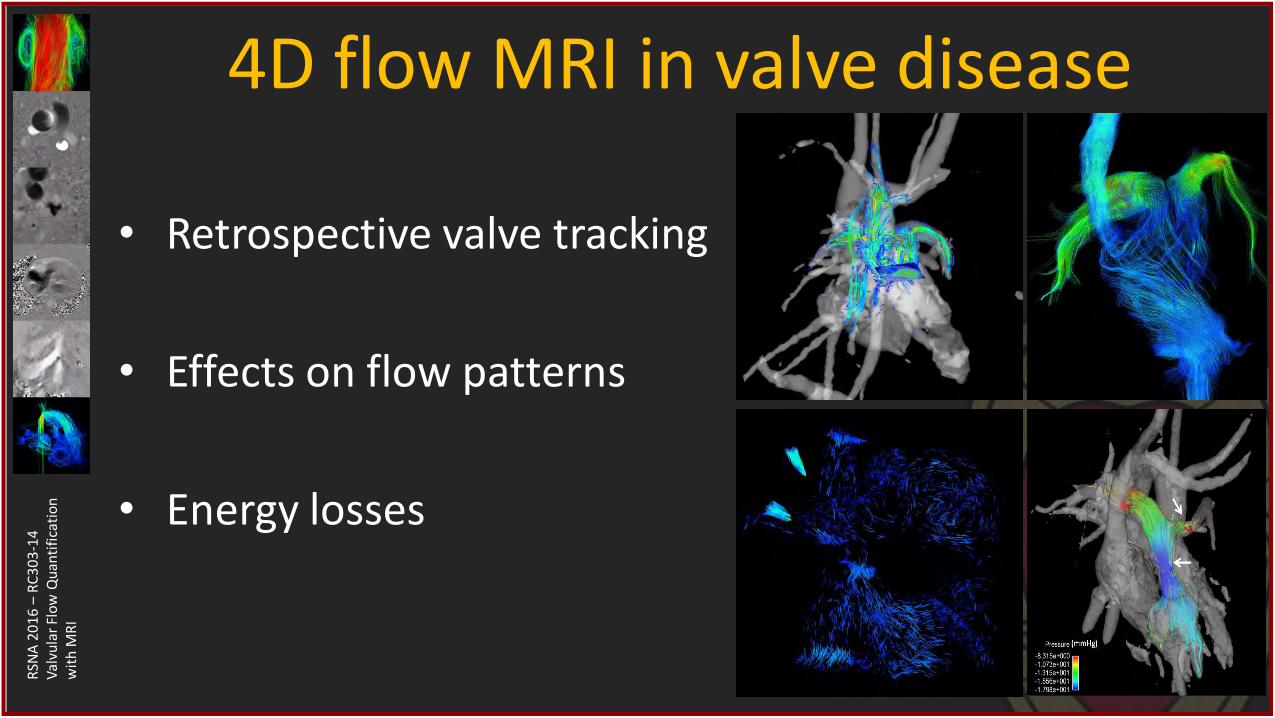
4D flow MRI in valve disease
• Retrospective valve tracking
• Effects on flow patterns
• Energy losses
RSN
A 2
01
6 –
RC
30
3-1
4
Val
vula
r Fl
ow
Qu
anti
fica
tio
n
wit
h M
RI
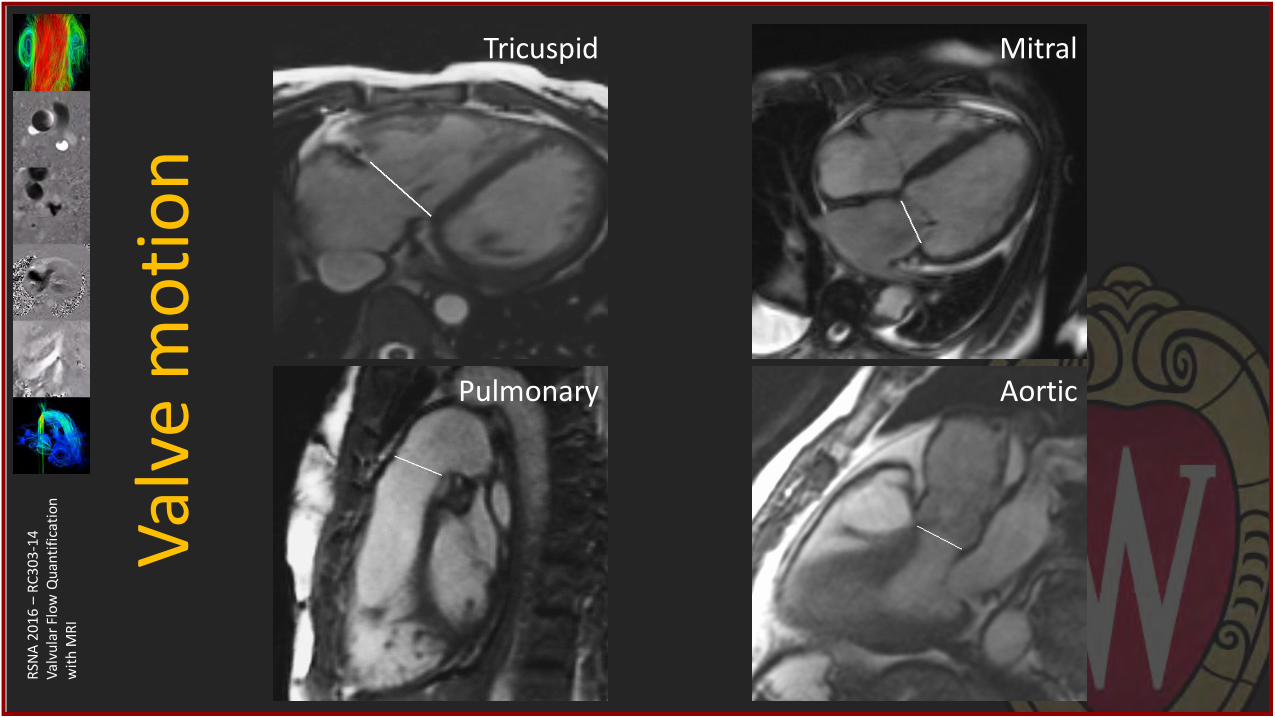
Val
ve m
oti
on
Mitral Tricuspid
Pulmonary Aortic
RSN
A 2
01
6 –
RC
30
3-1
4
Val
vula
r Fl
ow
Qu
anti
fica
tio
n
wit
h M
RI
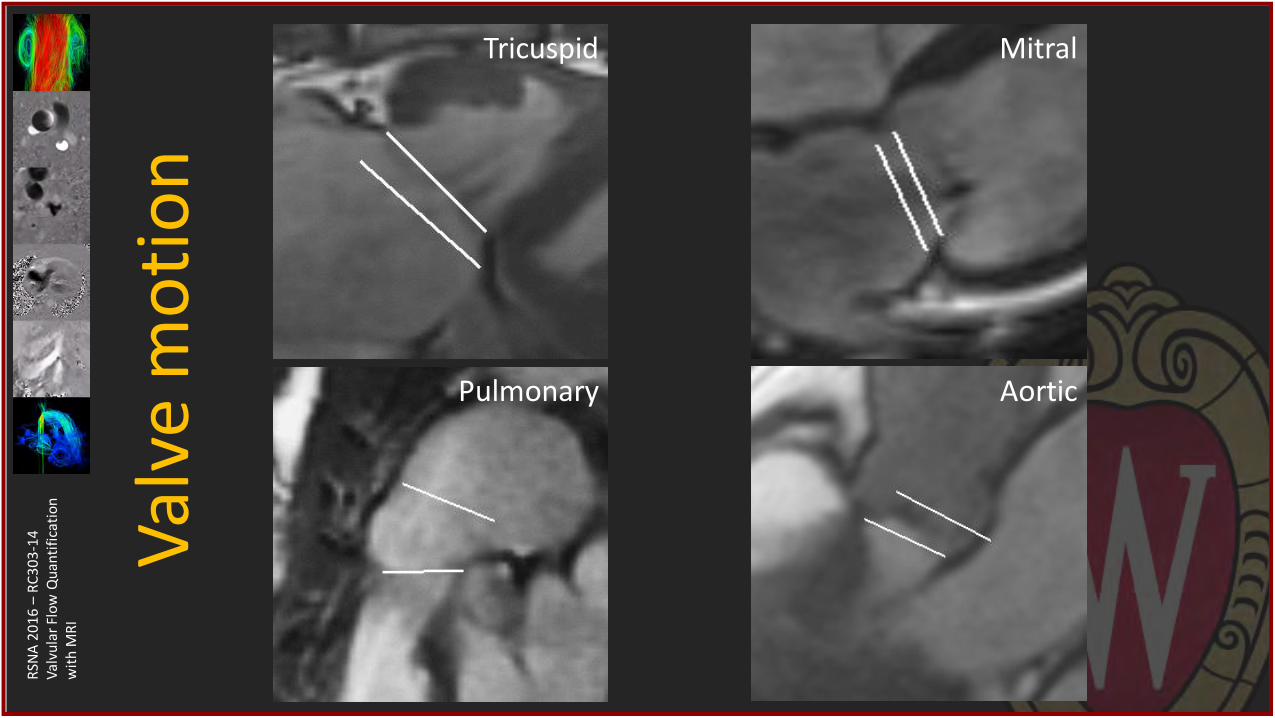
Val
ve m
oti
on
Mitral Tricuspid
Pulmonary Aortic
RSN
A 2
01
6 –
RC
30
3-1
4
Val
vula
r Fl
ow
Qu
anti
fica
tio
n
wit
h M
RI
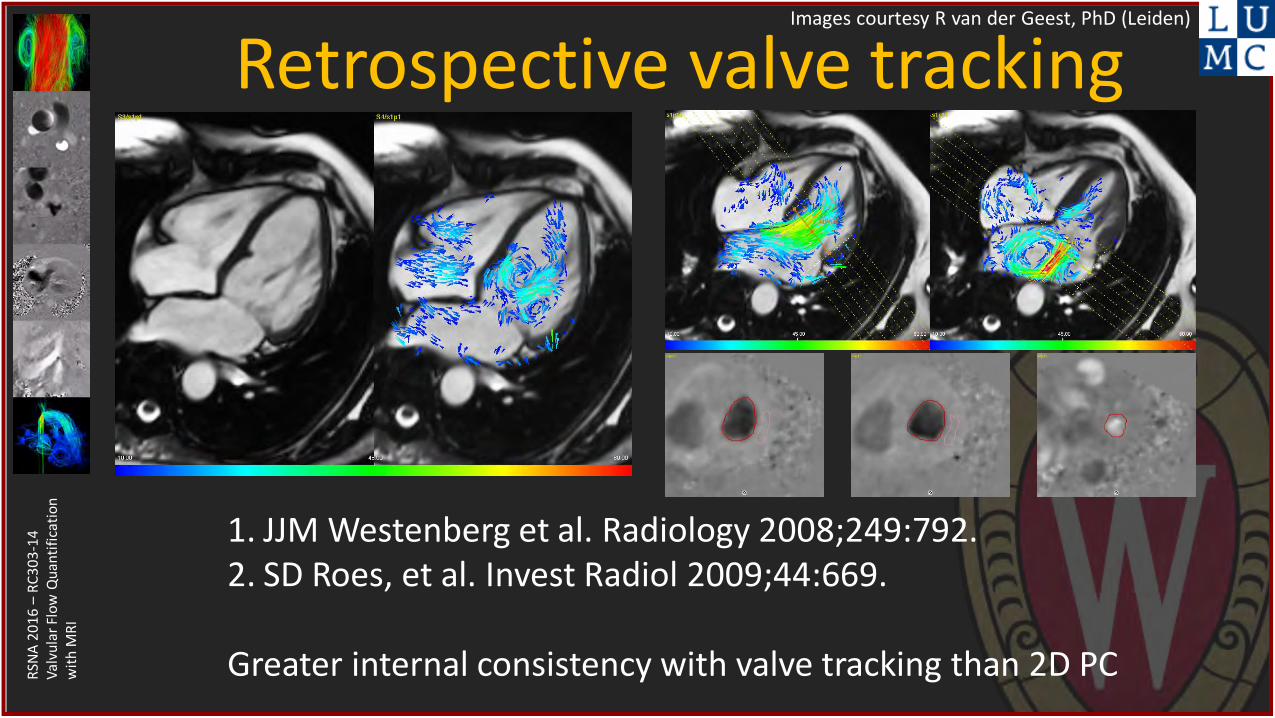
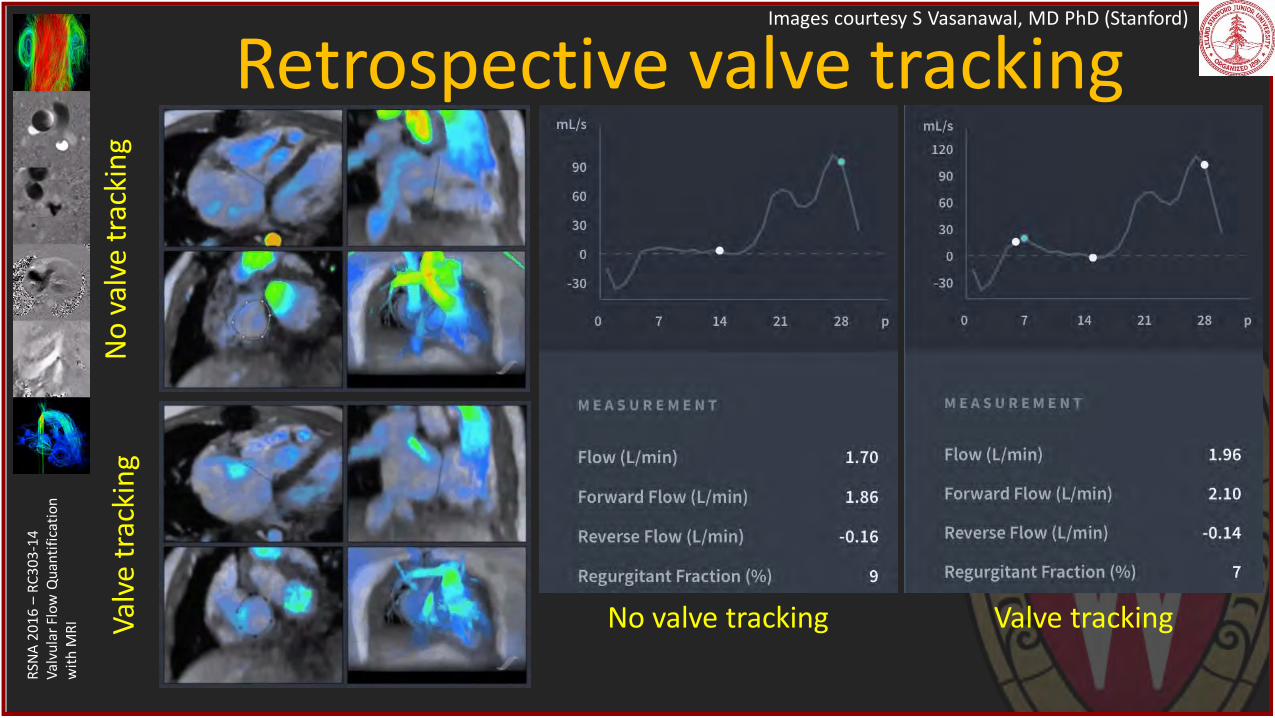
Retrospective valve tracking Images courtesy R van der Geest, PhD (Leiden)
1. JJM Westenberg et al. Radiology 2008;249:792. 2. SD Roes, et al. Invest Radiol 2009;44:669. Greater internal consistency with valve tracking than 2D PC
RSN
A 2
01
6 –
RC
30
3-1
4
Val
vula
r Fl
ow
Qu
anti
fica
tio
n
wit
h M
RI
Retrospective valve tracking Images courtesy S Vasanawal, MD PhD (Stanford)
Valve tracking No valve tracking Val
ve t
rack
ing
No
val
ve t
rack
ing
RSN
A 2
01
6 –
RC
30
3-1
4
Val
vula
r Fl
ow
Qu
anti
fica
tio
n
wit
h M
RI
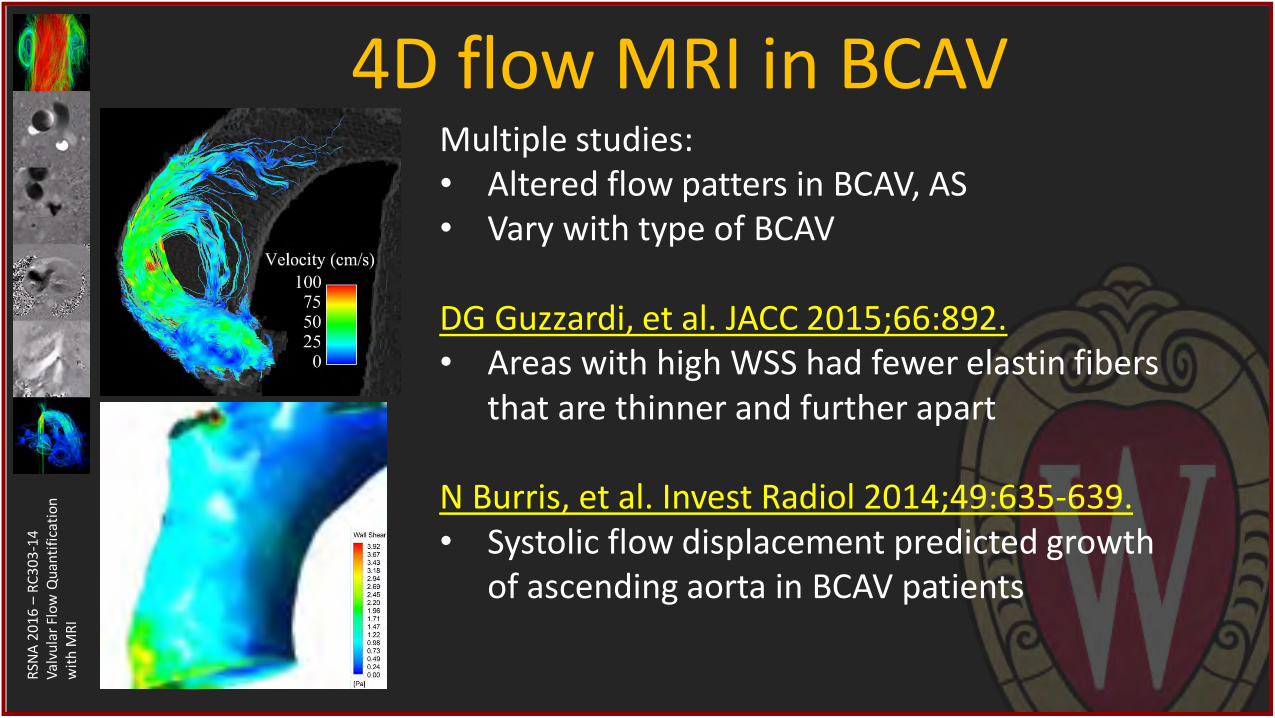
4D flow MRI in BCAV Multiple studies: • Altered flow patters in BCAV, AS • Vary with type of BCAV DG Guzzardi, et al. JACC 2015;66:892. • Areas with high WSS had fewer elastin fibers
that are thinner and further apart
N Burris, et al. Invest Radiol 2014;49:635-639. • Systolic flow displacement predicted growth
of ascending aorta in BCAV patients
RSN
A 2
01
6 –
RC
30
3-1
4
Val
vula
r Fl
ow
Qu
anti
fica
tio
n
wit
h M
RI
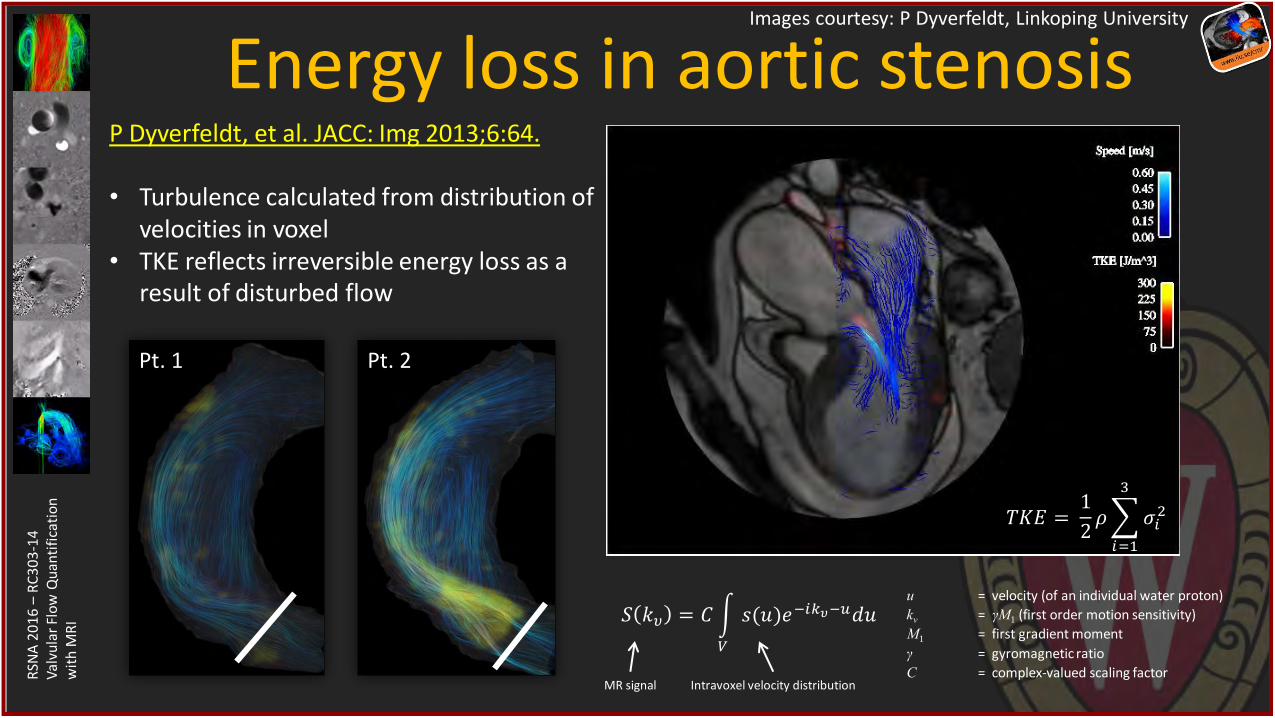
Energy loss in aortic stenosis Images courtesy: P Dyverfeldt, Linkoping University
P Dyverfeldt, et al. JACC: Img 2013;6:64. • Turbulence calculated from distribution of
velocities in voxel • TKE reflects irreversible energy loss as a
result of disturbed flow
u = velocity (of an individual water proton)
kv = γM1 (first order motion sensitivity)
M1 = first gradient moment
γ = gyromagnetic ratio
C = complex-valued scaling factor
Intravoxel velocity distribution MR signal
𝑆 𝑘𝜐 = 𝐶 𝑠(𝑢)𝑒−𝑖𝑘𝜐−𝑢𝑑𝑢
𝑉
𝑇𝐾𝐸 = 1
2𝜌 𝜎𝑖
2
3
𝑖=1
Pt. 1 Pt. 2
RSN
A 2
01
6 –
RC
30
3-1
4
Val
vula
r Fl
ow
Qu
anti
fica
tio
n
wit
h M
RI
Summary • Flow MRI can accurately assess severity of valvular disease
• Be aware of sources of artifact & error
– Aliasing
– Perpendicular to flow direction
– Background correction
• 4D flow MRI has potential to
– Improve accuracy with valve tracking
– Provide prognostic information for BCAV
Recommended