Alexander Rubin Principal Architect, Percona
Using Performance Schema to Monitor and Troubleshoot MySQL 5.6
www.percona.com 2
About me
• Working with MySQL for over 10 years
• Started at MySQL AB, then Sun
Microsystems,
• then Oracle (MySQL Consulting)
• Joined Percona 1 year ago
• Helping customers improve MySQL performance
• performance tuning
• full text search
• high availability
My name is Alexander Rubin
www.percona.com 3
Agenda
• Introduction to Performance Schema
• In MySQL 5.6
• Examples of using MySQL Performance
Schema
• Performance Schema configuration
www.percona.com 4
Performance Analyses
• Before MySQL 5.6 P_S:
• STATUS variables (SESSION and GLOBAL)
• Counters since MySQL start
• SHOW ENGINE INNODB STATUS
• SHOW PROFILES
• MySQL Slow Query Log
• Additional details in Percona Server
www.percona.com 5
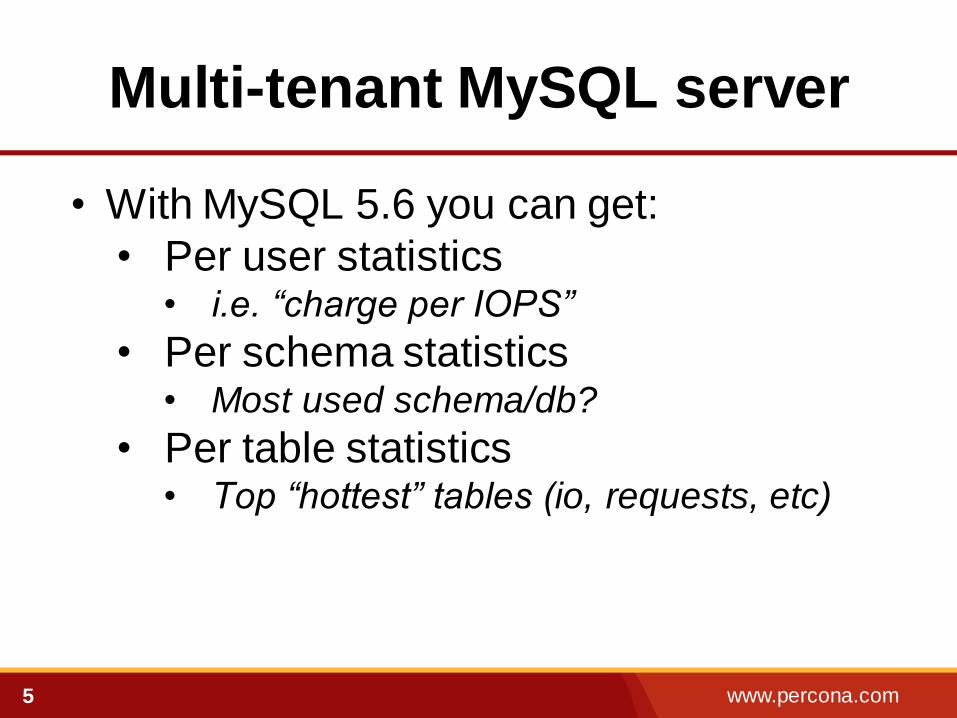
Multi-tenant MySQL server
• With MySQL 5.6 you can get:
• Per user statistics • i.e. “charge per IOPS”
• Per schema statistics • Most used schema/db?
• Per table statistics • Top “hottest” tables (io, requests, etc)
www.percona.com 6
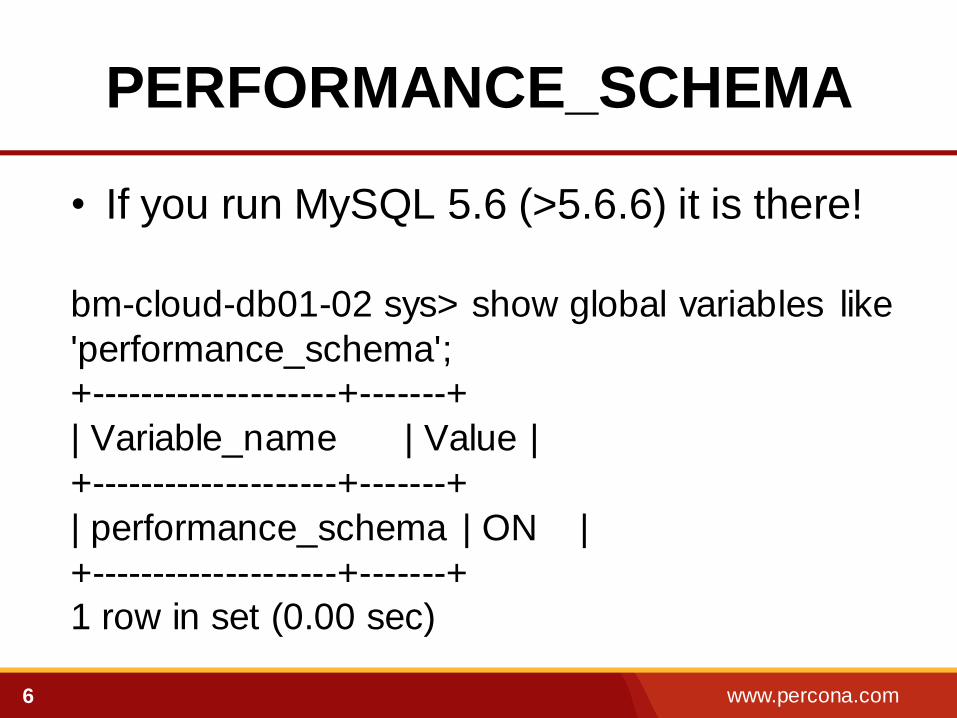
PERFORMANCE_SCHEMA
• If you run MySQL 5.6 (>5.6.6) it is there!
bm-cloud-db01-02 sys> show global variables like
'performance_schema';
+--------------------+-------+
| Variable_name | Value |
+--------------------+-------+
| performance_schema | ON |
+--------------------+-------+
1 row in set (0.00 sec)
www.percona.com 7
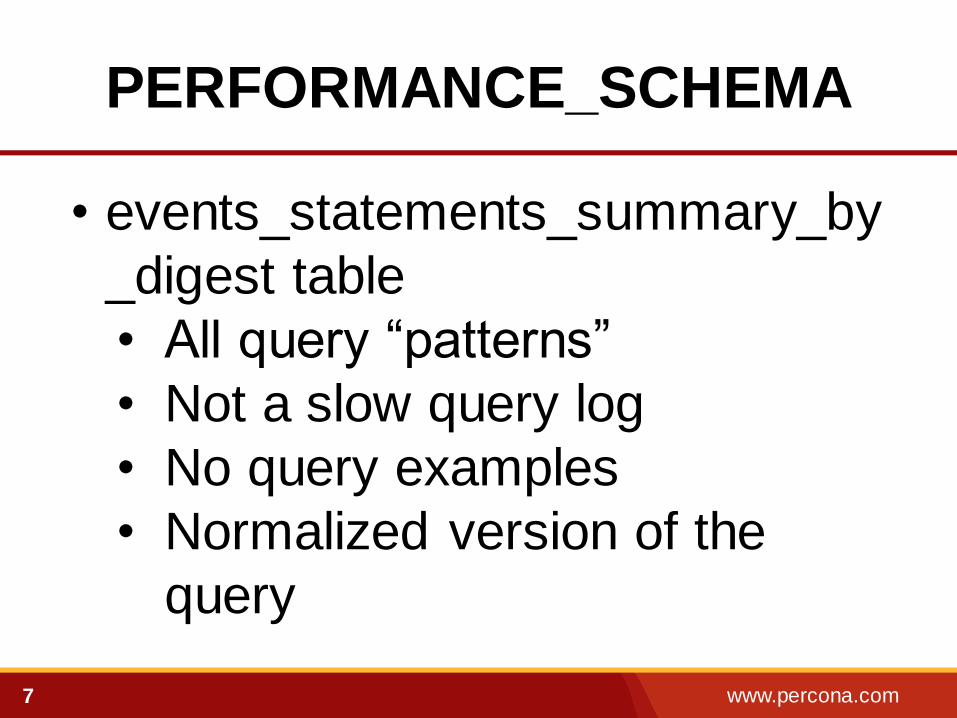
PERFORMANCE_SCHEMA
• events_statements_summary_by
_digest table
• All query “patterns”
• Not a slow query log
• No query examples
• Normalized version of the
query
www.percona.com 8
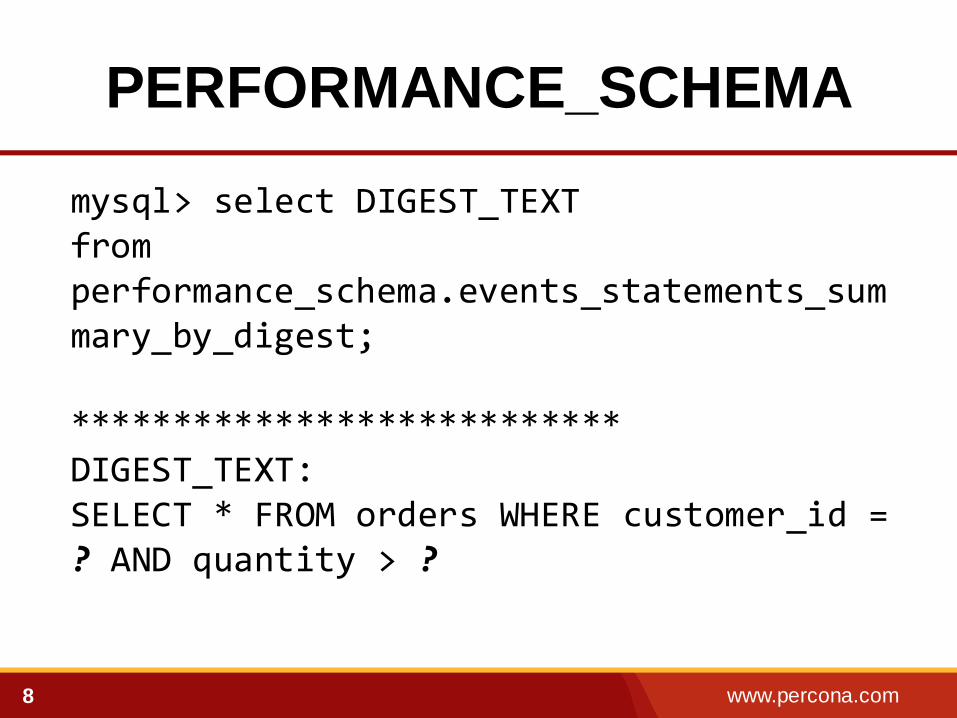
PERFORMANCE_SCHEMA
mysql> select DIGEST_TEXT from performance_schema.events_statements_summary_by_digest; *************************** DIGEST_TEXT: SELECT * FROM orders WHERE customer_id = ? AND quantity > ?
www.percona.com 9
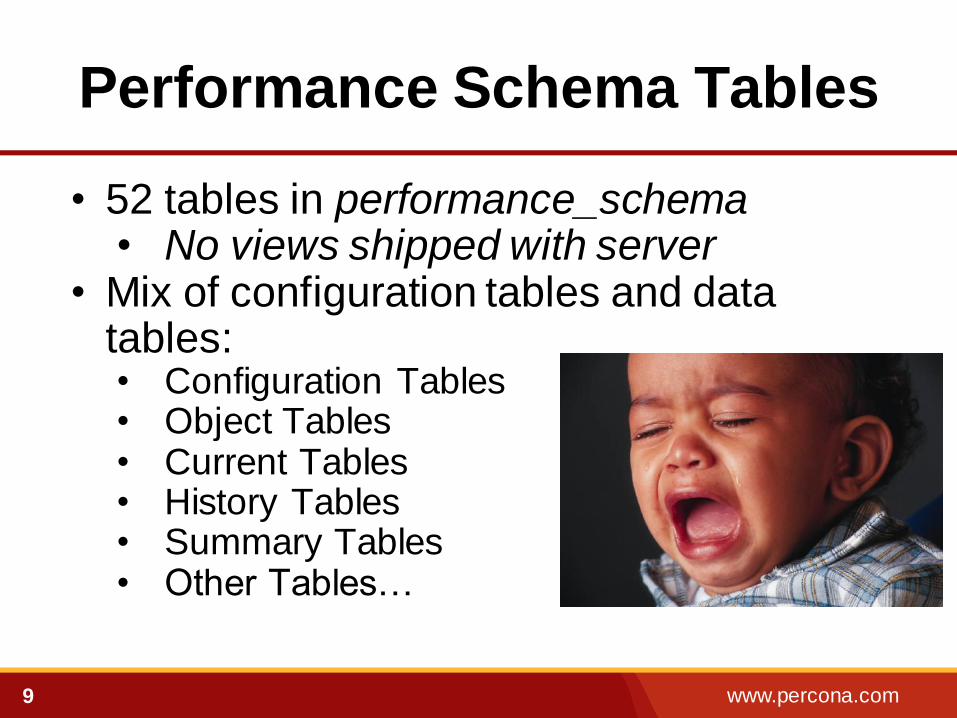
Performance Schema Tables
• 52 tables in performance_schema • No views shipped with server
• Mix of configuration tables and data tables: • Configuration Tables • Object Tables • Current Tables • History Tables • Summary Tables • Other Tables…

www.percona.com 10
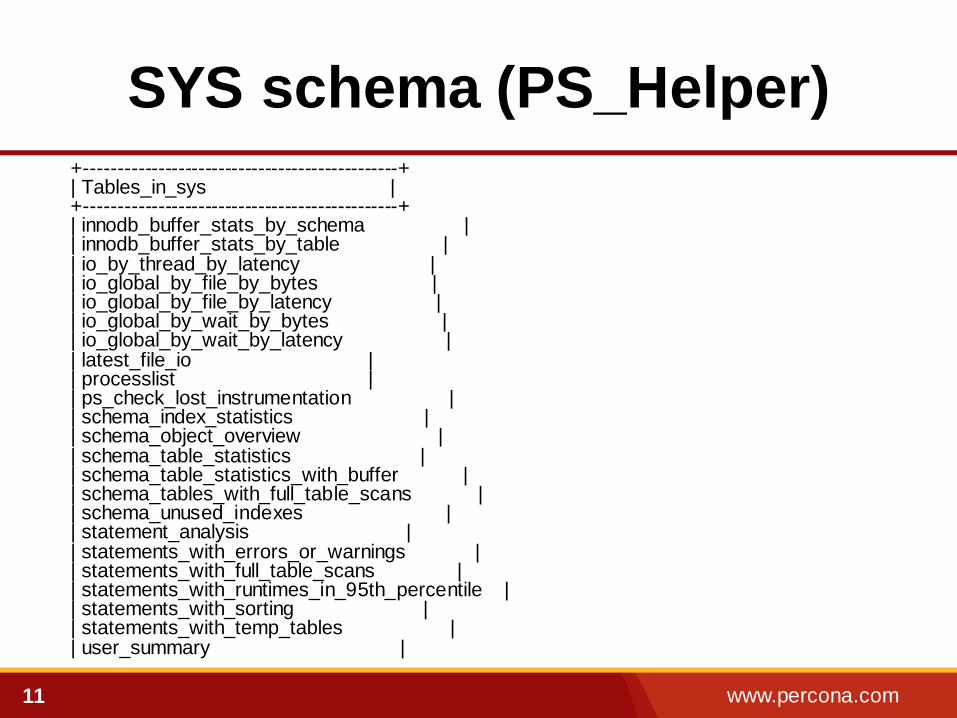
SYS schema (PS_Helper)
A great tool by Mark Leith to make
PERFORMANCE_SCHEMA easier to use
https://github.com/MarkLeith/mysql-sys
$ mysql -u root -p < ./sys_56.sql
www.percona.com 11
SYS schema (PS_Helper) +-----------------------------------------------+ | Tables_in_sys | +-----------------------------------------------+ | innodb_buffer_stats_by_schema | | innodb_buffer_stats_by_table | | io_by_thread_by_latency | | io_global_by_file_by_bytes | | io_global_by_file_by_latency | | io_global_by_wait_by_bytes | | io_global_by_wait_by_latency | | latest_file_io | | processlist | | ps_check_lost_instrumentation | | schema_index_statistics | | schema_object_overview | | schema_table_statistics | | schema_table_statistics_with_buffer | | schema_tables_with_full_table_scans | | schema_unused_indexes | | statement_analysis | | statements_with_errors_or_warnings | | statements_with_full_table_scans | | statements_with_runtimes_in_95th_percentile | | statements_with_sorting | | statements_with_temp_tables | | user_summary |
www.percona.com 12
Examples
• Real server example
Backend MySQL server for
cloud.percona.com
• MySQL server: bm-cloud-db01-02

www.percona.com 13
User Level
Statistics
www.percona.com 14
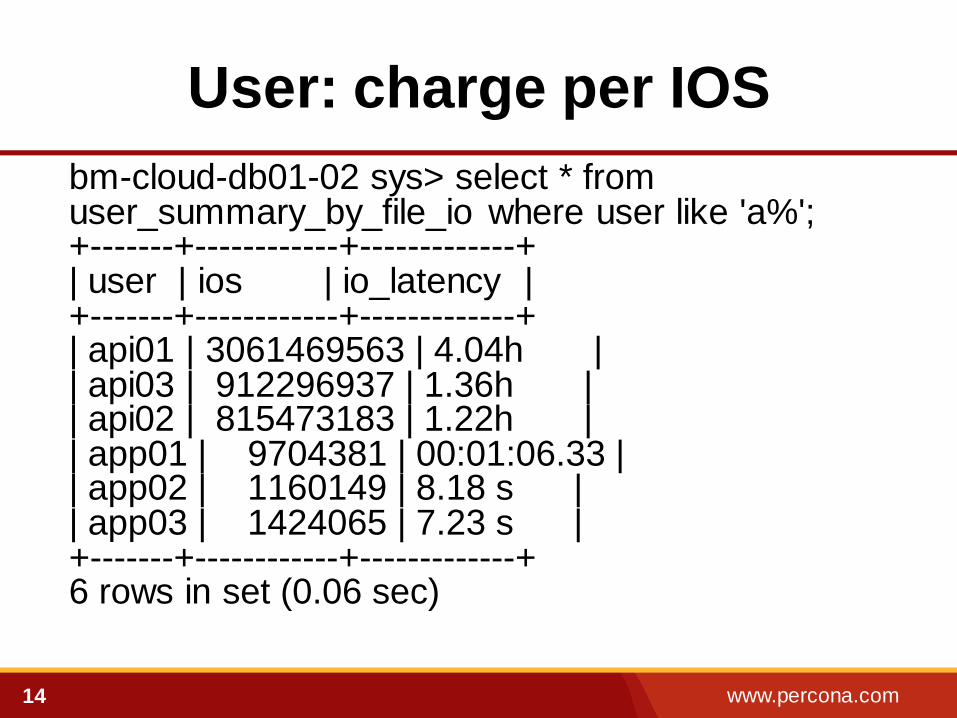
User: charge per IOS
bm-cloud-db01-02 sys> select * from user_summary_by_file_io where user like 'a%'; +-------+------------+-------------+ | user | ios | io_latency | +-------+------------+-------------+ | api01 | 3061469563 | 4.04h | | api03 | 912296937 | 1.36h | | api02 | 815473183 | 1.22h | | app01 | 9704381 | 00:01:06.33 | | app02 | 1160149 | 8.18 s | | app03 | 1424065 | 7.23 s | +-------+------------+-------------+ 6 rows in set (0.06 sec)
www.percona.com 15
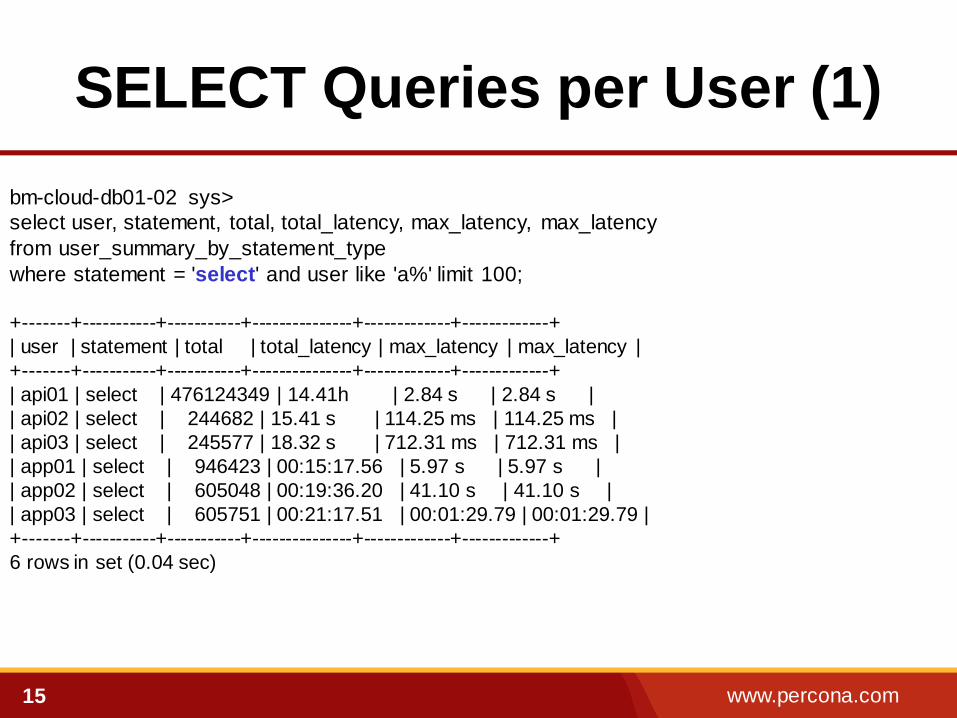
SELECT Queries per User (1)
bm-cloud-db01-02 sys>
select user, statement, total, total_latency, max_latency, max_latency
from user_summary_by_statement_type
where statement = 'select' and user like 'a%' limit 100;
+-------+-----------+-----------+---------------+-------------+-------------+
| user | statement | total | total_latency | max_latency | max_latency |
+-------+-----------+-----------+---------------+-------------+-------------+
| api01 | select | 476124349 | 14.41h | 2.84 s | 2.84 s |
| api02 | select | 244682 | 15.41 s | 114.25 ms | 114.25 ms |
| api03 | select | 245577 | 18.32 s | 712.31 ms | 712.31 ms |
| app01 | select | 946423 | 00:15:17.56 | 5.97 s | 5.97 s |
| app02 | select | 605048 | 00:19:36.20 | 41.10 s | 41.10 s |
| app03 | select | 605751 | 00:21:17.51 | 00:01:29.79 | 00:01:29.79 |
+-------+-----------+-----------+---------------+-------------+-------------+
6 rows in set (0.04 sec)
www.percona.com 16
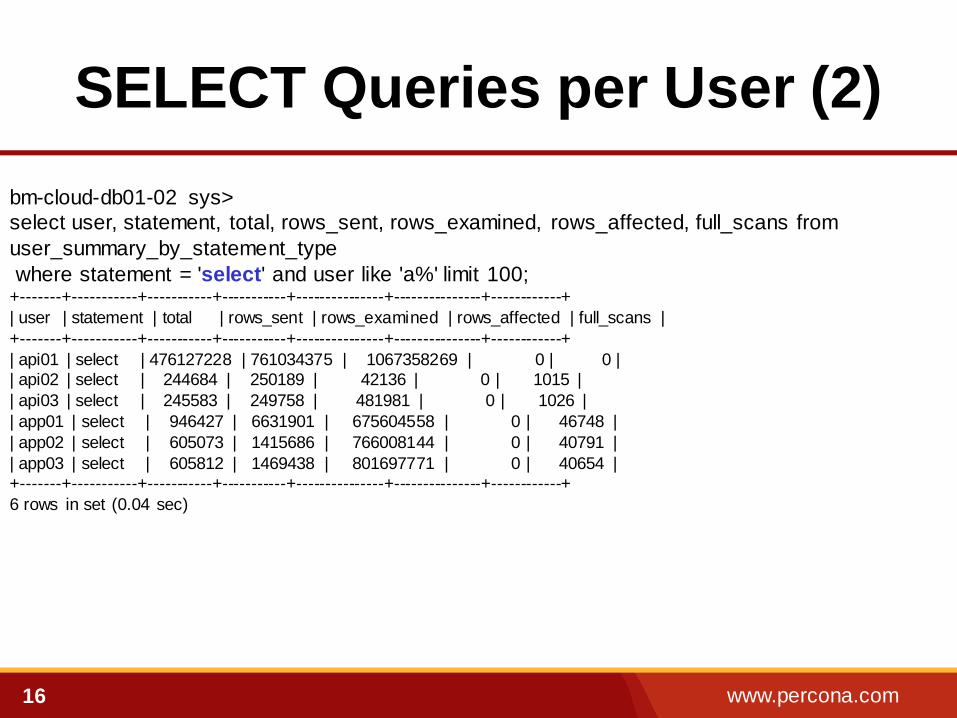
SELECT Queries per User (2)
bm-cloud-db01-02 sys>
select user, statement, total, rows_sent, rows_examined, rows_affected, full_scans from
user_summary_by_statement_type
where statement = 'select' and user like 'a%' limit 100; +-------+-----------+-----------+-----------+---------------+---------------+------------+
| user | statement | total | rows_sent | rows_examined | rows_affected | full_scans |
+-------+-----------+-----------+-----------+---------------+---------------+------------+
| api01 | select | 476127228 | 761034375 | 1067358269 | 0 | 0 |
| api02 | select | 244684 | 250189 | 42136 | 0 | 1015 |
| api03 | select | 245583 | 249758 | 481981 | 0 | 1026 |
| app01 | select | 946427 | 6631901 | 675604558 | 0 | 46748 |
| app02 | select | 605073 | 1415686 | 766008144 | 0 | 40791 |
| app03 | select | 605812 | 1469438 | 801697771 | 0 | 40654 |
+-------+-----------+-----------+-----------+---------------+---------------+------------+
6 rows in set (0.04 sec)
www.percona.com 17
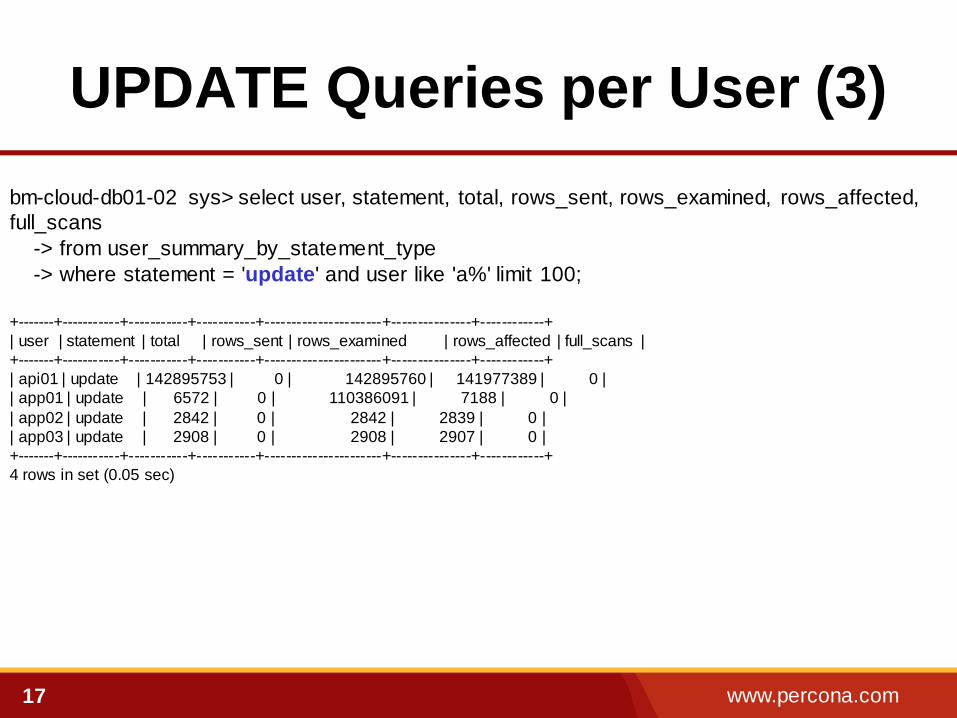
UPDATE Queries per User (3)
bm-cloud-db01-02 sys> select user, statement, total, rows_sent, rows_examined, rows_affected,
full_scans
-> from user_summary_by_statement_type
-> where statement = 'update' and user like 'a%' limit 100;
+-------+-----------+-----------+-----------+----------------------+---------------+------------+
| user | statement | total | rows_sent | rows_examined | rows_affected | full_scans |
+-------+-----------+-----------+-----------+----------------------+---------------+------------+
| api01 | update | 142895753 | 0 | 142895760 | 141977389 | 0 |
| app01 | update | 6572 | 0 | 110386091 | 7188 | 0 |
| app02 | update | 2842 | 0 | 2842 | 2839 | 0 |
| app03 | update | 2908 | 0 | 2908 | 2907 | 0 |
+-------+-----------+-----------+-----------+----------------------+---------------+------------+
4 rows in set (0.05 sec)
www.percona.com 18
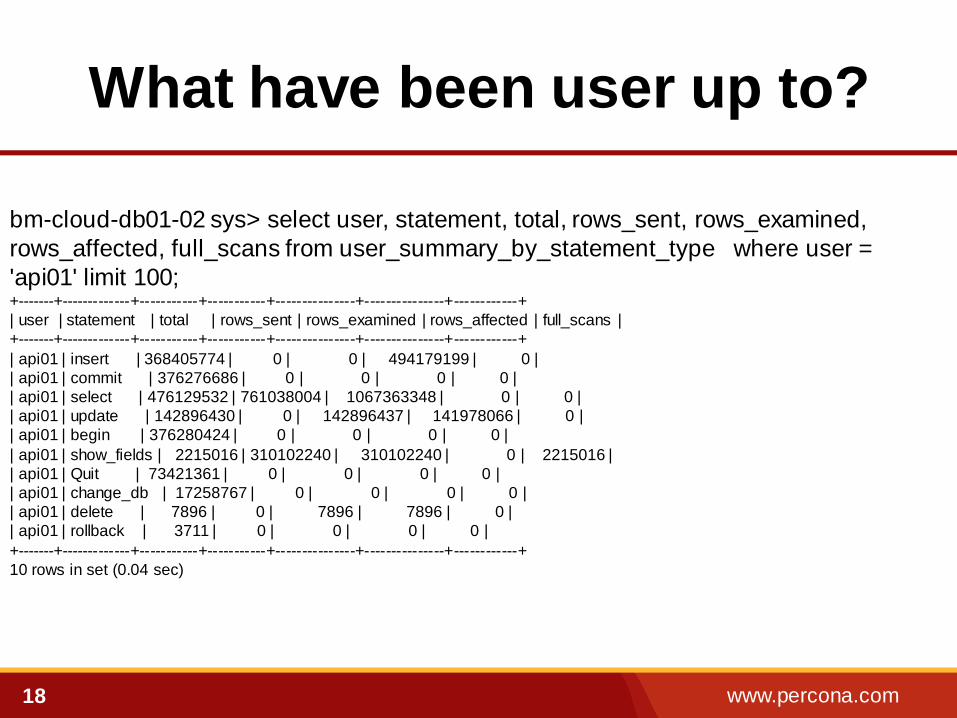
What have been user up to?
bm-cloud-db01-02 sys> select user, statement, total, rows_sent, rows_examined,
rows_affected, full_scans from user_summary_by_statement_type where user =
'api01' limit 100; +-------+-------------+-----------+-----------+---------------+---------------+------------+
| user | statement | total | rows_sent | rows_examined | rows_affected | full_scans |
+-------+-------------+-----------+-----------+---------------+---------------+------------+
| api01 | insert | 368405774 | 0 | 0 | 494179199 | 0 |
| api01 | commit | 376276686 | 0 | 0 | 0 | 0 |
| api01 | select | 476129532 | 761038004 | 1067363348 | 0 | 0 |
| api01 | update | 142896430 | 0 | 142896437 | 141978066 | 0 |
| api01 | begin | 376280424 | 0 | 0 | 0 | 0 |
| api01 | show_fields | 2215016 | 310102240 | 310102240 | 0 | 2215016 |
| api01 | Quit | 73421361 | 0 | 0 | 0 | 0 |
| api01 | change_db | 17258767 | 0 | 0 | 0 | 0 |
| api01 | delete | 7896 | 0 | 7896 | 7896 | 0 |
| api01 | rollback | 3711 | 0 | 0 | 0 | 0 |
+-------+-------------+-----------+-----------+---------------+---------------+------------+
10 rows in set (0.04 sec)
www.percona.com 19
Examples
Query Level
Statistics
www.percona.com 20
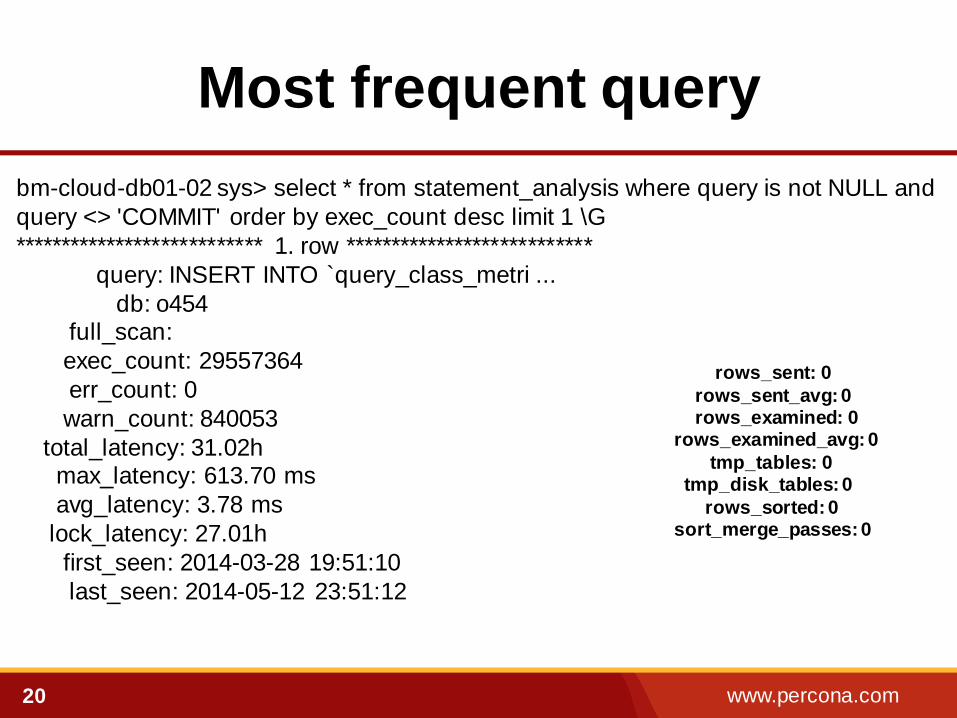
Most frequent query
bm-cloud-db01-02 sys> select * from statement_analysis where query is not NULL and
query <> 'COMMIT' order by exec_count desc limit 1 \G
*************************** 1. row ***************************
query: INSERT INTO `query_class_metri ...
db: o454 full_scan:
exec_count: 29557364
err_count: 0
warn_count: 840053
total_latency: 31.02h max_latency: 613.70 ms
avg_latency: 3.78 ms
lock_latency: 27.01h
first_seen: 2014-03-28 19:51:10
last_seen: 2014-05-12 23:51:12
rows_sent: 0
rows_sent_avg: 0 rows_examined: 0 rows_examined_avg: 0
tmp_tables: 0 tmp_disk_tables: 0
rows_sorted: 0 sort_merge_passes: 0
www.percona.com 21
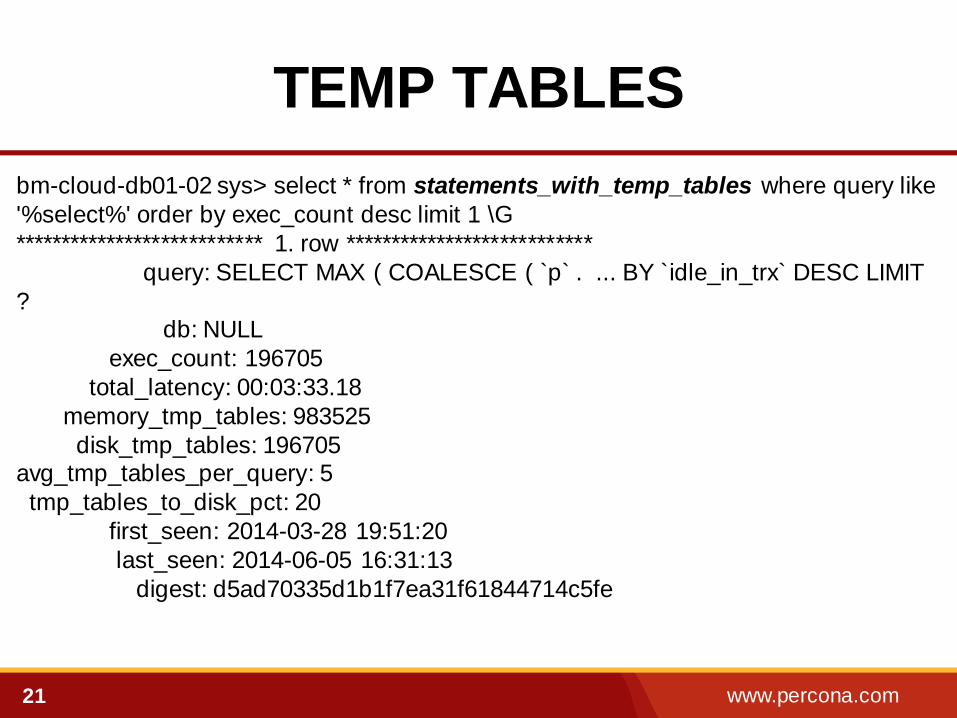
TEMP TABLES
bm-cloud-db01-02 sys> select * from statements_with_temp_tables where query like
'%select%' order by exec_count desc limit 1 \G
*************************** 1. row ***************************
query: SELECT MAX ( COALESCE ( `p` . ... BY `idle_in_trx` DESC LIMIT
? db: NULL
exec_count: 196705
total_latency: 00:03:33.18
memory_tmp_tables: 983525
disk_tmp_tables: 196705 avg_tmp_tables_per_query: 5
tmp_tables_to_disk_pct: 20
first_seen: 2014-03-28 19:51:20
last_seen: 2014-06-05 16:31:13
digest: d5ad70335d1b1f7ea31f61844714c5fe
www.percona.com 22
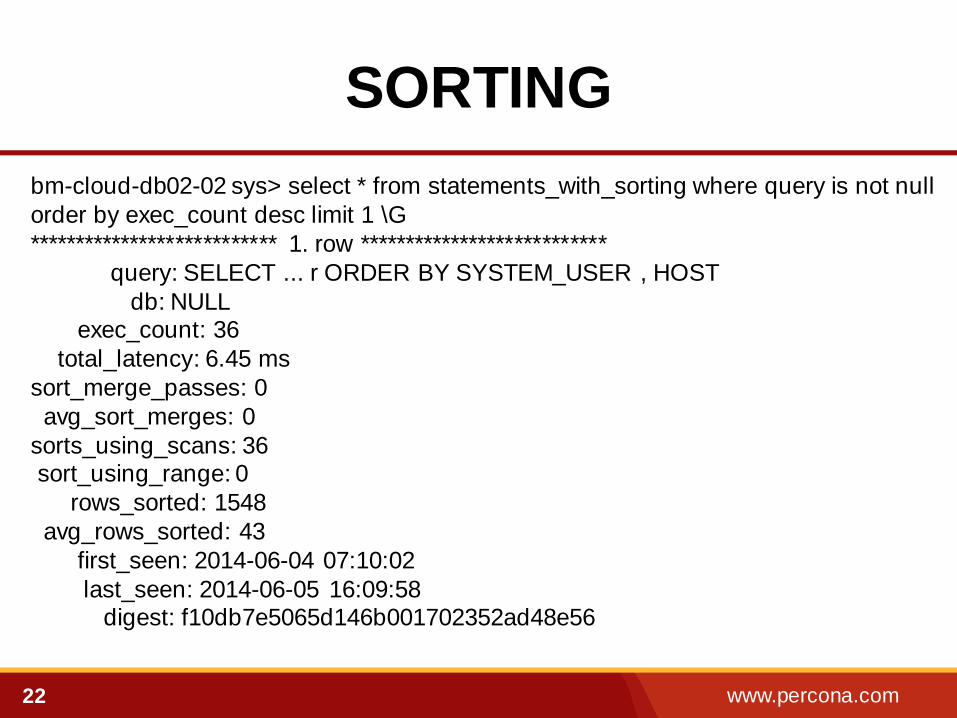
SORTING
bm-cloud-db02-02 sys> select * from statements_with_sorting where query is not null
order by exec_count desc limit 1 \G
*************************** 1. row ***************************
query: SELECT ... r ORDER BY SYSTEM_USER , HOST
db: NULL exec_count: 36
total_latency: 6.45 ms
sort_merge_passes: 0
avg_sort_merges: 0
sorts_using_scans: 36 sort_using_range: 0
rows_sorted: 1548
avg_rows_sorted: 43
first_seen: 2014-06-04 07:10:02
last_seen: 2014-06-05 16:09:58 digest: f10db7e5065d146b001702352ad48e56
www.percona.com 23
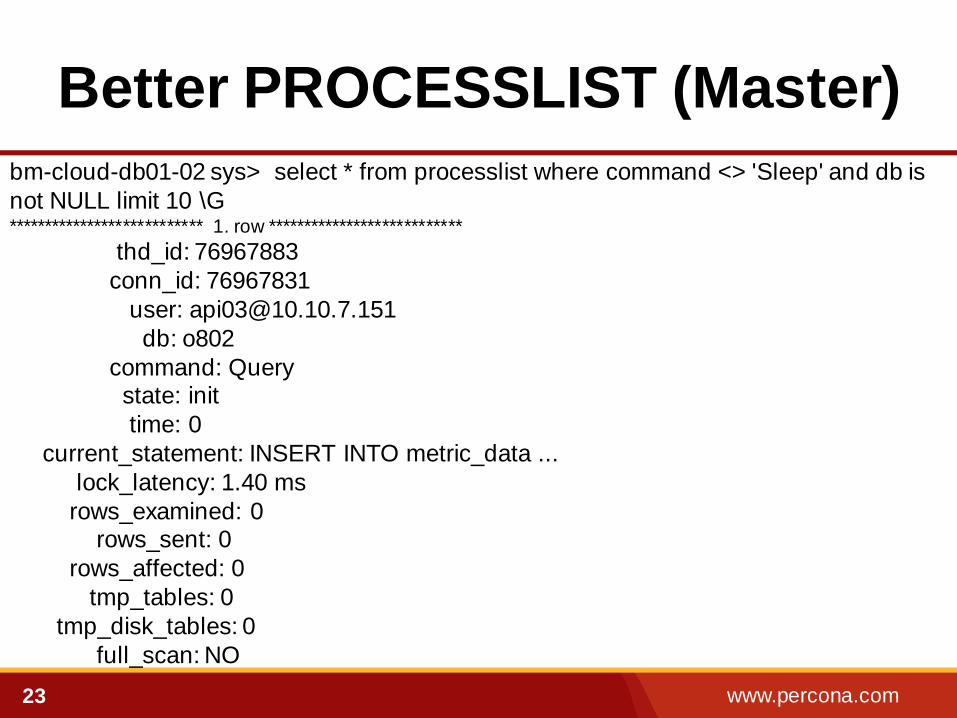
Better PROCESSLIST (Master)
bm-cloud-db01-02 sys> select * from processlist where command <> 'Sleep' and db is
not NULL limit 10 \G *************************** 1. row ***************************
thd_id: 76967883
conn_id: 76967831
user: [email protected]
db: o802
command: Query state: init
time: 0
current_statement: INSERT INTO metric_data ...
lock_latency: 1.40 ms
rows_examined: 0 rows_sent: 0
rows_affected: 0
tmp_tables: 0
tmp_disk_tables: 0
full_scan: NO
www.percona.com 24
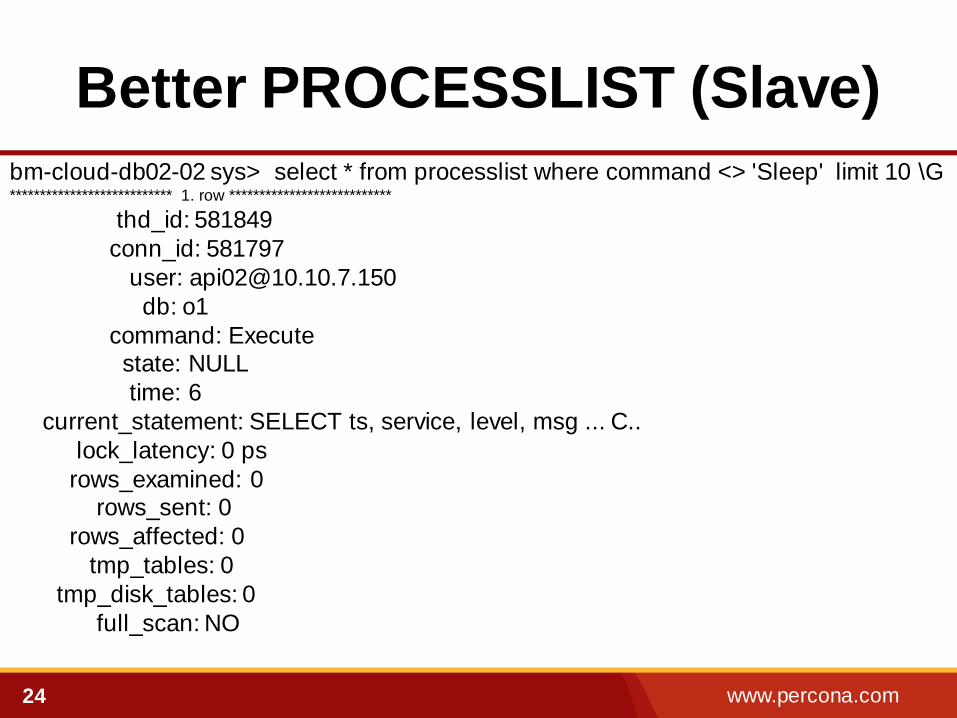
Better PROCESSLIST (Slave)
bm-cloud-db02-02 sys> select * from processlist where command <> 'Sleep' limit 10 \G *************************** 1. row ***************************
thd_id: 581849
conn_id: 581797
user: [email protected]
db: o1
command: Execute state: NULL
time: 6
current_statement: SELECT ts, service, level, msg ... C..
lock_latency: 0 ps
rows_examined: 0 rows_sent: 0
rows_affected: 0
tmp_tables: 0
tmp_disk_tables: 0
full_scan: NO

www.percona.com 25
Examples
Table /Schema
Level Statistics
www.percona.com 26
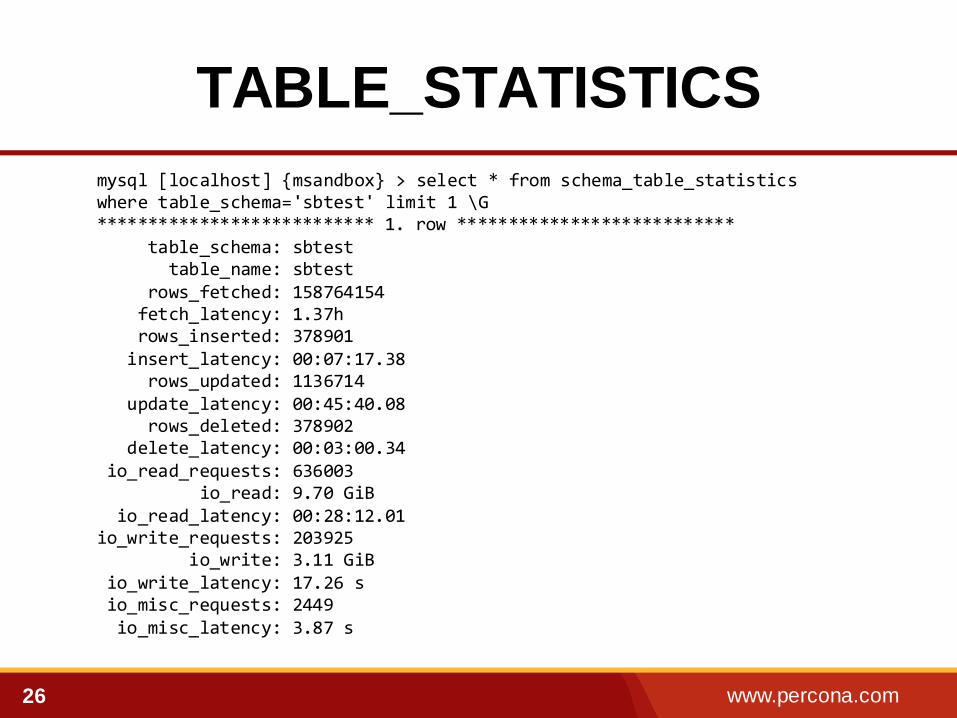
TABLE_STATISTICS
mysql [localhost] {msandbox} > select * from schema_table_statistics where table_schema='sbtest' limit 1 \G *************************** 1. row *************************** table_schema: sbtest table_name: sbtest rows_fetched: 158764154 fetch_latency: 1.37h rows_inserted: 378901 insert_latency: 00:07:17.38 rows_updated: 1136714 update_latency: 00:45:40.08 rows_deleted: 378902 delete_latency: 00:03:00.34 io_read_requests: 636003 io_read: 9.70 GiB io_read_latency: 00:28:12.01 io_write_requests: 203925 io_write: 3.11 GiB io_write_latency: 17.26 s io_misc_requests: 2449 io_misc_latency: 3.87 s
www.percona.com 27
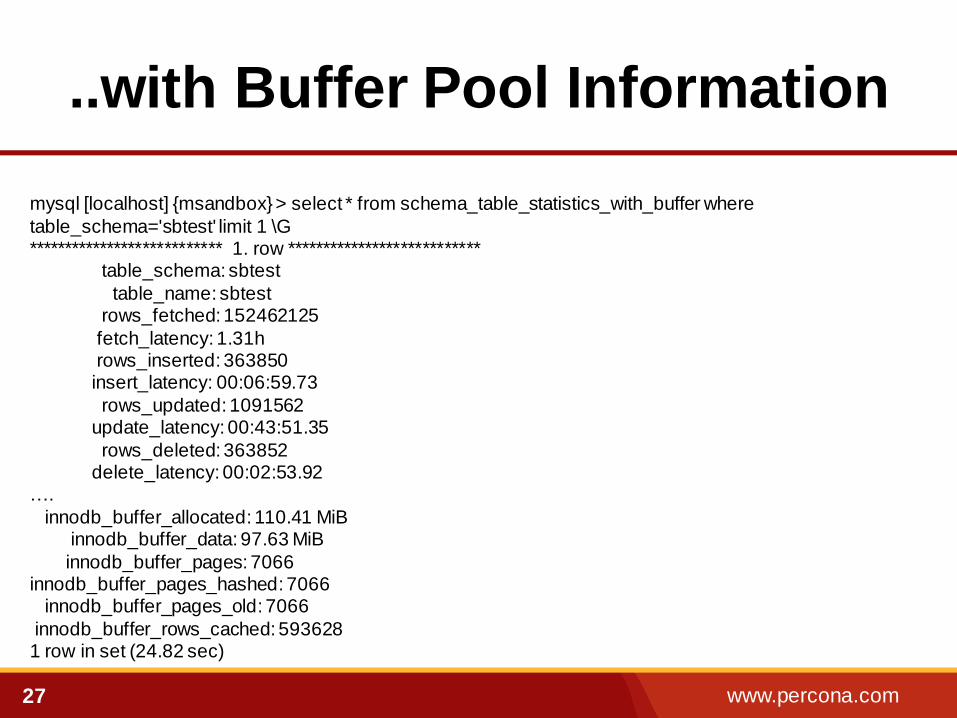
..with Buffer Pool Information
mysql [localhost] {msandbox} > select * from schema_table_statistics_with_buffer where
table_schema='sbtest' limit 1 \G *************************** 1. row *************************** table_schema: sbtest
table_name: sbtest rows_fetched: 152462125
fetch_latency: 1.31h rows_inserted: 363850 insert_latency: 00:06:59.73
rows_updated: 1091562 update_latency: 00:43:51.35
rows_deleted: 363852 delete_latency: 00:02:53.92 ….
innodb_buffer_allocated: 110.41 MiB innodb_buffer_data: 97.63 MiB
innodb_buffer_pages: 7066 innodb_buffer_pages_hashed: 7066 innodb_buffer_pages_old: 7066
innodb_buffer_rows_cached: 593628 1 row in set (24.82 sec)
www.percona.com 28
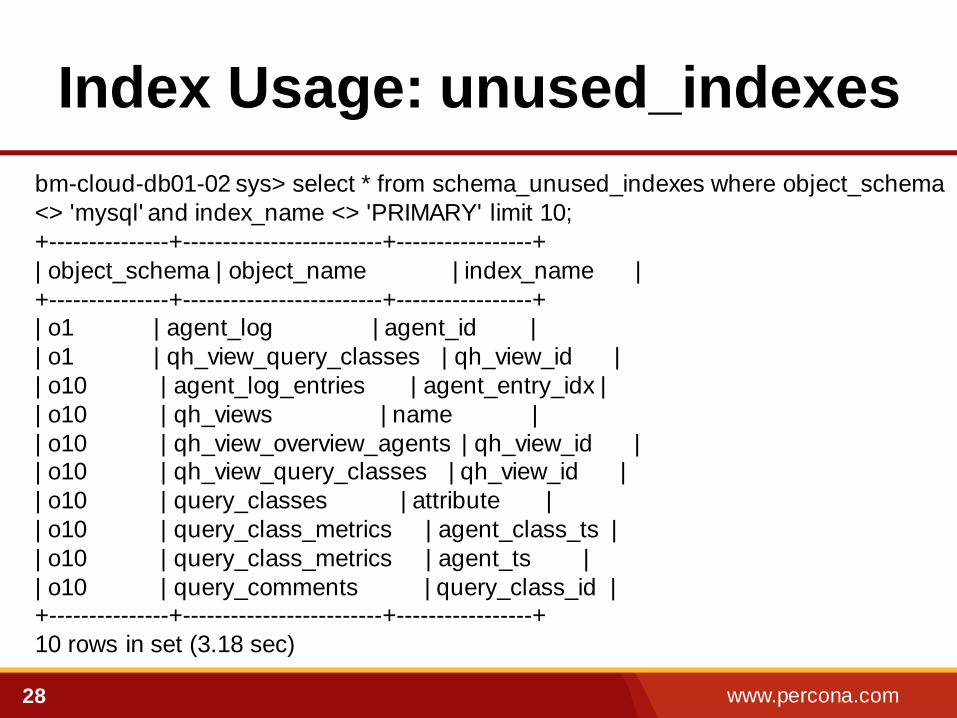
Index Usage: unused_indexes
bm-cloud-db01-02 sys> select * from schema_unused_indexes where object_schema
<> 'mysql' and index_name <> 'PRIMARY' limit 10;
+---------------+-------------------------+-----------------+
| object_schema | object_name | index_name |
+---------------+-------------------------+-----------------+ | o1 | agent_log | agent_id |
| o1 | qh_view_query_classes | qh_view_id |
| o10 | agent_log_entries | agent_entry_idx |
| o10 | qh_views | name |
| o10 | qh_view_overview_agents | qh_view_id | | o10 | qh_view_query_classes | qh_view_id |
| o10 | query_classes | attribute |
| o10 | query_class_metrics | agent_class_ts |
| o10 | query_class_metrics | agent_ts |
| o10 | query_comments | query_class_id | +---------------+-------------------------+-----------------+
10 rows in set (3.18 sec)
www.percona.com 29
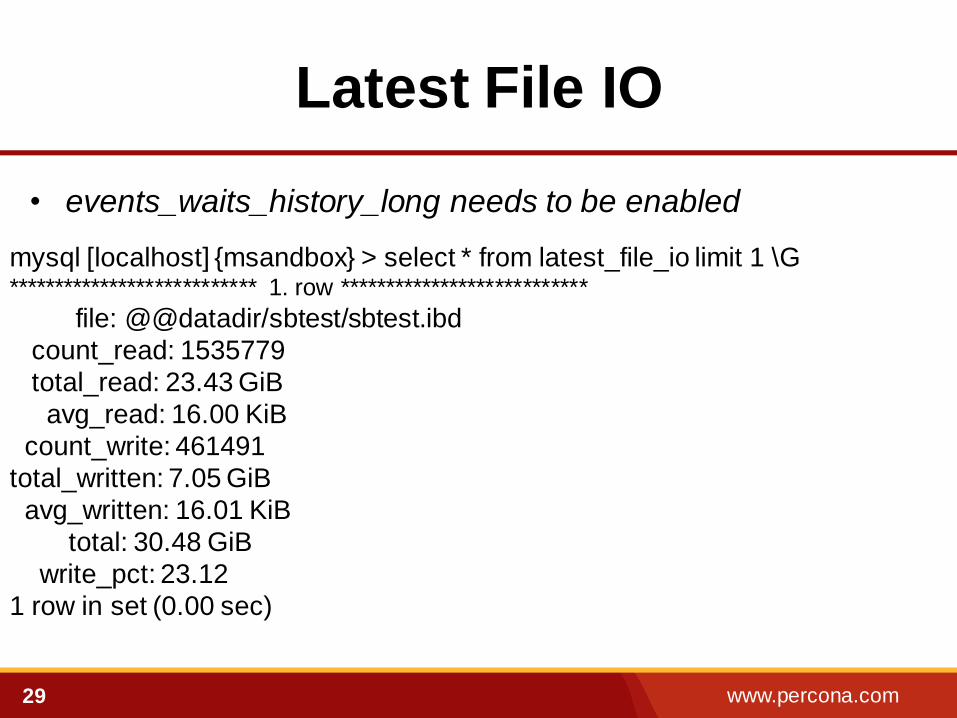
Latest File IO
mysql [localhost] {msandbox} > select * from latest_file_io limit 1 \G *************************** 1. row ***************************
file: @@datadir/sbtest/sbtest.ibd
count_read: 1535779
total_read: 23.43 GiB
avg_read: 16.00 KiB
count_write: 461491
total_written: 7.05 GiB
avg_written: 16.01 KiB
total: 30.48 GiB
write_pct: 23.12
1 row in set (0.00 sec)
• events_waits_history_long needs to be enabled
www.percona.com 30
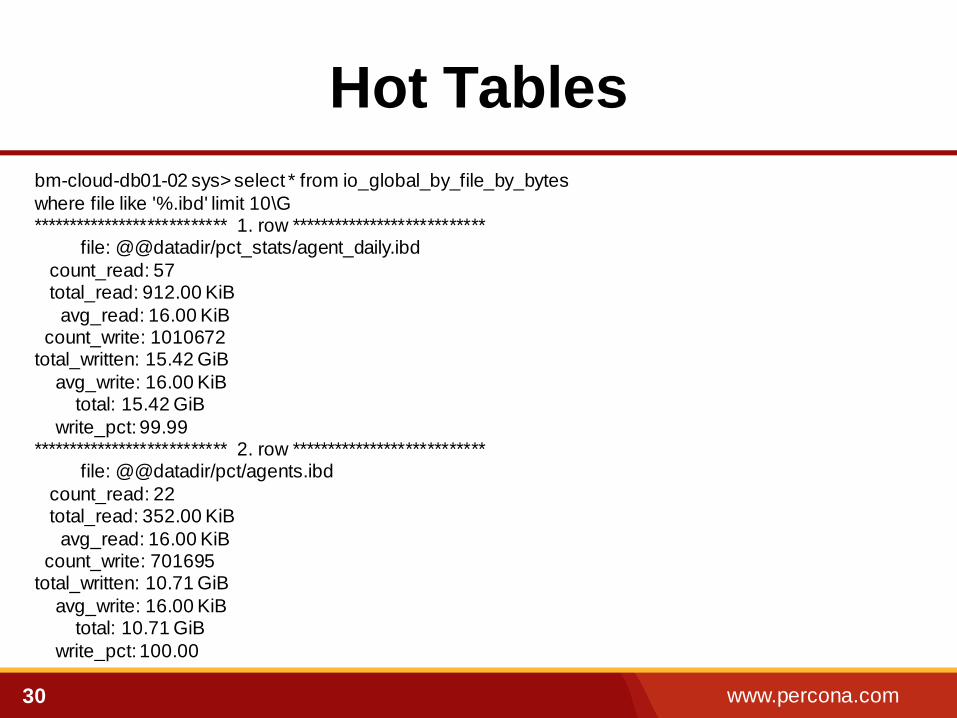
Hot Tables
bm-cloud-db01-02 sys> select * from io_global_by_file_by_bytes
where file like '%.ibd' limit 10\G *************************** 1. row *************************** file: @@datadir/pct_stats/agent_daily.ibd
count_read: 57 total_read: 912.00 KiB
avg_read: 16.00 KiB count_write: 1010672 total_written: 15.42 GiB
avg_write: 16.00 KiB total: 15.42 GiB
write_pct: 99.99 *************************** 2. row *************************** file: @@datadir/pct/agents.ibd
count_read: 22 total_read: 352.00 KiB
avg_read: 16.00 KiB count_write: 701695 total_written: 10.71 GiB
avg_write: 16.00 KiB total: 10.71 GiB
write_pct: 100.00
www.percona.com 31
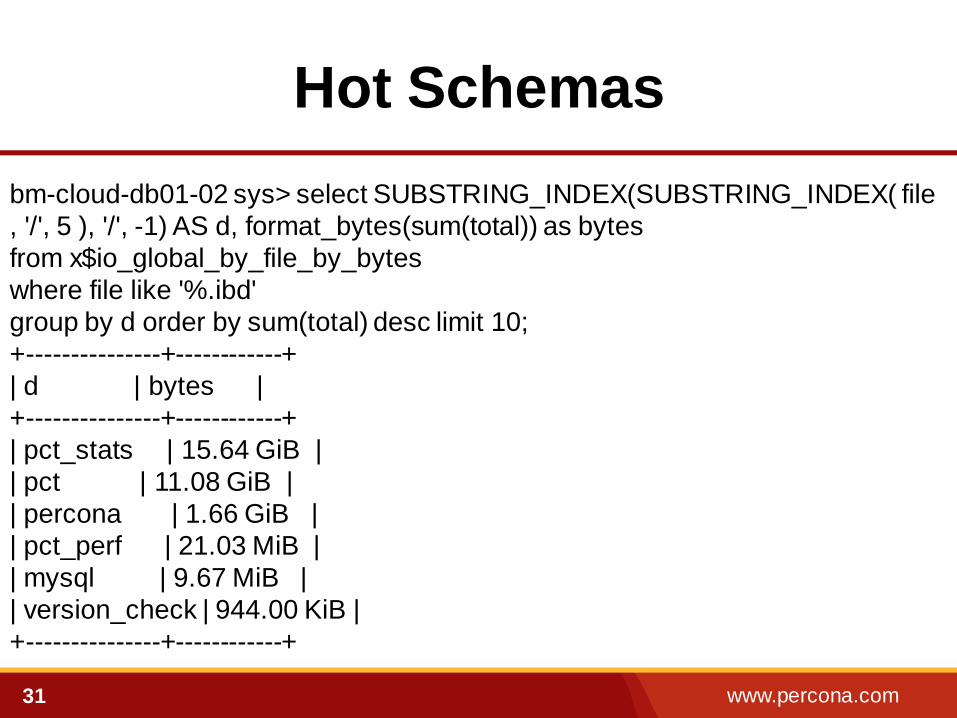
Hot Schemas
bm-cloud-db01-02 sys> select SUBSTRING_INDEX(SUBSTRING_INDEX( file
, '/', 5 ), '/', -1) AS d, format_bytes(sum(total)) as bytes
from x$io_global_by_file_by_bytes
where file like '%.ibd'
group by d order by sum(total) desc limit 10;
+---------------+------------+
| d | bytes |
+---------------+------------+
| pct_stats | 15.64 GiB |
| pct | 11.08 GiB |
| percona | 1.66 GiB |
| pct_perf | 21.03 MiB |
| mysql | 9.67 MiB |
| version_check | 944.00 KiB |
+---------------+------------+
www.percona.com 32
Configuration
P_S Configuration
www.percona.com 33
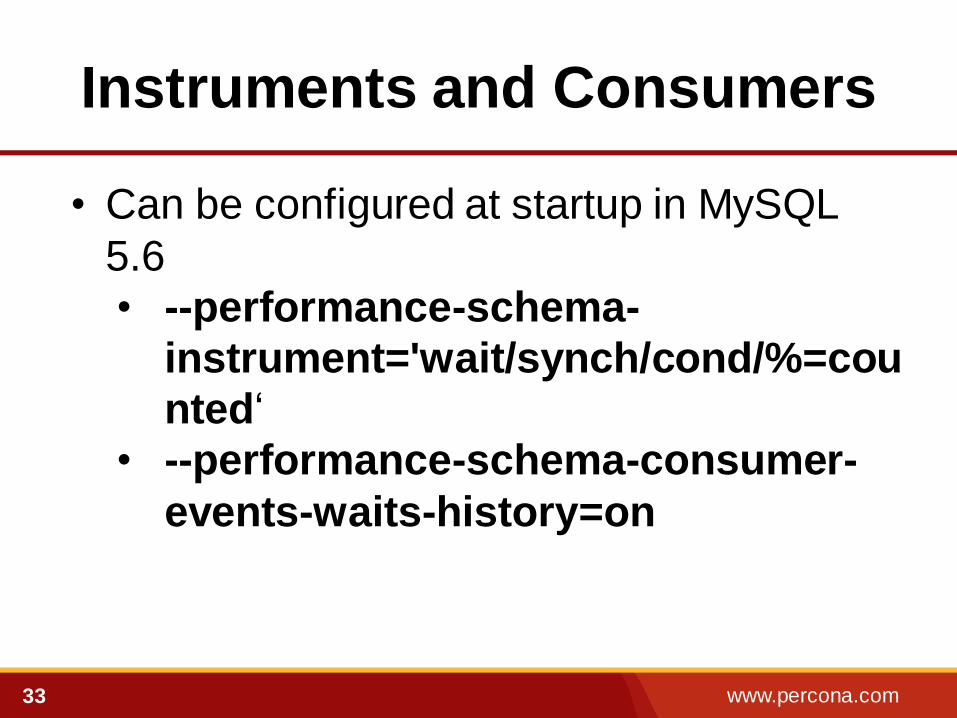
Instruments and Consumers
• Can be configured at startup in MySQL
5.6
• --performance-schema-
instrument='wait/synch/cond/%=cou
nted‘
• --performance-schema-consumer-
events-waits-history=on
www.percona.com 34
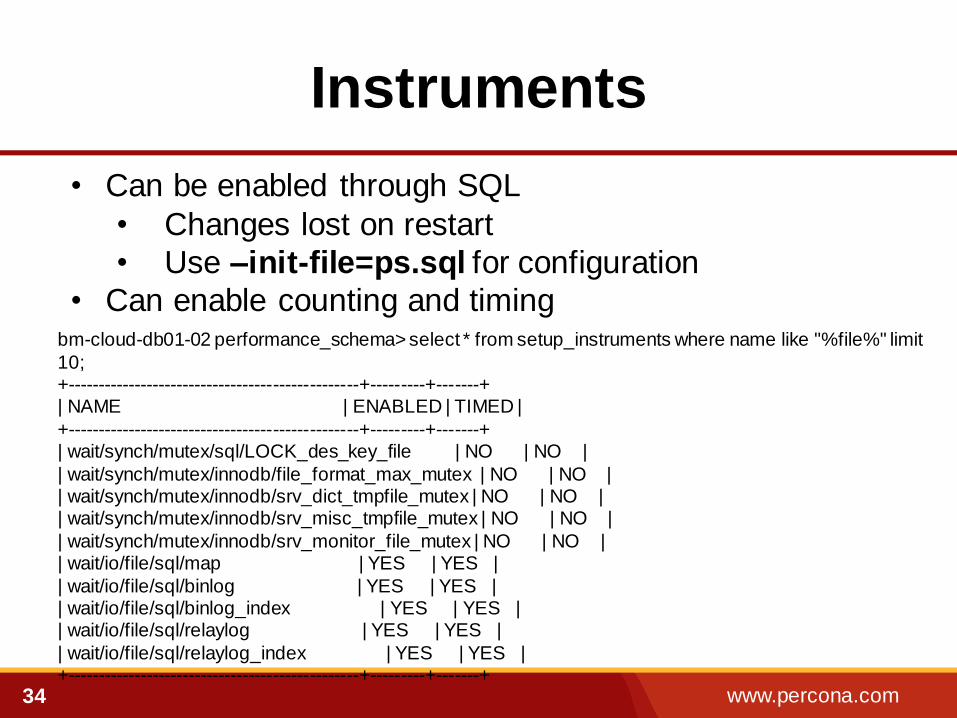
Instruments
• Can be enabled through SQL
• Changes lost on restart
• Use –init-file=ps.sql for configuration
• Can enable counting and timing
bm-cloud-db01-02 performance_schema> select * from setup_instruments where name like "%file%" limit
10; +------------------------------------------------+---------+-------+ | NAME | ENABLED | TIMED |
+------------------------------------------------+---------+-------+ | wait/synch/mutex/sql/LOCK_des_key_file | NO | NO |
| wait/synch/mutex/innodb/file_format_max_mutex | NO | NO | | wait/synch/mutex/innodb/srv_dict_tmpfile_mutex | NO | NO | | wait/synch/mutex/innodb/srv_misc_tmpfile_mutex | NO | NO |
| wait/synch/mutex/innodb/srv_monitor_file_mutex | NO | NO | | wait/io/file/sql/map | YES | YES |
| wait/io/file/sql/binlog | YES | YES | | wait/io/file/sql/binlog_index | YES | YES | | wait/io/file/sql/relaylog | YES | YES |
| wait/io/file/sql/relaylog_index | YES | YES | +------------------------------------------------+---------+-------+
www.percona.com 35
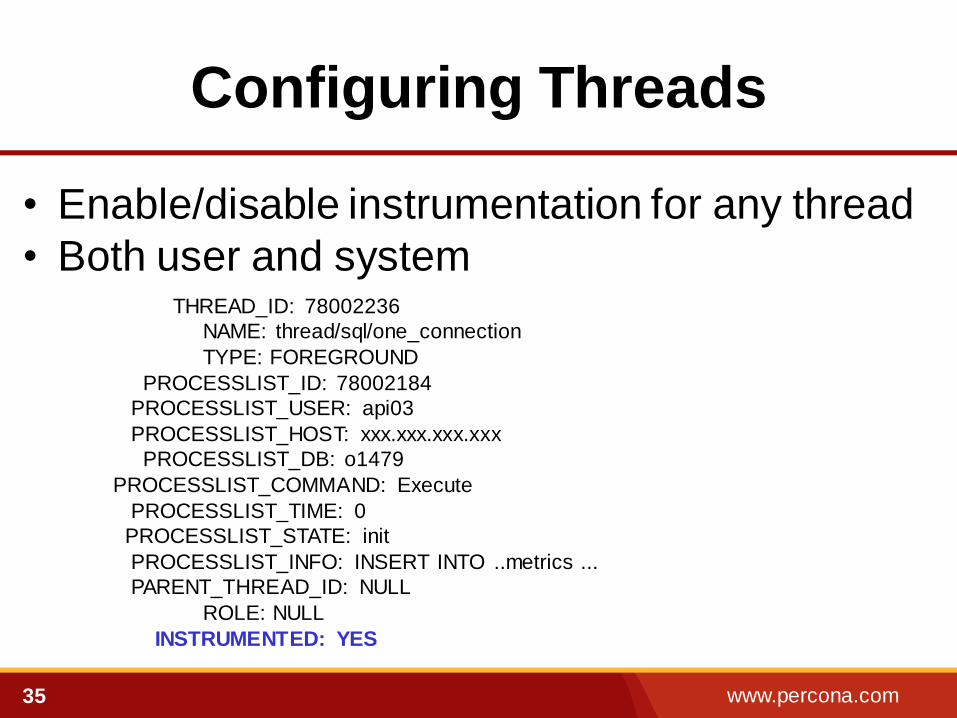
Configuring Threads
• Enable/disable instrumentation for any thread
• Both user and system THREAD_ID: 78002236
NAME: thread/sql/one_connection
TYPE: FOREGROUND
PROCESSLIST_ID: 78002184
PROCESSLIST_USER: api03
PROCESSLIST_HOST: xxx.xxx.xxx.xxx
PROCESSLIST_DB: o1479
PROCESSLIST_COMMAND: Execute
PROCESSLIST_TIME: 0
PROCESSLIST_STATE: init
PROCESSLIST_INFO: INSERT INTO ..metrics ...
PARENT_THREAD_ID: NULL
ROLE: NULL
INSTRUMENTED: YES
www.percona.com 36
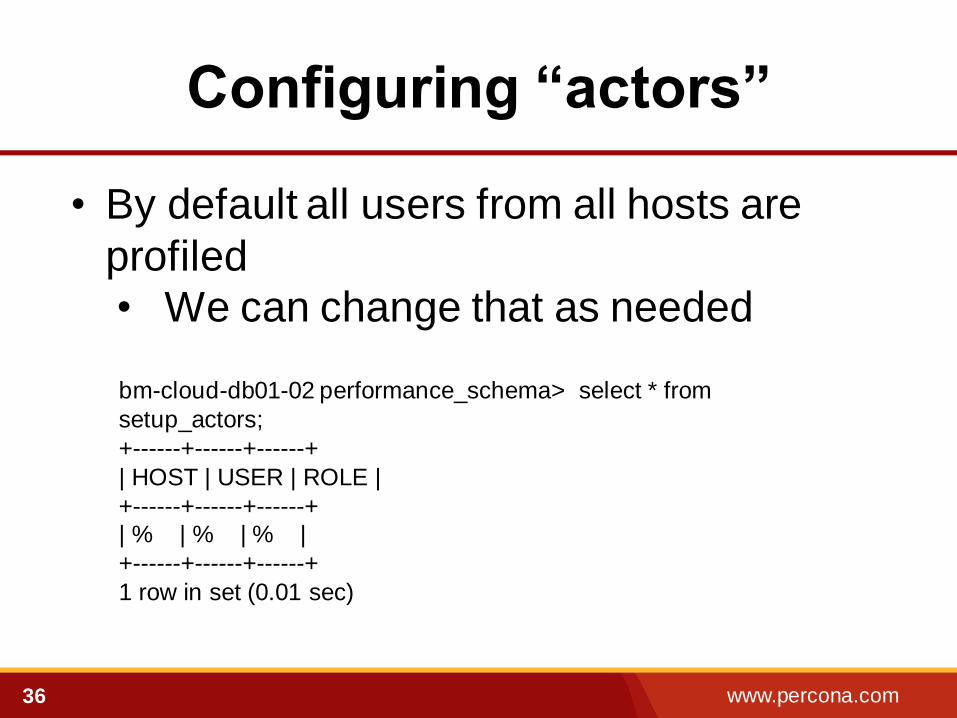
Configuring “actors”
• By default all users from all hosts are
profiled
• We can change that as needed
bm-cloud-db01-02 performance_schema> select * from
setup_actors;
+------+------+------+
| HOST | USER | ROLE |
+------+------+------+ | % | % | % |
+------+------+------+
1 row in set (0.01 sec)
www.percona.com 37
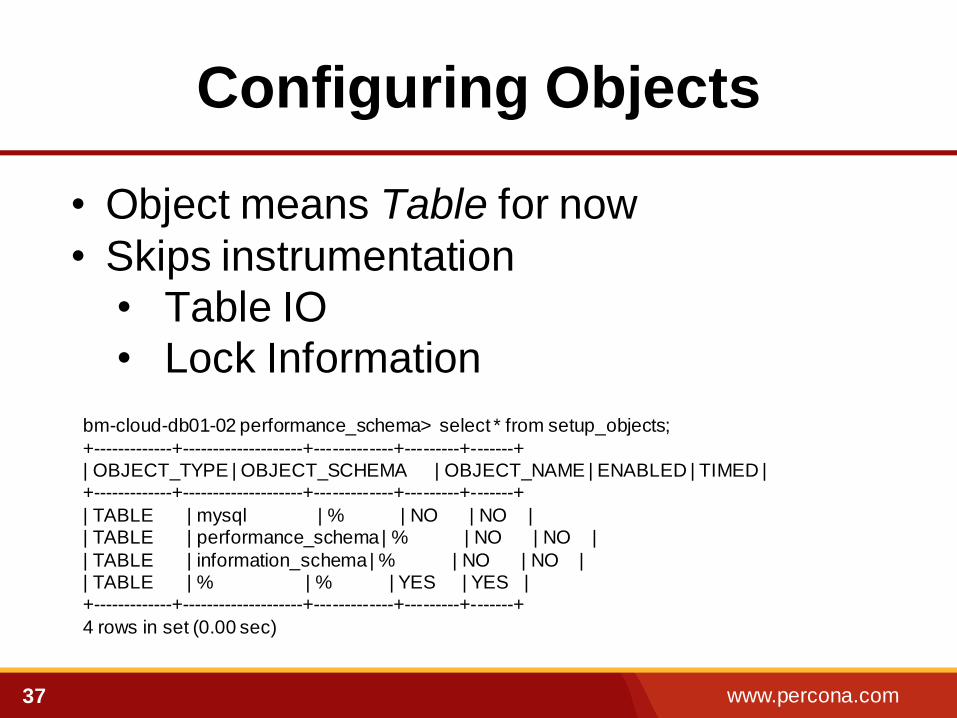
Configuring Objects
• Object means Table for now
• Skips instrumentation
• Table IO
• Lock Information
bm-cloud-db01-02 performance_schema> select * from setup_objects;
+-------------+--------------------+-------------+---------+-------+ | OBJECT_TYPE | OBJECT_SCHEMA | OBJECT_NAME | ENABLED | TIMED | +-------------+--------------------+-------------+---------+-------+
| TABLE | mysql | % | NO | NO | | TABLE | performance_schema | % | NO | NO |
| TABLE | information_schema | % | NO | NO | | TABLE | % | % | YES | YES | +-------------+--------------------+-------------+---------+-------+
4 rows in set (0.00 sec)
www.percona.com 38
Getting Incremental Data
• What have been top statements for last 5
minutes?
• Pull the data in the separate table and
compute the difference
• Use TRUNCATE TABLE to flush
statistics
www.percona.com 39
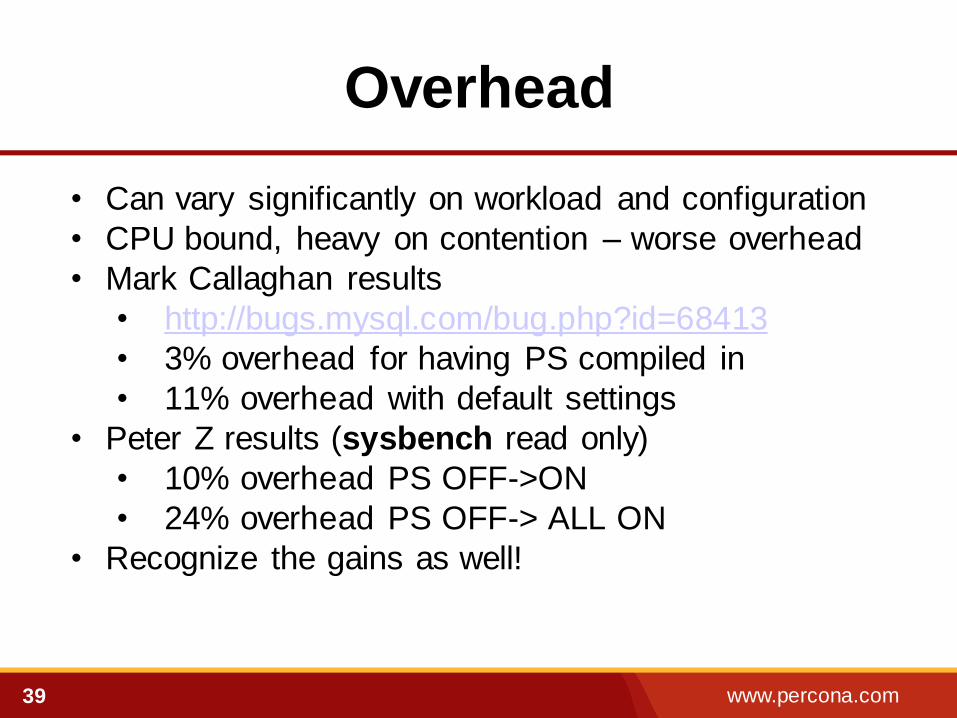
Overhead
• Can vary significantly on workload and configuration
• CPU bound, heavy on contention – worse overhead
• Mark Callaghan results
• http://bugs.mysql.com/bug.php?id=68413
• 3% overhead for having PS compiled in
• 11% overhead with default settings
• Peter Z results (sysbench read only)
• 10% overhead PS OFF->ON
• 24% overhead PS OFF-> ALL ON
• Recognize the gains as well!

www.percona.com 40
Enable ALL (on dev)
• My.cnf:
performance_schema_events_waits_history_long_size = 1000000
performance_schema_events_statements_history_long_size = 1000000
performance_schema_events_stages_history_long_size = 1000000
performance-schema-instrument='%=on'
• Enable all consumers
mysql> update setup_consumers set ENABLED = 'YES';
• Set all timer consistent to NANOSECOND
mysql> update setup_timers set TIMER_NAME =
'NANOSECOND';

www.percona.com 41
More on PERFORMANCE_SCHEMA
• MySQL Manual on Performance Schema • http://bit.ly/Uc7GIO
• Marc Alff’s Blog • http://marcalff.blogspot.com/
• Mark Leith’s Blog • http://www.markleith.co.uk/
• Presentations • MySQL Connect 2012
• http://bit.ly/142DuIa • Percona Live 2013
• http://bit.ly/12rZHwk

www.percona.com 42 www.percona.com
Thank You!
Recommended