UNIVERSITA DEL SALENTO
FACOLTA DI SCIENZE MM.FF.NN. - DIPARTIMENTO DI FISICA
DOTTORATO DI RICERCA IN FISICA - XIX CICLO - FIS/05
ROSARIO BRUNETTO
SPACE WEATHERING IN THE SOLAR SYSTEM:
FROM LABORATORY TO OBSERVATIONS,
THROUGH SPECTRAL MODELS
PhD Thesis
Tutors:Prof. Vincenzo OrofinoProf. Giovanni Strazzulla
ANNO ACCADEMICO 2006 - 2007


To Nadia

Contents
Sommario 1
Abstract 5
Acknowledgments 9
Introduction 11
I The surface of minor bodies 15
1 Surface composition and processing 17
1.1 Tools: observations and models . . . . . . . . . . . . . . . . . . . . . 19
1.1.1 UV-Vis-IR spectroscopy . . . . . . . . . . . . . . . . . . . . . 19
1.1.2 Hapke and Shkuratov theories . . . . . . . . . . . . . . . . . . 20
1.1.3 Results from space missions . . . . . . . . . . . . . . . . . . . 21
1.2 Space weathering of silicates . . . . . . . . . . . . . . . . . . . . . . . 22
1.2.1 Solar wind and cosmic ions . . . . . . . . . . . . . . . . . . . . 26
1.2.2 Micrometeorites bombardment . . . . . . . . . . . . . . . . . . 26
1.3 Ices: chemistry and colors . . . . . . . . . . . . . . . . . . . . . . . . 29
1.3.1 Chemistry of mixtures . . . . . . . . . . . . . . . . . . . . . . 29
1.3.2 C-rich species . . . . . . . . . . . . . . . . . . . . . . . . . . . 31
1.3.3 A wide spread of colors . . . . . . . . . . . . . . . . . . . . . . 33
1.4 Bitumens and other organics . . . . . . . . . . . . . . . . . . . . . . . 34
1.4.1 The organic crust . . . . . . . . . . . . . . . . . . . . . . . . . 34
i
1.4.2 Tholins . . . . . . . . . . . . . . . . . . . . . . . . . . . . . . 35
1.4.3 Bitumens . . . . . . . . . . . . . . . . . . . . . . . . . . . . . 36
2 Experimental approach 39
2.1 Ion irradiation experiments . . . . . . . . . . . . . . . . . . . . . . . . 39
2.2 Laser ablation experiments . . . . . . . . . . . . . . . . . . . . . . . . 44
2.3 How to extrapolate laboratory results . . . . . . . . . . . . . . . . . . 46
II New experimental results 51
3 Irradiation and ablation of silicates 53
3.1 Ordinary Chondrites: Epinal meteorite . . . . . . . . . . . . . . . . . 53
3.1.1 Irradiation and spectroscopy . . . . . . . . . . . . . . . . . . . 54
3.1.2 Comparison with NEOs and timescale . . . . . . . . . . . . . 57
3.2 Ion irradiation: the role of elastic collisions . . . . . . . . . . . . . . . 61
3.2.1 Characterization of the samples . . . . . . . . . . . . . . . . . 62
3.2.2 Mechanisms of ion energy loss and damaging . . . . . . . . . . 65
3.2.3 Spectral modifications . . . . . . . . . . . . . . . . . . . . . . 67
3.2.4 Spectral slopes and elastic collisions . . . . . . . . . . . . . . . 71
3.3 Laser irradiation below and above the ablation threshold . . . . . . . 76
3.3.1 Spectral modifications . . . . . . . . . . . . . . . . . . . . . . 76
3.3.2 Discussion . . . . . . . . . . . . . . . . . . . . . . . . . . . . . 81
3.3.3 Astrophysical implications . . . . . . . . . . . . . . . . . . . . 86
4 Irradiation of ices 91
4.1 Chemistry: the case of methanol . . . . . . . . . . . . . . . . . . . . . 91
4.1.1 Experimental results . . . . . . . . . . . . . . . . . . . . . . . 92
4.1.2 Discussion . . . . . . . . . . . . . . . . . . . . . . . . . . . . . 99
4.2 CH3OH, CH4, and C6H6: the organic residue . . . . . . . . . . . . . . 102
ii
III Space weathering in the Solar System 107
5 Spectral comparisons 109
5.1 The spectral slope of Near Earth and Main Belt Asteroids . . . . . . 109
5.1.1 Spectra of NEAs and MBAs . . . . . . . . . . . . . . . . . . . 109
5.1.2 A global view on space weathering of silicate-rich asteroids . . 115
5.2 S-, C-, and X-complexes: a big picture . . . . . . . . . . . . . . . . . 121
5.2.1 Spectral trends in the Main Belt . . . . . . . . . . . . . . . . . 124
5.2.2 The big picture . . . . . . . . . . . . . . . . . . . . . . . . . . 128
5.3 Irradiation mantles on centaurs and TNOs: ultra-red matter? . . . . 129
5.3.1 Observations of centaurs and TNOs . . . . . . . . . . . . . . . 130
5.3.2 The irradiation mantle . . . . . . . . . . . . . . . . . . . . . . 132
6 Peculiar objects 137
6.1 Asteroid 832 Karin and its family . . . . . . . . . . . . . . . . . . . . 137
6.1.1 Model of the continuum: the CS parameter . . . . . . . . . . . 139
6.1.2 Observations and model of 832 Karin . . . . . . . . . . . . . . 145
6.1.3 Discussion . . . . . . . . . . . . . . . . . . . . . . . . . . . . . 154
6.1.4 Appendix: the Karin family . . . . . . . . . . . . . . . . . . . 156
6.2 A particular case: asteroid 4 Vesta . . . . . . . . . . . . . . . . . . . 157
6.2.1 Vesta is not red . . . . . . . . . . . . . . . . . . . . . . . . . . 157
6.2.2 A magnetic field? . . . . . . . . . . . . . . . . . . . . . . . . . 160
7 Optical constants 163
7.1 Optical characterization of ablated silicates . . . . . . . . . . . . . . . 163
7.1.1 Nanophase metallic iron in laser ablation experiments . . . . . 164
7.1.2 Characterization of the samples . . . . . . . . . . . . . . . . . 166
7.1.3 Optical constants of silicates after UV laser ablation . . . . . . 174
7.1.4 Other possible scenarios . . . . . . . . . . . . . . . . . . . . . 180
7.2 Application to minor bodies . . . . . . . . . . . . . . . . . . . . . . . 186
7.2.1 Centaur 5145 Pholus: a mixture of silicates and organics . . . 186
7.2.2 Asteroid 1951 Lick: space weathering to the highest level . . . 190
iii

Conclusions 199
Bibliography 201
iv
List of Figures
1.1 Space weathering processes . . . . . . . . . . . . . . . . . . . . . . . . 19
1.2 OC paradox . . . . . . . . . . . . . . . . . . . . . . . . . . . . . . . . 25
1.3 The spectrum of Pholus . . . . . . . . . . . . . . . . . . . . . . . . . 30
1.4 Irradiation of asphaltite . . . . . . . . . . . . . . . . . . . . . . . . . 37
2.1 Scheme of the vacuum chamber . . . . . . . . . . . . . . . . . . . . . 40
2.2 Electronic to total energy loss . . . . . . . . . . . . . . . . . . . . . . 43
2.3 The amorphization dose vs the displacement energy. . . . . . . . . . . 48
2.4 Times to accumulate 100 eV per 16-amu for H2O ice . . . . . . . . . 49
3.1 Micro-Raman spectra of the Epinal meteorite . . . . . . . . . . . . . 55
3.2 Meteorite Epinal before and after irradiation . . . . . . . . . . . . . . 56
3.3 Ratio of the irradiated Epinal spectra. . . . . . . . . . . . . . . . . . 57
3.4 Spectra of Epinal compared with three NEOs . . . . . . . . . . . . . 58
3.5 Plot of spectral parameters of Epinal and NEOs . . . . . . . . . . . . 60
3.6 Micro-Raman spectra of Jackson silicates . . . . . . . . . . . . . . . . 63
3.7 Reflectance of Jackson silicates compared with USGS spectra . . . . . 64
3.8 Raman spectra of irradiated silicates . . . . . . . . . . . . . . . . . . 68
3.9 Ex situ spectra of silicates before and after irradiation . . . . . . . . . 70
3.10 In situ spectra of irradiated silicates . . . . . . . . . . . . . . . . . . . 71
3.11 The spectral slope S versus the parameter d . . . . . . . . . . . . . . 73
3.12 The spectral slope S versus the elastic and the inelastic collisions . . 74
3.13 Clinopyroxene before and after irradiation: below and above ablation 78
3.14 Spectra of olivine before and after ablation . . . . . . . . . . . . . . . 79
v
3.15 Spectra of orthopyroxene before and after ablation . . . . . . . . . . . 80
3.16 Scaled spectra of silicates before and after weathering . . . . . . . . . 82
3.17 Slope of clinopyroxene vs number of pulses and laser fluence . . . . . 83
3.18 Spectral slope vs the total laser dose . . . . . . . . . . . . . . . . . . 85
3.19 Spectral slope vs the BII/BI area ratio, below and above ablation . . 87
4.1 Transmittance spectra of frozen hydrocarbons . . . . . . . . . . . . . 93
4.2 Reflectance spectra of irradiated methanol at T = 16 K . . . . . . . . 95
4.3 Reflectance spectra of irradiated methanol at T = 77 K . . . . . . . . 96
4.4 Irradiation of a mixture water:methanol . . . . . . . . . . . . . . . . 97
4.5 Decrease of the CH3OH bands area after ion irradiation . . . . . . . . 98
4.6 Irradiation of methanol, methane, and benzene . . . . . . . . . . . . . 104
4.7 J-R slope for irradiated methane, benzene, and methanol . . . . . . . 105
5.1 Irradiated Eifel, olivine, and orthopyroxene . . . . . . . . . . . . . . . 116
5.2 Slope distributions of OCs, NEOs, and MBAs . . . . . . . . . . . . . 117
5.3 Band I peak vs. BII/BI for OCs, NEOs, MBAs, and experiments . . 119
5.4 Slope vs. BII/BI for OCs, NEOs, MBAs, and experiments . . . . . . 120
5.5 Spectral trends for MBAs and comparison with experiments . . . . . 126
5.6 Spectra of CC meteorites before and after laser and ion irradiation . . 127
5.7 Methanol, methane, and benzene, compared with centaurs and TNOs 131
5.8 K-J slope vs. J-R slope for experimental and observational data . . . 134
6.1 Summary of irradiated silicates . . . . . . . . . . . . . . . . . . . . . 140
6.2 Ratio plot for irradiated silicates . . . . . . . . . . . . . . . . . . . . . 141
6.3 The CS parameter vs the number of displacements per cm2 . . . . . . 144
6.4 Visible spectrum of Karin . . . . . . . . . . . . . . . . . . . . . . . . 147
6.5 NIR spectrum of Karin . . . . . . . . . . . . . . . . . . . . . . . . . . 148
6.6 Fit of Karin spectra . . . . . . . . . . . . . . . . . . . . . . . . . . . . 151
6.7 Timescales for Karin . . . . . . . . . . . . . . . . . . . . . . . . . . . 153
6.8 Irradiated Bereba compared with Vesta and the Moon . . . . . . . . 159
7.1 Imaginary index for olivine and pyroxene . . . . . . . . . . . . . . . . 171
vi
7.2 Estimation of grain size for silicates . . . . . . . . . . . . . . . . . . . 172
7.3 Imaginary index from inversion of the Hapke model . . . . . . . . . . 175
7.4 Fit of olivine spectra with metallic iron inclusions . . . . . . . . . . . 178
7.5 Fit of orthopyroxene spectra with metallic iron inclusions . . . . . . . 179
7.6 Fit of clinopyroxene spectra with metallic iron inclusions . . . . . . . 181
7.7 Fit of clinopyroxene below ablation, with metallic iron inclusions . . . 182
7.8 Fit of orthopyroxene spectra with glass inclusions . . . . . . . . . . . 184
7.9 Spectral fit of Pholus . . . . . . . . . . . . . . . . . . . . . . . . . . . 188
7.10 Asteroid Lick compared with ablated olivine (1) . . . . . . . . . . . . 191
7.11 Asteroid Lick compared with ablated olivine (2) . . . . . . . . . . . . 192
7.12 Fit of Lick spectrum using pristine and ablated olivine . . . . . . . . 193
7.13 Fit of Lick spectrum using San Carlos olivine (Hapke SW model) . . 194
7.14 Fit of Lick spectrum using Brachina meteorite (Hapke SW model) . . 195
7.15 Best fit of Lick spectrum . . . . . . . . . . . . . . . . . . . . . . . . . 196
vii

viii
List of Tables
2.1 Amorphization doses . . . . . . . . . . . . . . . . . . . . . . . . . . . 47
3.1 Damage parameters for irradiated silicates . . . . . . . . . . . . . . . 65
4.1 Peak position and FWHM of NIR bands . . . . . . . . . . . . . . . . 94
4.2 σ and A∞ for irradiated methanol . . . . . . . . . . . . . . . . . . . . 99
4.3 Damage parameters for irradiated ices . . . . . . . . . . . . . . . . . 103
5.1 Spectral parameters for selected MBAs . . . . . . . . . . . . . . . . . 112
5.2 Spectral parameters for selected NEAs . . . . . . . . . . . . . . . . . 113
5.3 List of meteorites from RELAB . . . . . . . . . . . . . . . . . . . . . 114
5.4 Slopes for selected centaurs and TNOs . . . . . . . . . . . . . . . . . 132
6.1 Parameters of observations of Karin . . . . . . . . . . . . . . . . . . . 146
6.2 Results of the fit of Karin’s spectrum . . . . . . . . . . . . . . . . . . 152
7.1 Grain size distribution for silicates . . . . . . . . . . . . . . . . . . . . 173
7.2 Abundances in the spatial mixture fit of Pholus spectrum . . . . . . . 187
7.3 Abundances in the intimate mixture fit of Pholus spectrum . . . . . . 189
ix

Sommario
La gran parte dei corpi del Sistema Solare non possiede atmosfera o campi
magnetici; tali corpi sono a volte chiamati “corpi minori”, ed includono asteroidi,
oggetti Trans-Nettuniani, pianeti nani, comete e satelliti dei pianeti.
Le superfici dei corpi del Sistema Solare non protetti, o debolmente protetti
da atmosfere o campi magnetici, sono costantemente sottoposte all’interazione con
micro-meteoriti, con particelle del vento solare e con particelle cariche di piu alta
energia, di provenienza solare, galattica o magnetosferica (ad es. i satelliti di Giove
e Saturno). Tale interazione, nota con il nome di “space weathering”, e causa di un
notevole numero di effetti.
Il bombardamento da parte di micro-impattori causa principalmente: ablazione
(con rideposizione di parte del materiale vaporizzato); effetti termici; creazione
di micro-crateri. L’irraggiamento da parte di ioni veloci (impiantazione) causa:
variazioni della struttura del bersaglio (ad es. amorfizzazione); variazione della
composizione; erosione della superficie.
I processi di space weathering portano quindi anche alla variazione delle pro-
prieta ottiche dei materiali che compongono la superficie dell’oggetto. Essa si ri-
flette in una variazione delle proprieta spettrali, che possono essere studiate me-
diante l’osservazione della luce solare riflessa da tali superfici. Di conseguenza, per
interpretare gli spettri di riflettanza acquisiti mediante osservazioni, e necessario
comprendere i meccanismi e i processi che governano l’evoluzione di tali superfici.
Un contributo importante viene da esperimenti di laboratorio, che permettono
la simulazione dei processi di space weathering e delle variazioni spettrali associate.
Questi studi vengono condotti su materiali che sono dei buoni analoghi dei materiali
2 Sommario
che compongono le superfici dei corpi minori. Si tratta principalmente di silicati,
ghiacci e materiali carboniosi refrattari. Un caso particolare viene dalle meteoriti;
si tratta di uno dei pochi casi in cui e possibile studiare direttamente in laboratorio
i materiali che compongono i corpi minori.
Lo scopo principale di questa tesi e di contribuire ad una migliore conoscenza
dei fenomeni di space weathering, per comprendere come tali processi energetici
possano aver influenzato la formazione ed evoluzione dei corpi minori del Sistema
Solare. L’approccio e principalmente di tipo sperimentale, con la caratterizzazione
dei materiali in laboratorio mediante spettroscopia in trasmissione e in riflessione
nell’intervallo UV-Vis-IR, spettroscopia Raman e Micro-Raman, e in misura minore
analisi molecolare ed elementale.
Per simulare lo space weathering, i materiali studiati sono stati sottoposti a varie
alterazioni, in particolare: irraggiamento ed ablazione con laser UV a nano-impulsi
(per simulare gli impatti micro-meteoritici); irraggiamento con ioni energetici a
diverse temperature (per simulare l’irraggiamento degli ioni cosmici). Lo scopo e la
comprensione dei meccanismi fisici di tali processi e la valutazione dei corrispondenti
tempi scala astrofisici.
Per gli esperimenti, ho utilizzato la strumentazione del Laboratorio di Astrofisica
del Dipartimento di Fisica dell’Universita del Salento (ex Universita di Lecce) e
del Laboratorio di Astrofisica Sperimentale dell’INAF, Osservatorio Astrofisico di
Catania, nell’ambito di un progetto di collaborazione. La complementarita dei due
apparati permette di studiare con completezza il processo energetico di alterazione
e le variazioni spettrali indotte su silicati, ghiacci e carboni.
In relazione alla crescente quantita di informazioni ottenute grazie ai telescopi
di nuova generazione ed alle piu recenti missioni spaziali, il supporto dei dati di
laboratorio si rivela sempre piu importante. Tuttavia, un confronto diretto tra
dati di laboratorio e osservativi non sempre e possibile; sono necessari opportuni
modelli teorici. Ecco perche in questa tesi ho affiancato all’aspetto sperimentale un
lavoro teorico che, partendo dalla stima delle costanti ottiche dei materiali alterati,
e in grado di modellare gli spettri in riflettanza dei corpi minori per ricavarne la
composizione superficiale.
Sommario 3
A tal fine, ho portato avanti collaborazioni con ricercatori di diversi istituti,
italiani ed esteri; questo mi ha permesso di lavorare in diversi centri di ricerca, in
particolare al Laboratoire d’Etudes Spatiales et d’Instrumentation en Astrophysique,
Osservatorio di Parigi-Meudon (Francia), all’Isaac Newton Group of Telescopes
& Instituto de Astrofısica de Canarias, Santa Cruz de la Palma (Spagna), e al
Dipartimento di Astronomia e Osservatorio Astronomico di Padova. Inoltre, un
Protocollo d’Intesa stipulato per l’occasione tra la NASA e il Dipartimento di Fisica
dell’Universita di Lecce, mi ha permesso di trascorrere circa 4 mesi al NASA - Ames
Research Center, CA (USA), dove ho sviluppato alcuni modelli per il calcolo delle
costanti ottiche dei materiali irraggiati con ioni e radiazione laser.
I principali risultati sperimentali presentati in questa tesi sono i seguenti:
1. l’alterazione con laser o con ioni di un vasto numero di campioni (terrestri
e meteoritici) ricchi di silicati causa una forte riduzione della riflettanza spettrale
(oscuramento) maggiormente nel UV-Vis che nel vicino IR (arrossamento); questo
processo, altamente efficiente, e probabilmente connesso alla formazione di nano-
inclusioni di ferro metallico sulla superficie dei grani;
2. l’irraggiamento ionico di ghiacci ricchi di carbonio (come CH3OH, CH4,
o C6H6) produce una notevole variazione nella composizione chimica; cio causa
un forte arrossamento e un progressivo oscuramento degli spettri correlato alla
distruzione delle molecole originarie e alla conseguente produzione di un residuo
carbonioso stabile, anche in presenza di miscele con H2O;
3. sono state determinate le costanti ottiche di alcuni di questi materiali processati
in laboratorio, per usarle nei modelli.
Dal confronto tra dati di laboratorio e osservazioni dei corpi minori e stato
possibile ottenere i seguenti risultati:
4. l’arrossamento degli spettri dei silicati e in grado di riprodurre le pendenze
spettrali osservate negli asteroidi prossimi all’orbita terrestre (Near Earth Objects)
e in quelli di fascia principale (Main Belt Asteroids); e possibile quindi spiegare la
discrepanza tra gli spettri delle meteoriti piu abbondanti (condriti ordinarie) e quelli
degli asteroidi di tipo S (ricchi di silicati), da cui si ritiene provengano tali meteoriti;
5. il tempo scala, nello spazio compreso tra l’orbita terrestre e la fascia principale
4 Sommario
degli asteroidi, per l’arrossamento degli asteroidi di tipo S e stato stimato in circa
105-106 anni; cio suggerisce anche un’efficienza relativamente alta dei processi di
ringiovanimento (ad es. impatti) che si oppongono all’arrossamento degli spettri;
6. gli spettri dei residui prodotti da irraggiamento di ghiacci spiegano la varieta
spettrale dei corpi minori del Sistema Solare esterno (centauri, oggetti di Kuiper
o Trans-Nettuniani, comete) e indicano la presenza di un mantello superficiale di
materiale organico refrattario sulla gran parte di essi;
Per alcuni oggetti specifici, inoltre, ho potuto effettuare un’analisi piu dettagliata
nell’ambito delle collaborazioni sopra elencate, ottenendo i seguenti risultati:
7. ho sviluppato un modello di space weathering che, facendo uso delle costanti
ottiche dei silicati, permette di ricavare la composizione superficiale degli asteroidi e
il loro grado di alterazione; l’applicazione di questo modello all’asteroide 832 Karin
ha mostrato come i tempi-scala di irraggiamento stimati per questo oggetto siano
in accordo con l’eta dell’impatto che ne ha ringiovanito la superficie circa 5.8×10⁶
anni fa;
8. ho applicato i modelli di space weathering a due oggetti peculiari, l’asteroide
1951 Lick e il centauro 5145 Pholus, dimostrando che i risultati sperimentali simulano
correttamente l’arrossamento dei silicati sia in presenza di saturazione che di miscele
con ghiacci e materiali organici.
Va sottolineato infine che questa tesi fornisce anche utili strumenti di laboratorio
e di modellistica a supporto delle nuove e continue osservazioni effettuate da moderni
telescopi e missioni spaziali, che ci aiutano a comprendere la genesi ed evoluzione
del Sistema Solare.
Abstract
The majority of Solar System bodies does not have atmosphere or magnetic field;
these bodies are sometimes called “minor bodies”, and include asteroids, Trans-
Neptunian objects, dwarf planets, comets, and satellites of planets.
The surface of Solar System minor bodies not (or weakly) protected by atmo-
sphere or magnetic field, are continuously affected by the interaction with micro-
meteorites, solar wind particles, and high energy particles, coming from the Sun,
the Galaxy, or local magnetospheres (e.g. satellites of Jupiter and Saturn). This
interaction, known as “space weathering”, causes several effects.
Micro-meteorite bombardment chiefly induces: ablation (with partial re-deposition
of the vapor); thermal effects, formation of micro-craters. Irradiation by fast ions
(implantation) induces: modification of the target structure (e.g. amorphization);
compositional variations; surface sputtering.
Thus, space weathering processes also cause variations in the optical properties
of the surface materials of a body. This is revealed by the variations of the spectral
properties, that can be studied observing the solar light reflected from the surface.
Therefore, interpretation of the observed reflectance spectra requires the knowledge
of the mechanisms and processes determining the surface evolution.
An important role is played by laboratory experiments, that simulate the space
weathering processes and the corresponding spectral variations. Such analysis is
performed on materials that are good analogues of the minor bodies surface com-
ponents, mainly: silicates, ices, refractory carbonaceous materials. Analysis of me-
teorites is a particular and important case, being one of the few chances to study in
the laboratory materials coming from minor bodies.
6 Abstract
The main goal of this thesis is to investigate the space weathering processes, to
better understand how such energetic processing may have influenced the formation
and evolution of Solar System minor bodies. The approach is mainly experimental,
to characterize solid materials in the laboratory using transmission and reflection
spectroscopy in the UV-Vis-IR range, Raman and micro-Raman spectroscopy, and
in some case molecular and elemental analysis.
To simulate space weathering, I have used various techniques, in particular:
nano-pulsed UV laser irradiation and ablation (to simulate micro-meteorite im-
pacts); fast ion irradiation at different temperatures (to simulate cosmic ion ir-
radiation). The aim is to understand the physical mechanisms and evaluate the
corresponding astrophysical timescales.
During the experiments, I have used the setup at the Laboratorio di Astrofisica
(Dipartimento di Fisica, Universita del Salento - ex Universita di Lecce, Italy) and
at the Laboratorio di Astrofisica Sperimentale (INAF, Osservatorio Astrofisico di
Catania, Italy), in a collaboration project. The two laboratories are complemen-
tal, allowing a detailed analysis of the energetic processing and spectral variations
induced on silicates, ices, and carbons.
Laboratory data give invaluable support to interpret the large number of informa-
tion obtained by new generation telescopes and ongoing space missions. However, a
direct comparison between laboratory measurements and observations is not always
possible, since theoretical models are necessary. Consequently, in this thesis I have
also included theoretical efforts to model the reflectance spectra of minor bodies,
starting from the estimation of the optical constants of the “weathered” materials.
This allows to estimate the surface composition.
To this aim, I have collaborated with researchers from different institutes, in
Italy and abroad; this allowed me to work in several research centers, in particular
at Laboratoire d’Etudes Spatiales et d’Instrumentation en Astrophysique, Observa-
tory of Paris-Meudon (France), at Isaac Newton Group of Telescopes & Instituto
de Astrofısica de Canarias, Santa Cruz de la Palma (Spain), and at Dipartimento
di Astronomia and Osservatorio Astronomico di Padova. Furthermore, a specific
Agreement between NASA and Dipartimento di Fisica (Lecce), allowed me to spend
Abstract 7
about 4 months at NASA - Ames Research Center, CA (USA), where I developed
some models to calculate the optical constants of materials after ion and laser irra-
diation.
The main experimental results presented in this thesis are the following:
1. laser and ion processing of a large number of silicate-rich samples (terrestrial
and meteoritic) induces a substantial decrease of the spectral reflectance (darkening),
mainly in the UV-Vis range (reddening); this process is highly efficient, and is
probably caused by the formation of nanophase metallic iron inclusions in the surface
grains;
2. ion irradiation of carbon-rich ices (such as CH3OH, CH4, C6H6) causes a strong
variation of the chemical composition; this induces spectral reddening and darkening,
related to the destruction of the original molecules and consequent production of a
stable carbonaceous residue, even when mixed with H2O;
3. optical constants of some of these processed materials have been estimated,
to use them in the models.
From the comparison between laboratory data and observations of minor bodies,
the following results have been obtained:
4. the spectral reddening of silicates is able to reproduce the observed spectral
slopes for Near-Earth and Main Belt asteroids; consequently, it is possible to explain
the spectral mismatch between the most abundant meteorites (ordinary chondrites)
and their presumed parent bodies (S-type asteroids);
5. the astrophysical timescales (between the Earth orbit and the Main Belt) for
the reddening of S-type asteroids has been estimated to be about 105-106 years; this
also suggests a relatively high efficiency for the rejuvenating processes (e.g. impacts)
that oppose to the spectral reddening;
6. the spectra of residues (produced after irradiation of ices) explain the spectral
variety of minor bodies in the outer Solar System (centaurs, Kuiper Belt or Trans-
Neptunian objects, comets) and indicate the presence of a surface mantle composed
of organic refractory materials in the majority of these bodies;
In addition, for some peculiar bodies I have performed a more detailed analysis
(thanks to the collaborations mentioned above), with the following results:
8 Abstract
7. I have developed a space weathering model that, using the optical constants of
silicates, allow to estimate the surface composition of asteroids and their weathering
level; application of this model to asteroid 832 Karin showed that the irradiation
timescales that we estimate for this body are in agreement with the age of the impact
that rejuvenated the surface about 5.8×10⁶ years ago.
8. I have applied the space weathering models to two peculiar objects, i.e.
asteroid 1951 Lick and centaur 5145 Pholus, showing that the experimental results
correctly simulate the reddening of silicates, even in a saturation regime or when
silicates are mixed with ices and organic materials.
Finally, it must be stressed that this thesis provides useful laboratory and theo-
retical tools as a support for the new observations collected with modern telescopes
and space missions, that help us to understand the origin and evolution of the Solar
System.
Acknowledgments
I am gratefully and deeply indebted to all the people who have helped, supported,
and guided me during these last three years, but unfortunately there is no room here
to list them all individually. First and foremost I wish to thank my supervisors Vin-
cenzo Orofino and Giovanni Strazzulla, especially for their positive and constructive
criticism and discussions. I consider myself very lucky to have been guided by these
two scientists, who always provided invaluable personal and scientific support.
I warmly thank the groups of experimental Astrophysics in Lecce and in Catania.
From the continuos interaction with all these bright people, inside and outside the
laboratory, I received expertise, help, and a lot of encouragement. I am also grateful
to the technicians and researchers at the Department of Physics in Lecce and at
the Catania Observatory, who helped me several times in many ways during my
PhD courses and during the experiments. A special thank goes to the students that
shared with me the everyday struggle to get a job!
As a PhD student I have been allowed to travel (more than 100,000 km!) to
attend congresses and to work in foreign institutes. This has been an extraordinary
opportunity to improve my skills and knowledge, but also to enlarge my vision
meeting people from very different cultures. I thank the individuals and institutions
who gave financial support, in particular the groups in Lecce and Catania.
I wish to thank my colleagues and collaborators in Paris, Padova, Canary Islands,
and in the USA, especially Ted Roush at NASA ARC, for all the things I have
experienced and all I have learned from them. In particular, I am thankful to my
American and Spanish colleagues and friends, for teaching me also their wonderful
languages.
10 Acknowledgments
I owe much to my Italian and international friends, especially to those who hosted
and guided me during my stays and journeys. I have an exceptional thank to give
to the “scattered ones”, for the great moments we had.
I thank my close friends in Catania. During these three years, I have realized how
their powerful presence in my life has been absolutely fundamental to the realization
of this thesis, step by step, following our common ideals.
I am overwhelmed with gratitude and love to my family. From my parents and
my brother I received a constant and very important help in so many ways that it
is hard to describe.
Last but of course not least, I wish to thank Nadia, the person who gives meaning
to all my words and thoughts, since we share the same struggle and contradictory
love for science, knowledge, freedom, democracy, and all the other little things of
our everyday life. Through joy and pain, there is no way to measure the support
and love I received from her during the last three years.
Rosario Brunetto
April, 2007
Universita del Salento, Italy
Introduction
Immagina le stelle, scoprirai che sorridono sempre.
Immagina intensamente e vedrai dove gli altri pensano che non ci sia niente.
(Cristina Dona, Dove sei tu - 2003)
This thesis focuses on the space weathering processes in the Solar System, us-
ing mainly laboratory results, and applying them to observations through spectral
models.
In the first part I will introduce the space weathering issue related to the alter-
ation of surface composition, chemistry, and physics of minor bodies in the Solar
System. I will also review the present knowledge of the subject and the previ-
ous experimental results obtained in different laboratories. Then I will describe
the laboratory setup I have used: the main experimental facilities are the ones in
Lecce (Italy) at the Laboratorio di Astrofisica, Dipartimento di Fisica, Universita
del Salento, and in Catania (Italy) at the Laboratorio di Astrofisica Sperimentale,
Osservatorio Astrofisico di Catania (INAF).
In the second part I will discuss the main experimental results that I have ob-
tained after laser ablation and ion irradiation of silicates, ices, and meteorites. The
spectral modifications will be carefully analyzed and results will be compared with
previous experiments; a first glance to the astrophysical implications will be given.
The third part includes the application of the experiments to the observed surface
spectra of minor bodies, using various approaches. In some cases, optical charac-
terization of laboratory samples is performed to produce optical constants that are
input parameters for the spectral models. The case of a few peculiar objects is also
12 Introduction
discussed. This also allows to connect space weathering results to dynamical anal-
ysis, and to link surface properties to internal structure and physical properties of
asteroids.
The results described in this thesis are obtained through several collaborations
with various researchers and colleagues in Italy, France, Spain, USA, and Germany.
Most of the work has been published in peer reviewed journals (listed below).
Since English is not my native language, I wish to apologize for any mistake and
incorrect use of the language that the reader could find in this thesis.
Journal publications related to this thesis:
1. R. Brunetto, T.L. Roush, A.C. Marra, V. Orofino, 2007. Optical characteri-
zation of laser ablated silicates. Icarus, submitted.
2. P. Vernazza, M. Birlan, A. Rossi, E. Dotto, D. Nesvorny, R. Brunetto, S.
Fornasier, M. Fulchignoni, S. Renner, 2006. Physical characterization of the
Karin family. Astronomy and Astrophysics 460, 945-951.
3. R. Brunetto, P. Vernazza, S. Marchi, M. Birlan, M. Fulchignoni, V. Orofino, G.
Strazzulla, 2006. Modeling asteroid surfaces from observations and irradiation
experiments: The case of 832 Karin. Icarus 184, 327-337.
4. M. Lazzarin, S. Marchi, L.V. Moroz, R. Brunetto, S. Magrin, P. Paolicchi,
G. Strazzulla, 2006. Space Weathering in the Main Asteroid Belt: The Big
Picture. The Astrophysical Journal Letters 647, L179-L182.
5. R. Brunetto, M.A. Barucci, E. Dotto, G. Strazzulla, 2006. Ion irradiation of
frozen methanol, methane, and benzene: linking to the colors of Centaurs and
Trans-Neptunian objects. The Astrophysical Journal 644, 646-650.
6. P. Vernazza, R. Brunetto, G. Strazzulla, M. Fulchignoni, P. Rochette, N.
Meyer-Vernet, I. Zouganelis, 2006. Asteroid colors: a novel tool for mag-
netic field detection? The case of Vesta. Astronomy and Astrophysics Letters
451, L43-L46.
Introduction 13
7. R. Brunetto, F. Romano, A. Blanco, S. Fonti, M. Martino, V. Orofino, C.
Verrienti, 2006. Space weathering of silicates simulated by nanosecond pulse
UV excimer laser. Icarus 180, 546-554.
8. R. Brunetto, G. Strazzulla, 2005. Elastic collisions in ion irradiation experi-
ments: A mechanism for space weathering of silicates. Icarus 179, 265-273.
9. S. Marchi, R. Brunetto, S. Magrin, M. Lazzarin, D. Gandolfi, 2005. Space
weathering of near-Earth and main belt silicate-rich asteroids: observations
and ion irradiation experiments. Astronomy and Astrophysics 443, 769-775.
10. R. Brunetto, G.A. Baratta, M. Domingo, G. Strazzulla, 2005. Reflectance and
transmittance spectra (2.2-2.4 µm) of ion irradiated frozen methanol. Icarus
175, 226-232.
11. G. Strazzulla, E. Dotto, R. Binzel, R. Brunetto, M.A. Barucci, A. Blanco,
V. Orofino, 2005. Spectral alteration of the meteorite Epinal (H5) induced by
heavy ion irradiation: a simulation of space weathering effects on Near Earth
Asteroids. Icarus 174, 31-35.
12. R. Brunetto, G.A. Baratta, G. Strazzulla, 2005. Amorphization of diamond by
ion irradiation: a Raman study. Journal of Physics: Conference Series, Vol.
6, Issue 1, 120-125.

Part I
The surface of minor bodies

Chapter 1
Surface composition andprocessing
Our knowledge of the Solar System is evolving rapidly after the discovery of
several new bodies in the last decades.
On 24 August 2006, the International Astronomical Union (IAU) has voted a
resolution (IAU Resolution 5, 2006) that gives a new definition of what a planet is:
1. it is a celestial body in orbit around the Sun,
2. it has sufficient mass for its self-gravity to overcome rigid body forces so that
it assumes a hydrostatic equilibrium (nearly round) shape, and
3. has cleared the neighborhood around its orbit.
According to this new definition, there are currently eight planets in the Solar
System. The IAU also resolved that bodies in the Solar System (except satellites)
must be divided into three distinct categories: planets, dwarf planets, and small
Solar System bodies. In particular, a non-satellite body fulfilling only the first two
of these criteria is classified as a dwarf planet; a non-satellite body fulfilling only
the first criterion is classified as small Solar System body.
The IAU has officially identified three celestial bodies that have immediately
received the dwarf planet classification: Eris (see below), Ceres (the largest Main-
Belt asteroid), and Pluto, which has lost its status of planet. Other bodies might
be added to the list once it has been determined whether they are in hydrostatic
equilibrium or not. Consequently, all other objects, except satellites, orbiting the
18 1. Surface composition and processing
Sun are now referred to collectively as small Solar System bodies. These currently
include the classical asteroids (except for Ceres), most Trans-Neptunian Objects
(TNOs), the centaurs, all comets, and other small bodies.
When I began my Ph.D. courses in May 2004, the discovery of 2003 UB313 (later
named Eris, the largest TNO and dwarf planet) was still to be announced, and
Pluto was still considered a planet1. I started my research in the space weathering
area, assuming that my experiments would be applied to a large number of “minor
bodies”, including asteroids, comets, TNOs, etc.
Now that we have new definitions for planets, dwarf planets, and small Solar
System bodies, the use of the term “minor body” may sound confusing. However,
in this thesis I will keep using it, with the following warning: I call “minor body”
a body not (or weakly) protected by an atmosphere or a magnetic field, so that its
surface is exposed to the bombardment by micro-meteorites and solar wind ions.
This is to specify that the space weathering experiments that I will describe in
the following sections apply to any body that has its surface exposed to significant
amount of dose by weathering agents. Consequently, the objects that I am primarily
interested in include not only the small Solar System bodies, but also the dwarf
planets, many satellites2 and even one planet, i.e. Mercury.
Generally speaking, the surfaces of minor bodies are rich in silicates, ices, and
carbons3. Bodies in the inner Solar System are usually enriched in silicates, while
ices become dominant in the surface of outer objects.
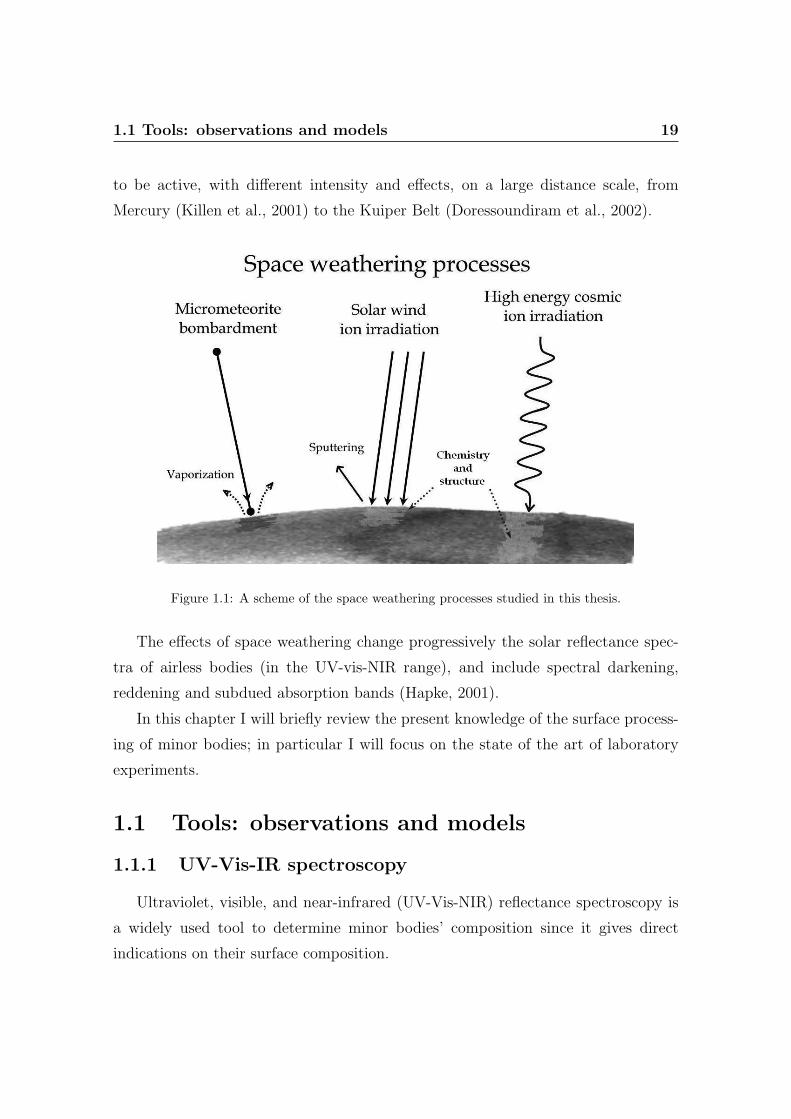
Irradiation by cosmic and solar wind ions and bombardment by interplane-
tary dust (micrometeorites) are processes believed to induce space weathering (see
Fig. 1.1), i.e., time-related processes able to change progressively the solar reflectance
spectra of airless planetary surfaces. These two processing mechanisms are believed
1It is probable that the definition of planet will change again in the future, and it is possiblethat new categories will need to be introduced, especially when a more detailed comprehension ofextra-solar systems and solid bodies formation and evolution will be achieved. Luckily, definitionschange with time, as this witnesses that our knowledge continues evolving.
2Some satellites have physical and compositional characteristics very close to those of asteroidsor TNOs. For a few objects, the possibility of a gravitational capture by the planets has beenexplored.
3In this thesis I will not deal with dynamical properties and classifications of minor bodies. Themain topic will be the surface composition.
1.1 Tools: observations and models 19
to be active, with different intensity and effects, on a large distance scale, from
Mercury (Killen et al., 2001) to the Kuiper Belt (Doressoundiram et al., 2002).
Figure 1.1: A scheme of the space weathering processes studied in this thesis.
The effects of space weathering change progressively the solar reflectance spec-
tra of airless bodies (in the UV-vis-NIR range), and include spectral darkening,
reddening and subdued absorption bands (Hapke, 2001).
In this chapter I will briefly review the present knowledge of the surface process-
ing of minor bodies; in particular I will focus on the state of the art of laboratory
experiments.
1.1 Tools: observations and models
1.1.1 UV-Vis-IR spectroscopy
Ultraviolet, visible, and near-infrared (UV-Vis-NIR) reflectance spectroscopy is
a widely used tool to determine minor bodies’ composition since it gives direct
indications on their surface composition.
20 1. Surface composition and processing
The solar incident flux reaching an airless body surface is split in two contri-
butions: the reflected and the absorbed part, whose ratio depends on the surface
albedo, which is a complex function of the optical properties, grain size, and other
scattering parameters. The observer receives both the light reflected from the sur-
face and the black-body emission, that is function of its temperature. Generally
speaking, reflected sunlight dominates the spectrum in the Vis-NIR range, while the
contribution of thermal emission becomes more important at longer wavelength.
Luckily, many diagnostic features that come from electronic and vibrational tran-
sitions within minerals or molecules are detectable in the 0.25-2.50 µm spectral
range. Thanks to laboratory calibrations, it is possible from the observed features
to establish the presence of specific minerals or species on the surface, and in some
instances to get information about important parameters, like temperature, density,
solid state structure, etc.
The possibility of revealing a feature depends of course on the abundance of
the particular species and on the strength of the feature itself (sometimes called
absorbance). Thanks to new generation telescopes, a large number of species are
being detected (see discussion below). Starting from high quality spectra of a given
mixtures, the average composition and relative abundances can be also determined
my means of scattering models (see below). Hence, it is clear that it is possible to
get a huge amount of compositional data on minor bodies’ surface materials through
reflectance spectroscopy.
1.1.2 Hapke and Shkuratov theories
Minor bodies’ surfaces are composed of several to many different minerals. De-
convolving a reflectance spectrum to mineral abundance in an unambiguous way is
difficult, because the spectra are complex nonlinear functions of grain size, abun-
dance, and material opacity (Poulet et al., 2002).
Multiple scattering models can provide approximate solutions to the radiative
transfer in a particulate medium. The optical constants of the considered materials
are important input parameters for those models, and must be carefully measured
1.1 Tools: observations and models 21
in the laboratory. They serve as the basis for the calculation of the necessary
absorption and scattering efficiencies for different size and shape distributions of the
dust particles.
In the literature, the two mainly used scattering theories (based on the equiv-
alent slab model) are the Hapke theory (Hapke, 1981) and the Shkuratov theory
(Shkuratov et al., 1999). A detailed and interesting comparison between these two
models has been performed by Poulet et al. (2002). I will use both theories in the
third part of the thesis.
The Hapke theory was one of the first to derive the single scattering albedo for
a grain of given size and refractive index and to provide this critical element in a
simple and straightforward way. Because of this simplicity, this has become the
dominant theory used in the planetary community. Shkuratov et al. (1999) applied
a similar form of statistical approach to calculate the albedo of a typical grain, but
the approach after that point is different. Poulet et al. (2002) found that their main
difference is the role of the phase function of individual particles of regolith, which
is predicted (and generally forward directed) in the case of the Shkuratov model
instead of being a free parameter as formulated in the Hapke model.
It is interesting to note that both models are invertible. In particular, Hapke and Wells
(1981) and Clark and Roush (1984) describe an approach to determination of the
absorption coefficient, α, of a given material starting from its measured reflectance
spectra. Since α is related to k via the dispersion relation, α = 4πk/λ, this approach,
that relies upon Hapke’s description of radiative transfer within particulate surfaces
(see Hapke (1981), Hapke (1986), and Hapke (1993), and references therein), pro-
vides a useful mechanism of determining k. An example of this will be given in the
last part of this thesis.
1.1.3 Results from space missions
Space missions are a powerful tool to study minor bodies in the Solar System.
Once a spacecraft arrives in the proximity of a body, it usually collects an incredibly
huge amount of data through the several instruments onboard.
22 1. Surface composition and processing
In this thesis I will not deal with space mission results. However, it is mandatory
to stress that results described in this work can be useful when interpreting data from
spacecrafts (especially spectroscopical data). Laboratory experiments and ground-
based observations give invaluable support to scientists working on space mission
data. In particular, I would like to number the main space missions currently in
flight, or ready to be launched, that can have strong scientific connection with the
work of this thesis:
1. Cassini-Huygens, a joint NASA/ESA/ASI space mission intended to study
Saturn and its moons, that is already sending us extraordinary results about
the saturnian satellites.
2. Rosetta, a ESA-led space mission, launched in 2004, intended to study the
comet 67P/Churyumov-Gerasimenko; Rosetta will also fly-by two asteroids
(2867 Steins and 21 Lutetia).
3. New Horizons, a NASA mission to Pluto and its moons (and eventually one or
more other TNOs), successfully launched on January 19, 2006; it is expected
to arrive at Pluto in July 2015.
4. Dawn, a NASA space mission ready to be launched; it is an orbiting space
probe that will visit and study the two most massive members of the asteroid
belt, the dwarf planet Ceres and the asteroid Vesta.
Other missions that may be related to this work are several missions to the Moon,
or missions that successfully visited asteroids (e.g. NEAR Shoemaker that stud-
ied the near-Earth asteroid Eros, or Hayabusa that visited the near-Earth asteroid
Itokawa). It is also worth to mention BepiColombo (currently under development),
a joint ESA/JAXA mission planned to reach Mercury.
1.2 Space weathering of silicates
The first zone of the Solar System, known as the inner Solar System, includes
the four terrestrial planets, the main asteroid belt, and the Near-Earth Asteroids
1.2 Space weathering of silicates 23
(NEAs). There are hundreds of thousands of currently known asteroids in the main
belt between Mars and Jupiter 4. Asteroids are rocky objects of different dimensions
and irregular shape (except for a few of them that might have reached the hydrostatic
equilibrium), thought to be remnants of the planetesimals that formed at the origin
of the Solar System.
When an asteroid collisional fragment enters the terrestrial atmosphere, the fric-
tion heats it up, and it is partially disrupted; the possible rock debris that reaches
the ground is called “meteorite”. Thus, a powerful tool to study asteroids is the
laboratory analysis of meteorites.
The spectra of many asteroids are dominated by silicate features. The main
species observed are olivine, clinopyroxene and orthopyroxene, spinel, feldspar and
hydrated phyllosilicates. Iron-Nickel metals can also be present. In a certain number
of bodies, a contribution from organic compounds can be observed, producing a
featureless spectrum and a relatively low albedo. Several asteroids are composed of
mixture of these minerals.
As I discussed above, studying the surface spectra, in most cases we can detect
mineralogical signatures characteristic of a particular species. Since the spectral
parameters of the different absorption features (i.e. band peak position, band ar-
eas) are related to a specific composition of the considered mineral, information
on elemental abundance can often be obtained, such as the Mg/Fe ratio or the Ca
content.
However, the spectra of asteroids are also influenced by the effects of the space
environment, that alters the optical properties of airless bodies’ surfaces. A number
of physical processes have been proposed as relevant in this context (e.g. microm-
eteoroid impacts, solar wind bombardment, etc.). The result of all these effects on
airless bodies is known as “space weathering”.
Space weathering was initially studied on lunar soils (Pieters et al., 1993), since
lunar soils returned from Apollo missions have optical properties that differ signifi-
cantly from those of pristine lunar rocks (Conel and Nash, 1970). Cassidy and Hapke
4Again, definitions vary in space and time, so asteroids are sometimes called “planetoids”.Near-Earth Objects with diameter lower than 50 m are called “meteoroids”.
24 1. Surface composition and processing
(1975) suggested the presence of metallic iron particle coatings on lunar soils; these
coatings should be produced by deposition of atoms sputtered by solar wind particles
and deposition of gaseous species produced by micrometeoritic impacts. Pieters et al.
(2000) analyzed the products of space weathering of lunar soils, and demonstrated
that nanophase reduced iron is produced on the surface of grains by a combination
of vapor deposition and irradiation effects 5.
Space weathering was proposed also by Chapman (1996) to explain the surface
variations of asteroid 243 Ida measured by the Galileo spacecraft. According to
this description, space weathering is a progressive change in the surface color of an
atmosphere-less body which becomes darker and darker in time, while its reflectance
spectrum becomes redder.
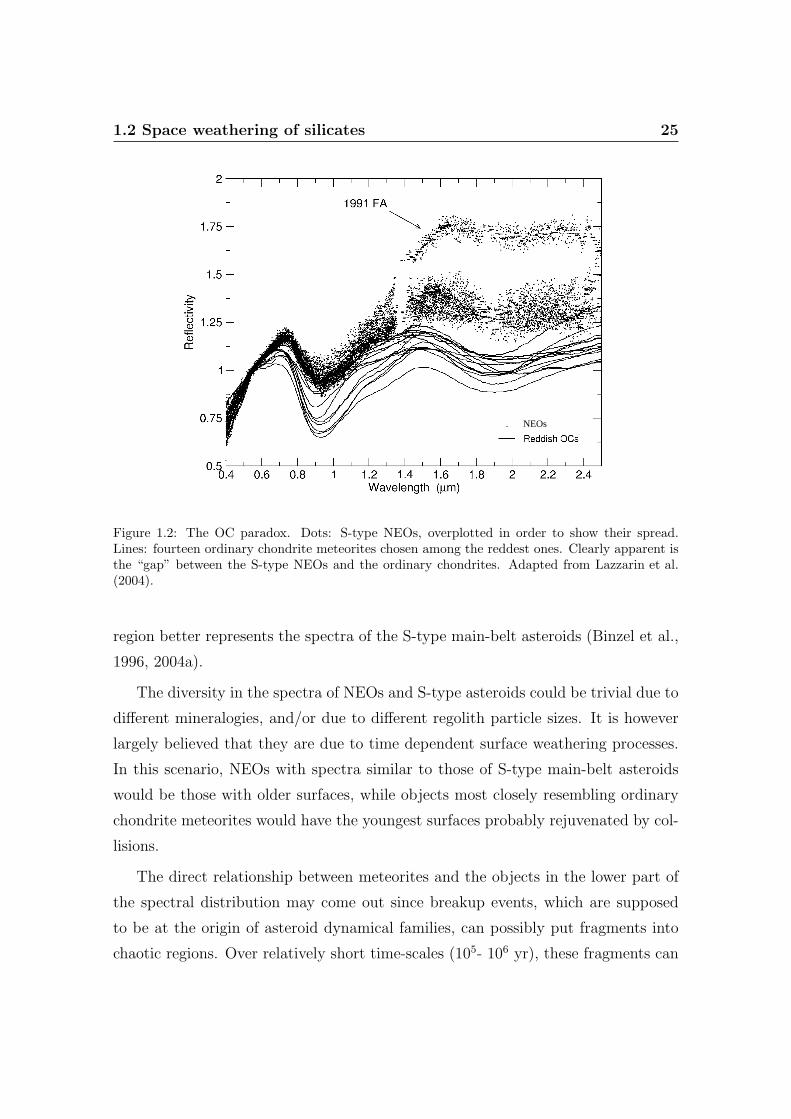
Furthermore it has been suggested that space weathering can be responsible for
the puzzling and significant mismatch (see Fig. 1.2) between the spectra of the most
populous class of meteorites (ordinary chondrites, OC) and the surface spectra of S-
type NEOs (Near Earth Objects) and MBAs (Main Belt Asteroids), their presumed
asteroidal parent bodies (Jedicke et al., 2004; Lazzarin et al., 2004).
In fact, space weathering processes have been often invoked to explain the spec-
tral diversity among objects of the same population, e.g., main-belt asteroids be-
longing to dynamical families, near-Earth objects (NEOs), trans-neptunian objects
(TNOs) and centaurs. Several authors (Doressoundiram et al., 1998; Florczak et al.,
1998; Lazzaro et al., 1999) pointed out that the spectra of MBAs belonging to a sin-
gle dynamical family show a continuous spread of spectral slopes, and the lower part
of the variation range is consistent with the spectra of ordinary chondrite meteorites.
This can be due to a compositional effect, or it can be interpreted as due to different
space weathering alteration states of the surfaces and as an indication that collisions
may have rejuvenated part of the family.
Ordinary chondrites have spectral properties that are at the lowest part (least red
sloped) of the range of variation of the spectral properties of NEOs, while the upper
5In a recent paper, Moretti et al. (2005) suggest an alternative process for surface alteration ofairless bodies, through a shock-induced phase transformation of Fe-Ni alloys. This process will notbe investigated in this thesis.
1.2 Space weathering of silicates 25
NEOs
Figure 1.2: The OC paradox. Dots: S-type NEOs, overplotted in order to show their spread.Lines: fourteen ordinary chondrite meteorites chosen among the reddest ones. Clearly apparent isthe “gap” between the S-type NEOs and the ordinary chondrites. Adapted from Lazzarin et al.(2004).
region better represents the spectra of the S-type main-belt asteroids (Binzel et al.,
1996, 2004a).
The diversity in the spectra of NEOs and S-type asteroids could be trivial due to
different mineralogies, and/or due to different regolith particle sizes. It is however
largely believed that they are due to time dependent surface weathering processes.
In this scenario, NEOs with spectra similar to those of S-type main-belt asteroids
would be those with older surfaces, while objects most closely resembling ordinary
chondrite meteorites would have the youngest surfaces probably rejuvenated by col-
lisions.
The direct relationship between meteorites and the objects in the lower part of
the spectral distribution may come out since breakup events, which are supposed
to be at the origin of asteroid dynamical families, can possibly put fragments into
chaotic regions. Over relatively short time-scales (105- 106 yr), these fragments can
26 1. Surface composition and processing
become NEOs or meteorites.
1.2.1 Solar wind and cosmic ions
The importance of simulating solar wind irradiation in studying the changes of
the optical properties of airless body surfaces has been known since a long time
(Cassidy and Hapke, 1975). Yet a limited number of laboratory experiments have
been performed to simulate space weathering effects on silicate materials.
A number of laboratory experimentalists have tried to simulate the effects of
space weathering on asteroid material analogues.
Ion irradiation of silicate samples has been performed using mainly H+ and He+
ions at keV energies (Hapke, 2001). Dukes et al. (1999) irradiated olivines: they
did not find any significant spectral change and interpreted this as due to the re-
oxidation of iron once removed from the vacuum chamber. Yamada et al. (1999)
performed high energy (MeV) proton implantation, producing only small changes
in the spectra.
It is known that the presence of reduced iron increases the spectral slope and de-
creases the depth of the 1 µm band of a mafic material spectrum (see Shkuratov et al.
(1999)). Thus a principal factor in producing spectral changes is thought to be the
sputtering of iron from iron-bearing silicates due to ion irradiation and the deposi-
tion of nanophase neutral Fe on adjacent grains (Hapke, 2001).
1.2.2 Micrometeorites bombardment
Laboratory simulations have been performed on asteroid-like materials simulat-
ing solar wind and cosmic ion irradiation by keV-MeV ion irradiation, and assuming
that micrometeorite bombardment can be simulated by pulsed laser irradiation.
Ion irradiation experiments can be considered a direct reproduction of solar
wind irradiation effects; on the contrary, laser irradiation is assumed to simulate
micrometeoroid impacts, but the confidence of this assumption is somewhat unclear.
The most important point for a correct simulation by laser irradiation is the use of
nanosecond pulses, in order to reproduce the duration of the vaporization process
1.2 Space weathering of silicates 27
induced by micrometeorite impacts.
Laser irradiation effects are known to vary widely, depending on the wave-
length of the incident laser beam, on the energy fluence (J/cm2) of the single
pulse, on the pulse duration, on the repetition rate, on properties of the target,
etc. (Chrisey and Hubler, 2004). In particular varying the laser fluence, it is possi-
ble to distinguish two main regions: at low fluence, laser irradiation induces mainly
thermal and chemical effects, on the contrary ablation occurs when the laser-light
intensity is high enough to induce significant material vaporization so that a dense
vapor plume is formed. The threshold fluence value to achieve ablation strongly
depends on the properties of the target and on the laser parameters: with inorganic
insulators and strong-to-medium absorption, threshold fluence is typically between
0.5 and 2 J/cm2 per pulse (Bauerle, 2000), valid for nanosecond pulsed laser. Indeed,
the threshold value is not independent on the pulse duration.
Furthermore, achieving the congruent ablation regime depends not only on ex-
perimenting above the threshold, but also on letting the laser radiation being ab-
sorbed in the very upper layers (few tens of nanometers) of the material, to avoid
the uncontrolled heating of the surrounding target.
Actually, the first experiments to simulate space weathering of OCs (Moroz et al.,
1996) were performed using microsecond pulsed laser irradiation. The effect was to
redden and darken reflectance spectra and also to produce a shift in the peak posi-
tion of the 1 µm absorption band. Nevertheless, the laser pulse duration was much
longer than the reasonable timescale of micrometeorite (1-10 µm size) impacts, and,
according to Sasaki et al. (2001), the resultant spectral changes should be ascribed
to glass formation. A shorter pulse duration (6-8 ns) was consequently used in
a number of experiments described by Yamada et al. (1999), Sasaki et al. (2001),
and Hiroi and Sasaki (2001). They used a nanosecond pulsed Nd-YAG laser (1064
nm) on pellets of pressed silicate powder, inducing vaporization and redeposition
processes. This was supposed to well simulate dust impact, also because of the
comparable duration of the pulse (6-8 ns).
Such experiments showed progressive (increasing the shot number) darkening
and reddening of the UV-vis-NIR silicate spectra, whose comparison with asteroid
28 1. Surface composition and processing
spectra led to a time-scale for this process (in the near-Earth space) of about 108 yr.
They attributed the observed spectral weathering to formation of coating enriched
in vapor-deposited nanophase iron (Sasaki et al., 2001).
It is well know that the characteristic of the ablation process strongly depends
on laser parameters, and target properties. The interaction between radiation and
matter (as ruled by the considered regime) depends on the particular balance of
optical properties, laser fluence, duration of the pulse, wavelength of the laser, etc.
In particular, when an infrared Nd:YAG laser (1064 nm) is considered, like in the
experiments of Yamada et al. (1999) and Sasaki et al. (2001), pulsed laser ablation
can simply be treated as a thermal process: infrared laser light excites vibrations
(related to defects, impurities or the solid surface itself) and the thermalization of
the excitation energy is so fast that the laser can simply be considered as a heat
source.
With these sources at high laser light intensities (> 108 W/cm2), the interaction
between the laser light and the induced plasma is dominant. The excitation energy
is instantaneously transformed into heat, and the resulting increase of temperature
changes the optical properties of the material, and the amount of absorbed laser
power. In this regime, the irradiated material becomes absorbing at any wavelength
due to surface breakdown and plasma formation. The temperature rise can result
in thermal ablation.
A typical problem with infrared lasers is a surface damage due to uncontrolled
melting or ablation of the target; moreover the temperature rise induces stresses
which can also affect the optical properties of the surrounding materials. With
ultraviolet laser radiation the situation can be quite different. If the photon energy
is high enough, laser light excitation can result in a direct bond breaking: as a
consequence, single atoms, molecule clusters, and/or fragments desorb from the
surface. Furthermore, high photon energies (i.e. short wavelength) allow spatially
well defined and stoichiometric ablation (congruent ablation), rapid heating and
cooling rates with low damage of the surrounding materials.
1.3 Ices: chemistry and colors 29
1.3 Ices: chemistry and colors
Ices are thought to be dominant on the surface of objects in the outer Solar
System. The Vis-NIR spectra of some centaurs and TNOs (or Kuiper Belt objects,
KBOs) indicate that their surfaces are rich with simple molecules such as H2O, N2,
CO2, CH4 , and CH3OH.
Water ice and methane ice have been easily detected due to their relatively
strong spectral features. For instance, water ice has been observed on the cen-
taurs Pholus (Cruikshank et al., 1998) and Chiron (Luu et al., 2000), and on KBOs
Quaoar (Jewitt and Luu, 2004) and Orcus (Fornasier et al., 2004; de Bergh et al.,
2005). Methane (CH4) is present on Pluto (Owen et al., 1993), on TNO 2005 FY9
(Licandro et al., 2006), and probably on the TNO Sedna (Barucci et al., 2005).
Other species and interesting ice mixtures have been observed on TNOs, Pluto,
Eris, and other objects such as short-period comets, centaurs, and Triton. Methanol
(CH3OH) bands have been possibly identified on Pholus (Cruikshank et al., 1998),
as discussed below. For some objects, there are indications of an inhomogeneous
surface (see, e.g., Licandro and Pinilla-Alonso (2005)). Benzene (C6H6) has not
been observed on TNOs or centaurs; in this thesis, it is used as a template for
aromatic compounds.
1.3.1 Chemistry of mixtures
Many comets 6 have very elliptical closed orbits, and spend most of time very
far from the Sun. Comets have a composition, measured in the gas phase from
sublimating molecules, to some extent similar to that observed on icy grains mantles
in dense molecular clouds. They are water-rich with significant contribution of CO2,
6The distinction between comets and asteroids is controversial; originally comets were identifiedbecause of their activity. A comet is a small body that, due to the effects of solar radiation uponthe nucleus, exhibits a coma and/or a tail. The nucleus is a minor body composed of rock, dust,and ices. Thus, comet surfaces should be composed also by volatile materials, besides the samerocks as the asteroids. For this reason, the word comet is often associated with the outer SolarSystem, while the word asteroid is associated with the inner Solar System. However, there areobjects that show asteroidal characteristics during a long time, and comet-like activity for limitedamount of time. Thus, from the point of view of the processing (i.e. the subject of this thesis), amore important distinction should be made between silicate-rich and ice-rich objects.
30 1. Surface composition and processing
CO, methanol and other hydrocarbons. Comets appear to be nitrogen poor.
On the other hand the surface of Pluto and Triton are nitrogen rich although,
locally, ice segragation could have formed surface spot rich in different molecules.
In addition to the dominant solid nitrogen and solid methane, CO and CO2 have
been detected on Triton’s surface. Pluto has some CO and no CO2.
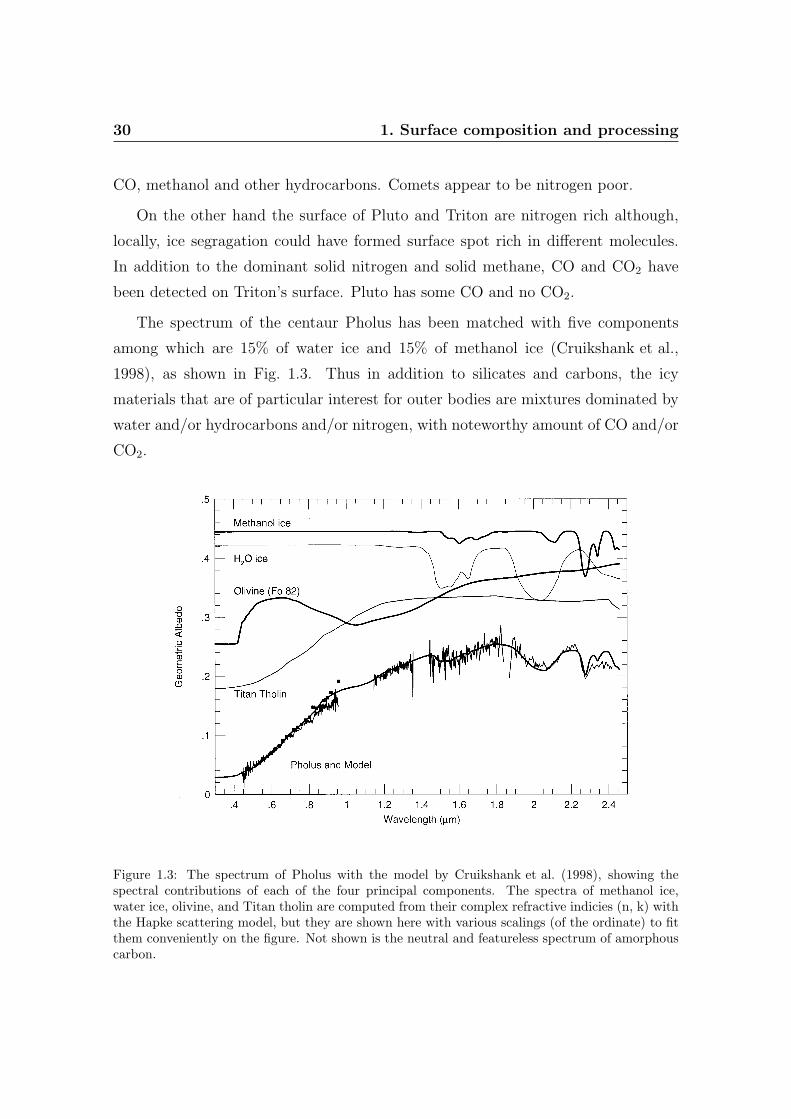
The spectrum of the centaur Pholus has been matched with five components
among which are 15% of water ice and 15% of methanol ice (Cruikshank et al.,
1998), as shown in Fig. 1.3. Thus in addition to silicates and carbons, the icy
materials that are of particular interest for outer bodies are mixtures dominated by
water and/or hydrocarbons and/or nitrogen, with noteworthy amount of CO and/or
CO2.
Figure 1.3: The spectrum of Pholus with the model by Cruikshank et al. (1998), showing thespectral contributions of each of the four principal components. The spectra of methanol ice,water ice, olivine, and Titan tholin are computed from their complex refractive indicies (n, k) withthe Hapke scattering model, but they are shown here with various scalings (of the ordinate) to fitthem conveniently on the figure. Not shown is the neutral and featureless spectrum of amorphouscarbon.
1.3 Ices: chemistry and colors 31
Therefore ion irradiation experiments can be performed on relevant mixtures, to
predict the presence of still undetected species. For instance, irradiation of H2O:N2
mixtures leads to the formation of N2O, NO and NO2 (Strazzulla et al., 2003a).
Although nitrogen and water are likely to be rapidly spatially segregated, because
of their very different thermodynamic properties, it is possible that, due to seasonal
sublimation and re-condensation observed for example on Pluto and Triton, the
highly volatile nitrogen is deposited on the entire surface of the objects, i.e. including
the water-rich spots. It has been shown that N2 condensed on amorphous water ice
diffuses in at temperatures of about 30 K thus realising an H2O:N2 mixture. This
is demonstrated by the appearance of a sharp water feature in the IR spectra at
about 1.88 µm that is easily distinguishable from the broad one of polymeric water
centered at about 2 µm (Palumbo and Strazzulla, 2003).
Irradiation of H2O:CH4:N2 mixtures leads to the formation of several species
among which carbon dioxide, carbon monoxide, HCN, HNCO, N2O and CN bearing
species (Palumbo et al., 2004). The formation of several new species among which
carbon dioxide and suboxides, nitrogen oxides, and a number of CN bearing species
have been also observed in irradiated CO:N2, CH4:N2 and CO:CH4:N2 mixtures
(Moore et al., 2003; Palumbo et al., 2004). Laboratory experiments have also shown
that carbonic acid (H2CO3) can be expected on objects with surface areas rich in
H2O:CO2 mixtures (Brucato et al., 1997).
1.3.2 C-rich species
In this thesis I will report the results of new irradiation experiments on C-rich
ices. These species play a very important role in determining the spectral behavior
of interstellar grains as well as of outer Solar System objects.
Solid methanol (CH3OH) is thought to be present both in frozen mantles on
interstellar grains and on some objects in the outer Solar System. Icy mantles on
interstellar dust particles, inside dense molecular clouds (T ∼ 10-20 K), and par-
ticularly in the circumstellar region around forming massive stars, contain CH3OH
among other simple molecules, such as H2O, CO, and CO2. Different absorption
32 1. Surface composition and processing
features, assigned to solid methanol after comparison with laboratory spectra, have
been identified along several lines of sight of obscured IR sources (Dartois et al.
(1999); Keane et al. (2001), and references therein).
Methanol, or some other simple molecule exhibiting C-H stretching, deformation
and combination modes, has also been suggested to be present in some objects in the
outer Solar System, such as comets (Mumma et al., 1993) and centaur 5145 Pholus
(Cruikshank et al., 1998). Methanol has been observed in the coma of comets as
gas phase species most likely directly sublimated from the nucleus. Its abundance
has been estimated to be on the order of few percent with respect to the dominant
water ice (Mumma et al., 1993), and varies among different comets, some appearing
to be CH3OH rich.
Methanol has been tentatively identified on Pholus (Fig. 1.3): Cruikshank et al.
(1998) observed the methanol band around 2.27 µm, although the band around 2.34
µm has not been observed, and modeled near-IR spectra with a multicomponent
ensemble containing both refractories (silicates and carbons) and ices (water and
methanol). More recently Cruikshank et al. (2003)) used the scattering theories of
Hapke and Shkuratov to model the reflectance spectra and colors of Kuiper belt and
centaur objects.
Both theories yielded good models of the reflectance spectrum of the centaur
Pholus using five components, although the derived abundances differed widely.
The abundance of methanol would be comparable to that of water ice (between 30
and 100% with respect to water). Presumably this can be true only for surface layers
(not the whole object). This implies that, if the identification is correct, thermal
processing has occurred and the analyzed surface layers are strongly enriched in
methanol.
Both in the case of comets and of Pholus, methanol could be directly aggregated
from the ices in the pre-solar nebula and, in any case, could be subjected to ion
bombardment from different cosmic ion populations in the various stages of evo-
lution (pre-solar dust in the interstellar medium, pre-solar nebula, comet or solid
object in the outer Solar System; e.g., Strazzulla (1997)). Several studies on the ef-
fects of energetic processing (ions and UV photons) of solid methanol and mixtures
1.3 Ices: chemistry and colors 33
with other species have been done (Baratta et al. (2002); Hudson and Moore (2000);
Palumbo et al. (1999), and references therein). Palumbo et al. (1999) showed that
the profile of the CH3OH bands varies with increasing ion fluence and, in partic-
ular, their relative intensities change strongly. IR transmittance spectroscopy has
however mostly been conducted in a spectral range (2.7- 25 µm) where bands due
to the fundamental vibrations are detectable (more interesting for application to
interstellar ices).
Acethylene (C2H2), ethane (C2H6), and methane (CH4), have been observed on
several comets (Mumma et al., 1996, 2000, 2001). Ethane and acetylene are possibly
present as condensates in Titan’s stratosphere (Coustenis et al., 1999), and, perhaps
mixed with dominant frozen nitrogen, on Triton and Pluto (Bohn et al., 1994).
Methane is present in dense molecular clouds (Lacy et al., 1991; Boogert et al.,
1996, 1997), and on several objects in the outer Solar System. Owen et al. (1993)
confirmed the presence of solid CH4 on Pluto, while Doute et al. (1999) showed that
the best model requires a fine grained segregated CH4 layer covering a compact
polycrystalline substrate dominated by N2 with small amount of CO (0.1-0.2%)
and CH4 (0.5%). Also the NIR spectrum of Triton indicates the presence of CO,
CO2, and CH4 together with the dominant nitrogen ice (Cruikshank et al., 1993).
Saturated hydrocarbons, although not yet detected, could be formed on interstellar
grains by hydrogen addition (Mumma et al., 1996) or by energetic processing such
as UV and ion irradiation. Cometary ices could however be re-processed by ion
bombardment in the Solar System before, during and after the formation of comets
themselves (Moore, 1999; Strazzulla, 1997; Strazzulla and Johnson, 1991).
1.3.3 A wide spread of colors
Minor bodies in the outer Solar System show a great variety of spectral colors
(Doressoundiram et al., 2002; Peixinho et al., 2004). In particular, some centaurs
and trans-Neptunian objects (TNOs) are very red (higher reflectance at higher wave-
length), because of what has been labeled “ultrared matter” (Jewitt, 2002).
The wide range of visible and near-infrared spectral behaviors observed can be
34 1. Surface composition and processing
only partially explained by a different composition. A number of processes are active
in the Solar System that could alter the surface properties of atmosphereless bodies.
Consequently, it is widely believed that a competition between aging (e.g., cosmic
ion irradiation) and rejuvenating (e.g., impacts with space debris, cryovolcanism,
etc.) processes produces the observed color distribution (Luu and Jewitt, 1996).
Some laboratory experiments on species considered to be good analogs of minor
bodies surface materials have attempted to simulate the space weathering processes.
In particular, ion irradiation experiments have demonstrated that solar wind and
cosmic ion irradiation can be very efficient mechanisms in reddening Vis-NIR re-
flectance spectra of silicates (Strazzulla et al., 2005; Marchi et al., 2005). However,
when starting from a red material, such as a bitumen (asphaltite, kerite), the weath-
ering trend is inverted: ion irradiation tends to flatten the spectrum in the Vis-NIR
range (Moroz et al., 2004a).
In ion irradiation of both silicates and bitumens, an important role is also played
by elastic (nuclear) collisions between ions and target nuclei (Brunetto and Strazzulla,
2005; Moroz et al., 2004a).
1.4 Bitumens and other organics
1.4.1 The organic crust
As simulated by laboratory experiments, simple molecules are destroyed by en-
ergetic particles and by UV photons, with consequent decrease of their band intensi-
ties (Brunetto et al., 2005a) and formation of other molecules (Palumbo et al., 1999;
Moore et al., 2003). Furthermore, when carbon is present, an organic residue is syn-
thesized that may produce a crust of refractory material, as in the case of comets
in the Oort cloud (Strazzulla and Johnson, 1991; Strazzulla, 1997; Strazzulla et al.,
1991, 2001).
These laboratory experiments revealed that when the carbon content is signifi-
cant, ion irradiation leads to the formation of an organic residue that is left over the
substrate after warm up to room temperature. The results indicate that whatever
the initial hydrocarbon is, it is converted to a refractory insoluble residue.
1.4 Bitumens and other organics 35
Based on these experimental results, it has been suggested that a comet exposed
to background particle irradiation develops an outer web of non-volatile material
(Johnson et al., 1987) which will lead to the formation of an organic crust, when it
is warmed entering in the inner Solar System. However, in situ Raman spectroscopy
of carbon-containing ice mixtures has revealed that the organic crust is already
forming during irradiation at low temperature and its formation does not require the
warming of the sample (Strazzulla et al., 1991; Palumbo et al., 2004; Ferini et al.,
2004). This gives support to the hypothesis that an organic crust could be already
formed during the TNOs long residence far from the Sun.
In particular, it has been suggested that, due to irradiation processing, TNOs
could have a crust even thicker and/or developed much rapidly than previously
estimated for comets in the Oort cloud (Strazzulla et al., 2003b).
1.4.2 Tholins
To match the red spectral slope observed on many TNOs or centaurs, it is some-
times necessary to include a material rich in carbon compounds in the scattering
models.
A widely used material is the so called “tholin”; tholins are organics produced
by plasma irradiation of organic-rich gases. Cruikshank et al. (1998) for instance
(Fig. 1.3) used the optical constants published by Khare et al. (1984a) for “Titan”
tholin. Such material is the involatile product of plasma irradiation of a gas mixture
of N2 + CH4 = 0.9 + 0.1, corresponding approximately to the bulk composition of
Titan’s lower atmosphere (Khare et al., 1984b). Titan tholin consists of a variety of
compounds, such as hydrocarbons and nitriles.
In both the Hapke and Shkuratov models, small quantity of tholins are usually
included, sometimes as inclusions in water ice. The role of the tholins is to provide
the strong absorption observed in many outer bodies, from about 1 µm toward the
UV. Also, tholins have relatively high reflectance in the 3.2 µm region, and they
therefore quench the very strong absorption of water ice in this spectral region.
This effect of tholin has been used to match the spectra of some of the Saturn’s
36 1. Surface composition and processing
large satellites (Cruikshank et al., 2005).
It should be noted that the tholins used in the models are considered representa-
tive of a very broad class of complex organic solids produced by energy deposition in
gases and ices having compositions of planetary relevance (Cruikshank et al., 2005).
For this reason, experiments described in this thesis will give more detailed informa-
tion on processed ices and their spectral properties in the Vis-NIR. The by-products
of these experiments are expected to well reproduce the organic materials present
on outer Solar System objects.
1.4.3 Bitumens
Natural solid oil bitumens (asphaltites, kerites, anthraxolites) appear to be use-
ful spectral analogs for cometary and asteroid refractory organics. They show color
similarities to the surfaces of dark asteroids and cometary nuclei, as well as compo-
sitional and structural resemblances to organic components of carbonaceous chon-
drites. These dark solids are composed of a variety of organic compounds, most of
which are aromatic and aliphatic hydrocarbons (Moroz et al., 1998).
These materials are very dark in the visible and have red-sloped spectra in the
visible and near-infrared. They may be comparable in composition and structure
to refractory organic solids on the surfaces of primitive outer Solar System objects
(Moroz et al., 2004a).
Ion irradiation experiments recently performed at the Catania laboratory by
Moroz et al. (2004a) showed that irradiation-induced carbonization gradually flat-
tens the spectral slopes of these red organic solids, indicating an unusual space
weathering trend (see Fig. 1.4). It was found that such spectral alteration increased
with increasing contribution of nuclear versus electronic energy loss. This implies
that nuclear (elastic) energy deposition plays an important role in changing the
optical properties of irradiated refractory complex hydrocarbon materials.
The observed rise of reflectance in the visible range and its drop in the near-
infrared have been interpreted as an increase of the absorption coefficients. The
increase in overall absorption is probably due to modification of the chemical struc-
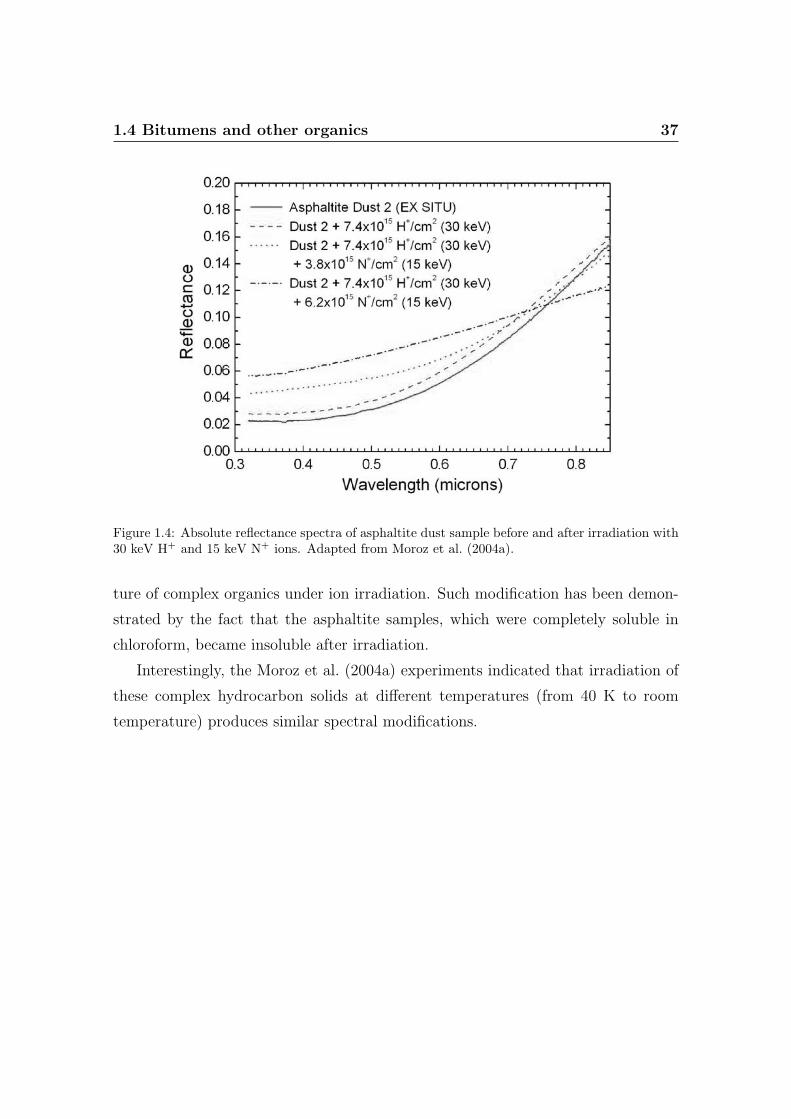
1.4 Bitumens and other organics 37
Figure 1.4: Absolute reflectance spectra of asphaltite dust sample before and after irradiation with30 keV H+ and 15 keV N+ ions. Adapted from Moroz et al. (2004a).
ture of complex organics under ion irradiation. Such modification has been demon-
strated by the fact that the asphaltite samples, which were completely soluble in
chloroform, became insoluble after irradiation.
Interestingly, the Moroz et al. (2004a) experiments indicated that irradiation of
these complex hydrocarbon solids at different temperatures (from 40 K to room
temperature) produces similar spectral modifications.

Chapter 2
Experimental approach
In this chapter I will describe the laboratory setup I have used to simulate
space weathering processes. The main experimental facilities used are the ones in
Lecce (Italy) at the Laboratorio di Astrofisica, Dipartimento di Fisica, Universita
del Salento, and in Catania (Italy) at the Laboratorio di Astrofisica Sperimentale,
Osservatorio Astrofisico di Catania (INAF).
2.1 Ion irradiation experiments
Ion irradiation experiments described in this thesis are performed in the Cata-
nia Laboratory. The experimental apparatus consists of a stainless steel vacuum
chamber (P<10−7 mbar) faced to a FTIR spectrophotometer (Bruker Equinox 55)
through KBr windows. A scheme of the chamber is shown in Fig. 2.1.
At the center of the chamber there is a cold finger, placed in thermal contact
with the tail section of a closed-cycle helium cryostat (10-300 K). An optically rough
(diffusing) gold substrate is put in contact with the cold finger for the reflectance
measurements and it is used as standard in the 0.7-2.7 µm spectral range, while
transmittance studies are performed using a silicon substrate.
In the case of ices, gaseous samples are prepared in a pre-chamber and admitted
by a gas inlet, through a needle valve, into the vacuum chamber, where they accrete
onto the cold substrate.
The substrate is surrounded by a cold trap; inside the trap the pressure is lower
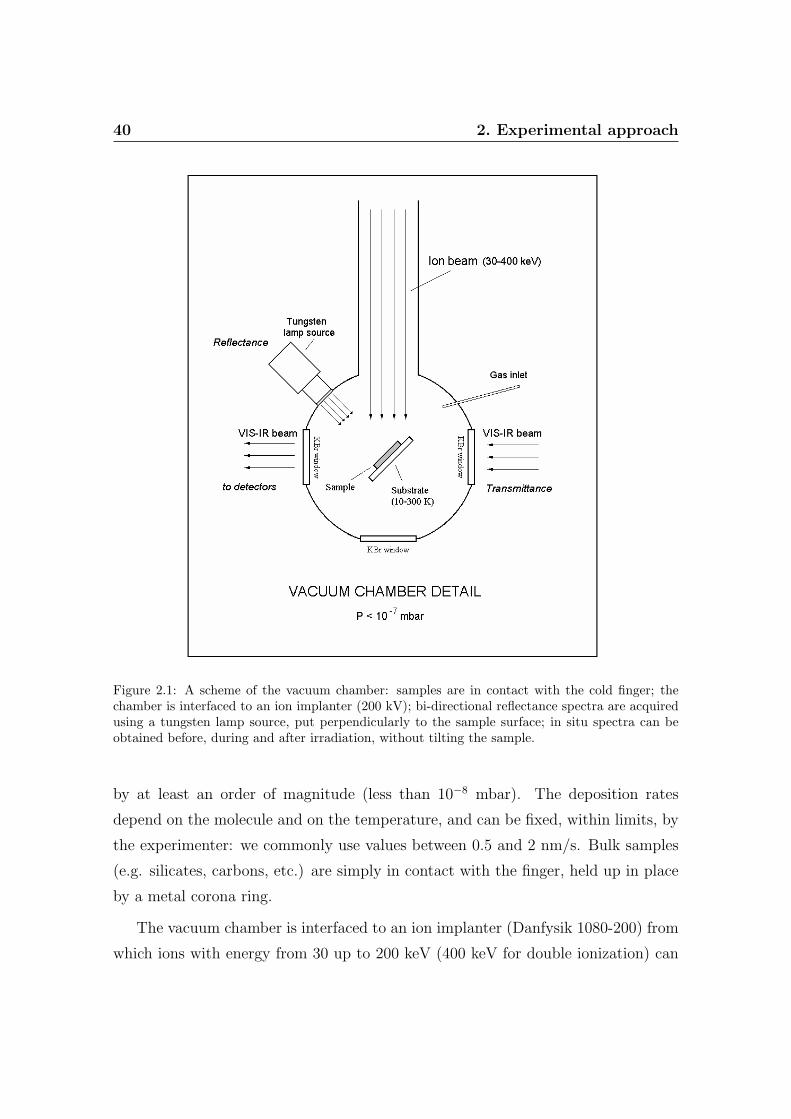
40 2. Experimental approach
Figure 2.1: A scheme of the vacuum chamber: samples are in contact with the cold finger; thechamber is interfaced to an ion implanter (200 kV); bi-directional reflectance spectra are acquiredusing a tungsten lamp source, put perpendicularly to the sample surface; in situ spectra can beobtained before, during and after irradiation, without tilting the sample.
by at least an order of magnitude (less than 10−8 mbar). The deposition rates
depend on the molecule and on the temperature, and can be fixed, within limits, by
the experimenter: we commonly use values between 0.5 and 2 nm/s. Bulk samples
(e.g. silicates, carbons, etc.) are simply in contact with the finger, held up in place
by a metal corona ring.
The vacuum chamber is interfaced to an ion implanter (Danfysik 1080-200) from
which ions with energy from 30 up to 200 keV (400 keV for double ionization) can
2.1 Ion irradiation experiments 41
be obtained; the ion beam produces a uniform spot on the target that is greater
than the spot of the vis-IR beam, and currents are usually below 1 µA/cm2 to avoid
macroscopic heating of the sample.
In the case of ices, the currents are typically from 100 to 400 nA/cm2; the
irradiation at the lowest doses is done at the lowest ion currents, the fresh ice being
more sensitive to possible temperature increases. If the irradiated sample becomes
more refractory, then the ion current is increased to speed up the experiment and
avoid as much contamination as possible. The ion current is continuously monitored
during irradiation. The ion beam is in fact passing through a sweeping system,
producing an area of about 4 cm2; then it passes through a metallic circular corona
having a circular hole of about 1.5 cm2. Ions that pass through the hole hit the
sample; the area of the metallic circular corona around the hole is equal (about 1.5
cm2) to that of the hole. In this way, we continuously read the ion current.
In the last 10 years, a large number of calibration experiments have been per-
formed at the Catania laboratory to measure the quantity of contaminants (mostly
H2O) deposited during the experiments. Under our present standard conditions the
background water deposition is less than 0.25 A/minute (see, e.g., a detailed discus-
sion in Leto and Baratta (2003)). Each of the current experiments lasts, at most,
a couple of hours, so a maximum contamination of 30 A is expected, i.e., 0.3% of
a typical thickness for the originally deposited ice film (see the following chapters).
However, the same bombarding ions cause sputtering from the surface of the sample.
Thus, the amount of contaminant is negligible. This is also supported by the finding
that no molecules containing oxygen (or nitrogen) are formed during irradiation of
pure hydrocarbons. In fact, if even small amounts of contaminants (of the order of
1%) such as water are intentionally added, ion irradiation easily forms CO bonds.
Fast ions penetrating solids deposit energy in the target by elastic interactions
with target nuclei and by inelastic collisions causing ionizations and excitations.
Thus bonds are broken along the path of the incoming ion producing physico-
chemical modifications and the erosion of material from the target (sputtering).
The sputtering process and the related astrophysical applications will not be dis-
cussed here (see e.g. Johnson (1998)). Chemical modifications induce the formation
42 2. Experimental approach
of molecules originally not present in the target.
The ion mean penetration depth (Rp), the stopping power (energy deposited
per unit path length), and the amount of elastic versus inelastic energy loss are
functions of the ion energy and mass (see Fig. 2.2) and of the properties of the
target. When ion irradiation experiments are performed to simulate solar wind
and cosmic ion irradiation, the corresponding type of ion can be easily obtained in
laboratory, though it is more difficult to reproduce the energy distribution of these
ions. Therefore, the laboratory results can be used for astrophysical application
only when we find out which is the physical mechanism that is causing the observed
effects, i.e. when we can extrapolate the laboratory data to a wider range of ion
masses and energies.
To compare the elastic vs. inelastic collisions, we often use H+ 200 keV vs. Ar+
200 keV or Ar++ 400 keV ions. Because protons are the most abundant ions in space,
H is used as a case study for light ions, while Ar, even if not abundant in space, is
used as a case for heavy ions. The energy loss of 200 keV protons is essentially due
to ionizations and excitations (electronic energy loss); 200 and 400 keV Ar ions lose
an important fraction of their energy through elastic collisions with the target nuclei
(see Fig. 2.2). The use of these projectiles is then the best we can do to mimic the
irradiation of the several ion populations (not just the 1 keV/amu solar wind ions;
see Strazzulla et al. (2003b)) that irradiate minor bodies in the Solar System.
Bi-directional reflectance spectra are acquired using a tungsten lamp source,
put perpendicularly to the sample surface; the scattered light is collected by the
spectrometer at an angle of 45◦ with respect to the incident radiation. Furthermore,
since the ion beam forms an angle of 45◦ with the target plane and of 90◦ with
the collected vis-IR radiation, spectra can be obtained before, during and after
irradiation, without tilting the sample. Transmittance spectra can also be collected
in the case of low absorbing samples, with the vis-IR radiation traversing the sample
through a hole in the cold finger. Spectra are always rationed to the background
spectrum which includes the substrate.
With our experimental setup we can measure in situ bidirectional reflectance
spectra in two distinct and partially overlapping ranges (0.7-1.1 and 0.9-2.7 µm, al-
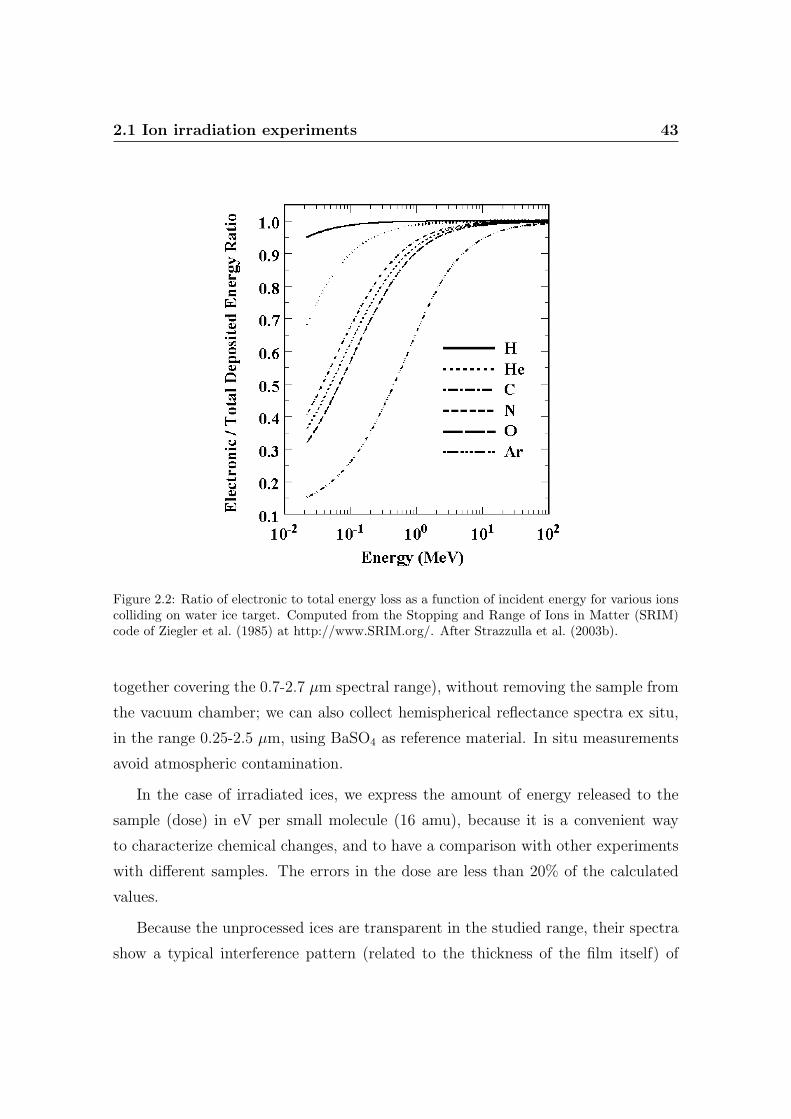
2.1 Ion irradiation experiments 43
Figure 2.2: Ratio of electronic to total energy loss as a function of incident energy for various ionscolliding on water ice target. Computed from the Stopping and Range of Ions in Matter (SRIM)code of Ziegler et al. (1985) at http://www.SRIM.org/. After Strazzulla et al. (2003b).
together covering the 0.7-2.7 µm spectral range), without removing the sample from
the vacuum chamber; we can also collect hemispherical reflectance spectra ex situ,
in the range 0.25-2.5 µm, using BaSO4 as reference material. In situ measurements
avoid atmospheric contamination.
In the case of irradiated ices, we express the amount of energy released to the
sample (dose) in eV per small molecule (16 amu), because it is a convenient way
to characterize chemical changes, and to have a comparison with other experiments
with different samples. The errors in the dose are less than 20% of the calculated
values.
Because the unprocessed ices are transparent in the studied range, their spectra
show a typical interference pattern (related to the thickness of the film itself) of
44 2. Experimental approach
two beams: the first reflected at the sample-gold interface and the second at the
sample-vacuum interface. We usually subtract the interference pattern in the case
of the virgin spectra; if the target is a C-bearing species, such interference is usually
destroyed once the film is damaged by the ions.
Raman spectra are collected using a Raman spectrometer equipped with a con-
tinuous Ar ion laser beam (514.5 nm) as exciting radiation and a CCD detector in
the 0.4-1.0 µm spectral range. We can collect both ex situ micro-Raman spectra
(spot of 1-5 µm in size), and in situ macro-Raman spectra (spot of 100 µm). Details
of the in situ Raman technique can be found in Brunetto et al. (2004).
2.2 Laser ablation experiments
Laser irradiation and ablation experiments described in this thesis have been
performed in the Lecce Laboratory. The experimental setup used to irradiate and
ablate the samples consisted of a multigas pulsed excimer laser (Lambda Physics
LPX 305i), a multitarget stainless steel chamber and a pumping system.
Irradiations below the ablation threshold (hereinafter BAT irradiation) have been
performed with a KrF excimer laser, working at a wavelength of 248 nm with pulse
duration of about 20 ns. The laser beam was homogenized by a fly’s eye beam
homogenizer optimized to work at 248 nm (Microlas), and directed perpendicularly
to the sample. The homogenized laser spot on the sample surface was of 0.9 × 0.9
cm2, while the energy per pulse of the laser beam was varied in the range 43-105
mJ, obtaining fluences in the range 0.05-0.13 J/cm2. The number of laser pulses
have been changed from 1000 to 20,000.
Ablation of the samples has been performed by an ArF excimer laser operating
at 193 nm with pulse duration of 20 ns. In this case the laser beam was focused by a
lens and then directed onto the target at an angle of 45◦ to have a spot of about 1.5
mm2, so that the laser fluence is about 2 J/cm2. The targets were mounted vertically
on a holder, which can support up to three different targets. Two different types of
motions (spinning and spanning) are possible for the targets, in order to irradiate
a given area of the samples, and ablate it uniformly. Therefore, a certain number
2.2 Laser ablation experiments 45
of pulses is needed to cover a single cycle of motion; further pulses correspond to
further passages and ablation on the same area.
The duration of our laser pulse (about 20 ns), typical for an UV excimer laser,
is longer than the 7 ns duration used by Yamada et al. (1999). However, only a
change of orders of magnitude (regime of picoseconds, or femtoseconds, etc.) would
cause strong differences in the physical process. For instance, lengthening the du-
ration to microseconds one would get effects similar to those described in the paper
by Moroz et al. (1996). So, the difference between 20 and 7 ns should have little
influence on the results.
The total dose (measured in J/cm2), in the case of BAT irradiation is given by:
dose = fluence × number of pulses; while in case of ablation it is given by: dose
= laser energy × number of pulses/ablated area. Note that, at a given fluence, a
large number of pulses may correspond to the lower dose in an increased ablated
area, i.e. to about a single complete cycle of motion (spinning and spanning) of the
target. In case of ablation, a silicon substrate was positioned parallel to the targets
in order to collect the ablated material (film deposition); the distance from target
to the substrate was 50 mm. Both BAT (below ablation threshold) irradiation and
ablation were performed in a vacuum chamber, evacuated down to 5×10⁻⁵ Pa, with
a frequency of pulses of 10 Hz.
It has to be stressed that, differently from the case of Yamada et al. (1999) and
Sasaki et al. (2001) where the samples were placed horizontally, with our experimen-
tal setup the targets can be mounted only vertically; this leads to a diverse profile
of the plume and a minor amount of re-deposited material. This difference has to
be kept in mind when comparing the spectral modifications.
Directional-hemispherical reflectance spectra are collected using a Perkin-Elmer
Lambda 900 spectrophotometer in the UV-vis-NIR spectral range (0.25-2.5 µm),
equipped with a Labsphere integrating sphere of 150 mm diameter in Spectralon.
The error in the reflectance spectra is of about 5%. The laser irradiation covers ho-
mogeneously areas of about 0.5-0.8 cm2, while the beam spot size in the reflectance
measurements is about 0.1 cm2, so that the reflectance measurements after irradia-
tion refer only to the irradiated area.
46 2. Experimental approach
In addition, XPS measurements are performed at SuperLab (Laboratory of Sur-
faces and Interfaces), Consorzio Catania Ricerche, University of Catania (Depart-
ment of Chemical Sciences); XPS analyses are performed with an XPS spectrometer
KRATOS ES 300 (180◦ hemispherical electrostatic analyzer) and MgKα excitation
(1253.6 eV) at 15 kV × 15 mA power. The pressure in the chamber is less than
10−7 Pa. The binding energy scale is calibrated by using several known lines.
2.3 How to extrapolate laboratory results
As discussed in the first part of this thesis, real planetary surfaces are com-
posed of several to many different minerals. Deconvolving a reflectance spectrum
to mineral abundance in an unambiguous way is difficult, because the spectra are
complex nonlinear functions of grain size, abundance, and material opacity. Multi-
ple scattering models can provide approximate solutions to the radiative transfer in
a particulate medium (Poulet et al., 2002). The optical constants of the considered
materials are important input parameters for those models, and must be carefully
measured in the laboratory.
Unfortunately, the estimation of the optical constants is not a simple task; dif-
ferent methods may produce different results, and several assumptions are usually
required. In the case of altered or treated samples (i.e. the cases studied in this the-
sis), the situation is even more complex, since the resulting material usually retains
part of the starting material characteristics, and thus it cannot be easily qualified
as a specific and self-consistent species. An example will be given in the third part
of this thesis.
Important information about minor bodies composition and processing may
come from simpler spectral comparison, that would focus on specific features (e.g.
spectral slopes, band peak positions, band areas, etc.) without passing through a
complex model. In this case it is possible to compare in an easier way laboratory
and observational data.
In any case, an additional obstacle when we want to extrapolate laboratory
processing experiments to the Solar System comes from the fact that airless surfaces
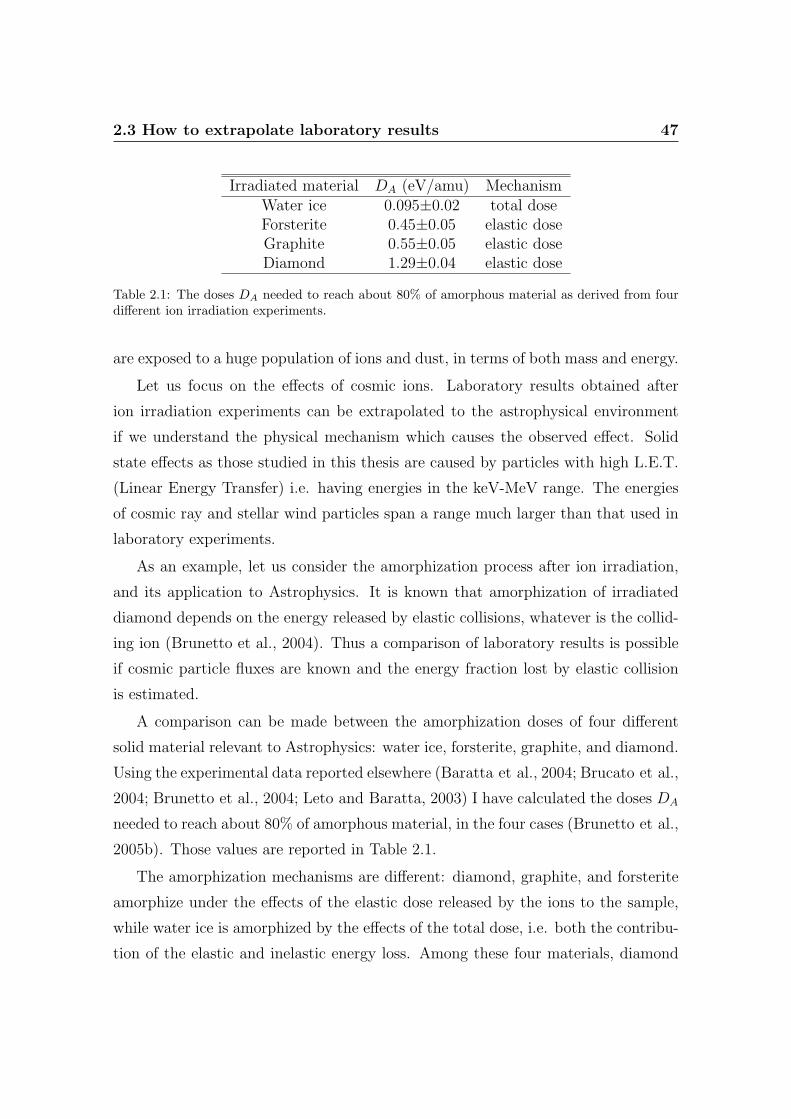
2.3 How to extrapolate laboratory results 47
Irradiated material DA (eV/amu) MechanismWater ice 0.095±0.02 total doseForsterite 0.45±0.05 elastic doseGraphite 0.55±0.05 elastic doseDiamond 1.29±0.04 elastic dose
Table 2.1: The doses DA needed to reach about 80% of amorphous material as derived from fourdifferent ion irradiation experiments.
are exposed to a huge population of ions and dust, in terms of both mass and energy.
Let us focus on the effects of cosmic ions. Laboratory results obtained after
ion irradiation experiments can be extrapolated to the astrophysical environment
if we understand the physical mechanism which causes the observed effect. Solid
state effects as those studied in this thesis are caused by particles with high L.E.T.
(Linear Energy Transfer) i.e. having energies in the keV-MeV range. The energies
of cosmic ray and stellar wind particles span a range much larger than that used in
laboratory experiments.
As an example, let us consider the amorphization process after ion irradiation,
and its application to Astrophysics. It is known that amorphization of irradiated
diamond depends on the energy released by elastic collisions, whatever is the collid-
ing ion (Brunetto et al., 2004). Thus a comparison of laboratory results is possible
if cosmic particle fluxes are known and the energy fraction lost by elastic collision
is estimated.
A comparison can be made between the amorphization doses of four different
solid material relevant to Astrophysics: water ice, forsterite, graphite, and diamond.
Using the experimental data reported elsewhere (Baratta et al., 2004; Brucato et al.,
2004; Brunetto et al., 2004; Leto and Baratta, 2003) I have calculated the doses DA
needed to reach about 80% of amorphous material, in the four cases (Brunetto et al.,
2005b). Those values are reported in Table 2.1.
The amorphization mechanisms are different: diamond, graphite, and forsterite
amorphize under the effects of the elastic dose released by the ions to the sample,
while water ice is amorphized by the effects of the total dose, i.e. both the contribu-
tion of the elastic and inelastic energy loss. Among these four materials, diamond
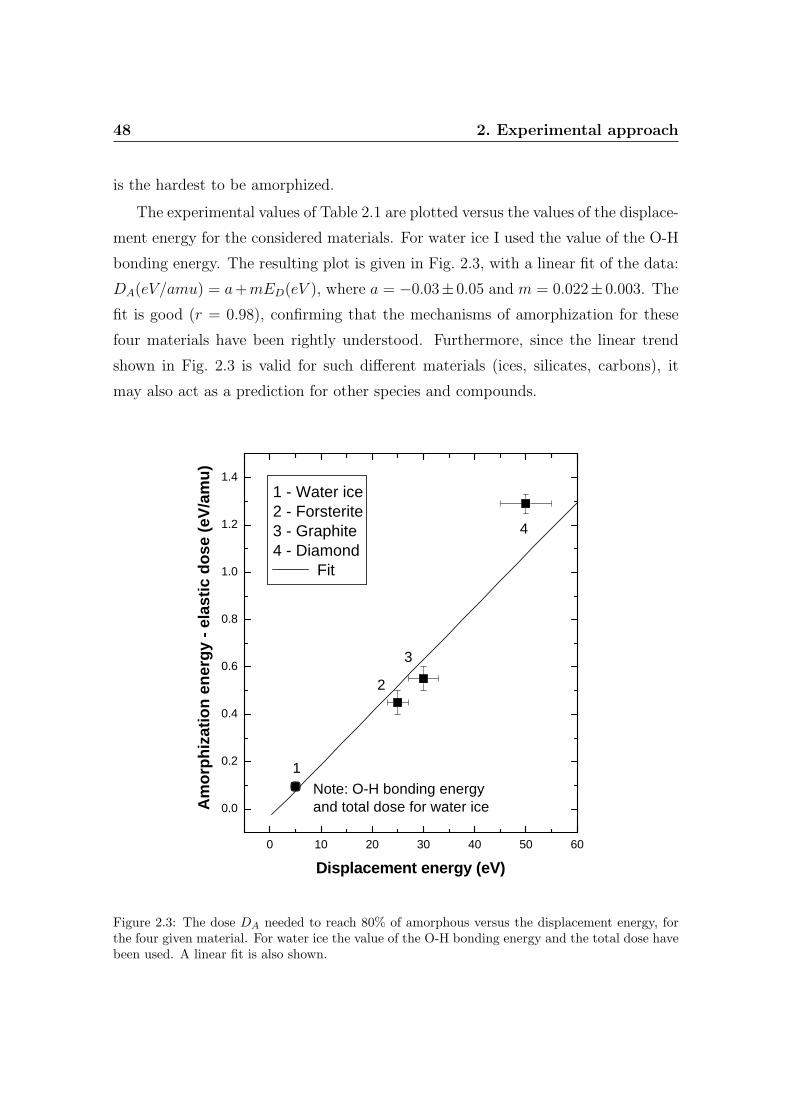
48 2. Experimental approach
is the hardest to be amorphized.
The experimental values of Table 2.1 are plotted versus the values of the displace-
ment energy for the considered materials. For water ice I used the value of the O-H
bonding energy. The resulting plot is given in Fig. 2.3, with a linear fit of the data:
DA(eV/amu) = a+mED(eV ), where a = −0.03±0.05 and m = 0.022±0.003. The
fit is good (r = 0.98), confirming that the mechanisms of amorphization for these
four materials have been rightly understood. Furthermore, since the linear trend
shown in Fig. 2.3 is valid for such different materials (ices, silicates, carbons), it
may also act as a prediction for other species and compounds.
0 10 20 30 40 50 60
0.0
0.2
0.4
0.6
0.8
1.0
1.2
1.4
Am
orp
hiz
atio
n e
ner
gy
- el
asti
c d
ose
(eV
/am
u)
Displacement energy (eV)
Note: O-H bonding energyand total dose for water ice
1 - Water ice2 - Forsterite3 - Graphite4 - Diamond
Fit
1
2
3
4
Figure 2.3: The dose DA needed to reach 80% of amorphous versus the displacement energy, forthe four given material. For water ice the value of the O-H bonding energy and the total dose havebeen used. A linear fit is also shown.
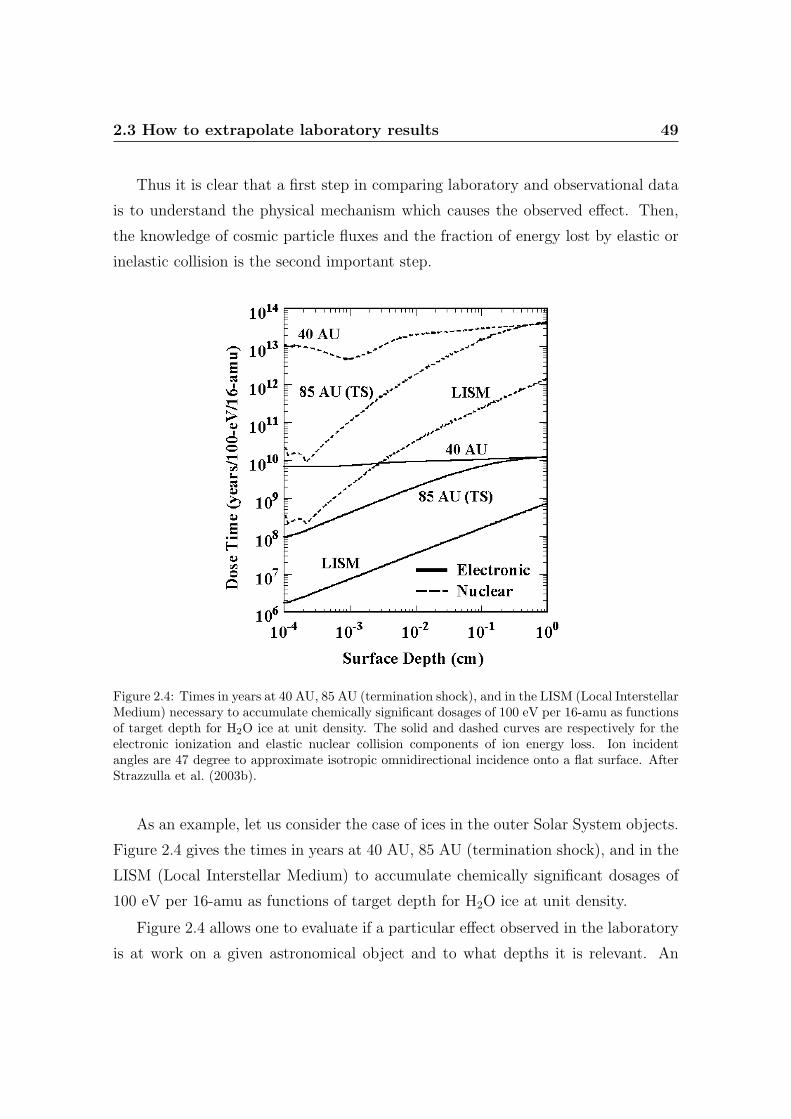
2.3 How to extrapolate laboratory results 49
Thus it is clear that a first step in comparing laboratory and observational data
is to understand the physical mechanism which causes the observed effect. Then,
the knowledge of cosmic particle fluxes and the fraction of energy lost by elastic or
inelastic collision is the second important step.
Figure 2.4: Times in years at 40 AU, 85 AU (termination shock), and in the LISM (Local InterstellarMedium) necessary to accumulate chemically significant dosages of 100 eV per 16-amu as functionsof target depth for H2O ice at unit density. The solid and dashed curves are respectively for theelectronic ionization and elastic nuclear collision components of ion energy loss. Ion incidentangles are 47 degree to approximate isotropic omnidirectional incidence onto a flat surface. AfterStrazzulla et al. (2003b).
As an example, let us consider the case of ices in the outer Solar System objects.
Figure 2.4 gives the times in years at 40 AU, 85 AU (termination shock), and in the
LISM (Local Interstellar Medium) to accumulate chemically significant dosages of
100 eV per 16-amu as functions of target depth for H2O ice at unit density.
Figure 2.4 allows one to evaluate if a particular effect observed in the laboratory
is at work on a given astronomical object and to what depths it is relevant. An

50 2. Experimental approach
important example will be given in the third part of this thesis, about the formation
of an organic crust on TNOs.
Part II
New experimental results

Chapter 3
Irradiation and ablation of silicates
As discussed in the first part of this thesis, the effects of space weathering are to
change progressively the solar reflectance spectra of airless bodies (in the UV-vis-NIR
range), and include spectral darkening, reddening, and subdued absorption bands
(Hapke, 2001); such effects would tend to convert spectra of ordinary chondrites, i.e.,
virgin or fresh materials, to have the spectral traits of S-type asteroids (Chapman,
1996).
In this chapter I report new ion irradiation experiments, performed in the Cata-
nia Laboratory, and laser irradiation and ablation experiments, performed in the
Lecce Laboratory.
The changes and modifications induced by colliding ions or by laser beam inside
the target have been monitored using in situ and ex situ reflectance spectroscopy
(0.25-2.7 µm) and Raman spectroscopy. Analogous experiments have been per-
formed in our laboratory on carbonaceous materials and C-rich ices to simulate
space weathering by cosmic ions on bodies of the outer Solar System (see next
chapter).
3.1 Ordinary Chondrites: Epinal meteorite
Based on the paper: Strazzulla, G., Dotto, E., Binzel, R., Brunetto, R.,
Barucci, M. A., Blanco, A., Orofino, V. 2005. Spectral alteration of the
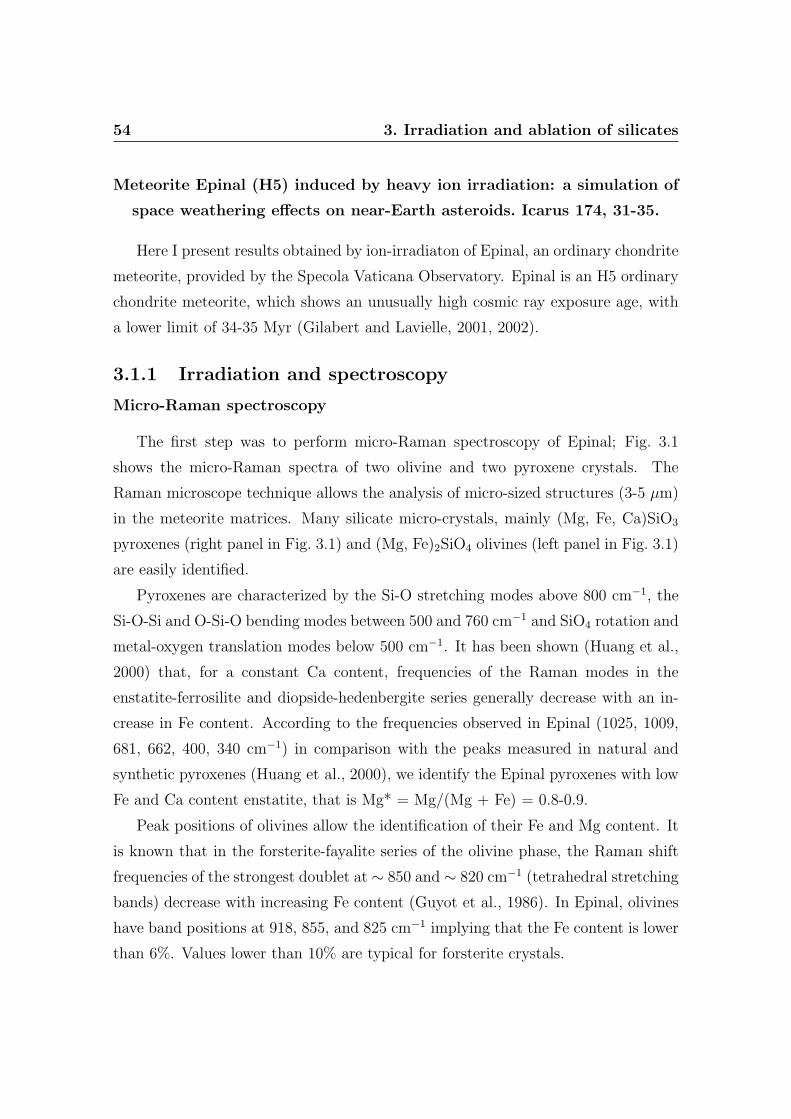
54 3. Irradiation and ablation of silicates
Meteorite Epinal (H5) induced by heavy ion irradiation: a simulation of
space weathering effects on near-Earth asteroids. Icarus 174, 31-35.
Here I present results obtained by ion-irradiaton of Epinal, an ordinary chondrite
meteorite, provided by the Specola Vaticana Observatory. Epinal is an H5 ordinary
chondrite meteorite, which shows an unusually high cosmic ray exposure age, with
a lower limit of 34-35 Myr (Gilabert and Lavielle, 2001, 2002).
3.1.1 Irradiation and spectroscopy
Micro-Raman spectroscopy
The first step was to perform micro-Raman spectroscopy of Epinal; Fig. 3.1
shows the micro-Raman spectra of two olivine and two pyroxene crystals. The
Raman microscope technique allows the analysis of micro-sized structures (3-5 µm)
in the meteorite matrices. Many silicate micro-crystals, mainly (Mg, Fe, Ca)SiO3
pyroxenes (right panel in Fig. 3.1) and (Mg, Fe)2SiO4 olivines (left panel in Fig. 3.1)
are easily identified.
Pyroxenes are characterized by the Si-O stretching modes above 800 cm−1, the
Si-O-Si and O-Si-O bending modes between 500 and 760 cm−1 and SiO4 rotation and
metal-oxygen translation modes below 500 cm−1. It has been shown (Huang et al.,
2000) that, for a constant Ca content, frequencies of the Raman modes in the
enstatite-ferrosilite and diopside-hedenbergite series generally decrease with an in-
crease in Fe content. According to the frequencies observed in Epinal (1025, 1009,
681, 662, 400, 340 cm−1) in comparison with the peaks measured in natural and
synthetic pyroxenes (Huang et al., 2000), we identify the Epinal pyroxenes with low
Fe and Ca content enstatite, that is Mg* = Mg/(Mg + Fe) = 0.8-0.9.
Peak positions of olivines allow the identification of their Fe and Mg content. It
is known that in the forsterite-fayalite series of the olivine phase, the Raman shift
frequencies of the strongest doublet at ∼ 850 and ∼ 820 cm−1 (tetrahedral stretching
bands) decrease with increasing Fe content (Guyot et al., 1986). In Epinal, olivines
have band positions at 918, 855, and 825 cm−1 implying that the Fe content is lower
than 6%. Values lower than 10% are typical for forsterite crystals.
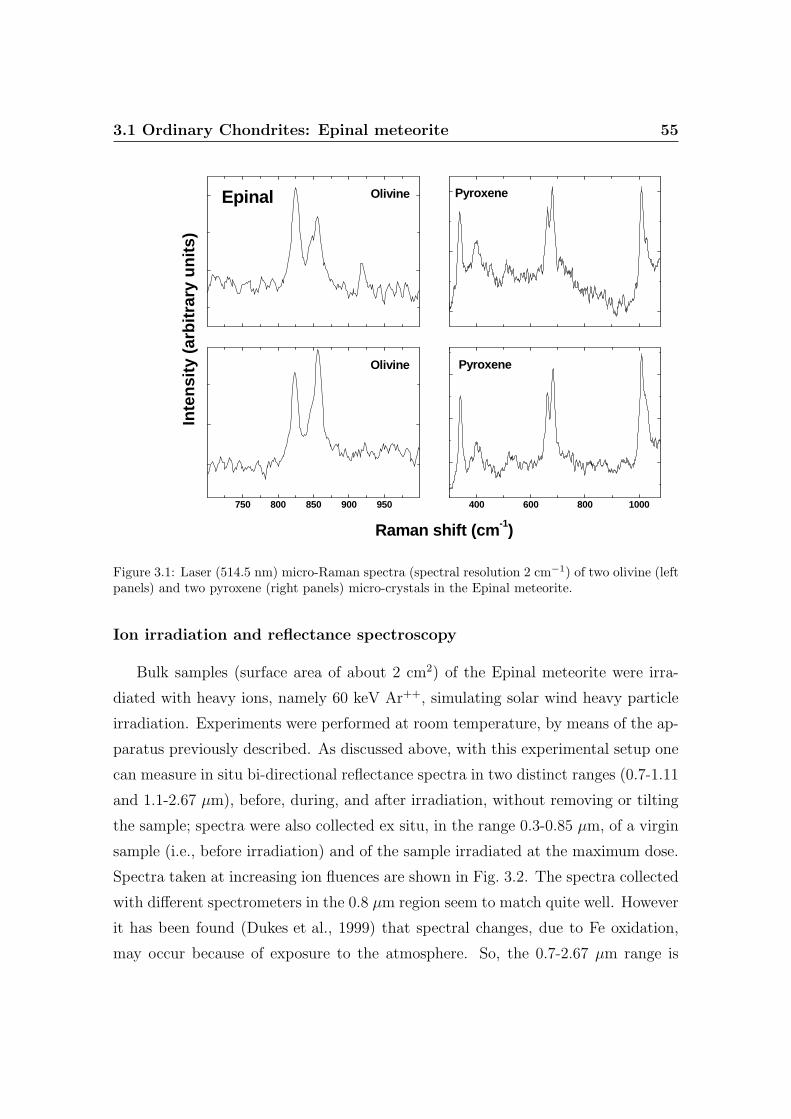
3.1 Ordinary Chondrites: Epinal meteorite 55
400 600 800 1000750 800 850 900 950
Inte
nsi
ty (
arb
itra
ry u
nit
s)
Raman shift (cm-1)
PyroxeneOlivineEpinal
Olivine Pyroxene
Figure 3.1: Laser (514.5 nm) micro-Raman spectra (spectral resolution 2 cm−1) of two olivine (leftpanels) and two pyroxene (right panels) micro-crystals in the Epinal meteorite.
Ion irradiation and reflectance spectroscopy
Bulk samples (surface area of about 2 cm2) of the Epinal meteorite were irra-
diated with heavy ions, namely 60 keV Ar++, simulating solar wind heavy particle
irradiation. Experiments were performed at room temperature, by means of the ap-
paratus previously described. As discussed above, with this experimental setup one
can measure in situ bi-directional reflectance spectra in two distinct ranges (0.7-1.11
and 1.1-2.67 µm), before, during, and after irradiation, without removing or tilting
the sample; spectra were also collected ex situ, in the range 0.3-0.85 µm, of a virgin
sample (i.e., before irradiation) and of the sample irradiated at the maximum dose.
Spectra taken at increasing ion fluences are shown in Fig. 3.2. The spectra collected
with different spectrometers in the 0.8 µm region seem to match quite well. However
it has been found (Dukes et al., 1999) that spectral changes, due to Fe oxidation,
may occur because of exposure to the atmosphere. So, the 0.7-2.67 µm range is
56 3. Irradiation and ablation of silicates
more reliable.
0.4 0.8 1.2 1.6 2.0 2.4
0.08
0.12
0.16
0.20
EPINAL
a. as preparedAfter 60 keV Ar++
b. 1.3 x 10¹⁵/cm2
c. 4.3 x 10¹⁵ /cm2 d. 1.7 x 10¹⁶ /cm2
d
c
b
a
Bid
irect
iona
l Ref
lect
ance
Wavelength (µm)
Figure 3.2: UV-Vis-NIR (0.3-2.67 µm) reflectance spectra of the ordinary chondrite meteoriteEpinal before irradiation and after three different ion fluences (60 keV Ar++). Spectra in therange 0.7-1.11 and 1.1-2.67 µm have been collected in situ (high vacuum). Spectra in the range0.3-0.85 µm have been collected ex situ (at atmospheric pressure).
The spectrum of Epinal exhibits the two bands at 1 (band I) and 2 (band II)
microns which are typical of ordinary chondrites. The band at 1 µm is due to
the presence of ferrous iron in both olivines and pyroxenes. The band at about
2 µm is attributed to pyroxenes (Adams, 1975; Burns et al., 1993; Moroz et al.,
2000). Irradiation of the external layers (the penetration depth of 60 keV Ar++ ions
in the meteorite sample is about 500 angstroms) of Epinal produces a progressive
darkening and changes in the slope of the spectra. The spectral slope across band I
increases dramatically, while the depths of both band I and band II become weaker.
Figure 3.3 reports the ratios between the spectra of the irradiated samples and that
of the virgin one.
A few tests with H+ ions (30 keV) produced modest differences in the spectra.
30 keV protons deposit their energy in the target mainly through ionizations and
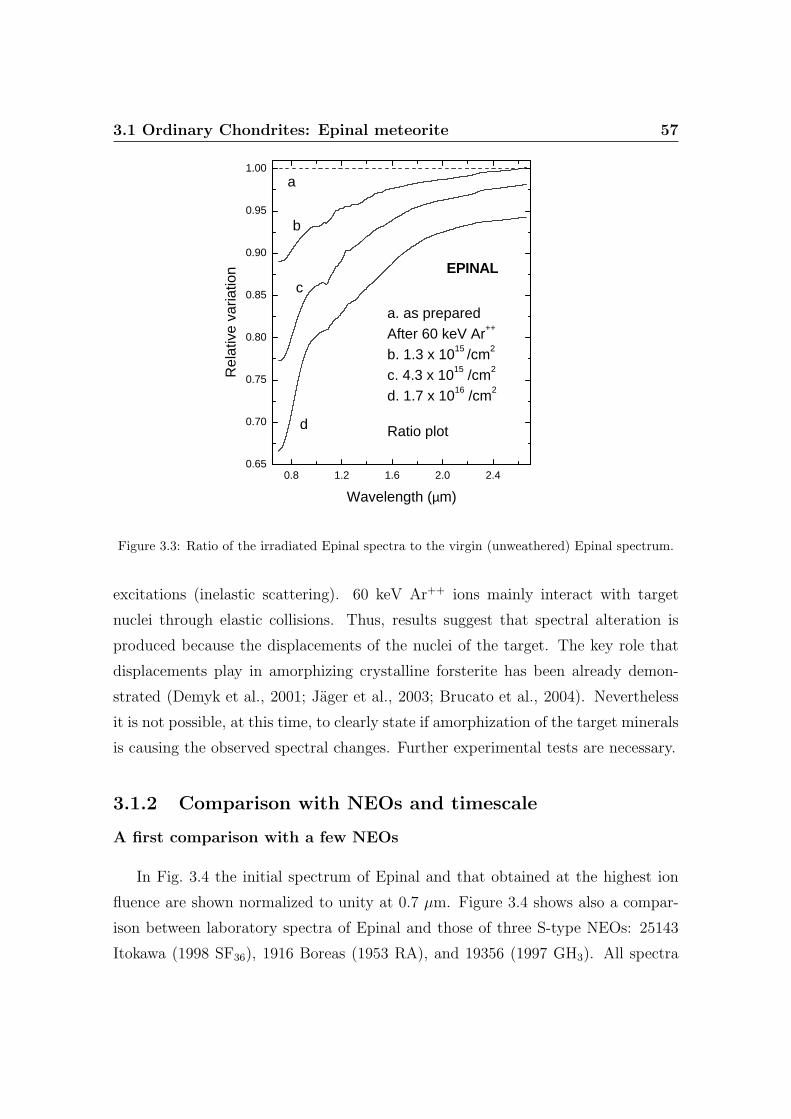
3.1 Ordinary Chondrites: Epinal meteorite 57
0.8 1.2 1.6 2.0 2.40.65
0.70
0.75
0.80
0.85
0.90
0.95
1.00
EPINAL
Rel
ativ
e va
riatio
n
Wavelength (µm)
a. as preparedAfter 60 keV Ar++
b. 1.3 x 10¹⁵ /cm2
c. 4.3 x 10¹⁵ /cm2 d. 1.7 x 10¹⁶ /cm2
Ratio plot
b
c
d
a
Figure 3.3: Ratio of the irradiated Epinal spectra to the virgin (unweathered) Epinal spectrum.
excitations (inelastic scattering). 60 keV Ar++ ions mainly interact with target
nuclei through elastic collisions. Thus, results suggest that spectral alteration is
produced because the displacements of the nuclei of the target. The key role that
displacements play in amorphizing crystalline forsterite has been already demon-
strated (Demyk et al., 2001; Jager et al., 2003; Brucato et al., 2004). Nevertheless
it is not possible, at this time, to clearly state if amorphization of the target minerals
is causing the observed spectral changes. Further experimental tests are necessary.
3.1.2 Comparison with NEOs and timescale
A first comparison with a few NEOs
In Fig. 3.4 the initial spectrum of Epinal and that obtained at the highest ion
fluence are shown normalized to unity at 0.7 µm. Figure 3.4 shows also a compar-
ison between laboratory spectra of Epinal and those of three S-type NEOs: 25143
Itokawa (1998 SF36), 1916 Boreas (1953 RA), and 19356 (1997 GH3). All spectra
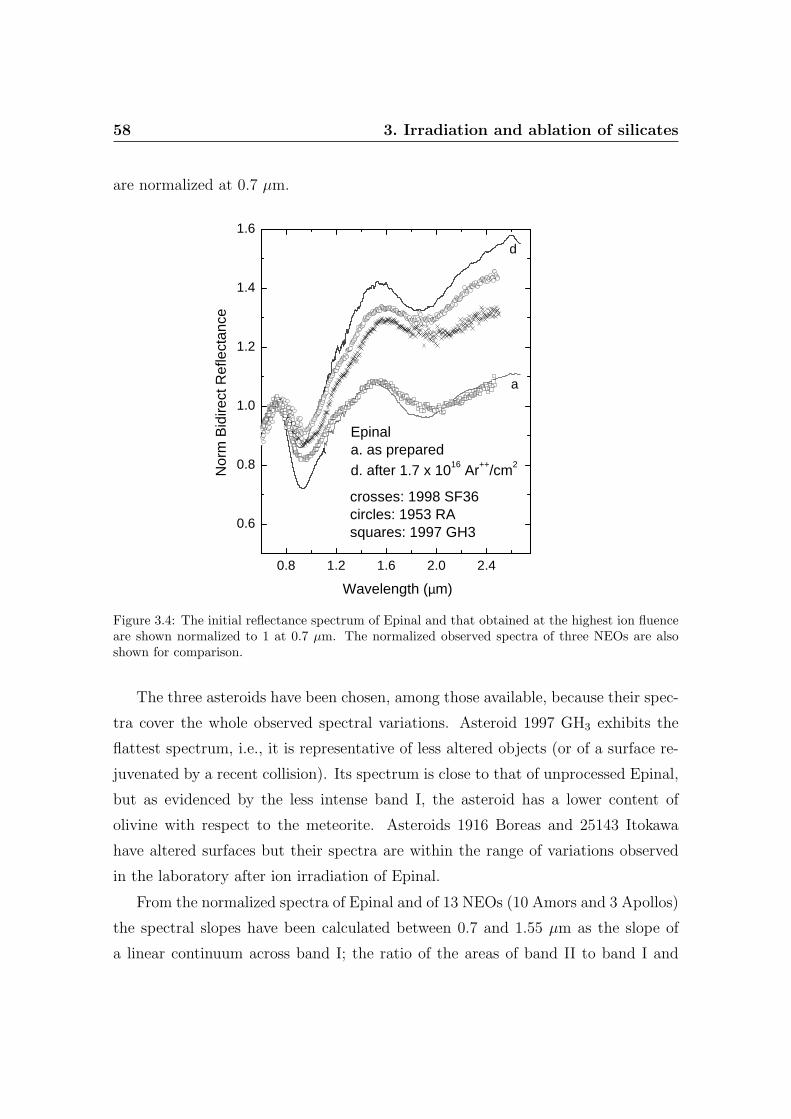
58 3. Irradiation and ablation of silicates
are normalized at 0.7 µm.
0.8 1.2 1.6 2.0 2.4
0.6
0.8
1.0
1.2
1.4
1.6
Wavelength (µm)
d
a
N
orm
Bid
irect
Ref
lect
ance
crosses: 1998 SF36circles: 1953 RAsquares: 1997 GH3
Epinala. as preparedd. after 1.7 x 10¹⁶ Ar++/cm2
Figure 3.4: The initial reflectance spectrum of Epinal and that obtained at the highest ion fluenceare shown normalized to 1 at 0.7 µm. The normalized observed spectra of three NEOs are alsoshown for comparison.
The three asteroids have been chosen, among those available, because their spec-
tra cover the whole observed spectral variations. Asteroid 1997 GH3 exhibits the
flattest spectrum, i.e., it is representative of less altered objects (or of a surface re-
juvenated by a recent collision). Its spectrum is close to that of unprocessed Epinal,
but as evidenced by the less intense band I, the asteroid has a lower content of
olivine with respect to the meteorite. Asteroids 1916 Boreas and 25143 Itokawa
have altered surfaces but their spectra are within the range of variations observed
in the laboratory after ion irradiation of Epinal.
From the normalized spectra of Epinal and of 13 NEOs (10 Amors and 3 Apollos)
the spectral slopes have been calculated between 0.7 and 1.55 µm as the slope of
a linear continuum across band I; the ratio of the areas of band II to band I and
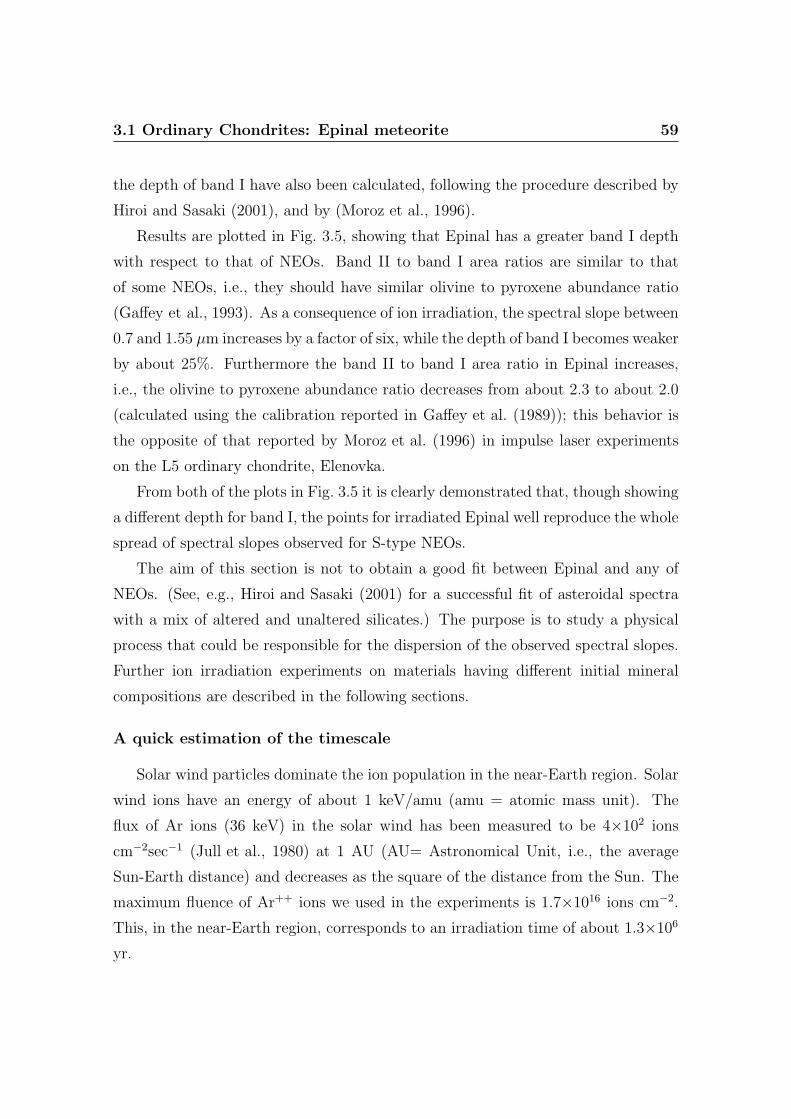
3.1 Ordinary Chondrites: Epinal meteorite 59
the depth of band I have also been calculated, following the procedure described by
Hiroi and Sasaki (2001), and by (Moroz et al., 1996).
Results are plotted in Fig. 3.5, showing that Epinal has a greater band I depth
with respect to that of NEOs. Band II to band I area ratios are similar to that
of some NEOs, i.e., they should have similar olivine to pyroxene abundance ratio
(Gaffey et al., 1993). As a consequence of ion irradiation, the spectral slope between
0.7 and 1.55 µm increases by a factor of six, while the depth of band I becomes weaker
by about 25%. Furthermore the band II to band I area ratio in Epinal increases,
i.e., the olivine to pyroxene abundance ratio decreases from about 2.3 to about 2.0
(calculated using the calibration reported in Gaffey et al. (1989)); this behavior is
the opposite of that reported by Moroz et al. (1996) in impulse laser experiments
on the L5 ordinary chondrite, Elenovka.
From both of the plots in Fig. 3.5 it is clearly demonstrated that, though showing
a different depth for band I, the points for irradiated Epinal well reproduce the whole
spread of spectral slopes observed for S-type NEOs.
The aim of this section is not to obtain a good fit between Epinal and any of
NEOs. (See, e.g., Hiroi and Sasaki (2001) for a successful fit of asteroidal spectra
with a mix of altered and unaltered silicates.) The purpose is to study a physical
process that could be responsible for the dispersion of the observed spectral slopes.
Further ion irradiation experiments on materials having different initial mineral
compositions are described in the following sections.
A quick estimation of the timescale
Solar wind particles dominate the ion population in the near-Earth region. Solar
wind ions have an energy of about 1 keV/amu (amu = atomic mass unit). The
flux of Ar ions (36 keV) in the solar wind has been measured to be 4×10² ions
cm−2sec−1 (Jull et al., 1980) at 1 AU (AU= Astronomical Unit, i.e., the average
Sun-Earth distance) and decreases as the square of the distance from the Sun. The
maximum fluence of Ar++ ions we used in the experiments is 1.7×10¹⁶ ions cm−2.
This, in the near-Earth region, corresponds to an irradiation time of about 1.3×10⁶
yr.
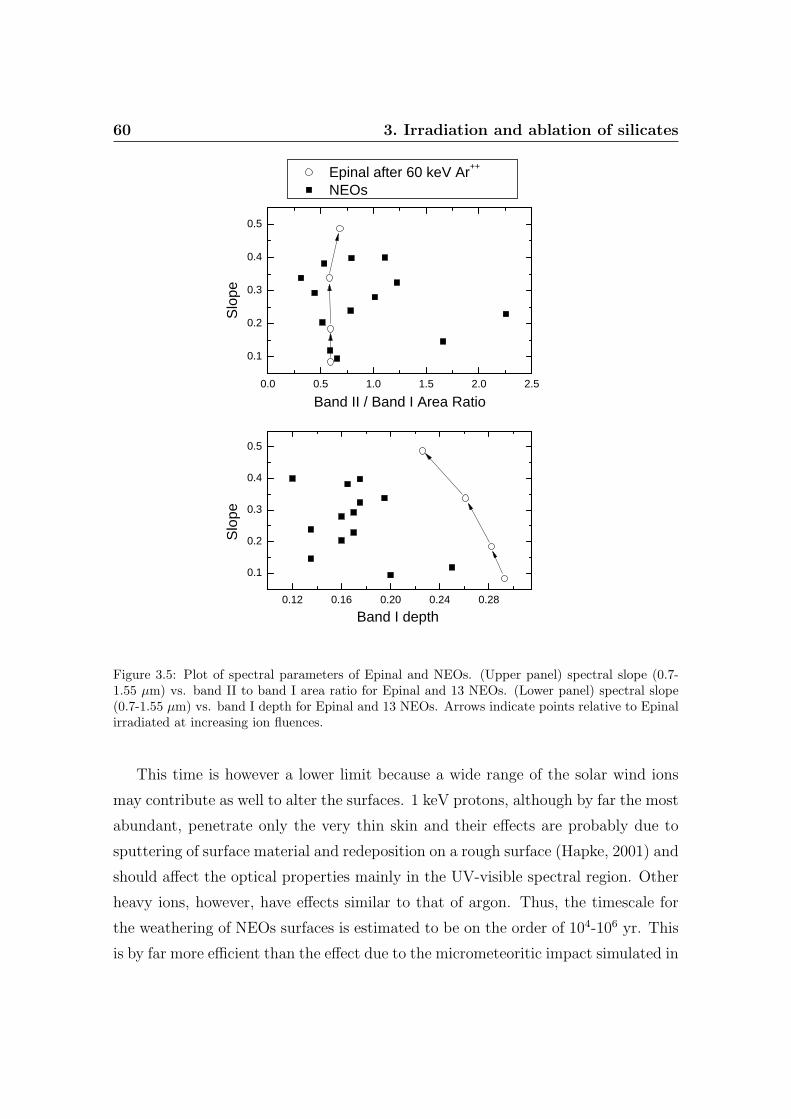
60 3. Irradiation and ablation of silicates
0.0 0.5 1.0 1.5 2.0 2.5
0.1
0.2
0.3
0.4
0.5
0.12 0.16 0.20 0.24 0.28
0.1
0.2
0.3
0.4
0.5
Epinal after 60 keV Ar++
NEOs
Slo
pe
Band II / Band I Area Ratio
Band I depth
Slo
pe
Figure 3.5: Plot of spectral parameters of Epinal and NEOs. (Upper panel) spectral slope (0.7-1.55 µm) vs. band II to band I area ratio for Epinal and 13 NEOs. (Lower panel) spectral slope(0.7-1.55 µm) vs. band I depth for Epinal and 13 NEOs. Arrows indicate points relative to Epinalirradiated at increasing ion fluences.
This time is however a lower limit because a wide range of the solar wind ions
may contribute as well to alter the surfaces. 1 keV protons, although by far the most
abundant, penetrate only the very thin skin and their effects are probably due to
sputtering of surface material and redeposition on a rough surface (Hapke, 2001) and
should affect the optical properties mainly in the UV-visible spectral region. Other
heavy ions, however, have effects similar to that of argon. Thus, the timescale for
the weathering of NEOs surfaces is estimated to be on the order of 104-106 yr. This
is by far more efficient than the effect due to the micrometeoritic impact simulated in
3.2 Ion irradiation: the role of elastic collisions 61
the laboratory by pulsed laser irradiation (Yamada et al., 1999; Sasaki et al., 2001).
Thus ion irradiation may be able to alter the surfaces of NEOs and reproduce the
whole range of observed spectra on short time scales. This implies that either the
surfaces exhibiting the flattest (least reddened) spectra belong to objects recently
injected in the near Earth orbit or they have been recently rejuvenated “fresh”
surfaces.
One mystery regarding solar wind as a primary space weathering agent re-
mains why nearly all NEOs are not more weathered than the main-belt asteroids.
Binzel et al. (2004b) find that NEOs greater than 5 km across are most similar to
main-belt asteroids, while those <5 km tend to have the best spectral matches to
ordinary chondrites. In this scenario, either the smaller NEOs are younger with
fresher surfaces or perhaps they do not have sufficient age or gravity to have devel-
oped a sufficient regolith to be susceptible to the types of irradiation effects explored
here.
Acknowledgments
Vatican Observatory is warmly acknowledged for providing us with a fragment
of meteorite Epinal. Italian Ministero dell’Istruzione, Universita e Ricerca has sup-
ported this research.
3.2 Ion irradiation: the role of elastic collisions
Based on the paper: Brunetto, R., Strazzulla, G. 2005. Elastic collisions
in ion irradiation experiments: A mechanism for space weathering of
silicates. Icarus 179, 265-273.
As I showed in the previous section, ion irradiation of ordinary chondrite Epinal
(H5) with Ar2+ 60 keV, produces darkening and reddening of the vis-NIR spectra.
In this section I report results of ion irradiation experiments performed on bulk
samples of silicate rich terrestrial rocks with a variety of ions (H+, He+, Ar+, Ar2+)
and energies (60-400 keV), and a comparison with a previous study of Epinal and
62 3. Irradiation and ablation of silicates
NEOs (Strazzulla et al., 2005). In these experiments, I have used bulk samples
because primarily interested in a comparison with our previous experiments with
the Epinal meteorite, which was a bulk sample too. The case of powdered samples
is discussed in the third part of this thesis.
Changing the ion energy and mass one can change the ion energy loss per unit
of path length and the ratio between the amount of energy lost by elastic and
inelastic (excitations and ionizations) collisions between ions and target nuclei. In
this way it is possible to investigate the physical mechanism that is responsible for
the modifications observed in the spectra.
3.2.1 Characterization of the samples
I have irradiated several samples of bulk silicate-rich rocks (surface area of about
4 cm2), supplied by the Jackson Co., North Carolina, USA. Samples come from
igneous rock fragments: ultramafic, coarse grained peridotite. Freshly cut samples
from rock fragments are used, with a surface roughness of about 100 µm.
Micro-Raman analysis was performed to characterize the samples. Raman spec-
troscopy is a useful technique in providing information about structural properties
and chemical composition; in particular the Raman microscope technique allows
the analysis of micro-sized structures (3-5 µm) in the sample matrices. Many sili-
cate micro-crystals can be identified in the sample surface; as an example, Fig. 3.6
shows two micro-Raman spectra of (Mg, Fe)2SiO4 olivine (upper panel) and (Mg,
Fe, Ca)SiO3 low-Ca pyroxene (lower panel) observed among Jackson silicates. Lu-
minescence continuum is absent here because the structures (3-5 µm) considered in
Fig. 3.6 are from pure silicate crystals, with no defects or impurities.
Raman spectra of pyroxene are characterized by the Si-O stretching modes above
800 cm−1, the Si-O-Si and O-Si-O bending modes between 500 and 760 cm−1, and
SiO4 rotation and metal-oxygen translation modes below 500 cm−1. It is well known
(Huang et al., 2000) that, for a constant Ca content, frequencies of the Raman modes
in the enstatite- ferrosilite and diopside-hedenbergite series decrease with an increase
in Fe content. Also the peak positions of olivine allow the identification of Fe and
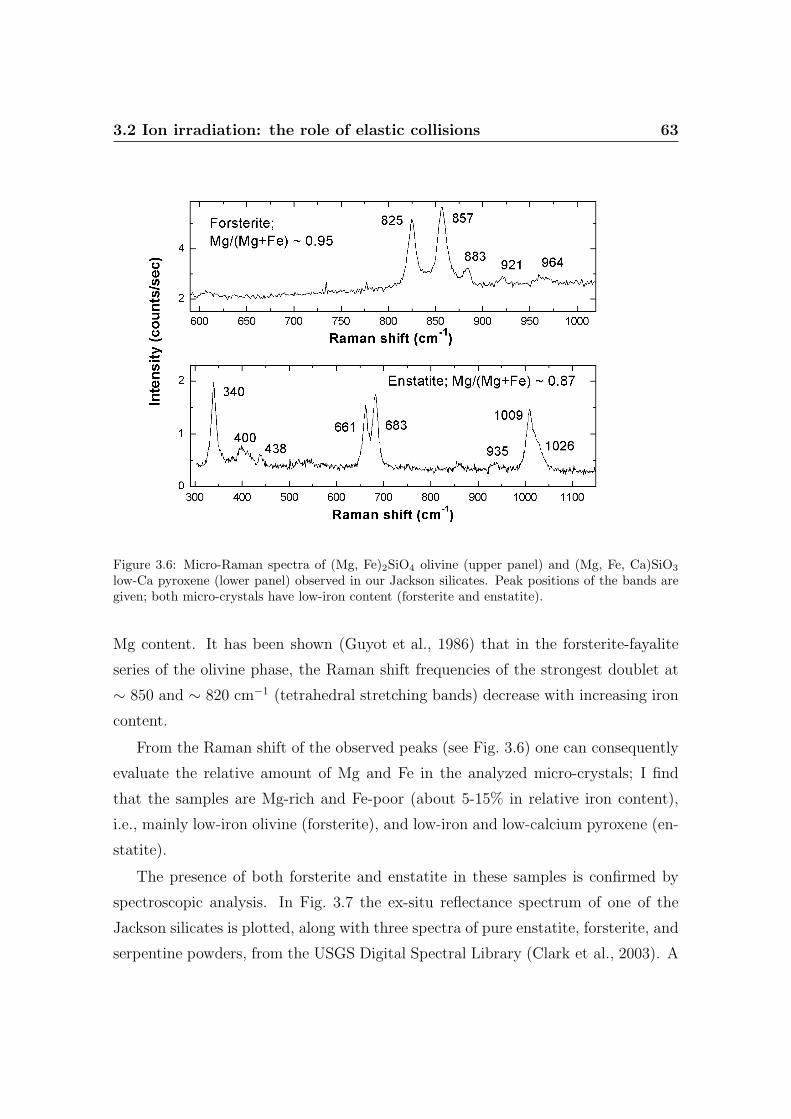
3.2 Ion irradiation: the role of elastic collisions 63
Figure 3.6: Micro-Raman spectra of (Mg, Fe)2SiO4 olivine (upper panel) and (Mg, Fe, Ca)SiO3
low-Ca pyroxene (lower panel) observed in our Jackson silicates. Peak positions of the bands aregiven; both micro-crystals have low-iron content (forsterite and enstatite).
Mg content. It has been shown (Guyot et al., 1986) that in the forsterite-fayalite
series of the olivine phase, the Raman shift frequencies of the strongest doublet at
∼ 850 and ∼ 820 cm−1 (tetrahedral stretching bands) decrease with increasing iron
content.
From the Raman shift of the observed peaks (see Fig. 3.6) one can consequently
evaluate the relative amount of Mg and Fe in the analyzed micro-crystals; I find
that the samples are Mg-rich and Fe-poor (about 5-15% in relative iron content),
i.e., mainly low-iron olivine (forsterite), and low-iron and low-calcium pyroxene (en-
statite).
The presence of both forsterite and enstatite in these samples is confirmed by
spectroscopic analysis. In Fig. 3.7 the ex-situ reflectance spectrum of one of the
Jackson silicates is plotted, along with three spectra of pure enstatite, forsterite, and
serpentine powders, from the USGS Digital Spectral Library (Clark et al., 2003). A
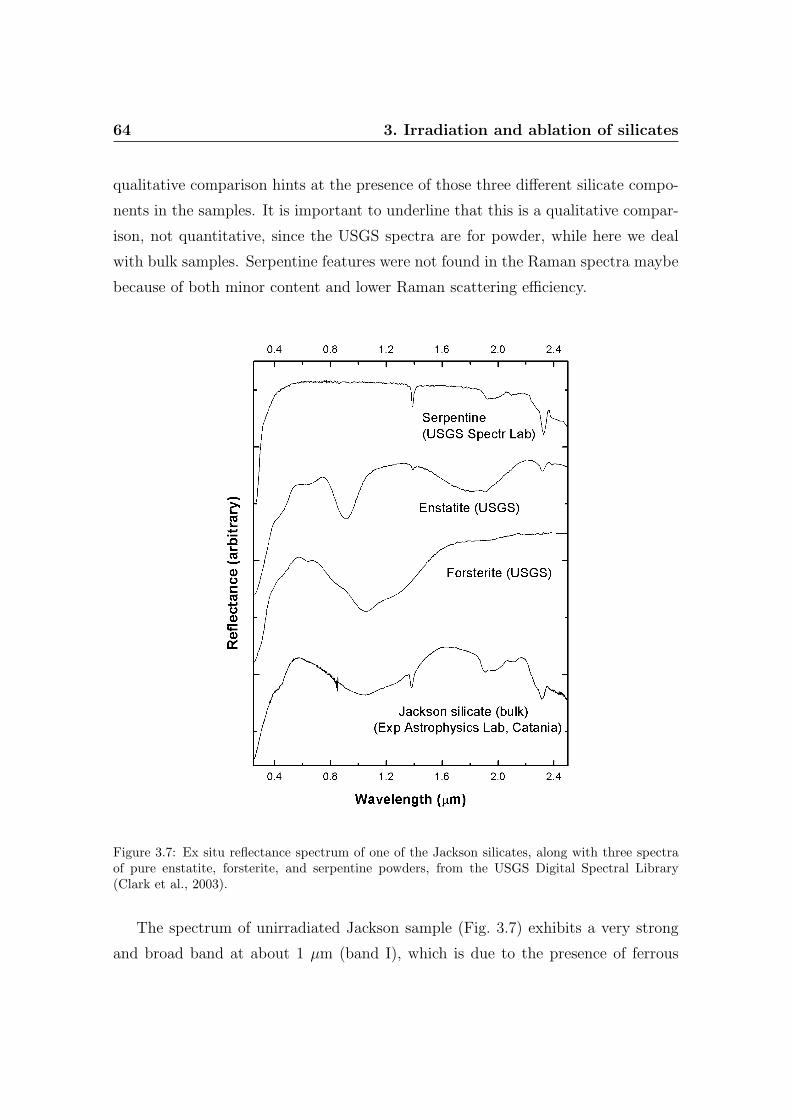
64 3. Irradiation and ablation of silicates
qualitative comparison hints at the presence of those three different silicate compo-
nents in the samples. It is important to underline that this is a qualitative compar-
ison, not quantitative, since the USGS spectra are for powder, while here we deal
with bulk samples. Serpentine features were not found in the Raman spectra maybe
because of both minor content and lower Raman scattering efficiency.
Figure 3.7: Ex situ reflectance spectrum of one of the Jackson silicates, along with three spectraof pure enstatite, forsterite, and serpentine powders, from the USGS Digital Spectral Library(Clark et al., 2003).
The spectrum of unirradiated Jackson sample (Fig. 3.7) exhibits a very strong
and broad band at about 1 µm (band I), which is due to the presence of ferrous
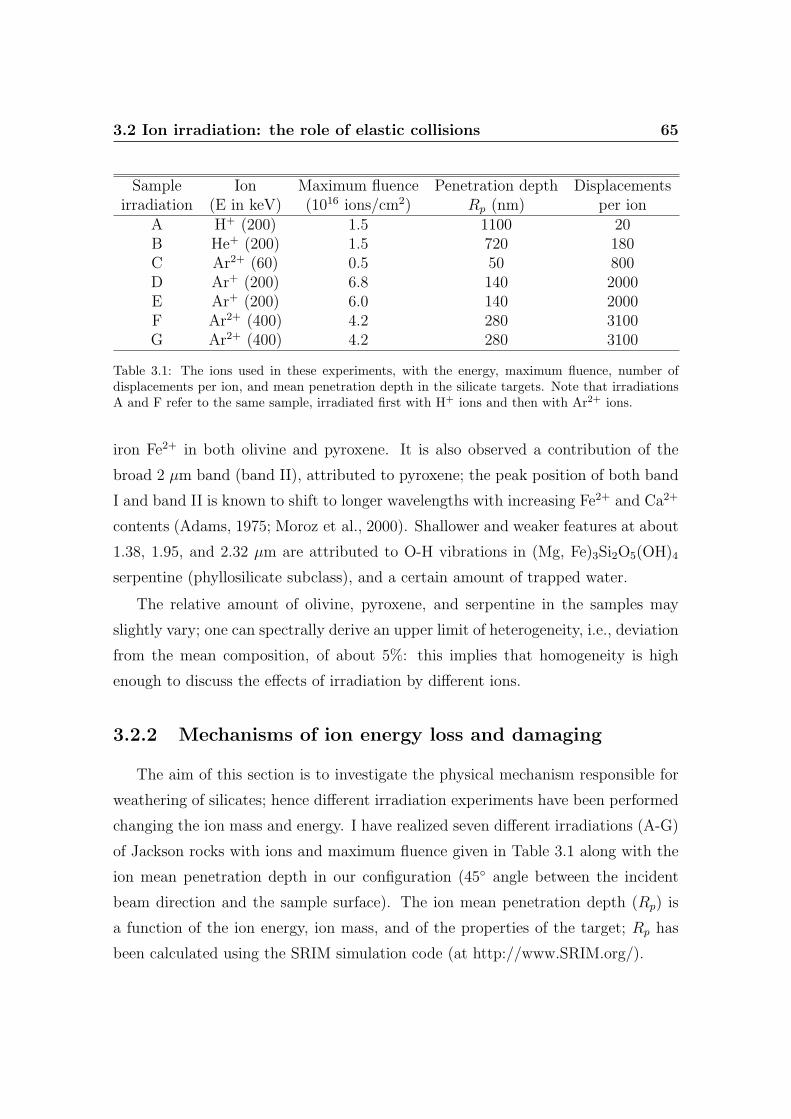
3.2 Ion irradiation: the role of elastic collisions 65
Sample Ion Maximum fluence Penetration depth Displacementsirradiation (E in keV) (1016 ions/cm2) Rp (nm) per ion
A H+ (200) 1.5 1100 20B He+ (200) 1.5 720 180C Ar2+ (60) 0.5 50 800D Ar+ (200) 6.8 140 2000E Ar+ (200) 6.0 140 2000F Ar2+ (400) 4.2 280 3100G Ar2+ (400) 4.2 280 3100
Table 3.1: The ions used in these experiments, with the energy, maximum fluence, number ofdisplacements per ion, and mean penetration depth in the silicate targets. Note that irradiationsA and F refer to the same sample, irradiated first with H+ ions and then with Ar2+ ions.
iron Fe2+ in both olivine and pyroxene. It is also observed a contribution of the
broad 2 µm band (band II), attributed to pyroxene; the peak position of both band
I and band II is known to shift to longer wavelengths with increasing Fe2+ and Ca2+
contents (Adams, 1975; Moroz et al., 2000). Shallower and weaker features at about
1.38, 1.95, and 2.32 µm are attributed to O-H vibrations in (Mg, Fe)3Si2O5(OH)4
serpentine (phyllosilicate subclass), and a certain amount of trapped water.
The relative amount of olivine, pyroxene, and serpentine in the samples may
slightly vary; one can spectrally derive an upper limit of heterogeneity, i.e., deviation
from the mean composition, of about 5%: this implies that homogeneity is high
enough to discuss the effects of irradiation by different ions.
3.2.2 Mechanisms of ion energy loss and damaging
The aim of this section is to investigate the physical mechanism responsible for
weathering of silicates; hence different irradiation experiments have been performed
changing the ion mass and energy. I have realized seven different irradiations (A-G)
of Jackson rocks with ions and maximum fluence given in Table 3.1 along with the
ion mean penetration depth in our configuration (45◦ angle between the incident
beam direction and the sample surface). The ion mean penetration depth (Rp) is
a function of the ion energy, ion mass, and of the properties of the target; Rp has
been calculated using the SRIM simulation code (at http://www.SRIM.org/).
66 3. Irradiation and ablation of silicates
The stopping power (energy deposited per unit path length) is also a function
of the ion energy and mass; ions release energy to the target atoms by elastic and
inelastic collisions. The amount of elastic versus inelastic energy loss is as well a
function of ion energy and mass, and slightly depends on the target material.
The energy lost by the colliding ions is redistributed among the species present
in the target, so that three main effects occur: (1) dislodgment of atoms from
their lattice position (vacancies and replacements), (2) ionization processes, and (3)
creation of phonons. The atoms of the recoils loose also energy and in turns cause
the same three effects.
By using the SRIM code, I have evaluated two parameters to compare the effects
of different ions and energies on silicate samples: (1) JV AC , the energy per unit
surface (keV cm−2) released by the ions to the target in vacancy formation processes;
(2) JION , the energy per unit surface (keV cm−2) released by the ions to the target
in ionization processes:
JV AC = EFfV AC (3.1)
JION = EFfION (3.2)
where E is the energy of the colliding ions (in keV), F is the ion fluence (ions/cm2),
and fV AC and fION are the fraction of the energy (per ion) released by a single ion
in vacancy formation processes and ionization processes, respectively (calculated by
the SRIM code). The contribution of recoils is also included both in JV AC and
JION . The fraction of energy released by a single ion in creation of phonons is
fPHON , where:
fV AC + fION + fPHON = 1. (3.3)
However, phonons do not contribute to the permanent damage of the target.
For given ion mass and energy, the JV AC value is strongly related to the elastic
collisions between ions and target nuclei, while the JION value is related to the
inelastic collisions. For instance, in the case of 200 keV H+ ions, about 99.6% of the
3.2 Ion irradiation: the role of elastic collisions 67
energy of the colliding ion is released in ionization processes (inelastic collisions),
while in the case of 60 keV Ar2+ ions this fION value drops down to about 54%. On
the contrary, the fV AC value (elastic collisions) is about 0.02% in the case of 200
keV H+ ions, while it grows by more than a factor of 100, up to about 2.3%, in the
case of 60 keV Ar2+ ions.
I have also evaluated the parameter d =number of displacements per cm2, i.e.,
d =(displ. per ion)×(ions cm−2); the number of displacements is given by the sum of
the vacancies, i.e., atoms removed from their lattice positions, and the replacements,
i.e., moving atoms replacing removed atoms of the same species. Actually, in the
present case replacement collisions are about 10% of the total, and the number
of vacancies is proportional to the number of displacements. All the species get
displaced. The d values also are sensitive to the elastic collisions between ions and
target nuclei; indeed d is about proportional to JV AC , and they are connected with
a progressive amorphization process of the irradiated layer.
The number of displacements per ion can be evaluated by using the SRIM code;
their values are also given in Table 3.1; as an example, moving from H+ to Ar+
ions (200 keV) the displacement collision events increase by a factor of 100. SRIM
simulation has however some limitations, e.g., it does not consider annealing, defect
diffusion, or accumulated damage.
3.2.3 Spectral modifications
All the samples listed in Table 3.1 have been studied with ex situ reflectance
spectroscopy before and after irradiation. Six of them (from A to F) have been
studied also with in situ reflectance spectroscopy, while the last one (sample G) has
been also monitored by in situ Raman spectroscopy. Irradiations A and F refer to
the same sample.
In Fig. 3.8 results are shown for irradiation of sample G with 400 keV Ar2+
ions; the intensity of the two characteristic Raman bands of forsterite decreases
with respect to the luminescence continuum, whose value increases with increasing
ion fluence (upper panel). In the lower panel of Fig. 3.8 the total area of the
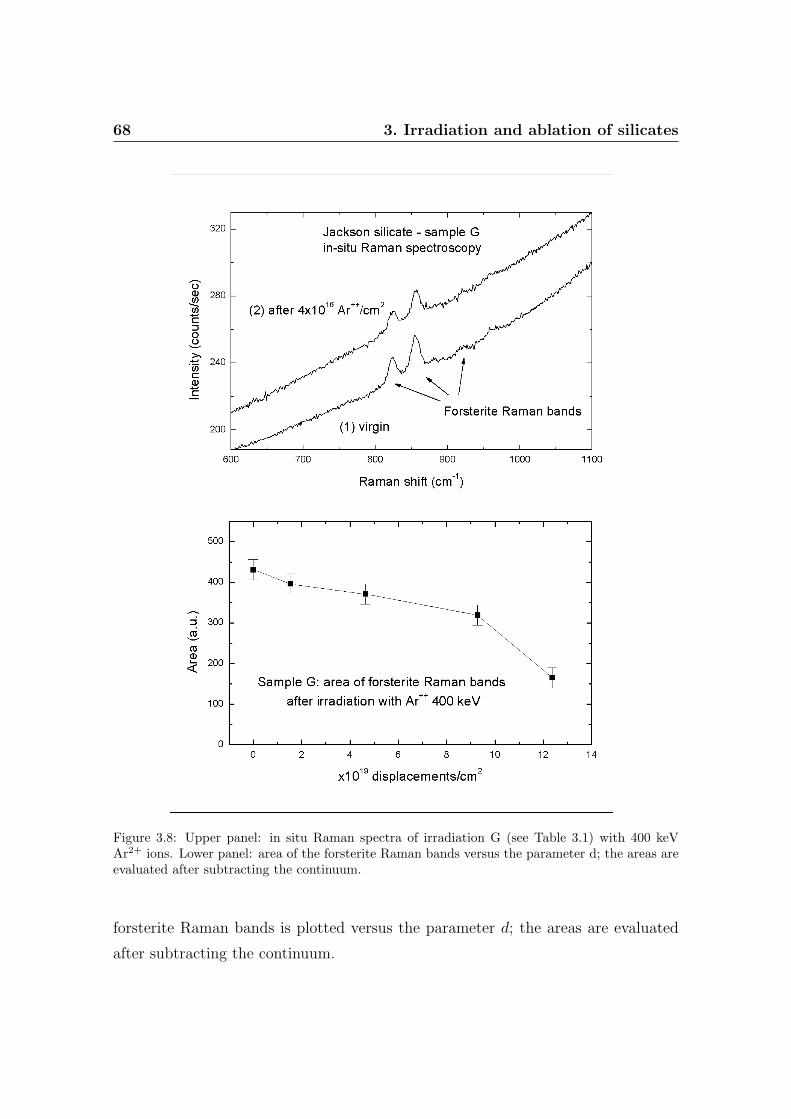
68 3. Irradiation and ablation of silicates
Figure 3.8: Upper panel: in situ Raman spectra of irradiation G (see Table 3.1) with 400 keVAr2+ ions. Lower panel: area of the forsterite Raman bands versus the parameter d; the areas areevaluated after subtracting the continuum.
forsterite Raman bands is plotted versus the parameter d; the areas are evaluated
after subtracting the continuum.
3.2 Ion irradiation: the role of elastic collisions 69
Luminescence signal is known to be associated with defects and impurities (Kachurin et al.,
1997; Khomenkova et al., 2002). In this case (in situ macro-Raman) the spot of the
laser is of about 100 µm and the luminescence signal is high. The Raman spectra
shown previously (Fig. 3.6) are ex situ micro-Raman (1-5 µm) spectra and do not
exhibit a significant continuum.
The increase of the continuum and decrease of the band areas can be interpreted
as an effect of a change in the optical properties of the upper layers of the target,
due to ion irradiation.
Indeed, while crystalline unirradiated silicates are transparent to the exciting
laser radiation (514.5 nm), in the irradiated samples the laser radiation is absorbed
in the very upper layers of the target (Rp < 1 µm), after progressive ion fluence;
this implies that a fraction of the signal in upper panel of Fig. 3.8 comes from the
unmodified target (below Rp) and its contribution decreases following the curve in
lower panel of Fig. 3.8.
Reflectance spectra of samples B and G are plotted in Fig. 3.9, collected ex
situ before and after irradiation. Strong darkening and reddening of both samples
is apparent. Furthermore, these spectral modifications are stronger in the case
of sample G than sample B. The area of band I is reduced as the slope of the
continuum across band I increases; this spectral reddening agrees with previous
experiments of ion irradiation of the Epinal meteorite (Strazzulla et al., 2005) and
laser irradiation of silicates (Sasaki et al., 2001). Similar results are obtained for the
remaining samples (A, C, D, E, F).
Reddening and darkening are observed also in situ, as it is shown in Fig. 3.10,
where spectra from the irradiations A and F (same sample) are plotted. Irradiation
with 400 keV Ar2+ has been performed after irradiation with 200 keV H+.
In Fig. 3.10, once again, ions having lower elastic stopping power (H+), in-
duce spectral modifications less pronounced than ions having higher elastic stopping
power (Ar2+), i.e., heavier ions redden and darken UV-vis-NIR spectra more effi-
ciently than lighter ions. In the lower panel of Fig. 3.10 the same spectra are shown
normalized to 1 at 0.7 µm.
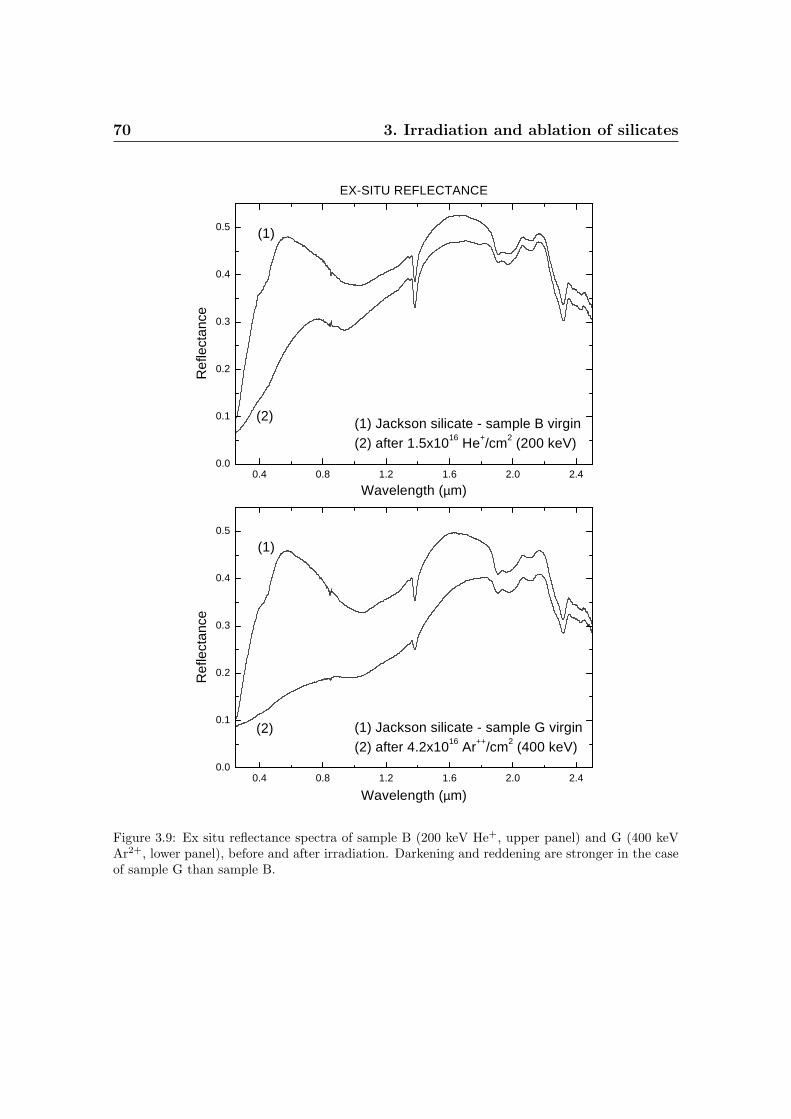
70 3. Irradiation and ablation of silicates
0.4 0.8 1.2 1.6 2.0 2.40.0
0.1
0.2
0.3
0.4
0.5
(2) (1) Jackson silicate - sample B virgin(2) after 1.5x10¹⁶ He+/cm2 (200 keV)
EX-SITU REFLECTANCER
efle
ctan
ce
Wavelength (µm)
(1)
0.4 0.8 1.2 1.6 2.0 2.40.0
0.1
0.2
0.3
0.4
0.5
Ref
lect
ance
Wavelength (µm)
(2) (1) Jackson silicate - sample G virgin(2) after 4.2x10¹⁶ Ar++/cm2 (400 keV)
(1)
Figure 3.9: Ex situ reflectance spectra of sample B (200 keV He+, upper panel) and G (400 keVAr2+, lower panel), before and after irradiation. Darkening and reddening are stronger in the caseof sample G than sample B.
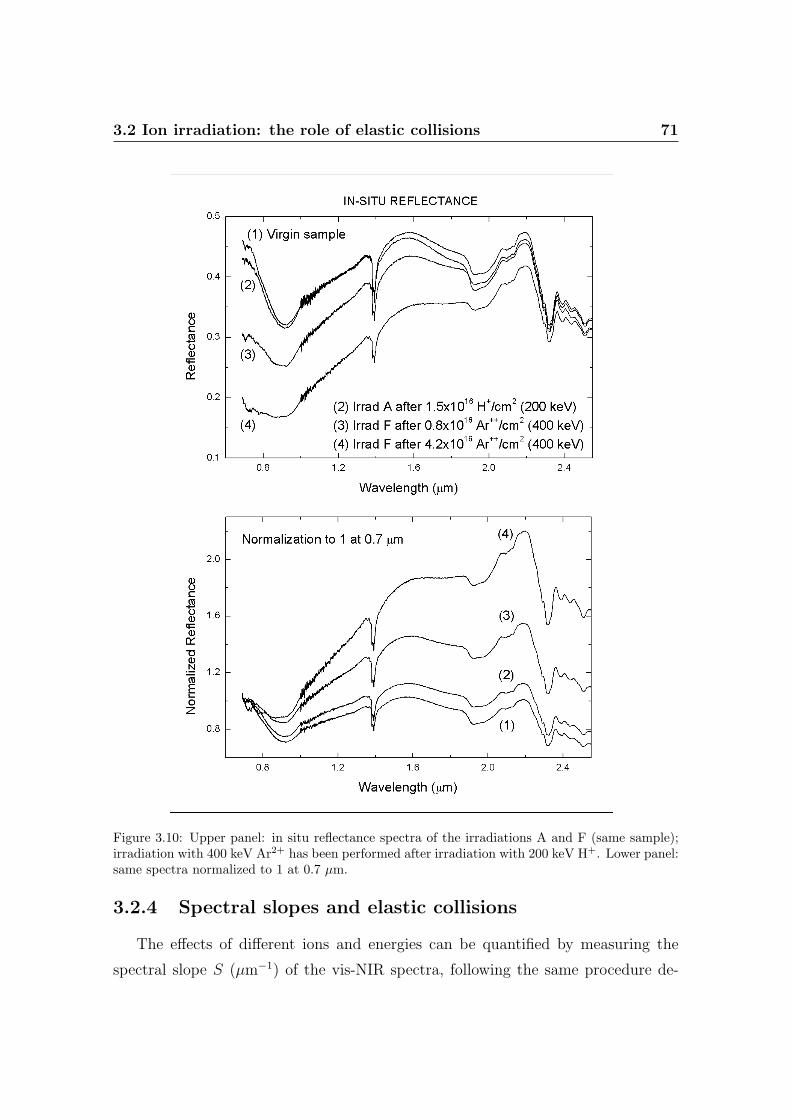
3.2 Ion irradiation: the role of elastic collisions 71
Figure 3.10: Upper panel: in situ reflectance spectra of the irradiations A and F (same sample);irradiation with 400 keV Ar2+ has been performed after irradiation with 200 keV H+. Lower panel:same spectra normalized to 1 at 0.7 µm.
3.2.4 Spectral slopes and elastic collisions
The effects of different ions and energies can be quantified by measuring the
spectral slope S (µm−1) of the vis-NIR spectra, following the same procedure de-
72 3. Irradiation and ablation of silicates
scribed by Strazzulla et al. (2005), i.e., the slope of a linear continuum above band
I (from about λa ∼ 0.7 µm to λb ∼ 1.6 µm), after normalization of the spectra at
0.7 µm.
Spectra collected in situ allow us to follow the reddening process with gradually
increasing damage value. This procedure differs from that described by other authors
(e.g., Hiroi and Sasaki (2001), because normalization here is not at 0.55 µm but at
0.7 µm; this leads to slightly lower values of slopes. One limitation of this procedure
is that the slope values may in some case (at the lower fluence) differ from those
measured ex situ, i.e., when the left shoulder of band I peaks at wavelength lower
than 0.7 µm. In such cases an overestimation of about 0.08 µm−1 is present; the S
values have been consequently corrected. In Fig. 3.11 the obtained spectral slopes are
plotted versus the parameter d, including all the points from the seven experiments
listed in Table 3.1, and the spectral slopes obtained after irradiation of the Epinal
meteorite (see above). The upper x-axis gives a rough estimate of the astrophysical
time-scale (at about 1 AU) necessary to induce the observed spectral reddening on
an asteroid surface (see above).
Several results can be drawn from Fig. 3.11:
1. the spectral slopes S measured from different ion irradiation experiments, i.e.,
different ions and energies, exhibit the same trend when plotted vs the number
of displacements per cm2;
2. the curve determined by data points is characterized by a rapid growth, which
tends to alleviate at about 2×10¹⁹ displacements cm−2 (logarithmic-like curve);
3. different samples have different starting slopes (d = 0); this is both due to
small heterogeneity (about 5%) in the relative content of olivine, pyroxene, and
serpentine, and to slightly different surface roughness properties; nevertheless
the slopes of all the samples converge to the same curve as the ion damage
increases;
4. even the points from irradiated Epinal meteorite follow the same curve, imply-
ing that these effects can be observed both in terrestrial and extraterrestrial
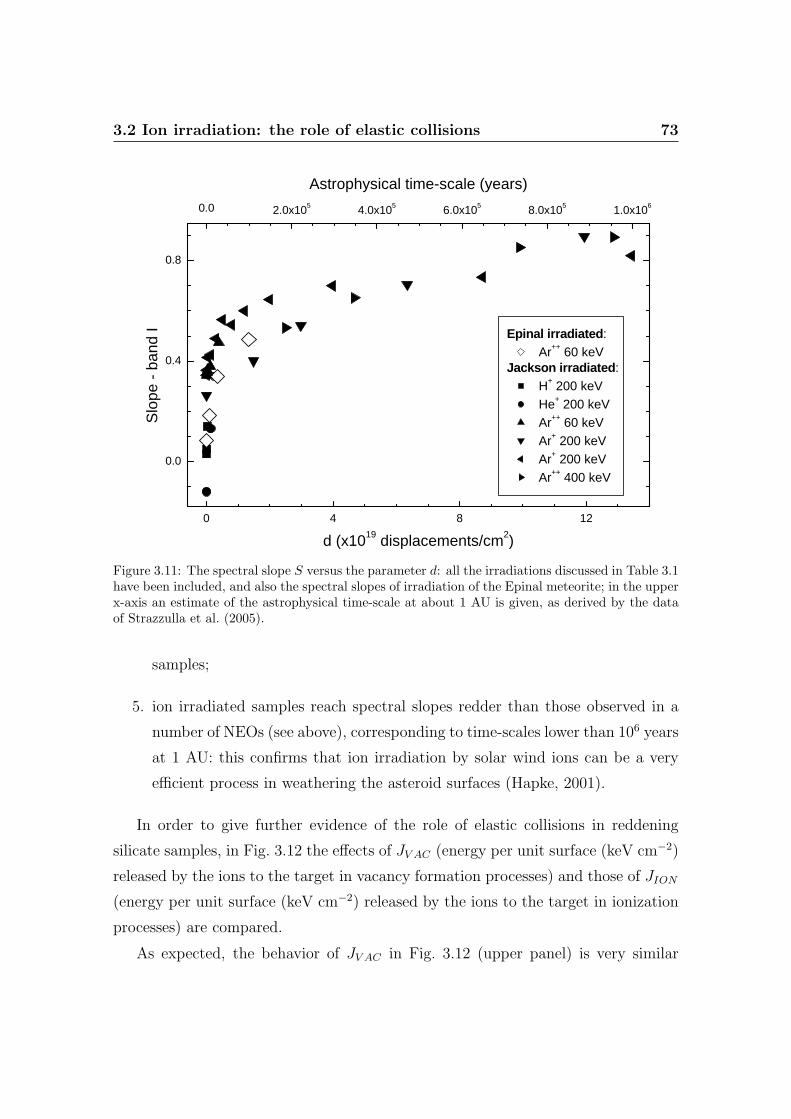
3.2 Ion irradiation: the role of elastic collisions 73
0 4 8 12
0.0
0.4
0.8
0.0 2.0x10⁵ 4.0x10⁵ 6.0x10⁵ 8.0x10⁵ 1.0x10⁶
Epinal irradiated: Ar++ 60 keV
Jackson irradiated: H+ 200 keV He+ 200 keV Ar++ 60 keV Ar+ 200 keV Ar+ 200 keV Ar++ 400 keV
Slo
pe -
ban
d I
d (x1019 displacements/cm2)
Astrophysical time-scale (years)
Figure 3.11: The spectral slope S versus the parameter d: all the irradiations discussed in Table 3.1have been included, and also the spectral slopes of irradiation of the Epinal meteorite; in the upperx-axis an estimate of the astrophysical time-scale at about 1 AU is given, as derived by the dataof Strazzulla et al. (2005).
samples;
5. ion irradiated samples reach spectral slopes redder than those observed in a
number of NEOs (see above), corresponding to time-scales lower than 106 years
at 1 AU: this confirms that ion irradiation by solar wind ions can be a very
efficient process in weathering the asteroid surfaces (Hapke, 2001).
In order to give further evidence of the role of elastic collisions in reddening
silicate samples, in Fig. 3.12 the effects of JV AC (energy per unit surface (keV cm−2)
released by the ions to the target in vacancy formation processes) and those of JION
(energy per unit surface (keV cm−2) released by the ions to the target in ionization
processes) are compared.
As expected, the behavior of JV AC in Fig. 3.12 (upper panel) is very similar
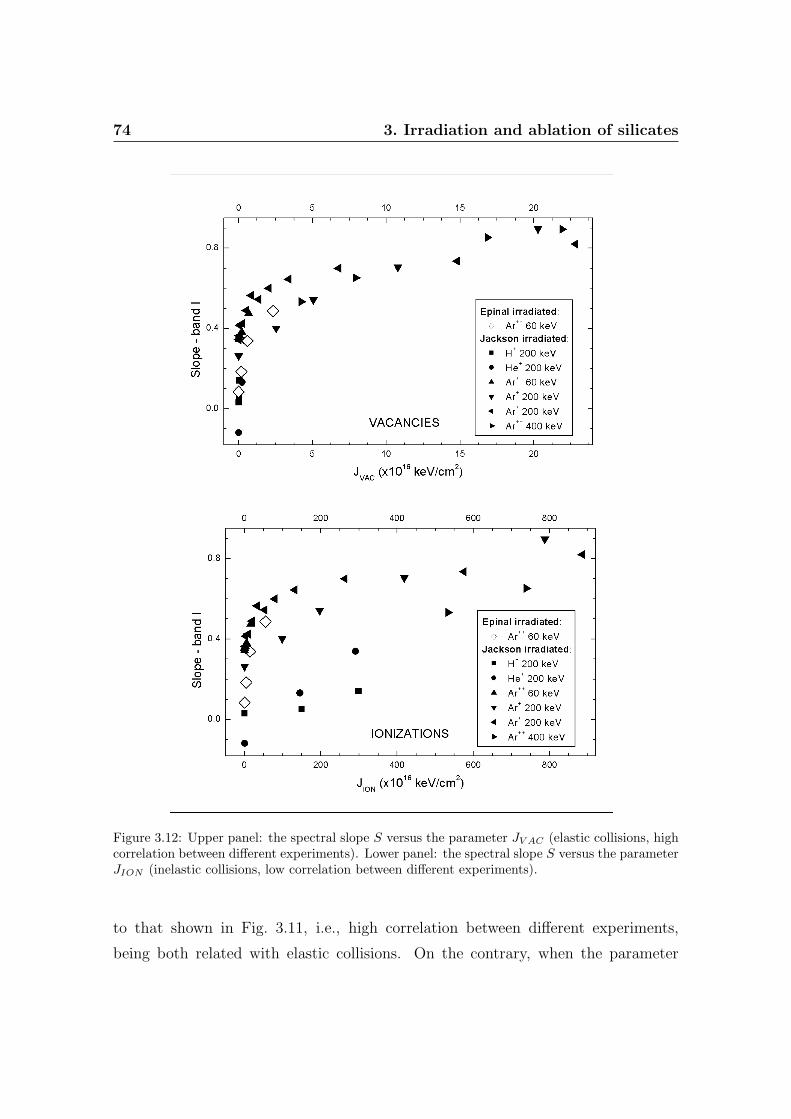
74 3. Irradiation and ablation of silicates
Figure 3.12: Upper panel: the spectral slope S versus the parameter JV AC (elastic collisions, highcorrelation between different experiments). Lower panel: the spectral slope S versus the parameterJION (inelastic collisions, low correlation between different experiments).
to that shown in Fig. 3.11, i.e., high correlation between different experiments,
being both related with elastic collisions. On the contrary, when the parameter
3.2 Ion irradiation: the role of elastic collisions 75
JION is considered (lower panel), correlation between the experiments gets lost: in
particular the points relative to irradiation with lighter ions (H+, He+), i.e., lower
elastic stopping power, move apart from that of heavier ions (Ar+), i.e., higher
elastic stopping power. Hence it is demonstrated that ion irradiation induces a
reddening of the reflectance spectrum of bulk silicates, which is strongly related
with the energy lost by elastic collisions with the target nuclei: heavier ions redden
and darken UV-vis-NIR spectra more efficiently than lighter ions.
Conclusions
Ion irradiation experiments of bulk silicates, rich of olivine, pyroxene, and serpen-
tine, have been performed using different ions (H+, He+, Ar+, Ar2+) having different
energies (from 60 to 400 keV) to weather the samples, simulating the effects of space
weathering induced on asteroids by solar wind ions.
UV-vis-NIR reflectance spectra have shown reddening and darkening in the 0.25-
2.7 µm spectral range. The increase of the band I spectral slope is strongly related
with the number of displacements caused by colliding ions inside the sample, or the
energy per unit surface released by the ions in vacancy formation processes, i.e., the
elastic collisions with the target nuclei.
Thus, reddening and darkening can be attributed both to amorphization of the
very upper layers (Rp < 1 µm) of the samples, and to sputtering of iron from silicates
and the deposition of nanophase neutral Fe on adjacent grains (Hapke, 2001), since
the two processes can correlate with the nuclear stopping power.
Since the studied samples can be considered bulk mixtures of silicates, further
experiments are needed to study whether silicate samples having pure chemical
composition (the so called end-members) suffer of spectral modifications analogous
to those described in this section. Moreover it is important to study ion irradiation
effects on powdered silicates, since it is well known that spectral properties of silicate
powder change with grain size, and this can be also a measure of aqueous alteration
(Orofino et al., 2006). Those results are described in the third part of the thesis.
76 3. Irradiation and ablation of silicates
Acknowledgments
We are grateful to V. Orofino for supporting and providing useful suggestions.
We also thank G.A. Baratta and F. Spinella for help in performing the experiments.
This research was supported by the Italian Ministero dell’Istruzione, Universita e
Ricerca (MIUR).
3.3 Laser irradiation below and above the abla-
tion threshold
Based on the paper: Brunetto, R., Romano, F., Blanco, A., Fonti, S.,
Martino, M., Orofino, V., Verrienti, C. 2006. Space weathering of
silicates simulated by nanosecond pulse UV excimer laser. Icarus 180,
546-554.
In this section I present the results of laser irradiation experiments performed on
pellets of powdered silicates, having different composition (orthopyroxene, clinopy-
roxene, olivine); a nanosecond pulse UV excimer laser is used, at two different
wavelength, 193 and 248 nm, to simulate the effects of space weathering induced on
minor bodies of the Solar System by micrometeorite bombardment.
These experiments are aimed to extend the previous results, by considering a
larger number of experimental situations. Indeed, different fluences, from 0.05 to 2
J/cm2, are used to weather the samples, experimenting below and above the ablation
threshold. In fact, at the present time nobody knows which regime is the closest
simulation to space-weathering process. For instance, uncontrolled melting could be
a part of the phenomenon occurring in micrometeorite impacts onto airless bodies.
The irradiated and ablated targets are studied by modifications of their UV-vis-
NIR reflectance spectra and XPS (X-ray Photoelectron Spectroscopy) analysis.
3.3.1 Spectral modifications
Irradiated samples are pellets of pressed (about 8 t for 60 s) silicate pow-
ders having average grain size of a few µm, in particular (Mg,Fe)2SiO4 olivine,
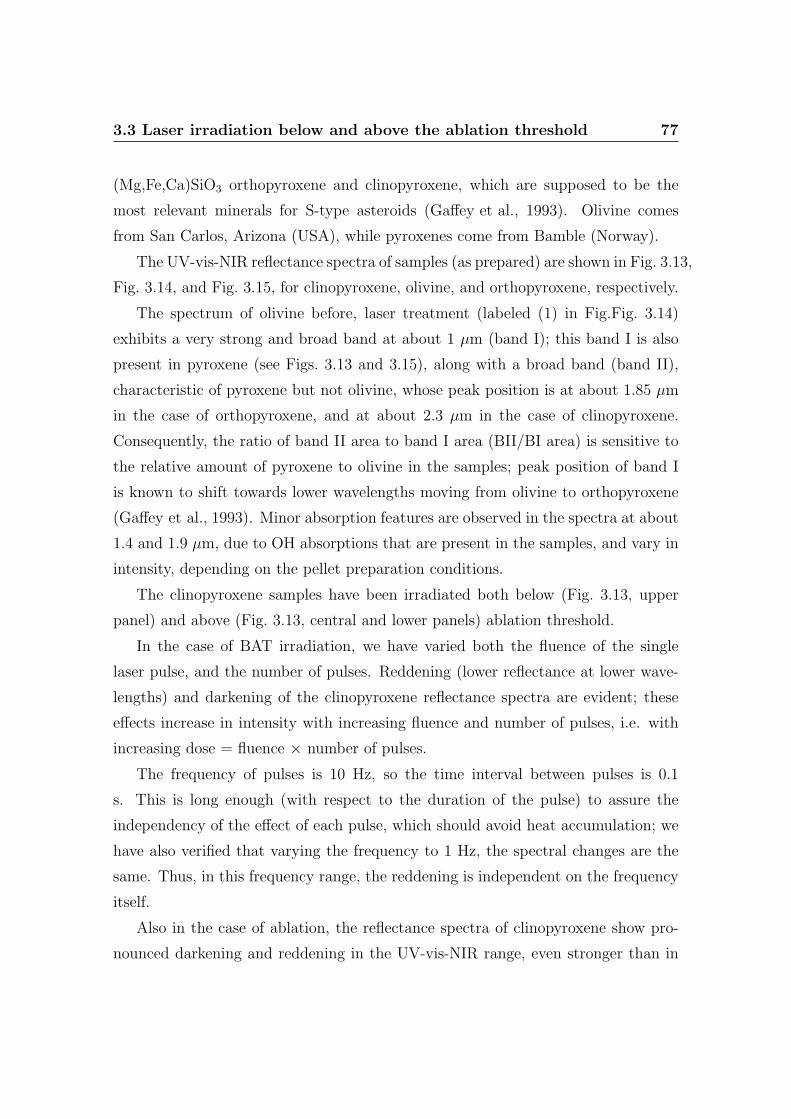
3.3 Laser irradiation below and above the ablation threshold 77
(Mg,Fe,Ca)SiO3 orthopyroxene and clinopyroxene, which are supposed to be the
most relevant minerals for S-type asteroids (Gaffey et al., 1993). Olivine comes
from San Carlos, Arizona (USA), while pyroxenes come from Bamble (Norway).
The UV-vis-NIR reflectance spectra of samples (as prepared) are shown in Fig. 3.13,
Fig. 3.14, and Fig. 3.15, for clinopyroxene, olivine, and orthopyroxene, respectively.
The spectrum of olivine before, laser treatment (labeled (1) in Fig.Fig. 3.14)
exhibits a very strong and broad band at about 1 µm (band I); this band I is also
present in pyroxene (see Figs. 3.13 and 3.15), along with a broad band (band II),
characteristic of pyroxene but not olivine, whose peak position is at about 1.85 µm
in the case of orthopyroxene, and at about 2.3 µm in the case of clinopyroxene.
Consequently, the ratio of band II area to band I area (BII/BI area) is sensitive to
the relative amount of pyroxene to olivine in the samples; peak position of band I
is known to shift towards lower wavelengths moving from olivine to orthopyroxene
(Gaffey et al., 1993). Minor absorption features are observed in the spectra at about
1.4 and 1.9 µm, due to OH absorptions that are present in the samples, and vary in
intensity, depending on the pellet preparation conditions.
The clinopyroxene samples have been irradiated both below (Fig. 3.13, upper
panel) and above (Fig. 3.13, central and lower panels) ablation threshold.
In the case of BAT irradiation, we have varied both the fluence of the single
laser pulse, and the number of pulses. Reddening (lower reflectance at lower wave-
lengths) and darkening of the clinopyroxene reflectance spectra are evident; these
effects increase in intensity with increasing fluence and number of pulses, i.e. with
increasing dose = fluence × number of pulses.
The frequency of pulses is 10 Hz, so the time interval between pulses is 0.1
s. This is long enough (with respect to the duration of the pulse) to assure the
independency of the effect of each pulse, which should avoid heat accumulation; we
have also verified that varying the frequency to 1 Hz, the spectral changes are the
same. Thus, in this frequency range, the reddening is independent on the frequency
itself.
Also in the case of ablation, the reflectance spectra of clinopyroxene show pro-
nounced darkening and reddening in the UV-vis-NIR range, even stronger than in
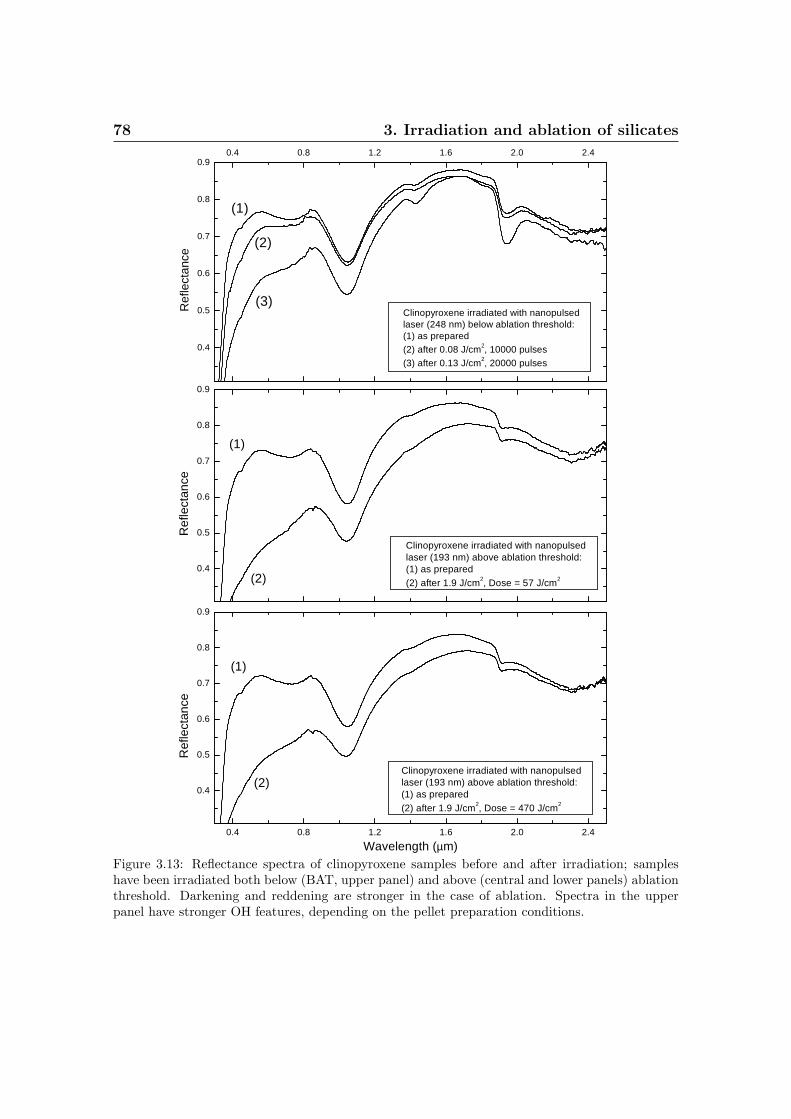
78 3. Irradiation and ablation of silicates
0.4 0.8 1.2 1.6 2.0 2.4
0.4
0.5
0.6
0.7
0.8
0.9
(3)
Ref
lect
ance
Clinopyroxene irradiated with nanopulsedlaser (248 nm) below ablation threshold:(1) as prepared(2) after 0.08 J/cm2, 10000 pulses(3) after 0.13 J/cm2, 20000 pulses
(1)
(2)
0.4 0.8 1.2 1.6 2.0 2.4
0.4
0.5
0.6
0.7
0.8
0.9
Ref
lect
ance
Wavelength (µm)
Clinopyroxene irradiated with nanopulsedlaser (193 nm) above ablation threshold:(1) as prepared(2) after 1.9 J/cm2, Dose = 470 J/cm2
(1)
(2)
0.4
0.5
0.6
0.7
0.8
0.9
Ref
lect
ance
Clinopyroxene irradiated with nanopulsedlaser (193 nm) above ablation threshold:(1) as prepared(2) after 1.9 J/cm2, Dose = 57 J/cm2
(1)
(2)
Figure 3.13: Reflectance spectra of clinopyroxene samples before and after irradiation; sampleshave been irradiated both below (BAT, upper panel) and above (central and lower panels) ablationthreshold. Darkening and reddening are stronger in the case of ablation. Spectra in the upperpanel have stronger OH features, depending on the pellet preparation conditions.
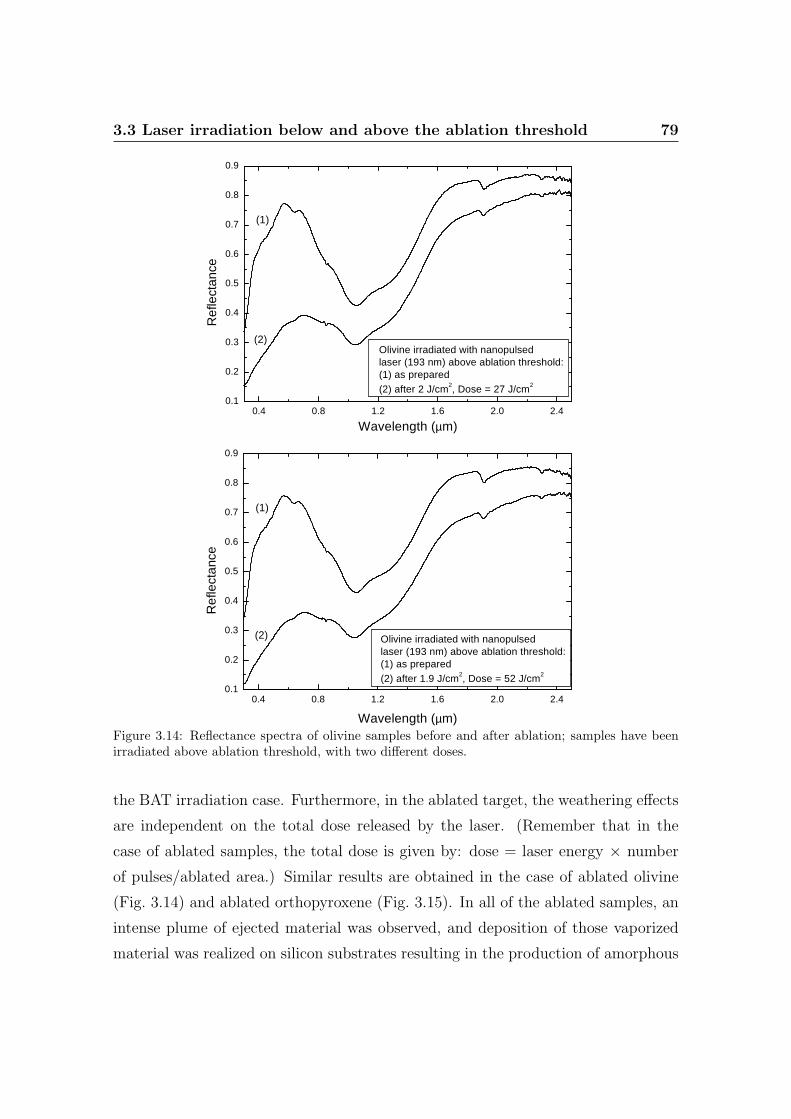
3.3 Laser irradiation below and above the ablation threshold 79
0.4 0.8 1.2 1.6 2.0 2.40.1
0.2
0.3
0.4
0.5
0.6
0.7
0.8
0.9
Ref
lect
ance
Wavelength (µm)
Olivine irradiated with nanopulsedlaser (193 nm) above ablation threshold:(1) as prepared(2) after 2 J/cm2, Dose = 27 J/cm2
(1)
(2)
0.4 0.8 1.2 1.6 2.0 2.40.1
0.2
0.3
0.4
0.5
0.6
0.7
0.8
0.9
Ref
lect
ance
Wavelength (µm)
Olivine irradiated with nanopulsedlaser (193 nm) above ablation threshold:(1) as prepared(2) after 1.9 J/cm2, Dose = 52 J/cm2
(1)
(2)
Figure 3.14: Reflectance spectra of olivine samples before and after ablation; samples have beenirradiated above ablation threshold, with two different doses.
the BAT irradiation case. Furthermore, in the ablated target, the weathering effects
are independent on the total dose released by the laser. (Remember that in the
case of ablated samples, the total dose is given by: dose = laser energy × number
of pulses/ablated area.) Similar results are obtained in the case of ablated olivine
(Fig. 3.14) and ablated orthopyroxene (Fig. 3.15). In all of the ablated samples, an
intense plume of ejected material was observed, and deposition of those vaporized
material was realized on silicon substrates resulting in the production of amorphous
80 3. Irradiation and ablation of silicates
0.4 0.8 1.2 1.6 2.0 2.40.1
0.2
0.3
0.4
0.5
0.6
0.7
0.8
0.9
Ref
lect
ance
Wavelength (µm)
Orthopyroxene irradiated with nanopulsedlaser (193 nm) above ablation threshold:(1) as prepared(2) after 2 J/cm2, Dose = 86 J/cm2
(1)
(2)
0.4 0.8 1.2 1.6 2.0 2.40.1
0.2
0.3
0.4
0.5
0.6
0.7
0.8
0.9
Ref
lect
ance
Wavelength (µm)
Orthopyroxene irradiated with nanopulsedlaser (193 nm) above ablation threshold:(1) as prepared(2) after 2 J/cm2, Dose = 43 J/cm2
(1)
(2)
Figure 3.15: Same as Fig. 3.14, but for orthopyroxene samples.
silicate films. Analysis of these deposits, by means of a Scanning Electron Micro-
scope, is planned in forthcoming experiments.
Note that in the case of olivine, a dose of 27 J/cm2 is able to induce strong
darkening and reddening; in these experimental conditions, this dose value corre-
sponds to about a single complete cycle of motion (spinning and spanning) of the
target. This means that, in UV ablating conditions, a single passage of the laser
on the sample surface is sufficient to induce the observed weathering effects, whose
3.3 Laser irradiation below and above the ablation threshold 81
intensity does not change with further repeated ablation cycles.
In order to quantify the produced weathering effects, and to compare them with
those observed in asteroids and previous laser irradiation experiments (Yamada et al.,
1999), the reflectance spectra have been scaled to 1 at 0.55 µm, to consequently eval-
uate the spectral slope, as the slope of a linear continuum across band I (as described
by Gaffey et al. (1993), or by Hiroi and Sasaki (2001)). The scaled spectra are plot-
ted in Fig. 3.16; different samples of the same end-member silicate may slightly differ
in the initial spectral slope. From Fig. 3.16, it is apparent that ablated clinopyrox-
ene reaches spectral slopes higher than BAT irradiated clinopyroxene, implying that
weathering effects are more efficient for ablation than for BAT irradiation.
Moreover, Fig. 3.16 shows that ablated olivine reaches the highest slope observed
in this work; this is in agreement with what reported by Hiroi and Sasaki (2001),
who found that olivine is weathered at higher level than pyroxene.
3.3.2 Discussion
Since the spectral slope is a good parameter to describe the weathering of sil-
icates, we have analyzed the slope value as a function of fluence and number of
pulses, for clinopyroxene. Results are plotted in Fig. 3.17: in the left panel the
fluence is fixed, while in the right panel the number of pulses is fixed. Below the
ablation threshold, the spectral slope increases linearly with both increasing fluence
or number of pulses.
The left panel of Fig. 3.17 includes also the points of ablated clinopyroxene. The
point at about 1000 number of pulses corresponds to about two complete cycles of
the motion of the target; this comparison shows that ablation is much more efficient,
and that the first cycles are enough to reach the highest slope.
The difference between the two regimes has to be ascribed mainly to the dif-
ferent effects of the interaction of the laser with the target surface. Irradiation of
a solid with a laser fluence below the ablation threshold, induces changes in the
morphology and microstructure of the surface, generation of defects and depletion
of one or several components of the target. Even for very low fluences, laser-induced
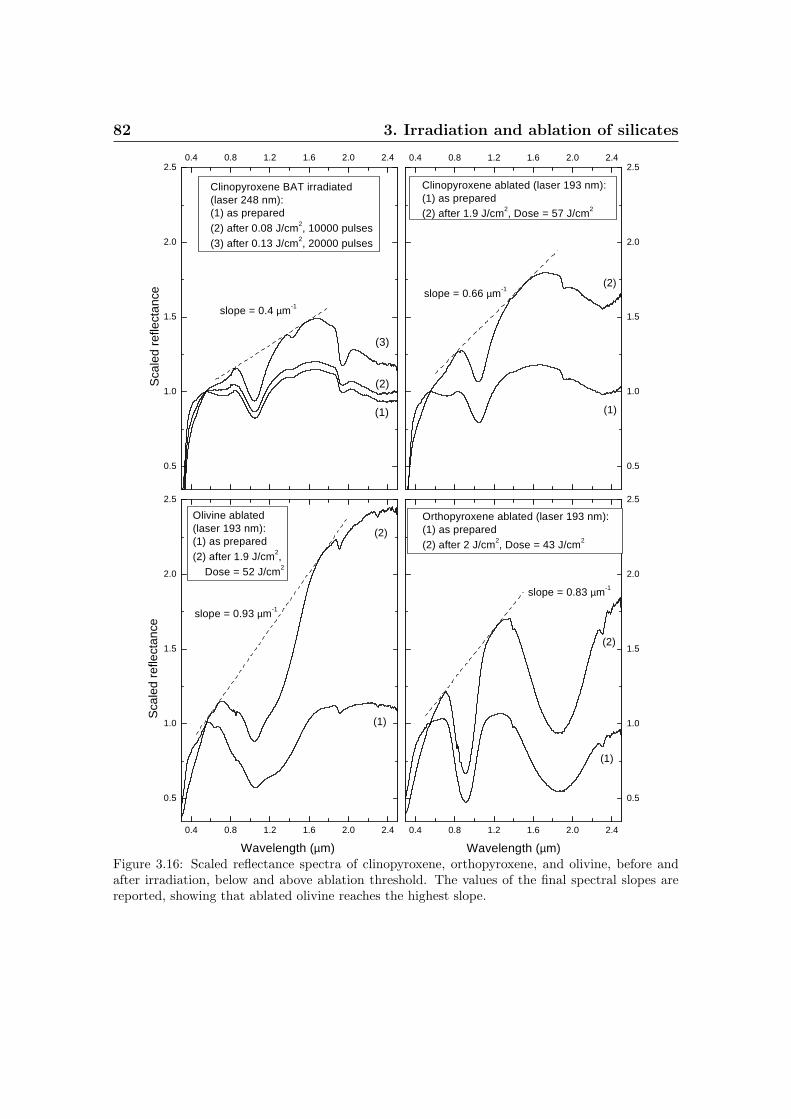
82 3. Irradiation and ablation of silicates
0.4 0.8 1.2 1.6 2.0 2.4
0.5
1.0
1.5
2.0
2.5
slope = 0.66 µm-1
Clinopyroxene ablated (laser 193 nm):(1) as prepared(2) after 1.9 J/cm2, Dose = 57 J/cm2
(1)
(2)
0.4 0.8 1.2 1.6 2.0 2.4
0.5
1.0
1.5
2.0
2.5
Sca
led
refle
ctan
ce
Wavelength (µm)
Olivine ablated (laser 193 nm):(1) as prepared(2) after 1.9 J/cm2, Dose = 52 J/cm2
(1)
(2)
slope = 0.93 µm-1
0.4 0.8 1.2 1.6 2.0 2.4
0.5
1.0
1.5
2.0
2.5
slope = 0.83 µm-1
Wavelength (µm)
Orthopyroxene ablated (laser 193 nm):(1) as prepared(2) after 2 J/cm2, Dose = 43 J/cm2
(1)
(2)
0.4 0.8 1.2 1.6 2.0 2.4
0.5
1.0
1.5
2.0
2.5
slope = 0.4 µm-1
(3)
S
cale
d re
flect
ance
Clinopyroxene BAT irradiated(laser 248 nm):(1) as prepared(2) after 0.08 J/cm2, 10000 pulses(3) after 0.13 J/cm2, 20000 pulses
(1)
(2)
Figure 3.16: Scaled reflectance spectra of clinopyroxene, orthopyroxene, and olivine, before andafter irradiation, below and above ablation threshold. The values of the final spectral slopes arereported, showing that ablated olivine reaches the highest slope.
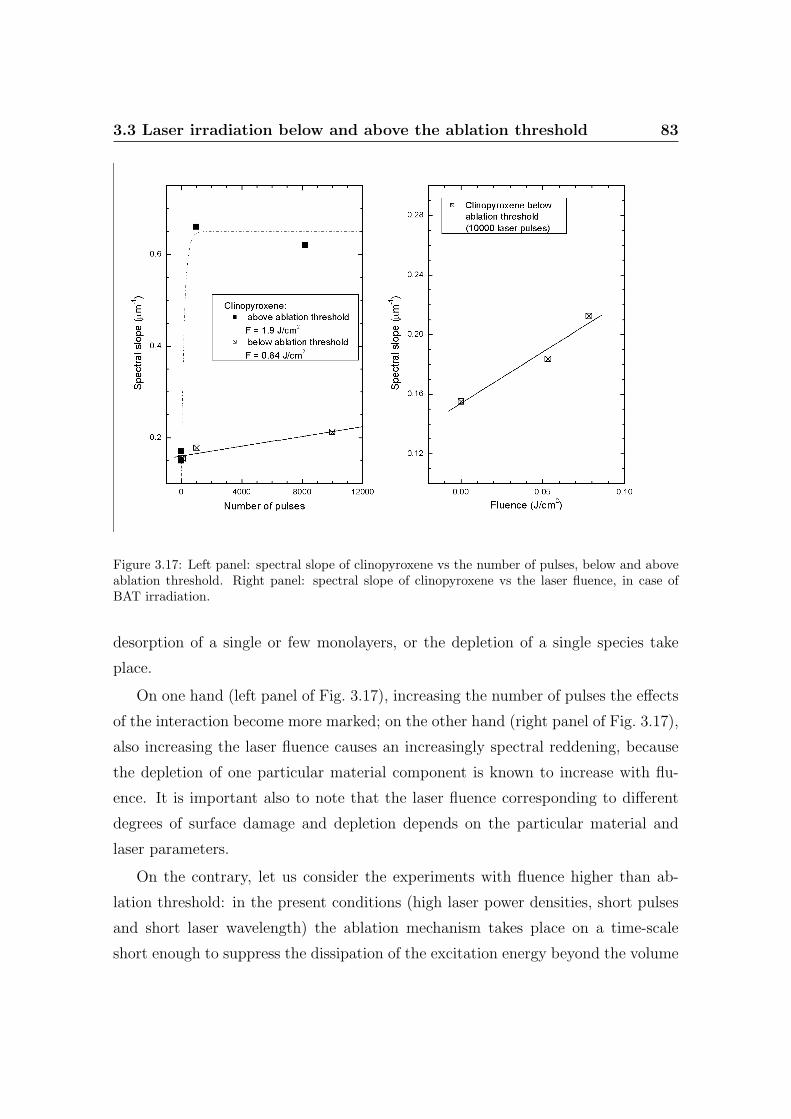
3.3 Laser irradiation below and above the ablation threshold 83
Figure 3.17: Left panel: spectral slope of clinopyroxene vs the number of pulses, below and aboveablation threshold. Right panel: spectral slope of clinopyroxene vs the laser fluence, in case ofBAT irradiation.
desorption of a single or few monolayers, or the depletion of a single species take
place.
On one hand (left panel of Fig. 3.17), increasing the number of pulses the effects
of the interaction become more marked; on the other hand (right panel of Fig. 3.17),
also increasing the laser fluence causes an increasingly spectral reddening, because
the depletion of one particular material component is known to increase with flu-
ence. It is important also to note that the laser fluence corresponding to different
degrees of surface damage and depletion depends on the particular material and
laser parameters.
On the contrary, let us consider the experiments with fluence higher than ab-
lation threshold: in the present conditions (high laser power densities, short pulses
and short laser wavelength) the ablation mechanism takes place on a time-scale
short enough to suppress the dissipation of the excitation energy beyond the volume
84 3. Irradiation and ablation of silicates
ablated during the pulse; consequently, the segregation of the remaining target into
different components can be largely avoided. In this regime of interaction, the rel-
ative concentration of species within the plasma plume remains almost unchanged
for successive laser pulses and equal to those of the target, resulting in congruent
ablation. In this regime heat loading of the target and material segregation remain
small.
This scenario can give an explanation of the different spectral behavior; in case
of ablation the highest slope is almost immediately reached. The effect is then
saturated: a further increase in the number of laser pulses has only the effect of
ablating material of the same composition of the starting target, i.e. the grains fly
away from the pellet.
The linear increase of spectral slope, shown in Fig. 3.17 for clinopyroxene below
ablation threshold, implies that the slope value of BAT irradiated samples increases
linearly with increasing laser dose. This is also shown in Fig. 3.18, where the spec-
tral slope is plotted vs. the dose: it includes the points from our samples (BAT
irradiated and ablated), and the values for olivine and orthopyroxene as derived
by the published data of Hiroi and Sasaki (2001); in their experiments, both laser
energy and number of pulses were varied, so that it is possible to plot their spectral
slopes vs. the total dose; in particular they ablated olivine and orthopyroxene using
an IR laser, up to a dose of 24 and 480 J/cm2, respectively.
Also the points from Hiroi and Sasaki (2001) follow a linear trend with increasing
dose. Nevertheless, their experimental values seem to be somehow in between results
of this thesis obtained in BAT irradiation and ablation regimes. Indeed, Fig. 3.18
reveals that there are some differences between our ablation experiments and those
of Hiroi and Sasaki (2001): while they had to increase the dose to reach the highest
slopes, in the ablation experiments described here the slope is not influenced by the
dose, i.e. the strongest reddening is already observed at the first dose; furthermore,
the slopes values obtained for both ablated olivine and ablated orthopyroxene are
about 50% higher than those of Hiroi and Sasaki (2001).
The comparison between UV and IR is referred to the total dose, and scaled to
the power of the laser, so that the difference between the two regimes is intrinsically
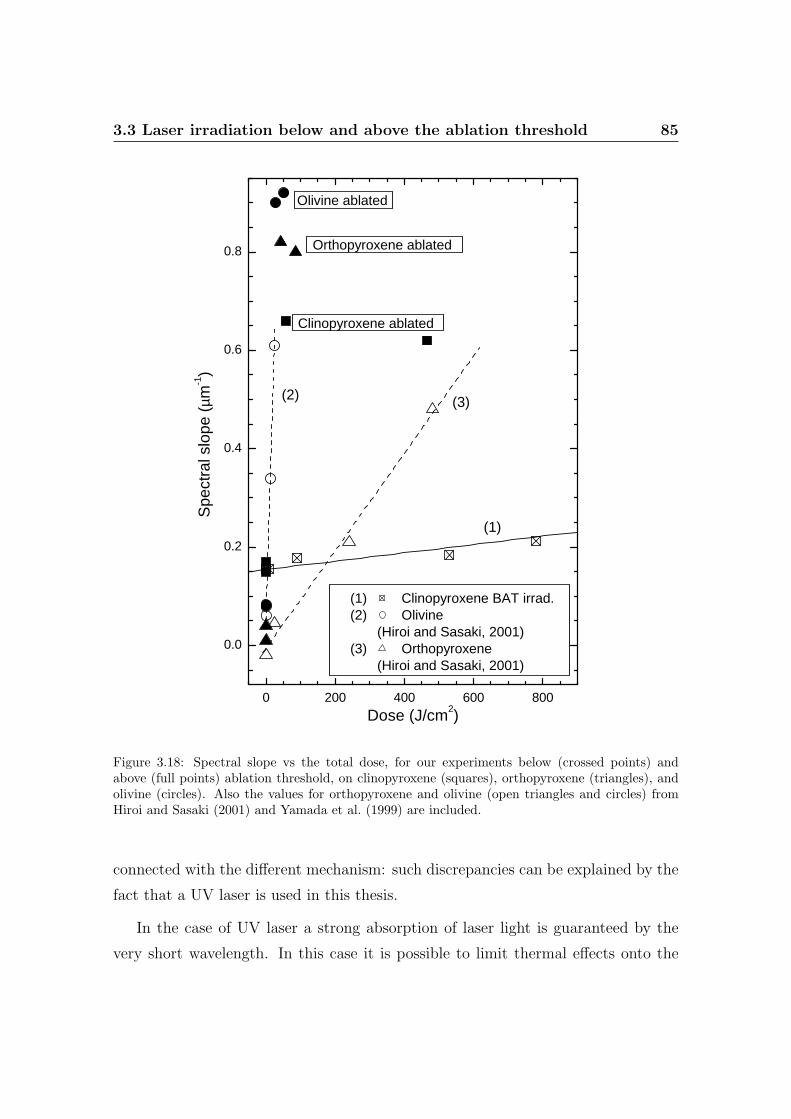
3.3 Laser irradiation below and above the ablation threshold 85
0 200 400 600 800
0.0
0.2
0.4
0.6
0.8
Olivine ablated
Orthopyroxene ablated
(1) Clinopyroxene BAT irrad.(2) Olivine (Hiroi and Sasaki, 2001)(3) Orthopyroxene (Hiroi and Sasaki, 2001)
(3)(2)
Clinopyroxene ablated
Spe
ctra
l slo
pe (
µm-1)
Dose (J/cm2)
(1)
Figure 3.18: Spectral slope vs the total dose, for our experiments below (crossed points) andabove (full points) ablation threshold, on clinopyroxene (squares), orthopyroxene (triangles), andolivine (circles). Also the values for orthopyroxene and olivine (open triangles and circles) fromHiroi and Sasaki (2001) and Yamada et al. (1999) are included.
connected with the different mechanism: such discrepancies can be explained by the
fact that a UV laser is used in this thesis.
In the case of UV laser a strong absorption of laser light is guaranteed by the
very short wavelength. In this case it is possible to limit thermal effects onto the
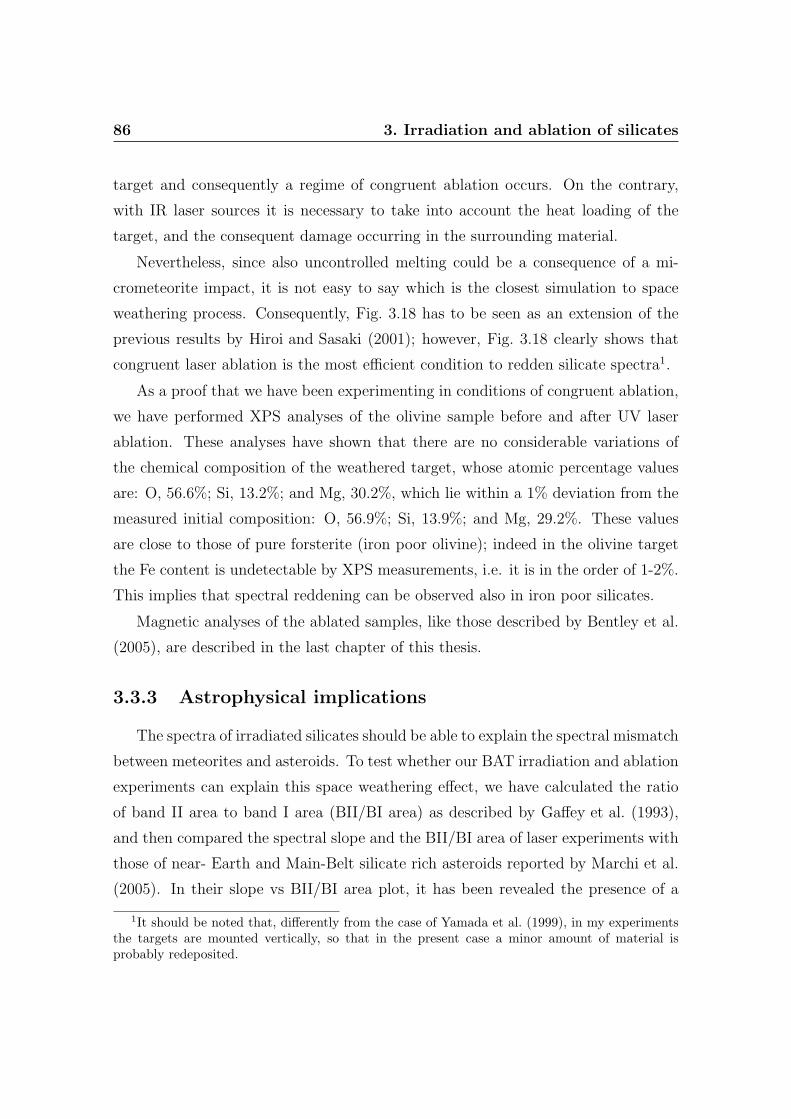
86 3. Irradiation and ablation of silicates
target and consequently a regime of congruent ablation occurs. On the contrary,
with IR laser sources it is necessary to take into account the heat loading of the
target, and the consequent damage occurring in the surrounding material.
Nevertheless, since also uncontrolled melting could be a consequence of a mi-
crometeorite impact, it is not easy to say which is the closest simulation to space
weathering process. Consequently, Fig. 3.18 has to be seen as an extension of the
previous results by Hiroi and Sasaki (2001); however, Fig. 3.18 clearly shows that
congruent laser ablation is the most efficient condition to redden silicate spectra1.
As a proof that we have been experimenting in conditions of congruent ablation,
we have performed XPS analyses of the olivine sample before and after UV laser
ablation. These analyses have shown that there are no considerable variations of
the chemical composition of the weathered target, whose atomic percentage values
are: O, 56.6%; Si, 13.2%; and Mg, 30.2%, which lie within a 1% deviation from the
measured initial composition: O, 56.9%; Si, 13.9%; and Mg, 29.2%. These values
are close to those of pure forsterite (iron poor olivine); indeed in the olivine target
the Fe content is undetectable by XPS measurements, i.e. it is in the order of 1-2%.
This implies that spectral reddening can be observed also in iron poor silicates.
Magnetic analyses of the ablated samples, like those described by Bentley et al.
(2005), are described in the last chapter of this thesis.
3.3.3 Astrophysical implications
The spectra of irradiated silicates should be able to explain the spectral mismatch
between meteorites and asteroids. To test whether our BAT irradiation and ablation
experiments can explain this space weathering effect, we have calculated the ratio
of band II area to band I area (BII/BI area) as described by Gaffey et al. (1993),
and then compared the spectral slope and the BII/BI area of laser experiments with
those of near- Earth and Main-Belt silicate rich asteroids reported by Marchi et al.
(2005). In their slope vs BII/BI area plot, it has been revealed the presence of a
1It should be noted that, differently from the case of Yamada et al. (1999), in my experimentsthe targets are mounted vertically, so that in the present case a minor amount of material isprobably redeposited.
3.3 Laser irradiation below and above the ablation threshold 87
rectangle zone occupied by OC meteorites (defined as zero damage zone), and a
triangle shaped distribution for asteroids; these two regions overlap only partially,
and this is believed to be due to space weathering.
Figure 3.19 plots the spectral slope vs the BII/BI area ratio of our experimental
data along with the meteorite and asteroid zones. It is clear that all the slopes ob-
served in the case of asteroids can be reproduced by the laser experiments, whatever
is the composition, i.e. pyroxene to olivine ratio, of the target.
0.0 0.4 0.8 1.2 1.6 2.0 2.4
0.0
0.2
0.4
0.6
0.8
1.0
1010 yr
108 yr
108 yr
Asteroids(NEOs and MBAs)
Spe
ctra
l slo
pe (
µm-1)
BII / BI area
OC meteorites
Clinopyroxene BAT irrad. Clinopyroxene ablated Olivine ablated Othopyroxene ablated
108 yr
Figure 3.19: Spectral slope vs the BII/BI area ratio, for experiments below (crossed points) andabove (full points) ablation threshold, on clinopyroxene (squares), orthopyroxene (triangles), andolivine (circles). The asteroid and meteorite regions are displayed, as derived by the data ofMarchi et al. (2005). The arrows mark the direction towards which space weathering by microm-eteorite impacts should act. The astrophysical time-scales are given, as derived in the text.
Note that space weathering mainly acts on the slope, but that in the case of
pyroxene it also causes an increase of the BII/BI area ratio; this is in agreement
with what found by Ueda et al. (2002a).
In order to get an astrophysical time-scale for the process, let us follow Sasaki et al.
(2001) who calculated a time-scale of about 108 yr in space at about 1 AU: they
reported that, considering an impact rate of few 10−4 m−2 s−1 for dust particles
88 3. Irradiation and ablation of silicates
of about 10−12 g (1 µm in diameter), and assuming an impact velocity of 20 km
s−1 for vaporization, the energy release rate by dust impacts is about 10−3 J m−2
yr−1. The dose provided here to redden olivine samples is 27 J cm−2: this leads to a
timescale of about 108 yr at 1 AU (similar results are obtained for ablated clinopy-
roxene and orthopyroxene); it should be stressed that on a comparable time-scale
we get higher spectral slopes than Sasaki et al. (2001), by a factor of about 50%,
once again implying that UV excimer laser is more efficient than infrared laser in
reddening silicate samples.
The same calculation as before have been repeated in the case of BAT clinopy-
roxene (irradiated below ablation threshold), finding a time-scale of about 1010 yr
at 1 AU, i.e. longer by a factor of 100 with respect to the ablated targets. As stated
above, laser irradiation experiments simulate micrometeorite impacts whereas ion
irradiation simulates solar wind irradiation. However, a direct comparison between
the two cases is not easy, because the two processes are very different. In terms
of energy, it is likely that the two effects have comparable efficiency in reddening
silicate spectra; however, in terms of astrophysical timescale, solar wind irradiation
seems to be faster (about 106 yr). Nevertheless, since the ion fluxes and the mi-
crometeoroid fluxes in space are only partially know, and they vary moving within
the Solar System, the relative efficiency of the two processes may strongly change
when considering different objects.
In conclusion, this work has confirmed and extended the results of Sasaki et al.
(2001); we have found that, in order to simulate micrometeorite bombardment, the
most efficient experimental conditions to darken and redden the reflectance spectra
are obtained performing congruent laser ablation, i.e. to use an UV laser with
fluence higher than ablation threshold.
Furthermore, it seems that congruent ablation reproduces quite well the mi-
crometeorite bombardment, because it minimizes the thermal effects, causes a high
transfer of momentum, and reproduces the astrophysical weathering in reasonable
time-scales (108 yr at 1 AU). On the contrary, irradiation below ablation threshold,
even if inducing similar spectral modifications, would correspond to astrophysical
time-scales longer than the age of the Solar System.
3.3 Laser irradiation below and above the ablation threshold 89
However, it is possible that, in a micrometeorite impact, uncontrolled melting
can occur; the amount of this melting will vary depending on the parameters of
the impact (energy, velocity, angle, etc.): varying the laser fluence, all the possible
variations of these thermal effects have been investigated, demonstrating that the
strongest reddening is obtained when thermal effects are minimized.
Acknowledgments
We are grateful to G. Compagnini and G. Strazzulla for help in the XPS anal-
ysis and for other useful suggestions. We thank Takahiro Hiroi and an anonymous
reviewer for their helpful comments. This research was supported by the Italian
Ministero dell’Istruzione, Universita e Ricerca (MIUR).

Chapter 4
Irradiation of ices
Fast ions passing through a molecular solid release energy to the target material.
Energetic ions produce surface, chemical, and physical changes when they collide
with solid materials.
As a consequence many molecular bonds are broken along the ion-track and, in
a very short time (one picosec or less), the molecular fragments recombine giving
rise to a rearrangement of the chemical structure.
Original and newly produced molecules can be ejected (sputtered) or remain in
the target (chemical alteration) and the structure of the target be changed.
Thus, in addition to the alteration of the chemical and lattice structure of the
target material, new molecular species (not present before irradiation) are formed.
If the material is originally volatile less volatile species can be formed which can
survive at higher temperature.
In this chapter I will describe a few irradiation experiments on C-rich ices; these
experiments are a case for the space weathering of outer Solar System objects,
and provide important information about the surface composition and processing of
those icy and distant bodies.
4.1 Chemistry: the case of methanol
Based on the paper: Brunetto, R., Baratta, G. A., Domingo, M.,
Strazzulla, G. 2005. Reflectance and transmittance spectra (2.2-2.4 µm)
92 4. Irradiation of ices
of ion irradiated frozen methanol. Icarus 175, 226-232.
Here I present a study of the effects induced by ion irradiation on frozen methanol
and mixtures water-methanol. In particular I have studied the profile (shape, width
and peak position) of methanol bands and the formation of new species at two
different temperatures. I show, for the first time, a strong decrease of the 2.34 µm
band with respect to the 2.27 µm one.
The technique used for the analysis is in-situ infrared spectroscopy in the 2.2-2.4
µm range, both in reflectance (for the first time) and transmittance. This range
is different from that studied previously for methanol (Hudson and Moore, 2000;
Palumbo et al., 1999), and it is more appropriate to get information on processes
taking place on planetary objects, where spectral properties, in the studied range,
are due to the scattering of the solar light from their surface layers.
Transmittance spectra of other simple hydrocarbons (CH4, C2H2, C2H4, C2H6)
and CO have been also obtained both to help in the identification of the new
molecules formed after ion irradiation of methanol-rich ices, and to get insight into
the question of the presence of simple frozen hydrocarbons on the surface of some
objects in the outer Solar System.
4.1.1 Experimental results
Fig. 4.1 presents NIR transmittance spectra (2.2- 2.4 µm) of some frozen (16
K) hydrocarbons (methanol, acethylene, ethylene, ethane, methane) and of carbon
monoxide. Different samples have different thickness (1-3 µm); spectra are normal-
ized to the most intense peak of each species, in the exhibited spectral region, and
are offset for clarity. Methanol samples have been irradiated with 30 keV He+ ions.
The transmittance spectrum of an irradiated sample (28 eV/16 amu) is also shown
in Fig. 4.1.
In Table 4.1 the peak positions and the FWHM of the NIR bands (2.2-2.4 µm)
of the studied species are given, as calculated from Fig. 4.1.
CO exhibits a single band at about 2.35 µm attributed to the overtone 2ν of
the fundamental vibration at about 4.67 µm. Ethane and ethylene have bands due
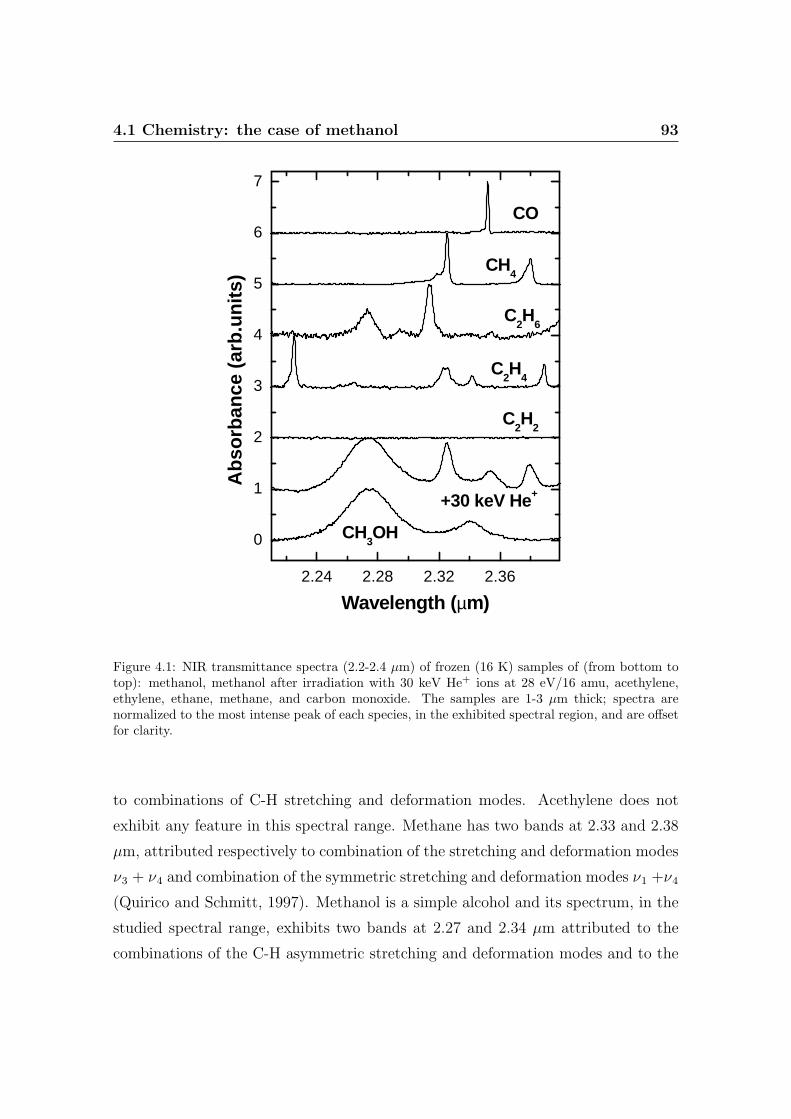
4.1 Chemistry: the case of methanol 93
2.24 2.28 2.32 2.36
0
1
2
3
4
5
6
7
CH4
C2H
4
CO
C2H
2
CH3OH
+30 keV He+
C2H
6
Wavelength (µm)
Ab
sorb
ance
(ar
b.u
nit
s)
Figure 4.1: NIR transmittance spectra (2.2-2.4 µm) of frozen (16 K) samples of (from bottom totop): methanol, methanol after irradiation with 30 keV He+ ions at 28 eV/16 amu, acethylene,ethylene, ethane, methane, and carbon monoxide. The samples are 1-3 µm thick; spectra arenormalized to the most intense peak of each species, in the exhibited spectral region, and are offsetfor clarity.
to combinations of C-H stretching and deformation modes. Acethylene does not
exhibit any feature in this spectral range. Methane has two bands at 2.33 and 2.38
µm, attributed respectively to combination of the stretching and deformation modes
ν3 + ν4 and combination of the symmetric stretching and deformation modes ν1 +ν4
(Quirico and Schmitt, 1997). Methanol is a simple alcohol and its spectrum, in the
studied spectral range, exhibits two bands at 2.27 and 2.34 µm attributed to the
combinations of the C-H asymmetric stretching and deformation modes and to the
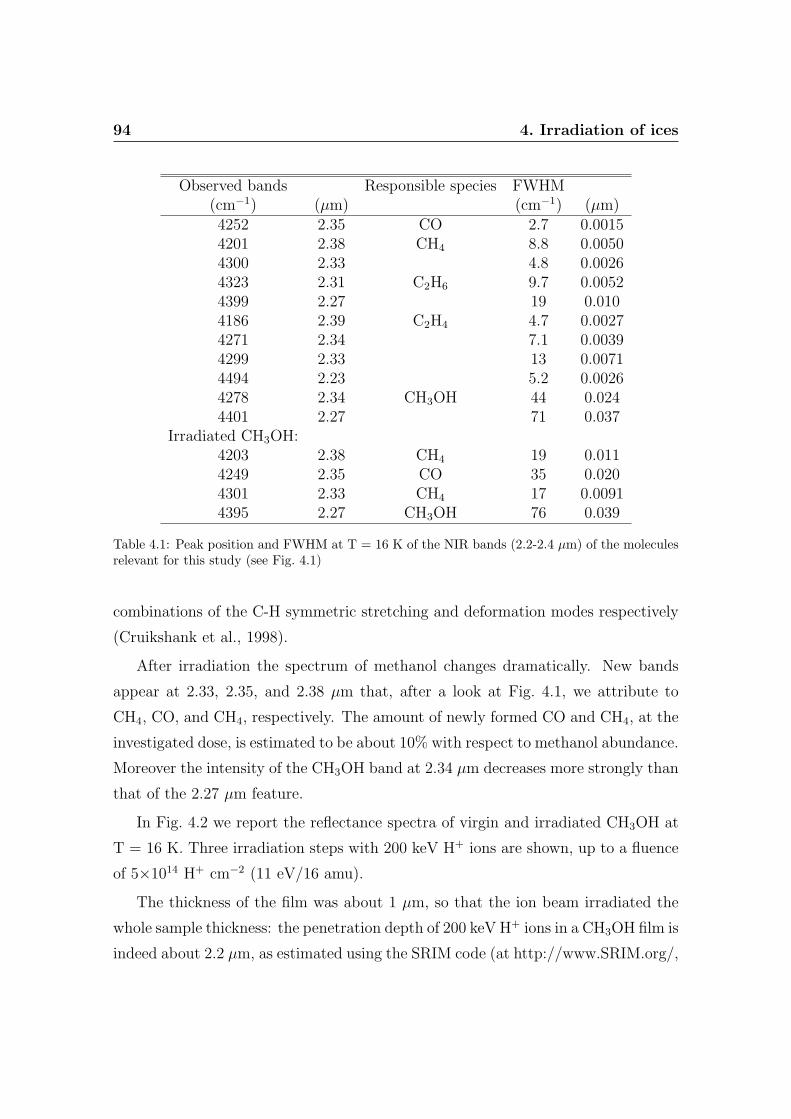
94 4. Irradiation of ices
Observed bands Responsible species FWHM(cm−1) (µm) (cm−1) (µm)4252 2.35 CO 2.7 0.00154201 2.38 CH4 8.8 0.00504300 2.33 4.8 0.00264323 2.31 C2H6 9.7 0.00524399 2.27 19 0.0104186 2.39 C2H4 4.7 0.00274271 2.34 7.1 0.00394299 2.33 13 0.00714494 2.23 5.2 0.00264278 2.34 CH3OH 44 0.0244401 2.27 71 0.037
Irradiated CH3OH:4203 2.38 CH4 19 0.0114249 2.35 CO 35 0.0204301 2.33 CH4 17 0.00914395 2.27 CH3OH 76 0.039
Table 4.1: Peak position and FWHM at T = 16 K of the NIR bands (2.2-2.4 µm) of the moleculesrelevant for this study (see Fig. 4.1)
combinations of the C-H symmetric stretching and deformation modes respectively
(Cruikshank et al., 1998).
After irradiation the spectrum of methanol changes dramatically. New bands
appear at 2.33, 2.35, and 2.38 µm that, after a look at Fig. 4.1, we attribute to
CH4, CO, and CH4, respectively. The amount of newly formed CO and CH4, at the
investigated dose, is estimated to be about 10% with respect to methanol abundance.
Moreover the intensity of the CH3OH band at 2.34 µm decreases more strongly than
that of the 2.27 µm feature.
In Fig. 4.2 we report the reflectance spectra of virgin and irradiated CH3OH at
T = 16 K. Three irradiation steps with 200 keV H+ ions are shown, up to a fluence
of 5×10¹⁴ H+ cm−2 (11 eV/16 amu).
The thickness of the film was about 1 µm, so that the ion beam irradiated the
whole sample thickness: the penetration depth of 200 keV H+ ions in a CH3OH film is
indeed about 2.2 µm, as estimated using the SRIM code (at http://www.SRIM.org/,
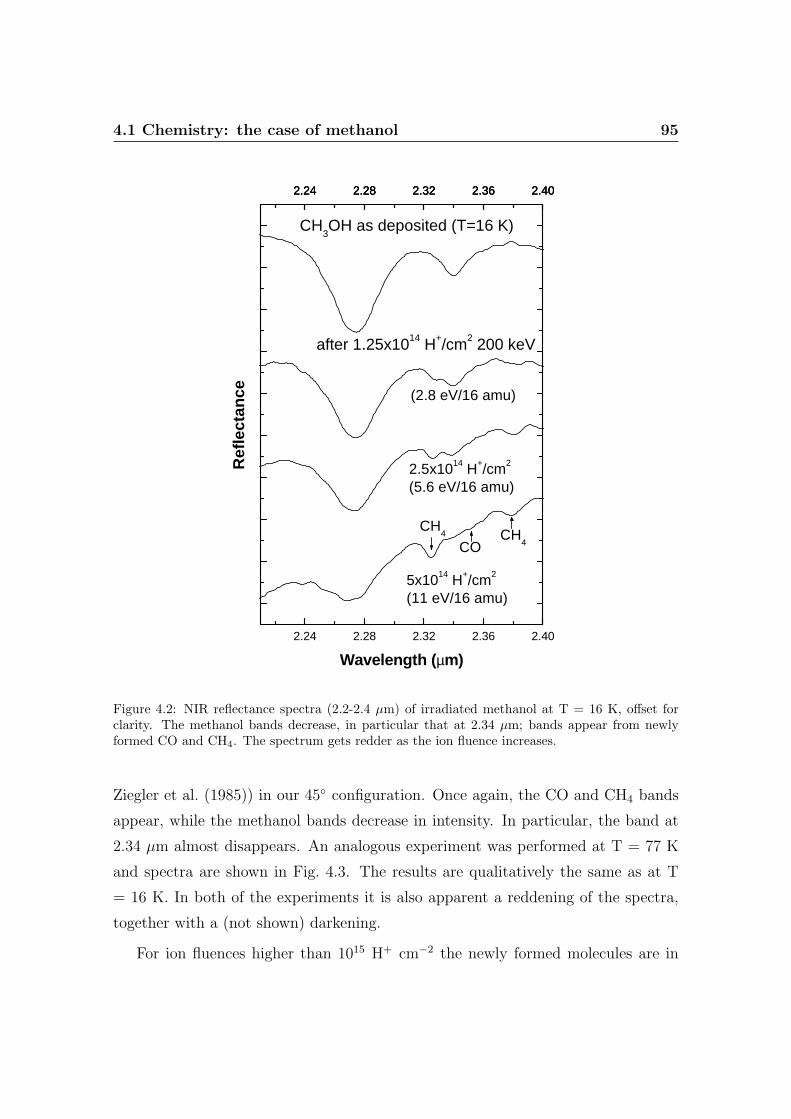
4.1 Chemistry: the case of methanol 95
2.24 2.28 2.32 2.36 2.402.24 2.28 2.32 2.36 2.402.24 2.28 2.32 2.36 2.40
2.24 2.28 2.32 2.36 2.40
Ref
lect
ance
Wavelength (µm)
5x10¹⁴ H+/cm2
(11 eV/16 amu)
(2.8 eV/16 amu)
CH4 CH
4CO
CH3OH as deposited (T=16 K)
after 1.25x10¹⁴ H+/cm2 200 keV
2.5x10¹⁴ H+/cm2
(5.6 eV/16 amu)
Figure 4.2: NIR reflectance spectra (2.2-2.4 µm) of irradiated methanol at T = 16 K, offset forclarity. The methanol bands decrease, in particular that at 2.34 µm; bands appear from newlyformed CO and CH4. The spectrum gets redder as the ion fluence increases.
Ziegler et al. (1985)) in our 45◦ configuration. Once again, the CO and CH4 bands
appear, while the methanol bands decrease in intensity. In particular, the band at
2.34 µm almost disappears. An analogous experiment was performed at T = 77 K
and spectra are shown in Fig. 4.3. The results are qualitatively the same as at T
= 16 K. In both of the experiments it is also apparent a reddening of the spectra,
together with a (not shown) darkening.
For ion fluences higher than 1015 H+ cm−2 the newly formed molecules are in
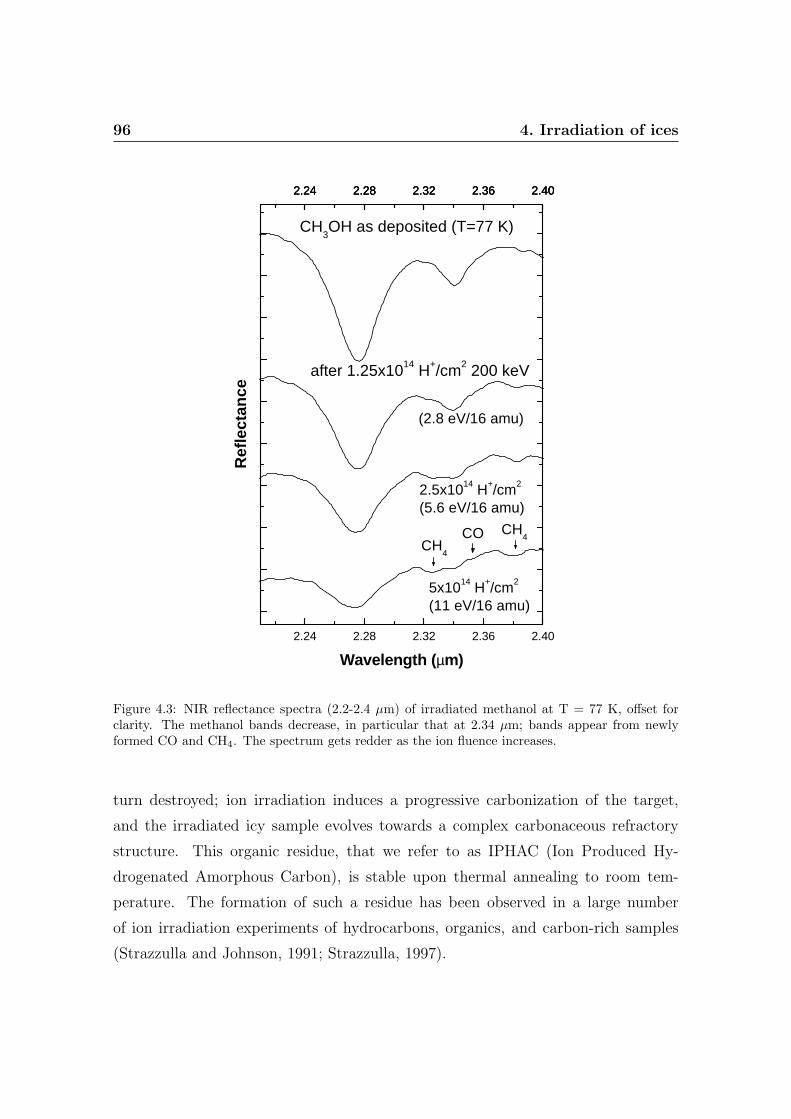
96 4. Irradiation of ices
2.24 2.28 2.32 2.36 2.402.24 2.28 2.32 2.36 2.402.24 2.28 2.32 2.36 2.40
2.24 2.28 2.32 2.36 2.40
Ref
lect
ance
Wavelength (µm)
CH4
CH3OH as deposited (T=77 K)
after 1.25x10¹⁴ H+/cm2 200 keV
5x10¹⁴ H+/cm2
(11 eV/16 amu)
(2.8 eV/16 amu)
2.5x10¹⁴ H+/cm2
(5.6 eV/16 amu)
CH4
CO
Figure 4.3: NIR reflectance spectra (2.2-2.4 µm) of irradiated methanol at T = 77 K, offset forclarity. The methanol bands decrease, in particular that at 2.34 µm; bands appear from newlyformed CO and CH4. The spectrum gets redder as the ion fluence increases.
turn destroyed; ion irradiation induces a progressive carbonization of the target,
and the irradiated icy sample evolves towards a complex carbonaceous refractory
structure. This organic residue, that we refer to as IPHAC (Ion Produced Hy-
drogenated Amorphous Carbon), is stable upon thermal annealing to room tem-
perature. The formation of such a residue has been observed in a large number
of ion irradiation experiments of hydrocarbons, organics, and carbon-rich samples
(Strazzulla and Johnson, 1991; Strazzulla, 1997).
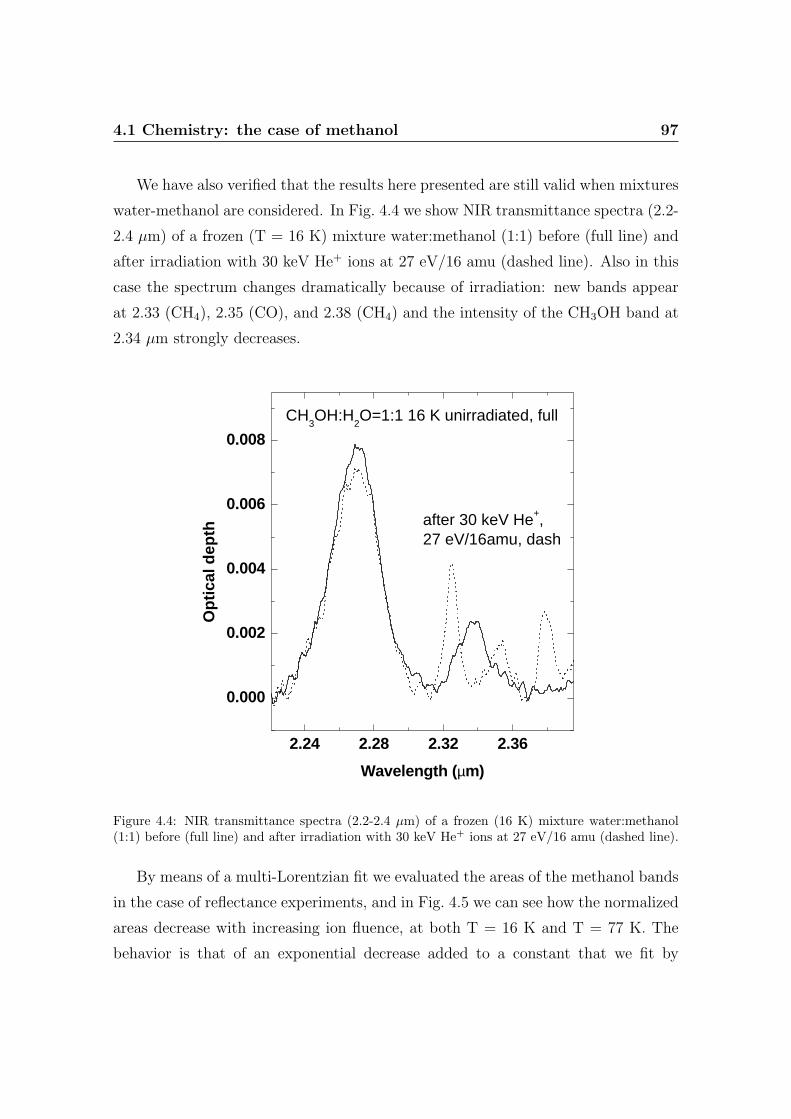
4.1 Chemistry: the case of methanol 97
We have also verified that the results here presented are still valid when mixtures
water-methanol are considered. In Fig. 4.4 we show NIR transmittance spectra (2.2-
2.4 µm) of a frozen (T = 16 K) mixture water:methanol (1:1) before (full line) and
after irradiation with 30 keV He+ ions at 27 eV/16 amu (dashed line). Also in this
case the spectrum changes dramatically because of irradiation: new bands appear
at 2.33 (CH4), 2.35 (CO), and 2.38 (CH4) and the intensity of the CH3OH band at
2.34 µm strongly decreases.
2.24 2.28 2.32 2.36
0.000
0.002
0.004
0.006
0.008
CH3OH:H
2O=1:1 16 K unirradiated, full
after 30 keV He+,27 eV/16amu, dash
Op
tica
l dep
th
Wavelength (µm)
Figure 4.4: NIR transmittance spectra (2.2-2.4 µm) of a frozen (16 K) mixture water:methanol(1:1) before (full line) and after irradiation with 30 keV He+ ions at 27 eV/16 amu (dashed line).
By means of a multi-Lorentzian fit we evaluated the areas of the methanol bands
in the case of reflectance experiments, and in Fig. 4.5 we can see how the normalized
areas decrease with increasing ion fluence, at both T = 16 K and T = 77 K. The
behavior is that of an exponential decrease added to a constant that we fit by
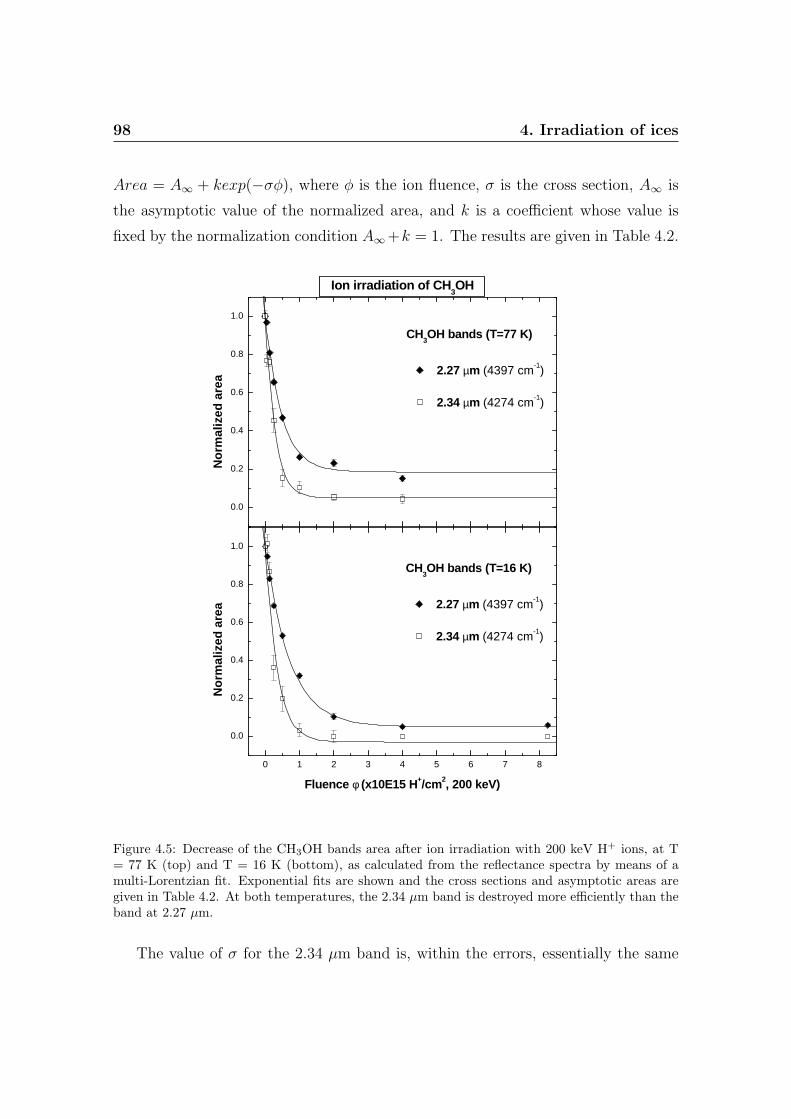
98 4. Irradiation of ices
Area = A∞ + kexp(−σφ), where φ is the ion fluence, σ is the cross section, A∞ is
the asymptotic value of the normalized area, and k is a coefficient whose value is
fixed by the normalization condition A∞+k = 1. The results are given in Table 4.2.
0 1 2 3 4 5 6 7 8
0.0
0.2
0.4
0.6
0.8
1.0
0.0
0.2
0.4
0.6
0.8
1.0
No
rmal
ized
are
a
Fluence φ (x10E15 H+/cm2, 200 keV)
CH3OH bands (T=16 K)
2.27 µm (4397 cm-1)
2.34 µm (4274 cm-1)
Ion irradiation of CH3OH
CH3OH bands (T=77 K)
2.27 µm (4397 cm-1)
2.34 µm (4274 cm-1)
No
rmal
ized
are
a
Figure 4.5: Decrease of the CH3OH bands area after ion irradiation with 200 keV H+ ions, at T= 77 K (top) and T = 16 K (bottom), as calculated from the reflectance spectra by means of amulti-Lorentzian fit. Exponential fits are shown and the cross sections and asymptotic areas aregiven in Table 4.2. At both temperatures, the 2.34 µm band is destroyed more efficiently than theband at 2.27 µm.
The value of σ for the 2.34 µm band is, within the errors, essentially the same
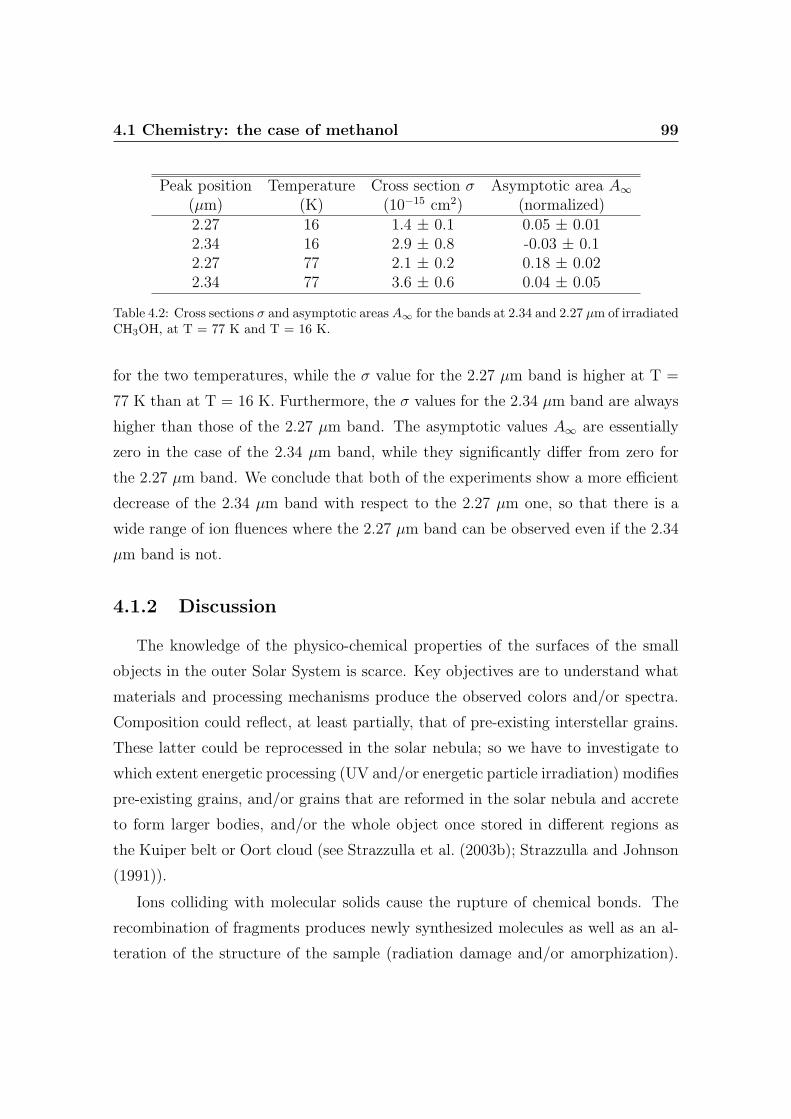
4.1 Chemistry: the case of methanol 99
Peak position Temperature Cross section σ Asymptotic area A∞(µm) (K) (10−15 cm2) (normalized)2.27 16 1.4 ± 0.1 0.05 ± 0.012.34 16 2.9 ± 0.8 -0.03 ± 0.12.27 77 2.1 ± 0.2 0.18 ± 0.022.34 77 3.6 ± 0.6 0.04 ± 0.05
Table 4.2: Cross sections σ and asymptotic areas A∞ for the bands at 2.34 and 2.27 µm of irradiatedCH3OH, at T = 77 K and T = 16 K.
for the two temperatures, while the σ value for the 2.27 µm band is higher at T =
77 K than at T = 16 K. Furthermore, the σ values for the 2.34 µm band are always
higher than those of the 2.27 µm band. The asymptotic values A∞ are essentially
zero in the case of the 2.34 µm band, while they significantly differ from zero for
the 2.27 µm band. We conclude that both of the experiments show a more efficient
decrease of the 2.34 µm band with respect to the 2.27 µm one, so that there is a
wide range of ion fluences where the 2.27 µm band can be observed even if the 2.34
µm band is not.
4.1.2 Discussion
The knowledge of the physico-chemical properties of the surfaces of the small
objects in the outer Solar System is scarce. Key objectives are to understand what
materials and processing mechanisms produce the observed colors and/or spectra.
Composition could reflect, at least partially, that of pre-existing interstellar grains.
These latter could be reprocessed in the solar nebula; so we have to investigate to
which extent energetic processing (UV and/or energetic particle irradiation) modifies
pre-existing grains, and/or grains that are reformed in the solar nebula and accrete
to form larger bodies, and/or the whole object once stored in different regions as
the Kuiper belt or Oort cloud (see Strazzulla et al. (2003b); Strazzulla and Johnson
(1991)).
Ions colliding with molecular solids cause the rupture of chemical bonds. The
recombination of fragments produces newly synthesized molecules as well as an al-
teration of the structure of the sample (radiation damage and/or amorphization).
100 4. Irradiation of ices
Because both the profile and the intensity of the IR bands depend on the chem-
ical composition of the bulk matrix and on its structure, it is not surprising that
the relative intensities of different bands of the same species vary. In particular,
as observed in the present case for the CH3OH bands, the symmetric modes are
weakened with respect to the asymmetric modes. Further experiments made by
depositing mixtures of methanol with CO and/or CH4, and irradiating them with
energetic ions, are programmed in our laboratory in order to clarify the relative
relevance of compositional effects (e.g., CO/CH3OH ratio) into respect to energetic
processing in changing the intensities of the methanol bands.
It could be argued that a contribution to the 2.27 µm band in irradiated methanol
comes from the synthesis of new species, such as ethylene glycol whose formation has
been evidenced, after some controversy, by a study in the mid-IR spectral region
(Hudson and Moore, 2000). However such a contribution, if any, would be very
small. In fact, if ethylene glycol gave a contribution in the here studied spectral
region, typical of overtones and combination modes, its abundance would be such
to exhibit some (not observed) very intense features in the mid-IR region.
The results here described corroborate the formation of CH4 and CO along with
other species after irradiation of frozen methanol; similar results were obtained in
other studies (e.g., Baratta et al. (2002); Hudson and Moore (2000); Palumbo et al.
(1999), and references therein) in a different spectral range (2.6-17 µm).
The results presented here can be also a case for some small bodies in the outer
Solar System, such as Pholus: its surface could in fact have been exposed for a long
time to ion irradiation at the various stages of its evolution. Let us consider, as an ex-
ample, only the post accretion irradiation by galactic cosmic rays. Cruikshank et al.
(1998) quote that the upper 10 m of the surface (depending on density) accumulated
a dose of 1.3×10¹² ergs cm−3 that, for a mean molecular weight of 16 and a density
of 0.5 g cm−3, corresponds to about 40 eV/16 amu, i.e., on the order of magnitude
that we used in our experiments.
The temperature of Pholus surface is estimated to vary between 40 and 90 K.
Our experiments indicate that for different ions (H+, He+), in a wide range of energy
of the incoming ions (30-200 keV), and temperature (16-77 K), the intensity of the
4.1 Chemistry: the case of methanol 101
methanol band at 2.34 µm strongly decreases with respect to the one at 2.27 µm.
Methanol, if present on Pholus, could be mixed with water ice also identified
in its spectrum (Cruikshank et al., 1998), and we have verified that the results
here presented are still valid when mixtures water-methanol are considered. Pholus
surface could then be rich of processed materials, and the fact that the band at 2.34
µm was not observed could be indicative of ion irradiation processes.
Laboratory experiments on methanol are also valuable to simulate variations in
the slopes of the UV-VIS spectra that are observed to occur in the small bodies
of the outer Solar System. Indeed, the existing observational data of these colors
(spectral slopes) show a continuous spread of objects with colors from very red (as it
is the case for Pholus) to essentially dark (e.g., Barucci et al. (2001), and references
therein).
Laboratory results indicate that whatever is the irradiated hydrocarbon, it is
converted to a refractory, insoluble residue (e.g., Strazzulla and Johnson (1991);
Strazzulla (1997)). The slope of the reflectance spectra of such a residue changes
with ion fluence. First extracted residues (at moderate doses) show red spectra
becoming flatter and flatter under further ion irradiation (Andronico et al., 1987).
It is known that natural solid bitumens are possible analogs for cometary and
asteroid organics (Moroz et al., 1998); laboratory experiments (Moroz et al., 2004a)
show that ion irradiation of bitumens neutralizes the spectral slopes (0.3-2.5 µm)
of these red organic solids. On the other hand, in the experiments here reported
(2.2-2.4 µm), the reflectance spectrum of methanol, which is flat and bright at the
beginning, gets redder after ion irradiation (see Figs. 4.2 and 4.3).
In the following section I will provide a detailed analysis, by in-situ reflectance
spectroscopy, of the ion induced evolution in the colors of different ices relevant to
the surface properties of distant objects in the Solar System.
Acknowledgments
This research was supported by the Italian Ministero dell’Istruzione, Universita
e Ricerca (MIUR), and the Spanish Ministerio de Ciencia y Tecnologia (MCyT).
102 4. Irradiation of ices
4.2 CH3OH, CH4, and C6H6: the organic residue
Based on the paper: Brunetto, R., Barucci, M. A., Dotto, E.,
Strazzulla, G. 2006. Ion Irradiation of Frozen Methanol, Methane, and
Benzene: Linking to the Colors of Centaurs and Trans-Neptunian
Objects. Astrophysical Journal 644, 646-650.
In this section, I present new ion irradiation experiments of frozen (16-80 K)
CH3OH, CH4 , and C6H6 , conducted with 200-400 keV ions, monitored by Vis-NIR
(0.65-2.7 µm) reflectance spectroscopy, to compare the induced color variations with
the observed spectra of some centaurs and TNOs.
We irradiated methanol, methane, and benzene with the ions given in Table 4.3.
The dose has been varied up to the highest value reported in Table 4.3, and spectra
have been collected at several intermediate steps. The thickness of the films and the
temperature are also reported in Table 4.3 (the error in the film thickness is <0.2
µm).
In the case of irradiation with 200 keV H+ ions, the mean penetration depth
is between 1.8 and 2.4 µm (depending on the ice density) in our 45◦ experimental
setup, and it is higher than the thickness of the samples (see Table 4.3). In the case
of Ar, the penetration depth can be of the same order of magnitude or lower than
the sample thickness; in this case the average doses that we use refer to the surface
and intermediate layers (the first 70%- 80% of the ion track, where Ar ions lose 80%-
90% of their energy), where the total (elastic plus inelastic) stopping power changes
by not more than 10%. These layers are the ones that are actually producing the
reflectance spectra.
The reflectance spectra of unprocessed and then progressively irradiated methanol,
methane, and benzene are reported in Fig. 4.6 (for the sake of clarity, only some of
the irradiation steps are shown).
Overtone and/or combination bands of the considered molecules are visible in
Fig. 4.6. Those bands are progressively destroyed as the dosage released by the
ions increases, and newly synthesized species (CO, CO2, CH4 , etc.) are identified.
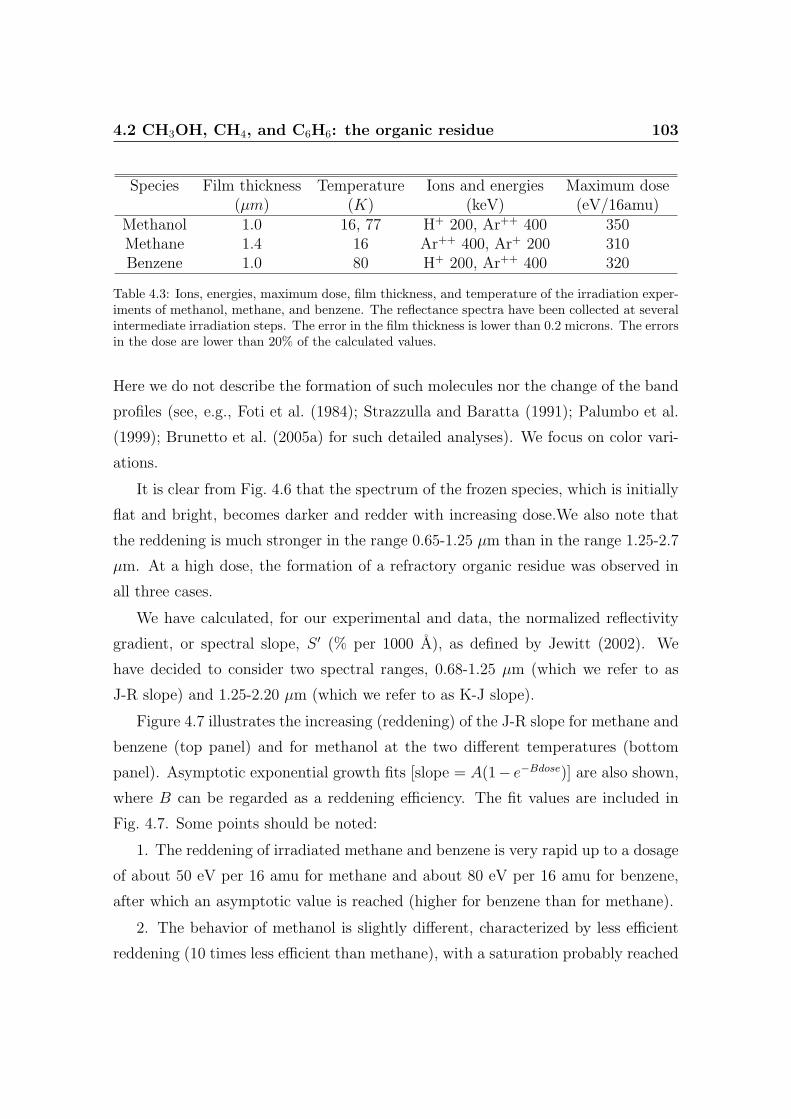
4.2 CH3OH, CH4, and C6H6: the organic residue 103
Species Film thickness Temperature Ions and energies Maximum dose(µm) (K) (keV) (eV/16amu)
Methanol 1.0 16, 77 H+ 200, Ar++ 400 350Methane 1.4 16 Ar++ 400, Ar+ 200 310Benzene 1.0 80 H+ 200, Ar++ 400 320
Table 4.3: Ions, energies, maximum dose, film thickness, and temperature of the irradiation exper-iments of methanol, methane, and benzene. The reflectance spectra have been collected at severalintermediate irradiation steps. The error in the film thickness is lower than 0.2 microns. The errorsin the dose are lower than 20% of the calculated values.
Here we do not describe the formation of such molecules nor the change of the band
profiles (see, e.g., Foti et al. (1984); Strazzulla and Baratta (1991); Palumbo et al.
(1999); Brunetto et al. (2005a) for such detailed analyses). We focus on color vari-
ations.
It is clear from Fig. 4.6 that the spectrum of the frozen species, which is initially
flat and bright, becomes darker and redder with increasing dose.We also note that
the reddening is much stronger in the range 0.65-1.25 µm than in the range 1.25-2.7
µm. At a high dose, the formation of a refractory organic residue was observed in
all three cases.
We have calculated, for our experimental and data, the normalized reflectivity
gradient, or spectral slope, S ′ (% per 1000 A), as defined by Jewitt (2002). We
have decided to consider two spectral ranges, 0.68-1.25 µm (which we refer to as
J-R slope) and 1.25-2.20 µm (which we refer to as K-J slope).
Figure 4.7 illustrates the increasing (reddening) of the J-R slope for methane and
benzene (top panel) and for methanol at the two different temperatures (bottom
panel). Asymptotic exponential growth fits [slope = A(1− e−Bdose)] are also shown,
where B can be regarded as a reddening efficiency. The fit values are included in
Fig. 4.7. Some points should be noted:
1. The reddening of irradiated methane and benzene is very rapid up to a dosage
of about 50 eV per 16 amu for methane and about 80 eV per 16 amu for benzene,
after which an asymptotic value is reached (higher for benzene than for methane).
2. The behavior of methanol is slightly different, characterized by less efficient
reddening (10 times less efficient than methane), with a saturation probably reached
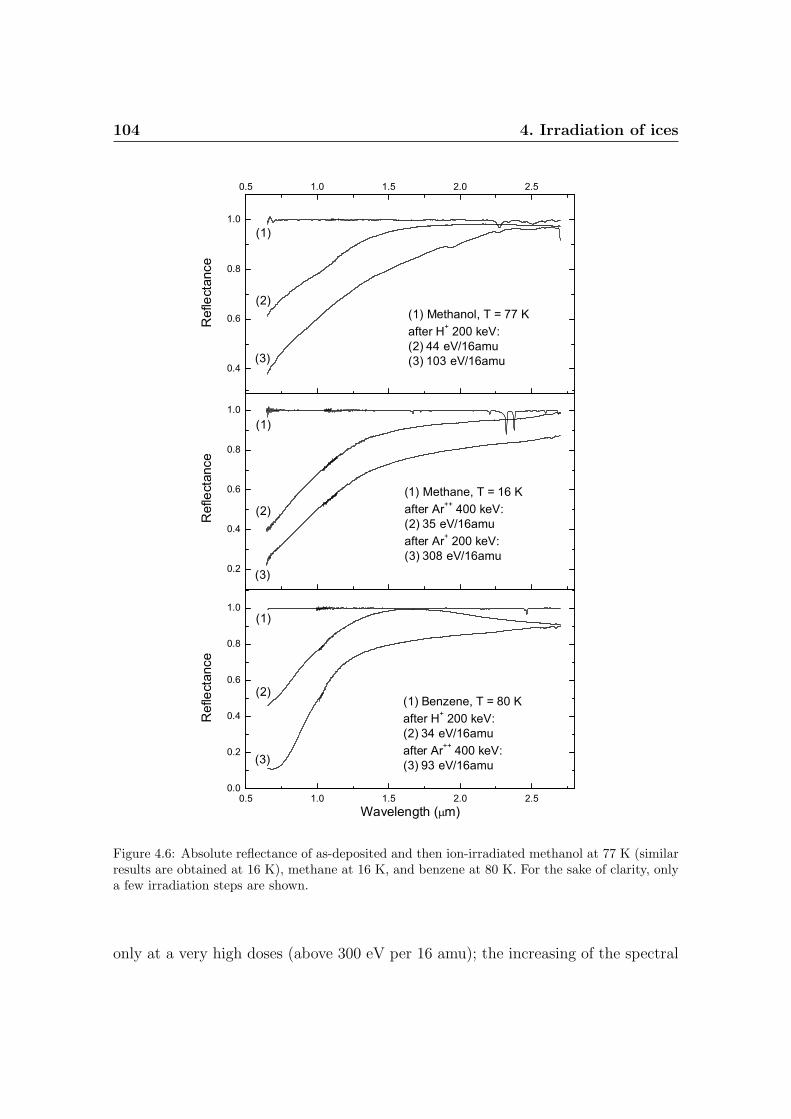
104 4. Irradiation of ices
0.5 1.0 1.5 2.0 2.50.0
0.2
0.4
0.6
0.8
1.0
(3)
(1)
Ref
lect
ance
Wavelength (mm)
(1) Benzene, T = 80 Kafter H+ 200 keV:(2) 34 eV/16amuafter Ar++ 400 keV:(3) 93 eV/16amu
(2)
0.2
0.4
0.6
0.8
1.0
(3)
(1)
Ref
lect
ance
(1) Methane, T = 16 Kafter Ar++ 400 keV:(2) 35 eV/16amuafter Ar+ 200 keV:(3) 308 eV/16amu
(2)
0.5 1.0 1.5 2.0 2.5
0.4
0.6
0.8
1.0
(3)
(1)
Ref
lect
ance
(1) Methanol, T = 77 Kafter H+ 200 keV:(2) 44 eV/16amu(3) 103 eV/16amu
(2)
Figure 4.6: Absolute reflectance of as-deposited and then ion-irradiated methanol at 77 K (similarresults are obtained at 16 K), methane at 16 K, and benzene at 80 K. For the sake of clarity, onlya few irradiation steps are shown.
only at a very high doses (above 300 eV per 16 amu); the increasing of the spectral
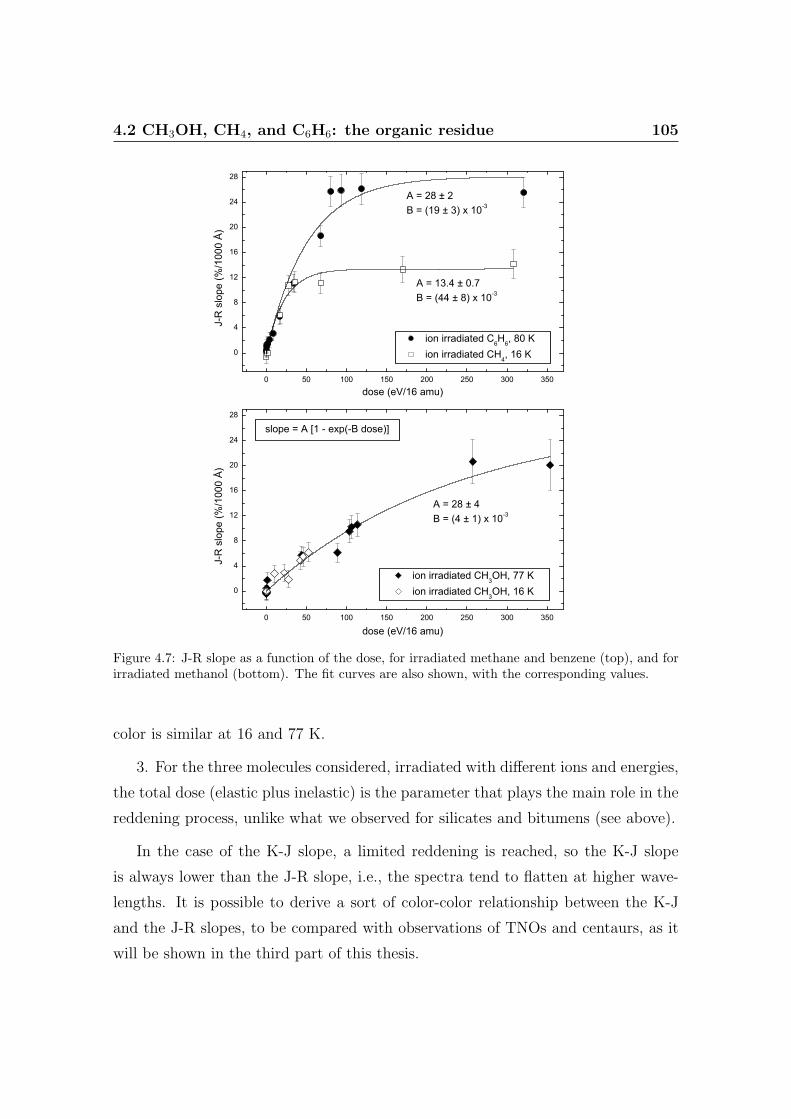
4.2 CH3OH, CH4, and C6H6: the organic residue 105
0 50 100 150 200 250 300 350
0
4
8
12
16
20
24
28
0 50 100 150 200 250 300 350
0
4
8
12
16
20
24
28
J-R
slo
pe (%
/100
0 Å)
dose (eV/16 amu)
ion irradiated C6H6, 80 K ion irradiated CH4, 16 K
A = 28 ± 2B = (19 ± 3) x 10-3
A = 13.4 ± 0.7B = (44 ± 8) x 10-3
J-R
slo
pe (%
/100
0 Å)
dose (eV/16 amu)
ion irradiated CH3OH, 77 K ion irradiated CH3OH, 16 K
A = 28 ± 4B = (4 ± 1) x 10-3
slope = A [1 - exp(-B dose)]
Figure 4.7: J-R slope as a function of the dose, for irradiated methane and benzene (top), and forirradiated methanol (bottom). The fit curves are also shown, with the corresponding values.
color is similar at 16 and 77 K.
3. For the three molecules considered, irradiated with different ions and energies,
the total dose (elastic plus inelastic) is the parameter that plays the main role in the
reddening process, unlike what we observed for silicates and bitumens (see above).
In the case of the K-J slope, a limited reddening is reached, so the K-J slope
is always lower than the J-R slope, i.e., the spectra tend to flatten at higher wave-
lengths. It is possible to derive a sort of color-color relationship between the K-J
and the J-R slopes, to be compared with observations of TNOs and centaurs, as it
will be shown in the third part of this thesis.

106 4. Irradiation of ices
Acknowledgments
We are grateful to G. A. Baratta and M. E. Palumbo for their helpful suggestions.
We thank F. Spinella for precious technical assistance, and an anonymous referee
who helped us improve the paper. This research has been supported by MIUR and
INAF.
Part III
Space weathering in the SolarSystem

Chapter 5
Spectral comparisons
I have shown in the previous chapters that the spectral slope is a useful tool
in characterizing space weathering effects on silicates, ices, and carbons. In this
chapter I will discuss the results of several spectral comparisons between laboratory
experiments and a large data-set of observed objects, from asteroids in the near-
Earth region to bodies in the Kuiper Belt.
5.1 The spectral slope of Near Earth and Main
Belt Asteroids
Based on the paper: Marchi, S., Brunetto, R., Magrin, S., Lazzarin, M.,
Gandolfi, D. 2005. Space weathering of near-Earth and main belt
silicate-rich asteroids: observations and ion irradiation experiments.
Astronomy and Astrophysics 443, 769-775.
In this section I report the results of a comparison between ion irradiation exper-
iments on silicates, a large data set of silicate-rich asteroid, and meteorites spectra.
5.1.1 Spectra of NEAs and MBAs
The observational data used in this work consist of a large set of visible and near-
infrared spectra of silicate-rich (generally indicated by S-type) asteroids. The vast
majority of these objects are in the main belt (MB). However a significant number
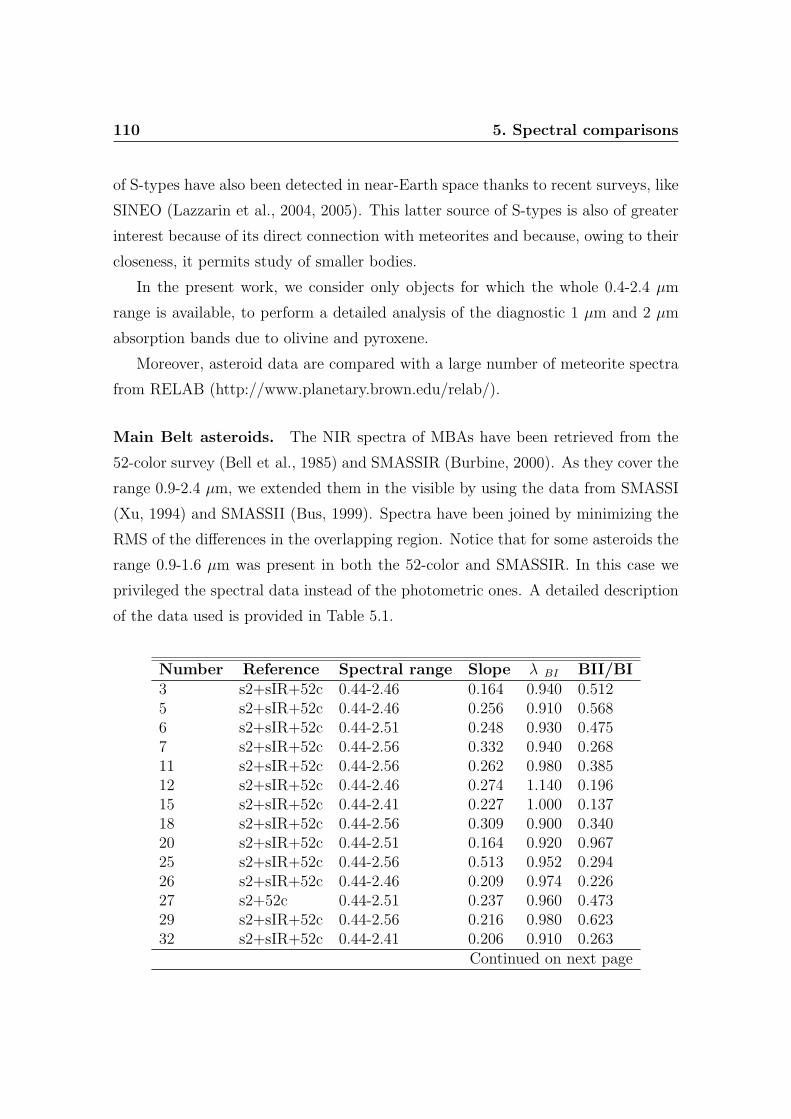
110 5. Spectral comparisons
of S-types have also been detected in near-Earth space thanks to recent surveys, like
SINEO (Lazzarin et al., 2004, 2005). This latter source of S-types is also of greater
interest because of its direct connection with meteorites and because, owing to their
closeness, it permits study of smaller bodies.
In the present work, we consider only objects for which the whole 0.4-2.4 µm
range is available, to perform a detailed analysis of the diagnostic 1 µm and 2 µm
absorption bands due to olivine and pyroxene.
Moreover, asteroid data are compared with a large number of meteorite spectra
from RELAB (http://www.planetary.brown.edu/relab/).
Main Belt asteroids. The NIR spectra of MBAs have been retrieved from the
52-color survey (Bell et al., 1985) and SMASSIR (Burbine, 2000). As they cover the
range 0.9-2.4 µm, we extended them in the visible by using the data from SMASSI
(Xu, 1994) and SMASSII (Bus, 1999). Spectra have been joined by minimizing the
RMS of the differences in the overlapping region. Notice that for some asteroids the
range 0.9-1.6 µm was present in both the 52-color and SMASSIR. In this case we
privileged the spectral data instead of the photometric ones. A detailed description
of the data used is provided in Table 5.1.
Number Reference Spectral range Slope λ BI BII/BI3 s2+sIR+52c 0.44-2.46 0.164 0.940 0.5125 s2+sIR+52c 0.44-2.46 0.256 0.910 0.5686 s2+sIR+52c 0.44-2.51 0.248 0.930 0.4757 s2+sIR+52c 0.44-2.56 0.332 0.940 0.26811 s2+sIR+52c 0.44-2.56 0.262 0.980 0.38512 s2+sIR+52c 0.44-2.46 0.274 1.140 0.19615 s2+sIR+52c 0.44-2.41 0.227 1.000 0.13718 s2+sIR+52c 0.44-2.56 0.309 0.900 0.34020 s2+sIR+52c 0.44-2.51 0.164 0.920 0.96725 s2+sIR+52c 0.44-2.56 0.513 0.952 0.29426 s2+sIR+52c 0.44-2.46 0.209 0.974 0.22627 s2+52c 0.44-2.51 0.237 0.960 0.47329 s2+sIR+52c 0.44-2.56 0.216 0.980 0.62332 s2+sIR+52c 0.44-2.41 0.206 0.910 0.263
Continued on next page
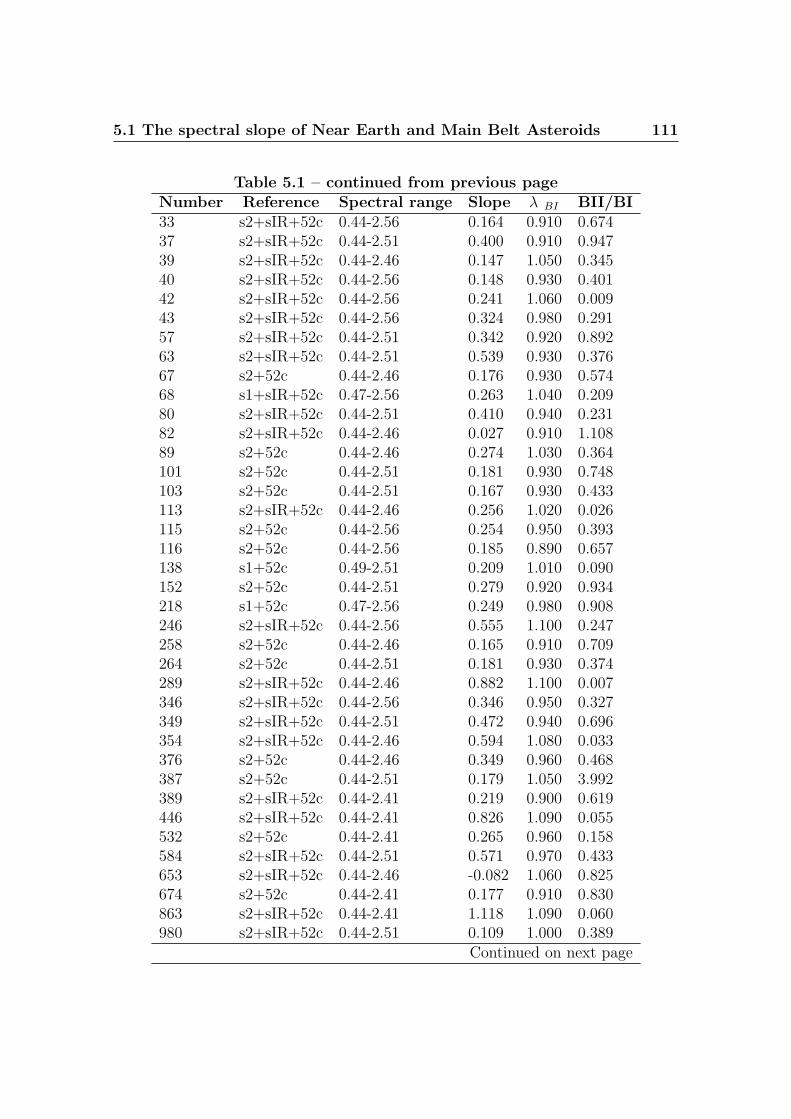
5.1 The spectral slope of Near Earth and Main Belt Asteroids 111
Table 5.1 – continued from previous pageNumber Reference Spectral range Slope λ BI BII/BI33 s2+sIR+52c 0.44-2.56 0.164 0.910 0.67437 s2+sIR+52c 0.44-2.51 0.400 0.910 0.94739 s2+sIR+52c 0.44-2.46 0.147 1.050 0.34540 s2+sIR+52c 0.44-2.56 0.148 0.930 0.40142 s2+sIR+52c 0.44-2.56 0.241 1.060 0.00943 s2+sIR+52c 0.44-2.56 0.324 0.980 0.29157 s2+sIR+52c 0.44-2.51 0.342 0.920 0.89263 s2+sIR+52c 0.44-2.51 0.539 0.930 0.37667 s2+52c 0.44-2.46 0.176 0.930 0.57468 s1+sIR+52c 0.47-2.56 0.263 1.040 0.20980 s2+sIR+52c 0.44-2.51 0.410 0.940 0.23182 s2+sIR+52c 0.44-2.46 0.027 0.910 1.10889 s2+52c 0.44-2.46 0.274 1.030 0.364101 s2+52c 0.44-2.51 0.181 0.930 0.748103 s2+52c 0.44-2.51 0.167 0.930 0.433113 s2+sIR+52c 0.44-2.46 0.256 1.020 0.026115 s2+52c 0.44-2.56 0.254 0.950 0.393116 s2+52c 0.44-2.56 0.185 0.890 0.657138 s1+52c 0.49-2.51 0.209 1.010 0.090152 s2+52c 0.44-2.51 0.279 0.920 0.934218 s1+52c 0.47-2.56 0.249 0.980 0.908246 s2+sIR+52c 0.44-2.56 0.555 1.100 0.247258 s2+52c 0.44-2.46 0.165 0.910 0.709264 s2+52c 0.44-2.51 0.181 0.930 0.374289 s2+sIR+52c 0.44-2.46 0.882 1.100 0.007346 s2+sIR+52c 0.44-2.56 0.346 0.950 0.327349 s2+sIR+52c 0.44-2.51 0.472 0.940 0.696354 s2+sIR+52c 0.44-2.46 0.594 1.080 0.033376 s2+52c 0.44-2.46 0.349 0.960 0.468387 s2+52c 0.44-2.51 0.179 1.050 3.992389 s2+sIR+52c 0.44-2.41 0.219 0.900 0.619446 s2+sIR+52c 0.44-2.41 0.826 1.090 0.055532 s2+52c 0.44-2.41 0.265 0.960 0.158584 s2+sIR+52c 0.44-2.51 0.571 0.970 0.433653 s2+sIR+52c 0.44-2.46 -0.082 1.060 0.825674 s2+52c 0.44-2.41 0.177 0.910 0.830863 s2+sIR+52c 0.44-2.41 1.118 1.090 0.060980 s2+sIR+52c 0.44-2.51 0.109 1.000 0.389
Continued on next page
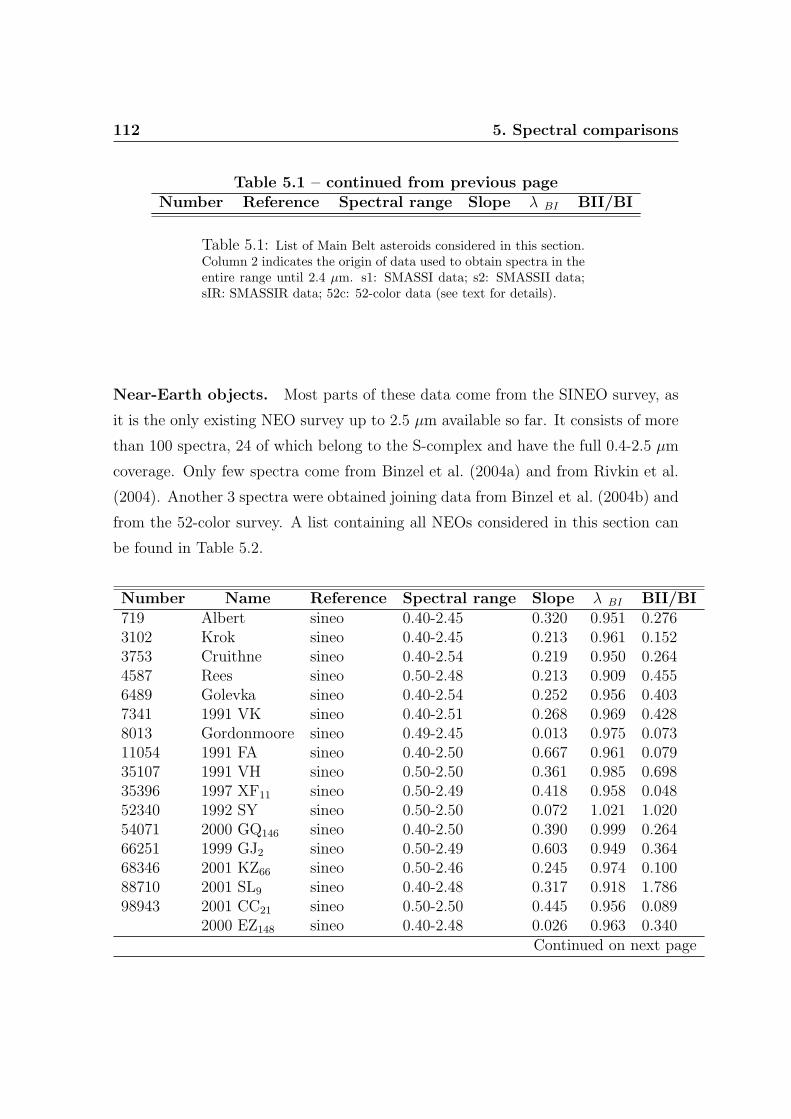
112 5. Spectral comparisons
Table 5.1 – continued from previous pageNumber Reference Spectral range Slope λ BI BII/BI
Table 5.1: List of Main Belt asteroids considered in this section.Column 2 indicates the origin of data used to obtain spectra in theentire range until 2.4 µm. s1: SMASSI data; s2: SMASSII data;sIR: SMASSIR data; 52c: 52-color data (see text for details).
Near-Earth objects. Most parts of these data come from the SINEO survey, as
it is the only existing NEO survey up to 2.5 µm available so far. It consists of more
than 100 spectra, 24 of which belong to the S-complex and have the full 0.4-2.5 µm
coverage. Only few spectra come from Binzel et al. (2004a) and from Rivkin et al.
(2004). Another 3 spectra were obtained joining data from Binzel et al. (2004b) and
from the 52-color survey. A list containing all NEOs considered in this section can
be found in Table 5.2.
Number Name Reference Spectral range Slope λ BI BII/BI719 Albert sineo 0.40-2.45 0.320 0.951 0.2763102 Krok sineo 0.40-2.45 0.213 0.961 0.1523753 Cruithne sineo 0.40-2.54 0.219 0.950 0.2644587 Rees sineo 0.50-2.48 0.213 0.909 0.4556489 Golevka sineo 0.40-2.54 0.252 0.956 0.4037341 1991 VK sineo 0.40-2.51 0.268 0.969 0.4288013 Gordonmoore sineo 0.49-2.45 0.013 0.975 0.07311054 1991 FA sineo 0.40-2.50 0.667 0.961 0.07935107 1991 VH sineo 0.50-2.50 0.361 0.985 0.69835396 1997 XF11 sineo 0.50-2.49 0.418 0.958 0.04852340 1992 SY sineo 0.50-2.50 0.072 1.021 1.02054071 2000 GQ146 sineo 0.40-2.50 0.390 0.999 0.26466251 1999 GJ2 sineo 0.50-2.49 0.603 0.949 0.36468346 2001 KZ66 sineo 0.50-2.46 0.245 0.974 0.10088710 2001 SL9 sineo 0.40-2.48 0.317 0.918 1.78698943 2001 CC21 sineo 0.50-2.50 0.445 0.956 0.089
2000 EZ148 sineo 0.40-2.48 0.026 0.963 0.340Continued on next page
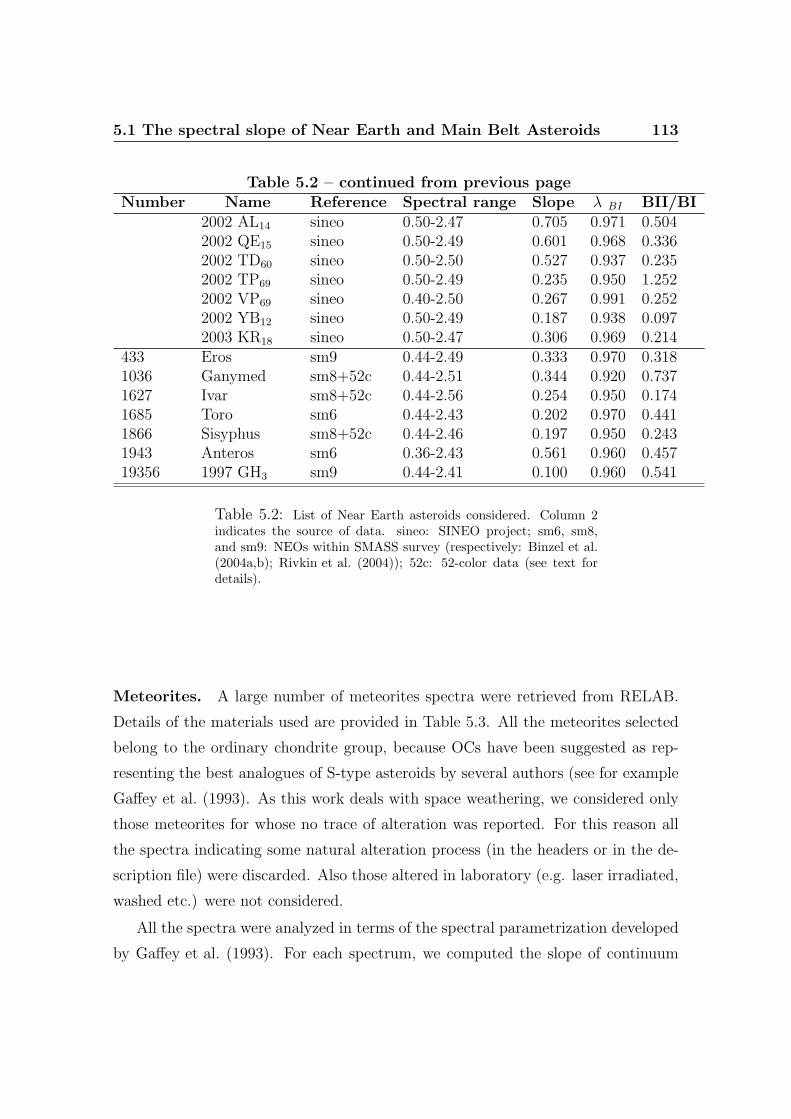
5.1 The spectral slope of Near Earth and Main Belt Asteroids 113
Table 5.2 – continued from previous pageNumber Name Reference Spectral range Slope λ BI BII/BI
2002 AL14 sineo 0.50-2.47 0.705 0.971 0.5042002 QE15 sineo 0.50-2.49 0.601 0.968 0.3362002 TD60 sineo 0.50-2.50 0.527 0.937 0.2352002 TP69 sineo 0.50-2.49 0.235 0.950 1.2522002 VP69 sineo 0.40-2.50 0.267 0.991 0.2522002 YB12 sineo 0.50-2.49 0.187 0.938 0.0972003 KR18 sineo 0.50-2.47 0.306 0.969 0.214
433 Eros sm9 0.44-2.49 0.333 0.970 0.3181036 Ganymed sm8+52c 0.44-2.51 0.344 0.920 0.7371627 Ivar sm8+52c 0.44-2.56 0.254 0.950 0.1741685 Toro sm6 0.44-2.43 0.202 0.970 0.4411866 Sisyphus sm8+52c 0.44-2.46 0.197 0.950 0.2431943 Anteros sm6 0.36-2.43 0.561 0.960 0.45719356 1997 GH3 sm9 0.44-2.41 0.100 0.960 0.541
Table 5.2: List of Near Earth asteroids considered. Column 2indicates the source of data. sineo: SINEO project; sm6, sm8,and sm9: NEOs within SMASS survey (respectively: Binzel et al.(2004a,b); Rivkin et al. (2004)); 52c: 52-color data (see text fordetails).
Meteorites. A large number of meteorites spectra were retrieved from RELAB.
Details of the materials used are provided in Table 5.3. All the meteorites selected
belong to the ordinary chondrite group, because OCs have been suggested as rep-
resenting the best analogues of S-type asteroids by several authors (see for example
Gaffey et al. (1993). As this work deals with space weathering, we considered only
those meteorites for whose no trace of alteration was reported. For this reason all
the spectra indicating some natural alteration process (in the headers or in the de-
scription file) were discarded. Also those altered in laboratory (e.g. laser irradiated,
washed etc.) were not considered.
All the spectra were analyzed in terms of the spectral parametrization developed
by Gaffey et al. (1993). For each spectrum, we computed the slope of continuum
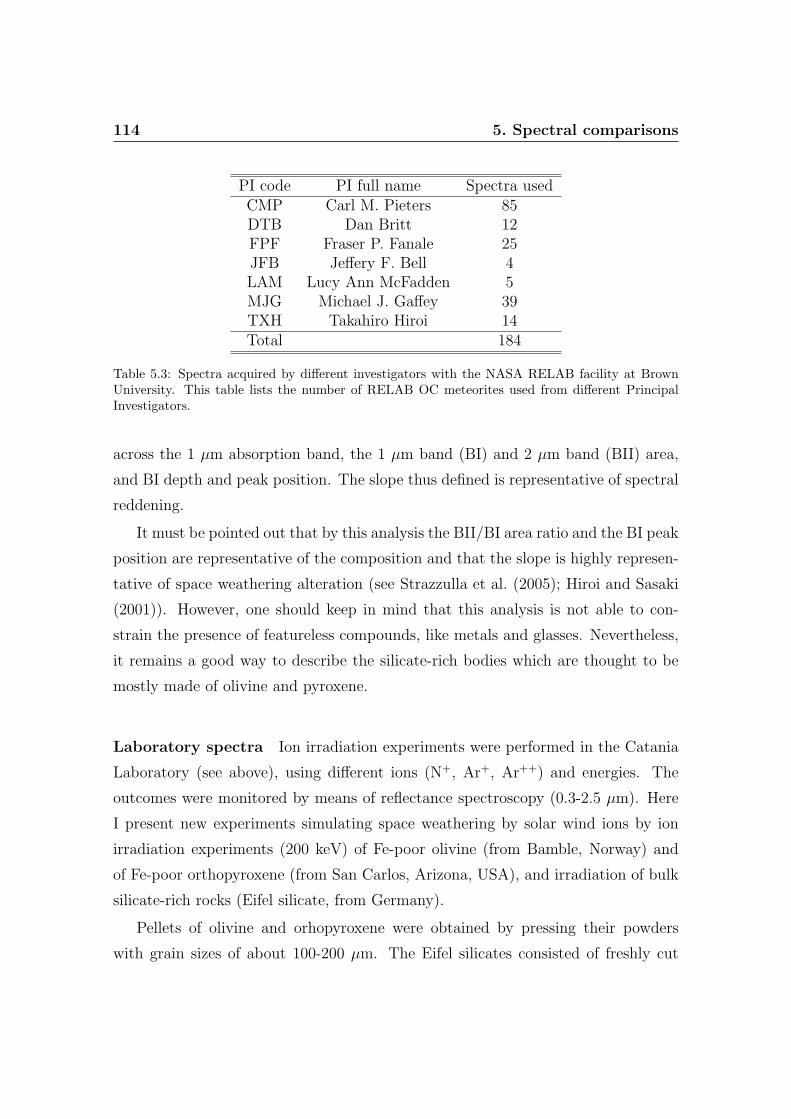
114 5. Spectral comparisons
PI code PI full name Spectra usedCMP Carl M. Pieters 85DTB Dan Britt 12FPF Fraser P. Fanale 25JFB Jeffery F. Bell 4LAM Lucy Ann McFadden 5MJG Michael J. Gaffey 39TXH Takahiro Hiroi 14Total 184
Table 5.3: Spectra acquired by different investigators with the NASA RELAB facility at BrownUniversity. This table lists the number of RELAB OC meteorites used from different PrincipalInvestigators.
across the 1 µm absorption band, the 1 µm band (BI) and 2 µm band (BII) area,
and BI depth and peak position. The slope thus defined is representative of spectral
reddening.
It must be pointed out that by this analysis the BII/BI area ratio and the BI peak
position are representative of the composition and that the slope is highly represen-
tative of space weathering alteration (see Strazzulla et al. (2005); Hiroi and Sasaki
(2001)). However, one should keep in mind that this analysis is not able to con-
strain the presence of featureless compounds, like metals and glasses. Nevertheless,
it remains a good way to describe the silicate-rich bodies which are thought to be
mostly made of olivine and pyroxene.
Laboratory spectra Ion irradiation experiments were performed in the Catania
Laboratory (see above), using different ions (N+, Ar+, Ar++) and energies. The
outcomes were monitored by means of reflectance spectroscopy (0.3-2.5 µm). Here
I present new experiments simulating space weathering by solar wind ions by ion
irradiation experiments (200 keV) of Fe-poor olivine (from Bamble, Norway) and
of Fe-poor orthopyroxene (from San Carlos, Arizona, USA), and irradiation of bulk
silicate-rich rocks (Eifel silicate, from Germany).
Pellets of olivine and orhopyroxene were obtained by pressing their powders
with grain sizes of about 100-200 µm. The Eifel silicates consisted of freshly cut
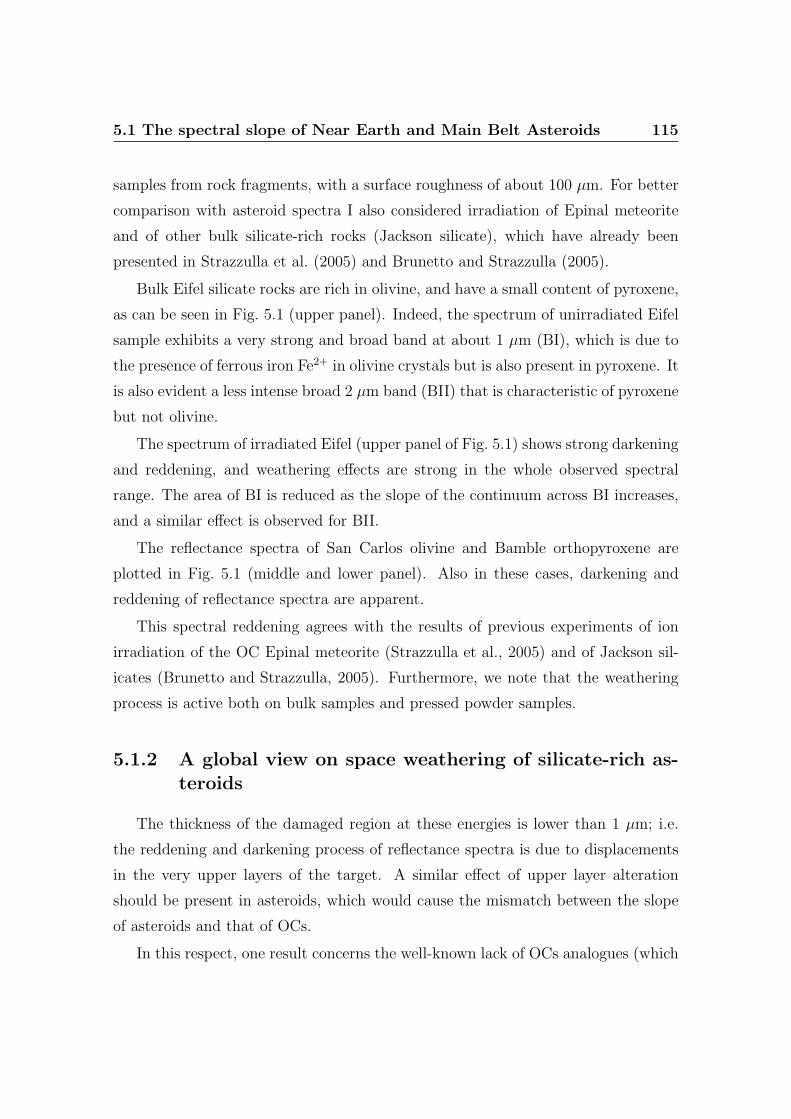
5.1 The spectral slope of Near Earth and Main Belt Asteroids 115
samples from rock fragments, with a surface roughness of about 100 µm. For better
comparison with asteroid spectra I also considered irradiation of Epinal meteorite
and of other bulk silicate-rich rocks (Jackson silicate), which have already been
presented in Strazzulla et al. (2005) and Brunetto and Strazzulla (2005).
Bulk Eifel silicate rocks are rich in olivine, and have a small content of pyroxene,
as can be seen in Fig. 5.1 (upper panel). Indeed, the spectrum of unirradiated Eifel
sample exhibits a very strong and broad band at about 1 µm (BI), which is due to
the presence of ferrous iron Fe2+ in olivine crystals but is also present in pyroxene. It
is also evident a less intense broad 2 µm band (BII) that is characteristic of pyroxene
but not olivine.
The spectrum of irradiated Eifel (upper panel of Fig. 5.1) shows strong darkening
and reddening, and weathering effects are strong in the whole observed spectral
range. The area of BI is reduced as the slope of the continuum across BI increases,
and a similar effect is observed for BII.
The reflectance spectra of San Carlos olivine and Bamble orthopyroxene are
plotted in Fig. 5.1 (middle and lower panel). Also in these cases, darkening and
reddening of reflectance spectra are apparent.
This spectral reddening agrees with the results of previous experiments of ion
irradiation of the OC Epinal meteorite (Strazzulla et al., 2005) and of Jackson sil-
icates (Brunetto and Strazzulla, 2005). Furthermore, we note that the weathering
process is active both on bulk samples and pressed powder samples.
5.1.2 A global view on space weathering of silicate-rich as-teroids
The thickness of the damaged region at these energies is lower than 1 µm; i.e.
the reddening and darkening process of reflectance spectra is due to displacements
in the very upper layers of the target. A similar effect of upper layer alteration
should be present in asteroids, which would cause the mismatch between the slope
of asteroids and that of OCs.
In this respect, one result concerns the well-known lack of OCs analogues (which
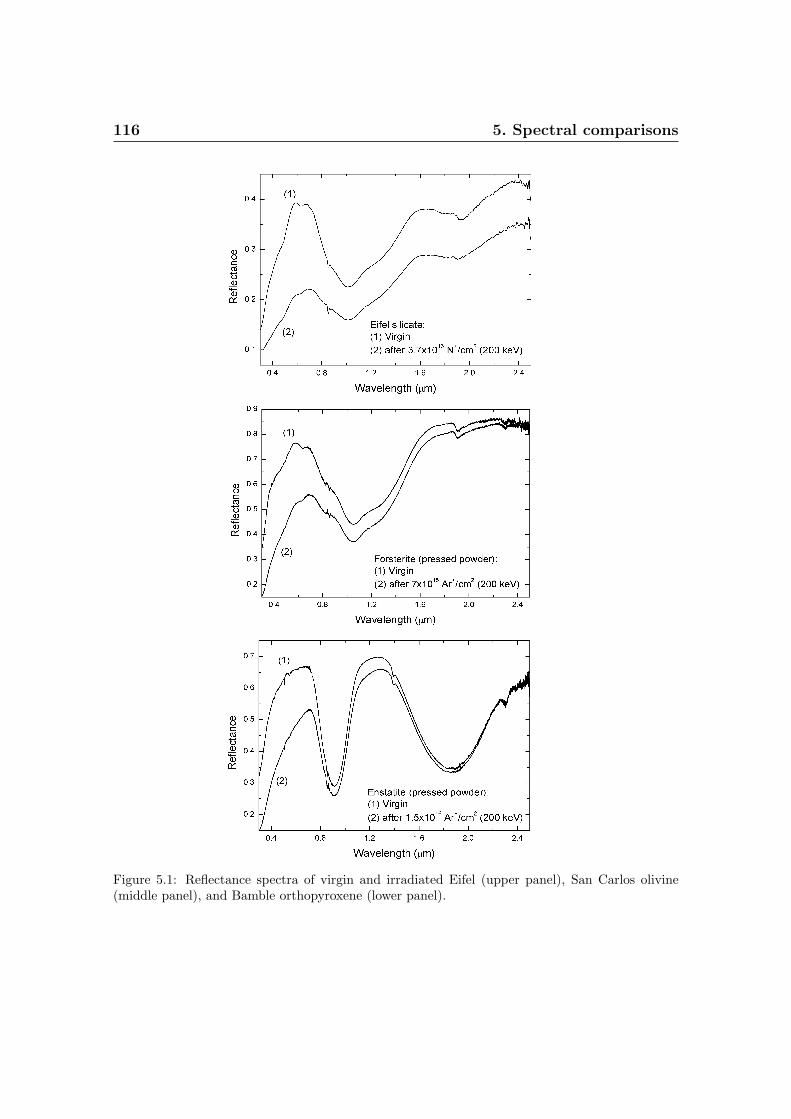
116 5. Spectral comparisons
Figure 5.1: Reflectance spectra of virgin and irradiated Eifel (upper panel), San Carlos olivine(middle panel), and Bamble orthopyroxene (lower panel).
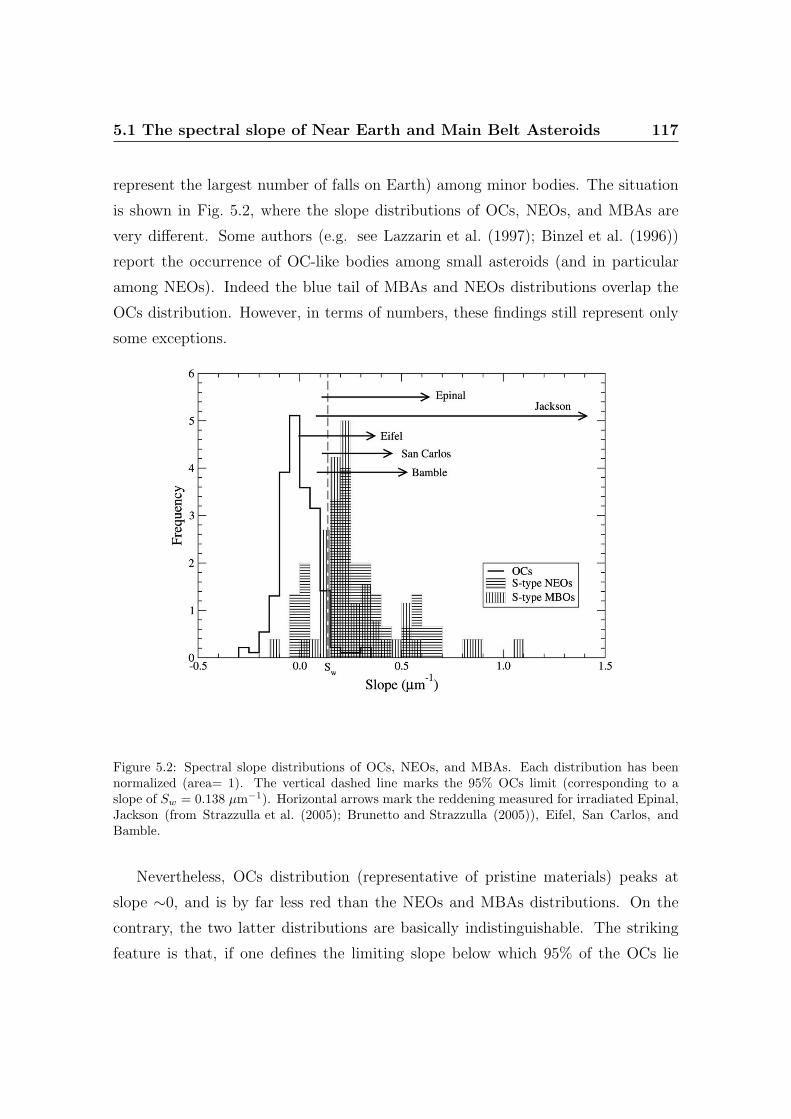
5.1 The spectral slope of Near Earth and Main Belt Asteroids 117
represent the largest number of falls on Earth) among minor bodies. The situation
is shown in Fig. 5.2, where the slope distributions of OCs, NEOs, and MBAs are
very different. Some authors (e.g. see Lazzarin et al. (1997); Binzel et al. (1996))
report the occurrence of OC-like bodies among small asteroids (and in particular
among NEOs). Indeed the blue tail of MBAs and NEOs distributions overlap the
OCs distribution. However, in terms of numbers, these findings still represent only
some exceptions.
Figure 5.2: Spectral slope distributions of OCs, NEOs, and MBAs. Each distribution has beennormalized (area= 1). The vertical dashed line marks the 95% OCs limit (corresponding to aslope of Sw = 0.138 µm−1). Horizontal arrows mark the reddening measured for irradiated Epinal,Jackson (from Strazzulla et al. (2005); Brunetto and Strazzulla (2005)), Eifel, San Carlos, andBamble.
Nevertheless, OCs distribution (representative of pristine materials) peaks at
slope ∼0, and is by far less red than the NEOs and MBAs distributions. On the
contrary, the two latter distributions are basically indistinguishable. The striking
feature is that, if one defines the limiting slope below which 95% of the OCs lie
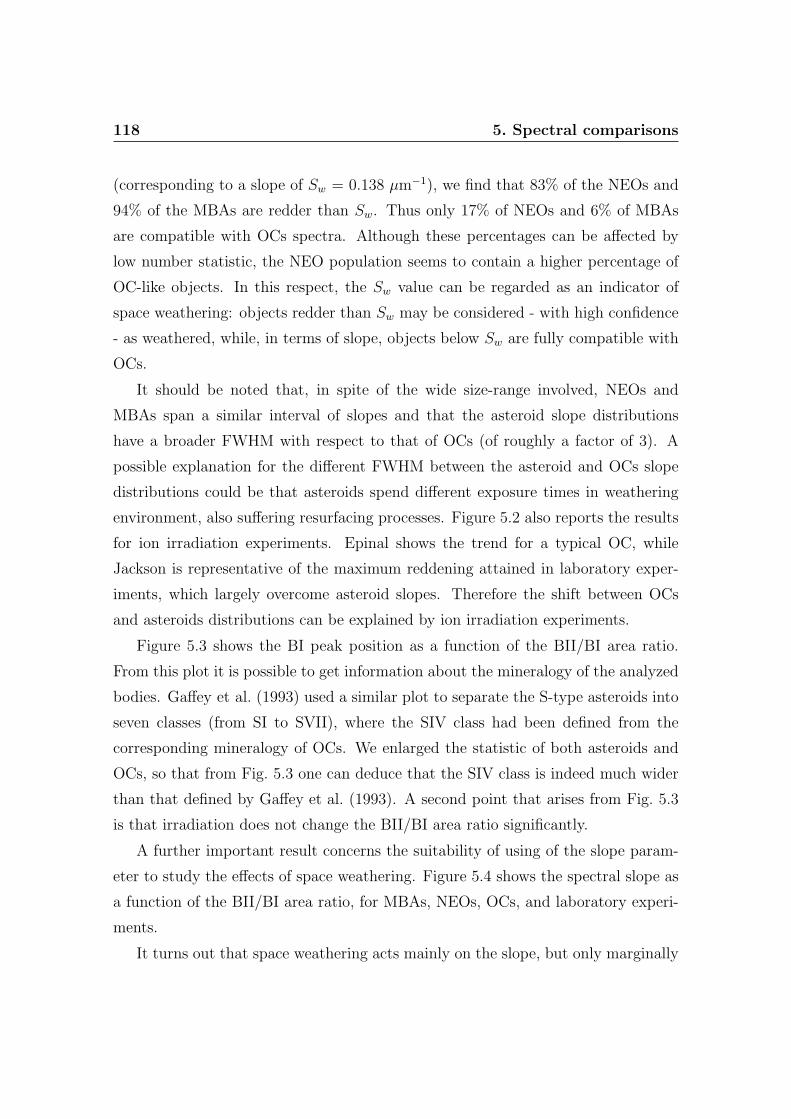
118 5. Spectral comparisons
(corresponding to a slope of Sw = 0.138 µm−1), we find that 83% of the NEOs and
94% of the MBAs are redder than Sw. Thus only 17% of NEOs and 6% of MBAs
are compatible with OCs spectra. Although these percentages can be affected by
low number statistic, the NEO population seems to contain a higher percentage of
OC-like objects. In this respect, the Sw value can be regarded as an indicator of
space weathering: objects redder than Sw may be considered - with high confidence
- as weathered, while, in terms of slope, objects below Sw are fully compatible with
OCs.
It should be noted that, in spite of the wide size-range involved, NEOs and
MBAs span a similar interval of slopes and that the asteroid slope distributions
have a broader FWHM with respect to that of OCs (of roughly a factor of 3). A
possible explanation for the different FWHM between the asteroid and OCs slope
distributions could be that asteroids spend different exposure times in weathering
environment, also suffering resurfacing processes. Figure 5.2 also reports the results
for ion irradiation experiments. Epinal shows the trend for a typical OC, while
Jackson is representative of the maximum reddening attained in laboratory exper-
iments, which largely overcome asteroid slopes. Therefore the shift between OCs
and asteroids distributions can be explained by ion irradiation experiments.
Figure 5.3 shows the BI peak position as a function of the BII/BI area ratio.
From this plot it is possible to get information about the mineralogy of the analyzed
bodies. Gaffey et al. (1993) used a similar plot to separate the S-type asteroids into
seven classes (from SI to SVII), where the SIV class had been defined from the
corresponding mineralogy of OCs. We enlarged the statistic of both asteroids and
OCs, so that from Fig. 5.3 one can deduce that the SIV class is indeed much wider
than that defined by Gaffey et al. (1993). A second point that arises from Fig. 5.3
is that irradiation does not change the BII/BI area ratio significantly.
A further important result concerns the suitability of using of the slope param-
eter to study the effects of space weathering. Figure 5.4 shows the spectral slope as
a function of the BII/BI area ratio, for MBAs, NEOs, OCs, and laboratory experi-
ments.
It turns out that space weathering acts mainly on the slope, but only marginally
5.1 The spectral slope of Near Earth and Main Belt Asteroids 119
Figure 5.3: Band I peak position vs. BII/BI area ratio for MBAs and NEOs. Positions forvirgin and irradiated silicate are also shown (arrows show their trend from virgin to irradiated).The shaded area corresponds to the region occupied by OCs. Symbol dimensions correspond tomaximum error bars.
on the ratio BII/BI, for both pressed powder (San Carlos and Bamble) and bulk
samples (Jackson, Eifel, Epinal). On the other hand, the ratio BII/BI is represen-
tative of the composition. Thus, the discrepancy between meteorites and asteroids
has mainly to be ascribed to the spectral slope, and this process is reproduced well
by ion irradiation experiments.
Another interesting issue related to Fig. 5.4 is that MBAs (and NEOs) have
a triangle-shaped distribution, with the highest slopes achieved for low values of
BII/BI, namely for high olivine contents.
From the spectra of irradiated Epinal, it has been estimated a reddening time-
scale of about 105 years at 1 AU (Astronomical Unit) from the Sun. The results
reported here indicate that most of the spectral slopes of asteroids can be reproduced
by damage values in the range 1-3×10¹⁹ displ/cm2 (see Fig. 5.4), in agreement with
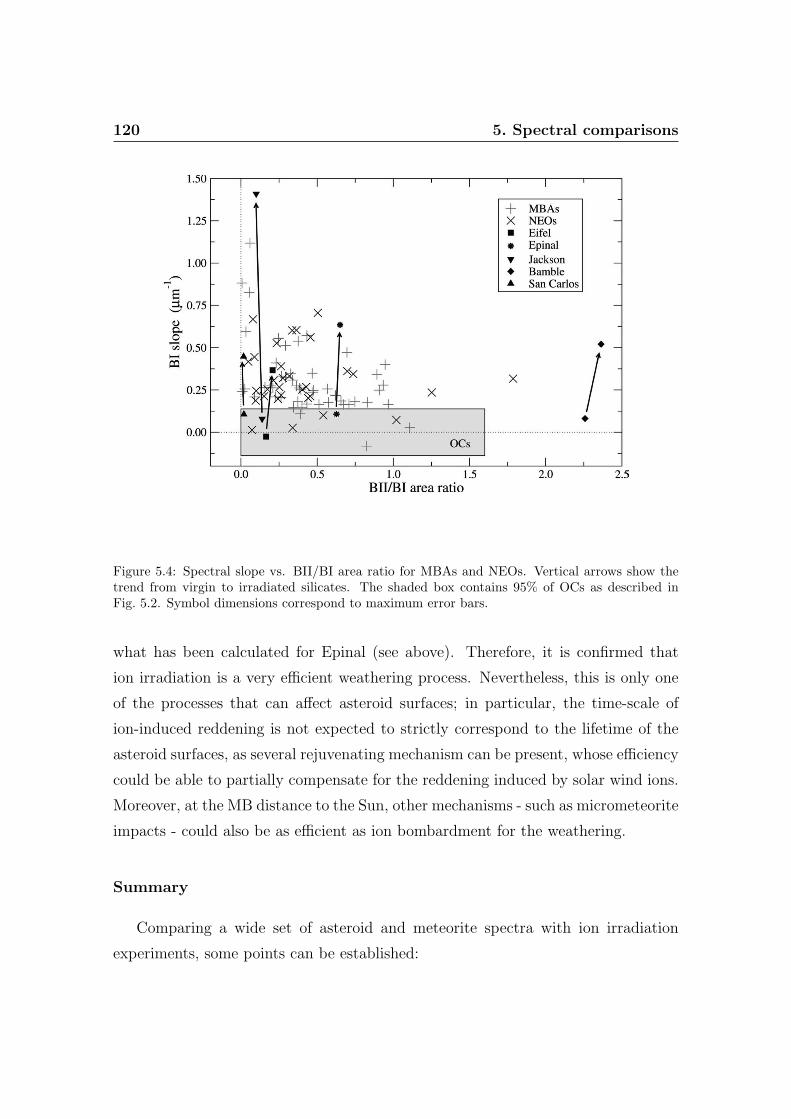
120 5. Spectral comparisons
Figure 5.4: Spectral slope vs. BII/BI area ratio for MBAs and NEOs. Vertical arrows show thetrend from virgin to irradiated silicates. The shaded box contains 95% of OCs as described inFig. 5.2. Symbol dimensions correspond to maximum error bars.
what has been calculated for Epinal (see above). Therefore, it is confirmed that
ion irradiation is a very efficient weathering process. Nevertheless, this is only one
of the processes that can affect asteroid surfaces; in particular, the time-scale of
ion-induced reddening is not expected to strictly correspond to the lifetime of the
asteroid surfaces, as several rejuvenating mechanism can be present, whose efficiency
could be able to partially compensate for the reddening induced by solar wind ions.
Moreover, at the MB distance to the Sun, other mechanisms - such as micrometeorite
impacts - could also be as efficient as ion bombardment for the weathering.
Summary
Comparing a wide set of asteroid and meteorite spectra with ion irradiation
experiments, some points can be established:
5.2 S-, C-, and X-complexes: a big picture 121
1. OCs and S-type asteroids exhibit a similar mineralogy, as deduced from band
parameters, more than what was previously assumed. Nevertheless, a signif-
icant mismatch was observed in the Vis-NIR spectra, which is due to very
different distributions of spectral slope.
2. The continuum slope above BI band is a good parameter to quantify the
degree of space weathering. Thus, a 95% OC slope limit (Sw) can be defined,
beyond which an asteroid can be considered as “weathered”. About 83% and
94% of the observed NEOs and MBAs, respectively, have a higher slope than
this limit. Moreover, asteroid slope distributions exhibit a noticeably broader
FWHM with respect to OCs distribution of about a factor of 3.
3. Ion irradiation can explain the shift of the OC distribution toward asteroid
distributions. Spectra of unaltered and irradiated silicates have slopes that
span a wider range than that observed in NEOs and MBAs.
4. MBA and NEO slope distributions do not differ significantly from each other.
However, if compared with OCs, they exhibit an asymmetrical slope distribu-
tion, a behavior that will be a subject of further investigations.
Acknowledgements
We thank G. Strazzulla for his helpful comments, and G. A. Baratta and F.
Spinella for their help during the experiments. We also thank V. Orofino for pro-
viding us with the silicate samples. We thank the anonymous referee who helped to
improve the paper by means of useful comments.
5.2 S-, C-, and X-complexes: a big picture
Based on the paper: Lazzarin, M., Marchi, S., Moroz, L. V., Brunetto,
R., Magrin, S., Paolicchi, P., Strazzulla, G. 2006. Space Weathering in
the Main Asteroid Belt: The Big Picture. Astrophysical Journal 647,
L179-L182.
122 5. Spectral comparisons
S-complex asteroids are composed mainly of mafic silicates olivine and pyroxe-
neand possibly some spectrally featureless phases such as plagioclase, FeNi metal,
and sulfides (Gaffey et al., 1993). For what concerns space weathering, laboratory
experiments demonstrated that their analog materials redden under both ion bom-
bardment (Strazzulla et al., 2005; Brunetto and Strazzulla, 2005) and laser irradi-
ation (Moroz et al., 1996; Yamada et al., 1999; Brunetto et al., 2006a); the latter
simulates micrometeorite impacts. Thus, the spectral “slope” increases with space
weathering.
The reddening due to micrometeorite impacts and low-energy light ions appears
to be related to the formation of nanophase metallic iron particles (SMFe; Hapke
(2001); Sasaki et al. (2001)). The micrometeorite impacts may be important con-
tributors to the reddening observed in the lunar samples (Hapke, 2001); however,
note that the different space environments and surface mineralogy between the lu-
nar samples and the MBAs do not allow for a direct extension of this statement to
MBAs.
In fact, the space weathering on S-complex asteroids seems to be more related
to solar ion flux rather than to micrometeorite bombardment (Marchi et al., 2006).
Consistently, Brunetto and Strazzulla (2005) suggested that, in terms of the astro-
physical timescale, solar wind ions (both light and heavy) are more efficient than
micrometeorites.
In comparison to the S complex, our understanding of C and X complexes (to-
gether more than half of the spectrally classified asteroids) is by far less satisfactory,
and their mineralogical assessment is not fully established. C and X complexes are
characterized by having mostly featureless visible spectra, but with different slopes:
from bluish to slightly red for the C-complex asteroids and from slightly red to mod-
erately red for the X-complex asteroids. Due to their featureless visible spectra, the
only clues to their composition can be found with the help of NIR observations and
with the use of meteoritic- assumed-counterparts.
Carbonaceous chondrites (CCs) have been suggested as possible fragments of
some C-complex asteroids on the basis of their spectral match and low albedo (∼0.07;
Johnson and Fanale (1973)). Although CC meteorites are dominated by silicates
5.2 S-, C-, and X-complexes: a big picture 123
(anhydrous and/or hydrated) by mass, their optical properties are dominated by
fine-grained opaque phases (e.g., sulfides) and organics. The response of the latter
phases to space weathering may be different from that of silicates (see below); thus,
it is not obvious how CCs (and C-complex asteroids) would behave under space
weathering.
The situation is even more complicated for the X-complex asteroids. Good spec-
tral matches have been found with different meteorite clans like enstatite chondrites
(E chondrites), aubrites, and irons (Burbine et al., 2002; Lazzarin et al., 2005, 2004).
Thus, the possible composition should range from Fe-free low-Ca pyroxene, enstatite,
metal, and sulfides (E chondrites and aubrites) to FeNi metal for the irons.
This is also confirmed by the wide albedo range observed. Due to recent observa-
tional work (Hardersen et al., 2005), features at 0.9 and 2 µm have been detected in
the spectra of some moderate-albedo X-complex asteroids (i.e., M-type asteroids),
and they have been assigned to mafic silicates (low-Fe, low- Ca pyroxene). These
findings might favor a mantle-core origin, ruling out the link with undifferentiated
E chondrites. However, absorption features at 3 µm have been detected and inter-
preted as being due to phyllosilicates (hydrated silicates), and this is inconsistent
with the high-temperature scenario for a differentiated parent body (Clark et al.,
2004; Lagerkvist et al., 2005).
Also, the experimental background of space weathering effects on terrestrial and
meteoritic analogs relevant for C and X complexes is not well established, basically
due to a lack of experimental work. The first experiments conducted on natural com-
plex hydrocarbon materials (asphaltite and kerite) showed that materials become
less red (the slope decreases) and less dark after irradiation with low-energy ions
(Moroz et al., 2004a), suggesting a similar space weathering trend for organic-rich
objects, opposite to that defined for silicates. Laser irradiation of a mineral mixture
containing 5 percent by weight (wt.%) kerite mixed with hydrated and anhydrous
silicates, metal, and calcite showed a slope decrease and darkening (Hiroi et al.,
2003). The same effect was observed after laser irradiation of a unique reddish CC
Tagish Lake (Hiroi et al., 2004) containing only 2.5 wt.% of organic material.
124 5. Spectral comparisons
However, no ion irradiation (presumably the dominant space weathering pro-
cess for asteroids; Marchi et al. (2006)) experiments have been performed on Tagish
Lake, organic-poor mineral mixtures or on pure hydrated silicates and sulfides, the
latter being the main darkening agents in primitive CC meteorites. The relative
abundances of organics compared to silicates and other constituents, the carboniza-
tion degree of organics, as well as the texture of constituents may define which
particular space weathering trend (increase or decrease of the slope) would domi-
nate. Observations of the slope-diameter anticorrelation for dark Cybele and Hilda
outer belt asteroids might suggest the dominance of the organic-like space weather-
ing trend on these distant (3.3-4 AU) objects (Lagerkvist et al., 2005). As for the
bright X-complex analog materials, no experiments have been performed yet.
5.2.1 Spectral trends in the Main Belt
With the aid of the method used for the S complex (Marchi et al., 2006), it is pos-
sible to obtain some relevant observational results concerning the above-mentioned
problems. We used the largest existing MBA spectroscopic database, consisting of
559 S-complex, 418 C-complex, and 250 X-complex MBAs from the second phase
of the Small Main-Belt Asteroid Spectroscopic Survey (SMASSII; Bus and Binzel
(2002a)). The model takes as input a state-of-the-art estimate (Bottke et al., 2005)
of the mean collisional age of the asteroids as a function of their size. Combining
the ages with the asteroid’s orbital configuration (namely, the semimajor axis and
eccentricity), we obtain a parameter proportional to the exposure of the ion flux
from the Sun. With respect to the previous model (see Marchi et al. (2006) for a
detailed explanation of the definition of exposure), we improve the age estimates
for the members of dynamical families, which can be set, if less than the collisional
age, equal to the age of the family (we used the recent and reliable estimates of
Nesvorny et al. (2006)). We also improve the exposure estimate by using the more
stable proper elements (Knezevic and Milani, 2003) instead of the osculating ele-
ments. We use the spectral slopes between 0.52 and 0.92 µm to characterize the
degree of space weathering.
5.2 S-, C-, and X-complexes: a big picture 125
Figure 5.5 shows the slope-exposure distribution for the three major complexes.
The most striking result is that for all the complexes, the trends are very clear
and statistically significant (the two-tailed probability, P, is <0.01%, ∼0.7%, and
∼0.8%, for the S, X, and C complexes, respectively). The trends are, respectively,
(24.9 ± 4.6), (14.6 ± 3.2), and (8.8 ± 5.4) × 10−5 µm−1 Myr−1 AU−2. Despite these
significant statistical trends, spectral slopes of individual objects exhibit a strong
scatter. This is certainly due to several parameters, like differences in composition,
surface roughness/texture, and inaccurate age determination; we use a mean value
and neglect possible dynamical corrections. Nevertheless, the quality of the results,
in statistical terms, is also supported by the overall agreement of the linear fits with
the average curves.
Notice that the trend found for the S complex is slightly reduced compared
to that previously found (Marchi et al., 2006). Notice also that the trend for the C
complex seems to be opposite to the only one available in the literature for family C-
complex asteroids (Nesvorny et al., 2005). In order to understand the trend obtained
by Nesvorny et al. (2005) using photometric rather than spectroscopic data, we
selected the C-complex family members present in our database.
Within the uncertainties due to the small number of objects, we obtain that
slope anticorrelates with exposure (and age), in agreement with Nesvorny et al.
(2005). The discrepancy between this trend, effective only for family members, and
the general, opposite, one is unclear, and it is probably due to some “sampling”
effect: the listed families may not be representative of the average composition of
the whole C-complex population of the main belt. The anticorrelation of family
members is mainly due to five families (24 Themis, 490 Veritas, 668 Dora, 1128
Astrid, and 1726 Hoffmeister) located beyond 2.78 AU, where the abundance of
organics (or other nonsilicate components) might be higher than in the inner part
of the main belt. A slope-age anticorrelation within C-complex families may be
due to an organic-like space weathering trend. Our conclusion is also supported by
the discovery of two active Themis family asteroids (Hsieh and Jewitt, 2006), which
are certainly compositionally very different from the usual C-complex asteroids;
it is possible that a relevant part of the Themis family itself has similar peculiar
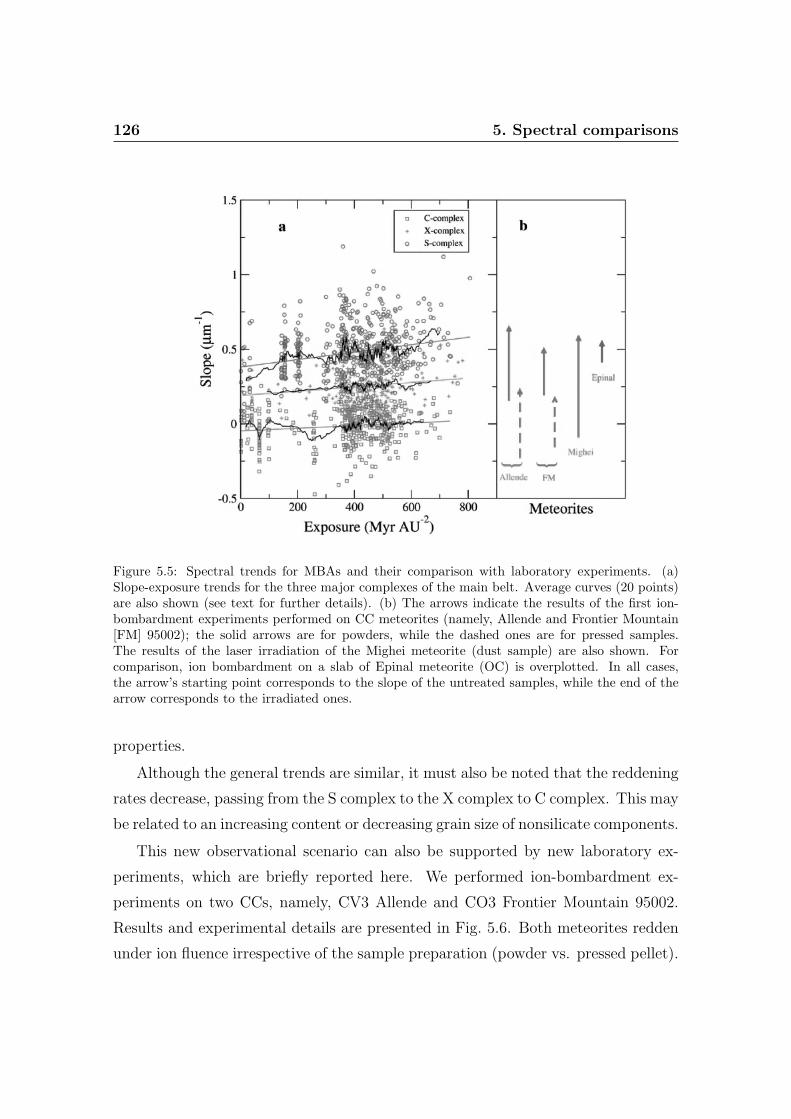
126 5. Spectral comparisons
Figure 5.5: Spectral trends for MBAs and their comparison with laboratory experiments. (a)Slope-exposure trends for the three major complexes of the main belt. Average curves (20 points)are also shown (see text for further details). (b) The arrows indicate the results of the first ion-bombardment experiments performed on CC meteorites (namely, Allende and Frontier Mountain[FM] 95002); the solid arrows are for powders, while the dashed ones are for pressed samples.The results of the laser irradiation of the Mighei meteorite (dust sample) are also shown. Forcomparison, ion bombardment on a slab of Epinal meteorite (OC) is overplotted. In all cases,the arrow’s starting point corresponds to the slope of the untreated samples, while the end of thearrow corresponds to the irradiated ones.
properties.
Although the general trends are similar, it must also be noted that the reddening
rates decrease, passing from the S complex to the X complex to C complex. This may
be related to an increasing content or decreasing grain size of nonsilicate components.
This new observational scenario can also be supported by new laboratory ex-
periments, which are briefly reported here. We performed ion-bombardment ex-
periments on two CCs, namely, CV3 Allende and CO3 Frontier Mountain 95002.
Results and experimental details are presented in Fig. 5.6. Both meteorites redden
under ion fluence irrespective of the sample preparation (powder vs. pressed pellet).
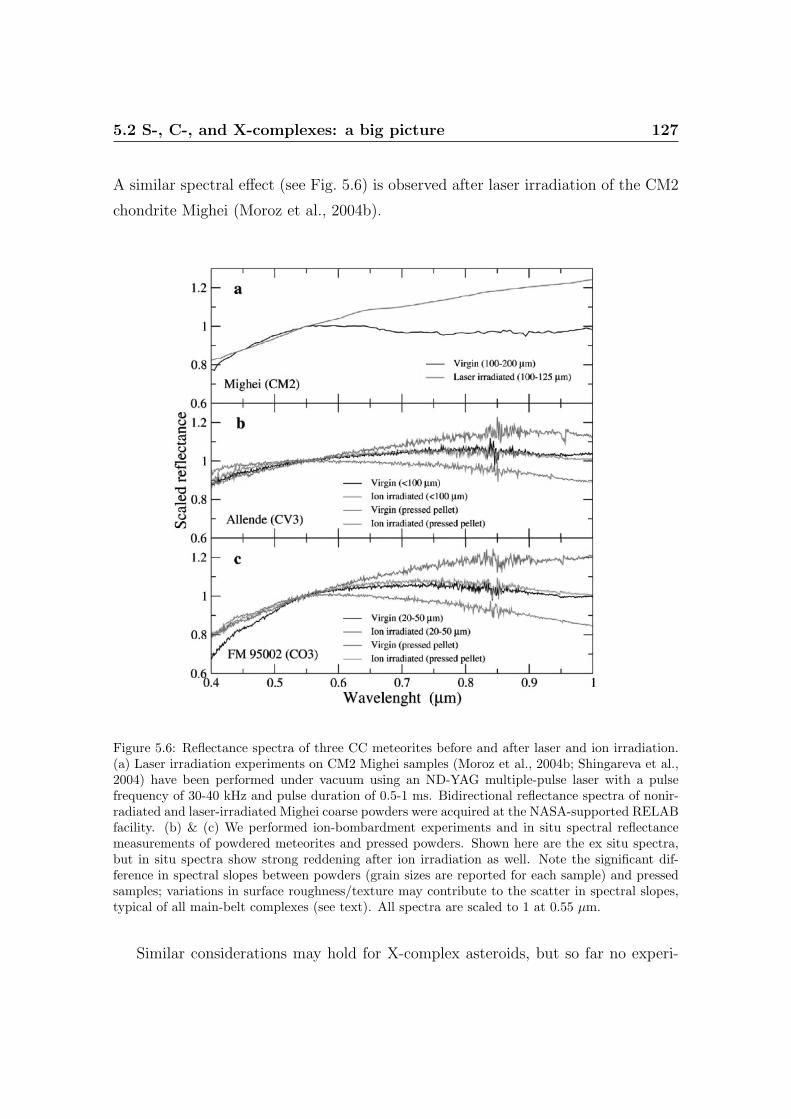
5.2 S-, C-, and X-complexes: a big picture 127
A similar spectral effect (see Fig. 5.6) is observed after laser irradiation of the CM2
chondrite Mighei (Moroz et al., 2004b).
Figure 5.6: Reflectance spectra of three CC meteorites before and after laser and ion irradiation.(a) Laser irradiation experiments on CM2 Mighei samples (Moroz et al., 2004b; Shingareva et al.,2004) have been performed under vacuum using an ND-YAG multiple-pulse laser with a pulsefrequency of 30-40 kHz and pulse duration of 0.5-1 ms. Bidirectional reflectance spectra of nonir-radiated and laser-irradiated Mighei coarse powders were acquired at the NASA-supported RELABfacility. (b) & (c) We performed ion-bombardment experiments and in situ spectral reflectancemeasurements of powdered meteorites and pressed powders. Shown here are the ex situ spectra,but in situ spectra show strong reddening after ion irradiation as well. Note the significant dif-ference in spectral slopes between powders (grain sizes are reported for each sample) and pressedsamples; variations in surface roughness/texture may contribute to the scatter in spectral slopes,typical of all main-belt complexes (see text). All spectra are scaled to 1 at 0.55 µm.
Similar considerations may hold for X-complex asteroids, but so far no experi-
128 5. Spectral comparisons
ments have been performed on possible analogs, such as aubrites, E chondrites, or
irons. For a better comparison, Fig. 5.5 also shows the reddening rate of these exper-
iments and the ion-irradiated H5 ordinary chondrite (OC) Epinal (Strazzulla et al.,
2005). Notice that the arrow lengths do not quantify the absolute degree of red-
dening; they simply reflect the experimental conditions and cannot be used for a
quantitative comparison.
5.2.2 The big picture
We have shown that a statistically significant slope-exposure correlation holds for
all the major MBA complexes and that this result may be understood consistently in
terms of the new experimental data. There are a few major implications for asteroid
science. First, it entails that the response to space weathering of (nearly) all kinds
of asteroids between 2 and 3.3 AU (where most of the asteroids in our sample are
located) be silicate-like.
This limit corresponds to the farthest distance where the Sun-related alteration
effects have been measured so far. Moreover, the existence of a reddening trend
for the C complex might define an upper limit (of a few percent) to the content
of organics within this region. The new space weathering simulation experiments
on CCs confirm the general robustness of our scenario. In addition, the existence
of slope-exposure trends indicates to us a Sun-related origin of the asteroidal space
weathering, at least in this region.
The low content of organics that we are suggesting may be explained either in
terms of their low original abundance in the part of the Solar Nebula from which
MBAs originate or as being due to a significant contamination by inorganic materi-
als, probably injected from the terrestrial region (e.g., within the outward migration
model recently proposed Bottke et al. (2006). The existence of a slope-exposure an-
ticorrelation among C-complex families may also be due to the existence of bodies
with a different composition (as a result of the compositional gradient in the Solar
Nebula or due to interlopers from the outer Solar System), perhaps with higher
contents of surface organics. The case of the active Themis member asteroids may
5.3 Irradiation mantles on centaurs and TNOs: ultra-red matter? 129
support this conclusion.
Concerning the moderate- to high-albedo part of the X complex, if the space
weathering-induced reddening is related to any change in the chemical state of Fe
(e.g., SMFe formation), then E chondrites and aubrites containing only Fe-free sil-
icates cannot be dominant components of the complex. However, additional space
weathering experiments on pure Fe-free silicate targets are required. Finally, the
emergence of similar reddening trends for C and X complexes may cause a severe
ambiguity between the two complexes since reddened (exposed to space weather-
ing) C-complex asteroids can be spectrally very similar to fresh X-complex aster-
oids, as shown by our new ion-bombardment experiments. It is also possible that
space-weathered C-complex asteroids may be confused with low-albedo X-complex
asteroids. On the basis of the available albedo data, this ambiguity might affect a
large fraction of about 50% of X-complex asteroids.
Acknowledgements
We thank the referee B. E. Clark for useful comments. We thank D. Nesvorny
for providing us with the most recent family ages and a list of family memberships.
We also thank L. Folco (Museo Nazionale dell’Antartide, Italy) for providing us with
samples of Allende and Programma Nazionale dell’Antartide (PNRA) meteorites.
We also thank Y. Keheyan for providing us with Allende samples. M. Lazzarin, S.
Marchi, S. Magrin, and P. Paolicchi have been supported by MIUR-PRIN funds. L.
V. Moroz was supported by MERTIS project funds.
5.3 Irradiation mantles on centaurs and TNOs:
ultra-red matter?
Based on the paper: Brunetto, R., Barucci, M. A., Dotto, E.,
Strazzulla, G. 2006. Ion Irradiation of Frozen Methanol, Methane, and
Benzene: Linking to the Colors of Centaurs and Trans-Neptunian
Objects. Astrophysical Journal 644, 646-650.
130 5. Spectral comparisons
5.3.1 Observations of centaurs and TNOs
I showed in the second part of this thesis present visible and near-infrared re-
flectance spectra of frozen methanol, methane, and benzene, collected before and
after irradiation with 200 keV H+ and Ar+ ions, and 400 keV Ar++ ions, up to a
dose released to target molecule of about 350 eV per 16 amu. The results evidenced
a strong reddening and darkening of the spectra, due to the formation of an organic
(C-rich) refractory residue.
In this section I compare this spectral behavior with some centaurs and trans-
Neptunian objects. To compare with laboratory data, I consider spectral observa-
tions of nine centaurs: (2060) Chiron (1977 UB), (8405) Asbolus (1995 GO), (10199)
Chariklo (1997 CU26), (32532) Thereus (2001 PT13), (52872) Okyrhoe (1998 SG35),
(54598) Bienor (2000 QC243), 55576 (2002 GB10), 63252 (2001 BL41), and 83982
(2002 GO9).
I also include nine TNOs: 26181 (1996 GQ21), 26375 (1999 DE9), (28978) Ixion
(2001 KX76), (38628) Huya (2000 EB173), 47171 (1999 TC36), 47932 (2000 GN171),
55565 (2002 AW197), (90377) Sedna (2003 VB12), and (90482) Orcus (2004 DW).
These observations are the products of the ESO Large Program (LP; PI: H.
Boehnhardt), executed from 2001 April to 2003 March at the VLT and NTT ESO
telescopes, covering both visible/ near-infrared photometry and spectroscopy (for
details see Barucci et al. (2002); Boehnhardt et al. (2003); Barucci and Peixinho
(2005)). Finally, I also consider the spectrum of centaur 5145 Pholus (after Cruikshank et al.
(1998)).
To compare the experiments with the observed spectra of centaurs and TNOs, I
have scaled all the spectra to 1 at 0.8 µm. A qualitative comparison with some of the
observed spectra (Thereus, (83982) 2002GO9, and Sedna) is displayed in Fig. 5.7; it
indicates a general trend, i.e., the colors of the observed objects can be reproduced
by progressive irradiation of simple molecules. Nevertheless, it should be stressed
that the aim of the comparison in Fig. 5.7 is not to fit the observed spectra, since a
scattering model of the surface would be necessary; furthermore, other species (for
instance H2O, N2, silicates, etc.) or even a spectrally flat amorphous carbon, which
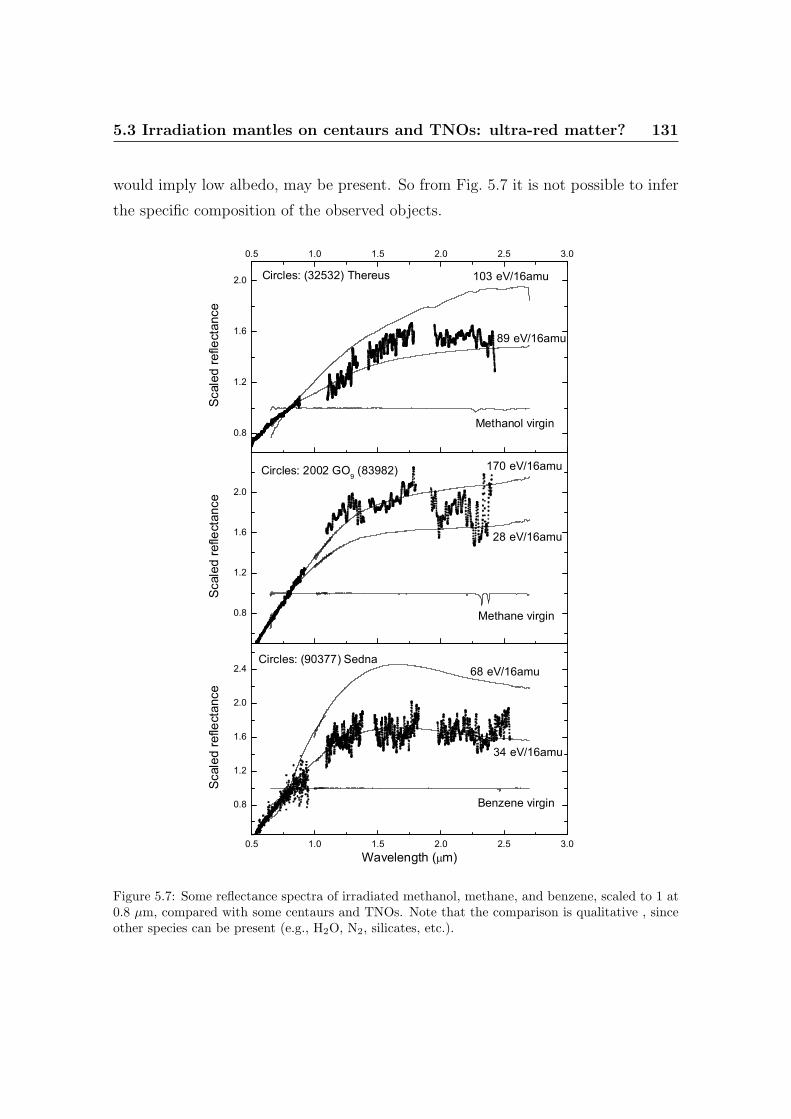
5.3 Irradiation mantles on centaurs and TNOs: ultra-red matter? 131
would imply low albedo, may be present. So from Fig. 5.7 it is not possible to infer
the specific composition of the observed objects.
0.5 1.0 1.5 2.0 2.5 3.0
0.8
1.2
1.6
2.0
2.4
34 eV/16amu
68 eV/16amu
Scal
ed re
flect
ance
Wavelength (mm)
Circles: (90377) Sedna
Benzene virgin
0.5 1.0 1.5 2.0 2.5 3.0
0.8
1.2
1.6
2.0
Circles: (32532) Thereus
Sc
aled
refle
ctan
ce
103 eV/16amu
Methanol virgin
89 eV/16amu
0.8
1.2
1.6
2.0
Scal
ed re
flect
ance
Circles: 2002 GO9 (83982)
28 eV/16amu
170 eV/16amu
Methane virgin
Figure 5.7: Some reflectance spectra of irradiated methanol, methane, and benzene, scaled to 1 at0.8 µm, compared with some centaurs and TNOs. Note that the comparison is qualitative , sinceother species can be present (e.g., H2O, N2, silicates, etc.).
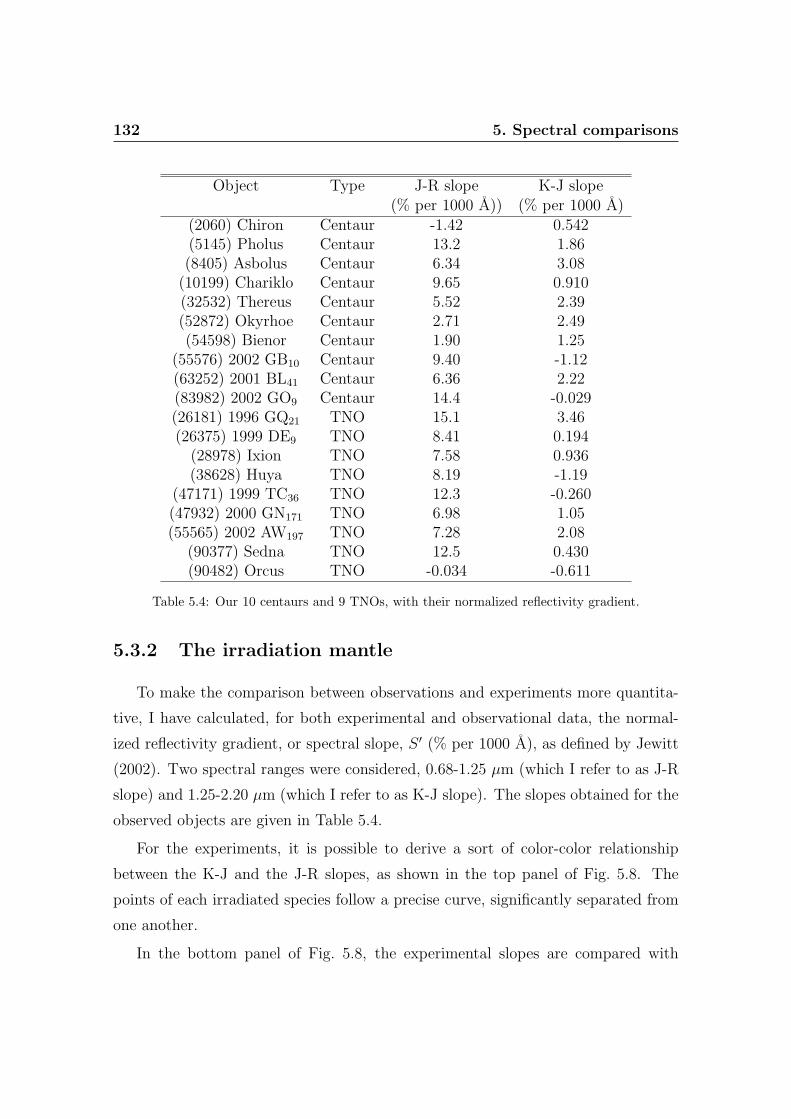
132 5. Spectral comparisons
Object Type J-R slope K-J slope(% per 1000 A)) (% per 1000 A)
(2060) Chiron Centaur -1.42 0.542(5145) Pholus Centaur 13.2 1.86(8405) Asbolus Centaur 6.34 3.08
(10199) Chariklo Centaur 9.65 0.910(32532) Thereus Centaur 5.52 2.39(52872) Okyrhoe Centaur 2.71 2.49(54598) Bienor Centaur 1.90 1.25
(55576) 2002 GB10 Centaur 9.40 -1.12(63252) 2001 BL41 Centaur 6.36 2.22(83982) 2002 GO9 Centaur 14.4 -0.029(26181) 1996 GQ21 TNO 15.1 3.46(26375) 1999 DE9 TNO 8.41 0.194
(28978) Ixion TNO 7.58 0.936(38628) Huya TNO 8.19 -1.19
(47171) 1999 TC36 TNO 12.3 -0.260(47932) 2000 GN171 TNO 6.98 1.05(55565) 2002 AW197 TNO 7.28 2.08
(90377) Sedna TNO 12.5 0.430(90482) Orcus TNO -0.034 -0.611
Table 5.4: Our 10 centaurs and 9 TNOs, with their normalized reflectivity gradient.
5.3.2 The irradiation mantle
To make the comparison between observations and experiments more quantita-
tive, I have calculated, for both experimental and observational data, the normal-
ized reflectivity gradient, or spectral slope, S ′ (% per 1000 A), as defined by Jewitt
(2002). Two spectral ranges were considered, 0.68-1.25 µm (which I refer to as J-R
slope) and 1.25-2.20 µm (which I refer to as K-J slope). The slopes obtained for the
observed objects are given in Table 5.4.
For the experiments, it is possible to derive a sort of color-color relationship
between the K-J and the J-R slopes, as shown in the top panel of Fig. 5.8. The
points of each irradiated species follow a precise curve, significantly separated from
one another.
In the bottom panel of Fig. 5.8, the experimental slopes are compared with
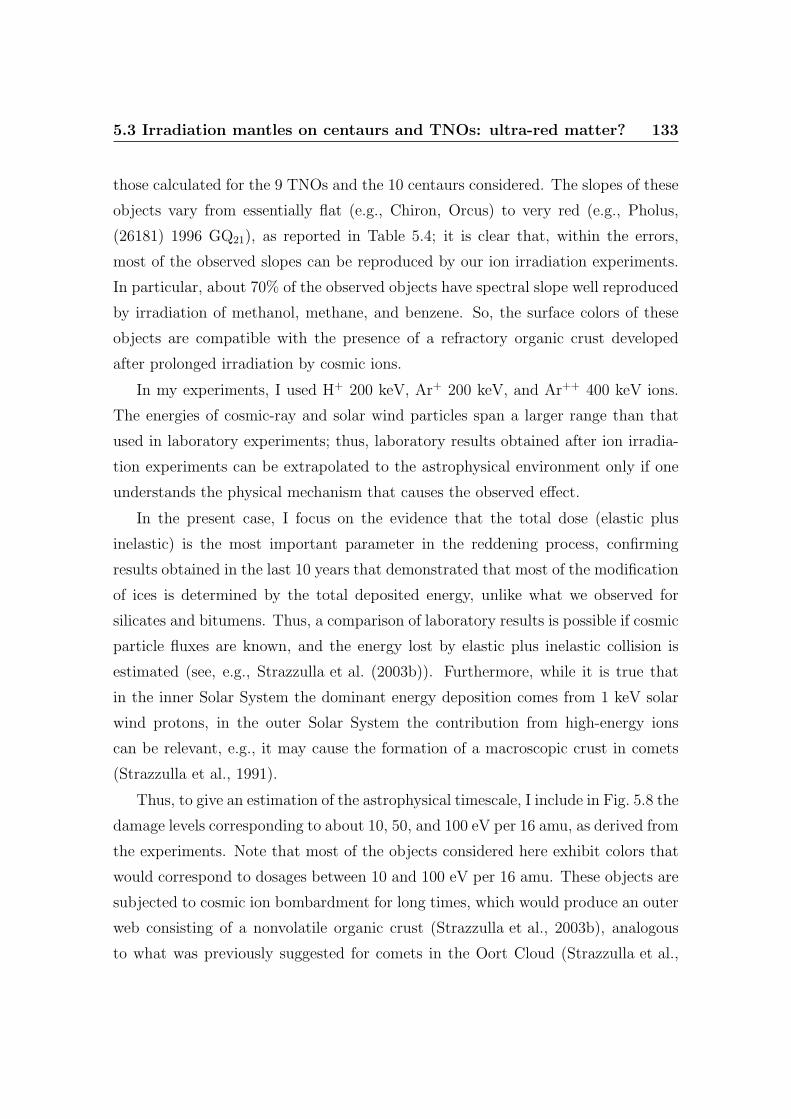
5.3 Irradiation mantles on centaurs and TNOs: ultra-red matter? 133
those calculated for the 9 TNOs and the 10 centaurs considered. The slopes of these
objects vary from essentially flat (e.g., Chiron, Orcus) to very red (e.g., Pholus,
(26181) 1996 GQ21), as reported in Table 5.4; it is clear that, within the errors,
most of the observed slopes can be reproduced by our ion irradiation experiments.
In particular, about 70% of the observed objects have spectral slope well reproduced
by irradiation of methanol, methane, and benzene. So, the surface colors of these
objects are compatible with the presence of a refractory organic crust developed
after prolonged irradiation by cosmic ions.
In my experiments, I used H+ 200 keV, Ar+ 200 keV, and Ar++ 400 keV ions.
The energies of cosmic-ray and solar wind particles span a larger range than that
used in laboratory experiments; thus, laboratory results obtained after ion irradia-
tion experiments can be extrapolated to the astrophysical environment only if one
understands the physical mechanism that causes the observed effect.
In the present case, I focus on the evidence that the total dose (elastic plus
inelastic) is the most important parameter in the reddening process, confirming
results obtained in the last 10 years that demonstrated that most of the modification
of ices is determined by the total deposited energy, unlike what we observed for
silicates and bitumens. Thus, a comparison of laboratory results is possible if cosmic
particle fluxes are known, and the energy lost by elastic plus inelastic collision is
estimated (see, e.g., Strazzulla et al. (2003b)). Furthermore, while it is true that
in the inner Solar System the dominant energy deposition comes from 1 keV solar
wind protons, in the outer Solar System the contribution from high-energy ions
can be relevant, e.g., it may cause the formation of a macroscopic crust in comets
(Strazzulla et al., 1991).
Thus, to give an estimation of the astrophysical timescale, I include in Fig. 5.8 the
damage levels corresponding to about 10, 50, and 100 eV per 16 amu, as derived from
the experiments. Note that most of the objects considered here exhibit colors that
would correspond to dosages between 10 and 100 eV per 16 amu. These objects are
subjected to cosmic ion bombardment for long times, which would produce an outer
web consisting of a nonvolatile organic crust (Strazzulla et al., 2003b), analogous
to what was previously suggested for comets in the Oort Cloud (Strazzulla et al.,
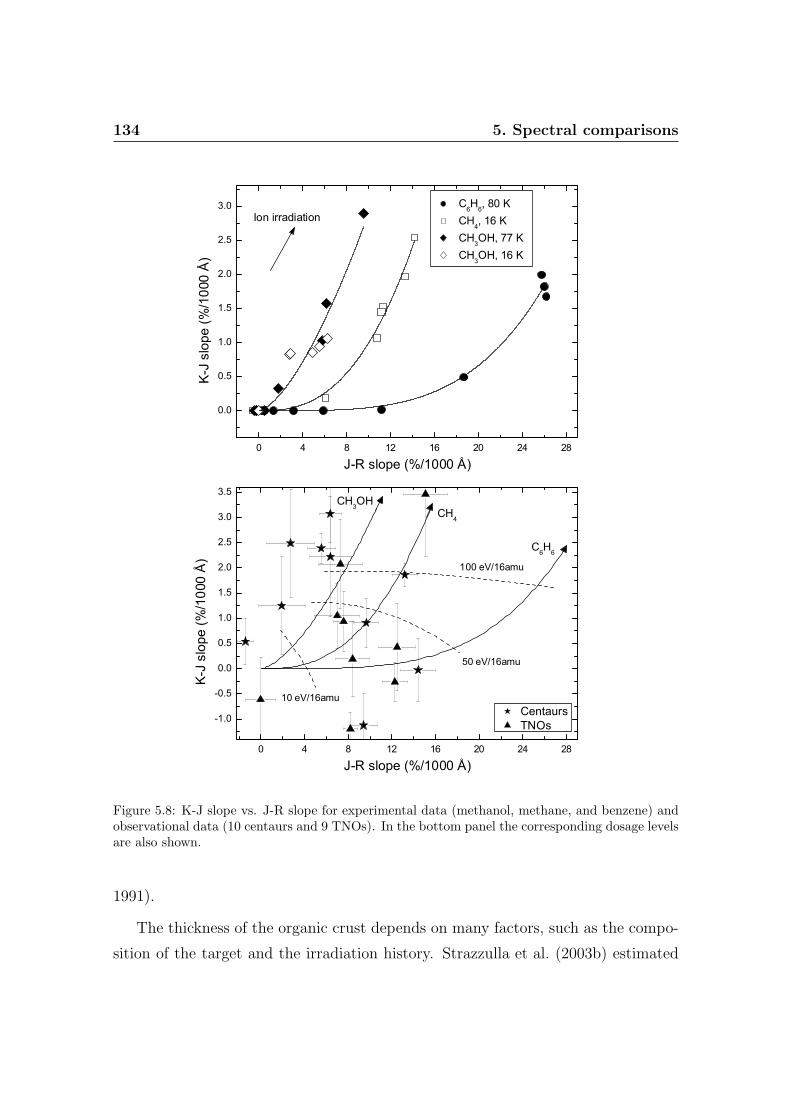
134 5. Spectral comparisons
0 4 8 12 16 20 24 28
0.0
0.5
1.0
1.5
2.0
2.5
3.0
K-J
slop
e (%
/100
0 Å
)
J-R slope (%/1000 Å)
C6H6, 80 K CH4, 16 K CH3OH, 77 K CH3OH, 16 K
Ion irradiation
0 4 8 12 16 20 24 28
-1.0
-0.5
0.0
0.5
1.0
1.5
2.0
2.5
3.0
3.5
100 eV/16amu
50 eV/16amu
CH4
C6H6
K-J
slop
e (%
/100
0 Å
)
J-R slope (%/1000 Å)
CentaursTNOs
CH3OH
10 eV/16amu
Figure 5.8: K-J slope vs. J-R slope for experimental data (methanol, methane, and benzene) andobservational data (10 centaurs and 9 TNOs). In the bottom panel the corresponding dosage levelsare also shown.
1991).
The thickness of the organic crust depends on many factors, such as the compo-
sition of the target and the irradiation history. Strazzulla et al. (2003b) estimated
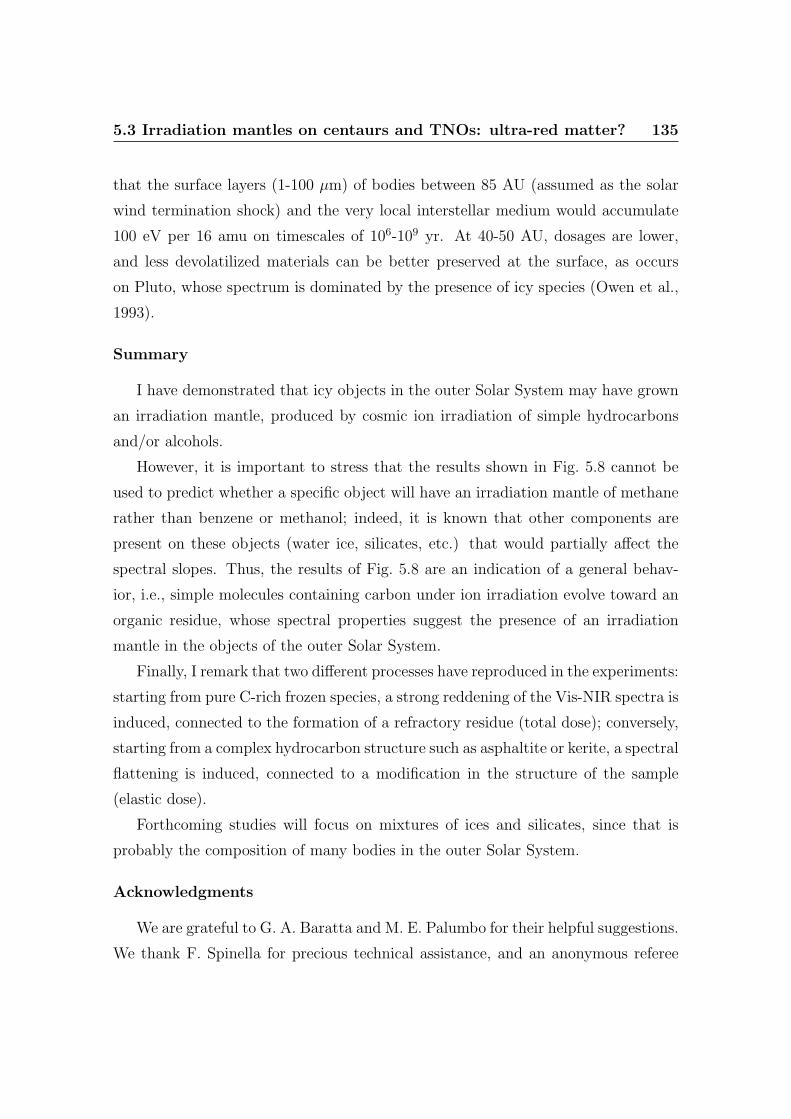
5.3 Irradiation mantles on centaurs and TNOs: ultra-red matter? 135
that the surface layers (1-100 µm) of bodies between 85 AU (assumed as the solar
wind termination shock) and the very local interstellar medium would accumulate
100 eV per 16 amu on timescales of 106-109 yr. At 40-50 AU, dosages are lower,
and less devolatilized materials can be better preserved at the surface, as occurs
on Pluto, whose spectrum is dominated by the presence of icy species (Owen et al.,
1993).
Summary
I have demonstrated that icy objects in the outer Solar System may have grown
an irradiation mantle, produced by cosmic ion irradiation of simple hydrocarbons
and/or alcohols.
However, it is important to stress that the results shown in Fig. 5.8 cannot be
used to predict whether a specific object will have an irradiation mantle of methane
rather than benzene or methanol; indeed, it is known that other components are
present on these objects (water ice, silicates, etc.) that would partially affect the
spectral slopes. Thus, the results of Fig. 5.8 are an indication of a general behav-
ior, i.e., simple molecules containing carbon under ion irradiation evolve toward an
organic residue, whose spectral properties suggest the presence of an irradiation
mantle in the objects of the outer Solar System.
Finally, I remark that two different processes have reproduced in the experiments:
starting from pure C-rich frozen species, a strong reddening of the Vis-NIR spectra is
induced, connected to the formation of a refractory residue (total dose); conversely,
starting from a complex hydrocarbon structure such as asphaltite or kerite, a spectral
flattening is induced, connected to a modification in the structure of the sample
(elastic dose).
Forthcoming studies will focus on mixtures of ices and silicates, since that is
probably the composition of many bodies in the outer Solar System.
Acknowledgments
We are grateful to G. A. Baratta and M. E. Palumbo for their helpful suggestions.
We thank F. Spinella for precious technical assistance, and an anonymous referee

136 5. Spectral comparisons
who helped us improve the paper. This research has been supported by MIUR and
INAF.
Chapter 6
Peculiar objects
In the previous chapter I have shown that statistically significant correlations
hold between spectral slopes and weathering effects, for the majority of NEOs and
MBAs. Also, clear weathering effects are observed on TNOs and centaurs. I have
also shown how these results may be understood consistently in terms of the exper-
imental data. In this chapter I will discuss the case of a few peculiar objects, to test
the space weathering models and their predictions.
6.1 Asteroid 832 Karin and its family
Based on the paper: Brunetto, R., Vernazza, P., Marchi, S., Birlan, M.,
Fulchignoni, M., Orofino, V., Strazzulla, G. 2006. Modeling asteroid
surfaces from observations and irradiation experiments: The case of 832
Karin. Icarus 184, 327-337.
The Karin cluster is a small asteroid family that formed 5.8±0.2 Myr ago in the
outer main belt. This is an exceptionally young age for an asteroid family. Thus, 832
Karin and its family give us an excellent opportunity for physical studies of a young
family whose members have apparently suffered limited dynamical and collisional
erosion, and to investigate the effects of a relatively short time exposition to space
weathering processes.
In this section I apply a space weathering model to the observed spectra of
Karin, and derive an exposure time to be compared with the age of the impact and
138 6. Peculiar objects
collisional breakup which originated the Karin asteroidal family.
In the previous sections, the spectral effects due to the solar wind and the
micrometeorite bombardment have been investigated. We have seen that, when
both processes are simulated in the laboratory (see, e.g., Yamada et al. (1999);
Sasaki et al. (2001); Brunetto et al. (2006a); Strazzulla et al. (2005)), a lunar-style
effect is observed, i.e., increased weathering results in a redder spectral slope, a lower
albedo, and weaker absorption features. Thus, in this scheme, the color/slope of an
asteroid spectrum is a function of exposure age and heliocentric distance; maybe
this scheme cannot easily be applied to asteroids Ida and Eros, where albedo vari-
ations and spectral reddening do not seem to be strictly related (Chapman, 1996;
Clark et al., 2001).
Nevertheless, it is also important to note that only reddening has been quan-
titatively studied to be related to the ion fluence. Qualitatively a darkening is
always observed that, however, has not yet quantitatively related to the fluence.
Thus, in this section I mainly focus on the reddening, also because recent results
(Marchi et al., 2006) indicate that the reddening effect is also evident on MBAs, so
it is at least reasonable applying this scheme to MBAs.
Asteroid spectra can be modeled by means of the Shkuratov or the Hapke scatter-
ing models (Shkuratov et al., 1999; Hapke, 1993). Nevertheless, pure silicate optical
constants (olivine, pyroxene) cannot reproduce the reddening caused by space weath-
ering processes; until now, additional components were needed, like submicroscopic
metallic iron (SMFe), to get the reddening effect (Hapke, 2001).
Solar wind ions affect a very thin upper layer of the asteroid surface, so re-
juvenating processes can be relevant. Old and new surfaces can even coexist on
the same object and be observed at different rotational phases. In this respect, a
strong evidence of space weathering may be provided by the variations of the surface
properties of the same asteroid (Chapman, 1996).
Recently, Nesvorny and Bottke (2004) have integrated backward in time the
known 90 members of the Karin family, a well-defined cluster of asteroids in the
proper elements space, formed by a collisional breakup, and embedded within the
larger Koronis family. The orbital elements of the Karin family members converge
6.1 Asteroid 832 Karin and its family 139
toward a single parent-body orbit, at 5.75±0.05 Myr ago. The discovery of the Karin
family offers an excellent opportunity for physical studies of a young family whose
members have apparently suffered limited dynamical and collisional erosion. The
most studied object of the Karin cluster is 832 Karin, a Main-Belt asteroid with
a diameter of 16-20 km (Sasaki et al., 2004; Yoshida et al., 2004; Nesvorny et al.,
2002; Nesvorny et al., 2005).
Here I compare the laboratory results with new spectra of 832 Karin in the visible
(0.45-0.95 µm) and in the near-IR (0.8-2.4 µm), and model the surface of 832 Karin
by applying a new description of space weathering.
6.1.1 Model of the continuum: the CS parameter
To study asteroid Karin, I start from the irradiation experiments of silicates,
described in the previous chapters.
The changes and modifications induced by colliding ions in the target have been
monitored using in situ bi-directional reflectance spectroscopy (0.7-2.5 µm) and ex
situ hemispherical reflectance spectroscopy (0.3-2.5 µm), as discussed above.
As a summary, the reflectance spectra of the samples, before and after irradiation,
are shown in Fig. 6.1. All the spectra exhibit the characteristic features of silicates,
with strong 1 and 2 µm bands (hereinafter band I and band II, respectively). In
the case of olivine and orthopyroxene powders, we consider both in situ and ex situ
experiments.
To compare different experiments (ion mass and energy) one can evaluate a
damage parameter as the number d = displacements per cm2, as demonstrated by
Brunetto and Strazzulla (2005).
The effects of space weathering can be easily described by an exponential contin-
uum. Indeed, if we compute the ratio between irradiated and unirradiated samples,
the contribution of bands I and II almost disappears, and a continuum curve is
left, with decreasing intensity moving from the NIR to the UV spectral range. This
space weathering process does not significantly affect the position or relative inten-
sities (areas) of the mafic silicate absorption features. This is illustrated in Fig. 6.2:
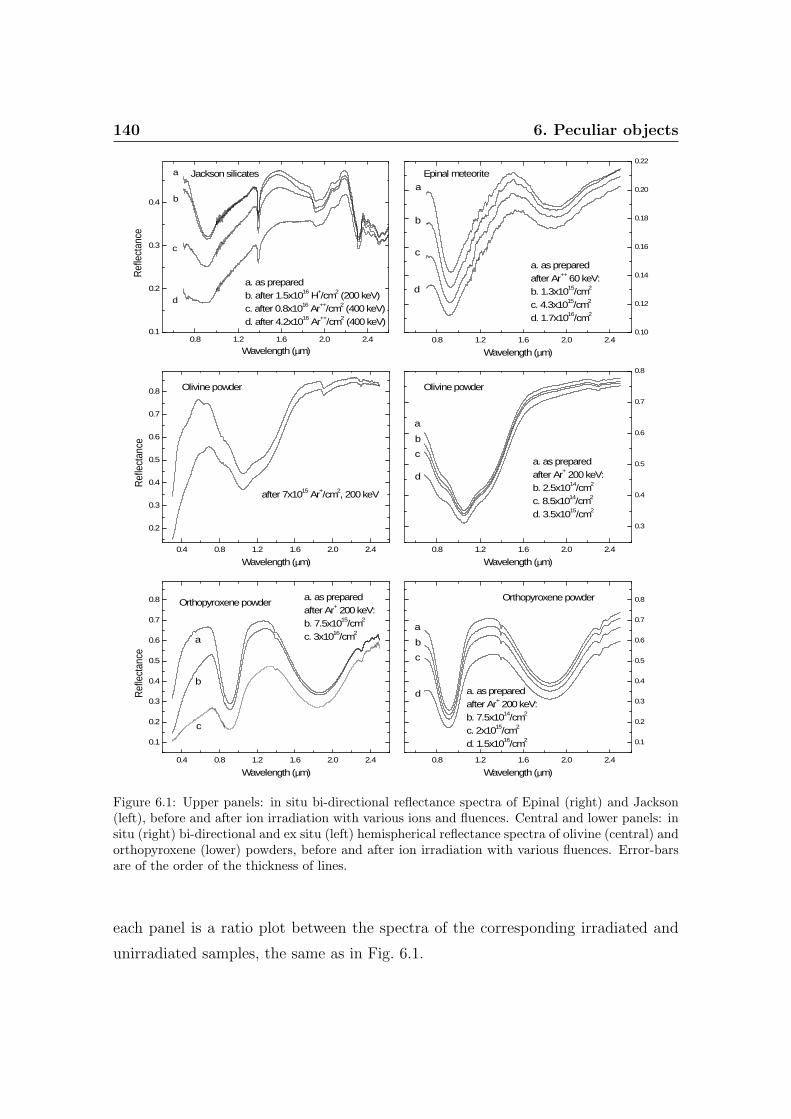
140 6. Peculiar objects
0.8 1.2 1.6 2.0 2.4
0.3
0.4
0.5
0.6
0.7
0.8
Wavelength (µm)
a. as preparedafter Ar+ 200 keV:b. 2.5x10¹⁴/cm2 c. 8.5x10¹⁴/cm2 d. 3.5x10¹⁵/cm2
Olivine powder
b
c
d
a
0.8 1.2 1.6 2.0 2.40.1
0.2
0.3
0.4
Ref
lect
ance
a
b
c
a. as preparedb. after 1.5x10¹⁶ H+/cm2 (200 keV)c. after 0.8x10¹⁶ Ar++/cm2 (400 keV)d. after 4.2x10¹⁶ Ar++/cm2 (400 keV)
Wavelength (µm)
Jackson silicates
d
0.8 1.2 1.6 2.0 2.40.10
0.12
0.14
0.16
0.18
0.20
0.22
Wavelength (µm)
Epinal meteorite
a. as preparedafter Ar++ 60 keV:b. 1.3x10¹⁵/cm2 c. 4.3x10¹⁵/cm2 d. 1.7x10¹⁶/cm2
b
c
d
a
0.4 0.8 1.2 1.6 2.0 2.4
0.2
0.3
0.4
0.5
0.6
0.7
0.8
Wavelength (µm)
Ref
lect
ance
Olivine powder
after 7x10¹⁵ Ar+/cm2, 200 keV
0.4 0.8 1.2 1.6 2.0 2.4
0.1
0.2
0.3
0.4
0.5
0.6
0.7
0.8
Ref
lect
ance
Wavelength (µm)
Orthopyroxene powdera. as preparedafter Ar+ 200 keV:b. 7.5x10¹⁵/cm2
c. 3x10¹⁶/cm2
b
c
a
0.8 1.2 1.6 2.0 2.4
0.1
0.2
0.3
0.4
0.5
0.6
0.7
0.8
a. as preparedafter Ar+ 200 keV:b. 7.5x10¹⁴/cm2 c. 2x10¹⁵/cm2 d. 1.5x10¹⁶/cm2
Wavelength (µm)
Orthopyroxene powder
b
c
d
a
Figure 6.1: Upper panels: in situ bi-directional reflectance spectra of Epinal (right) and Jackson(left), before and after ion irradiation with various ions and fluences. Central and lower panels: insitu (right) bi-directional and ex situ (left) hemispherical reflectance spectra of olivine (central) andorthopyroxene (lower) powders, before and after ion irradiation with various fluences. Error-barsare of the order of the thickness of lines.
each panel is a ratio plot between the spectra of the corresponding irradiated and
unirradiated samples, the same as in Fig. 6.1.
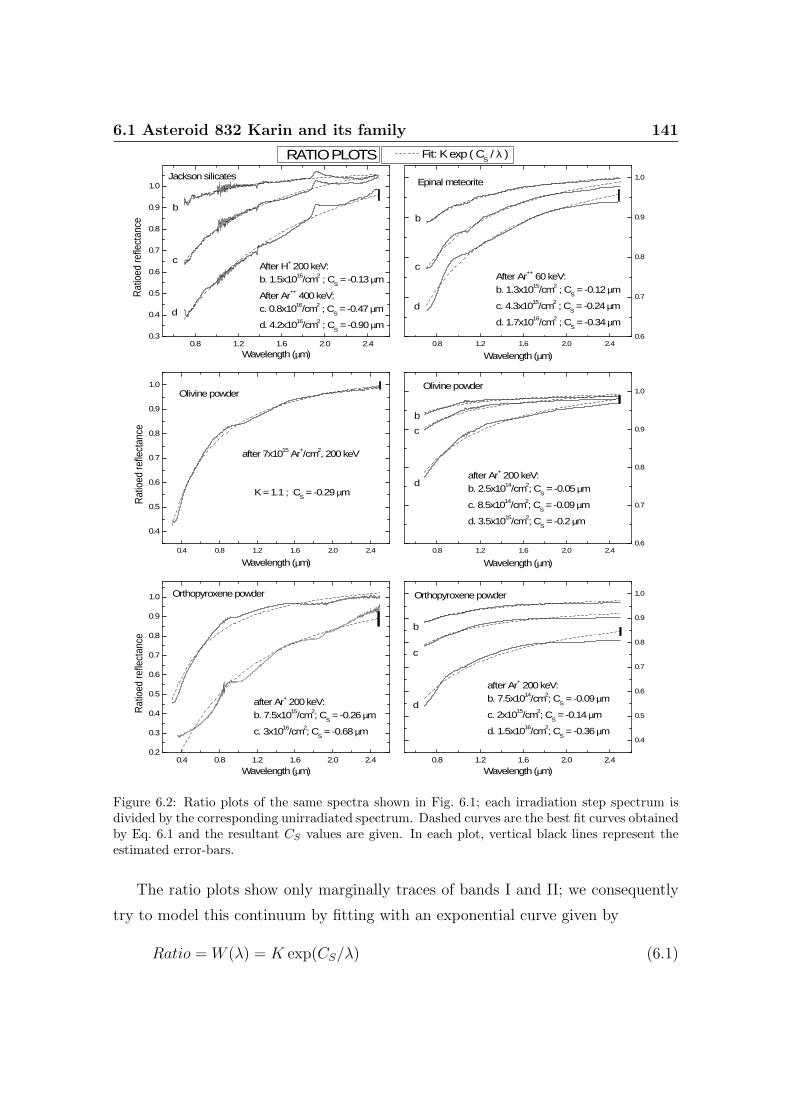
6.1 Asteroid 832 Karin and its family 141
0.8 1.2 1.6 2.0 2.4
0.4
0.5
0.6
0.7
0.8
0.9
1.0
after Ar+ 200 keV:b. 7.5x10¹⁴/cm2; C
S = -0.09 µm
c. 2x10¹⁵/cm2; CS = -0.14 µm
d. 1.5x10¹⁶/cm2; CS = -0.36 µm
Wavelength (µm)
Orthopyroxene powder
b
c
d
0.4 0.8 1.2 1.6 2.0 2.40.2
0.3
0.4
0.5
0.6
0.7
0.8
0.9
1.0
after Ar+ 200 keV:b. 7.5x10¹⁵/cm2; C
S = -0.26 µm
c. 3x10¹⁶/cm2; CS = -0.68 µm
Rat
ioed
refle
ctan
ce
Wavelength (µm)
Orthopyroxene powder
0.4 0.8 1.2 1.6 2.0 2.4
0.4
0.5
0.6
0.7
0.8
0.9
1.0
Wavelength (µm)
Rat
ioed
refle
ctan
ce
K = 1.1 ; CS = -0.29 µm
Olivine powder
after 7x10¹⁵ Ar+/cm2, 200 keV
0.8 1.2 1.6 2.0 2.40.6
0.7
0.8
0.9
1.0
Wavelength (µm)
Fit: K exp ( CS / λ )
After Ar++ 60 keV:b. 1.3x10¹⁵/cm2 ; C
S = -0.12 µm
c. 4.3x10¹⁵/cm2 ; CS = -0.24 µm
d. 1.7x10¹⁶/cm2 ; CS = -0.34 µm
RATIO PLOTS
Epinal meteorite
b
c
d
0.8 1.2 1.6 2.0 2.40.3
0.4
0.5
0.6
0.7
0.8
0.9
1.0
Rat
ioed
refle
ctan
ce
Jackson silicates
After H+ 200 keV:b. 1.5x10¹⁶/cm2 ; C
S = -0.13 µm
After Ar++ 400 keV:c. 0.8x10¹⁶/cm2 ; C
S = -0.47 µm
d. 4.2x10¹⁶/cm2 ; CS = -0.90 µm
Wavelength (µm)
b
c
d
0.8 1.2 1.6 2.0 2.40.6
0.7
0.8
0.9
1.0
Wavelength (µm)
after Ar+ 200 keV:b. 2.5x10¹⁴/cm2; C
S = -0.05 µm
c. 8.5x10¹⁴/cm2; CS = -0.09 µm
d. 3.5x10¹⁵/cm2; CS = -0.2 µm
Olivine powder
b
c
d
Figure 6.2: Ratio plots of the same spectra shown in Fig. 6.1; each irradiation step spectrum isdivided by the corresponding unirradiated spectrum. Dashed curves are the best fit curves obtainedby Eq. 6.1 and the resultant CS values are given. In each plot, vertical black lines represent theestimated error-bars.
The ratio plots show only marginally traces of bands I and II; we consequently
try to model this continuum by fitting with an exponential curve given by
Ratio = W (λ) = K exp(CS/λ) (6.1)
142 6. Peculiar objects
where λ is the wavelength, K is a scale factor that changes according to the normal-
ization of the spectra, and the parameter CS rules the strength of the exponential
curve, i.e., it is a measure of the effects of space weathering. The quantity W (λ) is
what we call ‘weathering function’; this function is not new (see below), but for the
first time it is used to fit a ratio between the spectra of irradiated and unirradiated
samples. We have also tried with other functions (logarithmic, rational, etc.), but
the best fit is obtained with the fitting function given by Eq. 6.1; furthermore, it
describes the same continuum that is used in the so-called MGM (modified Gaus-
sian model) of reflectance spectra. For instance, a detailed use of MGM analysis was
made by Hiroi and Sasaki (2001). They modeled the natural logarithm of reflectance
spectra R(ν) using the function:
ln R(ν) = C0 + C1ν +∑
i
Gi(ν) (6.2)
where ν is the wavenumber, Gi(ν) are the superimposed Gaussian distributions that
fit the reflectance bands, and C0 and C1 are two parameters for the background
function, i.e., the continuum. Space weathering acts only marginally on the band
center, strength, and width, as it has been proved by Hiroi and Sasaki (2001) for
laser irradiation and by Marchi et al. (2005) for ion irradiation. For this reason, the
logarithm of the ratio between irradiated and unirradiated spectra can be written
as:
ln[RIRR(ν)/RUNIRR(ν)] = (C0IRR − C0UNIRR) + (C1IRR − C1UNIRR)ν (6.3)
that leads to Eq. 6.1. The parameter CS = C1IRR − C1UNIRR is consequently a
measure of how much irradiated spectra redden with respect to their unaltered
spectra.
It is important to stress out that the ratio of the irradiated spectra with the
unirradiated ones does not perfectly eliminate bands I and II; this can affect the
fitting of the spectral region of both bands I and II. Furthermore, in the case of
Jackson silicates, ion irradiation seems to dehydrate the samples, but this marginally
affects the results of the fit.
6.1 Asteroid 832 Karin and its family 143
Ueda et al. (2002b) introduced a C2 term using Hapke’s space weathering model
(vapor deposition of reduced iron) into the MGM scheme. The C2 term includes
also a complex z function which depends on wavelength. At the present time I do
not include this C2 term because it would complicate the model and it still has to
be checked in the experimental data; it will be a subject for future studies.
Another important point is that natural logarithm of reflectance is not exactly
absorbance, although it is assumed in the MGM scheme. A reflectance spectrum
is a combination of volume scattering and surface scattering; as each mineral grain
becomes more opaque either by increasing grain size, more Fe content, or higher
degree of space weathering, the surface scattering effect becomes more significant.
Taking the ratio between spectra of different degree of space weathering divides two
values, each of which consists of a sum of volume and surface scattering effect. The
behavior of such quantity is more complicated than what described here in terms of
CS: space weathering changes both the surface reflectance and transmittance, thus
both surface and volume scattering components. Future works will try to focus on
the possibility to model the experimental spectra converting the reflectance into the
surface and volume component.
However, from Fig. 6.2 it is clear that the W (λ) function [Eq. 6.1] can fit quite
well the ratioed reflectance in all irradiated materials, either powder or bulk samples,
either meteorite or terrestrial sample, either olivine or orthopyroxene (the obtained
CS values are reported in Fig. 6.2). This implies that a weathered spectrum can be
obtained by multiplying the spectrum of the unaltered sample by a specific W (λ)
function with a precise corresponding CS value.
From this point of view, the CS parameter can be considered as a spectral slope;
it has to be remarked that, in accordance with the definition given in Eq. 6.1,
and unlike the spectral slope widely used up to now (see Gaffey et al. (1993), or
Marchi et al. (2005)), the CS parameter becomes more negative as the space weath-
ering effect increases (as it is shown in the right panels of Fig. 6.2), and, even if
not representing a real length (it is not connected with the depth of the weathered
layer), it is measured in µm.
In Fig. 6.3 I plot CS versus the number of displacements per unit area, for all
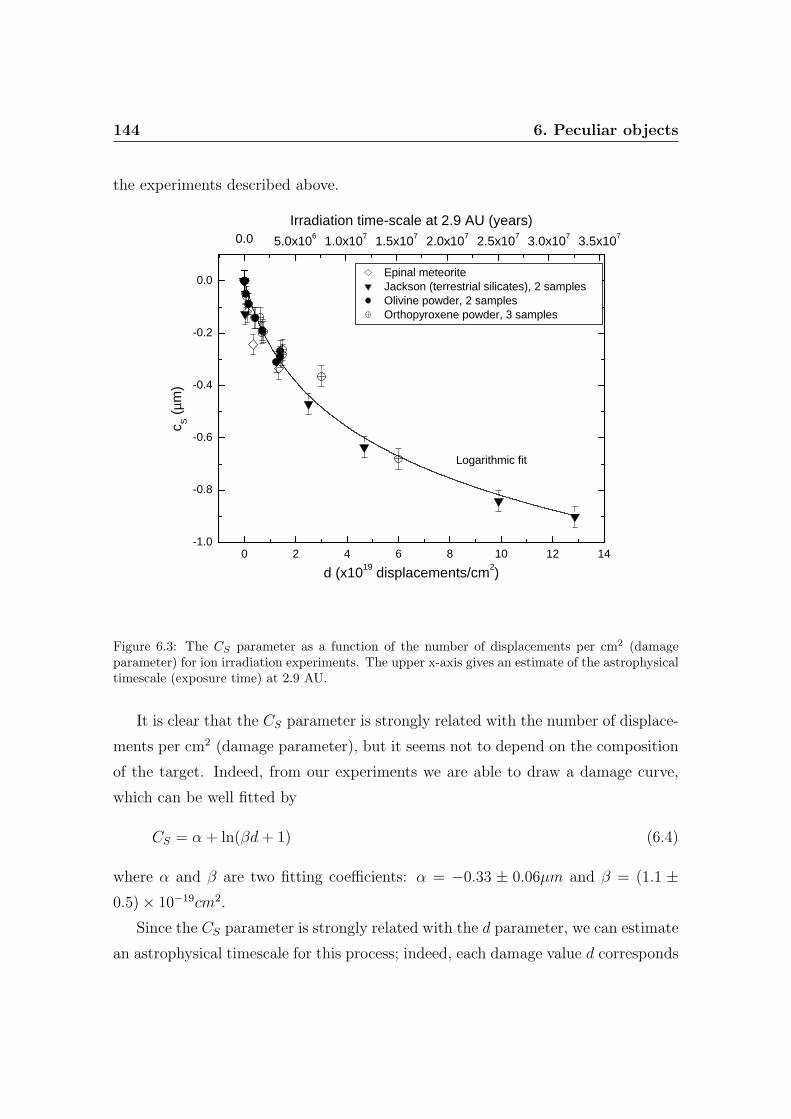
144 6. Peculiar objects
the experiments described above.
0 2 4 6 8 10 12 14-1.0
-0.8
-0.6
-0.4
-0.2
0.0
0.0 5.0x10⁶ 1.0x10⁷ 1.5x10⁷ 2.0x10⁷ 2.5x10⁷ 3.0x10⁷ 3.5x10⁷
Logarithmic fit
Irradiation time-scale at 2.9 AU (years)
c S (
µm)
d (x1019 displacements/cm2)
Epinal meteorite Jackson (terrestrial silicates), 2 samples Olivine powder, 2 samples Orthopyroxene powder, 3 samples
Figure 6.3: The CS parameter as a function of the number of displacements per cm2 (damageparameter) for ion irradiation experiments. The upper x-axis gives an estimate of the astrophysicaltimescale (exposure time) at 2.9 AU.
It is clear that the CS parameter is strongly related with the number of displace-
ments per cm2 (damage parameter), but it seems not to depend on the composition
of the target. Indeed, from our experiments we are able to draw a damage curve,
which can be well fitted by
CS = α + ln(βd + 1) (6.4)
where α and β are two fitting coefficients: α = −0.33 ± 0.06µm and β = (1.1 ±0.5)× 10−19cm2.
Since the CS parameter is strongly related with the d parameter, we can estimate
an astrophysical timescale for this process; indeed, each damage value d corresponds
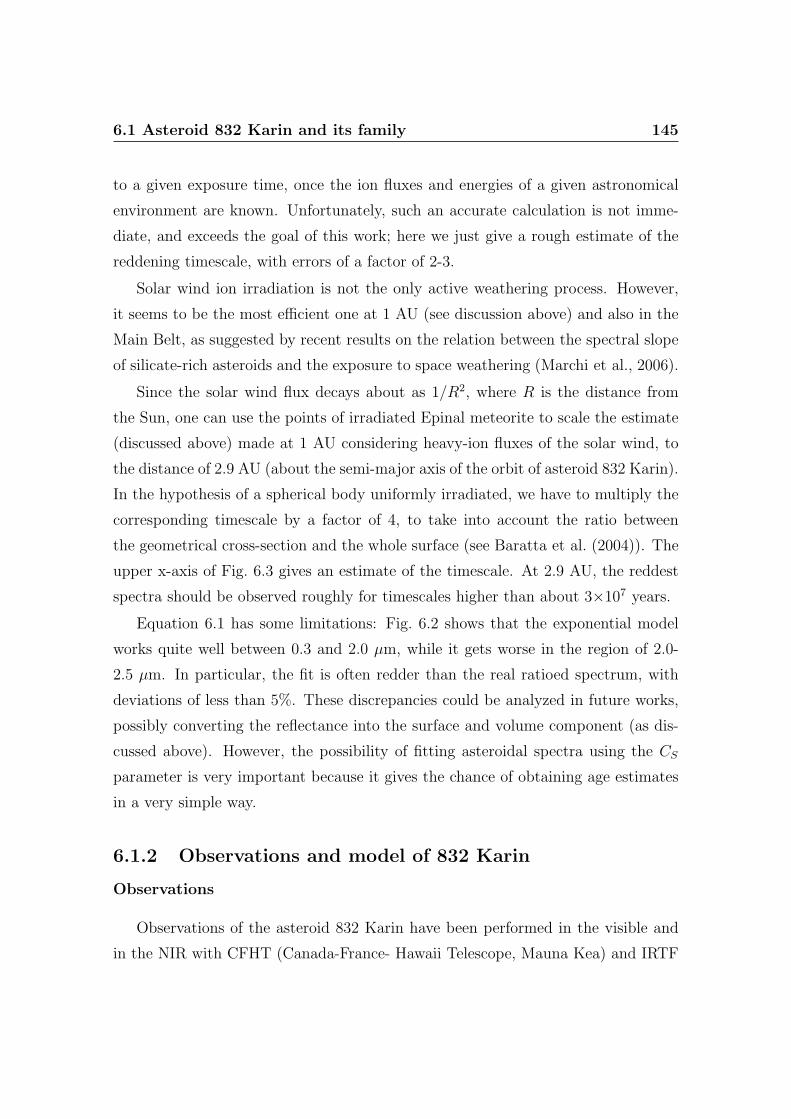
6.1 Asteroid 832 Karin and its family 145
to a given exposure time, once the ion fluxes and energies of a given astronomical
environment are known. Unfortunately, such an accurate calculation is not imme-
diate, and exceeds the goal of this work; here we just give a rough estimate of the
reddening timescale, with errors of a factor of 2-3.
Solar wind ion irradiation is not the only active weathering process. However,
it seems to be the most efficient one at 1 AU (see discussion above) and also in the
Main Belt, as suggested by recent results on the relation between the spectral slope
of silicate-rich asteroids and the exposure to space weathering (Marchi et al., 2006).
Since the solar wind flux decays about as 1/R2, where R is the distance from
the Sun, one can use the points of irradiated Epinal meteorite to scale the estimate
(discussed above) made at 1 AU considering heavy-ion fluxes of the solar wind, to
the distance of 2.9 AU (about the semi-major axis of the orbit of asteroid 832 Karin).
In the hypothesis of a spherical body uniformly irradiated, we have to multiply the
corresponding timescale by a factor of 4, to take into account the ratio between
the geometrical cross-section and the whole surface (see Baratta et al. (2004)). The
upper x-axis of Fig. 6.3 gives an estimate of the timescale. At 2.9 AU, the reddest
spectra should be observed roughly for timescales higher than about 3×10⁷ years.
Equation 6.1 has some limitations: Fig. 6.2 shows that the exponential model
works quite well between 0.3 and 2.0 µm, while it gets worse in the region of 2.0-
2.5 µm. In particular, the fit is often redder than the real ratioed spectrum, with
deviations of less than 5%. These discrepancies could be analyzed in future works,
possibly converting the reflectance into the surface and volume component (as dis-
cussed above). However, the possibility of fitting asteroidal spectra using the CS
parameter is very important because it gives the chance of obtaining age estimates
in a very simple way.
6.1.2 Observations and model of 832 Karin
Observations
Observations of the asteroid 832 Karin have been performed in the visible and
in the NIR with CFHT (Canada-France- Hawaii Telescope, Mauna Kea) and IRTF
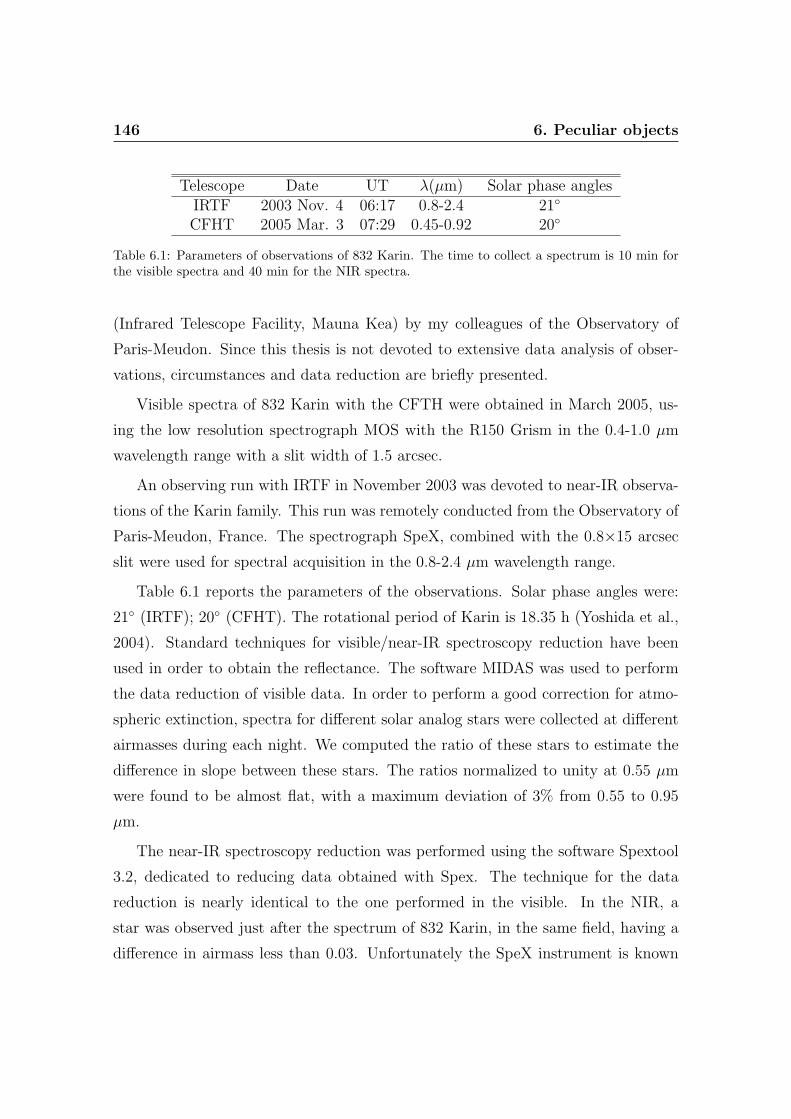
146 6. Peculiar objects
Telescope Date UT λ(µm) Solar phase anglesIRTF 2003 Nov. 4 06:17 0.8-2.4 21◦
CFHT 2005 Mar. 3 07:29 0.45-0.92 20◦
Table 6.1: Parameters of observations of 832 Karin. The time to collect a spectrum is 10 min forthe visible spectra and 40 min for the NIR spectra.
(Infrared Telescope Facility, Mauna Kea) by my colleagues of the Observatory of
Paris-Meudon. Since this thesis is not devoted to extensive data analysis of obser-
vations, circumstances and data reduction are briefly presented.
Visible spectra of 832 Karin with the CFTH were obtained in March 2005, us-
ing the low resolution spectrograph MOS with the R150 Grism in the 0.4-1.0 µm
wavelength range with a slit width of 1.5 arcsec.
An observing run with IRTF in November 2003 was devoted to near-IR observa-
tions of the Karin family. This run was remotely conducted from the Observatory of
Paris-Meudon, France. The spectrograph SpeX, combined with the 0.8×15 arcsec
slit were used for spectral acquisition in the 0.8-2.4 µm wavelength range.
Table 6.1 reports the parameters of the observations. Solar phase angles were:
21◦ (IRTF); 20◦ (CFHT). The rotational period of Karin is 18.35 h (Yoshida et al.,
2004). Standard techniques for visible/near-IR spectroscopy reduction have been
used in order to obtain the reflectance. The software MIDAS was used to perform
the data reduction of visible data. In order to perform a good correction for atmo-
spheric extinction, spectra for different solar analog stars were collected at different
airmasses during each night. We computed the ratio of these stars to estimate the
difference in slope between these stars. The ratios normalized to unity at 0.55 µm
were found to be almost flat, with a maximum deviation of 3% from 0.55 to 0.95
µm.
The near-IR spectroscopy reduction was performed using the software Spextool
3.2, dedicated to reducing data obtained with Spex. The technique for the data
reduction is nearly identical to the one performed in the visible. In the NIR, a
star was observed just after the spectrum of 832 Karin, in the same field, having a
difference in airmass less than 0.03. Unfortunately the SpeX instrument is known
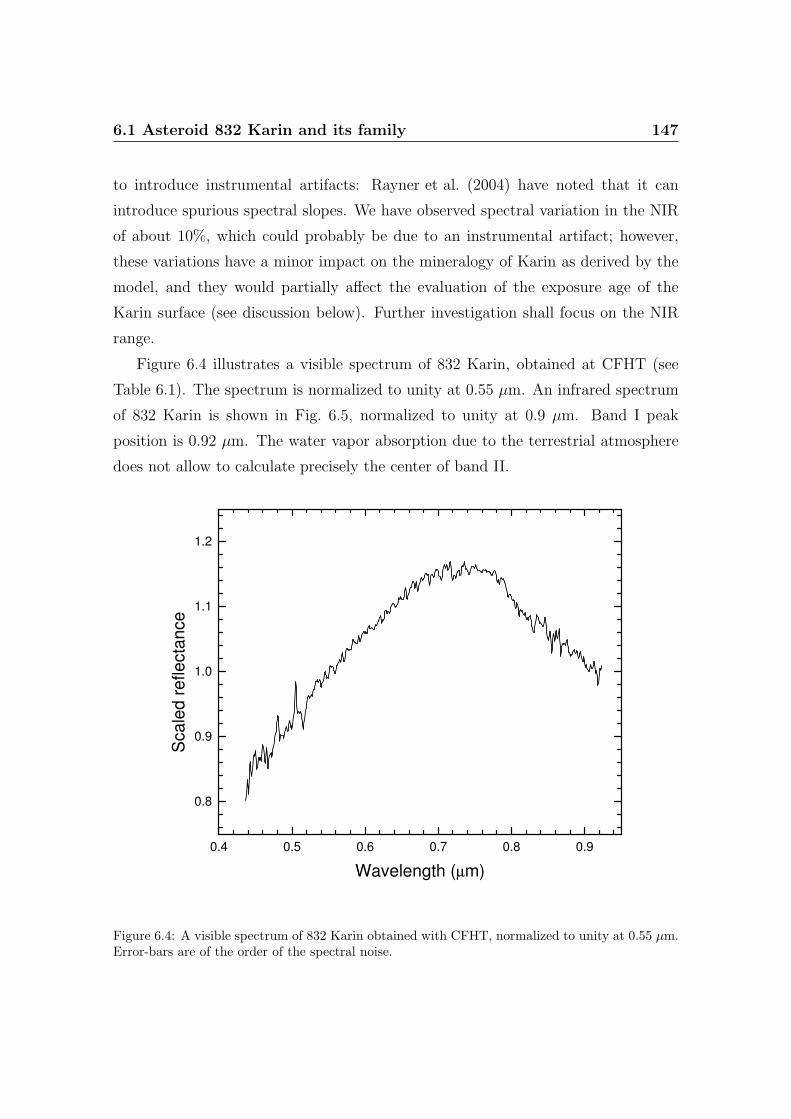
6.1 Asteroid 832 Karin and its family 147
to introduce instrumental artifacts: Rayner et al. (2004) have noted that it can
introduce spurious spectral slopes. We have observed spectral variation in the NIR
of about 10%, which could probably be due to an instrumental artifact; however,
these variations have a minor impact on the mineralogy of Karin as derived by the
model, and they would partially affect the evaluation of the exposure age of the
Karin surface (see discussion below). Further investigation shall focus on the NIR
range.
Figure 6.4 illustrates a visible spectrum of 832 Karin, obtained at CFHT (see
Table 6.1). The spectrum is normalized to unity at 0.55 µm. An infrared spectrum
of 832 Karin is shown in Fig. 6.5, normalized to unity at 0.9 µm. Band I peak
position is 0.92 µm. The water vapor absorption due to the terrestrial atmosphere
does not allow to calculate precisely the center of band II.
0.4 0.5 0.6 0.7 0.8 0.9
0.8
0.9
1.0
1.1
1.2
Wavelength (µm)
Sca
led
re
fle
cta
nce
Figure 6.4: A visible spectrum of 832 Karin obtained with CFHT, normalized to unity at 0.55 µm.Error-bars are of the order of the spectral noise.
148 6. Peculiar objects
1.0 1.5 2.0 2.5
0.8
1.0
1.2
1.4
1.6
Sca
led
re
fle
cta
nce
Wavelength (µm)
Figure 6.5: A NIR spectrum of Karin obtained with IRTF, normalized to unity at 0.9 µm. Error-bars are of the order of the spectral noise; however, spectral slope of 10% can be introduced in theNIR by instrumental artifacts of the Spex instrument.
Previous published data (Sasaki et al., 2004) showed spectral slope variations of
Karin; at the present time we are not able to either confirm or confute that result.
Further information will be obtained in the future by analyzing the Karin spectra
over its entire rotational phase.
Model: free parameters
The spectra of 832 Karin were modeled using the Shkuratov scattering model, in
order to constrain the possible surface composition of the asteroid (to compare with
those of ordinary chondrites) and its space weathering degree. The space weathering
was modeled with an exponential function following the experimental results (see
above).
6.1 Asteroid 832 Karin and its family 149
First, the model calculates the albedo of a particle of given size and composition
characterized by its optical constants n, k. From this albedo it is possible to derive
the reflectance of a single- or multi-component particulate surface.
The first step of the modeling was to choose reasonable endmember minerals. We
decided to start with the common endmember minerals found in ordinary chondrites,
namely olivine, ortho- and clinopyroxene, plagioclase feldspar, chromite, and iron
metal, applying an intimate mixture.
It cannot be assumed a priori that any particular S-type asteroid has an ordinary
chondrite composition. However, it is clear from the analysis of the absorption bands
that Karin and the ordinary chondrites have common minerals (i.e., olivine and
pyroxene) and they may be the major surface components. If there is another major
component on the Karin surface it should be almost featureless because otherwise
it would imply obvious signatures in the spectra. This is the reason why I refer to a
composition similar to that of ordinary chondrites; nevertheless, it is true also that
minor components affect the spectrum.
However, the goal is to investigate if the observed spectra of 832 Karin may be
interpreted in terms of weathered surfaces. For olivine and pyroxene, the optical
constants for different chemistries were considered, i.e., different Mg-number (from
Lucey (1998)).
As far as the other materials are concerned, we have exploited one of the strengths
of the Shkuratov model, i.e., its invertibility. The average behavior as a function of
wavelength of the imaginary part k can be estimated from reflectance data.
The calculation relies on an a priori knowledge of the grain size of the particles
in the sample as well as the real part of the refractive index (Shkuratov et al., 1999);
a value of n = 1.7 was assumed (reasonable for semi-transparent minerals).
This inverted model was used to calculate the optical constants for: plagioclase
(orthoclase) using the sample NMNH- 142137 Fe from USGS (Clark et al., 2003);
chromite (creac11) from RELAB (http://www.planetary.brown.edu/relab/). The
optical constants of iron measured by Johnson and Cristy (1974) were also used.
The free parameters of the model are the relative abundance of the components
(whose sum must be equal to 1), the mineral chemistries of the various components
150 6. Peculiar objects
(variation of the Mg-number), the effective (average) optical pathlength (propor-
tional to the grain size), and the CS parameter.
Indeed, the space weathering contribution is included by the following expression:
R(λ) = W (λ)A(λ) = K exp(CS/λ)A(λ) (6.5)
where R(λ) is the final spectral albedo, W (λ) is the weathering function introduced
in Eq. 6.1, and A(λ) is the albedo given by Shkuratov et al. (1999); Eq. 6.5 is assured
by the experimental results, that show that a weathered spectrum can be obtained
by multiplying the spectrum of the unaltered surface by a specific W (λ) function
with a precise corresponding CS value (see above).
Since I am studying a lunar-style weathering, the porosity is assumed to be
equal to 0.7 in the calculations; indeed, Shkuratov et al. (1999) used a value of 0.7
in order to model the reflectance spectra of the Moon. However, this parameter has
little influence on the results (Shkuratov et al., 1999). Finally, an IDL routine using
Levenberg-Marquardt algorithm was used to find the minimum root-mean-squared
(RMS) residual between the measured spectrum and the computed spectrum.
Results
The model was first applied to visible and NIR spectra separately, finding that
in the case of the vis spectrum the fit gives the same results as the NIR spectrum,
i.e., the same composition and the same degree of space weathering (CS value).
This allows to join the two spectra to form a composite spectrum of 832 Karin
(that I refer to as Karin weathered); the NIR spectrum has been scaled to the
visible spectrum using the overlap in the 0.8-0.95 µm wavelength range. Then this
composite spectrum (vis-NIR) of 832 Karin was modeled, verifying that the fit for
the composite spectrum gives the same results of its two components.
I illustrate in Fig. 6.6 the mixing model spectrum of Karin compared with the
measured spectra. A reasonable fit for Karin weathered was obtained in the 0.4-2.0
µm range.
Mixing ratios for each end-member are listed in Table 6.2; I do not find a specific
ordinary chondrite composition. Thus, a reasonable (but not unique) interpretation
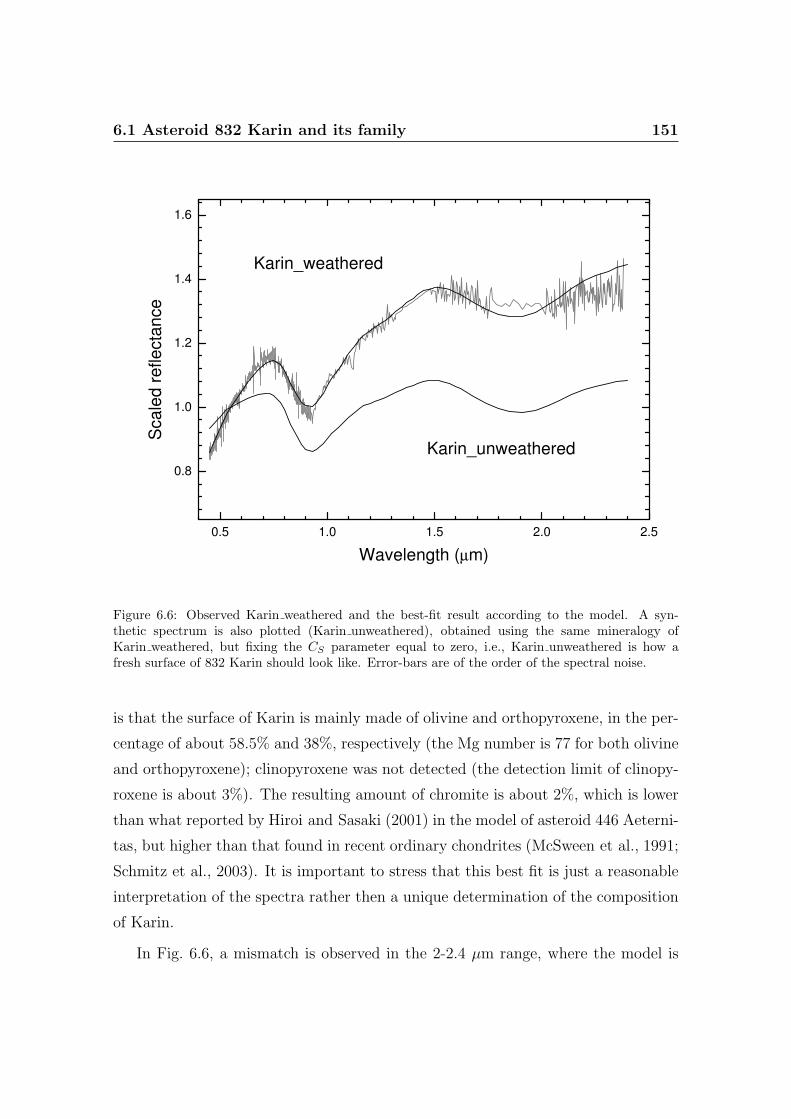
6.1 Asteroid 832 Karin and its family 151
0.5 1.0 1.5 2.0 2.5
0.8
1.0
1.2
1.4
1.6
Karin_unweathered
Karin_weathered
Sca
led
re
fle
cta
nce
Wavelength (µm)
Figure 6.6: Observed Karin weathered and the best-fit result according to the model. A syn-thetic spectrum is also plotted (Karin unweathered), obtained using the same mineralogy ofKarin weathered, but fixing the CS parameter equal to zero, i.e., Karin unweathered is how afresh surface of 832 Karin should look like. Error-bars are of the order of the spectral noise.
is that the surface of Karin is mainly made of olivine and orthopyroxene, in the per-
centage of about 58.5% and 38%, respectively (the Mg number is 77 for both olivine
and orthopyroxene); clinopyroxene was not detected (the detection limit of clinopy-
roxene is about 3%). The resulting amount of chromite is about 2%, which is lower
than what reported by Hiroi and Sasaki (2001) in the model of asteroid 446 Aeterni-
tas, but higher than that found in recent ordinary chondrites (McSween et al., 1991;
Schmitz et al., 2003). It is important to stress that this best fit is just a reasonable
interpretation of the spectra rather then a unique determination of the composition
of Karin.
In Fig. 6.6, a mismatch is observed in the 2-2.4 µm range, where the model is
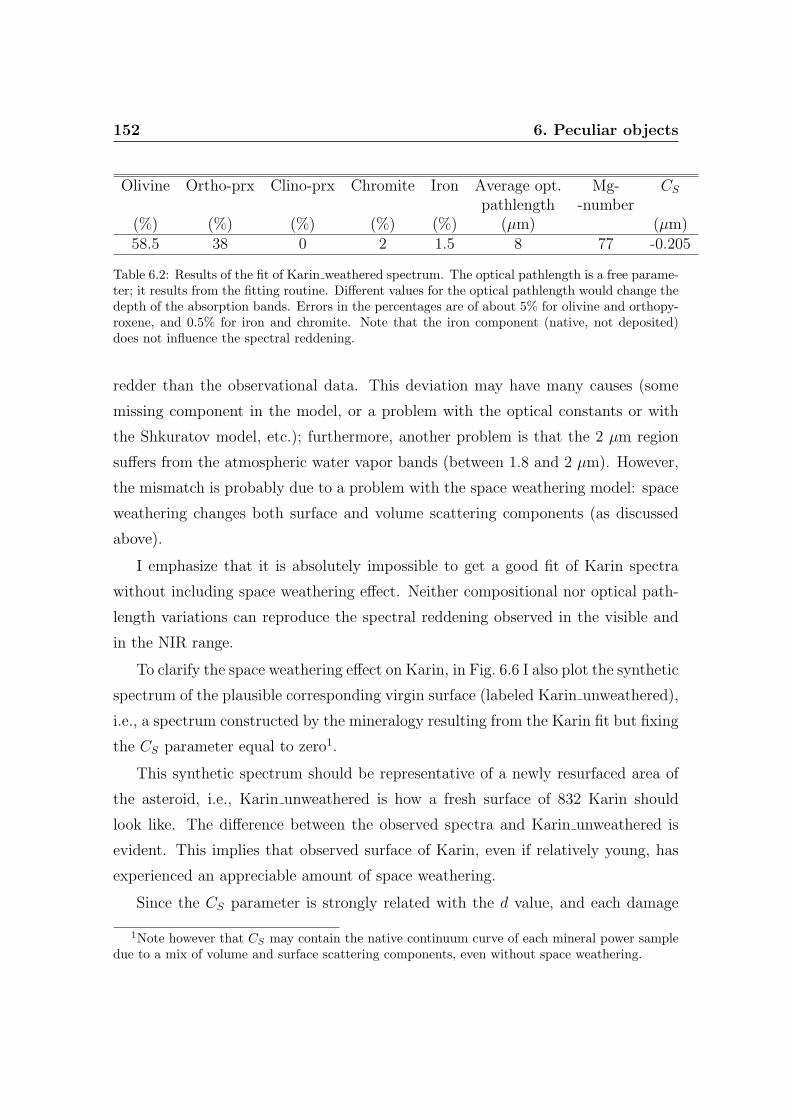
152 6. Peculiar objects
Olivine Ortho-prx Clino-prx Chromite Iron Average opt. Mg- CS
pathlength -number(%) (%) (%) (%) (%) (µm) (µm)58.5 38 0 2 1.5 8 77 -0.205
Table 6.2: Results of the fit of Karin weathered spectrum. The optical pathlength is a free parame-ter; it results from the fitting routine. Different values for the optical pathlength would change thedepth of the absorption bands. Errors in the percentages are of about 5% for olivine and orthopy-roxene, and 0.5% for iron and chromite. Note that the iron component (native, not deposited)does not influence the spectral reddening.
redder than the observational data. This deviation may have many causes (some
missing component in the model, or a problem with the optical constants or with
the Shkuratov model, etc.); furthermore, another problem is that the 2 µm region
suffers from the atmospheric water vapor bands (between 1.8 and 2 µm). However,
the mismatch is probably due to a problem with the space weathering model: space
weathering changes both surface and volume scattering components (as discussed
above).
I emphasize that it is absolutely impossible to get a good fit of Karin spectra
without including space weathering effect. Neither compositional nor optical path-
length variations can reproduce the spectral reddening observed in the visible and
in the NIR range.
To clarify the space weathering effect on Karin, in Fig. 6.6 I also plot the synthetic
spectrum of the plausible corresponding virgin surface (labeled Karin unweathered),
i.e., a spectrum constructed by the mineralogy resulting from the Karin fit but fixing
the CS parameter equal to zero1.
This synthetic spectrum should be representative of a newly resurfaced area of
the asteroid, i.e., Karin unweathered is how a fresh surface of 832 Karin should
look like. The difference between the observed spectra and Karin unweathered is
evident. This implies that observed surface of Karin, even if relatively young, has
experienced an appreciable amount of space weathering.
Since the CS parameter is strongly related with the d value, and each damage
1Note however that CS may contain the native continuum curve of each mineral power sampledue to a mix of volume and surface scattering components, even without space weathering.
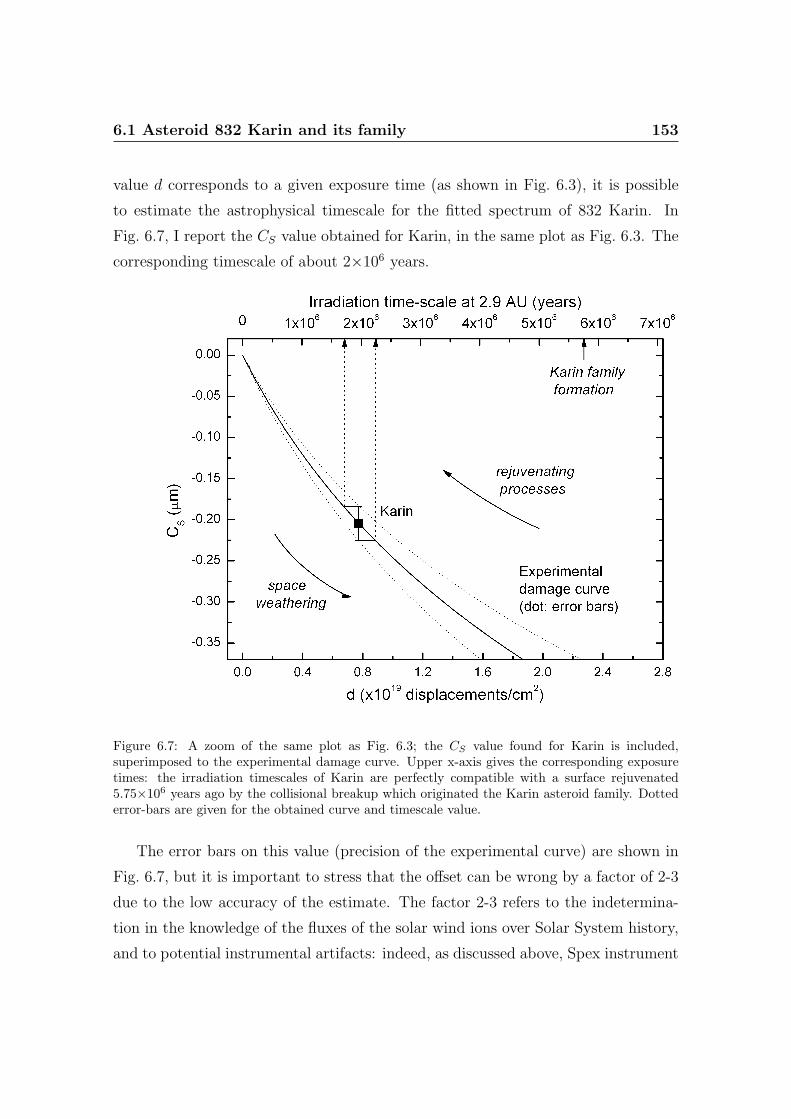
6.1 Asteroid 832 Karin and its family 153
value d corresponds to a given exposure time (as shown in Fig. 6.3), it is possible
to estimate the astrophysical timescale for the fitted spectrum of 832 Karin. In
Fig. 6.7, I report the CS value obtained for Karin, in the same plot as Fig. 6.3. The
corresponding timescale of about 2×10⁶ years.
Figure 6.7: A zoom of the same plot as Fig. 6.3; the CS value found for Karin is included,superimposed to the experimental damage curve. Upper x-axis gives the corresponding exposuretimes: the irradiation timescales of Karin are perfectly compatible with a surface rejuvenated5.75×106 years ago by the collisional breakup which originated the Karin asteroid family. Dottederror-bars are given for the obtained curve and timescale value.
The error bars on this value (precision of the experimental curve) are shown in
Fig. 6.7, but it is important to stress that the offset can be wrong by a factor of 2-3
due to the low accuracy of the estimate. The factor 2-3 refers to the indetermina-
tion in the knowledge of the fluxes of the solar wind ions over Solar System history,
and to potential instrumental artifacts: indeed, as discussed above, Spex instrument
154 6. Peculiar objects
may introduce spurious spectral slopes in the NIR; we have verified that these varia-
tions do not affect the mineralogy of Karin, but they may produce slightly different
timescales, for instance, in the order of 7×10⁵ years. In any case, the irradiation
timescale is shorter than the age of the impact, but quite close to it, which is about
5.75×10⁶ years; in particular the spectrum of Karin is compatible with a surface
rejuvenated 5.75×10⁶ years ago and which has consequently suffered an exposure
time to solar wind ions of the same order of magnitude.
6.1.3 Discussion
Results of this section suggest that a part of the surface of 832 Karin has experi-
enced a certain degree of space weathering, but only in the last 5.75×10⁶ years; this
would imply that the object has been at least partially rejuvenated by the impact
which originated the Karin family2.
It is mandatory to remind that, on one hand, the timescale estimate is not very
accurate, and, on the other hand, rejuvenating processes can be very relevant; actu-
ally, solar wind ions affect a very thin upper layer of the asteroid (< 1µm), so even
a small impact on the surface is able to remove the weathered layer. Hence a com-
petition between weathering and resurfacing is producing the observed reflectance
spectra.
As discussed above, Sasaki et al. (2004) observed different degrees of space weath-
ering on 832 Karin, and interpreted as the presence of a surface older than the
impact. Unfortunately, we do not have a study of Karin spectra over its entire rota-
tional phase, so it is impossible to put further constrains. However, since Karin is a
small body (about 18 km), it is not clear how it could have preserved a surface older
than the age of the Karin family. A number of processes support such argument.
Indeed, Nesvorny et al. (2002) discussed about the size of the parent body and
the impactor: they argued about 25 and 5 km, respectively. In this case 832 Karin is
2It must be stressed that the space weathering modeling is independent on the scattering model;similar results are also obtained by combining Eq. 6.1 with the scattering model of Hapke (1993),rather than that of Shkuratov et al. (1999). Indeed, in Eq. 6.5, the W (λ) function remains practi-cally the same, and it is combined with Eq. (37) of Hapke (1981). In fact, the obtained CS valuesare independent on the particular scattering theory used.
6.1 Asteroid 832 Karin and its family 155
47% of the mass of the parent body (or 43% volume). According to recent results of
Richardson et al. (2004), impact-induced seismic shaking can produce considerably
regolith movements. This should have been quite important for the impact that
formed the family and presumably affected the entire Karin surface.
Moreover, Nesvorny et al. (2002) state that it is likely that largest cluster mem-
bers (i.e., fragments like Karin) accumulated small fragments. If this is true, these
secondary impacts would have erased any trace of previous space weathering (keep
in mind that solar wind ions affect a very thin upper layer of the surface), both by
direct mixing of the regolith layer and through seismic shaking mentioned before
(which is also effective for small impactors; see Richardson et al. (2004)). In these
conditions, it seems hard that Karin could have retained an old surface. One would
expect that after the major collision that created the family, all the parent body
surface was reset. These speculations are supported by the timescales based on ion
irradiation experiments.
Note that, if it is true that all the Karin parent body was rejuvenated 5.75×10⁶
years ago, timescales derived from laser pulse irradiation (Sasaki et al., 2001; Brunetto et al.,
2006a) are too slow (about 108 years) to explain the observed space weathering of
Karin.
Conclusions
Spectra of asteroid 832 Karin have been obtained and analyzed in the range
0.45-0.95 and 0.8-2.4 µm. The observed vis-NIR spectra show spectral reddening
that can be explained by space weathering processes.
Starting from the results of ion irradiation experiments, a simple description of
space weathering given by Eq. 6.1 allows to reproduce the visible and NIR spectra
of 832 Karin.
I have obtained a value for the so-called CS parameter, related to a surface with
a certain degree of space weathering by formation of displacements. Referring to the
astrophysical timescale at 2.9 AU, this CS value of Karin corresponds to irradiation
timescales slightly younger than the age of the disruption which originated the Karin
family. This impact rejuvenated, at least partially, Karin’s surface 5.75×10⁶ years
156 6. Peculiar objects
ago, and the scenario is coherent with the model of a very efficient space weather-
ing process caused by solar wind ions, as simulated by ion irradiation experiments
described in this thesis.
Acknowledgments
We are grateful to G.A. Baratta and F. Spinella for their precious support during
the experiments and to M. Gaffey, T. Hiroi, and an anonymous referee, who have
helped us improving the paper with their accurate reviews and useful suggestions.
This research was supported by the Italian Ministero dell’Istruzione, Universita e
Ricerca (MIUR).
6.1.4 Appendix: the Karin family
Based on the paper: Vernazza, P., Birlan, M., Rossi, A., Dotto, E.,
Nesvorny, D., Brunetto, R., Fornasier, S., Fulchignoni, M., Renner, S.
2006. Physical characterization of the Karin family. Astronomy and
Astrophysics 460, 945-951.
Our team observed 24 Karin asteroid members in the visible and 6 members
in the near-IR. In the visible range, all the objects share the same characteristics:
a maximum around λ = 0.75µm, and a spectral slope spanning a continuous but
limited range; in the NIR, our spectra show a similar behaviour.
This indicates a similar composition and space weathering degree. None of the
objects can be considered as an interloper, based on the obtained spectra, confirming
the dynamical indication of a probable common origin from the fragmentation of a
parent-body. Results suggest global homogeneity of the parent body.
Comparing the spectral slope of the Karin members with the slope domain of
ordinary chondrites, the Karin members are found to be slightly redder than OCs.
We interpret this result as an indication of a low degree of spatial alteration for the
surfaces of these objects, which is in agreement with the young age of the Karin
family (5.8 Myr).
6.2 A particular case: asteroid 4 Vesta 157
This spectroscopic investigation has shown that in the case of a young family,
the dynamical indentification is very reliable.
6.2 A particular case: asteroid 4 Vesta
Based on the paper: Vernazza, P., Brunetto, R., Strazzulla, G.,
Fulchignoni, M., Rochette, P., Meyer-Vernet, N., Zouganelis, I. 2006.
Asteroid colors: a novel tool for magnetic field detection? The case of
Vesta. Astronomy and Astrophysics 451, L43-L46.
6.2.1 Vesta is not red
In the previous sections, I have widely discussed how space weathering processes
affect Solar System bodies that are not protected by an atmosphere or a magneto-
sphere, altering the optical properties of their soil. The continuous bombardment
by energetic cosmic rays, solar wind ions, and interplanetary dust particles (micro-
meteorites) are the sources of this weathering. Such alteration processes change the
spectral properties of silicate-rich objects, inducing progressive spectral darkening
and reddening.
They have been studied in order to find a link between the spectral prop-
erties of meteorites and the remote sensing data of asteroids. Indeed, as dis-
cussed above, space weathering can explain the spectral mismatch between ordi-
nary chondrites and the surface spectra of their presumed (S-type) asteroidal par-
ent bodies (Pieters et al., 2000; Adams and McCord, 1971; Strazzulla et al., 2005;
Marchi et al., 2005), while it also explain the spectral difference between lunar soils
and underlying rocks.
However, this spectral mismatch is not observed in the case of 4 Vesta (Chapman,
2004), one of the three largest main belt bodies (D = 529 ± 10 km) (Thomas et al.,
1997). Vesta is the only known differentiated asteroid with an intact internal struc-
ture, probably consisting of a metal core, a mantle, and a basaltic crust (McCord et al.,
1970).
158 6. Peculiar objects
Strong evidence suggests that the HED meteorites, a large set of differentiated
basalts (Eucrites), pyroxenites (Diogenites), and breccia mixtures of mainly these
two rock types (Howardites), are impact ejecta from Vesta. The link between HED
meteorites and Vesta was originally based on the good matches between the re-
flectance spectra and brightness of Vesta (albedo ∼ 0.35) and those of HED mete-
orites, indicating that Vesta’s surface is free of heavy space weathering (Chapman,
2004; McCord et al., 1970; Keil, 2002; Gaffey, 1983). On Vesta, the maturation
effect should be ∼ 100-1000 times lower than that of the Moon (Gaffey, 1983).
Recent ion irradiation experiments on pyroxenes (Marchi et al., 2005) have shown
significant reddening and darkening of the collected spectra with progressive irradia-
tion, as shown in the previous sections. Since pyroxene is a major surface component
of Vesta, as determined by spectroscopy, one could expect the solar wind irradiation
to significantly alter the optical properties of the surface of Vesta.
To investigate this question, it is interesting to perform irradiation experiments
on HED meteorites. Here I show preliminary results after irradiation of a eucrite
meteorite, Bereba, chosen because its reflectance spectrum is very similar to that of
Vesta. The ion irradiation experiments were performed using Ar++ ions with energy
of 400 keV.
Powdered (10-100 µm) samples of Bereba were placed in the vacuum chamber
describe above. Reflectance spectra (Fig. 6.8) were acquired using BaSO4 as the
reflectance standard.
The two bands in the spectra of Bereba around 0.9 and 2 µm are due to pyrox-
ene, while the small shoulder around 1.3 µm is due to the presence of plagioclase.
Irradiation of the sample produces a progressive reddening of the spectrum. The
spectral slope in the region of the first band (centered around 0.9 µm) increases
strongly, while the depth of both absorption bands becomes weaker. Irradiation of a
virgin sample of Bereba, whose spectrum and albedo are very close to those of Vesta,
yields a spectrum that is very similar to the Moon’s, in terms of spectral slope and
albedo (Fig. 6.8). The timescale for this process at 2.36 AU (average heliocentric
distance of Vesta) is about 105 years.
The lunar Maria basalts and the Vesta crust are very similar in mineralogical
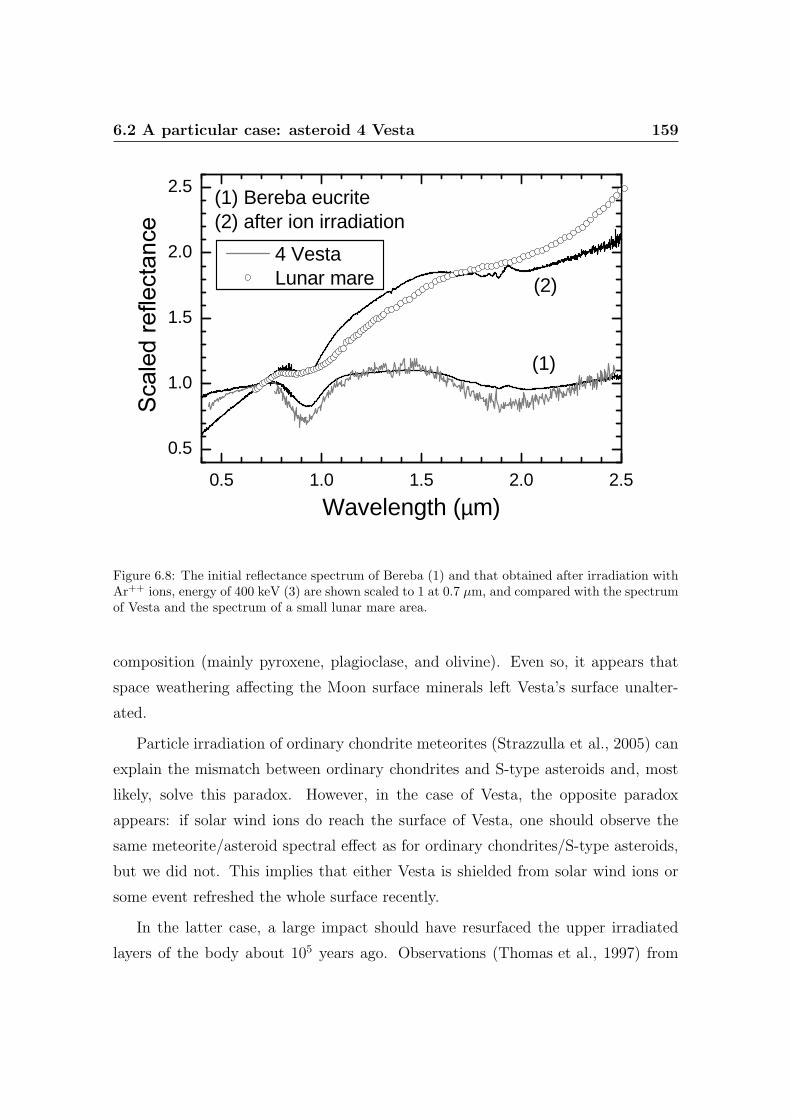
6.2 A particular case: asteroid 4 Vesta 159
0.5 1.0 1.5 2.0 2.5
0.5
1.0
1.5
2.0
2.5(1) Bereba eucrite(2) after ion irradiation
4 Vesta Lunar mare
Wavelength (µm)
(1)
(2)
Figure 6.8: The initial reflectance spectrum of Bereba (1) and that obtained after irradiation withAr++ ions, energy of 400 keV (3) are shown scaled to 1 at 0.7 µm, and compared with the spectrumof Vesta and the spectrum of a small lunar mare area.
composition (mainly pyroxene, plagioclase, and olivine). Even so, it appears that
space weathering affecting the Moon surface minerals left Vesta’s surface unalter-
ated.
Particle irradiation of ordinary chondrite meteorites (Strazzulla et al., 2005) can
explain the mismatch between ordinary chondrites and S-type asteroids and, most
likely, solve this paradox. However, in the case of Vesta, the opposite paradox
appears: if solar wind ions do reach the surface of Vesta, one should observe the
same meteorite/asteroid spectral effect as for ordinary chondrites/S-type asteroids,
but we did not. This implies that either Vesta is shielded from solar wind ions or
some event refreshed the whole surface recently.
In the latter case, a large impact should have resurfaced the upper irradiated
layers of the body about 105 years ago. Observations (Thomas et al., 1997) from
160 6. Peculiar objects
the Hubble Space Telescope indicate that Vesta has a 460 km basin on its surface,
which was the result of an impact from a ∼ 35 km projectile. Furthermore, it is
likely that Vesta experienced only one such impact over the Solar System history
(Bottke et al., 2005). Collisional modeling results suggest that this impact took
place about 1 Gyr ago and is responsible for the socalled Vestoids, a family of
D < 10 km asteroids on Vesta-like orbits whose spectral features strongly resemble
eucrites and howardites (Burbine et al., 2001; Marzari et al., 1996; Carruba et al.,
2005). Considering that the Vestoids are not the result of this impact, Bottke et al.
(2005) find a 19% probability that a major impact occurred on Vesta in the last 3.5
Gyr. Thus, a recent large impact (last 105 years) on Vesta seems unlikely.
6.2.2 A magnetic field?
There is a possibility that Vesta’s interior, or crust, is a good conductor or is suf-
ficiently magnetized, with a sufficiently coherent magnetization direction, so that it
will form a barrier to the solar wind (Greenstadt, 1971). A remanent magnetic field
is the most likely way of forming an obstacle to the solar wind flow resulting in its di-
version. The present data do not enable us to distinguish between a global magnetic
field producing a bona fide magnetosphere and a number of uniformly magnetized
blocks of crustal material uniformly magnetized producing several crustal “magne-
tospheres”. In the latter case, the solar wind particles would reach the surface via
a number of “cusps”.
To investigate this possibility, we estimated the fraction of Vesta’s observed
surface that must be unaltered, in order that Vesta’s spectrum and albedo remain
similar to those of HED meteorites. To make an order of magnitude estimate,
we assumed that, if the solar wind ions touch the surface, the spectra of those
unprotected regions would be similar to the most irradiated spectra of Bereba. By
a linear combination of the most irradiated spectra of Bereba and the virgin spectra
(geographical mixture), we found an upper limit of about 10% unprotected surface,
over which it would be obvious that space weathering is occurring on Vesta; this
limit is found when the slope of the linear combination is greater than the slope
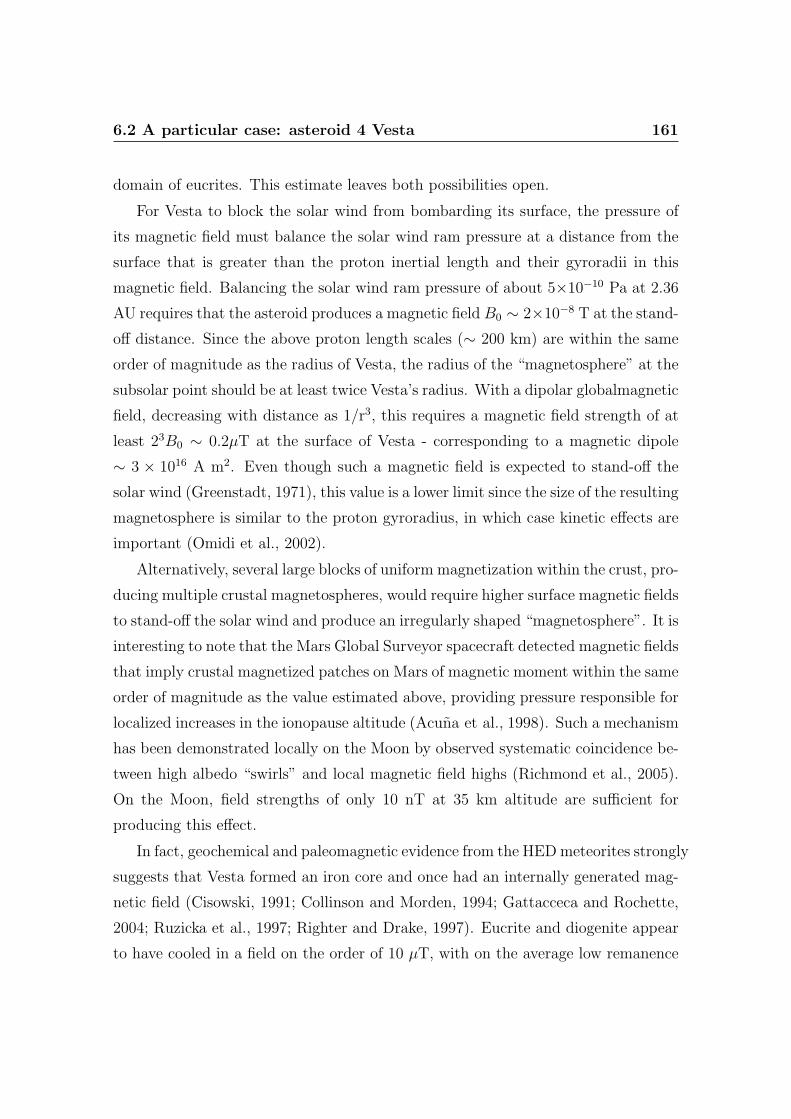
6.2 A particular case: asteroid 4 Vesta 161
domain of eucrites. This estimate leaves both possibilities open.
For Vesta to block the solar wind from bombarding its surface, the pressure of
its magnetic field must balance the solar wind ram pressure at a distance from the
surface that is greater than the proton inertial length and their gyroradii in this
magnetic field. Balancing the solar wind ram pressure of about 5×10⁻¹⁰ Pa at 2.36
AU requires that the asteroid produces a magnetic field B0 ∼ 2×10⁻⁸ T at the stand-
off distance. Since the above proton length scales (∼ 200 km) are within the same
order of magnitude as the radius of Vesta, the radius of the “magnetosphere” at the
subsolar point should be at least twice Vesta’s radius. With a dipolar globalmagnetic
field, decreasing with distance as 1/r3, this requires a magnetic field strength of at
least 23B0 ∼ 0.2µT at the surface of Vesta - corresponding to a magnetic dipole
∼ 3 × 10¹⁶ A m2. Even though such a magnetic field is expected to stand-off the
solar wind (Greenstadt, 1971), this value is a lower limit since the size of the resulting
magnetosphere is similar to the proton gyroradius, in which case kinetic effects are
important (Omidi et al., 2002).
Alternatively, several large blocks of uniform magnetization within the crust, pro-
ducing multiple crustal magnetospheres, would require higher surface magnetic fields
to stand-off the solar wind and produce an irregularly shaped “magnetosphere”. It is
interesting to note that the Mars Global Surveyor spacecraft detected magnetic fields
that imply crustal magnetized patches on Mars of magnetic moment within the same
order of magnitude as the value estimated above, providing pressure responsible for
localized increases in the ionopause altitude (Acuna et al., 1998). Such a mechanism
has been demonstrated locally on the Moon by observed systematic coincidence be-
tween high albedo “swirls” and local magnetic field highs (Richmond et al., 2005).
On the Moon, field strengths of only 10 nT at 35 km altitude are sufficient for
producing this effect.
In fact, geochemical and paleomagnetic evidence from the HED meteorites strongly
suggests that Vesta formed an iron core and once had an internally generated mag-
netic field (Cisowski, 1991; Collinson and Morden, 1994; Gattacceca and Rochette,
2004; Ruzicka et al., 1997; Righter and Drake, 1997). Eucrite and diogenite appear
to have cooled in a field on the order of 10 µT, with on the average low remanence
162 6. Peculiar objects
intensities on the order of 10 mA/m, due to low metal content. However, deeper
rocks may have enhanced magnetization, as may regolith rocks with a higher metal
content, which is demonstrated in howardite (Rochette et al., 2004). To generate a
global field from a crust or mantle magnetized within a dynamo, one needs a non
uniform crustal thickness (Aharonson et al., 2004). This type of coverage is exactly
the situation of Vesta, lacking its crust over a large portion, corresponding to the
large crater excavated at the present South pole (Thomas et al., 1997; Drake, 2001).
If the present rotation pole was the magnetic pole during remanence acquisition,
this would generate a significant global remanent dipolar field.
In the case of the Moon - which has no global magnetic field or atmosphere -
the average surface is exposed directly to the solar wind (except in the “swirls”),
which plays an important role in the reddening and darkening of the lunar spectrum,
in addition to micro-meteorite bombardment. Again, this suggests that Vesta may
support a magnetic field that protects its surface from the solar wind.
In conclusion, our preliminary results suggest the presence of a magnetic field
shielding a large portion of Vesta’s surface from solar wind ions, with a required
strength at the surface of ∼ 0.2 µT. However, further experiments on a larger set of
HED meteorites are needed to confirm this preliminary experiment, and a compar-
ison with spectra of Vestoids is planned to be performed in future studies.
Acknowledgments
We thank the Museum National d’Histoire Naturelle for providing us with the
meteoritic samples. We are grateful to G. A. Baratta, D. Fulvio, and F. Spinella for
their precious support during the experiments. We thank the referee J. Emery for
his pertinent and constructive remarks.
Chapter 7
Optical constants
Based on the paper: Brunetto, R., Roush, T.L., Marra, A.C., Orofino,
V. 2007. Optical characterization of laser ablated silicates. Icarus,
submitted.
As I showed in the previous sections, silicates are a major component in the
Solar System. Consequently, obtaining optical constants (real and imaginary part
of the refraction index) in the laboratory has a main relevance to interpret spec-
tral observations and remote sensing data of planetary, asteroid, TNOs’ surfaces,
and comets. Indeed, optical constants are the most important input parameters in
surface scattering models such as the Hapke model (Hapke, 1993) or the Shkuratov
model (Shkuratov et al., 1999). In this chapter I will estimate optical constants for
ablated silicates, and will apply them to spectra of two interesting objects.
7.1 Optical characterization of ablated silicates
From the considerations previously exposed in this thesis about space weathering,
it is clear that a detailed description of the optical properties of weathered silicates
is urgent. The knowledge of optical constants for irradiated and ablated silicates
helps modeling the surface spectra of an increasing number of objects.
Unfortunately, the estimation of the optical constants is not a simple task; dif-
ferent methods may produce different results, and several assumptions are usually
164 7. Optical constants
required. In the case of altered or treated samples, the situation is even more
complex, since the resulting material usually retains part of the starting material
characteristics, and thus it cannot be easily qualified as a specific and self-consistent
species.
In the previous sections, I showed how to characterize spectra of ion irradiated
samples when referred to the spectrum of the pristine material, by means of an
exponential continuum related to the ion-induced damage. In this approach, the
experimental curve is integrated into a classical Hapke or Shkuratov approach, to
model the reflectance spectra of silicate-rich asteroids and to derive mineralogy and
exposure time. Though providing useful information, this method is only appli-
cable in the case of a surface where silicates are spatially segregated from other
components. Thus, in the case of modeling intimate mixtures, optical constants are
required.
The goal of this section is to provide useful tools to model space weathering effects
on surfaces of asteroids and TNOs, performing an optical characterization of UV
laser ablated silicates (olivine, pyroxene). In fact, successful optical characterization
of weathered silicates has already been performed by other authors, in particular
making use of the nanophase metallic iron model (Hapke, 2001); see e.g. Hiroi et al.
(2006) for an application of this model to asteroid 25143 Itokawa. So, before I
proceed, it is useful to review those results and address why it is important to
perform optical characterization of my samples.
7.1.1 Nanophase metallic iron in laser ablation experiments
There is a wide consensus in the literature that spectral reddening and darkening
due to space weathering is connected with the formation of metallic iron particles
smaller than the wavelength, in vapor-deposited coatings on soil particle surfaces
and inside agglutinates (Hapke, 2001). This is supported by the observation of the
direct link between abundance of surface deposits of nanophase iron and systematic
variations of optical properties of lunar soils (Pieters et al., 2000), and by several
experimental results showing the formation of iron nanoparticles (see e.g. the re-
7.1 Optical characterization of ablated silicates 165
sults of laser irradiation in a simulation of lunar-like space weathering, discussed by
Sasaki et al. (2001)).
The physical interpretation relies on the fact that a vapor is generated by both
solar wind sputtering and micrometeorite impact, and injected preferentially down-
ward into the porous regolith; the iron should be reduced by selective loss of oxygen
during vapor deposition (Hapke, 2001).
In the second part of this thesis I have suggested that this strong and coher-
ent scheme for space weathering needs to be enlarged, since new experiments us-
ing heavy ion irradiation (Brunetto and Strazzulla, 2005) and UV laser ablation
(Brunetto et al., 2006a) have been performed, giving interesting results. In particu-
lar, I irradiated silicate samples with an UV excimer laser, below and above ablation
threshold. I confirmed and extended the results for spectral alteration discussed by
Sasaki et al. (2001); in particular it appeared that the most efficient experimental
conditions to darken and redden the reflectance spectra are obtained performing
congruent (stoichiometric) laser ablation, i.e. using an UV laser with fluence higher
than ablation threshold.
In the case of UV laser a strong absorption of laser light is guaranteed by the
very short wavelength. In this case it is possible to limit thermal effects onto the
target and consequently a regime of stoichiometric ablation occurs. On the contrary,
with IR laser sources (as the one used in previous laser ablation experiments) it is
necessary to take into account the heat loading of the target, and the consequent
damage occurring in the surrounding material (Brunetto et al., 2006a).
Comparing the spectral slopes after irradiation in ablating and non-ablating
conditions, it was found that below ablation threshold the slope increases linearly
with the dose, while in ablating conditions a saturated and very red slope is reached
after a very low dose. Experiments with IR lasers (e.g. Yamada et al. (1999)) lay in
between. This leads to serious concerns about which experimental regime is more
suitable to this purpose.
The formation of metallic iron can be observed by different techniques. Sasaki et al.
(2001) detected nanophase metallic iron on the Yamada et al. (1999) samples using
transmission electron microscopy (TEM). Bentley et al. (2005), used a laser setup
166 7. Optical constants
similar to Yamada et al. (1999) to produce weathered olivine and performed several
magnetic analyses. In particular, they observed an increase in magnetic susceptibil-
ity with laser exposure, for all irradiated samples.
Consequently, my team started to investigate variations in the magnetic suscep-
tibility on my UV laser ablated samples. Preliminary measurements on laser ablated
orthopyroxene show an increase in susceptibility with laser dose, similarly to what
measured by Bentley et al. (2005). We observe an increase in magnetic susceptibil-
ity of more than a factor of 3, from 7.1×10⁻⁸ to 2.5×10⁻⁷ m3/kg. This trend is in
agreement with what was reported by Bentley (2005), and the relative increase in
the magnitude is even stronger. Thus, even if a detailed microscopic surface analysis
of my samples is not yet available, preliminary magnetic measurements suggest that
formation of metallic iron has a major role.
Still, several open questions are arising. For instance, to explain the different
experimental results between Yamada et al. (1999) and Brunetto et al. (2006a), one
could wonder if the reddening effect on laser ablated silicates is only partially con-
nected with the metallic iron production, and partially connected with some mor-
phological and structural modification (e.g. formation of amorphous grains); also, it
is possible that at least part of the metallic iron is formed inside the grains, rather
than redeposited.
To try to answer those open points, I attempt to perform optical characteri-
zation to be compared with previous results, in particular with the Hapke’s space
weathering model.
7.1.2 Characterization of the samples
To characterize weathered silicates, I use reflectance spectra (UV-Vis-NIR range)
acquired in the Astrophysics Laboratory in Lecce, Italy. The samples (San Carlos
olivine, Bamble orthopyroxene, and clinopyroxene) were powdered. The grain size
distribution of the powder was not characterized and sieves were not used to separate
a specific size range, because the powder was pressed into a cohesive pellet to be
placed in the vacuum chambers. Based upon visual inspection of the powder, it
7.1 Optical characterization of ablated silicates 167
included a wide range of dimensions with an upper limit of about 0.5 mm. How this
initial distribution relates to the final grain sizes in the pressed pellet is uncertain
as the pressing process could potentially fracture grains.
In the same laboratory, nanopulsed UV excimer laser (193 and 248 nm) ablation
of silicates was performed in high vacuum conditions, as a simulation of micromete-
orite bombardments. The experimental details and conditions are described in the
previous sections. The reflectance spectra in the 0.3-2.5 µm range were studied as
a function of the dose.
For the purpose of this work, the reflectance geometry plays a very important
role; in these measurements, spectra are usually acquired using hemispherical geom-
etry, by means of an integrating sphere. In the codes used to model the spectra, a
bi-directional geometry is required. Thus, in the case of hemispherical geometry, I
decided to apply a recent result by Shkuratov and Grynko (2005), that provides a
way to estimate reflectance at 30◦, R(30◦), using the integral (hemispherical) albedo
(Aint) and vice versa, through the equation:
logR(30◦) = 1.088logAint (7.1)
Shkuratov and Grynko (2005) showed that Eq. 7.1 is valid for particulate me-
dia consisting of very irregular particles, and this seems to be quite close to our
case. Note that the proportion of this correction is much smaller than the spectral
variations after laser ablation (see below).
In these measurements, spectra of the altered area can sometimes refer to a
position on the surface slightly different from the spectrum before treatment (shifts
of hundreds of microns); since the samples have inhomogeneous grain sizes, this may
lead to slightly different band areas and depths. This was noted by Brunetto et al.
(2006b) in ion irradiation experiments, where spectral ratios after irradiation to
before irradiation showed non-perfect compensation of the absorption bands.
In the case of laser ablation, the total dose (energy per unit area) is a critical
damage parameter. Consequently, in this chapter I use the same damage parameters
as before to describe variations in the optical constants.
168 7. Optical constants
The Hapke radiative transfer model
Hapke and Wells (1981) and Clark and Roush (1984) describe an approach to
determination of the absorption coefficient, α, of a given material starting from
its measured reflectance spectra. Since α is related to k via the dispersion relation,
α = 4πk/λ , this approach, that relies upon Hapke’s description of radiative transfer
within particulate surfaces (see Hapke (1981, 1986, 1993), and references therein),
provides a useful mechanism of determining k.
Roush et al. (1990) and Lucey (1998) used the Hapke approach for determina-
tion of k for serpentine and olivines and pyroxenes, respectively. A brief summary is
provided here and the interested reader is referred to Roush et al. (1990) and Lucey
(1998) for more details. Beginning with the reflectance spectrum, n is assumed con-
stant; then, an iterative change of k forces the calculated and measured reflectance
to agree with one another. Additional leverage is provided in determining k if several
grain sizes of the same material are used, with the assumption that the composition
is not a function of grain size. Roush (2003, 2005) describes an additional itera-
tive approach that allows determination of n as a function of wavelength using a
subtractive Kramers-Kronig analysis.
The various assumptions contained within the Hapke-formalism (Hapke (1993),
and references therein), used here are discussed in equations 1-6 of Roush (1994)
and equations 1-4 of Cruikshank et al. (1997). Here scattering is assumed isotropic,
h, the width of the opposition surge, is assumed to be 0.05, and Hapke’s internal
scattering parameter, s, is set at 10−17. The first two of these parameters require
observations at multiple viewing geometries that were not obtained. The third
parameter is poorly characterized for natural materials and essentially setting it
to zero effectively forces the absorption coefficient to account for all the spectral
behavior.
Literature data: estimation of the grain size
The first step of the analysis was to compare the laboratory spectra obtained
for pristine materials with literature data on analogue silicates, in particular to use
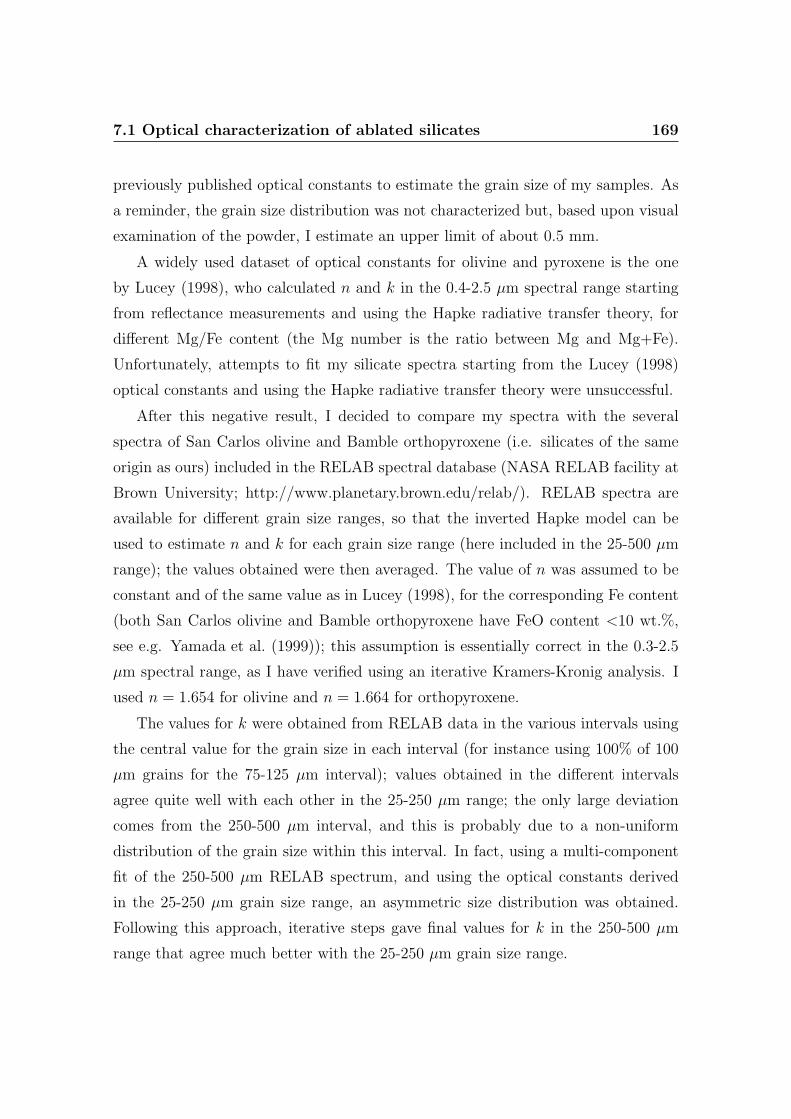
7.1 Optical characterization of ablated silicates 169
previously published optical constants to estimate the grain size of my samples. As
a reminder, the grain size distribution was not characterized but, based upon visual
examination of the powder, I estimate an upper limit of about 0.5 mm.
A widely used dataset of optical constants for olivine and pyroxene is the one
by Lucey (1998), who calculated n and k in the 0.4-2.5 µm spectral range starting
from reflectance measurements and using the Hapke radiative transfer theory, for
different Mg/Fe content (the Mg number is the ratio between Mg and Mg+Fe).
Unfortunately, attempts to fit my silicate spectra starting from the Lucey (1998)
optical constants and using the Hapke radiative transfer theory were unsuccessful.
After this negative result, I decided to compare my spectra with the several
spectra of San Carlos olivine and Bamble orthopyroxene (i.e. silicates of the same
origin as ours) included in the RELAB spectral database (NASA RELAB facility at
Brown University; http://www.planetary.brown.edu/relab/). RELAB spectra are
available for different grain size ranges, so that the inverted Hapke model can be
used to estimate n and k for each grain size range (here included in the 25-500 µm
range); the values obtained were then averaged. The value of n was assumed to be
constant and of the same value as in Lucey (1998), for the corresponding Fe content
(both San Carlos olivine and Bamble orthopyroxene have FeO content <10 wt.%,
see e.g. Yamada et al. (1999)); this assumption is essentially correct in the 0.3-2.5
µm spectral range, as I have verified using an iterative Kramers-Kronig analysis. I
used n = 1.654 for olivine and n = 1.664 for orthopyroxene.
The values for k were obtained from RELAB data in the various intervals using
the central value for the grain size in each interval (for instance using 100% of 100
µm grains for the 75-125 µm interval); values obtained in the different intervals
agree quite well with each other in the 25-250 µm range; the only large deviation
comes from the 250-500 µm interval, and this is probably due to a non-uniform
distribution of the grain size within this interval. In fact, using a multi-component
fit of the 250-500 µm RELAB spectrum, and using the optical constants derived
in the 25-250 µm grain size range, an asymmetric size distribution was obtained.
Following this approach, iterative steps gave final values for k in the 250-500 µm
range that agree much better with the 25-250 µm grain size range.
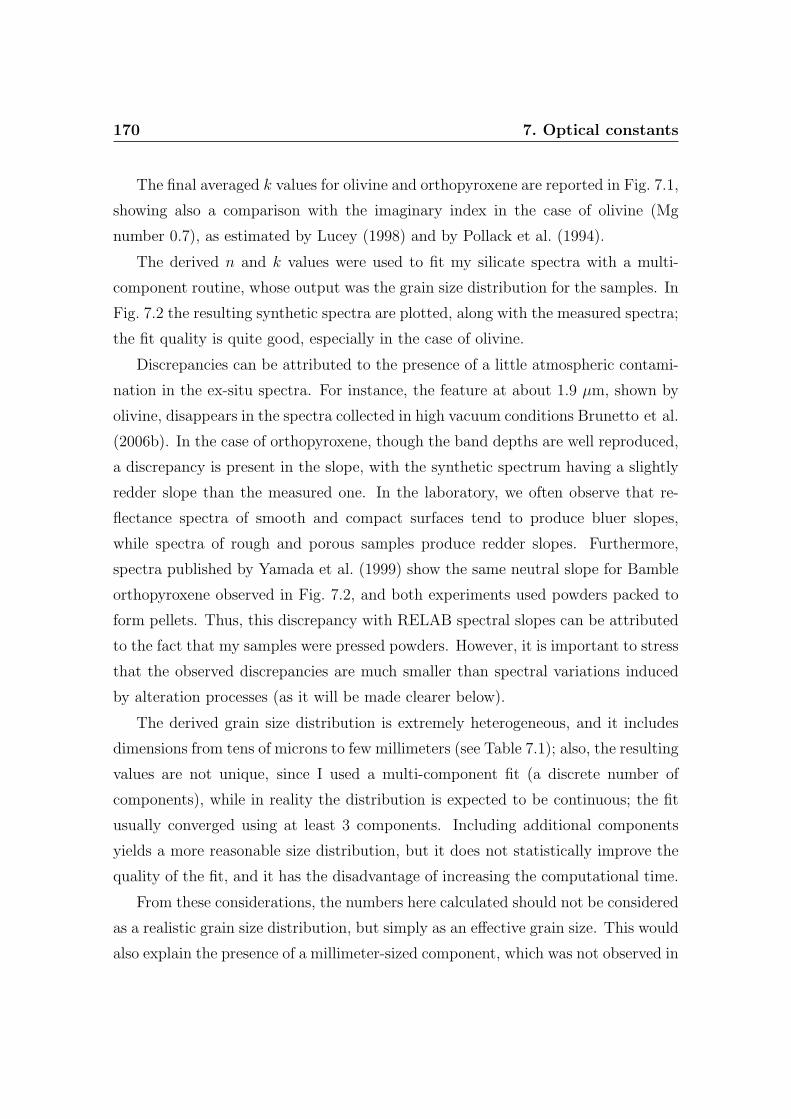
170 7. Optical constants
The final averaged k values for olivine and orthopyroxene are reported in Fig. 7.1,
showing also a comparison with the imaginary index in the case of olivine (Mg
number 0.7), as estimated by Lucey (1998) and by Pollack et al. (1994).
The derived n and k values were used to fit my silicate spectra with a multi-
component routine, whose output was the grain size distribution for the samples. In
Fig. 7.2 the resulting synthetic spectra are plotted, along with the measured spectra;
the fit quality is quite good, especially in the case of olivine.
Discrepancies can be attributed to the presence of a little atmospheric contami-
nation in the ex-situ spectra. For instance, the feature at about 1.9 µm, shown by
olivine, disappears in the spectra collected in high vacuum conditions Brunetto et al.
(2006b). In the case of orthopyroxene, though the band depths are well reproduced,
a discrepancy is present in the slope, with the synthetic spectrum having a slightly
redder slope than the measured one. In the laboratory, we often observe that re-
flectance spectra of smooth and compact surfaces tend to produce bluer slopes,
while spectra of rough and porous samples produce redder slopes. Furthermore,
spectra published by Yamada et al. (1999) show the same neutral slope for Bamble
orthopyroxene observed in Fig. 7.2, and both experiments used powders packed to
form pellets. Thus, this discrepancy with RELAB spectral slopes can be attributed
to the fact that my samples were pressed powders. However, it is important to stress
that the observed discrepancies are much smaller than spectral variations induced
by alteration processes (as it will be made clearer below).
The derived grain size distribution is extremely heterogeneous, and it includes
dimensions from tens of microns to few millimeters (see Table 7.1); also, the resulting
values are not unique, since I used a multi-component fit (a discrete number of
components), while in reality the distribution is expected to be continuous; the fit
usually converged using at least 3 components. Including additional components
yields a more reasonable size distribution, but it does not statistically improve the
quality of the fit, and it has the disadvantage of increasing the computational time.
From these considerations, the numbers here calculated should not be considered
as a realistic grain size distribution, but simply as an effective grain size. This would
also explain the presence of a millimeter-sized component, which was not observed in
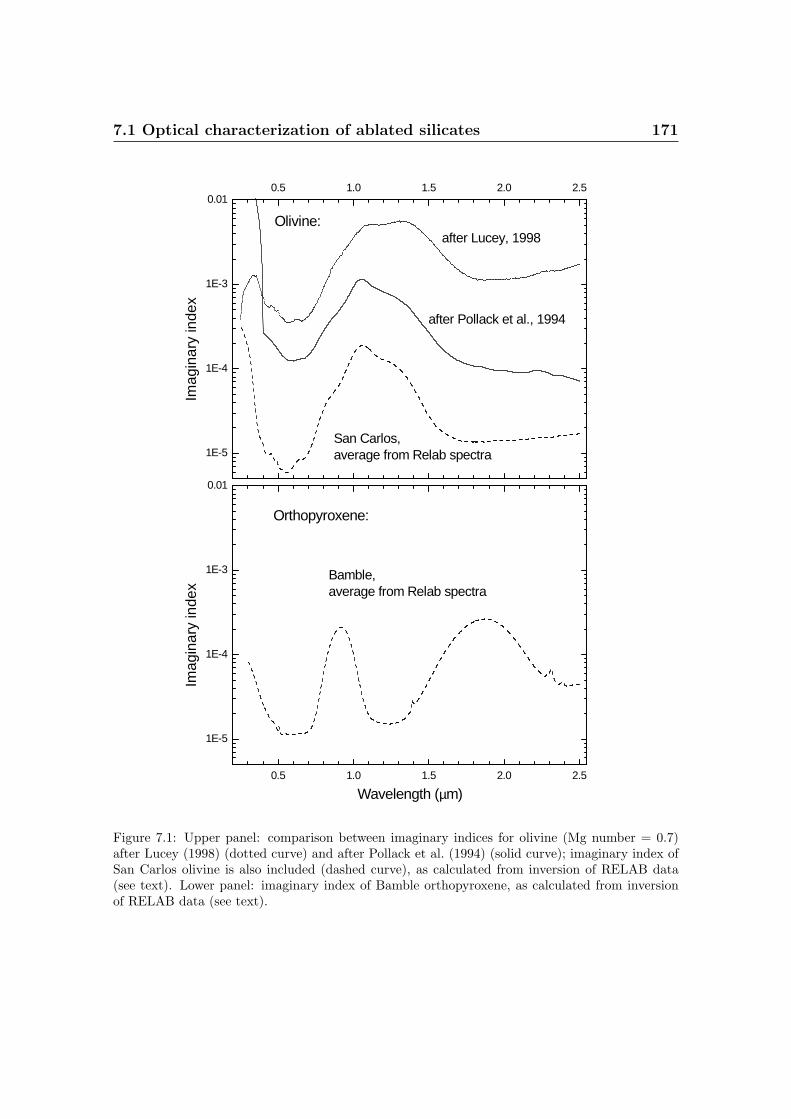
7.1 Optical characterization of ablated silicates 171
0.5 1.0 1.5 2.0 2.5
1E-5
1E-4
1E-3
0.01
after Lucey, 1998
Imag
inar
y in
dex
San Carlos, average from Relab spectra
after Pollack et al., 1994
Olivine:
0.5 1.0 1.5 2.0 2.5
1E-5
1E-4
1E-3
0.01
Imag
inar
y in
dex
Wavelength (µm)
Bamble,average from Relab spectra
Orthopyroxene:
Figure 7.1: Upper panel: comparison between imaginary indices for olivine (Mg number = 0.7)after Lucey (1998) (dotted curve) and after Pollack et al. (1994) (solid curve); imaginary index ofSan Carlos olivine is also included (dashed curve), as calculated from inversion of RELAB data(see text). Lower panel: imaginary index of Bamble orthopyroxene, as calculated from inversionof RELAB data (see text).
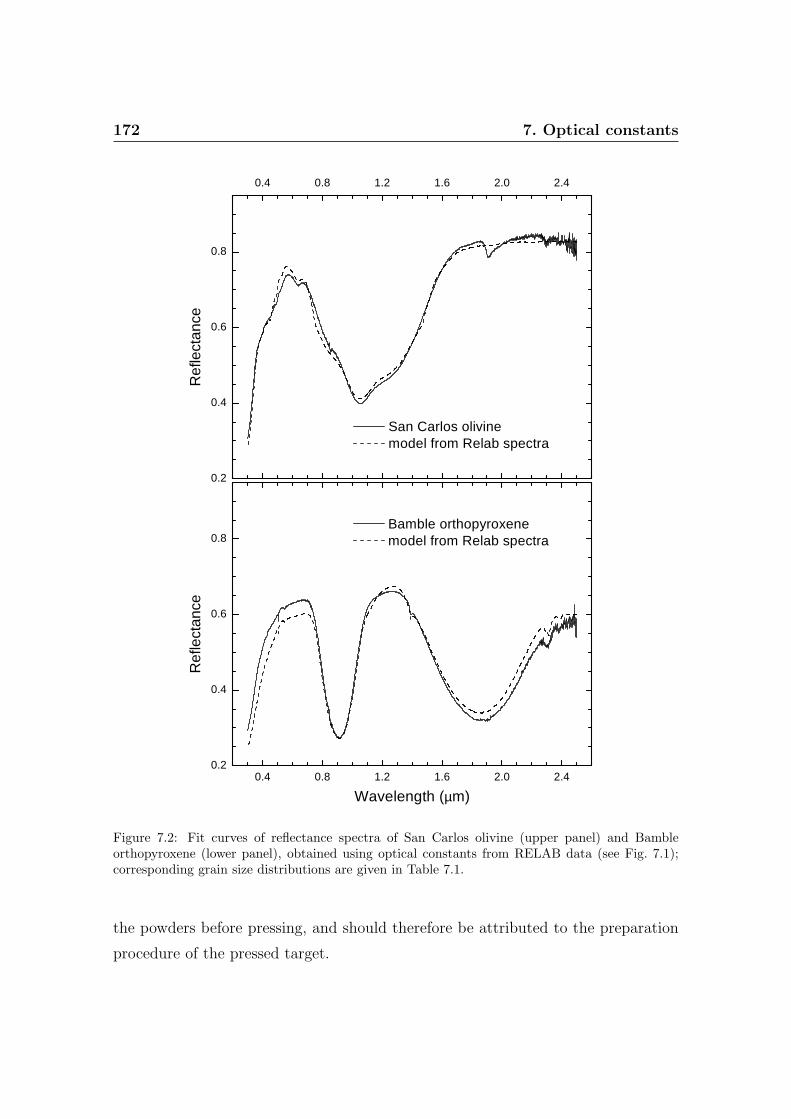
172 7. Optical constants
0.4 0.8 1.2 1.6 2.0 2.40.2
0.4
0.6
0.8
Ref
lect
ance
Wavelength (µm)
Bamble orthopyroxene model from Relab spectra
0.4 0.8 1.2 1.6 2.0 2.4
0.2
0.4
0.6
0.8
Ref
lect
ance
San Carlos olivine model from Relab spectra
Figure 7.2: Fit curves of reflectance spectra of San Carlos olivine (upper panel) and Bambleorthopyroxene (lower panel), obtained using optical constants from RELAB data (see Fig. 7.1);corresponding grain size distributions are given in Table 7.1.
the powders before pressing, and should therefore be attributed to the preparation
procedure of the pressed target.
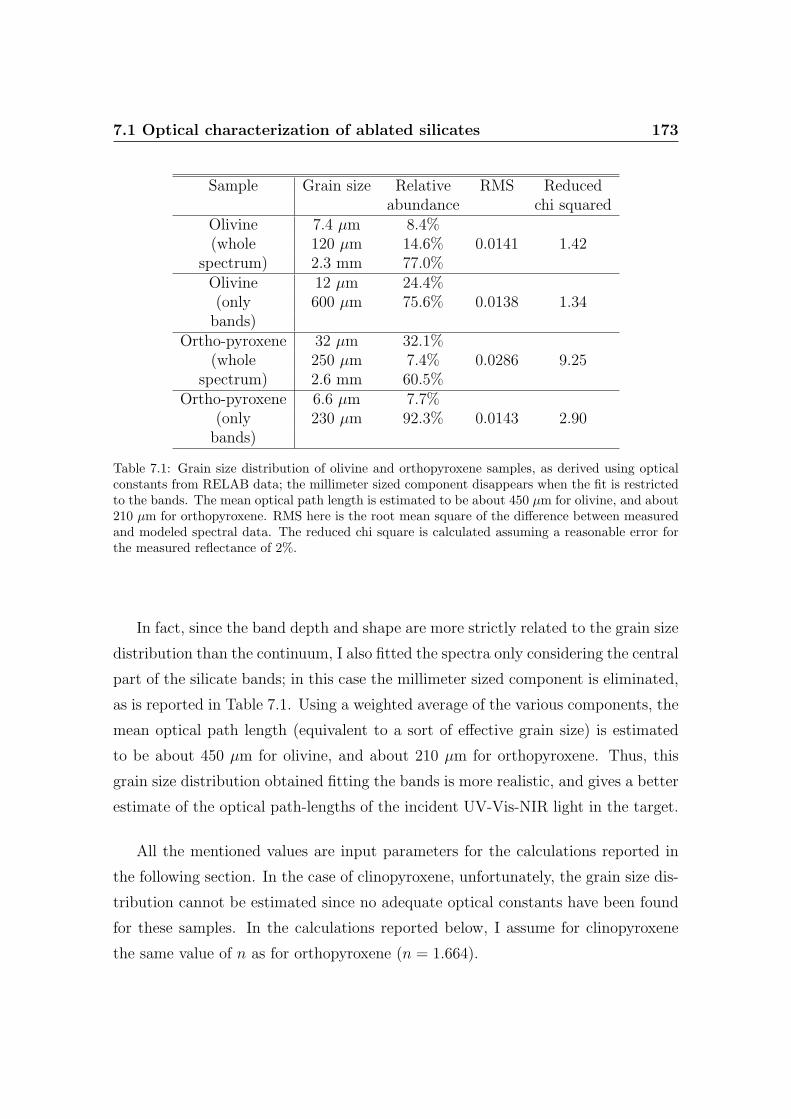
7.1 Optical characterization of ablated silicates 173
Sample Grain size Relative RMS Reducedabundance chi squared
Olivine 7.4 µm 8.4%(whole 120 µm 14.6% 0.0141 1.42
spectrum) 2.3 mm 77.0%Olivine 12 µm 24.4%(only 600 µm 75.6% 0.0138 1.34
bands)Ortho-pyroxene 32 µm 32.1%
(whole 250 µm 7.4% 0.0286 9.25spectrum) 2.6 mm 60.5%
Ortho-pyroxene 6.6 µm 7.7%(only 230 µm 92.3% 0.0143 2.90
bands)
Table 7.1: Grain size distribution of olivine and orthopyroxene samples, as derived using opticalconstants from RELAB data; the millimeter sized component disappears when the fit is restrictedto the bands. The mean optical path length is estimated to be about 450 µm for olivine, and about210 µm for orthopyroxene. RMS here is the root mean square of the difference between measuredand modeled spectral data. The reduced chi square is calculated assuming a reasonable error forthe measured reflectance of 2%.
In fact, since the band depth and shape are more strictly related to the grain size
distribution than the continuum, I also fitted the spectra only considering the central
part of the silicate bands; in this case the millimeter sized component is eliminated,
as is reported in Table 7.1. Using a weighted average of the various components, the
mean optical path length (equivalent to a sort of effective grain size) is estimated
to be about 450 µm for olivine, and about 210 µm for orthopyroxene. Thus, this
grain size distribution obtained fitting the bands is more realistic, and gives a better
estimate of the optical path-lengths of the incident UV-Vis-NIR light in the target.
All the mentioned values are input parameters for the calculations reported in
the following section. In the case of clinopyroxene, unfortunately, the grain size dis-
tribution cannot be estimated since no adequate optical constants have been found
for these samples. In the calculations reported below, I assume for clinopyroxene
the same value of n as for orthopyroxene (n = 1.664).
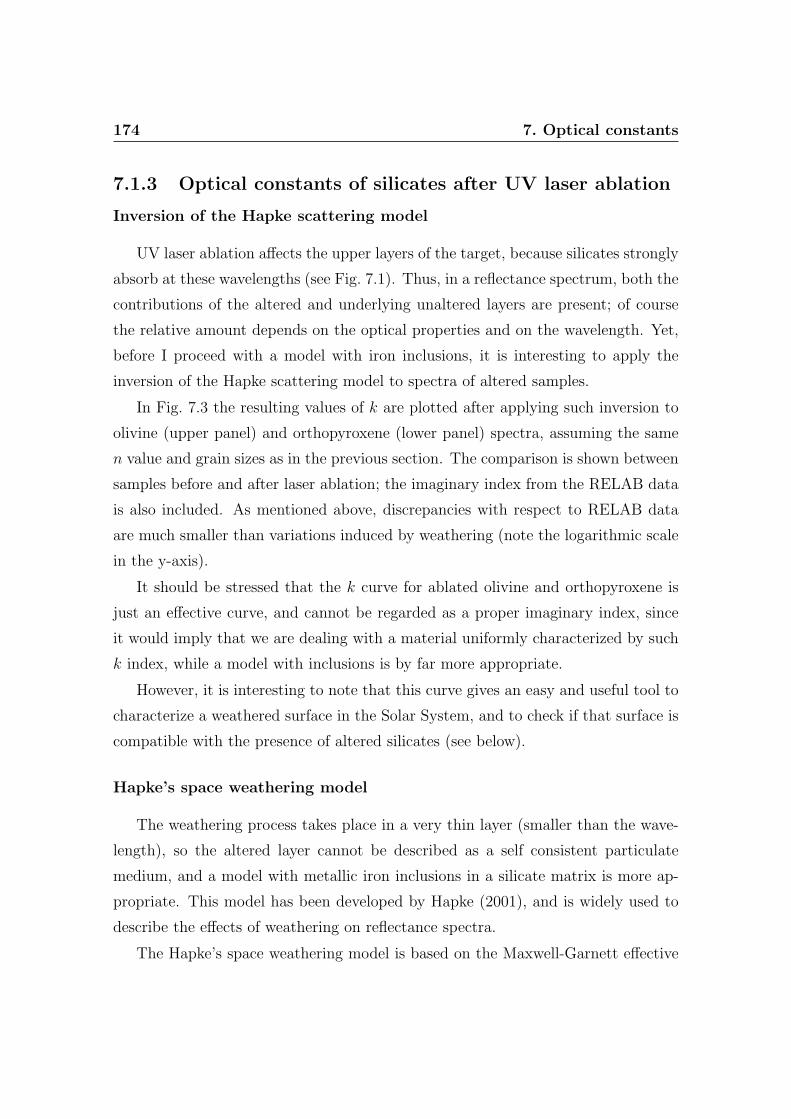
174 7. Optical constants
7.1.3 Optical constants of silicates after UV laser ablation
Inversion of the Hapke scattering model
UV laser ablation affects the upper layers of the target, because silicates strongly
absorb at these wavelengths (see Fig. 7.1). Thus, in a reflectance spectrum, both the
contributions of the altered and underlying unaltered layers are present; of course
the relative amount depends on the optical properties and on the wavelength. Yet,
before I proceed with a model with iron inclusions, it is interesting to apply the
inversion of the Hapke scattering model to spectra of altered samples.
In Fig. 7.3 the resulting values of k are plotted after applying such inversion to
olivine (upper panel) and orthopyroxene (lower panel) spectra, assuming the same
n value and grain sizes as in the previous section. The comparison is shown between
samples before and after laser ablation; the imaginary index from the RELAB data
is also included. As mentioned above, discrepancies with respect to RELAB data
are much smaller than variations induced by weathering (note the logarithmic scale
in the y-axis).
It should be stressed that the k curve for ablated olivine and orthopyroxene is
just an effective curve, and cannot be regarded as a proper imaginary index, since
it would imply that we are dealing with a material uniformly characterized by such
k index, while a model with inclusions is by far more appropriate.
However, it is interesting to note that this curve gives an easy and useful tool to
characterize a weathered surface in the Solar System, and to check if that surface is
compatible with the presence of altered silicates (see below).
Hapke’s space weathering model
The weathering process takes place in a very thin layer (smaller than the wave-
length), so the altered layer cannot be described as a self consistent particulate
medium, and a model with metallic iron inclusions in a silicate matrix is more ap-
propriate. This model has been developed by Hapke (2001), and is widely used to
describe the effects of weathering on reflectance spectra.
The Hapke’s space weathering model is based on the Maxwell-Garnett effective
7.1 Optical characterization of ablated silicates 175
0.4 0.8 1.2 1.6 2.0 2.4
1E-5
1E-4
1E-3
Imag
inar
y in
dex
Wavelength (µm)
(1) from our spectra before ablation(2) from our spectra after ablation
from Relab spectra
(1)
(2)
0.4 0.8 1.2 1.6 2.0 2.4
1E-5
1E-4
1E-3
Imag
inar
y in
dex
(1) from our spectra before ablation(2) from our spectra after ablation
from Relab spectra
(2)
(1)
Figure 7.3: Imaginary index k of San Carlos olivine (upper panel) and Bamble orthopyroxene(lower panel) samples, before and after UV laser ablation, inverting the Hapke scattering modeland using the grain size distribution of Table 1. Imaginary indices from RELAB data are alsoshown.
medium theory, to calculate the absorption coefficient of a silicate host medium con-
taining inclusions of small metallic iron spheres. The resulting absorption coefficient
176 7. Optical constants
α(λ) of a material containing metallic iron particles is:
α(λ) = αh(λ) + 36πφz(λ)/λ (7.2)
where αh(λ) is the absorption coefficient of the host silicate matrix, λ is the wave-
length; φ is the volume fraction of metallic iron particles in the host matrix, and
it is a function of the concentration of inclusions and relative densities of inclusion
and host materials. The function z(λ) is given by:
z(λ) =n3
hnFekFe
(n2Fe − k2
Fe + 2n2h)
2 + (2nFekFe)2(7.3)
where nh is the real part of the refractive index of the host material, nFe and kFe are
the real and imaginary parts of the refractive index of iron. In the space weathering
literature, the optical constants of iron by Johnson and Cristy (1974) are commonly
used in Eq. 7.3.
In the literature, a common assumption applying Hapke’s space weathering
model (see e.g. Hiroi et al. (2006), for asteroid 25143 Itokawa) is to assume that
the absorbance spectrum of silicates can be approximated by the negative natural
logarithm of their reflectance spectrum R(λ):
lnR(λ) ≈ −{αh(λ) + 36πφz(λ)/λ}de (7.4)
where de is the above discussed mean optical path length. In the case φ = 0 (no
iron inclusions), Eq. 7.4 gives an estimate of αh(λ) once we measure the reflectance
spectrum and we have an estimate for the effective grain size. This is exactly the
case of my samples before laser treatment (see discussion above). Consequently,
Eq. 7.4 becomes:
Rweath(λ) ≈ Runweath(λ)exp{−36πφz(λ)de/λ} (7.5)
This implies that the ratio between spectra of weathered to unweathered samples
is described by an exponential curve. The use of Eq. 7.5 is reasonable in the present
case because the Fe-bearing coatings are expected to be present only on the upper
sides of the powder grains seen by the spectrometer. Eq. 7.4 and Eq. 7.5 are easy
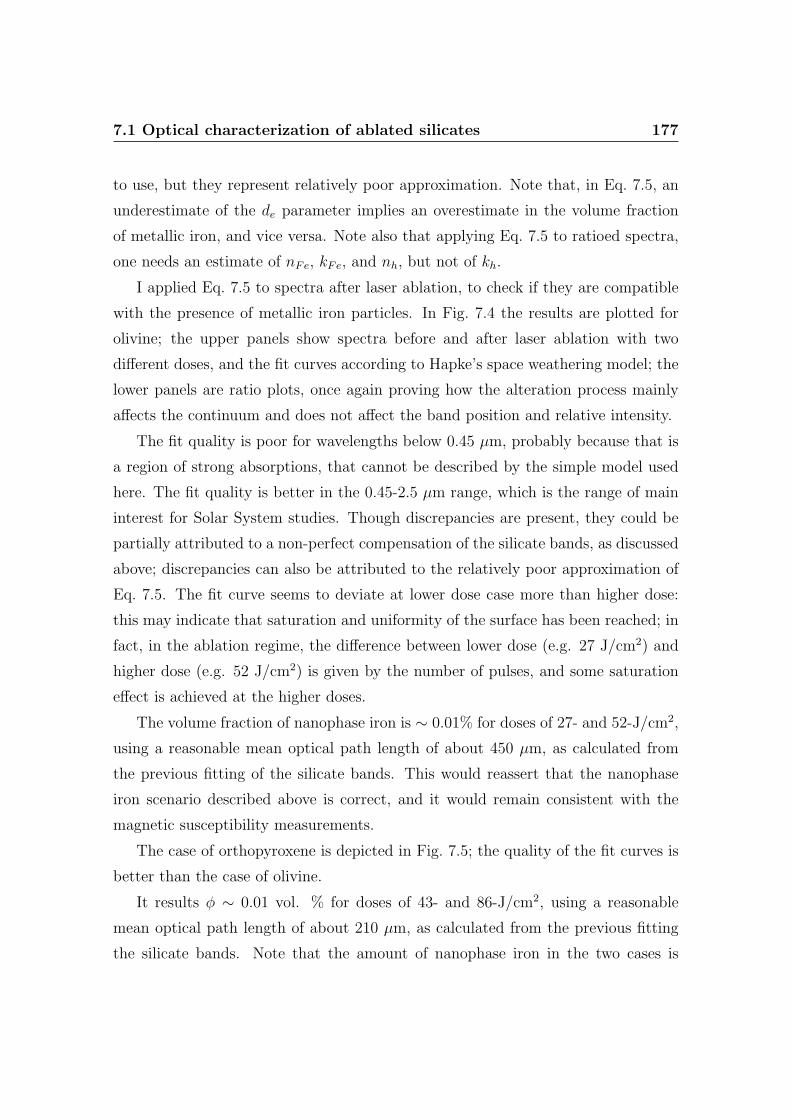
7.1 Optical characterization of ablated silicates 177
to use, but they represent relatively poor approximation. Note that, in Eq. 7.5, an
underestimate of the de parameter implies an overestimate in the volume fraction
of metallic iron, and vice versa. Note also that applying Eq. 7.5 to ratioed spectra,
one needs an estimate of nFe, kFe, and nh, but not of kh.
I applied Eq. 7.5 to spectra after laser ablation, to check if they are compatible
with the presence of metallic iron particles. In Fig. 7.4 the results are plotted for
olivine; the upper panels show spectra before and after laser ablation with two
different doses, and the fit curves according to Hapke’s space weathering model; the
lower panels are ratio plots, once again proving how the alteration process mainly
affects the continuum and does not affect the band position and relative intensity.
The fit quality is poor for wavelengths below 0.45 µm, probably because that is
a region of strong absorptions, that cannot be described by the simple model used
here. The fit quality is better in the 0.45-2.5 µm range, which is the range of main
interest for Solar System studies. Though discrepancies are present, they could be
partially attributed to a non-perfect compensation of the silicate bands, as discussed
above; discrepancies can also be attributed to the relatively poor approximation of
Eq. 7.5. The fit curve seems to deviate at lower dose case more than higher dose:
this may indicate that saturation and uniformity of the surface has been reached; in
fact, in the ablation regime, the difference between lower dose (e.g. 27 J/cm2) and
higher dose (e.g. 52 J/cm2) is given by the number of pulses, and some saturation
effect is achieved at the higher doses.
The volume fraction of nanophase iron is ∼ 0.01% for doses of 27- and 52-J/cm2,
using a reasonable mean optical path length of about 450 µm, as calculated from
the previous fitting of the silicate bands. This would reassert that the nanophase
iron scenario described above is correct, and it would remain consistent with the
magnetic susceptibility measurements.
The case of orthopyroxene is depicted in Fig. 7.5; the quality of the fit curves is
better than the case of olivine.
It results φ ∼ 0.01 vol. % for doses of 43- and 86-J/cm2, using a reasonable
mean optical path length of about 210 µm, as calculated from the previous fitting
the silicate bands. Note that the amount of nanophase iron in the two cases is
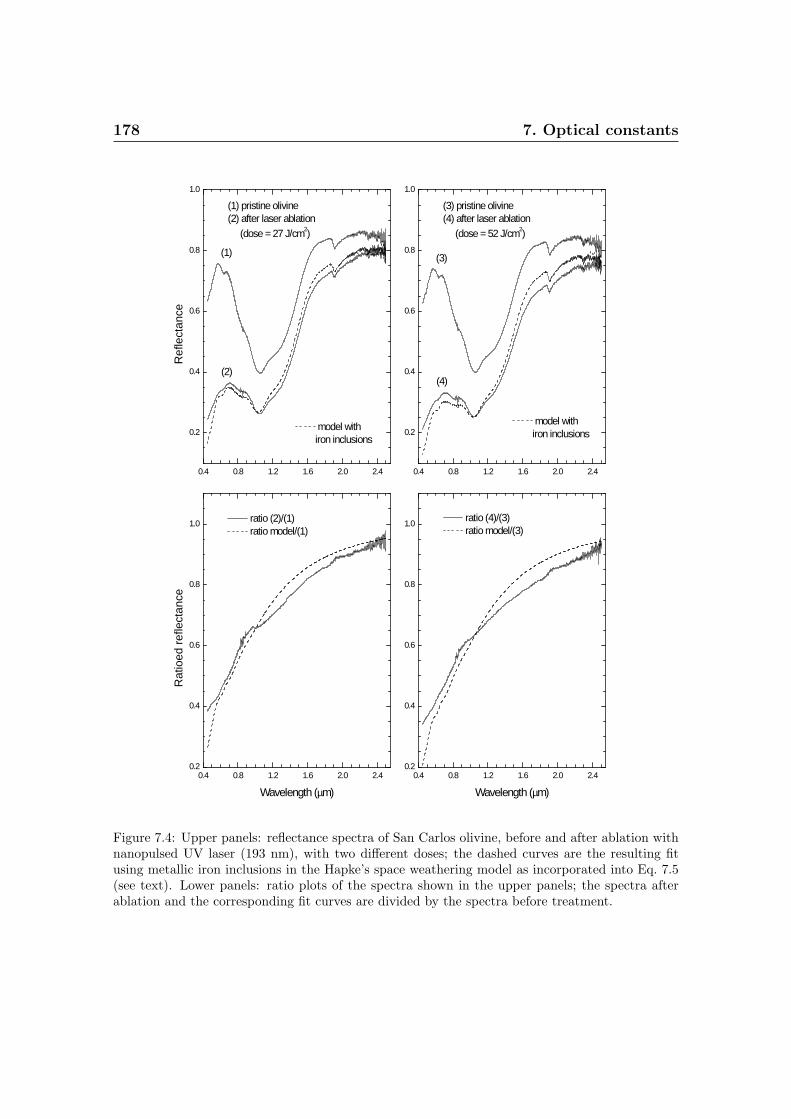
178 7. Optical constants
0.4 0.8 1.2 1.6 2.0 2.40.2
0.4
0.6
0.8
1.0
Wavelength (µm)
ratio (4)/(3) ratio model/(3)
0.4 0.8 1.2 1.6 2.0 2.4
0.2
0.4
0.6
0.8
1.0
(3)
(4)
(3) pristine olivine(4) after laser ablation (dose = 52 J/cm2)
model with iron inclusions
0.4 0.8 1.2 1.6 2.0 2.40.2
0.4
0.6
0.8
1.0
Rat
ioed
ref
lect
ance
Wavelength (µm)
ratio (2)/(1) ratio model/(1)
0.4 0.8 1.2 1.6 2.0 2.4
0.2
0.4
0.6
0.8
1.0
R
efle
ctan
ce
(1)
(2)
(1) pristine olivine(2) after laser ablation (dose = 27 J/cm2)
model with iron inclusions
Figure 7.4: Upper panels: reflectance spectra of San Carlos olivine, before and after ablation withnanopulsed UV laser (193 nm), with two different doses; the dashed curves are the resulting fitusing metallic iron inclusions in the Hapke’s space weathering model as incorporated into Eq. 7.5(see text). Lower panels: ratio plots of the spectra shown in the upper panels; the spectra afterablation and the corresponding fit curves are divided by the spectra before treatment.
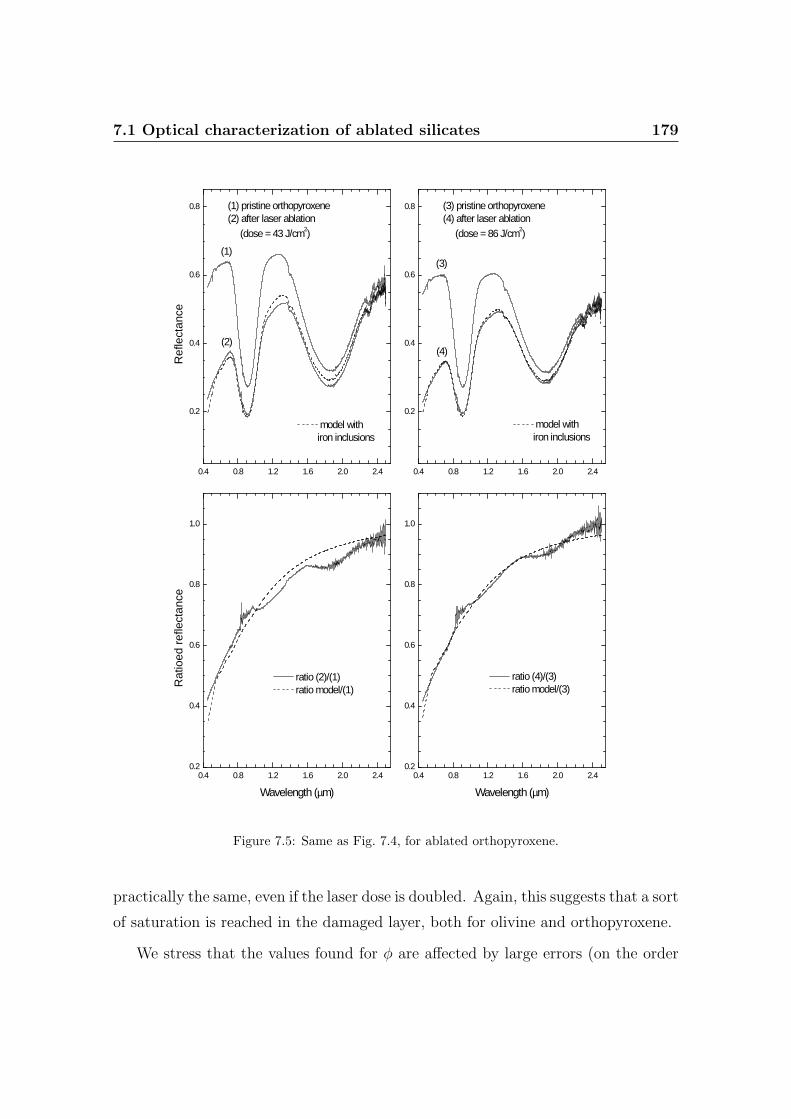
7.1 Optical characterization of ablated silicates 179
0.4 0.8 1.2 1.6 2.0 2.40.2
0.4
0.6
0.8
1.0
Wavelength (µm)
ratio (4)/(3) ratio model/(3)
0.4 0.8 1.2 1.6 2.0 2.40.2
0.4
0.6
0.8
1.0
Rat
ioed
ref
lect
ance
Wavelength (µm)
ratio (2)/(1) ratio model/(1)
0.4 0.8 1.2 1.6 2.0 2.4
0.2
0.4
0.6
0.8
(3)
(4)
(3) pristine orthopyroxene(4) after laser ablation (dose = 86 J/cm2)
model with iron inclusions
0.4 0.8 1.2 1.6 2.0 2.4
0.2
0.4
0.6
0.8
R
efle
ctan
ce
(1)
(2)
(1) pristine orthopyroxene(2) after laser ablation (dose = 43 J/cm2)
model with iron inclusions
Figure 7.5: Same as Fig. 7.4, for ablated orthopyroxene.
practically the same, even if the laser dose is doubled. Again, this suggests that a sort
of saturation is reached in the damaged layer, both for olivine and orthopyroxene.
We stress that the values found for φ are affected by large errors (on the order

180 7. Optical constants
of a factor of 2), that essentially come from the error of the estimated mean optical
path length. Hence, a comparison between φ values for olivine and orthopyroxene
implies that the amount of nanophase iron formed in the process is of the same order
of magnitude, and one cannot discriminate whether the process is more effective for
olivine or orthopyroxene. Probably the spectral changes depend more on the ferrous
content than on the crystal structure, and thus a comparison between olivine and
orthopyroxene could be done only using materials with the same Fe content. In
any case, laser ablated olivine produces NIR spectral slopes that are redder than
pyroxene (Hiroi and Sasaki, 2001; Brunetto et al., 2006a).
Using Hapke’s space weathering model on ablated clinopyroxene (Fig. 7.6) gives
a better fit than ablated orthopyroxene; here a value of nh = 1.664 is assumed
for clinopyroxene, i.e. the same value estimated for orthopyroxene. One can use
Eq. 7.5 because it does not require the knowledge of kh. Unfortunately in this
case the metallic iron content cannot be calculated since we do not have a precise
estimate of the grain size; however, one can calculate the product φde = 0.02µm, and
assuming a mean optical path length of about 210 µm (as the one of orthopyroxene)
again it results about ∼ 0.01 vol.%. These results are not strongly sensitive to
the range of n-values of clinopyroxene. Using an nh value of 1.84, near the upper
bounds of clinopyroxene, produces φ = 0.007 vol.%, and this is consistent with the
interpretation that φ ∼ 0.01 vol.%.
It is interesting to note that the product φde obtained for ortho- and clinopy-
roxene (about 0.02 µm) is nearly identical to what Hiroi et al. (2006) found for the
dark and red areas on asteroid 25143 Itokawa.
7.1.4 Other possible scenarios
Metallic iron particles without ablation process
A few experiments have been performed in our laboratory, investigating the laser
effect below the ablation threshold. In Fig. 7.7 the results of the model described
above are plotted for clinopyroxene laser processed below the ablation threshold (us-
ing the same assumptions as above). It comes out that the Hapke’s space weathering
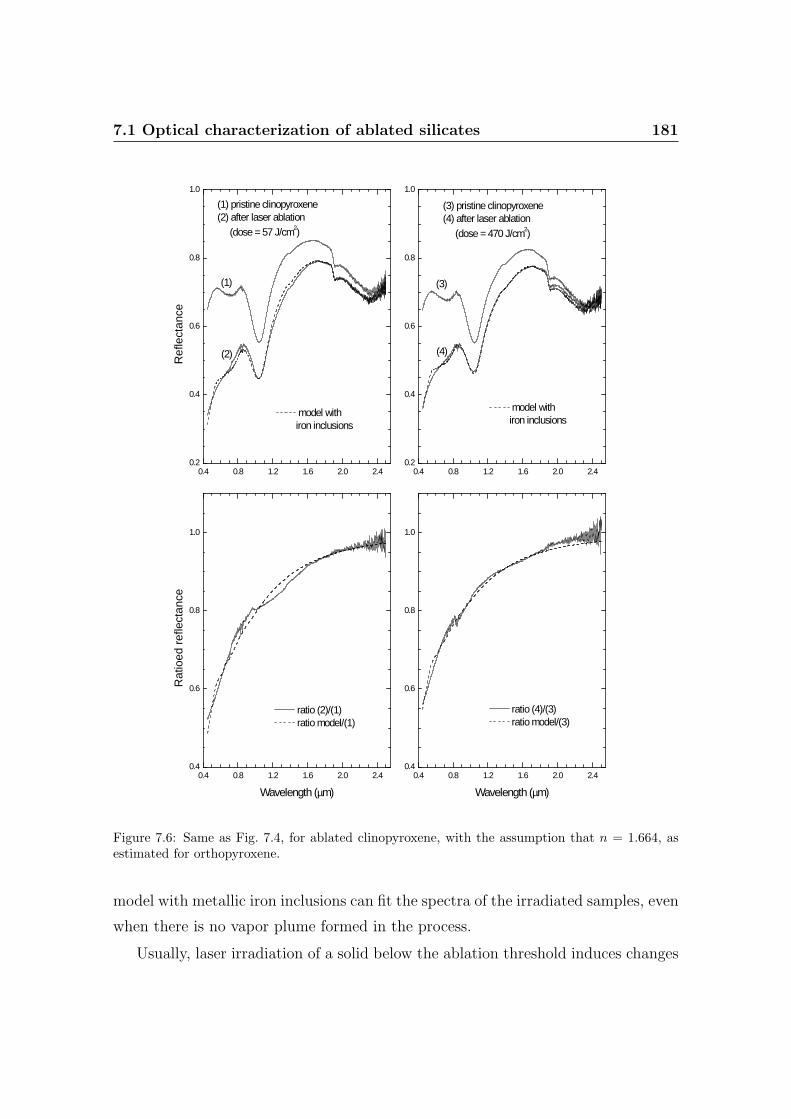
7.1 Optical characterization of ablated silicates 181
0.4 0.8 1.2 1.6 2.0 2.40.4
0.6
0.8
1.0
Wavelength (µm)
ratio (4)/(3) ratio model/(3)
0.4 0.8 1.2 1.6 2.0 2.40.4
0.6
0.8
1.0
Rat
ioed
ref
lect
ance
Wavelength (µm)
ratio (2)/(1) ratio model/(1)
0.4 0.8 1.2 1.6 2.0 2.40.2
0.4
0.6
0.8
1.0
(3)
(4)
(3) pristine clinopyroxene(4) after laser ablation (dose = 470 J/cm2)
model with iron inclusions
0.4 0.8 1.2 1.6 2.0 2.40.2
0.4
0.6
0.8
1.0
R
efle
ctan
ce
(1)
(2)
(1) pristine clinopyroxene(2) after laser ablation (dose = 57 J/cm2)
model with iron inclusions
Figure 7.6: Same as Fig. 7.4, for ablated clinopyroxene, with the assumption that n = 1.664, asestimated for orthopyroxene.
model with metallic iron inclusions can fit the spectra of the irradiated samples, even
when there is no vapor plume formed in the process.
Usually, laser irradiation of a solid below the ablation threshold induces changes
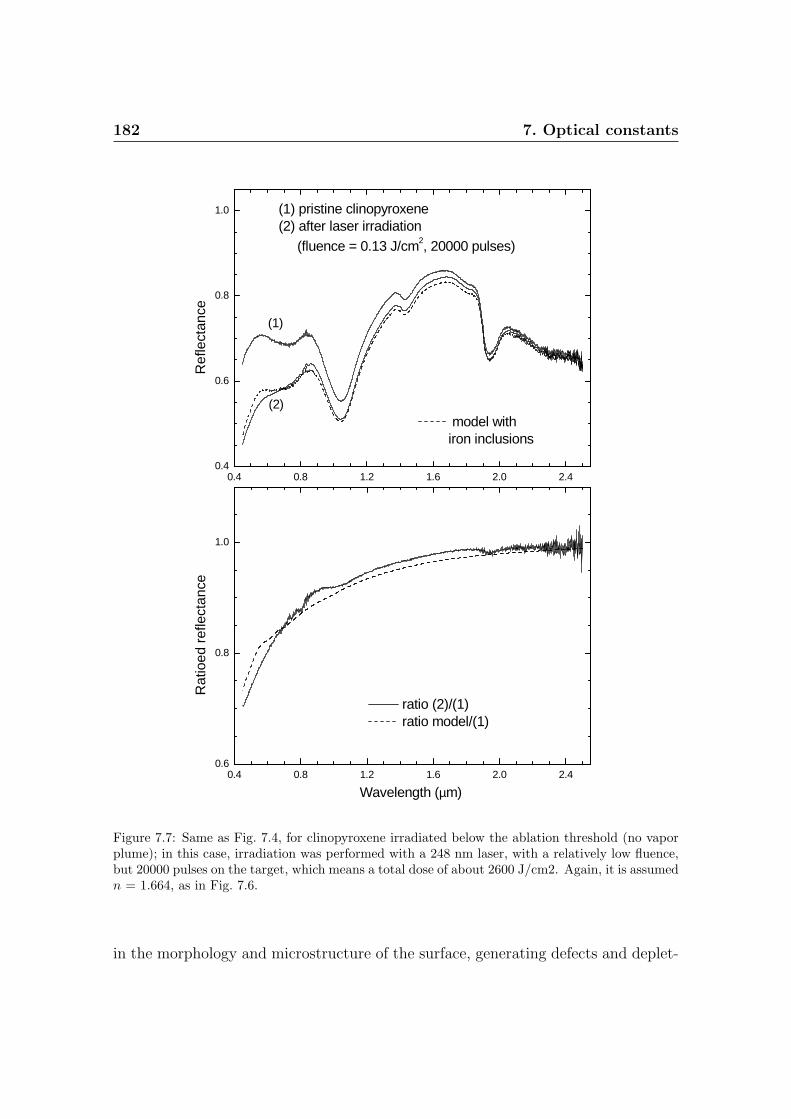
182 7. Optical constants
0.4 0.8 1.2 1.6 2.0 2.40.4
0.6
0.8
1.0R
efle
ctan
ce
(1)
(2)
(1) pristine clinopyroxene(2) after laser irradiation (fluence = 0.13 J/cm2, 20000 pulses)
model with iron inclusions
0.4 0.8 1.2 1.6 2.0 2.40.6
0.8
1.0
Wavelength (µm)
Rat
ioed
ref
lect
ance
ratio (2)/(1) ratio model/(1)
Figure 7.7: Same as Fig. 7.4, for clinopyroxene irradiated below the ablation threshold (no vaporplume); in this case, irradiation was performed with a 248 nm laser, with a relatively low fluence,but 20000 pulses on the target, which means a total dose of about 2600 J/cm2. Again, it is assumedn = 1.664, as in Fig. 7.6.
in the morphology and microstructure of the surface, generating defects and deplet-
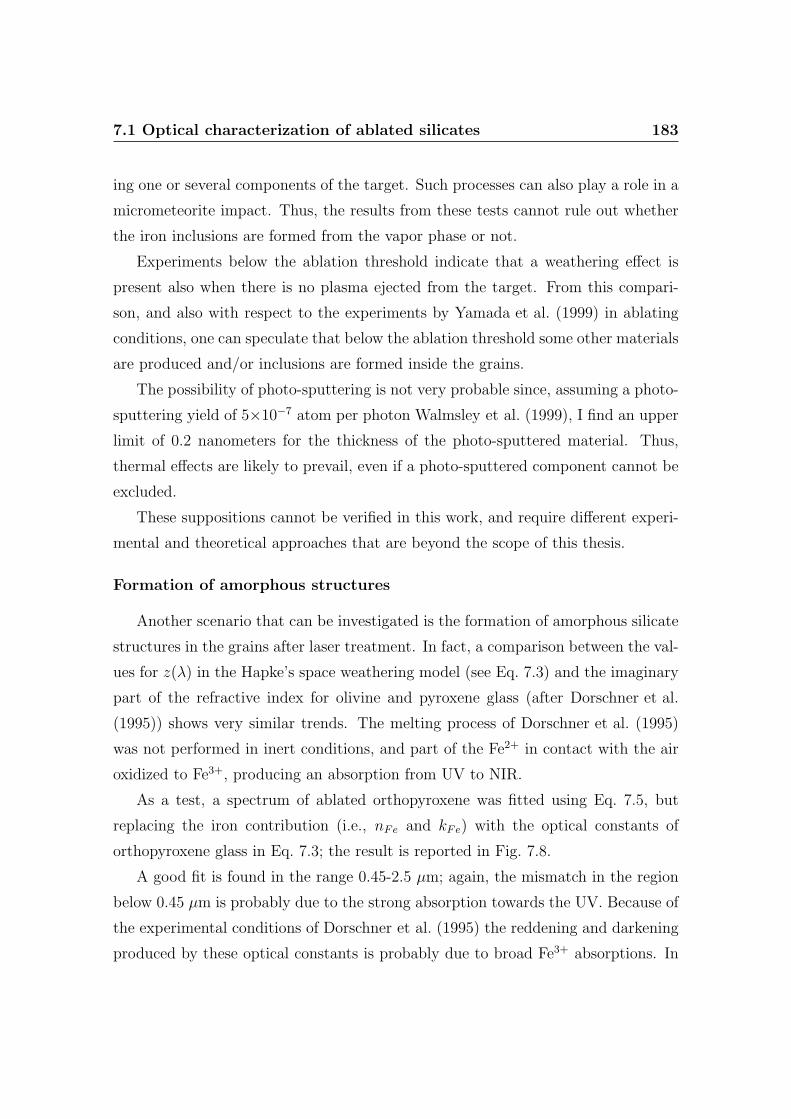
7.1 Optical characterization of ablated silicates 183
ing one or several components of the target. Such processes can also play a role in a
micrometeorite impact. Thus, the results from these tests cannot rule out whether
the iron inclusions are formed from the vapor phase or not.
Experiments below the ablation threshold indicate that a weathering effect is
present also when there is no plasma ejected from the target. From this compari-
son, and also with respect to the experiments by Yamada et al. (1999) in ablating
conditions, one can speculate that below the ablation threshold some other materials
are produced and/or inclusions are formed inside the grains.
The possibility of photo-sputtering is not very probable since, assuming a photo-
sputtering yield of 5×10⁻⁷ atom per photon Walmsley et al. (1999), I find an upper
limit of 0.2 nanometers for the thickness of the photo-sputtered material. Thus,
thermal effects are likely to prevail, even if a photo-sputtered component cannot be
excluded.
These suppositions cannot be verified in this work, and require different experi-
mental and theoretical approaches that are beyond the scope of this thesis.
Formation of amorphous structures
Another scenario that can be investigated is the formation of amorphous silicate
structures in the grains after laser treatment. In fact, a comparison between the val-
ues for z(λ) in the Hapke’s space weathering model (see Eq. 7.3) and the imaginary
part of the refractive index for olivine and pyroxene glass (after Dorschner et al.
(1995)) shows very similar trends. The melting process of Dorschner et al. (1995)
was not performed in inert conditions, and part of the Fe2+ in contact with the air
oxidized to Fe3+, producing an absorption from UV to NIR.
As a test, a spectrum of ablated orthopyroxene was fitted using Eq. 7.5, but
replacing the iron contribution (i.e., nFe and kFe) with the optical constants of
orthopyroxene glass in Eq. 7.3; the result is reported in Fig. 7.8.
A good fit is found in the range 0.45-2.5 µm; again, the mismatch in the region
below 0.45 µm is probably due to the strong absorption towards the UV. Because of
the experimental conditions of Dorschner et al. (1995) the reddening and darkening
produced by these optical constants is probably due to broad Fe3+ absorptions. In
184 7. Optical constants
0.4 0.8 1.2 1.6 2.0 2.4
0.2
0.4
0.6
0.8R
efle
ctan
ce
(1)
(2)
(1) pristine orthopyroxene(2) after laser ablation (dose = 43 J/cm2)
model with orthopyroxene glass inclusions (Mg number 0.8)
0.4 0.8 1.2 1.6 2.0 2.40.2
0.4
0.6
0.8
1.0
Wavelength (µm)
Rat
ioed
ref
lect
ance
ratio (2)/(1) ratio model/(1)
Figure 7.8: Same as left panels of Fig. 7.5, but using orthopyroxene glass (Mg number = 0.8)inclusions instead of metallic iron.
fact, it is interesting to note that the values of k for the amorphous pyroxene used
here range between 10−3 and 10−2 in the visible, while the values of k for Fe-free
pyroxene glass are between 10−5 and 10−4 in the same spectral range. This indicates
7.1 Optical characterization of ablated silicates 185
that the use of effective medium theory is reasonable, while it would not probably
be so for Fe-free glass particles, as scattering would become important. In fact,
effective medium theory does not take into account scattering by individual particles
(as reported above, the contaminants are assumed to be very small spheres).
I use orthopyroxene glass with Mg number of 0.8 and a volume fraction for the
inclusions of φ = 8.6 vol.%; this last value is quite large, suggesting that second
order effects should be probably included in Eq. 7.3.
Furthermore, the data from Dorschner et al. (1995) closest to the Bamble or-
thopyroxene composition are for Mg number of 0.8 and 0.95; a Mg number in between
would be probably more appropriate for Bamble orthopyroxene, but since optical
constants for that are not currently available, this scenario cannot be investigated
in more detail. However, these results indicate that the presence of contributions by
amorphous or glassy silicates containing iron, after the weathering process cannot
be excluded a priori, and indeed it deserves further experimental investigation.
Conclusions
Performing an optical characterization of samples before and after UV laser abla-
tion, it results that the weathering trend (reddening and darkening of the reflectance
spectra) is compatible with the Hapke’s space weathering model, using the optical
constants of metallic iron in a silicate matrix. The formation of nanophase iron
inclusions in the targets is also supported by new magnetic susceptibility measure-
ments of the laser ablated orthopyroxene. Both results agree with previous studies
using IR lasers (Yamada et al., 1999; Bentley et al., 2005).
I also investigated the potential formation of amorphous silicates (enriched in
Fe3+) in the process and preliminary results indicate that additional spectral con-
tributions from such materials may well be present. Also, from experiments below
ablation threshold, I suggest that a small part of the metallic iron or the iron-bearing
glassy inclusions may form independent of a vapor plume. It must be stressed that a
deeper analysis of the micrometeorite bombardment process should be investigated
looking at real micro-impact experiments.
186 7. Optical constants
Acknowledgments
We thank B. Hapke and an anonymous reviewer for their comments and sug-
gestions in the reviewing process, and warmly thank L. Sagnotti for his magnetic
measurements. We are also grateful to A. Blanco, L. Folco, M. Martino, L. Moroz,
F. Romano, and G. Strazzulla for their precious help and suggestions. This research
was supported by the Italian Ministero dell’Istruzione, Universita e Ricerca (MIUR),
and TLR acknowledges support enabling this research from NASA’s Planetary Ge-
ology and Geophysics Program.
7.2 Application to minor bodies
7.2.1 Centaur 5145 Pholus: a mixture of silicates and or-ganics
The surfaces of objects in the outer Solar System are dominated by ices and
organic refractories, but silicates have been tentatively identified on a few objects,
for instance on the centaur Pholus (Cruikshank et al., 1998) and the Uranian moon,
Miranda (Bauer et al., 2002). Since the red organic compounds observed on TNOs
and centaurs have very likely been produced by irradiation of simpler molecules
(Brunetto et al., 2006c), it is reasonable to ask if weathered silicates are present
also in the outer Solar System.
Many authors have already applied the Hapke’s space weathering model to inter-
pret the spectra of minor and airless bodies in the Solar System (see e.g. Hiroi et al.
(2006), and references therein). In space weathering studies, a high number of efforts
have been focusing on the connection between Main-Belt and Near-Earth asteroids
and meteorites (see e.g. Chapman (1996), and Clark et al. (2002)). The weathering
process has been shown to be highly efficient.
Here, I want to investigate if the darkening and reddening spectral effect of al-
tered silicates can be observed also on outer Solar System objects, where silicates
are probably mixed with icy species (H2O, N2, CH4, CH3OH, etc.) and complex
organics. Resurfacing processes may bring pristine silicate grains close to the sur-
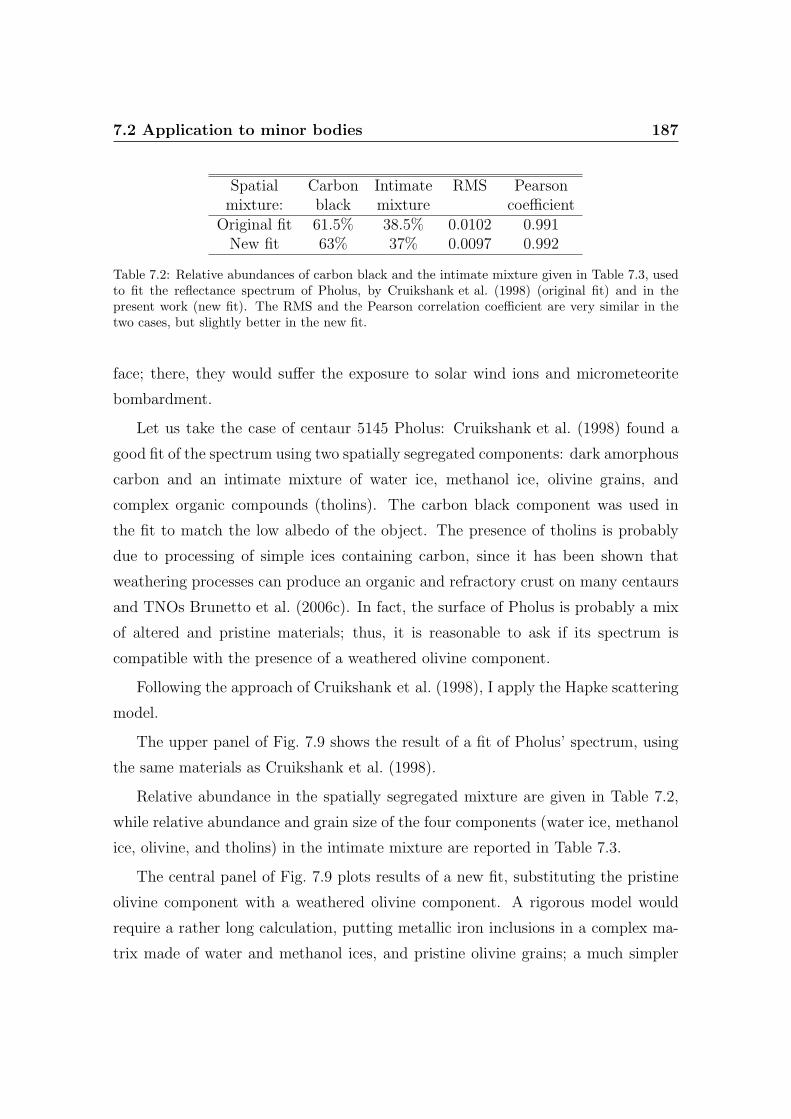
7.2 Application to minor bodies 187
Spatial Carbon Intimate RMS Pearsonmixture: black mixture coefficient
Original fit 61.5% 38.5% 0.0102 0.991New fit 63% 37% 0.0097 0.992
Table 7.2: Relative abundances of carbon black and the intimate mixture given in Table 7.3, usedto fit the reflectance spectrum of Pholus, by Cruikshank et al. (1998) (original fit) and in thepresent work (new fit). The RMS and the Pearson correlation coefficient are very similar in thetwo cases, but slightly better in the new fit.
face; there, they would suffer the exposure to solar wind ions and micrometeorite
bombardment.
Let us take the case of centaur 5145 Pholus: Cruikshank et al. (1998) found a
good fit of the spectrum using two spatially segregated components: dark amorphous
carbon and an intimate mixture of water ice, methanol ice, olivine grains, and
complex organic compounds (tholins). The carbon black component was used in
the fit to match the low albedo of the object. The presence of tholins is probably
due to processing of simple ices containing carbon, since it has been shown that
weathering processes can produce an organic and refractory crust on many centaurs
and TNOs Brunetto et al. (2006c). In fact, the surface of Pholus is probably a mix
of altered and pristine materials; thus, it is reasonable to ask if its spectrum is
compatible with the presence of a weathered olivine component.
Following the approach of Cruikshank et al. (1998), I apply the Hapke scattering
model.
The upper panel of Fig. 7.9 shows the result of a fit of Pholus’ spectrum, using
the same materials as Cruikshank et al. (1998).
Relative abundance in the spatially segregated mixture are given in Table 7.2,
while relative abundance and grain size of the four components (water ice, methanol
ice, olivine, and tholins) in the intimate mixture are reported in Table 7.3.
The central panel of Fig. 7.9 plots results of a new fit, substituting the pristine
olivine component with a weathered olivine component. A rigorous model would
require a rather long calculation, putting metallic iron inclusions in a complex ma-
trix made of water and methanol ices, and pristine olivine grains; a much simpler
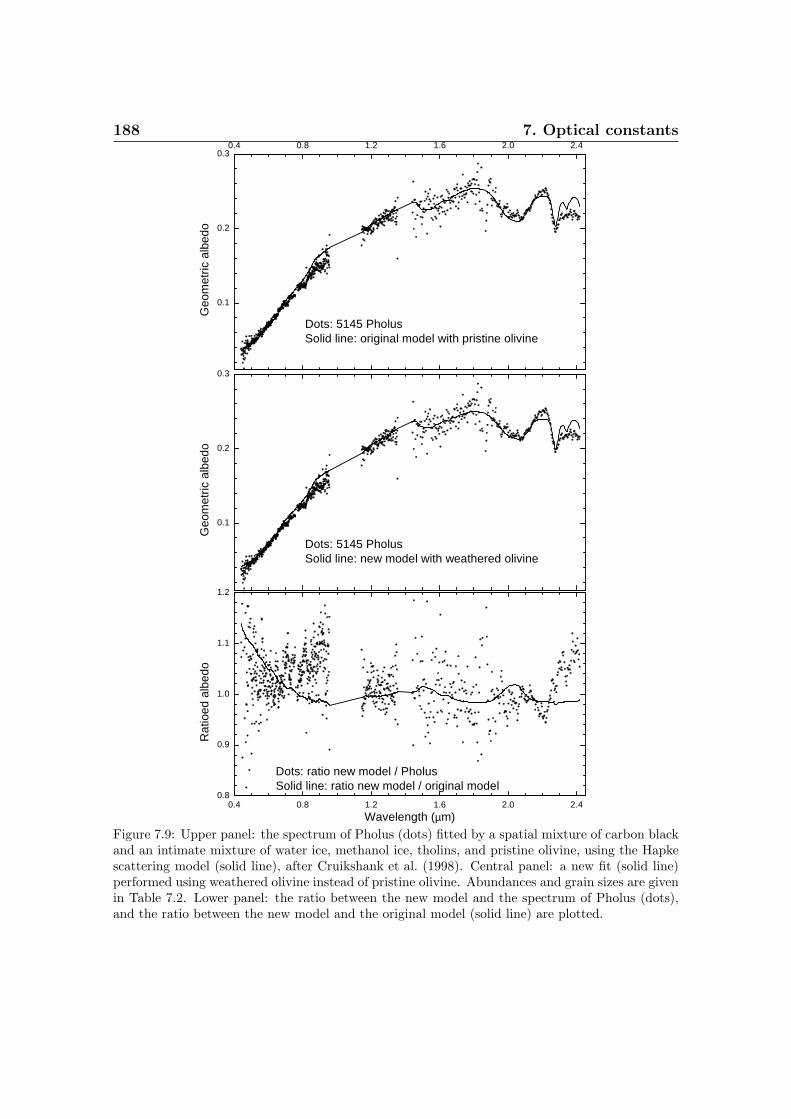
188 7. Optical constants
0.4 0.8 1.2 1.6 2.0 2.40.8
0.9
1.0
1.1
1.2
Wavelength (µm)
Rat
ioed
alb
edo
Dots: ratio new model / PholusSolid line: ratio new model / original model
0.1
0.2
0.3
Geo
met
ric a
lbed
o
Dots: 5145 PholusSolid line: new model with weathered olivine
0.4 0.8 1.2 1.6 2.0 2.4
0.1
0.2
0.3
Geo
met
ric a
lbed
o
Dots: 5145 PholusSolid line: original model with pristine olivine
Figure 7.9: Upper panel: the spectrum of Pholus (dots) fitted by a spatial mixture of carbon blackand an intimate mixture of water ice, methanol ice, tholins, and pristine olivine, using the Hapkescattering model (solid line), after Cruikshank et al. (1998). Central panel: a new fit (solid line)performed using weathered olivine instead of pristine olivine. Abundances and grain sizes are givenin Table 7.2. Lower panel: the ratio between the new model and the spectrum of Pholus (dots),and the ratio between the new model and the original model (solid line) are plotted.
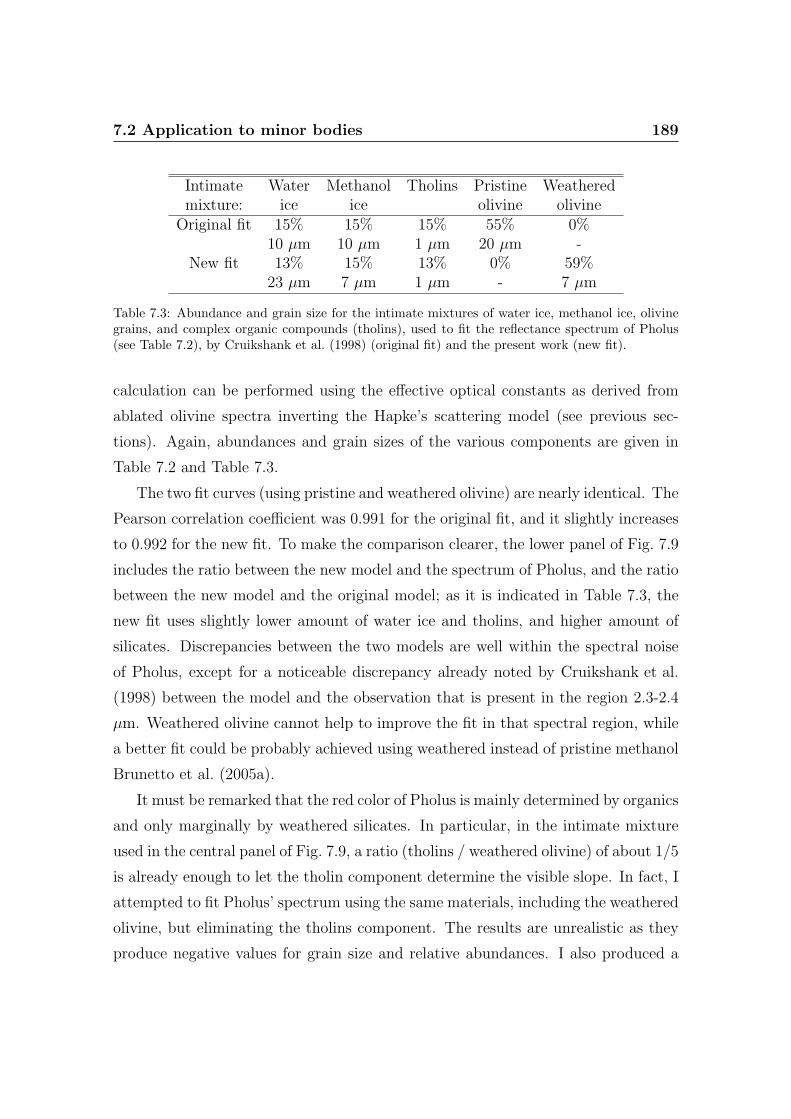
7.2 Application to minor bodies 189
Intimate Water Methanol Tholins Pristine Weatheredmixture: ice ice olivine olivine
Original fit 15% 15% 15% 55% 0%10 µm 10 µm 1 µm 20 µm -
New fit 13% 15% 13% 0% 59%23 µm 7 µm 1 µm - 7 µm
Table 7.3: Abundance and grain size for the intimate mixtures of water ice, methanol ice, olivinegrains, and complex organic compounds (tholins), used to fit the reflectance spectrum of Pholus(see Table 7.2), by Cruikshank et al. (1998) (original fit) and the present work (new fit).
calculation can be performed using the effective optical constants as derived from
ablated olivine spectra inverting the Hapke’s scattering model (see previous sec-
tions). Again, abundances and grain sizes of the various components are given in
Table 7.2 and Table 7.3.
The two fit curves (using pristine and weathered olivine) are nearly identical. The
Pearson correlation coefficient was 0.991 for the original fit, and it slightly increases
to 0.992 for the new fit. To make the comparison clearer, the lower panel of Fig. 7.9
includes the ratio between the new model and the spectrum of Pholus, and the ratio
between the new model and the original model; as it is indicated in Table 7.3, the
new fit uses slightly lower amount of water ice and tholins, and higher amount of
silicates. Discrepancies between the two models are well within the spectral noise
of Pholus, except for a noticeable discrepancy already noted by Cruikshank et al.
(1998) between the model and the observation that is present in the region 2.3-2.4
µm. Weathered olivine cannot help to improve the fit in that spectral region, while
a better fit could be probably achieved using weathered instead of pristine methanol
Brunetto et al. (2005a).
It must be remarked that the red color of Pholus is mainly determined by organics
and only marginally by weathered silicates. In particular, in the intimate mixture
used in the central panel of Fig. 7.9, a ratio (tholins / weathered olivine) of about 1/5
is already enough to let the tholin component determine the visible slope. In fact, I
attempted to fit Pholus’ spectrum using the same materials, including the weathered
olivine, but eliminating the tholins component. The results are unrealistic as they
produce negative values for grain size and relative abundances. I also produced a
190 7. Optical constants
synthetic spectrum of the new fit shown in the central panel of Fig. 7.9, by removing
tholins and rescaling the abundance of the other components. No result can match
the slope in the visible and very near-infrared region of the Pholus spectrum. Other
silicate components, such as pyroxenes, cannot help improving the fit quality. It
must be concluded that a tholin-like component is necessary to reproduce the red
slope of Pholus.
The amount of olivine used in the model increases when using the weathered
component, and the amount of tholins required decreases. However the presence of
weathered olivine is not significantly improving the quality of the fit, so it cannot
be ruled out if such a component is really present on the surface. In any case, this
result is an indication that optical characterization of weathered silicates may help
in interpreting the surface spectra also of bodies in the outer Solar System.
In conclusion, using the effective optical constants of weathered silicates to fit
the spectrum of centaur 5145 Pholus indicates that its surface spectrum does not
exclude the presence of weathered olivine, but such component cannot be clearly
detected when mixed with complex organics.
7.2.2 Asteroid 1951 Lick: space weathering to the highestlevel
Asteroid (1951) Lick is a Near-Earth object that orbits in the limit that separates
Amor objects from Mars Crossers1. It has been classified as an A-type asteroid by
Bus and Binzel (2002b). A-type asteroids, usually found in the main asteroid belt
between Mars and Jupiter, have spectra that are very similar to spectra of olivine
(Cruikshank and Hartmann, 1984).
Lick has a very red spectrum (de Leon et al., 2004), and it is probably one of
the most weathered Near-Earth asteroids. Thus, it is interesting to apply the space
weathering models that I have described in the previous sections to Lick’s spectrum.
This can be a test for space weathering to its highest levels, and to investigate the
1The Amor asteroids are a group of near-Earth asteroids named after the asteroid 1221 Amor.They approach the orbit of the Earth from beyond, but do not cross it. A Mars-crosser asteroid isan asteroid whose orbit crosses that of Mars.
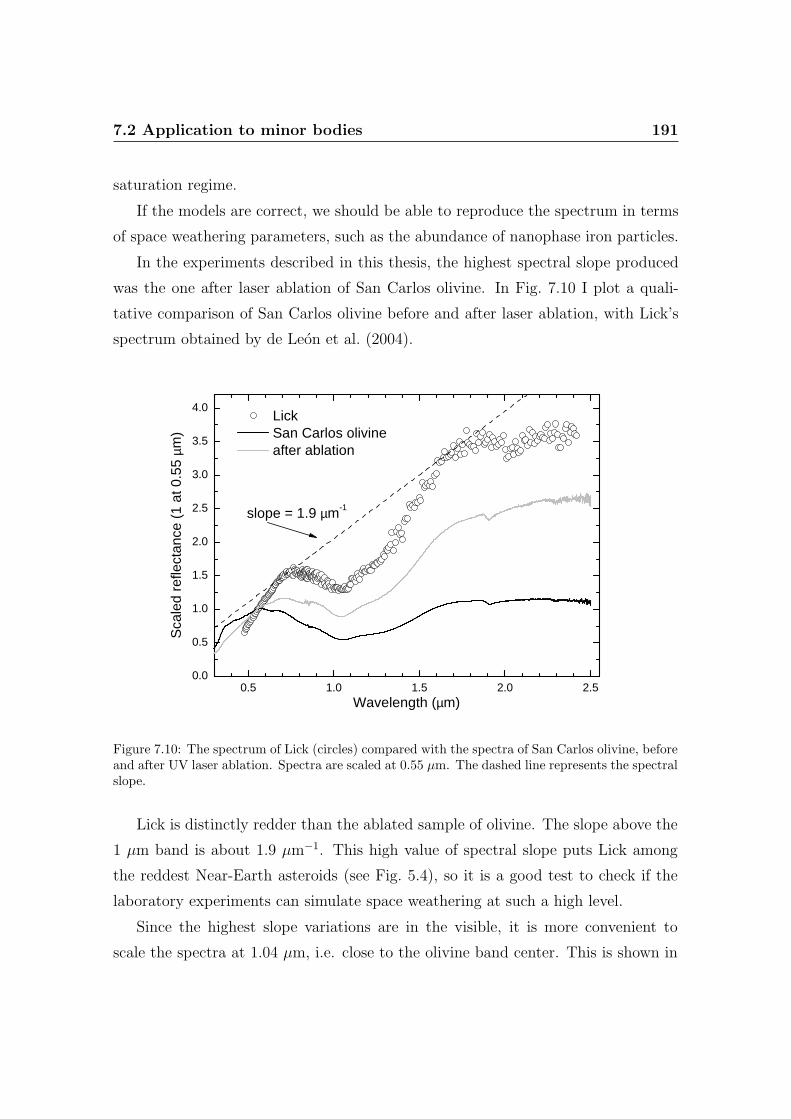
7.2 Application to minor bodies 191
saturation regime.
If the models are correct, we should be able to reproduce the spectrum in terms
of space weathering parameters, such as the abundance of nanophase iron particles.
In the experiments described in this thesis, the highest spectral slope produced
was the one after laser ablation of San Carlos olivine. In Fig. 7.10 I plot a quali-
tative comparison of San Carlos olivine before and after laser ablation, with Lick’s
spectrum obtained by de Leon et al. (2004).
0.5 1.0 1.5 2.0 2.50.0
0.5
1.0
1.5
2.0
2.5
3.0
3.5
4.0
Sca
led
refle
ctan
ce (
1 at
0.5
5 µm
)
Wavelength (µm)
Lick San Carlos olivine after ablation
slope = 1.9 µm-1
Figure 7.10: The spectrum of Lick (circles) compared with the spectra of San Carlos olivine, beforeand after UV laser ablation. Spectra are scaled at 0.55 µm. The dashed line represents the spectralslope.
Lick is distinctly redder than the ablated sample of olivine. The slope above the
1 µm band is about 1.9 µm−1. This high value of spectral slope puts Lick among
the reddest Near-Earth asteroids (see Fig. 5.4), so it is a good test to check if the
laboratory experiments can simulate space weathering at such a high level.
Since the highest slope variations are in the visible, it is more convenient to
scale the spectra at 1.04 µm, i.e. close to the olivine band center. This is shown in
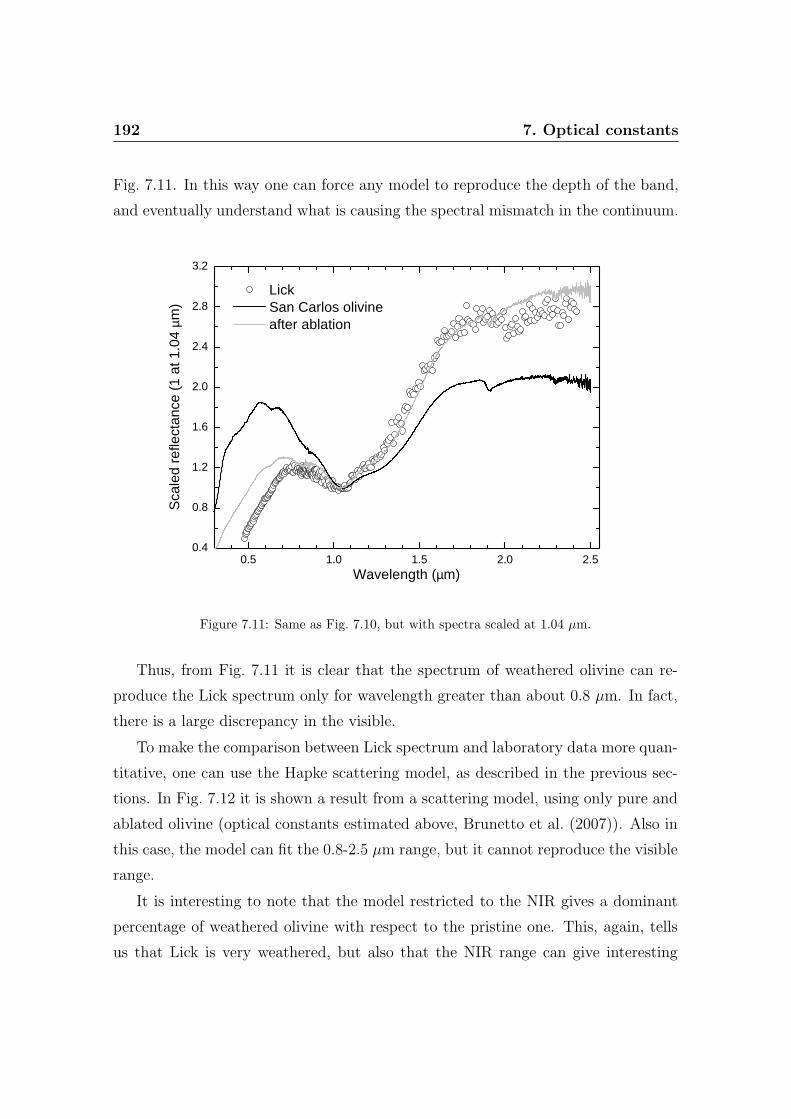
192 7. Optical constants
Fig. 7.11. In this way one can force any model to reproduce the depth of the band,
and eventually understand what is causing the spectral mismatch in the continuum.
0.5 1.0 1.5 2.0 2.50.4
0.8
1.2
1.6
2.0
2.4
2.8
3.2
Sca
led
refle
ctan
ce (
1 at
1.0
4 µm
)
Wavelength (µm)
Lick San Carlos olivine after ablation
Figure 7.11: Same as Fig. 7.10, but with spectra scaled at 1.04 µm.
Thus, from Fig. 7.11 it is clear that the spectrum of weathered olivine can re-
produce the Lick spectrum only for wavelength greater than about 0.8 µm. In fact,
there is a large discrepancy in the visible.
To make the comparison between Lick spectrum and laboratory data more quan-
titative, one can use the Hapke scattering model, as described in the previous sec-
tions. In Fig. 7.12 it is shown a result from a scattering model, using only pure and
ablated olivine (optical constants estimated above, Brunetto et al. (2007)). Also in
this case, the model can fit the 0.8-2.5 µm range, but it cannot reproduce the visible
range.
It is interesting to note that the model restricted to the NIR gives a dominant
percentage of weathered olivine with respect to the pristine one. This, again, tells
us that Lick is very weathered, but also that the NIR range can give interesting
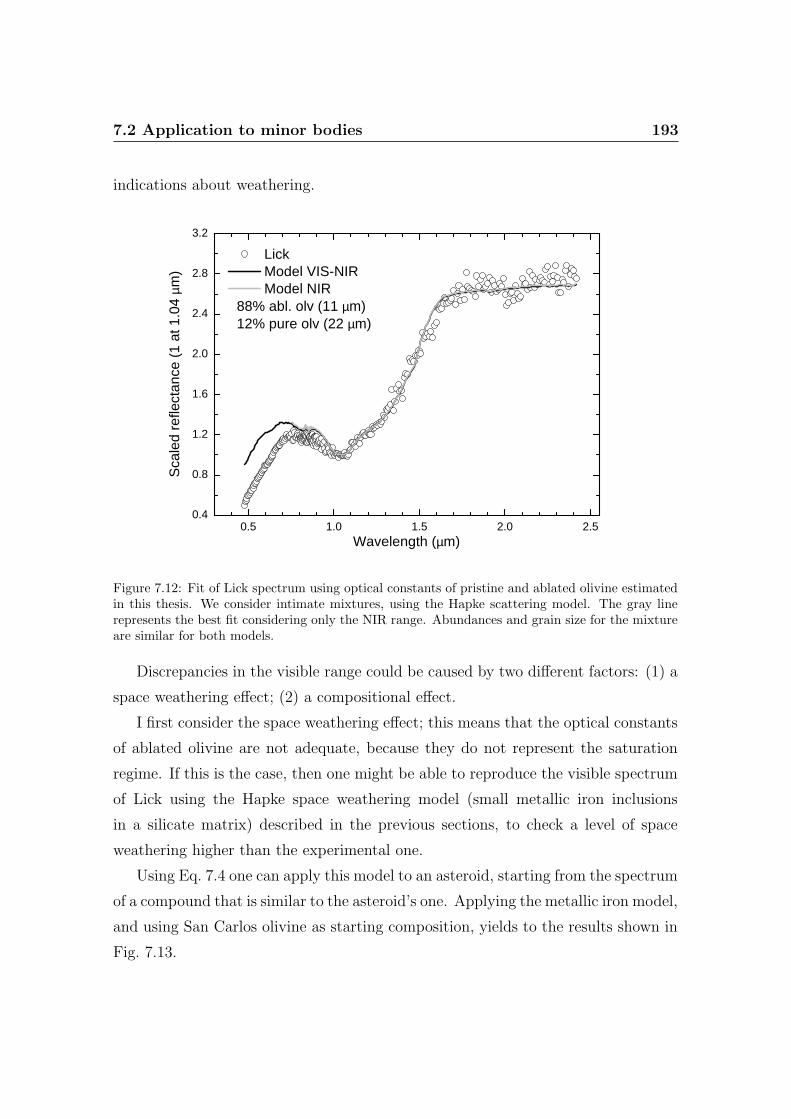
7.2 Application to minor bodies 193
indications about weathering.
0.5 1.0 1.5 2.0 2.50.4
0.8
1.2
1.6
2.0
2.4
2.8
3.2
Sca
led
refle
ctan
ce (
1 at
1.0
4 µm
)
Wavelength (µm)
Lick Model VIS-NIR Model NIR
88% abl. olv (11 µm) 12% pure olv (22 µm)
Figure 7.12: Fit of Lick spectrum using optical constants of pristine and ablated olivine estimatedin this thesis. We consider intimate mixtures, using the Hapke scattering model. The gray linerepresents the best fit considering only the NIR range. Abundances and grain size for the mixtureare similar for both models.
Discrepancies in the visible range could be caused by two different factors: (1) a
space weathering effect; (2) a compositional effect.
I first consider the space weathering effect; this means that the optical constants
of ablated olivine are not adequate, because they do not represent the saturation
regime. If this is the case, then one might be able to reproduce the visible spectrum
of Lick using the Hapke space weathering model (small metallic iron inclusions
in a silicate matrix) described in the previous sections, to check a level of space
weathering higher than the experimental one.
Using Eq. 7.4 one can apply this model to an asteroid, starting from the spectrum
of a compound that is similar to the asteroid’s one. Applying the metallic iron model,
and using San Carlos olivine as starting composition, yields to the results shown in
Fig. 7.13.
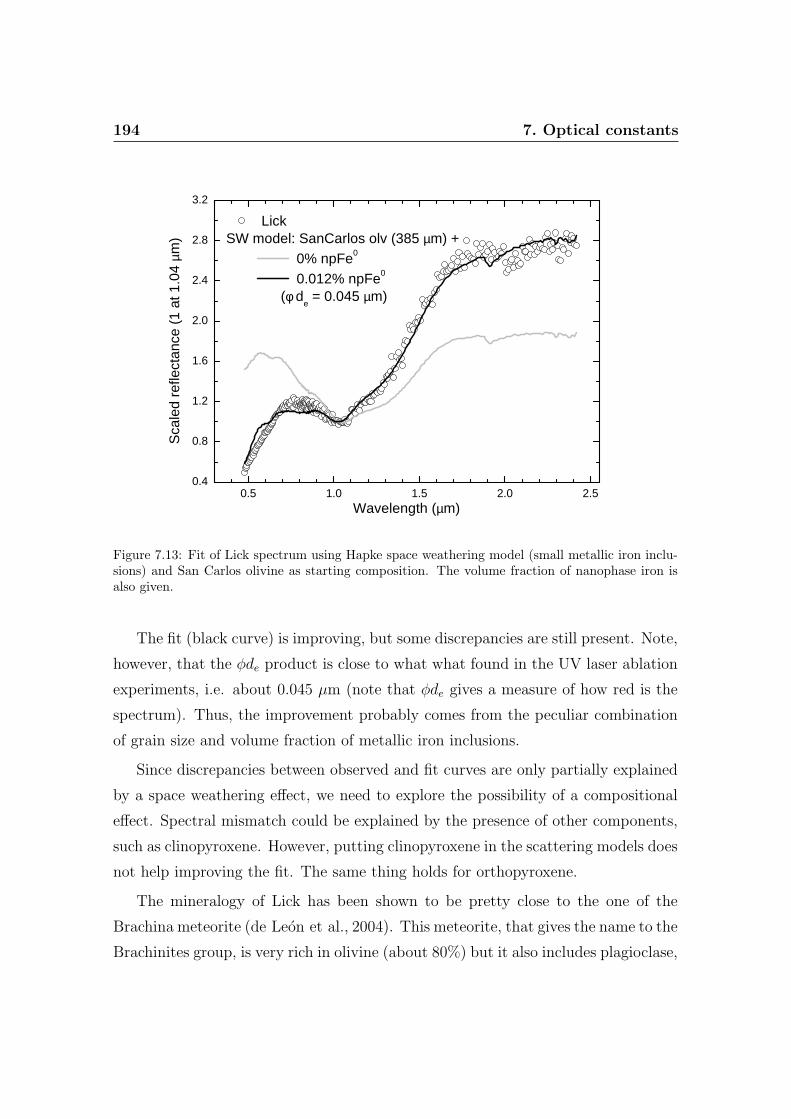
194 7. Optical constants
0.5 1.0 1.5 2.0 2.50.4
0.8
1.2
1.6
2.0
2.4
2.8
3.2
S
cale
d re
flect
ance
(1
at 1
.04
µm)
Wavelength (µm)
LickSW model: SanCarlos olv (385 µm) + 0% npFe0
0.012% npFe0
(φ de = 0.045 µm)
Figure 7.13: Fit of Lick spectrum using Hapke space weathering model (small metallic iron inclu-sions) and San Carlos olivine as starting composition. The volume fraction of nanophase iron isalso given.
The fit (black curve) is improving, but some discrepancies are still present. Note,
however, that the φde product is close to what what found in the UV laser ablation
experiments, i.e. about 0.045 µm (note that φde gives a measure of how red is the
spectrum). Thus, the improvement probably comes from the peculiar combination
of grain size and volume fraction of metallic iron inclusions.
Since discrepancies between observed and fit curves are only partially explained
by a space weathering effect, we need to explore the possibility of a compositional
effect. Spectral mismatch could be explained by the presence of other components,
such as clinopyroxene. However, putting clinopyroxene in the scattering models does
not help improving the fit. The same thing holds for orthopyroxene.
The mineralogy of Lick has been shown to be pretty close to the one of the
Brachina meteorite (de Leon et al., 2004). This meteorite, that gives the name to the
Brachinites group, is very rich in olivine (about 80%) but it also includes plagioclase,
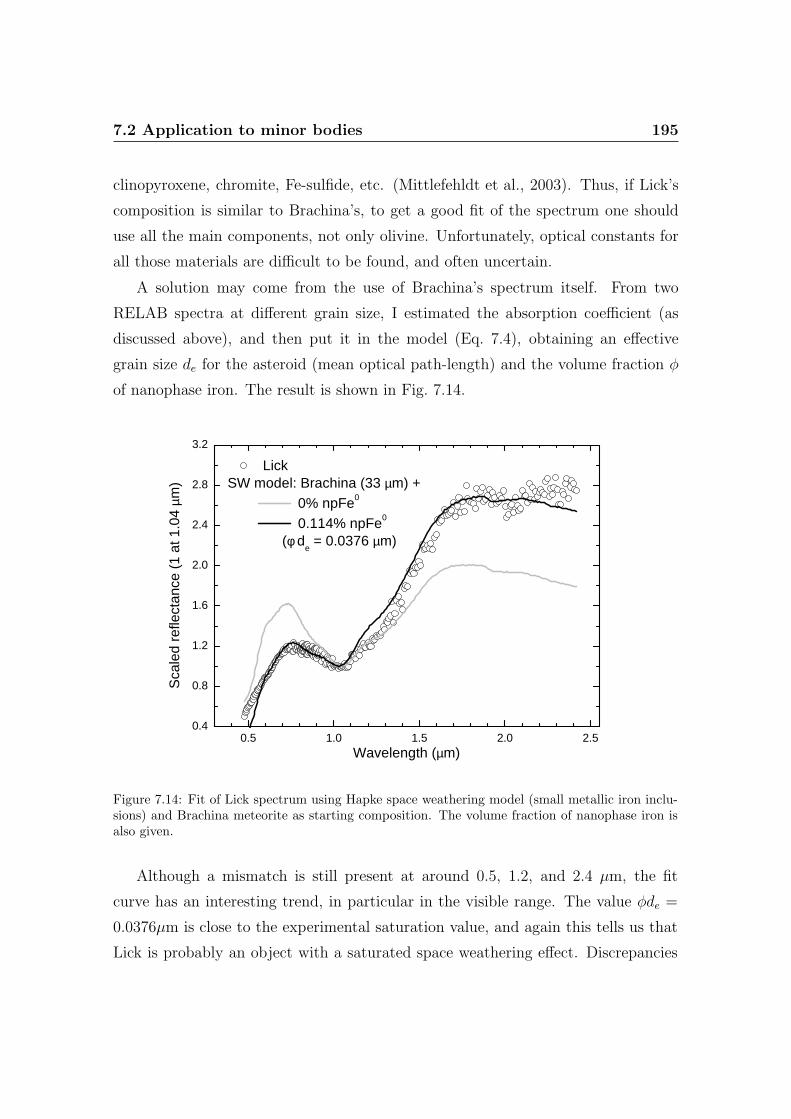
7.2 Application to minor bodies 195
clinopyroxene, chromite, Fe-sulfide, etc. (Mittlefehldt et al., 2003). Thus, if Lick’s
composition is similar to Brachina’s, to get a good fit of the spectrum one should
use all the main components, not only olivine. Unfortunately, optical constants for
all those materials are difficult to be found, and often uncertain.
A solution may come from the use of Brachina’s spectrum itself. From two
RELAB spectra at different grain size, I estimated the absorption coefficient (as
discussed above), and then put it in the model (Eq. 7.4), obtaining an effective
grain size de for the asteroid (mean optical path-length) and the volume fraction φ
of nanophase iron. The result is shown in Fig. 7.14.
0.5 1.0 1.5 2.0 2.50.4
0.8
1.2
1.6
2.0
2.4
2.8
3.2
Sca
led
refle
ctan
ce (
1 at
1.0
4 µm
)
Wavelength (µm)
LickSW model: Brachina (33 µm) + 0% npFe0
0.114% npFe0
(φ de = 0.0376 µm)
Figure 7.14: Fit of Lick spectrum using Hapke space weathering model (small metallic iron inclu-sions) and Brachina meteorite as starting composition. The volume fraction of nanophase iron isalso given.
Although a mismatch is still present at around 0.5, 1.2, and 2.4 µm, the fit
curve has an interesting trend, in particular in the visible range. The value φde =
0.0376µm is close to the experimental saturation value, and again this tells us that
Lick is probably an object with a saturated space weathering effect. Discrepancies
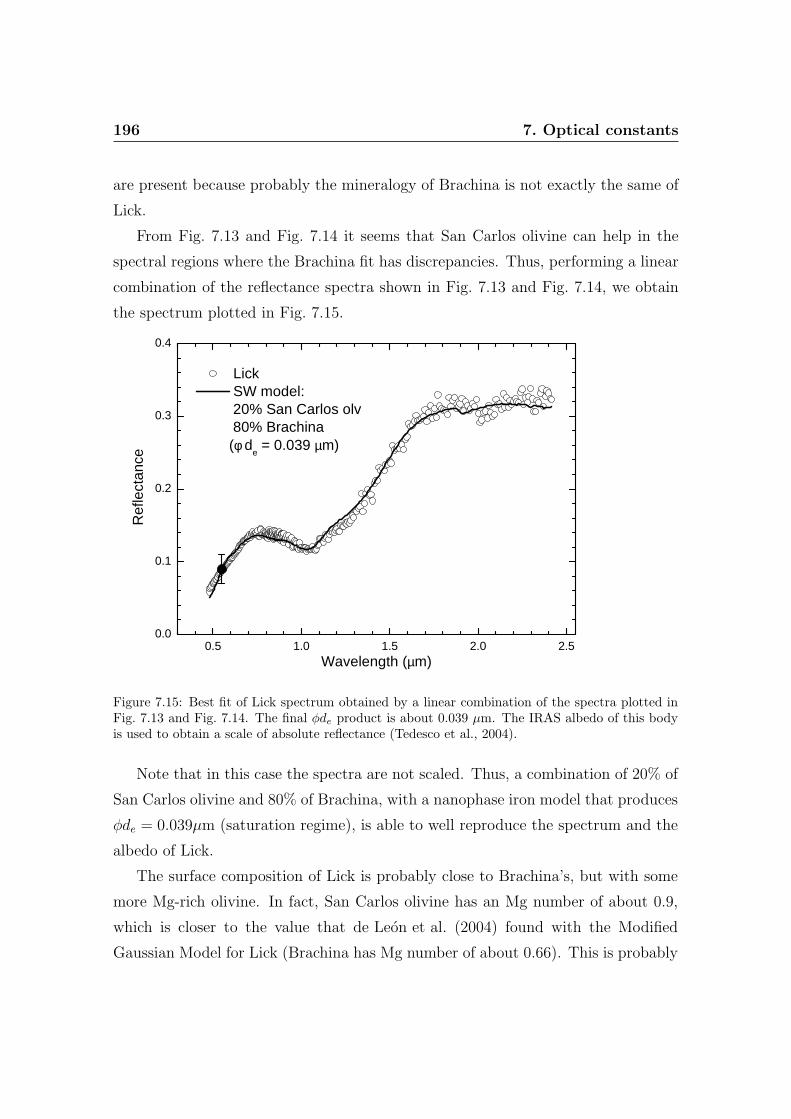
196 7. Optical constants
are present because probably the mineralogy of Brachina is not exactly the same of
Lick.
From Fig. 7.13 and Fig. 7.14 it seems that San Carlos olivine can help in the
spectral regions where the Brachina fit has discrepancies. Thus, performing a linear
combination of the reflectance spectra shown in Fig. 7.13 and Fig. 7.14, we obtain
the spectrum plotted in Fig. 7.15.
0.5 1.0 1.5 2.0 2.50.0
0.1
0.2
0.3
0.4
Ref
lect
ance
Wavelength (µm)
Lick SW model:
20% San Carlos olv 80% Brachina (φ d
e = 0.039 µm)
Figure 7.15: Best fit of Lick spectrum obtained by a linear combination of the spectra plotted inFig. 7.13 and Fig. 7.14. The final φde product is about 0.039 µm. The IRAS albedo of this bodyis used to obtain a scale of absolute reflectance (Tedesco et al., 2004).
Note that in this case the spectra are not scaled. Thus, a combination of 20% of
San Carlos olivine and 80% of Brachina, with a nanophase iron model that produces
φde = 0.039µm (saturation regime), is able to well reproduce the spectrum and the
albedo of Lick.
The surface composition of Lick is probably close to Brachina’s, but with some
more Mg-rich olivine. In fact, San Carlos olivine has an Mg number of about 0.9,
which is closer to the value that de Leon et al. (2004) found with the Modified
Gaussian Model for Lick (Brachina has Mg number of about 0.66). This is probably
7.2 Application to minor bodies 197
the reason why using a combination of San Carlos olivine and Brachina gives a good
fit. Thus, the mismatch shown in the previous figures was due to a compositional
effect.
The nanophase iron model for Lick produces φde = 0.039µm, similar to what
Brunetto et al. (2007) found for laser ablated olivine. It is interesting to note
that, on the contrary, the product φde obtained for ortho- and clinopyroxene by
Brunetto et al. (2007) was about 0.02 µm. This is actually nearly identical to what
Hiroi et al. (2006) found for the dark and red areas on asteroid Itokawa, whose com-
position is much more pyroxene-rich than Lick. This indicates that the laboratory
experiments are a good simulation of the asteroidal space weathering, at any regime.
An additional confirmation of the saturation regime comes from the comparison
with the results of Brunetto et al. (2006b); in the previous chapter it was shown that
computing the ratio between spectra of weathered and unweathered materials, the
contribution of silicate bands almost disappears, and a continuum curve is left, that
is related to the exposure to space weathering. This continuum is parameterized by
a CS coefficient, related to the exposure time. Since we estimated the composition of
Lick, from the results shown in Fig. 7.15 one can derive a value of CS ∼ −0.7µm for
Lick. From the results of Brunetto et al. (2006b), this value is close to the saturation
regime. As a comparison, the recently rejuvenated asteroid 832 Karin has a value
of CS ∼ −0.2µm (as discussed above).
The surface of Lick is extremely weathered; this may give information about
surface age and history, in particular about the lack of resurfacing events. Further
investigation is required in terms of collisional evolution and impact events.
In conclusion, the value φde = 0.039µm found in the best fit of Lick indicates
that the weathering process active on silicate-rich asteroids is properly simulated by
experiments described in this thesis, and that the presence of a saturation regime
(observed in the laboratory) is the correct interpretation for an asteroid surface
probably older than about 107-108 years (as discussed in the previous chapters about
space weathering timescales).

198 7. Optical constants
Acknowledgments
J. de Leon, J. Licandro, and T. Roush are warmly acknowledged for help and
suggestions. This research was supported by Istituto Nazionale di Astrofisica (INAF)
and by Isaac Newton Group of Telescopes (ING).
Conclusions
In this PhD Thesis, I focused on the space weathering processes on Solar System
minor bodies, using mainly laboratory results, and applying them to observations
through spectral models.
To simulate space weathering, I have used nano-pulsed UV laser irradiation and
ablation to simulate micro-meteorite impacts, and ion irradiation to simulate cosmic
ion irradiation, in the Lecce and Catania Laboratories. Weathered silicates, ices, and
carbons, have been studied mainly using transmission and reflection spectroscopy
in the UV-Vis-IR range.
The main experimental results are:
1. laser and ion processing of a large number of silicate-rich samples (terrestrial
and meteoritic) induce a substantial decrease of the spectral reflectance (darkening),
mainly in the UV-Vis range (reddening); this process is highly efficient, and is
probably caused by the formation of nanophase metallic iron inclusions in the surface
grains;
2. ion irradiation of carbon-rich ices (such as CH3OH, CH4, C6H6) causes a strong
variation of the chemical composition, with a preferential loss of H and O that drives
the carbonization of the samples; this induces spectral reddening and darkening,
related to the destruction of the original molecules and consequent production of a
stable carbonaceous residue, even when these ices are mixed with H2O;
3. optical constants of some of these processed materials have been estimated;
they have been and will be used in the spectral models.
From the comparison between laboratory data and observations of minor bodies,
the following results have been obtained:
200 Conclusions
4. the spectral reddening of silicates is able to reproduce the observed spectral
slopes for Near-Earth and Main Belt asteroids; consequently, it is possible to explain
the spectral mismatch between the most abundant meteorites (ordinary chondrites)
and their presumed parent bodies (S-type asteroids);
5. the astrophysical timescales (between the Earth orbit and the Main Belt) for
the reddening of S-type asteroids has been estimated to be about 105-106 years; this
also suggests a relatively high efficiency for the rejuvenating processes (e.g. impacts)
that oppose to the spectral reddening;
6. the spectra of residues (produced after irradiation of ices) explain the spectral
variety of minor bodies in the outer Solar System (centaurs, Kuiper Belt or Trans-
Neptunian objects, comets) and indicate the presence of a surface mantle composed
of organic refractory materials in the majority of these bodies;
In addition, for some peculiar bodies I have performed a more detailed analysis
(thanks to several collaborations), with the following results:
7. I have developed a space weathering model that, using the optical constants of
silicates, allows to estimate the surface composition of asteroids and their weathering
level; application of this model to asteroid 832 Karin showed that the irradiation
timescales that we estimate for this body are in agreement with the age of the impact
that rejuvenated the surface about 5.8×10⁶ years ago.
8. I have applied the space weathering models to two peculiar objects, i.e.
asteroid 1951 Lick and centaur 5145 Pholus, showing that the experimental results
correctly simulate the reddening of silicates, even in a saturation regime or when
silicates are mixed with ices and organic materials.
Finally, it must be stressed that this thesis provides useful laboratory and the-
oretical tools as a support for new observations collected with modern telescopes
and space missions, that help us to understand the origin and evolution of the Solar
System.
Bibliography
Acuna, M.H., and 19 colleagues, 1998. Magnetic Field and Plasma Observations at
Mars: Initial Results of the Mars Global Surveyor Mission. Science 279, 1676-1680.
Adams, J.B., and McCord, T.B., 1971. Alteration of Lunar Optical Properties: Age
and Composition Effects. Science 171, 567-571.
Adams, J.B., 1975. Interpretation of visible and near-infrared diffuse reflectance
spectra of pyroxenes and other rock-forming minerals. In: Karr, C. (Ed.), Infrared
and Raman Spectroscopy of Lunar and Terrestrial Minerals. Academic Press, San
Diego, pp. 91-116.
Aharonson, O., Zuber, M.T., Solomon, S.C., 2004. Crustal remanence in an in-
ternally magnetized non-uniform shell: a possible source for Mercury’s magnetic
field?. Earth and Planetary Science Letters 218, 261-268.
Andronico, G., Baratta, G.A., Spinella, F., Strazzulla, G., 1987. Optical evolution
of laboratory-produced organics: applications to Phoebe, Iapetus and outer belt
asteroids. Astron. Astrophys. 184, 333-336.
Baratta, G.A., Leto, G., Palumbo, M.E., 2002. A comparison of ion irradiation and
UV photolysis of CH4 and CH3OH. Astron. Astrophys. 384, 343-349.
Baratta, G.A., Mennella, V., Brucato, J.R., Colangeli, L., Leto, G., Palumbo, M.E.,
Strazzulla, G., 2004. Raman spectroscopy of ion-irradiated interplanetary carbon
dust analogues. J. Raman Spectrosc. 35, 487-496.
202 BIBLIOGRAPHY
Barucci, M.A., Fulchignoni, M., Birlan, M., Doressoundiram, A., Romon, J., Boehn-
hardt, H., 2001. Analysis of trans-neptunian and Centaur colours: continuous
trend or grouping? Astron. Astrophys. 371, 1150-1154.
Barucci, M.A., and 19 colleagues, 2002. Visible and near-infrared spectroscopy of
the Centaur 32532 (2001 PT13). ESO Large Program on TNOs and Centaurs:
First spectroscopy results. Astron. Astrophys. 392, 335-339.
Barucci, M.A., Cruikshank, D.P., Dotto, E., Merlin, F., Poulet, F., Dalle Ore, C.,
Fornasier, S., de Bergh, C., 2005. Is Sedna another Triton? Astron. Astrophys.
439, L1-L4.
Barucci, M. A., and Peixinho, N., 2005. TransNeptunian objects’ surface properties.
In Proc. IAU Symp. 229, Asteroids, Comets, Meteors, ed. D. Lazzaro, S. Ferraz-
Mello, & J. A. Fernandez (Cambridge: Cambridge Univ. Press), 171-190.
Bauer, J.M., Roush, T.L. T.R. Geballe, T.C. Owen, K.J. Meech, W.D. Vacca, and
J.T. Rayner, 2002. The near infrared spectrum of Miranda: Evidence for crys-
talline water ice. Icarus 158, 178-190.
Bauerle, D., 2000. Laser Processing and Chemistry. Third ed. Springer-Verlag,
Berlin.
Bell, J.F., Hawke, B.R., Owensby, P.D., Gaffey, M.J., 1985. The 52-Color Aster-
oid Survey: Results and Interpretation. Bulletin of the American Astronomical
Society 17, 729.
Bentley, M.S., 2005. Space weathering on Mercury: Laboratory studies and mod-
elling. Ph.D. Thesis.
Bentley, M.S., Ball, A.J., Dyar, M.D., Pieters, C.M., Wright, I.P., Zarnecki, J.C.,
2005. Space Weathering: Laboratory Analyses and In-Situ Instrumentation. 36th
Annual Lunar and Planetary Science Conference 36, 2255.
BIBLIOGRAPHY 203
Binzel, R.P., Bus, S.J., Burbine, T.H., Sunshine, J.M., 1996. Spectral properties
of near Earth asteroids: evidence for sources of ordinary chondrite meteorites.
Science 273, 946-948.
Binzel, R.P., Birlan, M., Bus, S.J., Harris, A.W., Rivkin, A.S., Fornasier, S.,
2004. Spectral observations for near-Earth objects including potential target 4660
Nereus: Results from Meudon remote observations at the NASA Infrared Tele-
scope Facility (IRTF). Planet. Space Sci. 52, 291-296.
Binzel, R.P., Rivkin, A.S., Stuart, J.S., Harris, A.W., Bus, S.J., Burbine, T.H.,
2004. Observed spectral properties of near-Earth objects: results for population
distribution, source regions, and space weathering processes. Icarus 170, 259-294.
Boehnhardt, H., and 21 colleagues, 2003. Results from the Eso Large Program on
Transneptunian Objects and Centaurs. Earth Moon and Planets 92, 145-156.
Bohn, R.B., Sandford, S.A., Allamandola, L.J., Cruikshank, D.P., 1994. Infrared
spectroscopy of Triton and Pluto ice analogs: the case for saturated hydrocarbons.
Icarus 111, 151-173.
Boogert, A.C.A., Schutte, W.A., Tielens, A.G.G.M., Whittet, D.C.B., Helmich,
F.P., Ehrenfreund, P., Wesselius, P.R., de Graauw, T., Prusti, T., 1996. Solid
methane toward deeply embedded protostars. Astron. Astrophys. 315, L377-L380.
Boogert, A.C.A., Helmich, F.P., Schutte, W.A., Tielens, A.G.G.M., Wooden, D.H.,
1997. Infrared observations and laboratory simulations of interstellar CH4 and
SO2. Astron. Astrophys. 317, 929-941.
Bottke, W.F., Durda, D.D., Nesvorny, D., Jedicke, R., Morbidelli, A., Vokrouhlicky,
D., Levison, H., 2005. The fossilized size distribution of the main asteroid belt.
Icarus 175, 111-140.
Bottke, W.F., Nesvorny, D., Grimm, R.E., Morbidelli, A., O’Brien, D.P., 2006. Iron
meteorites as remnants of planetesimals formed in the terrestrial planet region.
Nature 439, 821-824.
204 BIBLIOGRAPHY
Brucato, J.R., Palumbo, M.E., Strazzulla, G., 1997. Carbonic Acid by Ion Implan-
tation in Water/Carbon Dioxide Ice Mixtures. Icarus 125, 135-144.
Brucato, J.R., Strazzulla, G., Baratta, G., Colangeli, L., 2004. Forsterite amorphiza-
tion by ion irradiation: Monitoring by infrared spectroscopy. Astron. Astrophys.
413, 395-401.
Brunetto, R., Baratta, G.A., Strazzulla, G., 2004. Raman spectroscopy of ion irra-
diated diamond. J. Appl. Phys. 96, 380-386.
Brunetto, R., Baratta, G.A., Domingo, M., Strazzulla, G., 2005a. Reflectance and
transmittance spectra (2.2-2.4 µm) of ion irradiated frozen methanol. Icarus 175,
226-232.
Brunetto, R., Baratta, G.A., Strazzulla, G., 2005b. Amorphization of diamond by
ion irradiation: A Raman study. J. Phys. Conf. Ser. 6, 120-125.
Brunetto, R., and Strazzulla, G., 2005. Elastic collisions in ion irradiation experi-
ments: a mechanism for space weathering of silicates. Icarus 179, 265-273.
Brunetto, R., Romano, F., Blanco, A., Fonti, S., Martino, M., Orofino, V., Verri-
enti, C., 2006a. Space weathering of silicates simulated by nanosecond pulse UV
excimer laser. Icarus 180, 546-554.
Brunetto, R., Vernazza, P., Marchi, S., Birlan, M., Fulchignoni, M., Orofino, V.,
Strazzulla, G., 2006b. Modeling asteroid surfaces from observations and irradia-
tion experiments: The case of 832 Karin. Icarus 184, 327-337.
Brunetto, R., Barucci, M.A., Dotto, E., Strazzulla, G., 2006c. Ion Irradiation of
Frozen Methanol, Methane, and Benzene: Linking to the Colors of Centaurs and
Trans-Neptunian Objects. Astrophys. J. 644, 646-650.
Brunetto, R., Roush, T.L., Marra, A.C., Orofino, V., 2007. Optical characterization
of laser ablated silicates. Icarus, submitted.
BIBLIOGRAPHY 205
Burbine, T. H., 2000. Forging Asteroid-Meteorite Relationships Through Reflectance
Spectroscopy. Ph.D. Thesis, Massachusetts Institute of Technology.
Burbine, T.H., Buchanan, P.C., Binzel, R.P., Bus, S.J., Hiroi, T., Hinrichs, J.L.,
Meibom, A., McCoy, T.J., 2001. Vesta, Vestoids, and the howardite, eucrite, dio-
genite group: Relationships and the origin of spectral differences. Meteor. Planet.
Sci. 36, 761-781.
Burbine, T.H., McCoy, T.J., Meibom, A., Gladman, B., Keil, K., 2002. Meteoritic
Parent Bodies: Their Number and Identification. In Asteroids III, ed. W. F.
Bottke Jr. et al. (Tucson: Univ. Arizona Press), 653-667.
Burns, R.G., 1993. Mineralogical Applications of Crystal Field Theory, 2nd edition.
Cambridge Univ. Press, Cambridge.
Bus, S.J., 1999. Compositional Structure in the Asteroid Belt: Results of a Spec-
troscopic Survey. Ph.D. Thesis, Massachusetts Institute of Technology.
Bus, S.J., and Binzel, R.P., 2002a. Phase II of the Small Main-Belt Asteroid Spec-
troscopic Survey The Observations. Icarus 158, 106-145.
Bus, S.J., and Binzel, R.P., 2002b. Phase II of the Small Main-Belt Asteroid Spec-
troscopic Survey A Feature-Based Taxonomy. Icarus 158, 146-177.
Carruba, V., Michtchenko, T.A., Roig, F., Ferraz-Mello, S., Nesvorny, D., 2005. On
the V-type asteroids outside the Vesta family. I. Interplay of nonlinear secular
resonances and the Yarkovsky effect: the cases of 956 Elisa and 809 Lundia.
Astron. Astrophys. 441, 819-829.
Cassidy, W., Hapke, B., 1975. Effects of darkening processes on surfaces of airless
bodies. Icarus 25, 371-383.
Chapman, C.R., 1996. S-type asteroids, ordinary chondrites, and space weathering:
The evidence from Galileo’s fly-by of Gaspra and Ida. Meteorit. Planet. Sci. 31,
699-725.
206 BIBLIOGRAPHY
Chapman, C.R., 2004. Space Weathering of Asteroid Surfaces. Annual Review of
Earth and Planetary Sciences 32, 539-567.
Chrisey, D.B., and Hubler, C.K. (Eds.), 1994. Pulsed Laser Deposition of Thin
Films. Wiley, New York.
Cisowski, S.M., 1991. Remanent magnetic properties of unbrecciated eucrites. Earth
and Planetary Science Letters 107, 173-181.
Clark, B.E., and 11 colleagues, 2001. Space weathering on Eros: Constraints from
albedo and spectral measurements of Psyche crater. Meteorit. Planet. Sci. 36,
1617-1637.
Clark, B.E., Hapke, B., Pieters, C., Britt, D., 2002. Asteroid space weathering and
regolith evolution. Asteroids III, W. F. Bottke Jr., A. Cellino, P. Paolicchi, and
R. P. Binzel (eds), University of Arizona Press, Tucson, 585-599.
Clark, B.E., Bus, S.J., Rivkin, A.S., Shepard, M.K., Shah, S., 2004. Spectroscopy
of X-Type Asteroids. Astron. J. 128, 3070-3081.
Clark, R.N., and Roush, T. L. 1984. Reflectance spectroscopy: Quantitative analysis
techniques for remote sensing applications, J. Geophys. Res. 89, 6329-6340.
Clark, R.N., Swayze, G.A., Wise, R., Livo, K.E., Hoefen, T.M., Kokaly, R.F., Sutley,
S.J., 2003. USGS Digital Spectral Library splib05a. USGS Open File Report, 03-
395.
Collinson, D.W., and Morden, S.J., 1994. Magnetic properties of howardite, eu-
crite and diogenite (HED) meteorites: Ancient magnetizing fields and meteorite
evolution. Earth and Planetary Science Letters 126, 421-434.
Conel, J.E., and Nash, D.B., 1970. Spectral reflectance and albedo of Apollo 11 lunar
samples: Effects of irradiation and vitrification and comparison with telescopic
observations. Geochimica et Cosmochimica Acta Supplement 1, 2013.
BIBLIOGRAPHY 207
Coustenis, A., Schmitt, B., Khanna, R.K., Trotta, F., 1999. Plausible condensates
in Titan’s stratosphere from Voyager infrared spectra. Planet. Space Sci. 47, 1305-
1329.
Cruikshank, D.P., and Hartmann, W.K., 1984. The meteorite-asteroid connection -
Two olivine-rich asteroids. Science 223, 281-283.
Cruikshank, D.P., Roush, T.L., Owen, T.C., Geballe, T.R., de Berg, C., Schmitt,
B., Brown, R.H., Bartholomew, M.J., 1993. Ices on the surface of Triton. Science
261, 742-745.
Cruikshank, D.P., Roush, T.L., Moore, J.M., Sykes, M.V., Owen, T.C.,
Bartholomew, M.J., Brown, R.H., and Tryka, K.A., 1997. The Surfaces of Pluto
and Charon, in Pluto and Charon, S.A. Stern, and D.J. Tholen (Eds.), Univ.
Arizona Press, Tucson, AZ, 221-267.
Cruikshank, D.P., and 14 colleagues, 1998. The Composition of Centaur 5145 Pho-
lus. Icarus 135, 389-407.
Cruikshank, D.P., Roush, T.L., Poulet, F., 2003. Quantitative modeling of the spec-
tral reflectance of Kuiper belt objects and Centaurs. C. R. Phys. 4, 783-789.
Cruikshank, D.P., Owen, T.C., Ore, C.D., Geballe, T.R., Roush, T.L., de Bergh,
C., Sandford, S.A., Poulet, F., Benedix, G.K., Emery, J.P., 2005. A spectroscopic
study of the surfaces of Saturn’s large satellites: H2O ice, tholins, and minor
constituents. Icarus 175, 268-283.
Dartois, E., Schutte, W.A., Geballe, T.R., Demyk, K., Ehrenfreund, P.,
D’Hendecourt, L., 1999. Methanol: the second most abundant ice species to-
wards the high mass protostars RAFGL7009S and W 33A. Astron. Astrophys.
342, L32-L35.
de Bergh, C., Delsanti, A., Tozzi, G.P., Dotto, E., Doressoundiram, A., Barucci,
M.A., 2005. The surface of the transneptunian object 90482 Orcus. Astron. As-
trophys. 437, 1115-1120.
208 BIBLIOGRAPHY
de Leon, J., Duffard, R., Licandro, J., Lazzaro, D., 2004. Mineralogical characteri-
zation of A-type asteroid (1951) Lick. Astron. Astrophys. 422, L59-L62.
Demyk, K., Carrez, Ph., Leroux, H., Cordier, P., Jones, A.P., Borg, J., Quirico,
E., Raynal, P.I., d’Hendecourt, L., 2001. Structural and chemical alteration of
crystalline olivine under low energy He+ irradiation. Astron. Astrophys. 368, L38-
L41.
Doressoundiram, A., Barucci, M.A., Fulchignoni, M., Florczak, M., 1998. EOS fam-
ily: a spectroscopic study. Icarus 131, 15-31.
Doressoundiram, A., Peixinho, N., de Bergh, C., Fornasier, S., Thbault, P., Barucci,
M.A., Veillet, C., 2002. The color distribution in the Edgeworth-Kuiper Belt.
Astron. J. 124, 2279-2296.
Dorschner, J., Begemann, B., Henning, T., Jaeger, C., Mutschke, H., 1995. Steps to-
ward interstellar silicate mineralogy. II. Study of Mg-Fe-silicate glasses of variable
composition. Astron. Astrophys. 300, 503.
Doute, S., Schmitt, B., Quirico, E., Owen, T.C., Cruikshank, D.P., de Berg, C.,
Geballe, T.R., Roush, T.L., 1999. Evidence for methane segregation at the surface
of Pluto. Icarus 142, 421-444.
Drake, M.J., 2001. The eucrite/Vesta story. Meteor. Planet. Sci. 36, 501-513.
Dukes, C.A., Baragiola, R.A., McFadden, L.A., 1999. Surface modification of olivine
by H+ and He+ bombardment. J. Geophys. Res. 104, 1865-1872.
Ferini, G., Baratta, G.A., Palumbo, M.E., 2004. A Raman study of ion irradiated
icy mixtures. Astron. Astrophys. 414, 757-766.
Florczak, M., Barucci, M.A., Doressoundiram, A., Lazzaro, D., Angeli, C.A., Dotto,
E., 1998. A visible spectroscopic survey of the Flora Clan. Icarus 133, 233-246.
Fornasier, S., Dotto, E., Barucci, M.A., Barbieri, C., 2004. Water ice on the surface
of the large TNO 2004 DW. Astron. Astrophys. 422, L43-L46.
BIBLIOGRAPHY 209
Foti, G., Calcagno, L., Sheng, K.L., Strazzulla, G., 1984. Micrometre-sized polymer
layers synthesized by MeV ions impinging on frozen methane. Nature 310, 126-
128.
Gaffey, M.J., 1983. The Asteroid (4) Vesta: Rotational Spectral Variations, Surface
Material Heterogeneity, and Implications for the Origin of the Basaltic Achon-
drites. Lunar and Planetary Institute Conference Abstracts 14, 231-232.
Gaffey, M.J., Bell, J.F., Cruikshank, D.P., 1989. Reflectance spectroscopy and as-
teroid surface mineralogy. In: Binzel, R.P., Gehrels, T., Matthews, M.S. (Eds.),
Asteroids II. Univ. of Arizona Press, Tucson, AZ, pp. 98-127.
Gaffey, M.J., Burbine, T.H., Piatek, J.L., Reed, K.L., Chaky, D.A., Bell, J.F.,
Brown, R.H., 1993. Mineralogical variations within the S-type asteroid class.
Icarus 106, 573-602.
Gattacceca, J., and Rochette, P., 2004. Toward a robust normalized magnetic pa-
leointensity method applied to meteorites. Earth and Planetary Science Letters
227, 377-393.
Gilabert, E., and Lavielle, B., 2001. Noble gas exposure ages of the French chondrite
falls. In: 64th Ann. Metor. Soc. Meeting. Abstract #5358.
Gilabert, E., Lavielle, B., 2002. Collisional history of the French chondrite falls. In:
65th Ann. Metor. Soc. Meeting. Abstract #5217.
Greenstadt, E.W., 1971. Conditions for Magnetic Interaction of Asteroids with the
Solar Wind. Icarus 14, 374.
Guyot, F., Boyer, H., Madon, M., Velde, B., Poirier, J.P., 1986. Comparison of
the Raman microprobe spectra of (Mg, Fe)2SiO4 and Mg2GeO4 with olivine and
spinel structures. Phys. Chem. Miner. 13, 91-95.
Hapke, B., 1981. Bidirectional reflectance spectroscopy. 1. Theory. J. Geophys. Res.
86, 3039-3054.
210 BIBLIOGRAPHY
Hapke, B., 1986. Bidirectional reflectance spectroscopy 4: Extinction and the oppo-
sition effect, Icarus 67, 264-280.
Hapke, B., 1993. Combined theory of reflectance and emittance spectroscopy. In:
Pieters, C.M., Englert, P.A.J. (Eds.), Remote Geochemical Analysis: Elemental
and Mineralogical Composition. Cambridge Univ. Press, New York, pp. 31-42.
Hapke, B., 2001. Space weathering from Mercury to the asteroid belt. J. Geophys.
Res. 106 (E5), 10039-10073.
Hapke, B., and Wells, E., 1981. Bidirectional reflectance spectroscopy 2: Experi-
ments and observations, J. Geophys. Res. 96, 3055-3060.
Hardersen, P.S., Gaffey, M.J., Abell, P.A., 2005. Near-IR spectral evidence for the
presence of iron-poor orthopyroxenes on the surfaces of six M-type asteroids.
Icarus 175, 141-158.
Hiroi, T., and Sasaki, S., 2001. Importance of space weathering simulation products
in compositional modeling of asteroids: 349 Dembowska and 446 Aeternitas as
examples. Meteorit. Planet. Sci. 36, 1587-1596.
Hiroi, T., Moroz, L.V., Shingareva, T.V., Basilevsky, A.T., Pieters, C.M., 2003. Ef-
fects of Microsecond Pulse Laser Irradiation on Vis-NIR Reflectance Spectrum of
Carbonaceous Chondrite Simulant: Implications for Martian Moons and Primitive
Asteroids. Lunar and Planetary Institute Conference Abstracts 34, 1324.
Hiroi, T., Pieters, C.M., Rutherford, M.J., Zolensky, M.E., Sasaki, S., Ueda, Y.,
Miyamoto, M., 2004. What are the P-type Asteroids Made Of? Lunar and Plan-
etary Institute Conference Abstracts 35, 1616.
Hiroi, T., Abe, M., Kitazato, K., Abe, S., Clark, B.E., Sasaki, S., Ishiguro, M.,
Barnouin-Jha, O.S., 2006. Developing space weathering on the asteroid 25143
Itokawa. Nature 443, 56-58.
Hsieh, H.H., and Jewitt, D., 2006. A Population of Comets in the Main Asteroid
Belt. Science 312, 561-563.
BIBLIOGRAPHY 211
Huang, E., Chen, C.H., Huang, T., Lin, E.H., Xu, J., 2000. Raman spectroscopic
characteristics of Mg-Fe-Ca pyroxenes. Am. Mineral. 85, 473-479.
Hudson, R.L., and Moore, M.H., 2000. IR spectra of irradiated cometary ice ana-
logues containing methanol: a new assignment, a reassignment, and a nonassign-
ment. Icarus 145, 661-663.
IAU 2006 General Assembly: Resolutions 5 (Definition of a Planet in the Solar
System) and 6 (Pluto), IAU, 24 August 2006.
Jager, C., Fabian, D., Schrempel, F., Dorschner, J., Henning, Th., Wesch, W., 2003.
Structural processing of enstatite by ion bombardment. Astron. Astrophys. 401,
57-65.
Jedicke, R., Nesvorny, D., Whiteley, R., Ivezic, Z., Juric, M., 2004. An age-color
relationship for Main-Belt S-complex asteroids. Nature 429, 275-277.
Jewitt, D.C., 2002. From Kuiper Belt Object to Cometary Nucleus: The Missing
Ultrared Matter. Astron. J. 123, 1039-1049.
Jewitt, D.C., and Luu, J., 2004. Crystalline water ice on the Kuiper belt object
(50000) Quaoar. Nature 432, 731-733.
Johnson, P.B., and Cristy, R.W., 1974. Optical constants of metals: Ti, V, Cr, Mn,
Fe, Co, Ni, and Pd. Phys. Rev. B. 9, 5056-5070.
Johnson, R.E., Cooper, J.F., Lanzerotti, L.J., Strazzulla, G., 1987. Radiation For-
mation of a Non-Volatile Comet Crust. Astron. Astrophys. 187, 889.
Johnson, R.E., 1998. Sputtering and Desorption from Icy Surfaces. In: B. Schmitt,
C. de Bergh (Eds.), Solar System Ices, Kluwer Netherlands, Dordrecht, p. 303.
Johnson, T.V., and Fanale, F.P., 1973. Optical properties of carbonaceous chondrites
and their relationship to asteroids. J. Geophys. Res. 78, 8507-8518.
212 BIBLIOGRAPHY
Jull, A.J.T., Wilson, G.C., Long, J.V.P., Reed, S.J.B., Pillinger, C.T., 1980. Sput-
tering rates of minerals and implications for abundances of solar elements in lunar
samples. Nucl. Instrum. Methods 168, 357-365.
Kachurin, G.A., Tyschenko, I.E., Zhuravlev, K.S., Pazdnikov, N.A., Volodin, V.A.,
Gutakovsky, A.K., Leier, A.F., Skorupa, W., Yankov, R.A., 1997. Visible and
near-infrared luminescence from silicon nanostructures formed by ion implantation
and pulse annealing. Nucl. Instrum. Methods Phys. Res. B 122, 571-574.
Keane, J.V., Tielens, A.G.G.M., Boogert, A.C.A., Schutte, W.A., Whittet, D.C.B.,
2001. Ice absorption features in the 5-8 µm region toward embedded protostars.
Astron. Astrophys. 376, 254-270.
Keil, K., 2002. Geological History of Asteroid 4 Vesta: The “Smallest Terrestrial
Planet”. Asteroids III 573-584.
Khare, B.N., Sagan, C., Arakawa, E.T., Suits, F., Callcott, T.A., Williams, M.W.,
1984a. Optical constants of organic tholins produced in a simulated Titanian
atmosphere - From soft X-ray to microwave frequencies. Icarus 60, 127-137.
Khare, B.N., and 10 colleagues, 1984b. The organic aerosols of Titan. Advances in
Space Research 4, 59-68.
Khomenkova, L., Korsunska, N., Torchynska, T., Yukhimchuk, V., Jumayev, B.,
Many, A., Goldstein, Y., Savir, E., Jedrzejewski, J., 2002. Defect-related lumines-
cence of Si/SiO2 layers. J. Phys. Condens. Matter 14, 13217-13221.
Killen, R.M., Potter, A.E., Reiff, P., Sarantos, M., Jackson, B.V., Hick, P., Giles,
B., 2001. Evidence for space weather at Mercury. J. Geophys. Res. 106 (E9),
20509-20526.
Knezevic, Z., and Milani, A., 2003. Proper element catalogs and asteroid families.
Astron. Astrophys. 403, 1165-1173.
BIBLIOGRAPHY 213
Lacy, J.H., Carr, J.S., Evans Neal II, J., Baas, F., Achtermann, J.M., Arens, J.F.,
1991. Discovery of interstellar methane. Observations of gaseous and solid CH4
absorption toward young stars in molecular clouds. Astrophys. J. 376, 556-560.
Lagerkvist, C.I., Moroz, L., Nathues, A., Erikson, A., Lahulla, F., Karlsson, O.,
Dahlgren, M., 2005. A study of Cybele asteroids. Astron. Astrophys. 432, 349-
354.
Lazzarin, M., di Martino, M., Barucci, M.A., Doressoundiram, A., Florczak, M.,
1997. Compositional properties of Near-Earth Asteroids: spectroscopic compari-
son with Ordinary Chondrite Meteorites. Astron. Astrophys. 327, 388-391.
Lazzarin, M., Marchi, S., Barucci, M.A., Di Martino, M., Barbieri, C., 2004. Visible
and near-infrared spectroscopic investigation of near-Earth objects at ESO: First
results. Icarus 169, 373-384.
Lazzarin, M., Marchi, S., Magrin, S., Licandro, J., 2005. Spectroscopic investigation
of near-Earth objects at Telescopio Nazionale Galileo. Monthly Notices of the
Royal Astronomical Society 359, 1575-1582.
Lazzarin, M., Marchi, S., Moroz, L.V., Brunetto, R., Magrin, S., Paolicchi, P., Straz-
zulla, G., 2006. Space Weathering in the Main Asteroid Belt: The Big Picture.
Astrophys. J. 647, L179-L182.
Lazzaro, D., Moth-Diniz, T., Carvano, J.M., Angeli, C.A., Betzler, A.S., Florczak,
M., Cellino, A., Di Martino, M., Doressoundiram, A., Barucci, M.A., Dotto, E.,
Bendjoya, P., 1999. The Eunomia family: a visible spectroscopic survey. Icarus
142, 445-453.
Leto, G., and Baratta, G.A., 2003. Ly-alpha photon induced amorphization of Ic
water ice at 16 Kelvin. Effects and quantitative comparison with ion irradiation.
Astron. Astrophys. 397, 7-13.
Licandro, J., and Pinilla-Alonso, N., 2005. The Inhomogeneous Surface of Centaur
32522 Thereus (2001 PT13). Astrophys. J. 630, L93-L96.
214 BIBLIOGRAPHY
Licandro, J., Pinilla-Alonso, N., Pedani, M., Oliva, E., Tozzi, G.P., Grundy, W.M.,
2006. The methane ice rich surface of large TNO 2005 FY9: a Pluto-twin in the
trans-neptunian belt?. Astron. Astrophys. 445, L35-L38.
Lucey, P.G., 1998. Model near-infrared optical constants of olivine and pyroxene as
a function of iron content. J. Geophys. Res. 103 (E1), 1703-1714.
Luu, J., and Jewitt, D., 1996. Color Diversity Among the Centaurs and Kuiper Belt
Objects. Astron. J. 112, 2310.
Luu, J.X., Jewitt, D.C., Trujillo, C., 2000. Water Ice in 2060 Chiron and Its Impli-
cations for Centaurs and Kuiper Belt Objects. Astrophys. J. 531, L151-L154.
Marchi, S., Brunetto, R., Magrin, S., Lazzarin, M., Gandolfi, D., 2005. Space weath-
ering of near-Earth and Main-Belt silicate-rich asteroids: Observations and ion
irradiation experiments. Astron. Astrophys. 443, 769-775.
Marchi, S., Paolicchi, P., Lazzarin, M., Magrin, S., 2006. A general spectral slope-
exposure relation for S-type Main Belt and near-Earth asteroids. Astron. J. 131,
1138-1141.
Marzari, F., Cellino, A., Davis, D.R., Farinella, P., Zappala, V., Vanzani, V., 1996.
Origin and evolution of the Vesta asteroid family. Astron. Astrophys. 316, 248-262.
McCord, T.B., Adams, J.B., Johnson, T.V., 1970. Asteroid Vesta: Spectral Reflec-
tivity and Compositional Implications. Science 168, 1445-1447.
McSween, H.Y., Bennett, M.E., Jarosewich, E., 1991. The mineralogy of ordinary
chondrites and implications for asteroid spectrophotometry. Icarus 90, 107-116.
Mittlefehldt, D.W., Bogard, D.D., Berkley, J.L., Garrison, D.H., 2003. Brachinites:
Igneous rocks from a differentiated asteroid. Meteor. Planet. Sci. 38, 1601-1625.
Moore, M.H., 1999. The physics and chemistry of ices in the interstellar medium.
In: d’Hendecourt, L., Joblin, C., Jones, A. (Eds.), Solid Interstellar Matter: The
ISO Revolution. EDP Sciences, Springer-Verlag, Berlin, pp. 199-218.
BIBLIOGRAPHY 215
Moore, M.H., Hudson, R.L., Ferrante, R.F., 2003. Radiation Products in Processed
Ices Relevant to Edgeworth-Kuiper-Belt Objects. Earth Moon and Planets 92,
291-306.
Moretti, P.F., Maras, A., Palomba, E., Colangeli, L., Girasole, M., Pompeo, G.,
Longo, G., Cricenti, A., Somma, F., Serracino, M., 2005. Detection of Nanostruc-
tured Metal in Meteorites: Implications for the Reddening of Asteroids. Astro-
phys. J. 634, L117-L120.
Moroz, L.V., Fisenko, A.V., Semjonova, L.F., Pieters, C.M., Korotaeva, N.N., 1996.
Optical Effects of Regolith Processes on S-Asteroids as Simulated by Laser Shots
on Ordinary Chondrite and Other Mafic Materials. Icarus 122, 366-382.
Moroz, L.V., Arnold, G., Korochantsev, A.V., Wasch, R., 1998. Natural solid bi-
tumens as possible analogs for cometary and asteroid organics. 1. Reflectance
spectroscopy of pure bitumens. Icarus 134, 253-268.
Moroz, L., Schade, U., Wasch, R., 2000. Reflectance Spectra of Olivine-
Orthopyroxene-Bearing Assemblages at Decreased Temperatures: Implications
for Remote Sensing of Asteroids. Icarus 147, 79-93.
Moroz, L., Baratta, G., Strazzulla, G., Starukhina, L., Dotto, E., Barucci, M.A.,
Arnold, G., Distefano, E., 2004a. Optical alteration of complex organics induced
by ion irradiation: 1. Laboratory experiments suggest unusual space weathering
trend. Icarus 170, 214-228.
Moroz, L.V., Hiroi, T., Shingareva, T.V., Basilevsky, A.T., Fisenko, A.V.,
Semjonova, L.F., Pieters, C.M., 2004b. Reflectance Spectra of CM2 Chondrite
Mighei Irradiated with Pulsed Laser and Implications for Low-Albedo Asteroids
and Martian Moons. Lunar and Planetary Institute Conference Abstracts 35,
1279.
Mumma, M.J., Weissman, P.R., Stern, S.A., 1993. Comets and the origin of the Solar
System: reading the Rosetta stone. In: Levy, E.H., Lunine, J.I., Matthews, M.S.
(Eds.), Protostars and Planets III. Univ. of Arizona Press, Tucson, pp. 1177-1252.
216 BIBLIOGRAPHY
Mumma, M.J., DiSanti, M.A., Dello Russo, N., Fomenkova, M., Magee-Sauer, K.,
Kaminski, C.D., Xie, D.X., 1996. Detection of abundant ethane and methane,
along with carbon monoxide and water, in Comet C/1996 B2 Hyakutake: evidence
for interstellar origin. Science 272, 1310-1314.
Mumma, M.J., DiSanti, M.A., Dello Russo, N., Magee-Sauer, K., Rettig, T.W.,
2000. Detection of CO and ethane in Comet 21P/Giacobini-Zinner: evidence for
variable chemistry in the outer solar nebula. Astrophys. J. 531, L155-L159.
Mumma, M.J., Dello Russo, N., DiSanti, M.A., Magee-Sauer, K., Novak, R.E., Brit-
tain, S.T., Rettig, T.W., Mc Lean, I.S., Reuter, D.C., Xu, Li.-H., 2001. Organic
composition of C/1999 S4 (LINEAR): a comet formed near Jupiter? Science 292,
1334-1339.
Nesvorny, D., and Bottke, W.F., 2004. Detection of the Yarkovsky effect for mainbelt
asteroids. Icarus 170, 324-342.
Nesvorny, D., Bottke,W.F., Dones, L., Levison, H.F., 2002. The recent breakup of
an asteroid in the main-belt region. Nature 417, 720-771.
Nesvorny, D., Jedicke, R., Whiteley, R.J., Ivezic, Z., 2005. Evidence for asteroid
space weathering from the Sloan Digital Sky Survey. Icarus 173, 132-152. (corri-
gendum 177, 291)
Nesvorny, D., Bottke, W.F., Vokrouhlicky, D., Morbidelli, A., Jedicke, R., 2006.
Asteroid families. In IAU Colloq. 229, Asteroids, Comets, Meteors, ed. L. Daniela,
M. Sylvio Ferraz, & F. J. Angel (Cambridge: Cambridge Univ. Press), 289-299.
Omidi, N., Blanco-Cano, X., Russell, C.T., Karimabadi, H., Acuna, M., 2002. Hy-
brid simulations of solar wind interaction with magnetized asteroids: General
characteristics. J. Geophys. Res. (Space Physics) 107, 12-1.
Orofino, V., Politi, R., Blanco, A., Fonti, S., 2006. Diffuse reflectance of altered
olivine grains: Remote sensing detection and implications for Mars studies. Planet.
Space Sci. 54, 784-793.
BIBLIOGRAPHY 217
Owen, T.C., Roush, T.L., Cruikshank, D.P., Elliot, J.L., Young, L.A., de Berg, C.,
Schmitt, B., Geballe, T.R., Brown, R.H., Bartholomew, M.J., 1993. Surface ices
and atmospheric composition of Pluto. Science 261, 745-749.
Palumbo, M.E., Castorina, A.C., Strazzulla, G., 1999. Ion irradiation effects on
frozen methanol. Astron. Astrophys. 342, 551-562.
Palumbo, M.E., and Strazzulla, G., 2003. Nitrogen condensation on water ice. Cana-
dian Journal of Physics 81, 217-224.
Palumbo, M.E., Ferini, G., Baratta, G.A., 2004. Infrared and Raman spectroscopies
of refractory residues left over after ion irradiation of nitrogen-bearing icy mix-
tures. Advances in Space Research 33, 49-56.
Peixinho, N., Boehnhardt, H., Belskaya, I., Doressoundiram, A., Barucci, M.A.,
Delsanti, A., 2004. ESO large program on Centaurs and TNOs: visible colors-
final results. Icarus 170, 153-166.
Pieters, C.M., Fischer, E.M., Rode, O.D., Basu, A., 1993. Optical effects of space
weathering on lunar soils and the role of the finest fraction. J. Geophys. Res. 98,
20817-20824.
Pieters, C.M., Taylor, L.A., Noble, S.K., Keller, L.P., Hapke, B., Morris, R.V.,
Allen, C.C., McKay, D.S.,Wentworth, S., 2000. Space weathering on airless bodies:
Resolving a mystery with lunar samples. Meteorit. Planet. Sci. 35, 1101-1107.
Pollack, J.B., Hollenbach, D., Beckwith, S., Simonelli, D.P., Roush, T., Fong, W.,
1994. Composition and radiative properties of grains in molecular clouds and
accretion disks. Astrophys. J. 421, 615-639.
Poulet, F., Cuzzi, J.N., Cruikshank, D.P., Roush, T., Dalle Ore, C.M. 2002. Com-
parison between the Shkuratov and Hapke Scattering Theories for Solid Planetary
Surfaces: Application to the Surface Composition of Two Centaurs. Icarus 160,
313-324.
218 BIBLIOGRAPHY
Quirico, E., and Schmitt, B., 1997. Near-infrared spectroscopy of simple hydrocar-
bons and carbon oxides diluted in solid N2 and as pure ices: implications for
Triton and Pluto. Icarus 127, 354-378.
Rayner, J.T., Onaka, P.M., Cushing, M.C., Vacca, W.D., 2004. Four years of good
SpeX. In: Moorwood, A.F.M., Masanori, I. (Eds.), Ground Based Instrumentation
for Astronomy. In: Proc. SPIE, vol. 5492. SPIE, Bellingham, WA, pp. 1498-1509.
Richardson, J.E., Melosh, H.J., Greenberg, R., 2004. Impact-induced seismic activity
on Asteroid 433 Eros: A surface modification process. Science 306, 1526-1529.
Richmond, N.C., Hood, L.L., Mitchell, D.L., Lin, R.P., Acuna, M.H., Binder, A.B.,
2005. Correlations between magnetic anomalies and surface geology antipodal to
lunar impact basins. J. Geophys. Res. (Planets) 110, 5011.
Righter, K., Drake, M.J., 1997. A magma ocean on Vesta: Core formation and
petrogenesis of eucrites and diogenites. Meteor. Planet. Sci. 32, 929-944.
Rivkin, A.S., Binzel, R.P., Sunshine, J., Bus, S.J., Burbine, T.H., Saxena, A., 2004.
Infrared spectroscopic observations of 69230 Hermes (1937 UB): possible unweath-
ered endmember among ordinary chondrite analogs. Icarus 172, 408-414.
Rochette, P., Gattacceca, J., Menvielle, M., Eisenlohr, P., Chevrier, V., 2004. Inter-
est and design of magnetic properties measurements on planetary and asteroidal
landers. Planet. Space Sci. 52, 987-995.
Roush, T.L., 1994. Charon: More than water ice? Icarus 108, 243-254.
Roush, T.L., 2003. Estimated optical constants of the Tagish Lake meteorite, Me-
teor. Planet. Sci. 38, 419-426.
Roush, T.L., 2005. Near-infrared (0.67-4.7 µm) optical constants estimated for mont-
morillonite, Icarus 179, 259-264.
BIBLIOGRAPHY 219
Roush, T.L., Pollack, J. B., Witteborn, F. C., Bregman, J. D., and Simpson. J.
P. 1990. Ice and minerals on Callisto: A reassessment of the reflectance spectra,
Icarus 86, 355-382.
Ruzicka, A., Snyder, G.A., Taylor, L.A., 1997. Vesta as the HED Parent Body:
Implications for the Size of a Core and for Large-Scale Differentiation. Meteor.
Planet. Sci. 32, 825-840.
Sasaki, S., Nakamura, K., Hamabe, Y., Kurahashi, E., Hiroi, T., 2001. Produc-
tion of iron nanoparticles by laser irradiation in a simulation of lunar-like space
weathering. Nature 410, 555-557.
Sasaki, T., Sasaki, S., Watanabe, J., Sekiguchi, T., Yoshida, F., Kawakita, H., Fuse,
T., Takato, N., Dermawan, B., Ito, T., 2004. Mature and fresh surfaces on the
newborn Asteroid Karin. Astrophys. J. 615 (2), L161-L164.
Schmitz, B., Haggstrom, T., Tassinari, M., 2003. Sediment-dispersed extraterrestrial
chromite traces a major asteroid disruption event. Science 300 (5621), 961-964.
Shingareva, T.V., Basilevsky, A.T., Fisenko, A.V., Semjonova, L.F., Korotaeva,
N.N., 2004. Mineralogy and Petrology of Laser Irradiated Carbonaceous Chondrite
Mighei. Lunar and Planetary Institute Conference Abstracts 35, 1137.
Shkuratov, Y., Starukhina, L., Hoffmann, H., Arnold, G., 1999. A model of spectral
albedo of particulate surfaces: implications for optical properties of the Moon.
Icarus 137, 235-246.
Shkuratov, Y.G., and Grynko, Y.S., 2005. Light scattering by media composed of
semitransparent particles of different shapes in ray optics approximation: con-
sequences for spectroscopy, photometry, and polarimetry of planetary regoliths.
Icarus 173, 16-28.
Strazzulla, G., and Johnson, R.E., 1991. Irradiation effects on comets and cometary
debris. In: Newburn Jr., R., Neugebauer, M., Rahe, J. (Eds.), Comets in the
Post-Halley Era. Kluwer, Dordrecht, pp. 243-275.
220 BIBLIOGRAPHY
Strazzulla, G., and Baratta, G.A., 1991. Laboratory study of the IR spectrum of
ion-irradiated frozen benzene. Astron. Astrophys. 241, 310-316.
Strazzulla, G., Baratta, G.A., Johnson, R.E., Donn, B., 1991. Primordial comet
mantle - Irradiation production of a stable, organic crust. Icarus 91, 101-104.
Strazzulla, G., 1997. Ion bombardment of comets. In: Pendleton, Y.J., Tielens,
A.G.G.M. (Eds.), From Stardust to Planetesimals. In: ASP Conf. Series, vol.
122. ASP, San Francisco, pp. 423-433.
Strazzulla, G., Baratta, G.A., Palumbo, M.E., 2001. Vibrational spectroscopy of
ion-irradiated ices. Spectrochim. Acta A 57 (4), 825-842.
Strazzulla, G., Leto, G., Gomis, O., Satorre, M.A., 2003a. Implantation of carbon
and nitrogen ions in water ice. Icarus 164, 163-169.
Strazzulla, G., Cooper, J.F., Christian, E.R., Johnson, R.E., 2003b. Ion irradiation
of TNOs: from the fluxes measured in space to the laboratory experiments. C. R.
Phys. 4, 791-801.
Strazzulla, G., Dotto, E., Binzel, R., Brunetto, R., Barucci, M.A., Blanco, A.,
Orofino, V., 2005. Spectral alteration of the meteorite Epinal (H5) induced by
heavy ion irradiation: a simulation of space weathering effects on Near-Earth
Asteroids. Icarus 174, 31-35.
Tedesco, E.F., Noah, P.V., Noah, M., Price, S.D., 2004. IRAS Minor Planet Survey
V6.0. NASA Planetary Data System, IRAS-A-FPA-3-RDR-IMPS-V6.0 12.
Thomas, P.C., Binzel, R.P., Gaffey, M.J., Storrs, A.D., Wells, E.N., Zellner, B.H.,
1997. Impact excavation on asteroid 4 Vesta: Hubble Space Telescope results.
Science 277, 1492-1495.
Ueda, Y., Hiroi, T., Pieters, C.M., Miyamoto, M., 2002a. Changes of Band I center
and Band II/Band I area ratio in reflectance spectra of olivine-pyroxene mixtures
due to the space weathering and grain size effects. Lunar Planet. Sci. XXXIII.
Abstract 2023.
BIBLIOGRAPHY 221
Ueda, Y., Hiroi, T., Pieters, C.M., Miyamoto, M., 2002b. Expanding the modified
Gaussian model to include the space weathering effects: Estimation of the weath-
ering degrees of Pulse-Laser treated olivine samples. Lunar Planet. Sci. XXXIII.
Abstract 1950.
Vernazza, P., Brunetto, R., Strazzulla, G., Fulchignoni, M., Rochette, P., Meyer-
Vernet, N., Zouganelis, I., 2006. Asteroid colors: a novel tool for magnetic field
detection? The case of Vesta. Astron. Astrophys. 451, L43-L46.
Walmsley, C.M., Pineau des Forets, G., Flower, D.R., 1999. Silicon chemistry in
PDRs. Astron. Astrophys. 342, 542-550.
Xu, S., 1994. CCD Photometry and Spectroscopy of Small Main-Belt Asteroids.
Ph.D. Thesis, Massachusetts Institute of Technology
Yamada, M., Sasaki, S., Nagahara, H., Fujiwara, A., Hasegawa, S., Yano, H., Hiroi,
T., Ohashi, H., Otake, H., 1999. Simulation of space weathering of planet-forming
materials: Nanosecond pulse laser irradiation and proton implantation on olivine
and pyroxene samples. Earth Planets Space 51, 1255-1265.
Yoshida, F., and 10 colleagues, 2004. Photometric observations of a very young
family-member Asteroid (832) Karin. Astron. Soc. Jpn. 56, 1105-1113.
Ziegler, J.F., Biersack, J.P., Littmark, U., 1985. The Stopping and Range of Ions in
Solids. Pergamon, Elmsford, NY.
Recommended