Embed Size (px)
Citation preview

UNIVERSITA’ DEGLI STUDI DI PADOVA DIPARTIMENTO DI SCIENZE ECONOMICHE E AZIENDALI
“MARCO FANNO” CORSO DI LAUREA MAGISTRALE IN ECONOMIA INTERNAZIONALE
LM-56 Classe delle lauree magistrali in SCIENZE DELL’ECONOMIA
Tesi di laurea Impatti del processo di integrazione dei mercati elettrici europei
Impacts of the European electricity markets integration process
Relatore: Correlatore: Dott.ssa CALOFFI ANNALISA Ing. VAILATI RICCARDO
Laureando: BERARDI FRANCESCO MARIA
Anno Accademico 2015-2016

II

III
Il candidato dichiara che il presente lavoro è originale e non è già stato sottoposto, in tutto o in parte, per il conseguimento di un titolo accademico in altre Università italiane o straniere. Il candidato dichiara altresì che tutti i materiali utilizzati durante la preparazione dell’elaborato sono stati indicati nel testo e nella sezione “Riferimenti bibliografici” e che le eventuali citazioni testuali sono individuabili attraverso l’esplicito richiamo alla pubblicazione originale.
Firma dello studente _________________

IV

V
Abstract Il meccanismo di Market Coupling è parte del progetto europeo per la creazione del mercato
interno dell’energia. L’implementazione di questo ambizioso progetto, frutto del processo di
integrazione dei mercati europei iniziato alla fine della Seconda Guerra Mondiale, ha
comportato dei cambiamenti nei meccanismi di funzionamento dei mercati elettrici e la
creazione di enti sovranazionali per un maggiore e migliore coordinamento degli enti nazionali
dell’energia. Questo lavoro di tesi quantifica i benefici del sistema elettrico italiano a seguito
dell’attivazione del meccanismo di accoppiamento con i paesi confinanti. I benefici trovati sono
misurati attraverso la diminuzione delle inefficienze di mercato.
The Market Coupling mechanism is part of the European project to create the Internal Energy
Market (IEM). This ambitious project is the result of the European market integration process
started at the end of the Second World War. The implementation of the project has led to
changes in the working mechanism of the electricity markets and the creation of supra-national
authorities in order to reach a better coordination of national energy agencies. This thesis work
calculates the benefits of the Italian electricity system after the activation of the coupling
mechanism with its neighbouring countries. The welfare gains measured are the decreases of
the market inefficiencies.

VI
VII
INDEX
Introduction ............................................................................................................................... 1
Chapter 1. The European electricity market ......................................................................... 9
1.1 Theoretical background ....................................................................................................... 9 1.2 Setting the scene: the European history .................................................................................. 12
1.2.1 The situation after the World War ....................................................................................... 12 1.2.2 ’50s and EURATOM ........................................................................................................... 14 1.2.3 Creation of EU and its expansion ......................................................................................... 16
1.3 Energy policies in Europe ......................................................................................................... 17 1.3.1 1945 – 1986: Post-war reconstruction and oil shocks .......................................................... 17 1.3.2 The nuclear energy ............................................................................................................... 18
1.4 1986 – 2012: The liberalisation process ................................................................................... 21 1.4.1 The UK case history ............................................................................................................. 22 1.4.2 The European Liberalisation ................................................................................................ 25 1.4.3 Italian Electricity Market ..................................................................................................... 28 1.4.4 The Italian liberalisation process ......................................................................................... 29
Chapter 2. The Electricity Market ........................................................................................ 35
2.1 Technical features of power systems ........................................................................................ 35 2.1.1 Technical constraints of power system ................................................................................ 36 2.1.2 Management of the power system ........................................................................................ 37
2.1.2.1 Dispatch and ancillary services .................................................................................................... 37 2.1.2.2 Balancing ...................................................................................................................................... 37
2.2 Working mechanisms of the electricity markets .................................................................... 37 2.2.1 Merit order ........................................................................................................................... 38 2.2.2 The System Marginal Price (SMP) mechanism ................................................................... 39 2.2.3 Pay-As-Bid mechanism (PAB) ............................................................................................ 41 2.2.4 SMP vs PAB ........................................................................................................................ 41 2.2.5 Zonal markets ....................................................................................................................... 42
2.3 The Italian Electricity Spot Market ......................................................................................... 44 2.3.1 Market zones ........................................................................................................................ 44 2.3.2 The markets .......................................................................................................................... 48 2.3.3 The offers ............................................................................................................................. 48 2.3.4 Day-Ahead Market ............................................................................................................... 50 2.3.5 The Intra-Day Market (MI) .................................................................................................. 50 2.3.6 Ancillary Services Market (MSD) ....................................................................................... 52
2.3.6.1 The Balancing Market .................................................................................................................. 53 2.4 Other electricity markets in Italy ............................................................................................. 53
VIII
2.4.1 Forward electricity market (MTE) ....................................................................................... 53 2.4.2 Platform for physical delivery of financial contracts concluded on IDEX (CDE) .............. 54 2.4.3 OTC Registration Platform (PCE) ....................................................................................... 54
Chapter 3. Market integration: the hardware ..................................................................... 57
3.1 Background ................................................................................................................................ 57 3.2 European price trends ............................................................................................................... 59 3.3 Italian generation mix ............................................................................................................... 71 3.4 Italian interconnection development ....................................................................................... 73
3.4.1 The Balkan Area .................................................................................................................. 76
Chapter 4. Market integration: the software ....................................................................... 83
4.1 Legal provisions ......................................................................................................................... 83 4.1.1 Regulation 714/2009/EC ...................................................................................................... 83 4.1.2 Network Codes ..................................................................................................................... 84 4.1.3 CACM Code ......................................................................................................................... 85
4.1.3.1 Capacity calculation methods ....................................................................................................... 86 4.1.3.2 Zones definition ............................................................................................................................ 89 4.1.3.3 Capacity allocation methods for the day-ahead market ............................................................... 90
4.1.4 Electricity Balancing (EB) ................................................................................................... 91 4.1.5 Cross-border exchange ......................................................................................................... 93
4.2. Market Coupling Implementation .......................................................................................... 94 4.2.1 Regional Initiatives .............................................................................................................. 95 4.2.2 Price Coupling of Regions (PCR) ........................................................................................ 96 4.2.3 Market Coupling between Italy – Slovenia .......................................................................... 97 4.2.4 Italian Market Coupling ....................................................................................................... 99
4.3 Euphemia .................................................................................................................................. 101 4.3.1 How it works ...................................................................................................................... 101 4.3.2 Welfare maximisation problem (Master Problem) ............................................................ 102 4.3.3 Price determination sub-problem ....................................................................................... 103 4.3.4 PUN search sub-problem ................................................................................................... 104 4.3.5 Volume Indeterminacy sub-problem .................................................................................. 104
Chapter 5. The benefits of Market Coupling ..................................................................... 107
5.1 IT-SI Market Coupling ........................................................................................................... 107 5.2 Price inefficiencies ................................................................................................................... 108
5.2.1 Methodology ...................................................................................................................... 109 5.2.2 Price differences ................................................................................................................. 109 5.2.3 Price convergence .............................................................................................................. 115 5.2.4 Anti-economic flows .......................................................................................................... 118

IX
5.1.4.1 Anti-economic flows 2013 ......................................................................................................... 118 5.2.4.2 Anti-economic flows 2014 ......................................................................................................... 119 5.2.4.3 Anti-economic flows 2015 ......................................................................................................... 119
5.3 Unused cross-border capacity ................................................................................................ 121 2013 Unused NTC .................................................................................................................................. 121 2014 Unused NTC .................................................................................................................................. 122 2015 Unused NTC .................................................................................................................................. 122
5.4 Results ....................................................................................................................................... 123
Conclusions ............................................................................................................................ 124
Reference list ......................................................................................................................... 127

X
XI
FIGURE INDEX Fig. 1 Merit order curve ........................................................................................................... 10
Fig. 2 Seasonale variations of electricity consumption ........................................................... 11
Fig. 3 Load duration curve ....................................................................................................... 12
Fig. 4 Determination of the Clearing Price .............................................................................. 39
Fig. 5 System Marginal Price ................................................................................................... 40
Fig. 6 System Marginal Price ................................................................................................... 41
Fig. 7 Zonal price algorithm .................................................................................................... 43
Fig. 8 Virtual and geographical zones of the national transmission grid ................................. 45
Fig. 9 Italian geographical zones ............................................................................................. 46
Fig. 10 2005 Annual average zonal prices on MGP (€/MWh) ................................................ 46
Fig. 11 Electricity Production from energy sources (2005) ..................................................... 60
Fig. 12 Electricity production by source (2015) ...................................................................... 60
Fig. 13 Breakdown of electricity production by source (2015), percentage values ................ 61
Fig. 14 Prices (€) of the main energy commodities, 2005-2014 .............................................. 62
Fig. 15 Spot prices on the main European PXs ....................................................................... 62
Fig. 16 Average Wholesale Baseload Price - 2008 .................................................................. 64
Fig. 17 Average Wholesale Baseload Price - 2012 .................................................................. 65
Fig. 18 Average Wholesale Baseload Price - 2014, 1st Semester ........................................... 66
Fig. 19 Average Wholesale Baseload Price – 4th Quarter, 2014 .............................................. 67
Fig. 20 Average Wholesale Baseload Price – 1st Quarter, 2015 .............................................. 68
Fig. 21 Average Wholesale Baseload Price – 3rd Quarter, 2015 ............................................. 69
Fig. 22 Electricity Infrastructure Projects of Energy Community Interest (PECIs) – IPA ...... 79
Fig. 23 Trans-Balkan corridor .................................................................................................. 80
Fig. 24 Italian interconnection with Montenegro .................................................................... 80
Fig. 25 Network code overview ............................................................................................... 85
Fig. 26 CACM links ................................................................................................................. 86
Fig. 27 Security of Supply country A ...................................................................................... 88
Fig. 28 ATC and FB domain ................................................................................................... 89
Fig. 29 Price Coupling of Regions ........................................................................................... 97
Fig. 30 IT-SI Market Coupling Mechanism ............................................................................ 99
Fig. 31 Market Coupling results March 2016 ........................................................................ 100
Fig. 32 IT-FR capacity allocation .......................................................................................... 100
Fig. 33 IT-AU capacity allocation ......................................................................................... 100
Fig. 34 IT-SI capacity allocation ........................................................................................... 100
XII
Fig. 35 BSP import, Nord and BSP prices ............................................................................. 107
Fig. 36 Net import on Slovenia BSP, Slovenia Nord and on the SI-North border ................ 108
CHART INDEX Chart 1 2005 Annual average zonal prices on MGP (€/MWh) ............................................... 47
Chart 2 Annual average zonal prices on MGP (€/MWh). 2005 - 2010 ................................... 48
Chart 3 Types of bids and offers .............................................................................................. 49
Chart 4 Organisational diagram of the MPE ............................................................................ 50
Chart 5 Timeline of activities on the MPE in respect of the day D. Source: GME ................. 55
Chart 6 Aggregated Balance of Electric Energy in Italy in 2013 and 2014 (GWh) ................ 73
Chart 7 Italian interconnection capacity during winter (MW; Peakload capacity from 7 am to
11 pm) .............................................................................................................................. 76
Chart 8 Italian interconnection capacity during summer (MW; Peakload capacity from 7 am to
11 pm) .............................................................................................................................. 76
Chart 9 Average gross electricity tariffs in €cent per kWh ..................................................... 77
Chart 10 Anti-economic flows 2013. Source: GME, EPEX, BSP, LAGIE, TERNA, ENTSO-E
........................................................................................................................................ 118
Chart 11 Anti-economic flows 2014. Source: GME, EPEX, BSP, LAGIE, TERNA, ENTSO-E
........................................................................................................................................ 119
Chart 12 Anti-economic flows before February 2015 ........................................................... 120
Chart 13 Anti-economic flows on MC markets post Februardy 2015 ................................... 120
Chart 14 Unused NTC 2013. Source: GME, TERNA, ENTSO-E ........................................ 121
Chart 15 Unused NTC 2014. Source: GME, TERNA, ENTSO-E ........................................ 122
Chart 16 Unused NTC 2015. Source: GME, TERNA, ENTSO-E ........................................ 122
GRAPH INDEX Graph 1 Annual average zonal prices in MGP (€/MWh) ........................................................ 48
Graph 2 Balanced Bids and Offers .......................................................................................... 52
Graph 3 NTCs (average on both directions) on cross-zonal borders aggregated per region ... 70
Graph 4 Change in NTC value per border in the CSE, CWE and CEE regions - 2010-2014 (MW
and %) .............................................................................................................................. 71
Graph 5 Italian electricity production by sources (2005) ........................................................ 72
Graph 6 Italian electricity production by sources (2014) ........................................................ 72
Graph 7 Primary energy production by source (2010 and 2014) ............................................. 78

XIII
Graph 8 IT-AT Price Differential. Source: GME, EPEX ...................................................... 110
Graph 9 IT-FR Price Differential. Source: GME, EPEX ....................................................... 111
Graph 10 IT-CH Price Differential. Source: GME, EPEX .................................................... 112
Graph 11 IT-SI Price Differential. Source: GME, BSP ......................................................... 113
Graph 12 IT-GR Price Differential. Source: GME, LAGIE .................................................. 114
Graph 13 IT-AT Price Convergence 2013-2015 ................................................................... 115
Graph 14 IT-FR Price Convergence 2013-2015 .................................................................... 116
Graph 15 Price Convergence 2013-2015 ............................................................................... 116
Graph 16 IT-SI Price Convergence 2013-2015 ..................................................................... 117
Graph 17 Price Convergence 2013-2015 ............................................................................... 117

XIV
1
Introduction La seguente tesi è frutto di un interesse personale maturato nei confronti delle politiche
energetiche dell’Unione Europea. L’ipotesi iniziale era capire in che modo l’Unione Europea
agisse per garantire una maggiore stabilità ed efficienza ai mercati energetici nazionali, se ci
fosse in atto un progetto energetico unitario predisposto dall’Unione stessa ed in che modo
l’Italia si fosse adeguata per aderire all’eventuale progetto. Per prima cosa è stato necessario
restringere il campo di ricerca in base alle risorse energetiche. La scelta è ricaduta sul settore
elettrico in quanto, oltre ad essere stato il primo settore ad essere preso in considerazione, la
fornitura di energia elettrica rappresenta, per le aziende italiane, un costo fisso elevato, proprio
per il prezzo che l’energia elettrica ha in Italia. Alla domanda di partenza se ne aggiungeva
quindi una seconda: in che modo l’Italia sta agendo per garantire un prezzo dell’energia elettrica
competitivo rispetto al panorama europeo? E quindi, in relazione alla precedente: l’Unione
Europea ha attivato un progetto comune a tutti gli Stati Membri per ottenere l’allineamento dei
prezzi elettrici nazionali e l’integrazione dei mercati elettrici nazionali, ma quali effetti ha avuto
sul mercato italiano? Il sito della Commissione Europea ha risposto alla mia domanda: il
processo di integrazione dei mercati elettrici europei era iniziato ormai già da diversi anni tra i
paesi europei, in particolare tra le regioni settentrionali, e l’Italia era appena entrata nel vivo
della questione. Infatti, a inizio 2015 era stato attivato il meccanismo di accoppiamento del
mercato elettrico italiano con i mercati confinanti, ad oggi ultimo step del progetto di
integrazione dei mercati elettrici.
L’integrazione dei mercati elettrici europei, secondo la Commissione Europea, è il modo più
conveniente per garantire un approvvigionamento sicuro e conveniente per i cittadini
dell’Unione Europea. L’integrazione dei mercati avrebbe infatti diversi effetti, tra cui, in
particolare, una maggiore concorrenza a livello europeo e una maggiore stabilità, e un
sostanziale abbassamento dei prezzi energetici dei singoli paesi verso un allineamento di
prezzo. Per l’Italia, quindi, l’integrazione dei mercati energetici è un elemento cruciale per
ottenere l’abbassamento del prezzo nazionale dell’elettricità.
La tesi è stata redatta in collaborazione con l’ing. Riccardo Vailati, funzionario tecnico presso
l’Autorità per l’Energia Elettrica e il Gas (AEEG), che, durante i mesi necessari per la ricerca
e la stesura del lavoro, lo ha revisionato e corretto ed ha fornito e consigliato materiale utile ad
affrontare il tema scelto. Da ultimo, ha consigliato di affrontare il tema dell’integrazione dei
mercati prendendo come punto di vista l’eliminazione delle inefficienze sulle interconnessioni
tra paesi nei mercati elettrici del giorno prima (MGP), a seguito dell’implementazione dei nuovi
meccanismi di mercato. Le inefficienze considerate, di tipo allocativo, per l’analisi dei dati sono

2
due: i flussi anti-economici e la non saturazione della capacità nelle interconnessioni.
L’osservazione e la misurazione di tali inefficienze permette di calcolare la perdita di benessere
di un sistema elettrico, nel nostro caso quello italiano, rispetto ad una possibile situazione di
efficienza. Il meccanismo di accoppiamento dei mercati è stato ideato per eliminare proprio
queste inefficienze e, di conseguenza, per massimizzare i benefici portati dall’interconnessione
di due sistemi.
Nel dettaglio, l’analisi sulla prima tipologia di inefficienza si preoccupa di misurare il numero
di ore e il corrispondente ammontare di elettricità generati da un flusso contrario al flusso di un
sistema nella norma. Solitamente i flussi elettrici si muovono da un sistema con prezzo più
basso verso un sistema con prezzo più alto. Nel caso di un flusso antieconomico, i flussi si
muovono inversamente, cioè da un sistema con prezzo più alto verso un sistema a prezzo più
basso, generando perdite di benessere sociale. A tal proposito è necessario misurare il
differenziale di prezzo dei due sistemi e il volume dei flussi scambiati.
Nel caso della seconda tipologia di inefficienza si misura la differenza tra la cosiddetta capacità
di trasporto netta – Net Transfer Capacity (NTC) – e la capacità commercializzata tra due
sistemi, con flussi dal sistema con prezzo minore al sistema con prezzo maggiore. Tale quantità,
messa in relazione con il differenziale di prezzo, misura l’effettiva perdita di benessere sociale.
Per parlare del funzionamento del mercato MGP è stato prima necessario dare una visione
d’insieme dell’evoluzione del mercato elettrico europeo: dalla fine della Seconda Guerra
Mondiale, con la creazione delle prime organizzazioni internazionali per il controllo delle
risorse energetiche – CECA ed EURATOM –, il processo di liberalizzazione dei mercati
energetici poi, ed infine la creazione di enti sovranazionali per il coordinamento e lo sviluppo
delle reti elettriche e le interconnessioni tra paesi membri. Particolare attenzione è stata posta
sugli effetti del processo di liberalizzazione sul mercato italiano.
Il secondo capitolo tratta di conseguenza della struttura odierna del mercato elettrico italiano,
il suo funzionamento ed i limiti tecnici del sistema – bilanciamento tra potenza immessa e
prelevata, le perdite, le esternalità –. Inoltre, per la particolare divisione zonale dei prezzi
italiani, è stata necessaria una trattazione dei meccanismi di determinazione del prezzo – in
questo caso System Marginal Price (SMP) e Pay-As-Bid (PAB) – ed i loro effetti sul mercato.
Terminata la parte teorica del lavoro di tesi, si è quindi proceduti alla parte più empirica:
l’osservazione, attraverso dati e reportistica dei vari enti nazionali ed internazionali,
dell’evoluzione del mercato elettrico europeo e l’integrazione dei mercati nazionali.
Il terzo ed il quarto capitolo sono strettamente legati tra loro, in quanto rappresentano due
aspetti fondamentali per il funzionamento del sistema elettrico europeo. Il terzo capitolo
rappresenta la parte di hardware dell’integrazione dei mercati, e si focalizza quindi sulle novità
3
in materia di rete elettrica e la programmazione delle infrastrutture europee attraverso la
cosiddetta Lista di Progetti di Interesse Comune (Projects of Common Interests, PCIs).
Nell’ambito del miglioramento delle interconnessioni con l’estero, l’Italia sta apportando
miglioramenti alle strutture già esistenti e lavora per costruirne di nuove: è il caso della
interconnessione con il Montenegro che darà accesso al sistema elettrico dell’area balcanica.
Il quarto capitolo, invece, si concentra sulla parte di software dell’integrazione dei mercati. In
particolare si considera il Terzo Pacchetto Legislativo – i.e. Third Energy Package – emesso
dalla Commissione Europea e adottato nel settembre 2009. Il pacchetto legislativo è composto
da tre regolamenti e due direttive e tratta della regolamentazione per il funzionamento del
mercato elettrico e del gas. Il capitolo si focalizza su uno dei regolamenti (714/2009)
sull’introduzione ed applicazione dei cosiddetti codici di rete – i.e. Network Codes – . Vengono
presi in considerazione due di questi codici, il Capacity Allocation and Congestion
Management (CACM) ed Electricity Balancing (EB), che determinano il funzionamento
dell’allocazione di capacità ed il bilanciamento elettrico del mercato del giorno prima. Da
ultimo, ma non meno importante, viene presentato ed analizzato l’algoritmo utilizzato per
l’accoppiamento dei mercati: EUPHEMIA. Sviluppato dapprima nel 2011, a partire da un
precedente algoritmo (COSMOS), il suo utilizzo comincia solamente nel 2014 per accoppiare
la regione dell’Europa settentrionale alla regione meridionale. Nel 2015, infine, viene utilizzato
con successo anche dal GME.
Il quinto ed ultimo capitolo, infine, attraverso l’utilizzo di dati del mercato italiano e dei paesi
confinanti – Francia, Svizzera, Austria, Slovenia e Grecia – calcola le inefficienze del mercato
precedentemente spiegate: i flussi antieconomici e la non saturazione della capacità sulle
interconnessioni con l’estero.
Il lavoro di tesi contribuisce, quindi, alla letteratura che analizza i benefici e gli effetti
dell’integrazione dei mercati europei. La letteratura sull’argomento è vasta e varia in quanto vi
sono numerosi e diversi elementi che possono essere presi in considerazione. Tra i tanti lavori
consultati per la stesura della tesi, ne sono stati considerati due in particolare, per quanto
riguarda la vicinanza temporale e gli elementi considerati: Pellini (2012) e Newbery (2013). Il
primo si rivolge al mercato italiano e misura i benefici attesi del sistema dovuti al passaggio dal
meccanismo delle aste esplicite al meccanismo di accoppiamento dei mercati e, quindi, al
meccanismo di aste implicite sulle interconnessioni con l’estero. Le simulazioni vengono
effettuate sul mercato italiano, in diversi scenari, per l’anno 2012 in relazione a Francia, Grecia
e Germania, e valutano il surplus ottenuto dai consumatori, dai produttori e la rendita di
congestione.
4
Il secondo lavoro considerato è un report preparato nel 2013 per la Commissione Europea.
All’interno del report, nell’Allegato B, Newbery analizza i benefici dell’accoppiamento dei
mercati e al paragrafo 3 presenta le inefficienze legate alle aste esplicite nelle interconnessioni.
Nelle analisi eseguite nei paragrafi successivi, l’autore misura la bontà del nuovo meccanismo
adottato sulle interconnessioni tra Inghilterra e Francia durante il 2011-2012, e tra Francia e
Germania nel 2010, calcolando entrambe le inefficienze precedentemente viste.
Il mio lavoro da una parte riprende alcuni degli elementi di questi studi, dall’altra aggiunge
nuovi elementi. Per prima cosa il periodo da me considerato, oltre che più ampio (2013-2015),
utilizza dati molto recenti fino alla fine del 2015. In secondo luogo, considera le
interconnessioni italiane ma, rispetto a Pollini, aggiunge all’analisi le interconnessioni con
Svizzera e Slovenia. Infine, rispetto al lavoro di Newbery, tra i paesi considerati – eccetto
l’interconnessione con la Slovenia – il Market Coupling non era ancora attivo, se non
nell’ultimo anno di analisi (febbraio 2015).
5
This thesis is about energy policies in EU market and I decided to study this topic according to
my personal interest on this specific field of research. The initial hypothesis in our research
work is to understand how the European Commission acts in order to ensure stability and
efficiency to national energy markets, specifically with a project which could be applied to all
the Union Member States. First of all it was necessary to choose what energy resource consider.
We decide to study the electricity sector since it is the more interesting for the Italian market.
The second question we would like to answer is how Italy is acting in order to ensure a more
competitive electricity price with respect to the other European countries. another interesting
moving point is the one which ask if the European Union started a joint project with all the
Member Countries due to the harmonisation of national electricity prices and if the integration
of the national electricity markets can be considered already begun.
As we can see in the European normative the integration process had already started between
the countries of Northern Europe and the Italian integration process was in its main phase. In
fact, in early 2015, the coupling mechanism was activated on the Italian borders and it is
considered as the last step of the European integration process.
According to the European Commission the integration of European electricity markets is the
most cost-effective way to ensure secure and affordable supplies to EU citizens. In fact market
integration would had different effect, including increased competition at European level and
ensured greater system stability along with a substantial decrease in energy prices on individual
markets towards price harmonisation. Therefore the integration of energy markets is a crucial
topic for the Italian power market in order to obtain lower domestic electricity price.
This thesis has been prepared in collaboration with Eng. Riccardo Vailati, technical officer at
the Authority for Electricity and gas (AEEG). In the period of the preparation of the thesis he
has provided and recommended useful material to study and interpret results. He also
recommended to focus on markets integration taking as a reference point the elimination of
inefficiencies on the interconnections between countries in the Day-Ahead Market (MGP), after
the implementation of the new market mechanisms. The considered allocative inefficiencies
are two: the Anti-Economic Flows and the Unused Cross-Border Capacity. The study in terms
of magnitude of these inefficiencies allows us to calculate the loss of welfare of the electricity
system in the Italian system. The market coupling mechanism is precisely designed in order to
to eliminate these inefficiencies and as a consequence to maximise the benefits brought by the
interconnection of two systems.
The analysis on the first type of inefficiency is aimed to measure the number of hours and the
corresponding amount of electricity generated by a reverse flow than the usual. The electricity
flows usually move from a system with lower price to a higher price system. In the case of an

6
anti-economic flow, the flows move inversely: from a higher price area to a lower price area,
generating social welfare losses in the system. So, it is necessary to measure the price
differential of the two systems and the volume of the exchanged flow.
In the case of the second type of inefficiency we consider the difference between the so-called
Net Transfer Capacity (NTC) and the capacity commercialised between two systems. This
amount, related to the price differential, measures the effective loss of social welfare.
In order to be able to discuss about the operating principle of the MGP, it is necessary to give
an overview of the development of the European electricity market which started at the end of
the Second World War with the first international organisations for the control of energy
sources – ECSC and EURATOM – and then followed by the electricity markets liberalisation
process, and at the end the creation of supranational authorities for the coordination and
development of electricity grids, and interconnections between countries. There has been
particular attention on the effects of the Italian market liberalisation.
Consequently, the second chapter is about the structure of the Italian electricity structure, its
operating principles and the technical constraints of the system – i.e. the balance between power
injected and withdrawn, the losses, the network externalities –. In addition, because of the zonal
difference within the Italian price, it was necessary a section on the different price determination
mechanisms – in this case the System Marginal Price (SMP) and the Pay-As-Bid (PAB) – and
their effects on the market.
The empirical part consists of the observation and measurement through data and reports of
various national and international organisations of the European electricity market evolution
and the integration of national markets.
The third and fourth chapters are closely linked, as they represent two fundamental aspects for
the functioning of the European electricity system. The third chapter is about the hardware of
the integration of the markets. This Chapter focuses on the innovations of the grid and the
planning of the European infrastructures through the so-called Projects of Common Interests
list (PCIs). In the last years, Italy has significantly improved the existing interconnections with
neighbouring countries and works in order to create new structures, as the Montenegro
interconnection with Montenegro that will give access to the Balkan electricity system.
The fourth chapter focuses on the hardware of the integration of the markets. In particular we
consider the Third Energy Package issued by the European Commission and adopted in
September 2009. The legislative package consists of three regulations and two directives. They
focus on the operating principles rules of the electricity and gas market. The chapter takes into
account one of the regulations (714/2009) in the induction and the application of the so-called
Network Codes. We considered two of them, the Capacity Allocation and Congestion
7
Management (CACM) and the Electricity Balancing (EB). They determine, respectively, the
allocation of capacity and the balancing of the day-ahead market. Last but not least, it is
presented and analysed the algorithm used for the coupling of the markets: EUPHEMIA. First
developed in 2011, from a previous algorithm (COSMOS), it started to work only in 2014 to
match the Northern European region to the Southern region. In 2015, finally, the GME
successfully implemented it.
The fifth and last chapter, finally, calculates the inefficiencies previously explained – the anti-
economic flows and the unused capacity – through the use of the Italian and the neighbouring
country data on the electricity market.
This thesis contributes to the existing literature about the impacts of the integration of European
markets. The literature on this topic is wide and various as there are many different factors that
can be taken into account. Among the works used for the thesis, I considered in particular two
of them with regard to the time and factors considered: Pellini (2012) and Newbery (2013). The
first work is on the Italian market and measures the benefits of the system due to the passage
from the explicit auctions to the implicit auctions on the cross-border interconnections. The
simulations are carried out on the Italian market through different scenarios during 2012. The
interconnections considered are France, Greece and Germany and the simulations evaluate the
surplus gained by the consumers, the producers and the congestion rent.
The second work is a report prepared for the European Commission in 2013. Within the report,
in the Appendix B, Newbery analyses the benefits of Market Coupling and in section 3
introduces the inefficiencies related to the explicit auctions on the cross-border
interconnections. In the following sections, the author calculates the goodness of the new
mechanism adopted between the England-France interconnection during 2011-2012, and
between France-Germany in 2010. Newbery calculates both the inefficiencies previously seen.
My thesis on the one hands incorporates some of the elements of these studies but also adds
new elements. First of all the time period considered is broader than the one considered by
Pellini and Newbery, the included data are more recent. Secondly, the thesis takes into account
the Italian interconnections but, compared to Pollini, adds to the analysis the interconnections
with Switzerland and Slovenia. Finally, compared to the report of Newbery, all the markets
considered – except for Slovenia – were not coupled. The Market Coupling mechanism started
on February 2015.

8

9
Chapter 1. The European electricity market
This chapter retraces the history of European energy since the end of the Second World War
until the early 2000s. The chapter looks at those events that contributed to the European energy
unification, from the first international agreement up to an European integrated market between
the Member states. The chapter tries to show the process of the European institutions that
brought to the liberalisation process of the European countries, the base for the Internal
European Market.
The first part of the chapter describes the situation of Europe immediately after the Second
World War. In this period, the European countries tried to solve all the controversies between
them and live in peace. In order to achieve these goals, the European countries started to
establish supranational organisations. Initially these organisations were necessary to manage
existing power resources, the countries’ points of contention, and to create the economic
condition for an integrated European market without the necessary attention to integrated
energy policies. With the introduction of the European Union and its institutions, the European
countries started to coordinate energy policies within them, in order to better deal with
economic crisis, as the oil shocks and to the improvement of nuclear energy as main source. At
the end of the ‘80s the liberalisation process of the power market started firstly in Europe from
UK and then spread all over the Europe. In Italy, the liberalisation of the market started in 1996
after a European Directive on the power market, promoting competition between actors on the
activities of the market. The following Directives, showed later on chapter 3, focused on more
coordinated energy policies between countries, in order to harmonise legislation, to allow
countries to improve cross-border exchanges and to promote tighter collaborations.
1.1 Theoretical background Economic theory applied to electricity markets has to face two major difficulties concerning
the nature of demand and supply. Firstly, elasticity of demand is very low, almost zero.
Secondly, the characteristics of supply costs in electricity markets are not compatible with the
assumption made in competitive economics.
More in detail, supply in electricity markets is the combined output of all generators used to
satisfy the consumer’s demand for electricity. Usually, the supply curve shows the total amount
offered for sale at any given price for any given period. In the short term electricity supply is
considered to be fixed while in the long term the production capacity may be altered. Three
main aspects of electricity supply must be considered: different cost levels, non-convexity of
generator costs and concentrated structure of the market.

10
After the electricity market is defined, the supply curve is usually represented by a merit order
curve, as in Figure 1. Such curve ranges from the least expensive to the most expensive units.
The merit order curve presents the costs and capacities of all generators. The differences
between costs are mainly due to the technology used and its related fuel. For example,
hydropower and nuclear power plants have usually ow marginal costs compared to gas powered
plants.
As it will be explained later in the Second Chapter, in order to calculate the price of the system,
it is possible to choose between two different price mechanism: the System Marginal Price and
the Pay As Bid mechanism.
Fig. 1 Merit order curve
Characteristics of supply of a single power plant are not compatible with assumptions of
competitive economics. In fact, production costs of a single power plant are not convex. Convex
costs have the property that twice as much output always cost at least twice as much to produce
(Stoft, 2002). Electricity production costs are not convex due mainly to the existence of startup
costs and no-load-costs. For example, if the startup cost of a plant is 20 €/MWh and if its
marginal cost is 25 €/MWh, producing 1 MWh over 2 hours would cost 70 €/MWh, while
producing 2 MWh in the same period would only cost 120 €/MWh. Thus, producing twice as
much is cheaper per unit.
Another important issue to consider is that the electricity industry is no longer organised as a
monopoly, because of most power plants today are owned by a small number of companies. On
the other hand, when one player of the market owns more than 50% of generation capacity, the
market structure represents the most important barrier for competition and a serious concern in
term of market power.

11
Market demand is generally defined as the quantity of electricity that end-users are willing to
consume at any given price. Electricity demand has three important features: seasonal
variations, segmentation of consumers and low elasticity.
In a general way, the demand for electricity varies on a temporal scale with respect to season,
day of the week and hour of the day. Hence electricity consumption is higher during the day
than during night and lower during weekend than during weekdays. Moreover, electricity
consumption may vary widely between summer and winter due to the use of heating and air
conditioning systems.
Fig. 2 Seasonale variations of electricity consumption
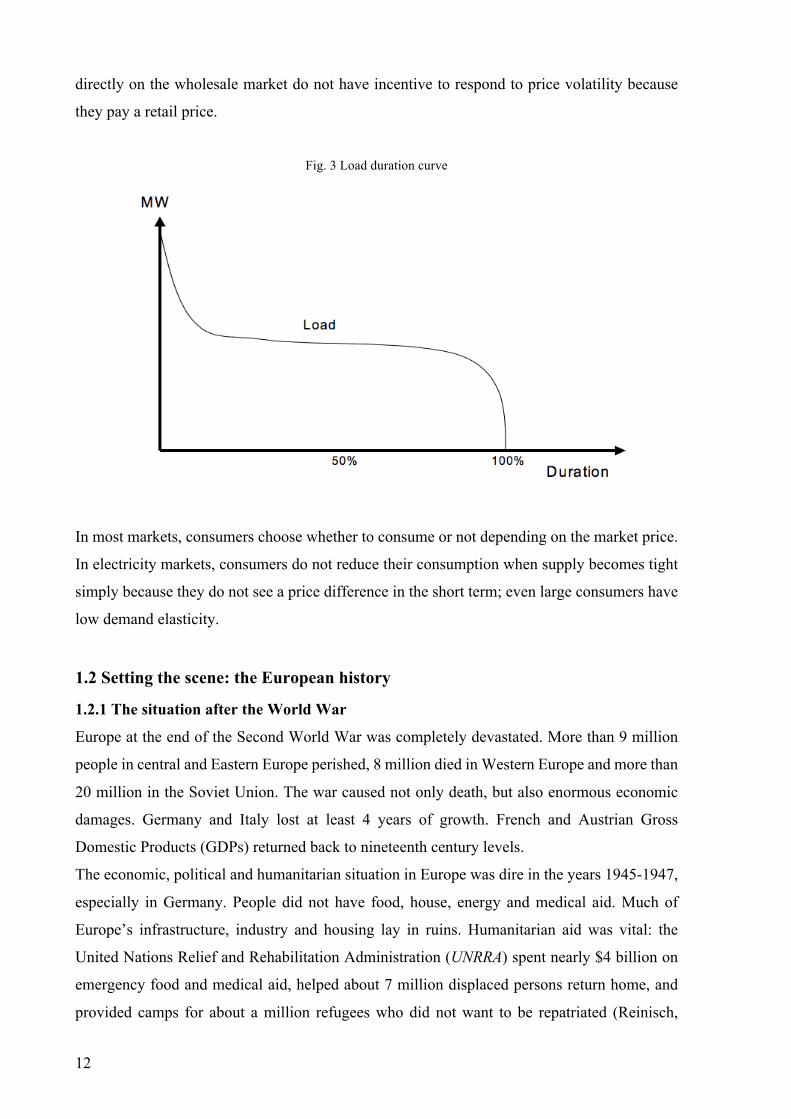
The seasonal variations of demand in Figure 2 are usually summarised in a load-duration curve
as in Figure 3.
Demand can be divided into several segments according to the level of need and sensitivity to
price change of its buyers. Different categories have been defined in Europe, as a result of the
adoption of Directive 96/92/EC to improve the transparency of electricity prices charged to
industrial end-users and domestic consumers.
Finally, the elasticity of demand is a sensitive issue in electricity markets. In any market, the
elasticity of demand represents the responsiveness of consumers to a change in price – in this
case electricity prices. In electricity markets elasticity of demand is very low for most
consumers due to the lack of substitutes and the high importance given to the product by
consumers. Large consumers directly connected to the high tension grid and acting at the
wholesale level can react to some extent to electricity prices. Households and small and medium
industry are almost unresponsive to price fluctuations because wholesale volatility is not passed
on to retail consumers, or at least not in real time. These small consumers, which do not act
12
directly on the wholesale market do not have incentive to respond to price volatility because
they pay a retail price.
Fig. 3 Load duration curve
In most markets, consumers choose whether to consume or not depending on the market price.
In electricity markets, consumers do not reduce their consumption when supply becomes tight
simply because they do not see a price difference in the short term; even large consumers have
low demand elasticity.
1.2 Setting the scene: the European history
1.2.1 The situation after the World War
Europe at the end of the Second World War was completely devastated. More than 9 million
people in central and Eastern Europe perished, 8 million died in Western Europe and more than
20 million in the Soviet Union. The war caused not only death, but also enormous economic
damages. Germany and Italy lost at least 4 years of growth. French and Austrian Gross
Domestic Products (GDPs) returned back to nineteenth century levels.
The economic, political and humanitarian situation in Europe was dire in the years 1945-1947,
especially in Germany. People did not have food, house, energy and medical aid. Much of
Europe’s infrastructure, industry and housing lay in ruins. Humanitarian aid was vital: the
United Nations Relief and Rehabilitation Administration (UNRRA) spent nearly $4 billion on
emergency food and medical aid, helped about 7 million displaced persons return home, and
provided camps for about a million refugees who did not want to be repatriated (Reinisch,

13
2011). UNRRA, founded by the United Nations in Washington (1943), was “the first
international body to do something concrete and constructive, an attempt at an international
civil service” (Wilson, 1947). For the first time in history men and women of different
nationalities, backgrounds and skills were all united in the ambition to build “a true world
community with new social systems and international relations” (Susan and Taylor, 2004).
At the same time, national governments were in crisis. In France, General de Gaulle resigned
as president of the provisional government in 1946. Italy and Belgium saw internal conflict
over their monarchy. Italy abolished the reign in a referendum. In Belgium, the return of the
king sparked riots.
Considering all these difficulties, how could Europe prevent another war? At the end of the
hostility, there were no other armed conflicts, but anger and hate within Europe and between
nations went on. The war started in 1939 because of destructive nationalism: the solution
suggested by the belief of peace between European countries was tighter integration of all
European nations.
“[…] What is this plight to which Europe has been reduced? Some of the smaller states have
indeed made a good recovery, but over wide areas are a vast, quivering mass of tormented,
hungry, careworn and bewildered human beings, who wait in the ruins of their cities and homes
and scan the dark horizons for the approach of some new form of tyranny or terror. […] What
is this sovereign remedy? We must build a kind of United States of Europe. In this way only will
hundreds of millions of toilers be able to regain the simple joys and hopes which make life
worth living. The process is simple. All that is needed is the resolve of hundreds of millions of
men and women to do right instead of wrong and to gain as their reward blessing instead of
cursing.”
Winston Churchill, University of Zurich, 19 September 1946, p. 1-2
Following this peaceful aim, the Organisation for European Economic Co-operation (OEEC)
came into effect on 16 April 1948 (Griffiths, 1997). It emerged from the Marshall Plan, the
European Recovery Programme (ERP, 1947) and the Conference of Sixteen (Conference for
European Economic Co-operation, CEEC), which sought to establish a permanent organisation
to continue work on a joint recovery programme and in particular to supervise the distribution
of aid. The OEEC originally had 18 participants (Austria, Belgium, Denmark, France, Greece,
Iceland, Ireland, Italy, Luxembourg, Netherlands, Norway, Portugal, Sweden, Switzerland,
Turkey, United Kingdom and Western Germany). Its first objective in 1948/1949 was to “get
14
member countries to reduce their initial requests so as not to exceed the yearly allocation” of
the ERP, a matter of no easy solution (Haberler, 1948).
“... one of the earliest tasks of the OEEC was to seek to free European trade from the
restrictions and bilateralism that had grown up in all member countries. [However] it was
clear that ... trade liberalization would not be possible without adequate intra-European
payments arrangements which would ensure complete transferability of European currencies.”
Wexler, 1983, p. 200
Through the efforts of the OEEC and backed by Marshall Plan money both of these goals were
finally achieved through the trade liberalisation programmes of the OEEC. In fact, the U.S.
Secretary of State George C. Marshall announced that the USA would give financial assistance
to all European nations “West of the Urals”. From 1948 to 1952, Marshall Plan aid amounted
to $12 billion, with half of this going to the UK, France and West Germany (Murphy, 1948).
1.2.2 ’50s and EURATOM
From the ‘50s, European countries started to organise the power sources in order to limit
conflicts within them. To do so, the European Coal and Steel Community (ECSC) was created
in Paris in 1951 after the proposal of France and Germany. Such organisation put in place a
common market in coal and steel among the six founding countries, which were Belgium,
France, the Federal Republic of Germany, Italy, Luxembourg and the Netherlands. The
organisation was “designed to substitute for historic rivalries a fusion of their essential interests;
to establish, by creating an economic community, the foundation of a broad and independent
community among peoples long divided by bloody conflicts; and to lay the bases of institutions
capable of giving direction to their future common destiny” (Goormahgtigh, 1953).
With the Treaties of Rome in 1957, the aforementioned European countries decided to set up
two organisations, one created in order to manage energy and one for economic scope. Then, it
was decided to create a European Atomic Energy Community (EURATOM), “the first great
achievement of the supranational Europe” 1, and a European Economic Community (EEC),
aimed “to promote […] a harmonious development of economic activities, a continuous and
balanced expansion, an increased stability, an accelerated raising of the standard of living and
closer relations between its Member States”2. Alternatively to the EEC, in 1960 others
1Treaty establishing the European Atomic Energy Community (EURATOM), Rome, 1957 2 Treaty establishing the European Economic Community (EEC), art. 2, Rome, 1957

15
European nations3 founded the European Free Trade Association (EFTA) “to promote closer
economic cooperation and free trade”4.
More in detail, EURATOM was founded in order to tackle the general shortage of conventional
energy. In fact, in the 1950s nuclear energy looked like a way of achieving energy
independence. It was the first attempt of energy collaboration between European countries
conceived on a grand scale. Since the costs of investing in nuclear energy could not be met by
individual states, the founding States joined together. The goal of the “nuclear” Treaty was to
contribute to the creation and development of Europe’s nuclear industries and to ensure security
of supply. Furthermore, the Treaty guaranteed high safety standards for the public and the use
of nuclear materials only for civilian use. In fact, EURATOM’s power were limited to peaceful
civil uses of nuclear energy.
On the other hand, the EEC, during the years, became much more important than EURATOM.
The development of the organisation for the economic cooperation restricted the energy
development for an integration within countries.
The nascent EEC spent its first year of life setting up its administrative machinery and
developing an integration programme. With the Treaty, the six countries linked each other with
a deep economic integration. The first step was the most concrete and ambitious: the customs
union. Intra-EEC import quotas were abolished in 1961 and tariffs were zero by July 1968,
earlier than the prevision due to the period of European economic prosperity (1950 – 1980).
The new Common External Tariff (CET) applied by all EEC members was set at the simple
arithmetic average of the Six’s pre-EEC tariffs. These further steps for the European integration
coincided with “a substantial increase in the foreign direct investment flows to the six original
members of the EC both from third countries, and in particular the US, and from other
Community Member States” (Yannopoulos, 1990). More in detail, Aitken (1973) showed that
“both the EEC and EFTA have experienced a cumulative growth in Gross Trade Creation
(GTC)5 over their respective integration periods, with the GTC of the EEC being substantially
greater than the GTC of EFTA”.
In addition, the Treaty promised free labour mobility, capital market integration, free trade in
services and a range of common policies. The Treaty also created some supranational
institutions such as European Parliamentary Assembly, the European Court of Justice and the
European Commission.
3 Austria, Denmark, Norway, Portugal, Sweden, Switzerland and the United Kingdom (1960). Finland (1961). 4 See at http://www.efta.int/ 5 Gross Trade Creation (Balassa, 1967) refers to the total increase in trade among members of a trading community brought about through integration, regardless of whether the additional trade replaces domestic production or whether it replaces non-member exports.

16
Between the 1973 and the end of the ‘80s Denmark, Ireland, the United Kingdom, Greece,
Spain and Portugal joined the Community, raising the number of member states to twelve.
1.2.3 Creation of EU and its expansion
The falling of the Wall in Berlin in 1989 caused a political earthquake in Europe. A unified
Germany scared the other countries and imbalanced the political equilibrium. It was necessary
a stronger union and cooperation within Europe. Thus, the European Council decided to form
an Economic and Monetary Union (EMU) aimed at converging the economies of all member
states of the EU at three stages.
The first phase ended with the approval of the Treaty on the European Union (Maastricht,
1992), or the Maastricht Treaty, added intergovernmental cooperation, in areas such as foreign
policy and internal security, to the existing Community system. The Maastricht Treaty created
the European Union (EU) consisting of three pillars: the European Community (EC), which
replaced the EEC, the Common Foreign and Security Policy (CFSP) and police and judicial
cooperation in criminal matters, the Justice and Home Affairs (JHA). It came into force on 1
November 1993. In 1995 Austria, Finland and Sweden joined the EU, bringing its membership
to 15. Maastricht Treaty also created EU citizenship, locked in the free movement of capital,
enshrined the principle of subsidiarity, strengthened the European Parliament’s power over EU
legislation, introduced policies on workers’ health and safety, workplace conditions, equal pay
and the consultation of employees (Toth, 1992). The second phase started with the creation of
the European Monetary Institute (EMI), the “forerunner” of the European Central Bank (ECB),
in 1994. In 1998, the ECB was finally instituted and the EMI ended his term. The ECB, with
the national banks of the Member States (Eurosystem), acted as a leading financial authority,
aimed “to safeguard financial stability and promote European financial integration”6. The third
and last EMU phase consisted in monetary union by 1999 and adopting a single currency by
2002, the Euro. The process has not been easy to implement, with some critical issue to solve.
Sturm (2009) identifies four effects of the introduction of euro notes and coins (“euro cash
changeover”) on consumer price anomalies. These anomalies are caused by the conversion of
prices from national currencies to the euro, on the effects of price developments at the euro
changeover on different types of households, on the inflation perceptions, on the effect of the
euro on the dispersion of prices across countries.
After the country member growth in 1995, EU prepared the biggest ever enlargement. It
received application from the six former Soviet bloc countries (Bulgaria, Czech Republic,
6 See at https://www.ecb.europa.eu/home/html/index.en.html
17
Hungary, Poland, Romania and Slovakia), the three Baltic states that had been part of the Soviet
Union (Estonia, Latvia and Lithuania), one of the republics of former Yugoslavia (Slovenia)
and two Mediterranean countries (Cyprus and Malta). Negotiations opened in December 1997.
Ten more states of the candidate countries joined the European Union on 1 May 2004. Bulgaria
and Romania joined in 2007 and Croatia joined in 2013. The enlargement brings the EU’s
membership up to 28 member states.
EU tried two times to reform itself (Amsterdam 1997 and Nice 2000) but it was not so easy,
due to the difficulty to explain the reform to EU’s voters and the difference between the EU’s
countries. Germany re-launched the institutional reform process in 2007 (Moravcsik, 1998 and
Dinan 1999).
The EU Member States signed the Reform Treaty, known as the Lisbon Treaty, on December
2007 (Kurpas, 2007). It entered into force on December 2009. The Treaty of Lisbon is the
constitutional basis of the European Union. It reformed the EU institutions and the internal
policies, improved the EU decision-making process and strengthened the democratic dimension
and the external policies of the EU.
1.3 Energy policies in Europe
The following passages of the chapter try to show how the Member States collaborated in order
to achieve energy cooperation. As it is explained below, Member States usually managed
energy on their own. They started to cooperate on energy goals only in the last years of the XX
century, when the environmental topics urged.
1.3.1 1945 – 1986: Post-war reconstruction and oil shocks
At the end of World War II in Europe there were not enough facilities for the production of
energy. Therefore, for the majority of European countries, the first objective was to reconstruct
energy facilities in order to satisfy the request and to return as soon as possible to the pre-war
level of electricity generation (Tehrani, 2013). In order to achieve this goal, France and Italy
(in 1946) and UK (in 1947) chose to increase their control on the production of electricity
through nationalisation and the creation of monopolies (Chick, 2007). In this way, the states
had direct control on pricing and technology choices. Differently, Germany and Spain chose no
centralised planning. Germany kept its structure of local and regional providers that
characterised the country in the pre-war period, due to its division in Länder. In Spain, private
companies controlled the electricity sector and in 1944 they created the “Asociaciòn Española

18
de la Industria Elèctrica” (UNESA) to promote a “real national electricity system”7,
alternatively to the national electricity companies Endesa (1944) and Enher (1949). The
government controlled prices through the “Unified limited rates” system (1951). In this way,
whether they were national companies or not, the state influenced the market, both the entrants
on the market and price regulation and was involved in investments choices to answer demand.
During the ‘50s and ‘60s the imports of cheap oil threatened the European production of coal.
Domestic producers asked for protection against oil imports. France reduced coal production in
favour of oil imports. Differently, the UK and Germany took measures to protect domestic coal
production. Especially the UK established a tax for oil imports.
In 1973 and 1979 two oil shocks occurred. In reaction to a huge increase of fossil fuel prices
many kinds of measures were taken: the International Energy Agency (IEA) were created in
1974 within the framework of the Organisation for Economic Co-operation and Development
(OECD)8 to implement an international energy programme.
As a consequence of the shocks, in 1974 the EEC established a “Council Resolution concerning
a new energy policy strategy for the Community”9, which was shortly enhanced with energy
goals for 1985. With this Resolution the Council emphasised the added value of close
coordination among Member States and also adopted guidelines concerning energy supply, i.e.
promotion of nuclear energy, hydrocarbon and solid fuels in the Community, and
diversification. Other guidelines concerned energy demand, due to use energy more rationally.
UK started exploring North Sea for new resources. Firms returned to coal use and some
countries started developing a nuclear programme, as it is explained below (Tehrani et al. 2013).
The 1973 crisis in particular caused a rift between the United States and its trans-Atlantic allies
and provoked considerable debate within the recently enlarged EEC about not just energy but
also wider foreign policy issues (Venn, 2002). To react to high oil prices, all countries also took
measures to reduce their dependency to oil.
1.3.2 The nuclear energy10
As a direct result of the oil crisis, countries started developing nuclear programmes. France,
Spain, Italy, Germany and UK took different choices, which are summarised below.
7 UNESA Website, Historia, on line: http://www.unesa.es/que-es-unesalhistoria 8 See at http://www.iea.org/aboutus/ 9 Council Resolution of 17 September 1974 concerning a new energy policy strategy for the Community. Official Journal C 153 , 09/07/1975 P. 0001 – 0002. See at: http://eurlex.europa.eu/LexUriServ/LexUriServ.do?uri=CELEX:31975Y 0709%2801%29:EN:HTML 10 World Nuclear Association. See at www.world-nuclear.org for country profile.

19
France - In 1974, the Prime Minister Pierre Messmer announced a huge nuclear developing
programme (Hecht, 2009). The programme envisaged to construct around 80 nuclear power
plants by 1985 and 170 nuclear plants by 2000. In the following 15 years, France installed 56
reactors, and at the end of 2000s, the country had 59 operative reactors. Nowadays, 407 TWh
(75%) out of the 541 TWh country’s total production comes from fission-electric power
stations, the highest percentage in the world. However, François Hollande, who won the 2012
Presidential Elections, included a partial nuclear phase-out in his party program (Reuter, 2015).
This program plans to close the 24 oldest reactors by 2025. In 2015 France’s National Assembly
voted that by 2025 only 50% of energy will be produced by nuclear plants.
Spain – The Spanish nuclear power plants construction started in 1964 with the creation of four
small and medium-sized power plants, with a total generation capacity of 1220 MW. In the
early 1970s the government started to construct a second generation of seven reactors, five of
which were completed. In 1971, Spain had reached a higher nuclear position than its economic
performance in the international arena. Spain appeared as the poorest country in the Western
world that made use of nuclear power commercially and the only dictatorship (De La Torre,
2014). In the early 1980s, a third generation of five power plants was launched, but only two
of them were completed. Nowadays, Spain has seven nuclear reactors generating 1/5 of its
electricity.
Italy – Italy at the end of the Second World War was a pioneer of civil nuclear power. In 1946,
Edison S.p.A., Fiat and Cogne Acciai Speciali founded CISE (Centro Informazioni Studi
Esperienze), one of the first nuclear research centre. In 1952, the Italian government created a
public institution for the nuclear research, the “Comitato Nazionale per le Ricerche Nucleari”
(CNRN), under the jurisdiction of the “Consiglio Nazionale delle Ricerche” (CNR). CNRN
then became an independent body of research, the “Comitato Nazionale per l’Energia Nucleare”
(CNEN) (Sileo, 2008). The construction of the first reactor took place in Latina in 1958. In
1959, the first General Electric (GE) boiling water reactor (BWR) was realised in Garigliano.
The construction of a Westinghouse Pressurized Water Reactor (PWR), the Enrico Fermi
Nuclear Power Plant, started in 1961 in Trino Vercellese.
Initially, different companies owned these power plants. On the 27th November 1962, Italian
Parliament approved the foundation of “Ente Nazionale per l’Energia Elettrica”11 (ENEL) and
the transfer to it of all the activities of the firms operating in the market. The Government
created ENEL to face two main goals: to eliminate imbalances and differences between
Northern and Southern regions of Italy and to deliver electricity to citizens at affordable prices.
11 Atti parlamentari, Camera dei Deputati, Seduta di martedì 27 Novembre 1962, Disegno di Legge “Istituzione dell’Ente per l’energia elettrica e trasferimento ad esso delle imprese esercenti le industrie elettriche”

20
At the end of 1962, the whole electricity market was under the monopoly of ENEL. The first
problem that ENEL faced was the building of new power plants. In fact, at the end of the 50s,
hydroelectric plants reached their limits. Environmental damages, like the Vajont disaster in
1963, stopped projects of new plants. In 1967, the consumption of fossil fuels for power
generation grew, overpassing the hydroelectric and making the country dependent from foreign
coal and oil12. The positive trend and great increase due to the exploitation of thermoelectric
plants suddenly stopped in 1973 and 1979 with the oil crisis. Due to the high prices of oil, the
Italian government decided to diversify its supply sources. The consumption of coal and the net
import of energy increased. Since the 1963, the government started a very ambitious energy
plan with a strong development in nuclear energy, due to its great know-how (Enrico Fermi and
Felice Ippolito). After the oil crisis a renewed interest for nuclear grew: new plants in Caorso
and Montalto di Castro were built or planned to build, in order to join those one already active
in Garigliano and Trino Vercellese. At that time, the nuclear sector in Italy was less developed
than the other countries. Bureaucracy concessions caused delays and problems to the realization
of the national nuclear plan. Even so, the Government decided to abandon the plan because of
the high costs of the plants and the convenience of the thermoelectric plants.
The Chernobyl accident in 1986 prompted further debate on nuclear power. An abrogative
referendum followed in 8-9 November 1987 on three different themes: the attribution to the
“Comitato interministeriale per la programmazione economica” (CIPE) of decisional power for
the construction of the nuclear plants, to authorize Enel to pay Regions for the electricity
produced and to allow Enel to promote the construction of nuclear plants. After the vote and
the winning of the “yes”, with an average of the 80%, the government decided to terminate the
programme and to dismiss the nuclear plants, finally in 1990. In 2009, the Italian government
approved a package of legislation on nuclear energy with the goal to have ten new nuclear
reactors and the 25% of electricity generated by nuclear power by 2030. In 2011, a referendum
rejected all of the initiatives of the government.
Germany – German support for nuclear energy was very strong in the 1970s as a consequence
of the oil price shocks. As in France, there was a perception of vulnerability regarding energy
supplies. After the Chernobyl accident in 1986, in August 1986, a resolution passed to abandon
nuclear power within ten years. The last nuclear plant constructed in Germany was in
Neckarwestheim in 1989. When Germany was reunited in 1990, the government decided to
shut down for safety reasons all the Soviet-designed reactors located in the Eastern part of the
country. However, the eight reactors were shut down only in 2011. Until March 2011, Germany
12 “An Electric History”, Archivio Storico ENEL. See at https://www.enel.it/it-it/Documents/azienda/sostenibilita/09_una_storia_elettrica.pdf

21
obtained one-quarter of its electricity from nuclear energy, using 17 reactors. Nowadays, the
share of nuclear energy is about 17%. The debate on the premature phase-out of nuclear power
generation in Germany started in 2000s with an intense dispute on the effective operating time
for the existing power plants (Böhringer, 2000). One of the main problem is the cost of phasing
out nuclear power: in 2011, decommissioning 23 nuclear units was expected to cost €48 billion.
United Kingdom – The nuclear experience started in 1954, when the government founded the
United Kingdom Atomic Energy Authority (UKAEA)13. In August 1956 the first station was
connected. It was Calder Hall power plants, the world’s first nuclear power station to deliver
electricity in commercial quantities: its four reactors produced 60 MWe each. The last plant,
Sizewell B, was constructed in 1995. It was the first of a series of four other plants, but the rest
were dropped as they were inefficient. In the early 1990s, the government decided to privatise
the electric power industry. In 1996, the UK’s most advanced nuclear plants were absorbed in
British Energy, and the government raised £2.1 billion. Nowadays the UK has 16 reactors
generating about 18% of its electricity and most of these are to be retired by 2023. To face this
situation, the government has planned to build new reactors for a total of 19 GWe by 2025.
Nowadays, UK government has decided to invest in the sector in order to “establish nuclear
fusion as a viable power source” (Cashmore, 2015). Thus, in 2014 the government started the
construction of two new facilities.
1.4 1986 – 2012: The liberalisation process
The Financial Times declared that “energy liberalisation is a political and regulatory process
that brings competition into former electricity and gas monopolies. Competition occurs mainly
in power generation and sales activities. Network activities such as transport and distribution
are traditionally maintained regulated. The aim of energy liberalisation is to create competitive
markets, leading to more efficiency and innovation in the industry. […] Energy liberalisation
comes traditionally with a privatisation process, when formerly state-owned utilities are
privatised or part-privatised”14.
The liberalisation process of the electricity market started in the United Kingdom in the first
years of the ‘80s. The UK was the first country in Europe and the second in the world after
Chile to reform its energy market (Pollitt, 2004). The privatisation of the English market is
important, not for its dimension, but for the model of privatisation adopted, later implemented
by the other countries.
13 UKAEA. See at https://www.gov.uk/government/organisations/uk-atomic-energy-authority 14 See at http://lexicon.ft.com/Term?term=energy-liberalisation

22
The UK liberalisation process established the guidelines for the following legislation of the
European liberalisation in 1996.
1.4.1 The UK case history
Government and parliament controlled the electricity market in the period between 1948, year
of the nationalisation, and 1990. The market was divided in three distinct geographical areas:
England and Wales, Scotland and Northern Ireland. The responsible for generation and
transmission in England and Wales was the nationalised Central Electricity Generation Board
(CEGB). The firm collaborated with 12 regional bodies – the Area Boards – that dealt with
distribution and supply. In contrast, there was full vertical integration in Scotland and Northern
Ireland through the nationalised North of Scotland Hydro-Electric Board, South of Scotland
Electricity Board and Northern Ireland Electricity Board (Lehtonen, 2009). A regulation of the
industry in the form of Treasury monitoring and assessment of major investments projects,
followed in 1960.
The government-appointed Monopolies and Merger Commission, then Competition
Commission (closed on 1 April 2014), now Competition and Markets Authority (CMA)15, had
powers to report on the activities of the nationalised industries and their efficiency. In terms of
its environmental impact, health, safety and nuclear safety, government departments and
government agencies regulated the industry. Now it works “to promote competition for the
benefit of consumers, both within and outside the UK”.
Between the 1980s and the 1990s, the Conservative Government first introduced some
liberalisation into the industry and then restructured and privatised it.
The first attempt to liberalise the market was in 1983 with the Energy Act. The Act is created
to “amend the law relating to electricity so as to facilitate the generation and supply of electricity
by persons other than Electricity Boards”16. The Act removed the requirement that only Area
Boards could supply electricity but imposed the duty to buy electricity on “fair terms” from a
private generator or supplier. The Act had a very limited impact with only a small number of
private companies entering the market.
The government continued to maintain the golden share in the privatised companies since the
1995, when these shares were withdrawn. US-owned companies composed the first wave of
acquisition that bought up several regional electricity companies while also acquiring
generating capacities.
15 See at https://www.gov.uk/government/organisations/competition-and-markets-authority/about 16 Energy Act 1983, Chapter 25, 9th May 1983
23
The main goal of the Conservative government in its privatisation project was to reorganise the
industry in order to create real competition. Limits to this challenge were the transmission and
distribution elements of supplying electricity that were natural monopolies (Haskel and
Szymanski, 1992).
The Conservative government privatised British Gas in 1986 but left it with a monopoly
position within the sector, and with some problems concerning public service obligations and
security of supply (Stern 1997). Consequently, the government planned to restructure the
electricity industry and tried to create conditions to make it easier for new entrants to compete
with the privatised generators. In 1989, the government presented a White Book that became
law through the Electricity Act. It is “an Act to provide for the appointment and functions of a
Director General of Electricity Supply and of consumers’ committees for the electricity supply
industry; […] to provide for the vesting of the property, rights and liabilities of the Electricity
Boards and the Electricity Council in companies nominated by the Secretary of State and the
subsequent dissolution of those Boards and that Council”17. The Act regulated the first phase
from the end of 1990 until 1992. In the late 1980s, the government sold off English and Walsh
generating and regional electricity companies. Then, between 1990 and 1992 sold the Scottish
vertical integrated companies. The Northern Ireland supply industry followed in 1993 and the
nuclear part of the industry became British Energy in 1996. In 1990, the government divided
the CEGB’s power stations between Nuclear Electric (14%), now EDF Energy, that remain
under public control, E.ON UK18, formerly Powergen (52%), and National Power (34%), which
in 2000 was divided between Innogy (now RWE19 npower plc) and International Power (now
Engie Energy International20). Another entity created from the CEGB was the National Grid
Company (NGC)21, the owner of the national transmission network. With the new market
structure, National Power and Powergen started to supply energy directly to larger consumers
while the regional electricity companies started to invest in generating capacity. In Scotland,
the government sold off the vertically integrated duopolies without any changes to their
structure.
The Act established a new regulator of the market, the Director General of Electricity Supplies
(DGES), who had the support of the Office of Electricity Regulation (Offer), now Ofgem22.
The DGES had the main responsibility to promote competition within the industry.
17 Electricity Act 1989, Chapter 29, 27th July 1989 18 See at https://www.eonenergy.com/ 19 See at http://www.rwe.com 20 See at http://www.engie.com/en/ 21 See at http://www2.nationalgrid.com/uk/ 22 See at https://www.ofgem.gov.uk/

24
The Conservative government intention was to create a real wholesale market for electricity
with the generating companies selling their output at changing prices in response to the
demands of the regional electricity companies and any new entrants on the supply side. The
challenge was to do something that had not been attempted anywhere else in the world and the
initial structure – the Electricity Pool of England and Wales – proved not to be a long-term
solution. In fact, the connector to Scotland did not have enough capacity to allow there to be an
efficient flow of electricity between the countries. This would only change in 2005. The Pool
worked on the basis of bids from the generating companies setting the price at which they would
sell electricity in 48 half-hourly blocks over a 24-hour period. The National Grid Company run
the system and entered the bids into a specially designed programme (“Goal”).
In the years after 1990, the British government created a wholesale market where all the
generators could sell their output on the same terms. Similarly, all retail suppliers could buy
electricity on the same terms: the access to the distribution system allowed competition in
supply. So, the Pool system allowed market competition in both generation and supply, and
prices to most consumers fell by around 30% in real terms (Green 1998). However, two main
problems emerged in the way the Pool operated in practice. The first problem was the scope for
the generating companies to restrict supplied quantities and therefore push up the price of
wholesale electricity. The second problem was the extensive use of the Contract for Differences
(CfDs). These contracts were long-term, bilateral agreements between a generator and
electricity supply company. These contracts where excessively risky, identified in the market
risk, the liquidation risk and the counterparty risk. The main risk where the market risk: CfDs
where traded on margin and the leveraging effect of this increases the risk significantly. The
main criticism of the performance of the electricity market was that the restructuring in 1990
created an effective duopoly: National Power and PowerGen set the price over 90 per cent of
the time (Newbery 1998).
In 1997, the government decided to realise a major reform of the market. The Government
accepted the Proposal of the Director General of Electricity Supply (DGES) in October 1998
in its White Paper on Energy Policy23. In essence, the main term of the new Energy Policy was
concerned with a better liberalisation, with particular emphasis on its social goals (Pearson,
2012). In November 1998, the DGES published a Framework Document24 that explained how
the Programme for the Electricity Trading Arrangements (RETA) would be taken forward. The
23 “Conclusions on the Review of Energy Sources for Power Generation and Government response to fourth and fifth Reports of the Trade and Industry Committee”, October 1998. See at http://webarchive.nationalarchives.gov.uk/19990117061127/dti.gov.uk/energy/ 24 “Review of Electricity Trading Arrangements: Framework Document”, OFFER, November 1998. See at https://www.ofgem.gov.uk/ofgem-publications/79067/review-electricity-trading-arrangements.pdf

25
proposals were to put in place market-based trading arrangements more like those in commodity
markets and competitive energy markets. The Government designed the markets to be more
efficient and provide greater choice for market participants while maintaining the operation of
a secure and reliable electricity system. The New Electricity Trading Agreements (NETA)
created by the market reform came into force on 27th March 2001. The next key development
was the expansion of NETA into the British Electricity Transmission and Trading
Arrangements (BETTA) in 2005, bringing Scotland into the market for the first time.
1.4.2 The European Liberalisation
The European liberalisation followed the UK liberalisation. However, unlike the UK process,
Europe had to face the individual interests of the member countries.
It firstly started in 1986, when the Single European Act (SEA) “revised the Treaties of Rome
in order to add new momentum to European integration and to complete the internal market”25
and included some advices on environmental protection26: the Community must “preserve,
protect and improve the quality of the environment, to contribute towards protecting human
health, and to ensure a prudent and rational utilization of natural resources”. Even if over the
following years the issue of environmental protection became more important in Europe, this
did not translate into European agenda and the environmental and energy policies laid on
economic objectives.
More in detail, the commission published a White Paper27 that identified the 279 measures
needed to complete the Internal Market. As described in the previous section, in 1989 the United
Kingdom started its liberalisation process of the energy market, the first example in the world,
adopted as a model by the other countries.
In 1992 the Commission failed in the attempt to include a separate energy chapter into the
Treaty of Maastricht. Several Member States, especially those that had fairly high own reserves,
banned the proposal as they did not want to give away autonomy in that field. The references
to energy28 in the Treaty were useless for general energy legislation.
In 1996, the European Parliament and the European Council released the 96/92/EC29 “Directive
on common rules for the internal market”. This Directive, for the first time, “established
common rules for the generation, transmission and distribution of electricity. It laid down the
25 “The Single European Act”, Luxembourg, February 1986. See at http://eur-lex.europa.eu/legal-content/EN/TXT/HTML/?uri=URISERV:xy0027&from=EN 26 Articles 130R, 130S and 130T. 27 “Completing the Internal Market”, White Paper from the Commission to the European Council, 1985 28 Articles 130s. 29 See at http://eur-lex.europa.eu/LexUriServ/LexUriServ.do?uri=CELEX:31996L0092:EN:HTML
26
rules relating to the organisation and functioning of the electricity sector, access to market, the
criteria and procedures applicable to calls for tender and the granting of authorisations and the
operations of systems”30 . In its 29 articles, the Directive specified what the Member States had
to do in order to liberalise the market. The Directive’s three main points were about the Market,
the creation of a national System Operator and the Member States. The Directive defined the
Market as competitive but at the same time it must took into account public service obligations.
The firms that operate into the Market had to respect the competition rules of the Treaty.
The discussion on the National System Operator get more difficult. The Operator, which each
Member States had to designate, had different responsibility, such as responsibility for
operating, ensuring the maintenance of, and, if necessary, developing the transmission system
in a given area. It should be responsible for managing energy flows on the system and shall be
responsible for ensuring a secure, reliable and efficient energy system. The System Operator
should be independent at least in management terms from other activities not relating to the
transmission system. The last Article of the Decree talked about the role of the Member States.
The Member States should create appropriate and efficient mechanisms for regulation, control
and transparency so as to avoid any abuse of dominant position, in particular to the detriment
of consumers, and any predatory behaviour. According to the article n. 86 of the Treaty31, “any
abuse by one or more undertakings of a dominant position within the common market or in a
substantial part of it shall be prohibited as incompatible with the common market in so far as it
may affect trade between Member States”. Therefore, the 96/92/EC Directive created the
structure where the Member States could move to reorganise their markets. The Member States
experienced different energy situation and did not coordinate among them.
After the Directive and the adoption of the Kyoto protocol in 1997, climate change and thus
energy issues came strong on the global agenda. EU came to the conclusion that energy and
climate challenges were such of a scale that solutions were not to be found on the national state
level.
The second Directive in 200332, established common rules for the generation, transmission,
distribution and supply of electricity. It laid down the rules relating to the organisation and
functioning of the electricity sector, access to the market, the criteria and procedures applicable
to calls for tenders and the granting of authorisations and the operation of systems. The
Directive further promoted competition through more stringent rules of access to networks and
requiring independent regulators. The regulation of cross-border trade was aimed to facilitate
30 Directive 96/92/EC, art. 1 31 Treaty Establishing the European Community, Rome, 1957. See at http://ec.europa.eu/archives/emu_history/documents/treaties/rometreaty2.pdf 32 Directive 2003/54/EC “Concerning common rules for the internal market in electricity”

27
market integration. By July 2007, Directive main objectives were: unbundling of transmission
system operators (TSOs) and distribution system operators (DSOs) from the rest of the industry,
free entry to generation, monitoring of supply competition, full market opening, promotion of
renewable sources, strengthening the role of the regulator and a single European market
(Jamasb and Pollitt 2005).
A new round of EU energy market legislation, known as the third “Internal Energy Market
Package” or the “Third Energy Package” (TEP), was proposed by the European Commission
in September 2007. This Package was adopted by the European Parliament and the Council of
the European Union in July 2009. It entered into force on 3 September 2009. It has been enacted
to improve the functioning of the internal energy market and resolve structural problems33. In
order to achieve the goal of a single internal energy market policies had to remove or reduce
differences between countries about cross-border trade, governance and regulation of energy
(Dutton, 2015). More in detail, the directives and regulations composing the legislation
package covers five main areas:
• Unbundling energy suppliers from network operators;
• Strengthening the independence of regulators;
• Establishment of the Agency for the Cooperation of Energy Regulators (ACER);
• Cross-border cooperation between transmission system operators and the creation of
European Networks for Transmission System Operators;
• Increase transparency in retail markets to benefit consumers.
Under the Legislation Package, unbundling must be applied by the Member countries from
three different choices: Ownership Unbundling, Independent System Operator and Independent
Transmission Operator.
The second area covered by the Third Package was to guarantee independent regulators who
ensured the application of the rules. Another important goal of the national regulators was to
cooperate each other to promote competition, the opening-up of the market and secure energy
network system (Kayikci, 2011).
In order to help the cooperation between the different national operators and to ensure the
smooth functioning of the internal energy market, the EU established the Agency for the
Cooperation of Energy Regulators34 (ACER). It is independent from the Commission, national
governments and energy companies.
National transmission system operators were responsible for controlling the effective
transportation of electricity and natural gas through pipelines and grid. Operators had to work
33 See at https://ec.europa.eu/energy/en/topics/markets-and-consumers/market-legislation 34 See at http://www.acer.europa.eu/

28
together to ensure the optimal management of EU networks. Two operators guaranteed the
cross-border cooperation of gas and electricity: the European Network for Transmission System
Operators for Electricity35 (ENTSO-E) and the European Network for Transmission System
Operators for Gas36 (ENTSOG).
The Third Package finally included rules designed to benefit European energy consumers and
protect their rights. The right to choose or change suppliers without extra charges, receive
information on energy consumption, and quickly and cheaply resolve disputes.
In 2010, the European Commission also published a Communication in which it emphasized a
new energy policy: the 20-20-20 Policy, also called the 2020 Energy Strategy or Europe 202037.
It was entitled: “a strategy for smart, sustainable and inclusive growth”. Aims of this
Communication was that Member States had to reduce their consumption of primary energy,
reduce gas emissions and increase the use of renewable energies in energy consumption by 20%
within 2020. This new strategy tried to take advantage of the strengths of the Lisbon strategy
(goals of growth and job creation) and, at the same time, to not do the same mistakes (poor
implementation, differences between countries). To do so, Europe promoted fiscal incentives
for building sectors, abolished wastes in lightning, collaborated with the European Investment
Bank (EIB) and the European Bank for Reconstruction and Development (EBRD) in order to
create financing initiatives for sustainable energy, develop new opportunities for the economy
in energy efficiency and green technologies.
1.4.3 Italian Electricity Market
In July 1992, ENEL became a private company and the Ministry of the Economy became the
only shareholder. This operation was part of a plan of state disinvestments and it included also
a future listing of the company, which effectively occurred in 1999.
In November 1995 the Government established an independent energy regulator “Autorità per
l’Energia Elettrica ed il Gas”38 (AEEG). This was considered a necessary requirement before
changing the ownership of ENEL and, therefore, a strong signal of the government’s
willingness to privatise the electricity industry. The main goal of the AEEG can be summarised
as follows39: (a) to promote competition, efficiency and a high standard of quality in the
35 See at https://www.entsoe.eu/ 36 See at http://www.entsog.eu/ 37 “Communication from the Commission Europe 2020 A strategy for smart , sustainable and inclusive growth”, Brussels, 2010. See at http://eurlex.europa.eu/LexUriServ/LexUriServ.do?uri=COM:2010:2020:FIN:EN:PDF 38 Legge n. 481/95, “Norme per la concorrenza e la regolazione dei servizi di pubblica utilità. Istituzione delle Autorità di regolazione dei servizi di pubblica utilità”, GU n.270 18 novembre 1995. 39 Law November 14th 1995, n 481, ART. 1(1). See at http://www.normattiva.it/urires/N2Ls?urn:nir:stato:legge:1995-11-14;481!vig=

29
industries; (b) to guarantee widespread services all over the national area; (c) to define a definite
and clear price list based on fixed criteria; (d) to guarantee fair returns to companies; (e) to
promote business' protection for users and consumers. The same law put the Government in
charge of the privatisation process40. At that stage, the need to restructure the industry and create
competition at least in the generation phase was generally agreed. However, there was not a
political consensus on the privatisation. There were divergent positions on whether to enact a
new electricity law, on which to base the new industrial structure, or to wait for the EU directive
on the Internal Electricity Market to be completed and adopt it as the main framework for the
Italian internal market.
1.4.4 The Italian liberalisation process
In order to liberalise the Italian market, the Government adopted the last option, and since June
1996 the Italian Government moved towards the reorganisation of the industrial and ownership
structure. It occurred in 1999 when the Government adopted the legislative decree n. 79 March
1999, and its first chapter on the "Liberalisation of the Electricity Market"41. This Decree
implemented the European 96/92/EC Directive in the Italian legislation.
The European Directive laid down only the general condition that should be in place to assure
the creation of a single Internal European Market (IEM) in Europe, but refrained from designing
a concrete market. Given this freedom, most European countries chose to keep centralised
components to a minimum and to leave market organisation to the dynamics of private
initiative. The question of third-party access to the network became central to the debate around
the liberalisation of the European electricity markets due to the natural monopoly characteristic
of the transmission network. The European Union's electricity Directive provides three
institutional options for the organisation of network access: the single buyer procedure, the
negotiated third-party access and the regulated third-party access.
The Negotiated Third Party Access (NTPA) allowed large electricity users to conclude supply
contracts directly with any (internal or foreign) generator. Those countries where the industry
was already highly liberalised (UK and the Nordic countries) generally preferred this system.
On the other hand, countries that have kept a public monopolistic structure have supported the
proposal of the Single Buyer system. This system designated a national electricity buyer to
arrange contracts on behalf of “small” customers. The EU Directive allowed to open the market
for “large” customers to competition. According to this system only “eligible customers” could
40 Law November 14th 1995, n. 481, art. 1(2). 41 Decreto Legislativo 16 marzo 1999, n.79, “Attuazione della direttiva 96/92/CE recante norme comuni per il mercato interno dell’energia elettrica”, GU n.75 31 marzo 1999. See at http://www.parlamento.it/parlam/leggi/deleghe/99079dl.htm

30
buy the energy directly from the generators42, while others have to be supplied (by law) by the
single buyer. The systems provided by the Directive do not lead to equivalent economic results
even if the systems were intended to.
Thanks to the approval of the Legislative Decree 79/99 the Italian legislation approved the
creation of the Electricity Italian Market. The Decree started the reform of the Electricity Sector
in Italy and finally responded to promote competition in the sector for the activity of production,
import, export, purchase and sale and to maximise transparency and efficiency in the naturally
monopolistic activity of dispatching. The activities performed by the actors of the market were:
• Generation: the transformation of primary power source in electricity by power plants.
This is a liberalised activity. Recently, thanks to state subsidies for renewables, the State
has launched some programs of collaboration between citizens in order to co-generate
and self-consume the energy.
• Transmission: the transport and transformation of electric power on the high voltage
grid. This is a monopolistic activity at national level. The electricity generated by plants
or imported from other countries is transferred to consuming zones.
• Distribution: transport and transformation of electric power on the medium and low
voltage grid. This is a monopolistic activity at municipality level.
Nowadays, along with the Parliament and the Government, there are various institutions that
take care of the electricity market which is ruled by law. The Ministry of Economic
Development (“Ministero dello Sviluppo Economico, MSE) defines strategic and operational
safety and cost effectiveness of the national power system. The “Autorità per l’energia elettrica,
il gas ed il sistema idrico” (AEEGSI, Electricity, Gas and Water System Regulator) guarantees
the promotion of competition and efficiency in the sector, with functions of regulation and
control. The GSE deals with the production and stimulation of the production of electricity from
renewable sources. The “Acquirente Unico” (AU, Single Buyer) guarantees the availability of
electricity to cover the demand of Captive Customers (final customers allowed to contract or
opting for energy only with their local distributor).
The innovation of the Italian Decree consisted in rules created to limit ENEL’s power on the
electric market. The Decree implemented a new structure of the electricity system. The Decree
imposed specific rules to ENEL:
42 Notice that the directive also includes a safeguard clause (art.19/5) to enable member states to deal with market imbalances caused by the opening of markets to competition. In this context, member states may ban the supply of electricity from another member state towards one of its eligible customers should this type of customer not be equally considered as eligible in the exporting member state

31
• ENEL had to reduce its market share: from the 1 January 2003, no firm could have more
than 50% of total installed power or to sell more than 50% of total energy, including
imports.
• It had to sell power plants for 15100 MW and group the power plants in three societies
called GenCos (Generation Company): Eurogen, Elettrogen and Interpower, made of
thermoelectric and hydroelectric plants.
• It had to create independent societies for the management of different activities: energy
production, energy distribution and sale to non-eligible customers, sale to eligible
customers, property rights of transmission networks and the dismantling of disused
nuclear power plants.
The Decree implemented new rules for the distribution activities. In particular art. 9(3) of the
Decree declared that "in order to rationalise the distribution of electricity, it is released only one
distribution grant for municipality". To do so, the supplier companies operating in the same
municipality had to aggregate their activities.
ENEL must grant exclusive rights for distribution to several companies, each operating on a
territorial basis (local monopolies). Some of the companies were municipal and others were
subsidiaries of ENEL. The new system based its structure on concessions granted for 30 years,
from 2001 to 2030. In the two-year period 2001-2002, the Government sold its Generation
Companies (GenCos):
• Elettrogen (5438 MW) was acquired by Endesa, the most important Spanish utility, in
a pool which also comprised a small utility of Brescia (ASM) and the Santander Central
Hispano, the most important Spanish bank. The price of Elettrogen was 2.83 billion
euros43.
• Eurogen (7008 MW) was sold in 2002 to Edipower, divided between Edison (40%),
utilities of Milan and Turin (13% each), a Swiss utility (Atel, 13%) and different Italian
and international banks (20%). According to private agreements between these partners,
Edison gained 3500 MW while the other utilities controlled 1150 MW each one. In this
operation, Electricité de France gained more than the others, because controlled Edison
and Atel44.
• Interpower, now renamed Tirreno Power (2611 MW), yielded a return of 874
million/Euros. Energia Italia and the joint venture Electrabel /Acea bought it in 200245.
43 “La cessione di Elettrogen”, Il Sole 24 Ore, 2002 44 “Enel, Eurogen a Edipower per 3,7 miliardi di euro”, Il Sole 24 Ore, 2002 45 “Enel cede Interpower per 874 mln”, Il Sole 24 Ore, 2002

32
The Government decided to give the management and full control of the transmission network
to an independent system operator, the “Gestore della Rete di Trasmissione Nazionale”
(GRTN), a state-owned company46. The ownership of the network remained into the ENEL
group in a new independent company called Trasmissione Elettrica Rete Nazionale S.p.A.
(TERNA), founded on May 31st 1999.
However, although important organisational changes had been made in the functioning of the
market, the Italian power system faced a critical situation in 2003, when a national blackout
occurred. The 2003 Italian blackout was caused by a malfunction on the power line between
Italy and Switzerland. The separation of the interconnected networks is a rare event, although
forecasted by the electricity system management. In this case, the first line of defence of the
electricity network is set in order to secure network itself: the loss of a system's component –
i.e. a power line or a generator group – cannot provoke an irregular behaviour of the system.
This protection system is adopted for each grid by every single network manager which are part
of the EIM. In 2003 the first line of defence, and consequently the other two lines, did not work
and the system collapsed. Another problem connected to the blackout was the delayed restart
of the system due to malfunctions in the telecommunications systems between GRTN and local
operators, fundamental for the restart operations47. The Italian Government tried to solve this
anomaly only in 2005, firstly with the Decree n. 239/2003 and finally with the Decree May 11st
200448, with the unification between Terna and GRTN. Terna started to manage both the
network and the dispatching, while GRTN, renamed “Gestore dei Servizi Energetici” (GSE)49
started to promote and support renewable energy sources (RES) in Italy. More in detail, GSE
fostered sustainable development by providing support for renewable electricity (RES-E)
generation and by taking actions to build awareness of environmentally-efficient energy uses.
GSE controlled different Italian companies:
• Gestore dei Mercati Energetici50 (GME) controls and economically manages the
Electricity Market, under principles of neutrality, transparency, objectivity, and
competition between or among producers.
• Acquirente Unico51 (AU) has the mission to procure continuous, secure, efficient and
reasonably-priced electricity supply for households and small businesses. AU buys
46 Legislative Decree March 16th 1999, n. 79, art. 3(4). See at http://www.parlamento.it/parlam/leggi/deleghe/99079dl.htm 47 Black-out del sistema elettrico italiano del 29 Settembre 2003, Rapporto della Commissione di Indagine, 28 Novembre 2003. See at www.autorita.energia.it/allegati/docs/06/20040706155854doc.pdf+&cd=1&hl=it&ct=clnk&gl=it 48 Then Decreto del Presidente del Consiglio dei Ministri, GU n.115 18/05/2004 49 http://www.gse.it 50 http://www.mercatoelettrico.org/it/ 51 http://www.acquirenteunico.it/

33
electricity in the market on the most favourable terms and resells it to distributors or
retailers of the standard offer market (“mercato di maggior tutela”) for supply to small
consumers who did not switch to the open market.
• April 29th 2009 GSE completely acquire Ricerca del Sistema Energetico52 (RSE), which
carries out research into the field of electrical energy with special focus on national
strategic projects funded through the Fund for Research into Electrical Systems.
In this way, Terna became the only company to control the Italian network.
52 http://www.rse-web.it/home.page

34

35
Chapter 2. The Electricity Market The second chapter is about the operating principles of the Italian electricity market after the
liberalisation process, as described in the previous chapter. The market structure of a power
system has to take into account specific technical constraints – i.e. the balance between power
injected and withdrawn, the losses, the network externalities – in order to keep the system safe.
Another important point for the Italian power system is the price determination mechanism.
Below it is proposed a comparison between two different mechanisms: the System Marginal
Price and the Pay As Bid mechanism, and their effects on the welfare of the system.
2.1 Technical features of power systems
The technical features shown below were designed in order to allow the correct functioning of
the power systems. From this viewpoint, Deane et al. (2015) proposed a theoretical approach
to the security of power and energy systems. In their view, security is a multidimensional
system property, composed by stability, flexibility, resilience, adequacy and robustness, related
to the capacity of the systems to cope with a wide number of different kind of potential threats.
More in detail, these properties are:
• Stability, or operational security. It is related to the capacity of the highly interconnected
power system to absorb sudden disruptions.
• Flexibility. It means the techno-economic capacity of the system to modify electricity
production or consumption to respond to supply and demand in the face of rapid and
large imbalances.
• Adequacy measures whether there is a reasonable expectation that the system as a whole
is evolving in a way to meet demand at all times. System adequacy refers to the capacity
of the system to meet demand under all conditions over the course of a year, in any of
the potential evolutions of the energy system.
• Resilience. It refers to the capacity of the power system to cope with sudden and
transient shocks.
• Robustness to stresses on energy resources and infrastructures. It is mainly an attribute
of the wider energy system. It refers to its capacity to cope with economic or political
constraints.
Even if a multitude of different types of risks are involved in energy security, they all converge
round a common characteristic, i.e. their ability to affect the capacity of the system to deliver
energy services to its end users. Thus, energy security is a state of the whole power and energy
systems. Therefore, the security of the system is not a function of its single components but of

36
their dynamic interactions. Chaudry et al. (2009) affirms that these interactions determine the
capacity of the systems to tolerate disturbance and to continue to deliver affordable energy
services to consumers. Thus, a secure power system is one that is evolving over time with the
adequate capacity to absorb uncertain events: it is able to continue providing the adequate
quantity of energy service needs of users at least cost.
2.1.1 Technical constraints of power system
In order to keep the system secure, the operation of electricity system must meet specific
technical constraints, related to the security of the electricity grid. Firstly, it requires an
instantaneous and continuous balance between the amount of power injected and withdrawn
from the grid. It must take into account the losses of transmission and distribution, and the
network externalities. Secondly, the frequency and the voltage of the network must be kept
within a very narrow range for the security and quality of the service. Finally, it is necessary
that the energy flows of each individual power line do not exceed the maximum limits transit
of the power line itself, the so-called network congestion.
It is hard and expensive to respect these constraints, due to the characteristics of technologies
and to the production, the transport and the consumption. The three main constraints of the
electricity power system are:
- Demand. It is variable and mostly inelastic. The power demand on the network exhibits
a considerable short-term (daily) volatility, as well as a medium term (weekly and
seasonal) volatility. However, volatility has cyclic nature and therefore it is predictable.
- Offer. The electricity installations have minimum and maximum limits to the power
output as well as the minimum time of start-up and ramping constraints. Besides,
electricity cannot be stored in significant quantities. It can be stored indirectly through
hydroelectric pumped storage plants and water basins.
- Transport. It deals with two limitations. Firstly, network externalities: once fed into the
grid, the energy enters all the available power lines, redistributing on the basis of
complex physical laws determined by the balance of injections and withdrawals.
Electricity is not traceable. Therefore, a local disequilibrium spreads across the grid
through power and frequency variations. Secondly, limits of the electricity network
capacity: in order to guarantee the security of the system, power lines can not exceed
their limit. Excessive power flows energy brings to the so-called network congestion.

37
2.1.2 Management of the power system
The high degree of complexity and coordination necessary to ensure the functioning of the
system require the identification of a single coordinator. This latter, which is known as
Dispatcher or System Operator, is equipped with a power control on all the production facilities
of the system. The dispatcher ensures that, given the limits of transits and the dynamic
constraints on generation plants the production always equals the consumption, and frequency
and voltage do not divert from the acceptable levels. In order to do so, the dispatcher performs
the following two core activities: ancillary services and balancing.
2.1.2.1 Dispatch and ancillary services
Every day, the dispatcher prepares the schedules that each generation plant will have to follow
on the next day, in order to meet the expected demand at minimum cost. Obviously, the
dispatcher also has to take into account for the losses that are expected to occur in the system.
Programmes define, for each timeframe of the following day, the amount of energy delivered
to the grid. Besides meeting the operational limits of individual production units, as well as the
transportation limits on the power grid, these programmes must also provide for the availability
of an adequate reserve margin. This latter can be used to face unforeseen events such as
increases in demand, losses of production units or transmission lines.
2.1.2.2 Balancing
The dispatcher guarantees the balance between injections and withdrawals of the entire system
at all times. The balance is guaranteed by control systems and automatic control of the
generation plant (primary and secondary frequency regulation) that raise and lower the feed-in
to compensate for any imbalance on the network. The dispatcher actively intervenes only when
the operating margin reserves of automatic control systems are below security standards, in
order to reintegrate them. The dispatcher then sends order to tertiary reserve units in order to
start, increase or reduce the power output. In order to consider the technical constraints, the
power markets and the market mechanisms are designed for the ancillary service.
2.2 Working mechanisms of the electricity markets The following section describes the different mechanisms to calculate and select the offers on
the electricity markets. The determination of the price is crucial in order to satisfy the actors of
the market. First of all, it is described the merit order principle: it is used in particular to
calculate the Clearing Price of the market. Then, two other mechanisms are considered: the
38
System Marginal Price (SMP) and the Pay-As-Bid (PAB) mechanism. These are different
setting mechanisms for electricity price, one as an alternative to the other.
Furthermore, the Italian market differences consist of the application of a national price and
other different prices, called “zonal prices”, within the market. The market zones and the
functioning of the zonal prices are in the following section.
2.2.1 Merit order
During the market session, the operators can make their proposals and specify the amount and
the purchasing or selling price (respectively the maximum or the minimum price). Each bid
must be consistent with the potential of the offer point. The offers are approved after the closing
of the market sitting according to the economic merit-order criterion. It is a way of ranking
available sources of energy, especially electrical generation, based on ascending order of price
(which may reflect the order of their short-run marginal costs of production) together with
amount of energy that will be generated.
This procedure is the same process implemented by GME in Italy. In fact, at the end of the
presentation session, the GME activates the Market Resolution process. This process refers to
the acceptance of bids submitted into the market. In particular, the process determines the
accepted bids, the price at which they are valued, the injection and withdrawal schedules of the
points to which they refer.
Therefore, the acceptance process could be explained as follows. Firstly, all the valid selling
proposals are organised in an aggregate supply curve where prices are sorted in ascending order
and all the demand proposals are organised in an aggregate demand curve where prices are
sorted in descending order. The intersection of the curves determines the total amount of energy
traded, the clearing price, the deals accepted and the schedules approved.
Secondly, the clearing price is unique in all the zones and equal to P*. The deals accepted have
sale price not exceeding P* and purchase price not less than P*.
The Single Market Clearing Price, as in Figure 4, is not the only way to set the price of the
market and it is not the more efficient. Indeed, the Clearing Price is exposed to several
criticisms. Market power, excessive payments to generators and volatility are the principal
criticisms.
About the excessive payments, the U.S. Electricity Consumers Resource Council claims that
“the requirement that all successful bidders receive the clearing price is extremely lucrative o
suppliers at the expense of consumers” (ELCON, 2002). Also, the American Public Power
Association highlights “substantially high power prices in long-term bilateral markets, prices
that seem to bear little relationship to seller’ actual costs” (APPA, 2004).

39
Fig. 4 Determination of the Clearing Price
2.2.2 The System Marginal Price (SMP) mechanism
The first setting mechanism presented is the System Marginal Price, used for electricity price.
It is widely spread in Europe. The System Marginal Price is the mechanism that compesates
producers corresponding to all the clearing price between supply and demand. The clearing
price is equal to the most expensive price of the offer among those accepted to meet demand.
The matching of supply and demand in the system marginal price respects precise rules. For
the supply, the operators transmit the amount of energy which they can provide and the
minimum price of sale. For the demand, the operators transmit the amount of energy to buy and
the maximum price of purchase.
The system marginal price (Figure 5) is the equilibrium price obtained by comparing the
proposals to sell and purchase, such as to maximise the amount of trade. In the SMP all the
operators are remunerated at the marginal price, which is equal to the price for the last selected
offer, regardless of the price previously offered by the individual operator.
The advantage usually associated to the SMP is the incentive given to innovation and the
efficiency of the production. The difference between the offer price and the marginal price
rewards the efficiency of the plants. It allows manufacturers to invest in technologies which
reduced costs. In fact, competition between suppliers stimulate firms to reduce their production
costs. In the case of a highly competitive market, the producers competing to optimise costs
would exert a downward pressure on the marginal price.

40
Fig. 5 System Marginal Price
The main criticism of the SMP concerns the cost savings that the consumers obtain accepting
offers at the lowest prices of the marginal price. However, it can be assumed that, if it did not
apply the SMP, the offer behaviour would fit in trying to predict the marginal price and
advancing offers little more profitable. Therefore, the savings earned through the SMP are real.
However, not to the extent assumed during the Council of Ministers in November 2008, when
the main lines of the reform (Decree Law 185/08) where discussed. The savings achieved by
users was equivalent to the full difference between the prices offered individually by the
producers and the corresponding marginal price.
Basically, the selection of the offers must take into account the physical constraints of energy
trades, resulting in the capacity of the electrical grid to transport energy production areas to
consuming areas. For example, in Italy before the opening and closing of the MGP, the GME
exchanges informations with Terna.
For that reason, there are producers that, either because they control a wide market share, or
thanks to the importance and strategic location of its plants, have a clearer influence in
determining the price in individual local markets.
The SMP mechanism can be considered a reasonable method for determining the price of
energy (Wang, 1997). However, its operation and the behaviour of individual operators vary
considerably under the influence of other factors, such as the number of competitors and the
physical characteristics of the target market. These are the factors which need further work to
make the market more competitive and bring real benefits to consumers.

41
2.2.3 Pay-As-Bid mechanism (PAB)
The second setting mechanism is usually adopted in response to rising prices in markets. In
order to face this situation, it was necessary to switch from Uniform-Price auctions (also Single
Clearing Price), to Pay-As-Bid auctions (Laffer, 2005). In a Pay-As-Bid auction prices paid to
winning suppliers are based on their actual bids, rather than the highest price of the supplier.
The PAB auctions are also known as “discriminatory auctions” because they pay to the winners
a different price related to the specific prices offered into the auction. On the other hand, price
paid to the consumers is the average price of the winning offers. The yellow area of Figure 6 is
the markup gained by the Consumers. In fact, the consumers gain both the surplus included
between the demand curve and the average price, and the surplus which earlier was of the
Producers.
Fig. 6 System Marginal Price
2.2.4 SMP vs PAB
These two alternative designs and their peculiarity are considered under a wide literature (here
considered Tierney et al. 2008, Newbery and McDaniel 2002). The first, and obvious
impression (Federico et al. 2003, Kahn et al. 2001) comparing the SMP and PAB mechanisms,
is that the latter would reduce consumers’ overall expenditure for wholesale power. However,
literature does not have a favourable position with respect to the switch from the SMP to the
PAB mechanism. In particular, Tierney et al. (2008) reaches four conclusions:

42
- First of all, they exclude the possibility of a reduction in wholesale prices for generation.
Following the authors, even forecasts prices increase beyond the control of the
regulatory authority.
- Second, the margins earned by the plants owners are a means to recover fixed and
capital costs of the plant, and they also allow the latter to improve plant performance.
- Third, the implementation of PAB auctions may have adverse consequences on the
market. In particular PAB has consequences on the market efficiency, including
inefficient plant dispatch, disincentives for demand response and for investment in
baseload.
- Fourth, small suppliers see the reduction of their market power.
A widely analised example about the effects of the switch from SMP to PAB is the UK
(Newbery and McDaniel, 2002, Federico and Rahman, 2001). The literature has shown that in
this country the switch from a uniform price auction to a discriminatory auction under perfect
competition has resulted in a trade-off between efficiency and the level of consumer surplus the
two auction rules. Federico et al. (2001) forecast a negative impact on profits and output, and a
positive impact on consumer surplus, with ambiguous implications for welfare and average
prices.
However, there are also authors who have taken a positive view about the shift to the PAB.
Following Pycia et al. (2015) and Woodward (2014), the PAB auctions are preferred to the
SMP, especially for divisible goods. Someone suggests the introduction of a “cap” or “floor”
to the incentives, reducing the action of the auction between known limits. This behaviour
betrays the aim of the auction. In the discriminatory auctions is essential to forecast the clearing
price. This need causes higher forecasting costs (Kahn et al. 2001). Furthermore, the agents
who participate to the discriminatory auctions have to choose between efficiency and consumer
surplus (Federico and Rahman 2003). Another feature of the discriminatory auctions is to
reduce the possibility of tacit collusion (Fabra 2003).
Guerci et al. (2012) affirm that the shift from SMP to PAB in the Italian Day-Ahead Market
induces a significant rise in prices. However, this consequence is not present for real-time
markets implementing Pay-As-Bid clearing mechanism.
2.2.5 Zonal markets
As it is already said, usually the price used in the supply offers of the electricity market is the
clearing price of the zone to which they belong. More in detail, the offers to sell and the bids
referred to mixed offer points and offer points of virtual zones are valued at the clearing price
of the relevant zone. The price is the result of the intersection between the demand and the

43
supply curve for that specific hour. When at least one transit limit is breached, an algorithm
“splits” the market into two zones and repeats the process explained above and as Figure 7
shows. One “exporting” zone, including all the zones that exceed the constraint, and one
“importing” zone, including all the zones that are below the constraint. The clearing price
obtained is a “zonal price” (Pz) that is different in the two market areas; it is higher in the
importing zone and lower in the exporting one. If, even after this operation the transit limits are
still violated, the “market splitting” process is repeated in the areas where such a breach occurs.
Fig. 7 Zonal price algorithm
Source: GME
On the other hand, in Italy, the accepted demand bids are evaluated at the single national price
(PUN, “prezzo unico nazionale”) which is defined as the average of the zonal prices weighted
by zonal consumption and represents the purchase price or end customers. GME implements
an algorithm which employs the PUN. The PUN is only applied to withdrawal points belonging
to national geographical zones. The Pz is used for all the other offer points – injection, mixed
and withdrawal points belonging to neighbouring countries’ virtual zones.
As it will be explained in detail later, the Italian power market is divided into six areas and the
marginal price is calculated for each zone. While the traders who buy in the MGP pay the PUN,
the producers are paid to the Pz. Unlike the PUN, the Pz is influenced by supply and the
transportation difficulties. Thus, the Pz is higher in those zones which there is insufficient
supply and besides the inability to transport the energy produced elsewhere.
Furthermore, before the MGP session, the GME releases the informations of the grid to the
operators. The informations specify the energetic requirements per hour and per zone and the
maximum transaction limits between zones.

44
2.3 The Italian Electricity Spot Market
The spot electricity market consists of three markets: the Day-Ahead Market (Mercato del
Giorno Prima, MGP), the Intra-Day Market (Mercato Infragiornaliero, MI) and the Dispatching
Service Market (Mercato del Servizio di Dispacciamento, MSD).
The Day-Ahead Market is the trading facility of the energy supply and demand for every hour
of the day after. All the electricity operators take part to the MGP.
The Intra-Day Market replaces the Adjustment Market. The MI allows the operators to modify
the schedules determined on the MGP.
The Dispatching Service Market is where Terna acquires its supply of resources for the
dispatching services as solving congestion, building adequate storage margins and keeping the
balance between injection and withdrawal.
2.3.1 Market zones
The Italian electricity network is partitioned in grid sections that are called “zones”. A zone is
a portion of the National Transmission Grid (Rete di Trasmissione Nazionale, RTN) with
specific transit limits of energy. In fact, in order to maintain network security between
neighbouring zones, transit limits of energy exist, which are defined through a calculation
model that is based on the balance between electricity generation and consumption.
The identifying process of the zones, representing the Relevant Grid, takes into account the
Development Plan of the National Transmission Grid prepared by Terna. Zones of the Relevant
Grid could correspond with physical area or virtual area (without a physical correspondence)
or pole of limited production. A pole of limited production is a virtual area with production
limited for security restrictions.
The GME uses this zonal simplified representation of the network to test and remove
congestions created by injections and withdrawals that are determined either by the market or
by bilateral contracts. The representation highlights the most relevant transit limitations
between national areas, foreign areas and poles of limited production.
The National Transmission Grid is connected to foreign countries through twenty-two power
lines: four to France; twelve to Switzerland; one to Austria and two to Slovenia. There are also
some cables connections with Greece and twice with Corsica (through Sardinia). A national
cable connection also links Sardinia with the Italian peninsula.
The zones are structured to facilitate the management of energy transits alongside the peninsula.
The structure designed by Terna is as follows (Figure 8):
- Six geographic areas: North (Val D’Aosta, Piemonte, Liguria, Lombardia, Trentino,
Veneto, Friuli Venezia Giulia, Emilia Romagna), North-Centre (Toscana, Umbria,

45
Marche), South-Centre (Lazio, Abruzzo, Campania), South (Molise, Puglia Basilicata,
Calabria), Sicily, Sardinia;
- Eight foreign virtual areas (France, Switzerland, Austria, Slovenia, Borzen SouthPool
Slovenia, Corsica, Corsica AC, Greece);
- Four national virtual areas, represented by poles of limited production: Rossano, Foggia,
Brindisi, Priolo. These areas consist only of production units. Interconnection capacity
is less than the installed power of the units.
Fig. 8 Virtual and geographical zones of the national transmission grid
Source: GME
Each geographical or virtual area includes a set of offer points, also called dispatching point.
Offer points set injection and withdrawal schedules that are defined both through bilateral
agreements and market offers. Offer points can be either injection points, or withdrawal points
or mixed points (both injection and withdrawal).
The injection schedules consist in the energy amount injected in the day, at the hour and from
the offer point pre-set. The offer points correspond with the single production units, i.e.
transformation plants from any primary source. Terna controls directly the production units to
guarantee the system balance.
In the case of withdrawal schedules - i.e. the volume of energy to be withdrawn from the grid
on the day, at the hour and at the offer point to which the schedule refers - the offer points may
correspond both to individual points of withdrawal – i.e. individual consuming units - and to
sets of withdrawal points.

46
Fig. 9 Italian geographical zones
Source: GME
Each offer point has its own user. This latter is an agent that has signed a contract with Terna
for the dispatching service (both the injection and withdrawals schedules and the balancing
orders). Deviations from the schedule schedules involve the payment of deviation charges, in
the form of penalties applied to offer points.
Fig. 10 2005 Annual average zonal prices on MGP (€/MWh)
Source: GME
The following Charts and Graphs show the trend of the Italian zonal prices in 2005, 2010 and
2014. It is possible to see a decrease in the annual price from 2005 to 2014. The 2014 prices
show that only Sicily has an average price greater than the others.

47
Chart 1 2005 Annual average zonal prices on MGP (€/MWh)
Source: GME

48
Chart 2 Annual average zonal prices on MGP (€/MWh). 2005 - 2010
Source: GME
Graph 1 Annual average zonal prices in MGP (€/MWh)
Source: GME
2.3.2 The markets
The electricity market consists of market sessions, which are activities aimed at receiving and
managing the offers and determining the market outcome. Each session receives the offers
within a specific time window. This time interval is called sitting.
2.3.3 The offers
The market participants buy and sell. Their offers/bids concern amounts and prices of
electricity. The proposals express the availability to sell (or buy) up to a certain amount of
energy at a price not less (or not more) than the one specified in the same offer. Proposals
cannot refer to negative quantities (prices).
The proposals refer to the single offer point and to the single hour. This means that there is a
maximum of 24 offers for each day and each offer point. The proposals can be Simple, Multiple,
Default or Balanced. Simple offers are composed by a couple of values: the amount of energy
offered on the market by an operator and the relative price for a relevant period. Multiple offers
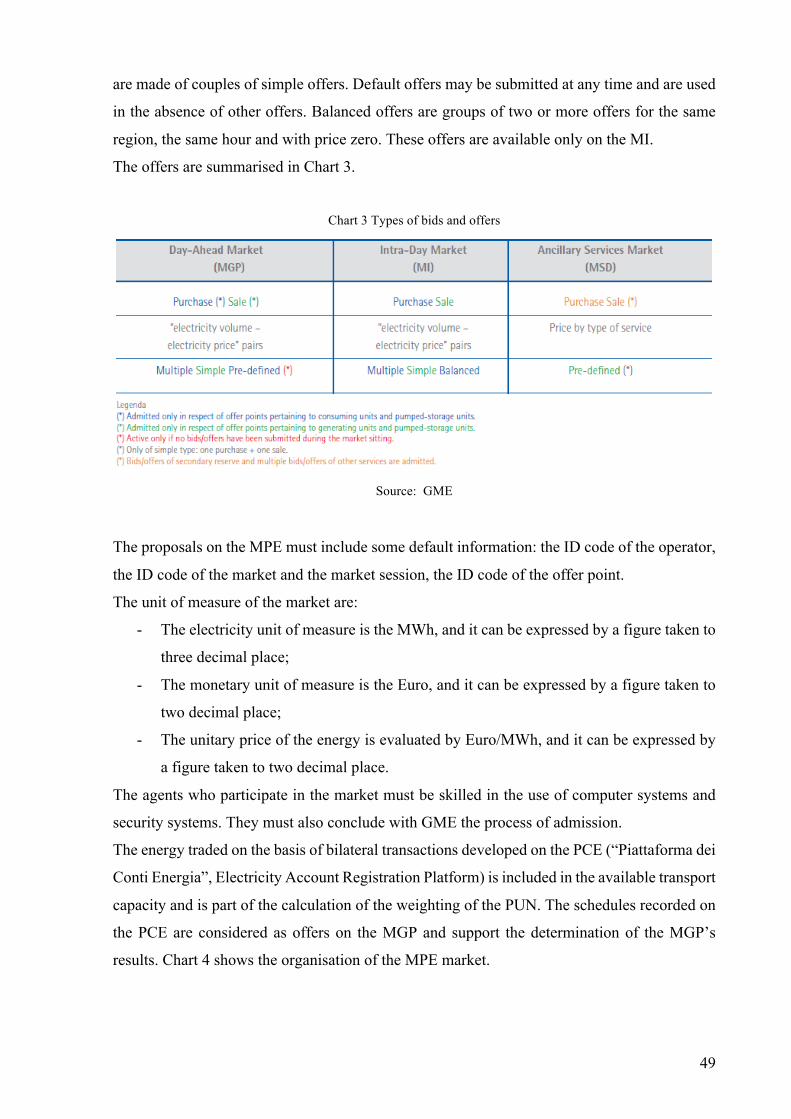
49
are made of couples of simple offers. Default offers may be submitted at any time and are used
in the absence of other offers. Balanced offers are groups of two or more offers for the same
region, the same hour and with price zero. These offers are available only on the MI.
The offers are summarised in Chart 3.
Chart 3 Types of bids and offers
Source: GME
The proposals on the MPE must include some default information: the ID code of the operator,
the ID code of the market and the market session, the ID code of the offer point.
The unit of measure of the market are:
- The electricity unit of measure is the MWh, and it can be expressed by a figure taken to
three decimal place;
- The monetary unit of measure is the Euro, and it can be expressed by a figure taken to
two decimal place;
- The unitary price of the energy is evaluated by Euro/MWh, and it can be expressed by
a figure taken to two decimal place.
The agents who participate in the market must be skilled in the use of computer systems and
security systems. They must also conclude with GME the process of admission.
The energy traded on the basis of bilateral transactions developed on the PCE (“Piattaforma dei
Conti Energia”, Electricity Account Registration Platform) is included in the available transport
capacity and is part of the calculation of the weighting of the PUN. The schedules recorded on
the PCE are considered as offers on the MGP and support the determination of the MGP’s
results. Chart 4 shows the organisation of the MPE market.

50
Chart 4 Organisational diagram of the MPE
Source: GME
2.3.4 Day-Ahead Market
The Day-Ahead Market (MGP) is organised as an implicit auction model. Most of electricity
transactions takes place on this market. All the “participants of the electricity market” can take
part to the transactions. The central counterpart to the purchase and sale transactions is the
GME.
Market sessions start at 8 o’clock of the 9th day before the delivery day and finishes 9.15 am of
the day before the delivery day. The GME publishes the preliminary informations on its website
no later than 8.45 am of the closing day (i.e. no later than half an hour before the closing).
Later on, GME publishes the overall market results, and then communicates the individual
results to the participants. In the end GME communicates the programmes to the dispatching
users and to Terna within 10.45 am of the closing day.
2.3.5 The Intra-Day Market (MI)
The MI is the place where trading of electricity (per hour of the next day) occurs. Such deals
modify the Injection and Withdrawal Schedules resulting from the Day-Ahead Market. The MI
was born in 2010 thanks to the law n. 2/200953 (DM 29 Aprile 2009) that reformed the Power
Market. The MI replaces the “Mercato di Aggiustamento” and allows the operators to modify
the offers and the bids and their commercial positions as in a continuous trading. The latter is a
negotiation mode based on an automatic combinations of the purchase orders and sales. It is
possible to insert new proposals continuosly during the trading sessions.
53 See at http://www.sviluppoeconomico.gov.it/images/stories/mise_extra/Decreto%20ministeriale%20per%20la%20riforma%20del%20mercato%20elettrico.pdf

51
Supply offers and demand bids are selected under the same criterion of the MGP. However,
unlike in the MGP, accepted demands are valued at the zonal price. At the end of each session,
the GME notifies to Terna the relevant results due to the dispatching process.
The GME applies a non-arbitrage fee to all accepted bids/offers pertaining to withdrawal points
belonging to geographical zones, in order to replicate the effect of the application of the PUN.
In particular, there are different solution for each transaction. In the case of a purchase
transaction referred to a withdrawal point of a geographic zone, if the PUN in the previous
MGP has been higher (lower) than the related zonal price, the market participant will pay
(receive) a non-arbitrage fee. In the case of a sale transaction, if the PUN in the previous MGP
has been lower (higher) than the related zonal price, the market participant will pay (receive) a
non-arbitrage fee. In the first case the fee is equal to the difference between the PUN and the
zonal price, applied to each MWh covered by the purchase transaction; in the second case the
fee is equal to the difference between the zonal price and the PUN, applied to each MWh
covered by the sale transaction.
The MI takes place in 5 sessions: MI1, MI2, MI3, MI4, MI5.
- The sitting of the MI1 session takes place after the closing of the MGP. It opens at 12.55
pm of the day before the day of delivery and closes at 3 pm of the same day. The results
of the MI1 are publicised within 3.30 p.m. of the day before the day of delivery.
- The sitting of the MI2 opens at 12.55 p.m. of the day before the day of delivery and
closes at 4.30 p.m. of the same day. The results of the MI2 are publicised within 5 p.m.
of the day before the day of delivery.
- The sitting of the MI3 opens at 5.30 p.m. of the day before the day of delivery and closes
at 3.45 p.m. of the day of delivery. The results of the MI3 are publicised within 4.15
p.m. of the day of closing of the sitting.
- The sitting of the MI4 opens at 5.30 p.m. of the day before the day of delivery and closes
at 7.45 a.m. of the day of delivery. The results of the MI4 are publicised within 8.15
a.m. of the day of closing of the sitting.
- The sitting of the MI5 opens at 5.30 p.m. of the day before the day of delivery and closes
at 11.30 a.m. of the day of delivery. The results of the MI5 are publicised within 12 p.m.
of the day of closing of the sitting.
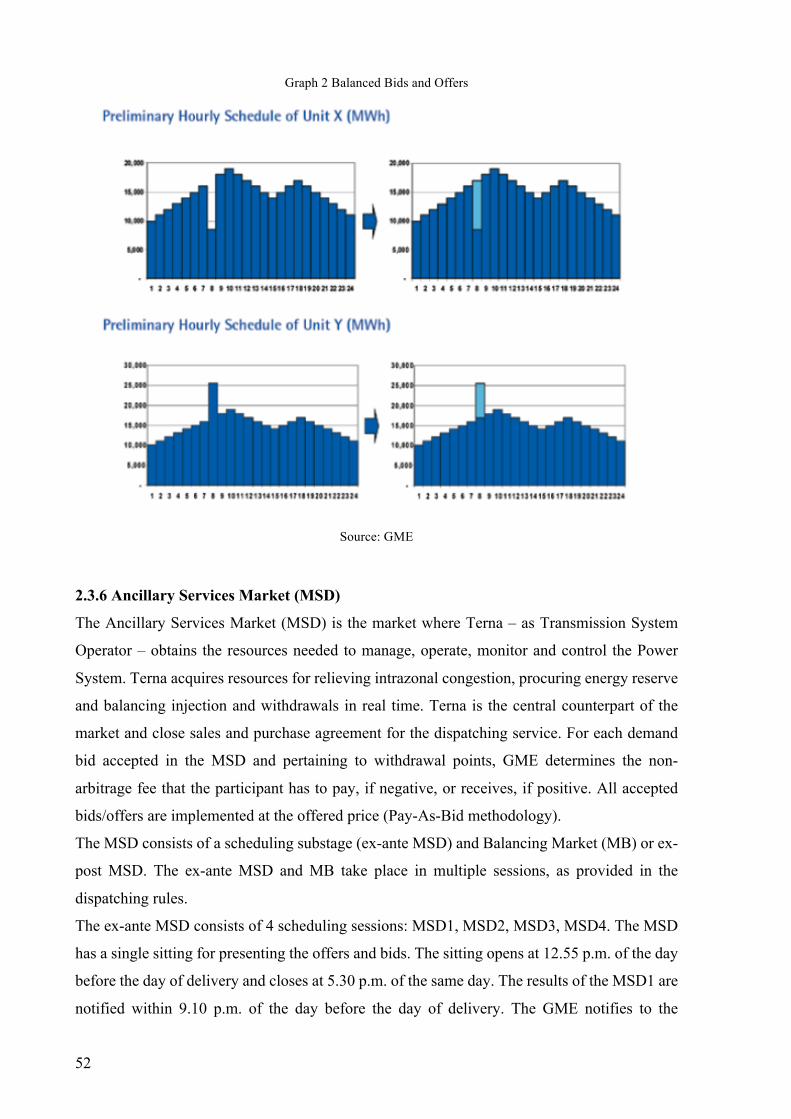
52
Graph 2 Balanced Bids and Offers
Source: GME
2.3.6 Ancillary Services Market (MSD)
The Ancillary Services Market (MSD) is the market where Terna – as Transmission System
Operator – obtains the resources needed to manage, operate, monitor and control the Power
System. Terna acquires resources for relieving intrazonal congestion, procuring energy reserve
and balancing injection and withdrawals in real time. Terna is the central counterpart of the
market and close sales and purchase agreement for the dispatching service. For each demand
bid accepted in the MSD and pertaining to withdrawal points, GME determines the non-
arbitrage fee that the participant has to pay, if negative, or receives, if positive. All accepted
bids/offers are implemented at the offered price (Pay-As-Bid methodology).
The MSD consists of a scheduling substage (ex-ante MSD) and Balancing Market (MB) or ex-
post MSD. The ex-ante MSD and MB take place in multiple sessions, as provided in the
dispatching rules.
The ex-ante MSD consists of 4 scheduling sessions: MSD1, MSD2, MSD3, MSD4. The MSD
has a single sitting for presenting the offers and bids. The sitting opens at 12.55 p.m. of the day
before the day of delivery and closes at 5.30 p.m. of the same day. The results of the MSD1 are
notified within 9.10 p.m. of the day before the day of delivery. The GME notifies to the

53
operators of the market the individual results of the MSD2 concerning the bids and the offers
accepted by Terna within 6.15 a.m. of the day of delivery.
Then GME notifies to the operators the results of the MSD3 within 10.15 a.m. of the day of
delivery, and the results of the MSD4 within 14.15 p.m. of the day of delivery.
In the ex-ante MSD, Terna accepts energy demand bids and supply offers in order to relieve
residual congestions and to create reserve margins.
2.3.6.1 The Balancing Market
The Balancing Market takes place in multiple session. In these sessions Terna selects the offers
and the bids in respect of group of hours of the same day of the MB session. Nowadays, the
MB consists of 5 sessions. The first session of the MB takes into consideration the valid bids
and offers that the operators have submitted in the previous ex-ante MSD session. Each
remaining session of the MB opens at 10.30 p.m. of the day before the delivery day and closes
1 hour and a half before the first hour of negotiation of each session. In the MB, Terna accepts
energy demands and supply in order to provide its service of secondary control and to balance
energy injections and withdrawals into or from the grid in real time.
2.4 Other electricity markets in Italy The GME organise and manage the Electricity Power Market under principles of neutrality,
transparency, objectivity and competition between producers. Main task of GME is to manage
the Electricity Markets, which consists of Spot Electricity Market (MPE), of Forward
Electricity Market (MTE) and of Platform for physical delivery of financials contracts (CDE)
concluded on the Italian Derivatives Exchange (IDEX). Since 2007, GME managed also the
OTC Registration Platform (OTC). It supports the relevant institutions of the energy sector:
Ministry of Economic Development, Ministry of Economy and Finance, AEEG.
Last but not least, GME manages the Environmental Markets, i.e. Green Certificates Market
(MCV), Energy Efficiency Certificates Market (MTEE) and Emissions Trading Market (MUE).
2.4.1 Forward electricity market (MTE)
MTE is the venue for the forward trading contracts of electricity. All operators admitted to the
electricity market can participate.
GME is the counterpart of the market and takes note of the net delivering position on PCE.
Transactions on MTE are continuous. The market sessions take place from Monday to Friday,
from 9 a.m. to 5.30 p.m., except for the next-to-last day of open market of each month. On this
day the closing is advanced at 2 p.m. for operational reasons.
54
On MTE operators could negotiate only two variety of contracts. The amount of energy of the
contracts is established by GME equal to 1 MW, multiplied for the relevant periods. The
contracts could be Baseload or Peakload. The difference between the contracts is the period of
delivery of the energy, which could be monthly, quarterly and yearly. Market participants
submit orders by specifying the type and period of delivery of the contracts, the numeber of
contracts and the price of purchase and sell.
2.4.2 Platform for physical delivery of financial contracts concluded on IDEX (CDE)
During 2009, GME has concluded an agreement with Borsa Italiana S.p.A., the company which
manages regulated markets and the energy derivatives market (IDEX). The agreement is due to
the Decree of the Ministry of Economic Development of the same year, which has promoted
the “co-operation with the company managing the regulated market of electricity derivatives”54.
Thanks to the agreement, participants in both markets may sell the financial electricity
derivatives contracts that they have concluded on IDEX through physical delivery in the
Electricity Market. Basically, the purchase or the sale of a derivative on IDEX results in an
adjustment on CDE platform, having GME as counterpart.
2.4.3 OTC Registration Platform (PCE)
Producers and customers can also purchase and sell outside the exchange (bilateral or OTC
contracts). Prices of supplies – i.e. the injection and withdrawal schedules - and of energy are
freely determined by the parties, while remaining bound to the system’s transmission capacity.
PCE is managed through an information system on the Internet. Participants have their own IDs
and password assigned by GME. At the same time, PCE exchanges information between Terna
and participants. Transactions between participants are registered at any time. Transactions of
the day D could be registered from 60 days before D to 10 a.m. the day before D.
54 Ministerial Decree 29 April 2009, from Law n.2 28 January 2010, art.3, para. 10
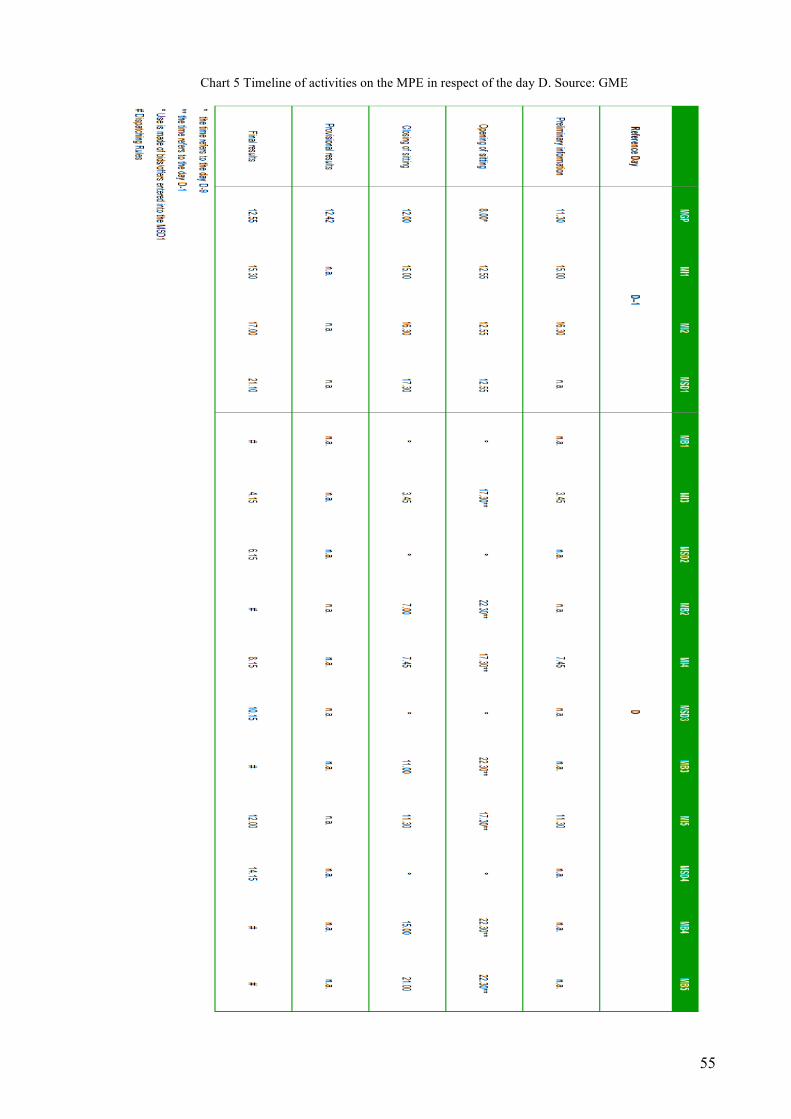
55
Chart 5 Timeline of activities on the MPE in respect of the day D. Source: GME

56
57
Chapter 3. Market integration: the hardware The third and fourth Chapter take into account the development of two essential aspects of the
market integration: the “hardware” – i.e. the grid and the interconnection capacities – and the
“software” – i.e. the network codes and the management rules –.
In order to improve the hardware, in 2013 the EU released a Regulation55 on trans-European
energy infrastructure. The Regulation borught a significant boost in energy infrastructure
projects, allowing to define several Projects of Common Interests (PCIs), which are discussed
in the third section. Furthermore, another significant change in the planning procedures,
introduced by the Regulation, is the introduction of cost-benefit analysis.
The first section of the Chapter shows the evolution of power market prices in the European
countries during the period 2005-2015. The price comparison is useful in order to show that the
harmonisation of the prices between countries is improving over time. However, as it is better
shown in the second section, greater harmonisation needs time to be reached. The second
section shows the generation mix of resources used by the Italian power plants in order to
produce electricity, and the national energy balance.
The last section shows the improvements of the Italian interconnections with other countries.
A stronger interconnection allows countries to better couple the power markets or to interlink
new markets, as in the case of the planned interconnection between Italy and the Balkan area.
3.1 Background Power market integration effects has been a widely debated argument in the last years. In fact,
economists tried to find out what aspect will bring more gains to the cooperation between
countries, and who – within the market participants, from the producers to the consumers – will
benefit more from this tighter integration. Among the various issues on integration of electricity
markets, the literature considered focuses on the day-ahead time-frame.
Ehrenmann and Neuhoff (2009) indicates that both implicit and explicit auctions, the two
market design for the allocation of transmission capacity, lead to the welfare maximizing
outcome in a competitive market, in the case of full information, no uncertainty and perfect
foresight.
On the other hand, literature focuses on the market structure of the system: it has a crucial role
in determining the level of competition. In fact, the way transmission capacity is allocated to
market participants is crucial when assessing the efficiency properties of the integrated market,
55 Regulation (EU) No 347/2013, 17 April 2013. See at http://eur-lex.europa.eu/legal-content/EN/TXT/HTML/?uri=CELEX:32013R0347&from=IT
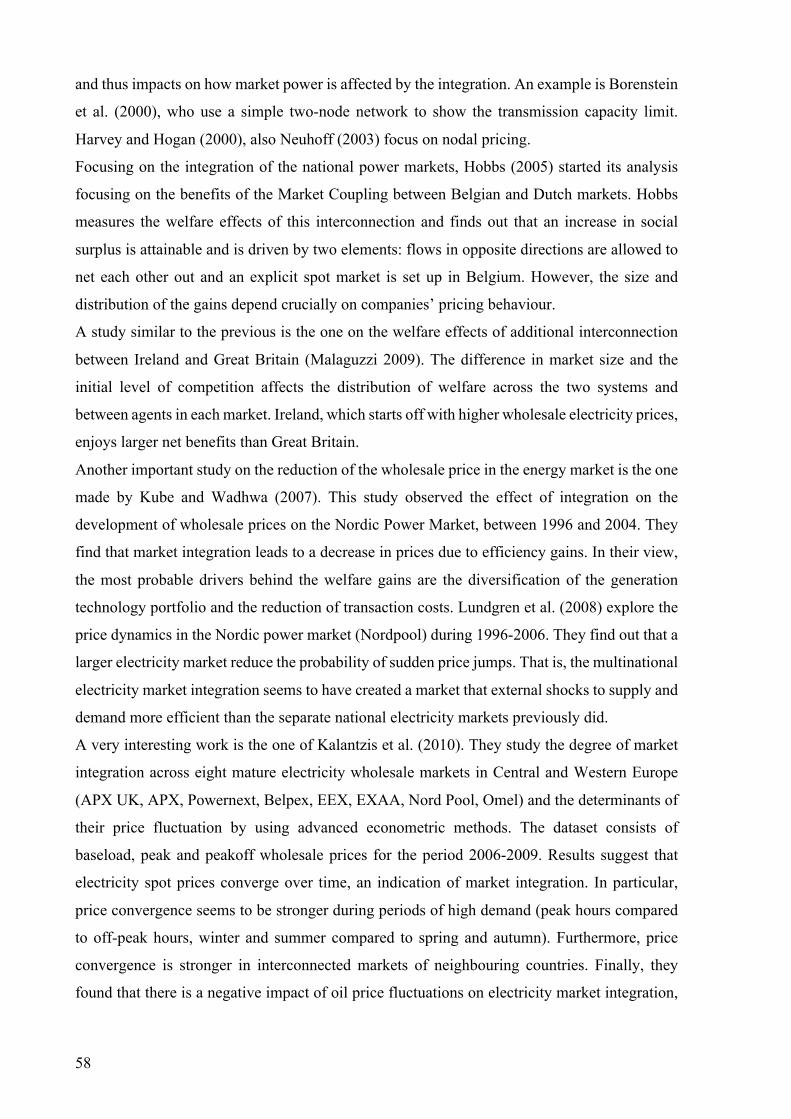
58
and thus impacts on how market power is affected by the integration. An example is Borenstein
et al. (2000), who use a simple two-node network to show the transmission capacity limit.
Harvey and Hogan (2000), also Neuhoff (2003) focus on nodal pricing.
Focusing on the integration of the national power markets, Hobbs (2005) started its analysis
focusing on the benefits of the Market Coupling between Belgian and Dutch markets. Hobbs
measures the welfare effects of this interconnection and finds out that an increase in social
surplus is attainable and is driven by two elements: flows in opposite directions are allowed to
net each other out and an explicit spot market is set up in Belgium. However, the size and
distribution of the gains depend crucially on companies’ pricing behaviour.
A study similar to the previous is the one on the welfare effects of additional interconnection
between Ireland and Great Britain (Malaguzzi 2009). The difference in market size and the
initial level of competition affects the distribution of welfare across the two systems and
between agents in each market. Ireland, which starts off with higher wholesale electricity prices,
enjoys larger net benefits than Great Britain.
Another important study on the reduction of the wholesale price in the energy market is the one
made by Kube and Wadhwa (2007). This study observed the effect of integration on the
development of wholesale prices on the Nordic Power Market, between 1996 and 2004. They
find that market integration leads to a decrease in prices due to efficiency gains. In their view,
the most probable drivers behind the welfare gains are the diversification of the generation
technology portfolio and the reduction of transaction costs. Lundgren et al. (2008) explore the
price dynamics in the Nordic power market (Nordpool) during 1996-2006. They find out that a
larger electricity market reduce the probability of sudden price jumps. That is, the multinational
electricity market integration seems to have created a market that external shocks to supply and
demand more efficient than the separate national electricity markets previously did.
A very interesting work is the one of Kalantzis et al. (2010). They study the degree of market
integration across eight mature electricity wholesale markets in Central and Western Europe
(APX UK, APX, Powernext, Belpex, EEX, EXAA, Nord Pool, Omel) and the determinants of
their price fluctuation by using advanced econometric methods. The dataset consists of
baseload, peak and peakoff wholesale prices for the period 2006-2009. Results suggest that
electricity spot prices converge over time, an indication of market integration. In particular,
price convergence seems to be stronger during periods of high demand (peak hours compared
to off-peak hours, winter and summer compared to spring and autumn). Furthermore, price
convergence is stronger in interconnected markets of neighbouring countries. Finally, they
found that there is a negative impact of oil price fluctuations on electricity market integration,

59
as its increase favours the production of electricity with indigenous sources, the mix of which
is different across countries.
The work proposed in this thesis observes the price trends of the electricity market in the years
2013, 2014 and 2015. The data used for the empirical study of the work are the wholesale
baseload price of the markets. The hourly prices and volumes are taken from the sites of each
Power Exchange of the country considered56. The Day-Ahead NTC values and the Cross-
Border Commercial Schedules are taken from the database of the ENTSO-E site. The NTC
values are also taken from the Terna database. The data on the production sources mix of
Europe and of Italy are taken respectively from Eurostat and from the AEEG sites.
The objective of the work is to prove that the mechanism changes of the power markets have
resulted in welfare gains of the entire system. The gains measured are the decrease of
inefficiencies in the cross-border exchanges with the Italian neighbouring countries.
3.2 European price trends
The European policies for the integration of the markets have improved the harmonisation of
the wholesale prices of the different European markets. However, power prices of Member
States are still different and react in a different way to shocks on market power resources.
Indeed, the evolution of power prices is due to several factors affecting demand and supply and,
therefore, power generation costs.
The demand side is valued on volumes, whereas the supply side is especially influenced by the
RES share, the gas and coal prices. European countries, as shown in the previous chapter,
diversified, during years, their generation mix. The electricity generation in Europe shifted from
coal and oil, to nuclear and in recent years to RES. During the ten-year period considered, the
European countries implemented new and more efficient power plants and dismissed the old
ones.
In 2005, the EU had a share of renewable energy in electricity of 10% on the total production,
while nuclear and fossil fuels generate the rest. Figure 11 shows in percentage the European
production of electricity from different sources in 2005. On the other hand, Figure 12 shows
the European electricity production in 2015. As it is explained in the previous Chapter,
European countries differentiated their electricity generation sources, in order to better face
power market shocks. The European decarbonisation process modifies the electricity sources:
the use of fossil fuels decreases and the RES share as energy sources raises.
56 The PX considered are EPEX Spot (France, Switzerland, Austria, Germany), BSP SouthPool (Slovenia), GME (Italy), APX Spot (UK, Belpex, the Netherland), Nord Pool (Norway, Sweden, Finland, Estonia, Latvia, Lithuania, Denmark, UK), POLPX (Poland), OPCOM (Romania), HUPX Zrt. (Hungary), PXE (Poland, Czech Republic, Slovakia, Hungary, Romania), LAGIE (Greece), SEMO (Ireland), OMIP (Spain, Portugal)

60
Fig. 11 Electricity Production from energy sources (2005)
Source: TSP Data Portal, Breakdown of electricity generation by energy source
The conventional thermal sources – i.e. fossil fuels – decrease from 54% to 48% of the total
production, while nuclear decreases from 30% to 26%. Renewables increase from 10% to 22%
of the total European production. The electricity production by solar is not available in the 2015
monthly cumulated data – data updated in May 201657 –. During 2014 the solar contribution to
the production was the 3.2% of the total.
Fig. 12 Electricity production by source (2015)
Source: Eurostat, Electricity production and supply statistics
57 Data extracted on Eurostat, Electricity production and supply statistics. See at http://ec.europa.eu/eurostat/statistics-explained/index.php/Electricity_production_and_supply_statistics#Further_Eurostat_information

61
More in detail, Figure 3 shows the Member States electricity power sources mix in 2015. The
European countries invest considerably in building renewable energy plants. The
heterogeneous composition of each Member State contributes to understand why electricity
national prices are still different to each other and react differently to shocks.
Italy has no electricity production from nuclear sources, and mainly produces electricity from
conventional thermal resources – 39% from gas, 14% from coal and 6% from oil58. On the other
hand, France, Hungary and Slovenia produce electricity mainly from nuclear sources,
respectively 76%, 51% and 37% in 2014. Norway takes its energy mainly from hydro power,
while Montenegro based its power on conventional thermal sources.
So, as it is possible to see, the production of electricity in the last years has undergone changes
with regard to sources mix of production and consequently, depending on the performance of
the primary resources markets, with regard to the price.
In 2014, the main energy commodity prices in Europe have a downward trend, in line with the
trends of the last years, as Figure 13 shows. Between 2012 and 2014 the price of oil and refinery
products has halved the level compared to 2012. The price of coal falls for the third consecutive
year, reaching close to the minimum value of the last six years. On the other hand, gas reverses
its trend, breaking a run of four consecutive increases.
Fig. 13 Breakdown of electricity production by source (2015), percentage values
Source: Eurostat, Electricity production and supply statistics
In this scenario, the European stock exchanges of electricity record a decrease in prices. The
stock exchanges are in full descending phase and on their respective minimum levels of the
58 Data from the World Bank – World Development Indicators
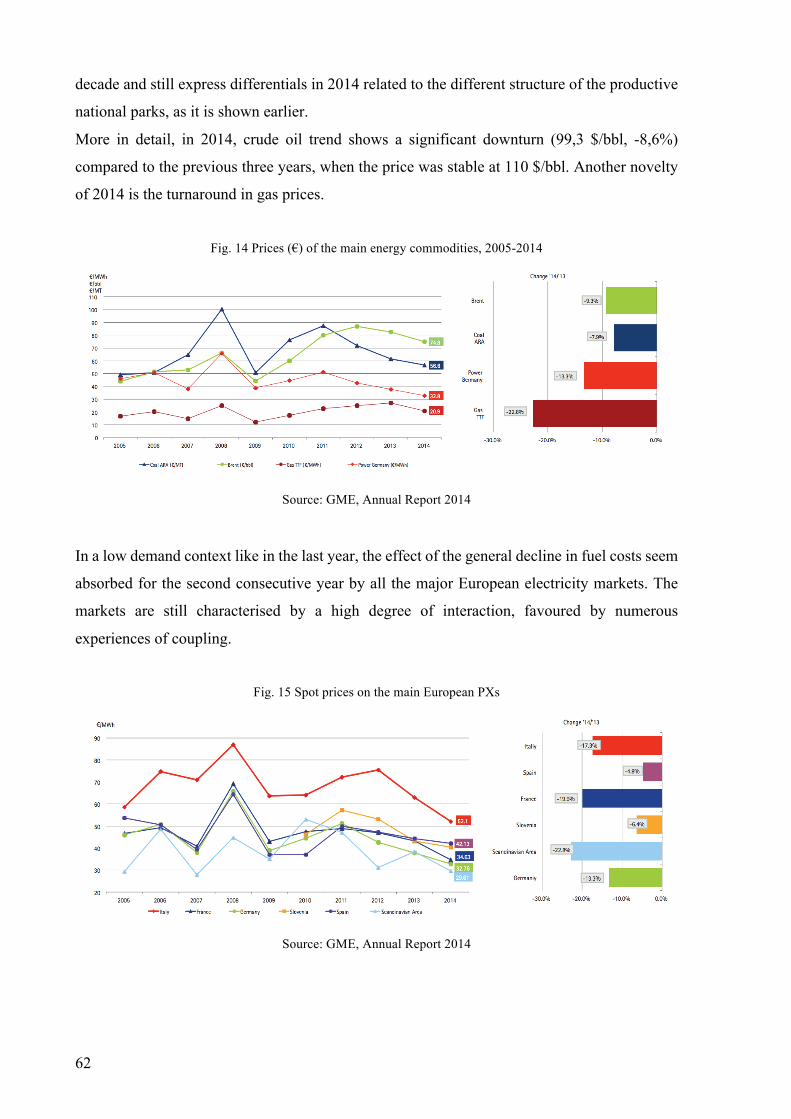
62
decade and still express differentials in 2014 related to the different structure of the productive
national parks, as it is shown earlier.
More in detail, in 2014, crude oil trend shows a significant downturn (99,3 $/bbl, -8,6%)
compared to the previous three years, when the price was stable at 110 $/bbl. Another novelty
of 2014 is the turnaround in gas prices.
Fig. 14 Prices (€) of the main energy commodities, 2005-2014
Source: GME, Annual Report 2014
In a low demand context like in the last year, the effect of the general decline in fuel costs seem
absorbed for the second consecutive year by all the major European electricity markets. The
markets are still characterised by a high degree of interaction, favoured by numerous
experiences of coupling.
Fig. 15 Spot prices on the main European PXs
Source: GME, Annual Report 2014

63
However, the combined effect of the different local expansion of renewable generation and the
recovery of competitiveness of energy in gas intensive countries, originated by the significant
change in direction of the price of the raw material, open the possibility of a new balance in the
European electricity market. These changes seem to point out positive adjustments in spreads
between domestic prices in the medium to long term. Figure 15 shows the spot prices trend on
the main European power exchanges in 2014. All the spot prices decrease, but the Italian price
continues to stay above the other prices.
The maps presented below shows the average wholesale baseload electricity prices of the
Member State. The years considered are 2008, 2012, the 1st Semester of 2014, the 4th Quarter
of 2014, the 1st Quarter of 2015 and the 3rd Quarter of 2015, in order to observe the change of
the wholesale prices of the European countries59. The data are taken from the website of the
national Power Exchange of each nation.
The colours used in order to identify the price difference are sorted from the lightest – i.e. the
lowest price – to the darkest one – i.e. the highest. If the countries is white, it has not been
possible to obtain useful and complete data for comparison.
Figure 16 shows the 2008 price situation in Europe. The 2008 Platts Pan European Power Index
(PEP) is about 79 €/MWh, with the highest quarterly average price – i.e. the third quarter - of
all time, reaching 95.83 €/MWh.
More in detail, the UK power price is to take into account. After the exceptional peak of 300
€/MWh in November 2007, caused in part by the shortage of France exporting nuclear capacity,
the average annual price stabilised around 160 €/MWh.
Electricity supply margins and meteorological conditions were among the important factors
that drove the market. The Met Office announced that UK was facing “coldest start of winter
in 30 years”.
Also Northern Europe Region registered high prices during the year. The situation could be
explained with availability of nuclear and hydro power plants in Sweden and Finland and the
bull run on gas prices following the shutting down of a major undersea pipeline in Norway.
59 Italy, France, Switzerland, Germany, Austria, Slovenia, Spain, Portugal, UK, Ireland, the Nederland, Denmark, Norway, Sweden, Finland, Belgium, Estonia, Latvia, Lithuania, Poland, Czech Republic, Romania, Hungary, Greece
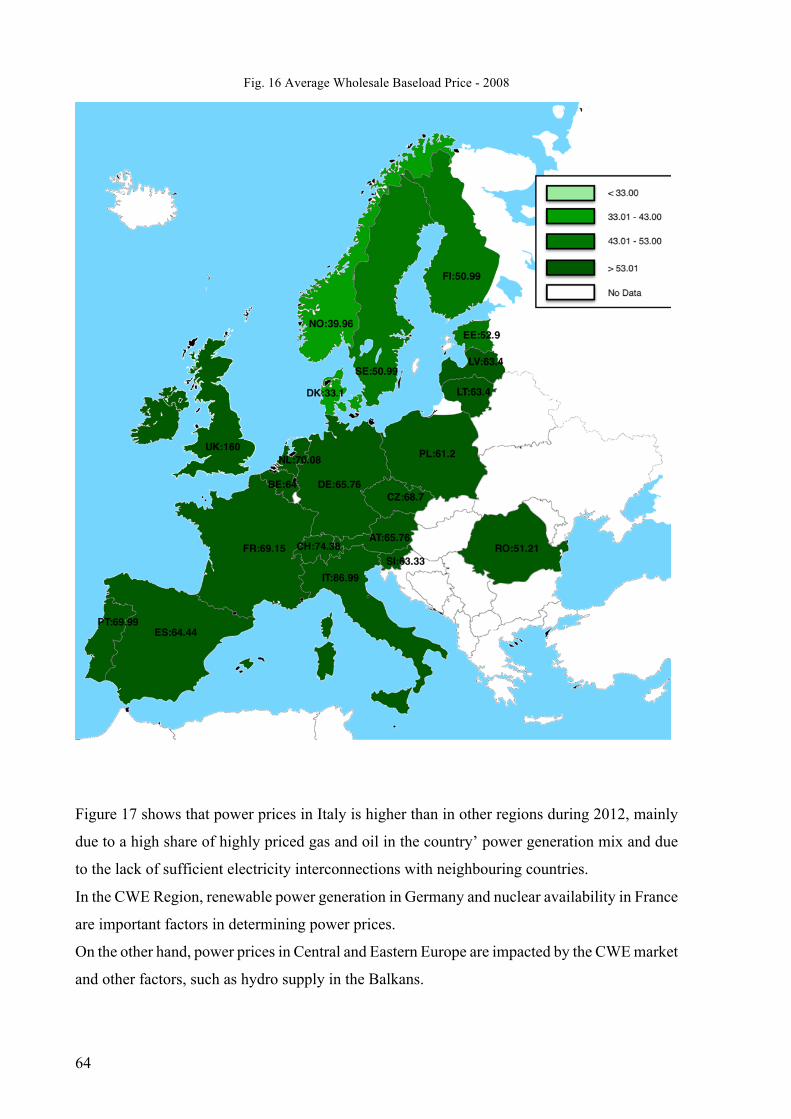
64
Fig. 16 Average Wholesale Baseload Price - 2008
Figure 17 shows that power prices in Italy is higher than in other regions during 2012, mainly
due to a high share of highly priced gas and oil in the country’ power generation mix and due
to the lack of sufficient electricity interconnections with neighbouring countries.
In the CWE Region, renewable power generation in Germany and nuclear availability in France
are important factors in determining power prices.
On the other hand, power prices in Central and Eastern Europe are impacted by the CWE market
and other factors, such as hydro supply in the Balkans.
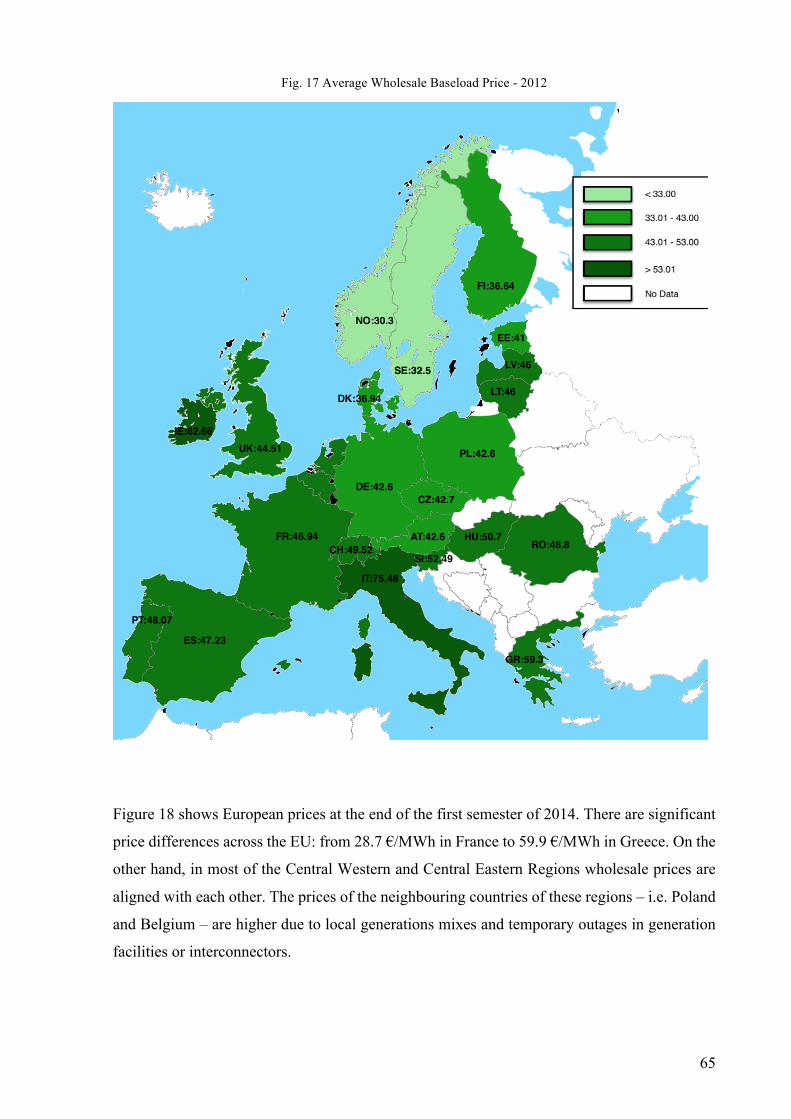
65
Fig. 17 Average Wholesale Baseload Price - 2012
Figure 18 shows European prices at the end of the first semester of 2014. There are significant
price differences across the EU: from 28.7 €/MWh in France to 59.9 €/MWh in Greece. On the
other hand, in most of the Central Western and Central Eastern Regions wholesale prices are
aligned with each other. The prices of the neighbouring countries of these regions – i.e. Poland
and Belgium – are higher due to local generations mixes and temporary outages in generation
facilities or interconnectors.

66
Fig. 18 Average Wholesale Baseload Price - 2014, 1st Semester
Countries having lower than optimal interconnection capacities to their neighbours – i.e. some
of Baltic states, Greece or Ireland – tend to have significantly higher prices than most of other
countries.
Although most of the wholesale electricity markets are coupled with one or more neighbouring
countries, and market coupling reduces welfare losses in cross border electricity trading, in
itself it cannot eliminate price differentials across Europe, as local factors are still important in
price formation.

67
Fig. 19 Average Wholesale Baseload Price – 4th Quarter, 2014
Figure 19 shows the price trend in the 4th Quarter of 2014. In three Nordic countries – Sweden,
Denmark and Finland – and in some Central European Countries – Germany, Czech Republic
and Slovakia – the quarterly average price is particularly low, due to good hydro and renewable
generation availability in the power mixes and available interconnections with the neighbouring
countries.
On the other hand, the price of the Italian market is decreasing over the years, as costly fossil
fuel generation has been partly replaced by renewables in the country’s power mix. However,
as the country heavily relies on power imports, the wholesale electricity price is among the
highest in the EU. Also, the Spanish market is substantially influenced by domestic hydro

68
availability and the permanent bottlenecks in the interconnection with France. In Greece the
high share of fossil fuels and reliance on power imports make the domestic wholesale electricity
price higher than the average.
Fig. 20 Average Wholesale Baseload Price – 1st Quarter, 2015
Figure 20 and 21 show respectively the 1st and 3rd Quarter of 2015. In comparison to the
previous Quarter, in the last period of 2015 the average wholesale electricity price increased in
most of the European markets. In contrast, there are price decreases, mainly in the Nordic
markets.

69
Fig. 21 Average Wholesale Baseload Price – 3rd Quarter, 2015
The price trends of the European electricity markets are going towards the price harmonisation,
however the “Single European Market Price” goal is far from being implemented. An example
of this process is the Italian electricity price: the price is decreasing, getting closer to the
European average, but not reaching it.
Furthermore, below is proposed the evolution of cross-border capacity offered to the market
between 2010-2014 is represented. Graph 3 presents how the level of net transmission capacity
values (NTCs) have developed in recent years.
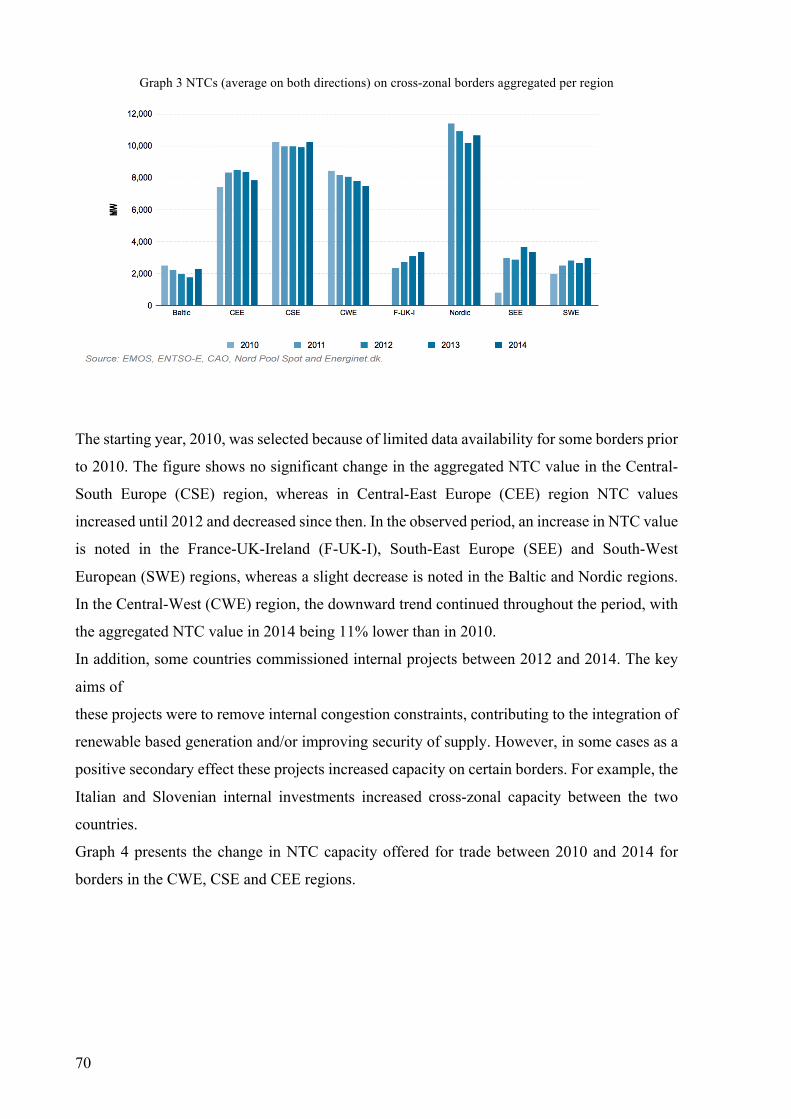
70
Graph 3 NTCs (average on both directions) on cross-zonal borders aggregated per region
The starting year, 2010, was selected because of limited data availability for some borders prior
to 2010. The figure shows no significant change in the aggregated NTC value in the Central-
South Europe (CSE) region, whereas in Central-East Europe (CEE) region NTC values
increased until 2012 and decreased since then. In the observed period, an increase in NTC value
is noted in the France-UK-Ireland (F-UK-I), South-East Europe (SEE) and South-West
European (SWE) regions, whereas a slight decrease is noted in the Baltic and Nordic regions.
In the Central-West (CWE) region, the downward trend continued throughout the period, with
the aggregated NTC value in 2014 being 11% lower than in 2010.
In addition, some countries commissioned internal projects between 2012 and 2014. The key
aims of
these projects were to remove internal congestion constraints, contributing to the integration of
renewable based generation and/or improving security of supply. However, in some cases as a
positive secondary effect these projects increased capacity on certain borders. For example, the
Italian and Slovenian internal investments increased cross-zonal capacity between the two
countries.
Graph 4 presents the change in NTC capacity offered for trade between 2010 and 2014 for
borders in the CWE, CSE and CEE regions.

71
Graph 4 Change in NTC value per border in the CSE, CWE and CEE regions - 2010-2014 (MW and %)
The largest increases of capacity are observed on the borders from Italy to Slovenia and Austria
to Switzerland in the CSE region, and from the Czech Republic to Germany in the CEE region.
The three borders with the highest NTC decreases are France to Germany, France to Belgium
in the CWE region, and Switzerland to Italy in the CSE region. Borders on which the NTC
levels remained relatively unchanged (i.e. where changes were lower than 10%) include borders
from the Netherlands to Belgium, from Germany to the Netherlands, and from France to Italy.
3.3 Italian generation mix
This section shows the generation mix of resources used for the electricity production in Italy,
and its trends during the years. Furthermore, it is considered the aggregated balance of energy
in Italy during 2012-2014.
The Italian electricity production, as the other European countries, consists of different sources
of electricity production, mainly thermal sources like oil, coal and gas. It changed during time:
below it is possible to observe the change from the 2005 to the 2014 energy source situation
(Graph 5 and 6).
In 2005 the fossil fuels consumption is equal to the 84% of the total electricity production. In
2014, after ten years, the thermoelectric generation decreases by almost 30% and is equal to
56% of the Italian electricity production. More in detail, the oil consumption reduced from 16%
in 2005 to 2% in ten years, in order to reduce dependence on foreign countries and to limit the
shocks due to fossil fuels.

72
Graph 5 Italian electricity production by sources (2005)
Source: AEEG, Annual Report 2005
Graph 6 Italian electricity production by sources (2014)
Source: AEEG, Annual Report 2015
According to Terna, during 2014 the demand for electricity has experienced a further decline
of around 3% compared to 2013. In fact, electricity consumption fell from 318.5 TWh, in 2013,
to 309 TWh in 2014. Chart 6 shows the electricity balance in Italy in 2014, compared to 2013.
In 2014 domestic production covered a share of the total national requirement of 86%, against
87% in 2013. Conversely, compared to 2013, net imports increased their share by one point.
This result represents the effect of an increase in imports, which, however, was also
accompanied by a significant increase in exports (+37.3%).

73
Chart 6 Aggregated Balance of Electric Energy in Italy in 2013 and 2014 (GWh)
Source: AEEG, Annual Report 2015
As it is showed on the previous section, the decreasing prices of the power sources allow the
Italian electricity price to decrease. However, in order to improve the functioning of the internal
electricity market is necessary to improve infrastructure, enabling sufficient interconnections
between neighbouring markets and cheap import power alternatives. To do so, Italy started to
improve its interconnection with neighbouring countries, increasing the existing
interconnections with France, Switzerland, Austria and Slovenia, and building up new
interconnections – for example with the Balkan area.
3.4 Italian interconnection development European energy interconnection has been a widely discussed topic during the last years. Since
the early 2000s, the European Commission has supervised the progress of the internal energy
market for electricity and gas, and the implementation of the EU law60. Main steps of this
interconnection path are:
• Decision No 1364/2006/EC of the European Parliament and of the Council of 6
September 2006 laying down guidelines for trans-European energy networks61;
• Communication of 10 January 2007 from the Commission to the Council and the
European Parliament entitled Prospects for the internal gas and electricity market62;
60 See at http://ec.europa.eu/energy/en/topics/markets-and-consumers/single-market-progress-report 61 See at http://eur-lex.europa.eu/legal-content/EN/TXT/?uri=celex:32006D1364#document1 62 See at http://eur-lex.europa.eu/legal-content/EN/TXT/?uri=celex:52006DC0841

74
• Communication of 10 January 2007 from the Commission to the Council and the
European Parliament entitled Priority Interconnection Plan (PIP)63.
In 2009, the EU’s Third Legislative Package established the European Network of
Transmission System Operators (ENTSO-E) from six predecessor associations. The different
committees, working groups and task forces have transferred their work into the ENTSO-E
structure. The former associations were: the Union for the Coordination of the Transmission of
Electricity (UCTE)64, the Association of the Transmission System Operators of Ireland
(ATSOI)65, the Baltic Transmission System Operators (BALTSO)66, the European
Transmission System Operator (ETSO)67, Nordel68 and the UK Transmission System Operators
Association (UKTSOA)69.
In 2009, the European Commission put forward a European Energy Programme for Recovery
(EEPR) which consisted, inter alia, in the identification of interconnection projects across the
EU and the mobilisation of EU financial resources. This programme helped realising several
interconnection projects between Member States, which due to the lack of appropriate funds
had previously not been built. The EEPR spent 650€ million on electricity interconnections70.
The trans-European Energy (TEN-E) Regulation71 adopted in 2013, together with the
Connecting Europe Facility (CEF)72, create a stable European instrument designed to identify
and ensure the timely implementation of the projects Europe needs along 12 priority corridors
and areas. These 12 priority corridors identified in the Regulation cover electricity, gas, oil and
carbon dioxide transport networks. The next step consists in the introduction of Projects of
Common Interest (PCI) – in the form of a List - for projects contributing to implement these
priorities. The list is updated every two years in order to integrate newly needed projects and
remove obsolete ones. The current list – the only one – was updated in November 201573. It
consists of 195 key energy infrastructure projects in order to complete the European internal
energy market. The CEF supports the improvements to the infrastructure projects with a budget
63 See at http://eur-lex.europa.eu/legal-content/EN/TXT/?uri=celex:52006DC0846 64 See at https://www.entsoe.eu/news-events/former-associations/ucte/Pages/default.aspx 65 See at https://www.entsoe.eu/news-events/former-associations/atsoi/Pages/default.aspx 66 See at https://www.entsoe.eu/news-events/former-associations/baltso/Pages/default.aspx 67 See at https://www.entsoe.eu/news-events/former-associations/etso/Pages/default.aspx 68 See at https://www.entsoe.eu/news-events/former-associations/nordel/Pages/default.aspx 69 See at https://www.entsoe.eu/news-events/former-associations/uktsoa/Pages/default.aspx 70 See at http://ec.europa.eu/energy/eepr/projects/ and Annex 1 COM/2015/082. See at http://eur-lex.europa.eu/legal-content/EN/TXT/?qid=1461851048902&uri=CELEX:52015DC0082R(01) 71 Regulation 347/2013 on guidelines for trans-European energy infrastructure, OJ L 115, 25.4.2013. See at http://eur-lex.europa.eu/legal-content/en/TXT/?uri=celex%3A32013R0347 72 Regulation 1316/2013 establishing the Connecting Europe Facility, OJ L 348, 20.12.2013. See at http://eur-lex.europa.eu/legal-content/EN/ALL/?uri=celex%3A32013R1316 73 See at http://eur-lex.europa.eu/legal-content/EN/TXT/PDF/?uri=OJ:JOL_2016_019_R_0001&from=EN

75
of approximately 1 billion euros, out of which €650 million in grants are set aside for PCIs in
2015. These grants are divided into two calls, the first and second call. The first call for
proposals closed 29 April 2015 and consists of 20 cross-European energy infrastructure
projects74, mainly in CEE, SEE and Baltic regions. 9 of these projects are in the electricity
worth a total of €70 million. The second call for proposals closed 14 October 2015 and the
indicative budget is €550 million. Even if the end of the work was set for February 2016, it is
still not possible to know the project approved.
In 2009, Italy introduced the Virtual Interconnector Programme to provide Italian industries
with energy at the price of nearby countries in exchange for co-founding new interconnector
projects developed by TSO Terna. The scheme was due to expire when at least 2.5GW of new
interconnectors had come on line.
Italy has several projects of interconnection75, due to improve its Electricity Interconnection
Level (EIL) of installed electricity production capacity76 in order to decrease its national
electricity price. In 2014, Italy has a 7% EIL and the capacity interconnection is 8.400 MW of
121.400 MW installed, too (Chart 2). In the first and second PCIs list, Italy is involved in
different projects between France and Corsica, Switzerland, Austria, Slovenia, Greece and
necessary internal reinforcements. The goal is to improve the Italian electricity interconnection
capacities to around 12%, when completed by 2020.
Since early 2000s the Italian system needs an improvement of the interconnection capacity to
France, Switzerland, Austria, Slovenia and Greece. During the years from 2001 to 2014 the
interconnection capacity implemented has been slightly higher than 3000 MW.
Chart 7 shows the interconnection capacity of the Italian power system during winter and Chart
8 shows the capacity during summer periods. Switzerland is the main counterpart of the system,
followed by France.
The Italian borders already have 25 operative interconnections, out of which 21 owned by
Terna, 1 owned by EneMalta and 3 merchant line managed by Terna.
74 See at https://ec.europa.eu/energy/sites/ener/files/documents/CEF_Energy_2015_call_for_proposals.pdf 75 See at http://eur-lex.europa.eu/legal-content/EN/TXT/PDF/?uri=OJ:JOL_2016_019_R_0001&from=EN 76 ENTSO-E, Scenario Outlook and Adequacy Forecast 2014. See at https://www.entsoe.eu/Documents/SDC%20documents/SOAF/141031_SOAF%202014-2030_.pdf
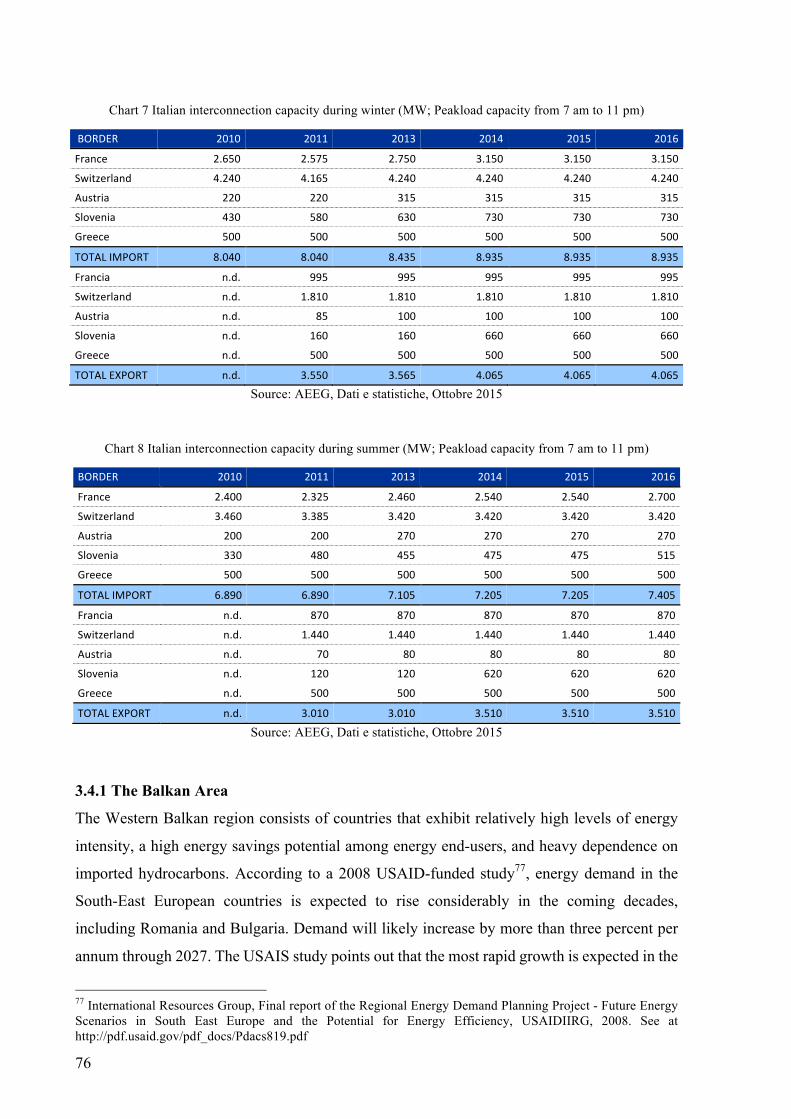
76
Chart 7 Italian interconnection capacity during winter (MW; Peakload capacity from 7 am to 11 pm)
BORDER 2010 2011 2013 2014 2015 2016
France 2.650 2.575 2.750 3.150 3.150 3.150
Switzerland 4.240 4.165 4.240 4.240 4.240 4.240
Austria 220 220 315 315 315 315
Slovenia 430 580 630 730 730 730
Greece 500 500 500 500 500 500
TOTALIMPORT 8.040 8.040 8.435 8.935 8.935 8.935
Francia n.d. 995 995 995 995 995
Switzerland n.d. 1.810 1.810 1.810 1.810 1.810
Austria n.d. 85 100 100 100 100
Slovenia n.d. 160 160 660 660 660
Greece n.d. 500 500 500 500 500
TOTALEXPORT n.d. 3.550 3.565 4.065 4.065 4.065
Source: AEEG, Dati e statistiche, Ottobre 2015
Chart 8 Italian interconnection capacity during summer (MW; Peakload capacity from 7 am to 11 pm)
BORDER 2010 2011 2013 2014 2015 2016
France 2.400 2.325 2.460 2.540 2.540 2.700
Switzerland 3.460 3.385 3.420 3.420 3.420 3.420
Austria 200 200 270 270 270 270
Slovenia 330 480 455 475 475 515
Greece 500 500 500 500 500 500
TOTALIMPORT 6.890 6.890 7.105 7.205 7.205 7.405
Francia n.d. 870 870 870 870 870
Switzerland n.d. 1.440 1.440 1.440 1.440 1.440
Austria n.d. 70 80 80 80 80
Slovenia n.d. 120 120 620 620 620
Greece n.d. 500 500 500 500 500
TOTALEXPORT n.d. 3.010 3.010 3.510 3.510 3.510
Source: AEEG, Dati e statistiche, Ottobre 2015
3.4.1 The Balkan Area
The Western Balkan region consists of countries that exhibit relatively high levels of energy
intensity, a high energy savings potential among energy end-users, and heavy dependence on
imported hydrocarbons. According to a 2008 USAID-funded study77, energy demand in the
South-East European countries is expected to rise considerably in the coming decades,
including Romania and Bulgaria. Demand will likely increase by more than three percent per
annum through 2027. The USAIS study points out that the most rapid growth is expected in the
77 International Resources Group, Final report of the Regional Energy Demand Planning Project - Future Energy Scenarios in South East Europe and the Potential for Energy Efficiency, USAIDIIRG, 2008. See at http://pdf.usaid.gov/pdf_docs/Pdacs819.pdf
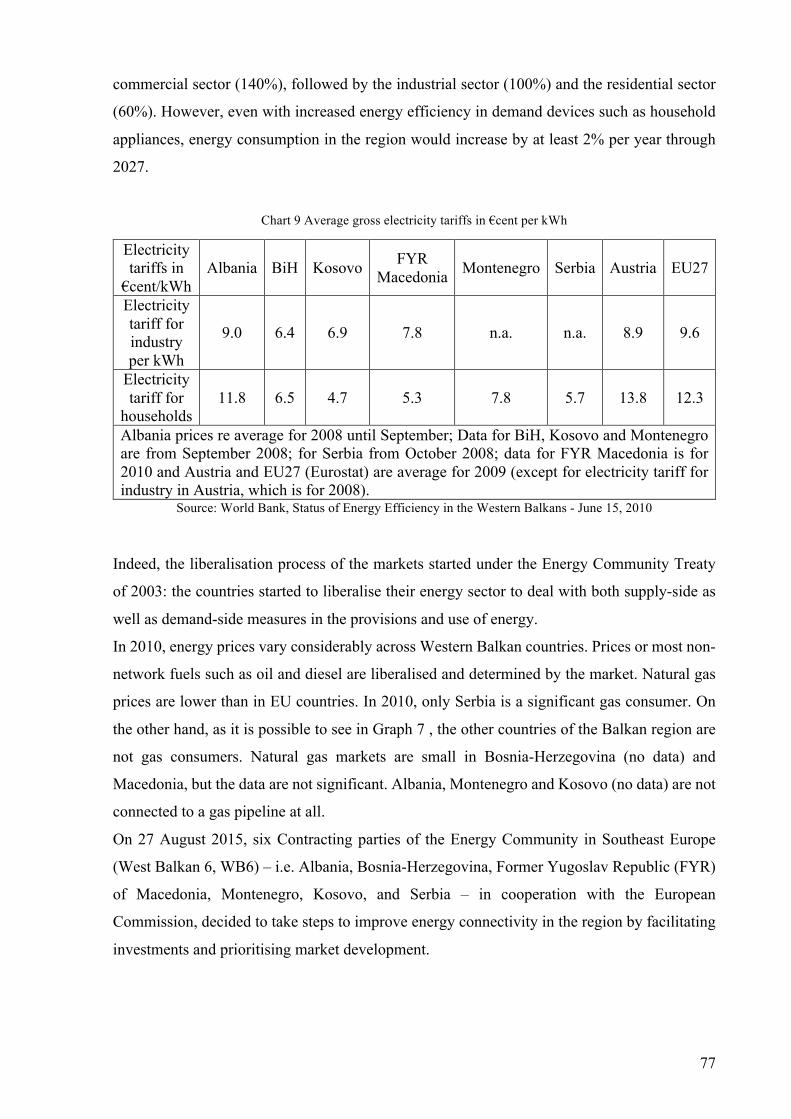
77
commercial sector (140%), followed by the industrial sector (100%) and the residential sector
(60%). However, even with increased energy efficiency in demand devices such as household
appliances, energy consumption in the region would increase by at least 2% per year through
2027.
Chart 9 Average gross electricity tariffs in €cent per kWh
Electricity tariffs in €cent/kWh
Albania BiH Kosovo FYR Macedonia Montenegro Serbia Austria EU27
Electricity tariff for industry per kWh
9.0 6.4 6.9 7.8 n.a. n.a. 8.9 9.6
Electricity tariff for
households 11.8 6.5 4.7 5.3 7.8 5.7 13.8 12.3
Albania prices re average for 2008 until September; Data for BiH, Kosovo and Montenegro are from September 2008; for Serbia from October 2008; data for FYR Macedonia is for 2010 and Austria and EU27 (Eurostat) are average for 2009 (except for electricity tariff for industry in Austria, which is for 2008).
Source: World Bank, Status of Energy Efficiency in the Western Balkans - June 15, 2010
Indeed, the liberalisation process of the markets started under the Energy Community Treaty
of 2003: the countries started to liberalise their energy sector to deal with both supply-side as
well as demand-side measures in the provisions and use of energy.
In 2010, energy prices vary considerably across Western Balkan countries. Prices or most non-
network fuels such as oil and diesel are liberalised and determined by the market. Natural gas
prices are lower than in EU countries. In 2010, only Serbia is a significant gas consumer. On
the other hand, as it is possible to see in Graph 7 , the other countries of the Balkan region are
not gas consumers. Natural gas markets are small in Bosnia-Herzegovina (no data) and
Macedonia, but the data are not significant. Albania, Montenegro and Kosovo (no data) are not
connected to a gas pipeline at all.
On 27 August 2015, six Contracting parties of the Energy Community in Southeast Europe
(West Balkan 6, WB6) – i.e. Albania, Bosnia-Herzegovina, Former Yugoslav Republic (FYR)
of Macedonia, Montenegro, Kosovo, and Serbia – in cooperation with the European
Commission, decided to take steps to improve energy connectivity in the region by facilitating
investments and prioritising market development.

78
Graph 7 Primary energy production by source (2010 and 2014)
Source: The shift project data portal, Breakdown of Electricity Generation by Energy Source
In parallel with PCIs, the Western Balkan countries committed to implementing the so-called
“energy soft measures” at national and regional level, as key preconditions for the development
of a truly integrated electricity market. Implementing the energy soft measures will require
comprehensive reform packages for most countries. The legislative bodies of each Western
Balkans 6 country are expected to provide the necessary legal and institutional framework
allowing the entities to successfully and timely implement the commitments made.
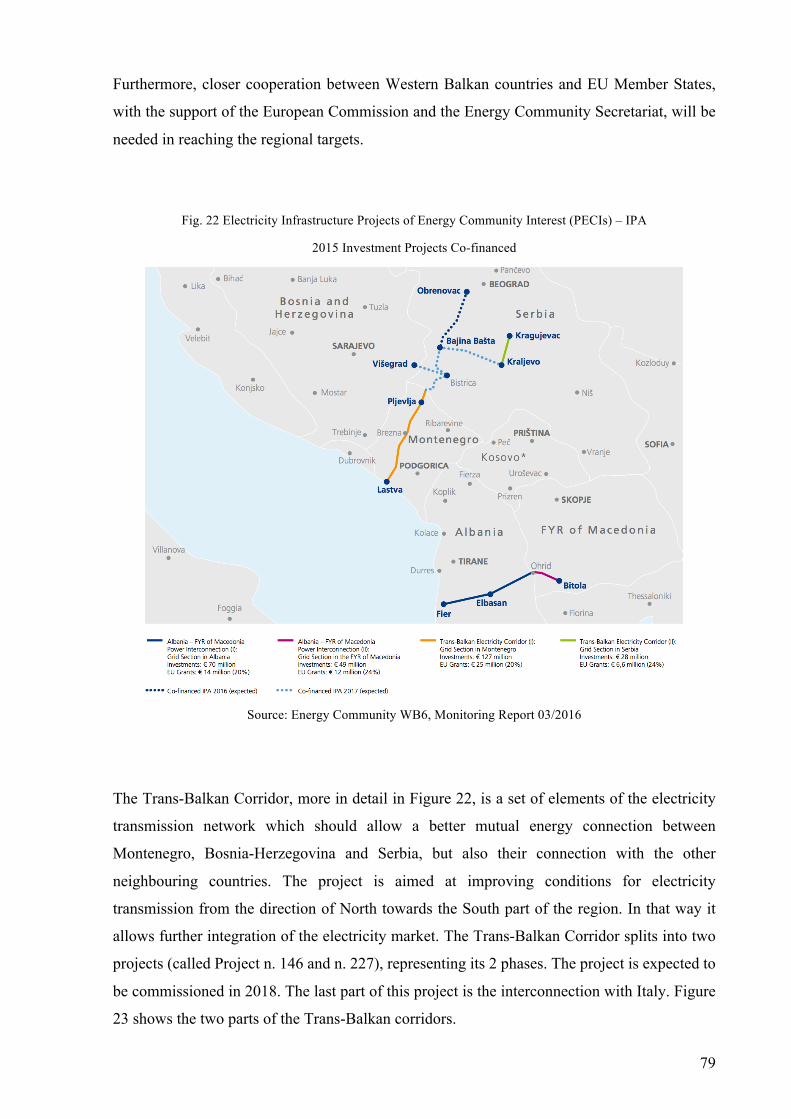
79
Furthermore, closer cooperation between Western Balkan countries and EU Member States,
with the support of the European Commission and the Energy Community Secretariat, will be
needed in reaching the regional targets.
Fig. 22 Electricity Infrastructure Projects of Energy Community Interest (PECIs) – IPA
2015 Investment Projects Co-financed
Source: Energy Community WB6, Monitoring Report 03/2016
The Trans-Balkan Corridor, more in detail in Figure 22, is a set of elements of the electricity
transmission network which should allow a better mutual energy connection between
Montenegro, Bosnia-Herzegovina and Serbia, but also their connection with the other
neighbouring countries. The project is aimed at improving conditions for electricity
transmission from the direction of North towards the South part of the region. In that way it
allows further integration of the electricity market. The Trans-Balkan Corridor splits into two
projects (called Project n. 146 and n. 227), representing its 2 phases. The project is expected to
be commissioned in 2018. The last part of this project is the interconnection with Italy. Figure
23 shows the two parts of the Trans-Balkan corridors.

80
Fig. 23 Trans-Balkan corridor
Source: TYNDP 2014, ENTSO-E
Figure 24 shows more in detail the interconnection, under construction, between Italy and
Montenegro. The project started in 2008 after the approval of the Ministry of the Economic
Development. The project consists in a HVDC subsea cable between Villanova (Italy) and
Lastva (Montenegro) and the converter stations.
Fig. 24 Italian interconnection with Montenegro
Source: TYNDP 2014, ENTSO-E

81
The connection is long 415 Kilometres out of which 390 Km underwater with a capacity of 1
GW. The interconnection is part of a wider project including the Balkans. Indeed, thanks to a
submarine cable in the Adriatic Sea, it is possible to connect Europe to the Balkans.
The project has a significant cross-border impact, because it makes possible to increase the use
of existing and future interconnections all along the corridor between Italy and Continental East
Europe, including the Member States Romania and Bulgaria. It helps to use most efficient
generation capacity and enables possible support of Italian and Balkan power systems.

82
83
Chapter 4. Market integration: the software Chapter 4 takes into account the software adopted by the Commission in order to complete the
IEM. The Third Energy Package, in addition to emit the list of Network Codes, has also outlined
the procedures for their definition and adoption. Furthermore, the work done by the Council,
the Commission and the Parliament has led to outline the criteria of independence, the operating
mode the respective responsibilities and the structure of the new supranational control system.
The first section of the Chapter analyses the Network Codes Regulation 714/2009 of the Third
Energy Package. The second section of the Chapter considers the projects for the
implementation of Market Coupling in different European Regions. In order to explain how the
prices are set, the section focuses on the single algorithm used on the Internal Energy Market:
Euphemia.
4.1 Legal provisions
The Third Energy Package is a legislative package adopted by the European Parliament and the
Council of the European Union in July 2009 and entered in force in September 2009. The
package is composed by 3 Regulations and 2 Directives, both for electricity and gas. It includes
the Regulation on Conditions for Access to the Network or Cross-Border Exchanges in
Electricity (714/2009/EC)78, encompassing the framework guidelines and network codes.
4.1.1 Regulation 714/2009/EC
Articles 6 and 8 of the Regulation provide the procedure applicable for the adoption of the
framework guidelines and the network codes. More in detail, Article 6 is about the
“Establishment of network codes”. More in detail, Article 6 establish that the Commission,
according to ACER and ENTSO-E, establish an annual priority list on the network codes to be
develop. Specific property of the framework guidelines is that it should contribute to non-
discrimination, effective competition and efficient functioning of the market. The Agency,
under request of the Commission, elaborates the framework guidelines within a reasonable
period of time – 6 months –, and is allowed to consult ENTSO-E and other stakeholders. The
Commission evaluates the framework and, if considers that the framework does not contribute
to improve the market, can request the Agency to review it. In alternative, the Commission
requests ENTSO-E to submit the network code. The Commission can adopt network code on
its own initiative if the Agency and ENTSO-E have failed to develop a network code. Anyway
78 See at http://eur-lex.europa.eu/legal-content/EN/ALL/?uri=CELEX%3A32009R0714

84
the Commission has to consult the Agency, the ENTSO-E and the stakeholders in regard the
network code
Article 8, and in particular 8(3), explains the tasks of the ENTSO-E. It can elaborate network
codes only upon a request of the Commission, in the case explained above, and on the areas
explained in Article 8(6). ENTSO-E has to develop common network operation tools for
emergency and normal conditions, in case of incidents and also research plans. In addition, it
has to elaborate some documents: a non-binding ten-year development plan (TYDP) every two
years, recommendations on technical cooperation between countries, an annual work
programme, an annual report and finally an annual summer and winter generation adequacy
outlooks.
Article 8(6) explains what areas can cover the network codes made by ENTSO-E, taking into
account regional specificities:
(a) network security and reliability rules including rules for technical transmission reserve capacity
for operational network security;
(b) network connection rules;
(c) third-party access rules;
(d) data exchange and settlement rules;
(e) interoperability rules;
(f) operational procedures in an emergency;
(g) capacity-allocation and congestion-management rules;
(h) rules for trading related to technical and operational provision of network access services and
system balancing;
(i) transparency rules;
(j) balancing rules including network-related reserve power rules;
(k) rules regarding harmonised transmission tariff structures including locational signals and inter-
transmission system operator compensation rules;
(l) energy efficiency regarding electricity networks.
Article 8(7) establishes that “the network codes shall be developed for cross-border network
issues and market integration issues and shall be without prejudice to the Member States’ right
to establish national network codes which do not affect cross-border trade”.
4.1.2 Network Codes
Network codes form the foundation on which the IEM is being built. The Network Codes cover
three key areas of the European electricity transmission sector. For first, the grid connection
rules need to be adapted to the introduction on the grid of clean low-carbon renewable
electricity. The second key area is about the grid operation. Third, the Network Codes consider

85
the cross-border electricity market. The market codes set down rules to harmonise cross-border
power trading, creating an equal playing ground for all market participants. Notably the
Network Codes on markets provides a set of rules for trading electricity across Europe.
The Network Codes considered for the market area are the Capacity Allocation and Congestion
Management (CACM), the Forward Capacity Allocation (FCA) and the Electricity Balancing
(EB). These codes allow Europe’s grids and natural resources to be used more efficiently. The
next sections will analyse the CACM and EB codes.
4.1.3 CACM Code
CACM is one of the three market related codes. It contains three main subsections that were
merged at an early stage: Intraday (ID), Day-ahead (DA) and Capacity Calculation (CC) (Figure
25).
Each network code is usually linked to other network codes of different areas. Figure 26 shows
approximately the links between Network Codes. The Figure is not an exhaustive example, in
fact there are further extensive links between codes.
Fig. 25 Network code overview
Source: ENTSO-E, Network Codes
So, CACM has many links to other codes and areas. One of the main code linked is the EB,
which has a strong link with intraday markets and common capacity calculation, bidding zones
and structure.
In 2014, it was decided that the regulation on CACM would be labelled “binding guideline”
instead of “network code”. This was decided because of the particular structure of the text: it
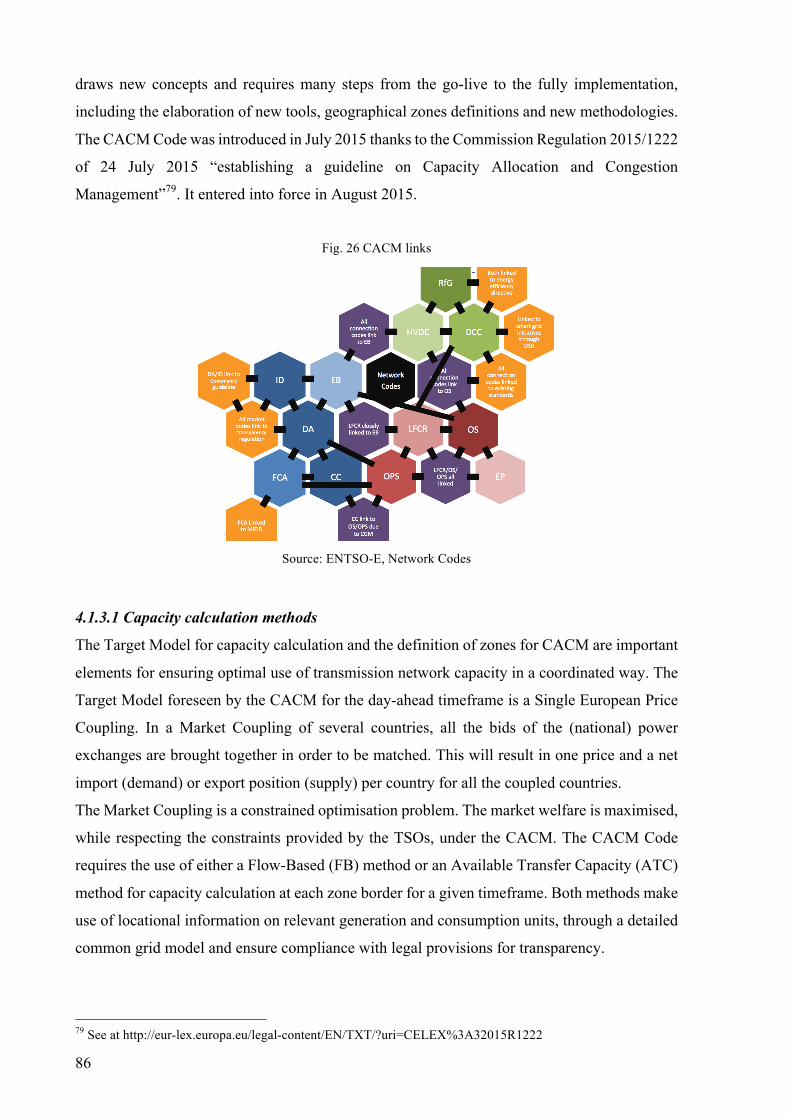
86
draws new concepts and requires many steps from the go-live to the fully implementation,
including the elaboration of new tools, geographical zones definitions and new methodologies.
The CACM Code was introduced in July 2015 thanks to the Commission Regulation 2015/1222
of 24 July 2015 “establishing a guideline on Capacity Allocation and Congestion
Management”79. It entered into force in August 2015.
Fig. 26 CACM links
Source: ENTSO-E, Network Codes
4.1.3.1 Capacity calculation methods
The Target Model for capacity calculation and the definition of zones for CACM are important
elements for ensuring optimal use of transmission network capacity in a coordinated way. The
Target Model foreseen by the CACM for the day-ahead timeframe is a Single European Price
Coupling. In a Market Coupling of several countries, all the bids of the (national) power
exchanges are brought together in order to be matched. This will result in one price and a net
import (demand) or export position (supply) per country for all the coupled countries.
The Market Coupling is a constrained optimisation problem. The market welfare is maximised,
while respecting the constraints provided by the TSOs, under the CACM. The CACM Code
requires the use of either a Flow-Based (FB) method or an Available Transfer Capacity (ATC)
method for capacity calculation at each zone border for a given timeframe. Both methods make
use of locational information on relevant generation and consumption units, through a detailed
common grid model and ensure compliance with legal provisions for transparency.
79 See at http://eur-lex.europa.eu/legal-content/EN/TXT/?uri=CELEX%3A32015R1222

87
The constraints provided by the CACM, both FB and ATC constraints, respect he Security of
Supply (SoS) domain. The SoS domain can be determined by making assumptions with regard
to the foreseen grid situation and by performing contingency analyses.
The FB method for capacity calculation makes use of locational information in the grid model
for the assessment of system security at the allocation stage without arbitrary assignment of
capacity per border, and thus allows an efficient utilisation of the network. This method is
therefore to be preferred to the ATC method for short term capacity calculation in cases where
transmission networks are highly meshed and interdependencies between the interconnections
are high (e.g. the ENTSO-E Continental Europe regional group, or the ACER Central West
Europe (CWE) and Central East Europe (CEE) regional initiative groups).
The ATC method is the measure of the transfer capability remaining in the physical
transmission network for further commercial activity, over and above already committed uses.
Mathematically, ATC is defined as:
ATC = TTC – TRM – CBM – existing transmission commitments
Where:
• Total Transfer Capability (TTC) is the amount of power that can be transferred over the
interconnected transmission network in a reliable manner while meeting a specific set of pre-
and post-contingency system conditions.
• Transmission Reliability Margin (TRM) is the amount of transmission transfer capability
needed to ensure that the interconnected transmission network is secure under a reasonable
range of uncertainties in system conditions.
• Capacity Benefit Margin (CBM) is the amount of transmission transfer capability reserved by
load serving entities to ensure access to generation from interconnected systems to meet
generation reliability requirements.
ATC is considered as an acceptable method for short term capacity calculation in less meshed
networks, such as the Nordic power system or possibly the cases of interconnections of or
between the large peninsulas or islands in Europe.
Both FB and ATC methods must be applied with due caution, as it is essential to ensure that
the trade of electricity within one zone and/or between zones is managed so as to minimise any
adverse impacts on other zones.
As an example, if we imagine country A, that is interconnected with country B and country C,
the SoS domain of country A could look like Figure 27. On the x-axis there is the commercial
exchange from country A to B, while on the y-axis there is the commercial exchange from
country A to C.
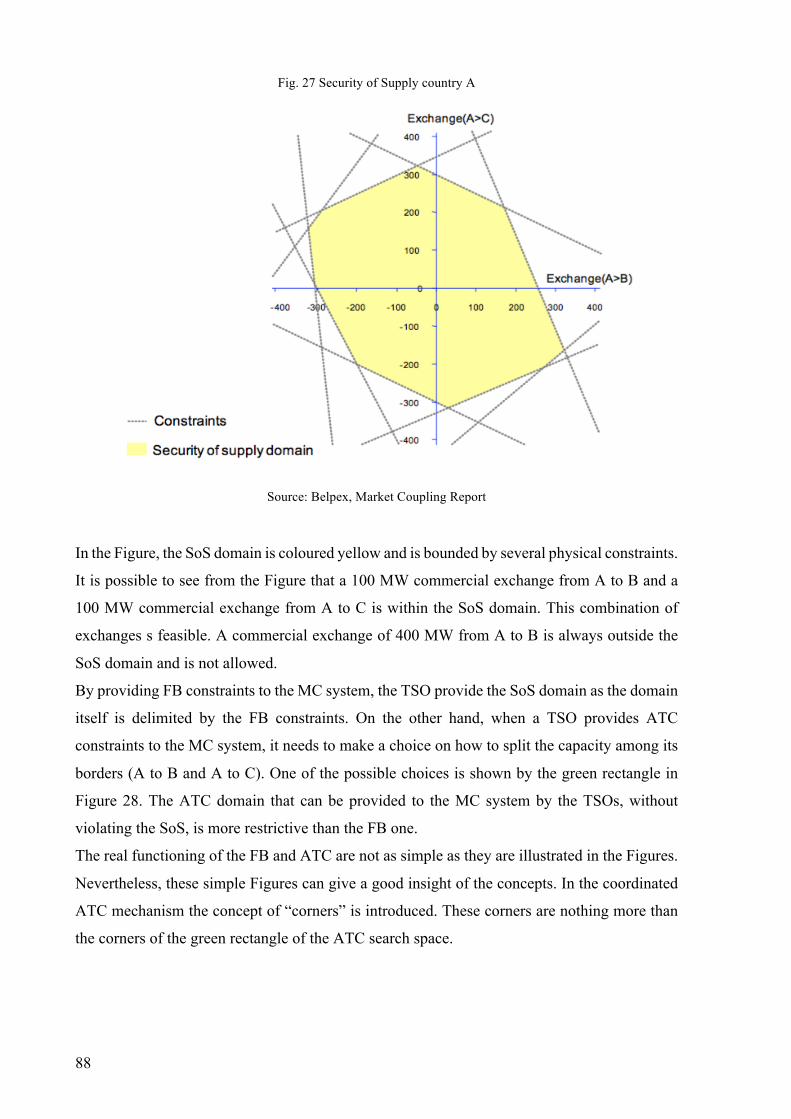
88
Fig. 27 Security of Supply country A
Source: Belpex, Market Coupling Report
In the Figure, the SoS domain is coloured yellow and is bounded by several physical constraints.
It is possible to see from the Figure that a 100 MW commercial exchange from A to B and a
100 MW commercial exchange from A to C is within the SoS domain. This combination of
exchanges s feasible. A commercial exchange of 400 MW from A to B is always outside the
SoS domain and is not allowed.
By providing FB constraints to the MC system, the TSO provide the SoS domain as the domain
itself is delimited by the FB constraints. On the other hand, when a TSO provides ATC
constraints to the MC system, it needs to make a choice on how to split the capacity among its
borders (A to B and A to C). One of the possible choices is shown by the green rectangle in
Figure 28. The ATC domain that can be provided to the MC system by the TSOs, without
violating the SoS, is more restrictive than the FB one.
The real functioning of the FB and ATC are not as simple as they are illustrated in the Figures.
Nevertheless, these simple Figures can give a good insight of the concepts. In the coordinated
ATC mechanism the concept of “corners” is introduced. These corners are nothing more than
the corners of the green rectangle of the ATC search space.

89
Fig. 28 ATC and FB domain
On the other hand, considering the FB search space, the concept of “vertices” is used. The
vertices are the corner points of the FB domain. In the Figure the vertices are the corner points
of the blue polygon.
So, given the Security of Supply of the grid:
• The ATC constraints are a choice made by the TSO inside of this security domain: the TSO
needs to make a choice on how to split the capacity among its borders;
• The FB domain is the security main itself.
In theory, the FB domain includes the ATC domain by definition – offering more trading
opportunities – with the same level of security of supply. As such, the FB mechanism will offer
ore trading opportunities to the market
4.1.3.2 Zones definition
The CACM Network Code sets that the TSOs establish one or more common grid models
suitable for community-wide application. As a minimum, each common grid model has to cover
an area appropriate for the capacity calculation method used, at least the synchronous area. The
common grid model includes a detailed description of the transmission network including the
location of generation units and demand. The Code establishes a zone as a bidding area, i.e. a
90
network area within which market participants submit their energy bids day-ahead, in intraday
and in the longer term timeframe. Then, after defining the zones, the TSOs are guided by the
principle of overall market efficiency. This includes all economic, technical and legal aspects
of relevance, such as, socio economic welfare, liquidity, competition, network structure and
topology, planned network reinforcement and redispatching costs. The definition of zones
contributes towards correct price signals and support adequate treatment of internal congestion.
Zone definitions concern all timeframes: long-term, day-ahead and intraday. Moreover, zone
delimitations should be coordinated with balancing zones. TSOs propose the delimitation of
zones for subsequent approval by the relevant National Regulatory Authorities (NRAs). In
cases where it can be shown that there is no significant internal congestion within or between
control areas, one or several control areas may constitute one zone. NRAs delimitate the zones
against the criteria of overall market efficiency. In case a change in the zone delimitation is
foreseen, it is of the utmost importance that market participants be consulted and have sufficient
time to prepare.
Limiting cross-border capacity to solve internal congestion inside a control area is generally
not permitted. If such a situation occurs, it needs to be reported transparently. Detailed
information on internal and cross-border congestion and limiting constraints (exact location,
exact hour of congestion) has to be reported to the relevant NRAs.
At the time when two or more adjacent capacity calculation regions in the same synchronous
area implement a capacity calculation methodology using the flow-based approach for the day-
ahead or the intraday market time-frame, they are considered as one region for this purpose and
the TSOs from this region submits within six months a proposal for applying a common
capacity calculation methodology using the flow-based approach for the day-ahead or intraday
market time-frame.
4.1.3.3 Capacity allocation methods for the day-ahead market
In the case of the capacity allocation methods for the day-ahead market the CACM foresees
that TSOs implement capacity allocation in the day-ahead market on the basis of implicit
auctions via a single price coupling algorithm which simultaneously determines volumes and
prices in all relevant zones, based on the marginal pricing principle. The implementation takes
into account the role of the power exchanges (PXs) and requires the harmonisation of day-ahead
bidding deadlines. If there is insufficient transmission capacity to enable all requested trades,
calculated zonal prices could differ. The single price coupling algorithm calculates volumes
and prices for all bidding areas and for each time unit. This means that there can only be one
91
price calculated per bidding area and per hour. The algorithm allows for block bids and any
other products that are deemed feasible and appropriate.
The CACM defines the price of transmission capacity between zones (when congestion occurs)
as the difference between the corresponding day-ahead zonal electricity prices. In addition to
congestion pricing, CACM methods for the day-ahead market provides the necessary elements
for the establishment of price references for the forward market.
The Code determines that reduction of allocated capacity may only be used in emergency
situations and force majeure, and when all other means are exhausted (reduction of allocated
capacity is a last resort measure). Additional costs deriving from a reduction in allocated
capacity have not to affect market participants.
4.1.4 Electricity Balancing (EB)
Electricity Balancing is one of the key roles of TSOs where they act to ensure that generation
equals demand in real time. This is vital for ensuring security of supply. The potential for
balancing resources to be effectively shared between countries can enhance security of supply
and reduce cost, hence there is a strong rationale for developing cross border balancing markets.
A first version of the Network Code on Electricity Balancing occurred on 18th September
201280, then on August 2014 ENTSO-E released another version of the Network Code81. On
July 2015 ACER released a Recommendation on the network code on Electricity Balancing82.
The EB Network Code stablishes common rules for Electricity Balancing including the
establishment of common principles for procurement and settlement of Frequency Containment
Reserves, Frequency Restoration Reserves and Replacement Reserves and common
methodology for the activation of Frequency Restoration Reserves and Replacement Reserves.
Article 10 of the 2014 Version states that this Network Code has to facilitate the achievement
of the following objectives:
(a) enhancing Pan-European Social Welfare;
(b) ensuring Operational Security;
(c) contributing to the efficient long-term operation and development of the European electricity
Transmission System and electricity sector;
80 See at https://www.entsoe.eu/fileadmin/user_upload/_library/consultations/Network_Code_Balancing/Framework_Guidelines_on_Electricity_Balancing.pdf 81 See at https://www.entsoe.eu/Documents/Network%20codes%20documents/NC%20EB/140806_NCEB_Resubmission_to_ACER_v.03.PDF 82 See at http://www.acer.europa.eu/Official_documents/Acts_of_the_Agency/Recommendations/ACER%20Recommendation%2003-2015.pdf
92
(d) fostering effective competition, non-discrimination and transparency in Balancing Markets;
(e) facilitating the efficient functioning and preventing undue distortion of other electricity markets
in timeframes different from the Balancing Markets;
(f) ensuring that the procurement of Balancing Services is fair, objective, transparent and market-
based, avoids undue barriers to entry for new entrants, fosters the liquidity of Balancing Markets
while preventing undue distortions from within the internal market in electricity;
(g) promoting the Exchange of Balancing Services;
(h) facilitating the participation of Demand Side Response including aggregation facilities and
energy storage; and
(i) facilitating the participation of Renewable Energy Sources and support the achievement of the
European Union target for the penetration of renewable generation.
Electricity balancing is the process through which the TSOs ensure that they are able to access
a sufficient amount of energy to balance the differences between supply and demand that occur
in every electricity transmission system. If back up power is not available, then a small problem
on the transmission network (such as a power station not working) could have serious Europe-
wide consequences for system security (i.e. there could be a need to disconnect some customers
from the system).
There are two different aspect of Electricity Balancing: balancing energy and balancing
reserves. In order to balance energy, TSOs adopt an electricity balancing service provided by
energy market participants. TSOs select the cheapest available provider – irrespective of
whether it is a generator, an industrial customer or someone providing demand side response –
with providers signalling the price at which they are willing to provide the service. On the other
hand, there are circumstances where it is not sensible for a TSO to wait until just before real
time to buy the services it needs. In these cases, the TSO will reserve capacity on a cross-border
line in order to ensure that the service will be available. This is known as balancing reserves.
Apparently, each Member State is able to guarantee both of them on its own. However, if
Member states choose to achieve this objective using only national resources, the costs are
likely to be greater and the risks may be higher than the combined European resources (Van
der Veen et al., 2012). To ensure the balance between demand and generation, TSOs has to
increase or decrease demand or generation (depending on whether there is too much or too little
of one or the other).
The development and integration of the European electricity market follows clear target models
in all areas except balancing83. Therefore, the Network Code EB sets out a precise series of
steps in order to see balancing markets growth from an undeveloped state. The TSOs need to
83 See at https://www.entsoe.eu/Documents/Events/2014/141013_ENTSO-E_Update-on-IEM-related%20project%20work_final.pdf

93
work together to specify products such as how quickly energy can be provided and for how
long delivery can be maintained – which can be offered Europe-wide. They also need to form
coordinated balancing areas – groups of countries which will work together – and update their
existing balancing market rules.
4.1.5 Cross-border exchange
Capacities for the transport of electricity in the European Grid are limited. In order to use the
grid in the most efficient and economic manner, grid capacities are made available to the market
through auctions. These auctions are organised by office that provides services in relation to
cross-border congestion management for transmission system operators.
In 2008 in Luxembourg was founded the Capacity Allocation Service Company (CASC.EU).
Since 2010, the countries involved in the company were the Netherlands, Belgium, France,
Italy, Greece, Slovenia, Austria, Switzerland, Luxembourg and other three from Germany.
CASC main functions were the management of explicit allocation and to provide services to
the TSOs regarding Market Coupling. The company implemented services in order to act as a
single point to implement and operate services related to the auctioning of power transmission
capacity on the common borders. It tries to increase liquidity and competition within markets
and, finally, it has the possibility to support the development and testing of standardised systems
and rules.
The creation of this office allows market participants to easily register and participate in
auctions. In fact, all participants have to take into consideration a single financial system for all
borders and a single platform for all auctions.
On the other hand, in 2008 was founded the Central Allocation Office (CAO). It is the joint
auction office allocating cross-border electricity transmission capacity for borders between
Austria, Czech Republic, Germany, Hungary, Poland, Slovakia and Slovenia.
The two offices then tried to work together in order to harmonise and, after some years, to join
together in a single office.
Firstly, on 19th May 2010, in order to improve the cooperation on cross border congestion
management, the TSOs of both the Central Western European (CWE) and Central South
European (CSE) regions, as well as Switzerland, signed a Memorandum of Understanding
(MoU). It allows to achieve a stronger integration of European power markets and subsequently
ensure an interregional cooperation and harmonisation through common coordinated methods.
By signing the MoU the mentioned TSOs have agreed to:
94
• For the 2011, assign all currently performed explicit auctions in respect of yearly, monthly and
daily capacities on the Italian and Swiss borders to Germany and Austria to Capacity Allocating
Service Company (CASC), the joint company constituted by TSOs of the CWE region.
• In 2012, implement harmonised auction rules for explicit auctions operated by CASC for both
the CWE and CSE regions, as well as Switzerland.
From 2011, Terna and the other TSOs allow CASC to perform explicit auctions, in order to
improve the harmonisation of Auction Rules. TSOs release the Access Rules for the
interconnections between Italy and France, Switzerland, Austria, Slovenia and Greece. The
allocation process with CASC as auction operator consists of differences about participation
requirements, financial issues and transfer. The main difference is that CASC performs the
whole allocation process on behalf of TSOs but in its own name.
After two years of careful and intensive preparation, the new allocation platform – the Joint
Allocation Office84 (JAO) – was established on 1st September 2015 from a merger of CAO and
CASC.EU. JAO is a joint service company of 20 TSOs from 17 countries85. Aim of the Office
is to perform the yearly, monthly and daily auctions of transmission rights on 27 borders in
Europe. More in detail, the JAO allocates the available transmission capacity provided by the
concerned TSOs, in the form of physical transmission rights. On the CWE Market Coupling
Borders, the Allocation of Daily Capacities is done by the CWE Market Coupling. In the
eventuality the CWE Market Coupling cannot take place, explicit allocation of capacities, in
the form of CWE auctions, are organized as backup solution, in accordance with the present
auction rules. On the Italian-Slovenian border, the allocation of daily capacities is done by the
Italian–Slovenian Market Coupling.
The Market Coupling, as it will be explained in detail in the next section, is an equalisation
mechanism of the markets. It determines the electricity value in the different areas of the
European market and at the same time allocates transportation capacity between the zones,
maximising their use. The market coupling mechanism allows the price convergence between
the Italian power market and the neighbouring countries. It allows the full use of transport
capacity on the interconnection and the best cross-border transport capacity.
4.2. Market Coupling Implementation
Aim of the Market Coupling is to optimise the allocation process of cross-border capacities,
thanks to a coordinated calculation of prices and flows between countries.
84 See at http://www.jao.eu/main 85 50Hertz (DE), Admie (GR), Amprion (DE), APG (AT), ČEPS (CZ), CREOS (LU), ELES (SI), ELIA (BE), EnerginetDK (DK), HOPS (HR), MAVIR (HU), PSE (PL), RTE (FR), SEPS (SK), Statnett (NO), Swissgrid (CH), TenneT (DE), TenneT (NL), Terna (IT), TransnetBW (DE)

95
History of Market Coupling, in order to reach a Single European Market, starts in the 1993-
2000 period, when the Nordic markets (Scandinavia and Estonia) get coupled. In 2006 a
Trilateral Market Coupling was established between the Netherlands, Belgium and France. In
2007 MIBEL (Mercado Ibérico de la Electricidad) started coupling Spain and Portugal. In 2009
Czech Republic and Slovak Republic started coupling their markets. In 2010 the CWE Market
Coupling was established, integrating the Netherlands, Belgium and France with Germany. In
the same year, it is established the CWE Nordic Interim Tight Volume Coupling (ITVC), which
is a provisional coupling system.
As foreseen in the EU Energy Work Plan for 2011-2014 of ACER, the CSE Region will be one
of the last region to participate in the Market Coupling process86. In fact, on November 2011,
among the CSE borders Market Coupling were implemented only for the Italian-Slovenian (IT-
SL) border. Hand in hand with the definition of the governance framework a gradual adoption
of the future single algorithm is foreseen in each market of the region, in order to get ready to
join other regional coupling already in operation. Chart 1 shows the steps of Market Coupling
in the CSE Region.
The NWE Region need an earlier implementation of the Market Coupling because of its auction
allocation inefficiency. The NWE Region is characterised by reduced and unpredictable price
differential. On the other hand, typical higher price of the Italian wholesale market caused an
“import set-up”. This mechanism implicates both institutional, foreign counterparts and market
participants focusing on long-term allocations than the daily allocations.
4.2.1 Regional Initiatives
The European electricity market is divided in 8 different relevant regions: Baltic, Central East
Europe (CEE), Central South Europe (CSE), Central West Europe (CWE), France-UK-Ireland
(F-UK-I), Nordic, South East Europe (SEE) and South West Europe (SWE). The regions,
together with ACER, launched an “Electricity Regional Initiative (ERI) Work Plan”. The
European Energy Work Plan consists of four cross-regional action plans which identify
milestones and responsibilities for implementation of a common European approach to cross-
border electricity trading.
To agree the four cross-regional action plans, the eight electricity regions developed a regional
input to the European Energy Work Plan. The seven regional inputs were developed in
discussion with TSOs and Member States and consulted on with regional stakeholders. The
regional inputs explain each regions contribution to completing the internal electricity market.
86 See at http://www.acer.europa.eu/en/electricity/regional_initiatives/pages/work-programmes-2011-2014.aspx

96
The four cross-regional action plans have been developed and agreed on the basis of the
regional inputs.
In the 2011-2014 Work Plan, the main drivers are the implementation of the target model for
capacity allocation and congestion management, the interconnections and available
transmission capacity, and transparency, with regional report on the management and use of
interconnections.
4.2.2 Price Coupling of Regions (PCR)
Three main Market Coupling projects was signed in order to complete the harmonisation of the
electricity European markets: CWE Market Coupling, Price Coupling of Regions and NWE
Price Coupling.
CWE starts first: in June 2007 a Memorandum of Understanding (MoU) is signed by market
regulators, PXs and TSOs of France, Belgium, Germany, Luxembourg and the Netherlands.
CWE Market Coupling successfully starts in November 2010, together with the CWE-Nordic
tight volume coupling. This project is aimed to couple the CWE region to the Nordic regions
between Germany and Denmark.
The initiative of the Price Coupling of Regions started in 2009. The parties involved signed the
PCR Cooperation Agreement and PCR Co-ownership Agreement in June 2012. The PCR is the
initiative of seven European Power Exchanges87 and it is the mechanism used to couple several
countries88 (Figure 29).
PCR is based on three main principles: a single algorithm, robust operation and individual
power exchange accountability. More in detail:
• The common algorithm, “European Pan-European Hybrid Electricity Market Integration
Algorithm” (Euphemia), gives a fair and transparent determination of day-ahead electricity
prices across Europe and allocate cross-border capacity. The algorithm is developed respecting
the specific features of the various power markets across Europe;
• Decentralised governance: it builds on existing contractual frameworks and institutional
arrangements, accelerating the implementation process;
• Decentralised operation: it decentralises liabilities between PXs and TSOs, supporting
decentralised governance.
87 EPEX SPOT (France, Germany, Austria and Switzerland), GME (Italy), Nord Pool (Norway, Denmark, Sweden, Finland, Estonia, Latvia, Lithuania, Germany and UK), OMIE (Spain), OPCOM (Romania), OTE (Greece) and TGE 88 Austria, Belgium, Czech Republic, Denmark, Estonia, Finland, France, Germany, Hungary, Italy, Latvia, Lithuania, Luxembourg, the Netherlands, Norway, Poland, Portugal, Romania, Slovakia, Slovenia, Spain, Sweden and UK

97
Fig. 29 Price Coupling of Regions
Source: GME, Presentation PCR
On 2014 Nord Pool together with three other PXs and 13 TSOs successfully launch the NWE
day-ahead price coupling project.
The market coupling project was completed when the NWE couples the day-ahead markets
across CWE, Great Britain, the Nordic countries, the Baltic countries and the SwePol link
between Sweden and Poland.
4.2.3 Market Coupling between Italy – Slovenia
The IT-SI Market Coupling starts89 on 31st December 2010, with the go-live on 1st January
2011. The mechanism allows to allocate the daily physical interconnection rights implicitly,
thanks to the resolution of the MGP markets of GME and BSP.
The project begins in 2008 when GME, Terna, Electricity Transmission System Operator
(Eles), Borzen (Market Operator in Slovenia) and BSP sign a MoU for introducing the Market
Coupling. The project receives the support of the Italian Ministry of Economic Development
and the Ministry of Economy of Slovenia, and the national regulatory authorities (AEEG and
AGEN-RS).
89 Delibera ARG/elt 143/10 and Delibera ARG/elt 243/10. See at http://www.autorita.energia.it/it/docs/10/143-10arg.htm and http://www.autorita.energia.it/it/docs/10/243-10arg.htm
98
In 2009, Italian and Slovenian Regulators set up a Working Group, which members are: GME
and BSP as PX, Borzen as MO in Slovenia, Terna and Eles as TSOs, and the Ministries. Purpose
of the working group is to design an achievable solution in order to implement the Market
Coupling on the IT-SI border, and suitable with other initiatives adopted in the CSE Region.
Furthermore, in order to establish a roadmap for the application of the mechanism.
The IT-SI Market Coupling is a decentralised price coupling which reflects the current roles
and responsibilities of the TSOs and PXs, and is based on relations already existing between
the TSOs and PXs. More in detail, each TSO is responsible for:
• defining its own grid model;
• reporting the ATC values between Italy and Slovenia to the PX of its own country;
• acting as counterparty to the PX of its own country for the imports/exports defined by the
Market Coupling.
On the other hand, the TSOs are jointly responsible for:
• defining the overall grid model or the purposes of the Market Coupling;
• defining the ATC values between Italy and Slovenia to be allocated through the MC.
As far as PXs, each one is responsible for:
• receiving bids/offers from its own Market Participants;
• running its own market software;
• determining and publishing the results of its own market.
The PXs are jointly responsible for:
• sharing data about the bids/offers received and the ATC for the Market Coupling;
• adopting a common matching algorithm;
• checking the consistency of the calculated data for the purposes of the Market Coupling, i.e.
prices and volumes of imports/exports;
• defining the import/export volumes resulting from the Market Coupling.
Basically, the market mechanism operates as shown in Figure 30.
The Market Coupling between Italy and Slovenia is based on a price coupling mechanism. This
means that the algorithm used perfectly replicates the matching rules of all the PXs participating
in the coupling. The matching algorithm is run by using all the relevant data concerning the
bids/offers submitted by Market Participants to the PXs participating in the coupling. At least,
common grid model is used for all the zones under the responsibilities of the TSOs participating
in the coupling. More in detail, the Slovenian market consists of 2 market zones: the Slovenia
Coupling zone where the daily capacity is allocated under BSP, and the zone “Slovenia”, also
called Slovenia Nord. Both are foreign virtual zones for Italy. Then, the Slovenia coupling zone
is assimilated to the Italian market and the BSP zone is linked to the foreign virtual zone
Slovenia, where yearly and monthly capacity are allocated.

99
Fig. 30 IT-SI Market Coupling Mechanism
Source: AEEG, Experiences with Market Coupling: the case of coupling between Italy and Slovenia, 2014
The algorithm adopted by GME and BSP has to take into account:
• hourly implicit auctions;
• no intertemporal constraint (no block bids);
• zonal prices, with computation of the PUN only in Italian physical zones;
• marginal price;
• computation of flows between zones;
• bids/offers expressed by specifying quantity-price pairs;
• a minimum tradable quantity (0.001 MWh);
• price expressed in 0.01 €/MWh.
The decentralised price coupling, thanks to the single algorithm, allows to achieve in a single
system the matching rules of coupled markets. On the other hand, thanks to the processes
decentralised management and the information sharing, it guarantees markets coordination
without responsibilities changes.
4.2.4 Italian Market Coupling
Another project implemented by Italy on its border is the Market Coupling between Italy and
France. From the 25th February 2015, the Market Coupling mechanism operates on the Italy-
France and Italy-Austria borders, too. On March 2016, the Market Coupling allocates capacity
for 2.848 MWh (fig. 31). The Net Transport Capacity (NTC) decreases on every borders
compared to March 2015 (-2/6%). The Market Coupling assigns 93,8% of the available capacity
on the Slovenian border. Little less than 80% capacity is assigned on the Austrian and French
border. The unused capacity of the market after the explicit auctions allocations is irrelevant
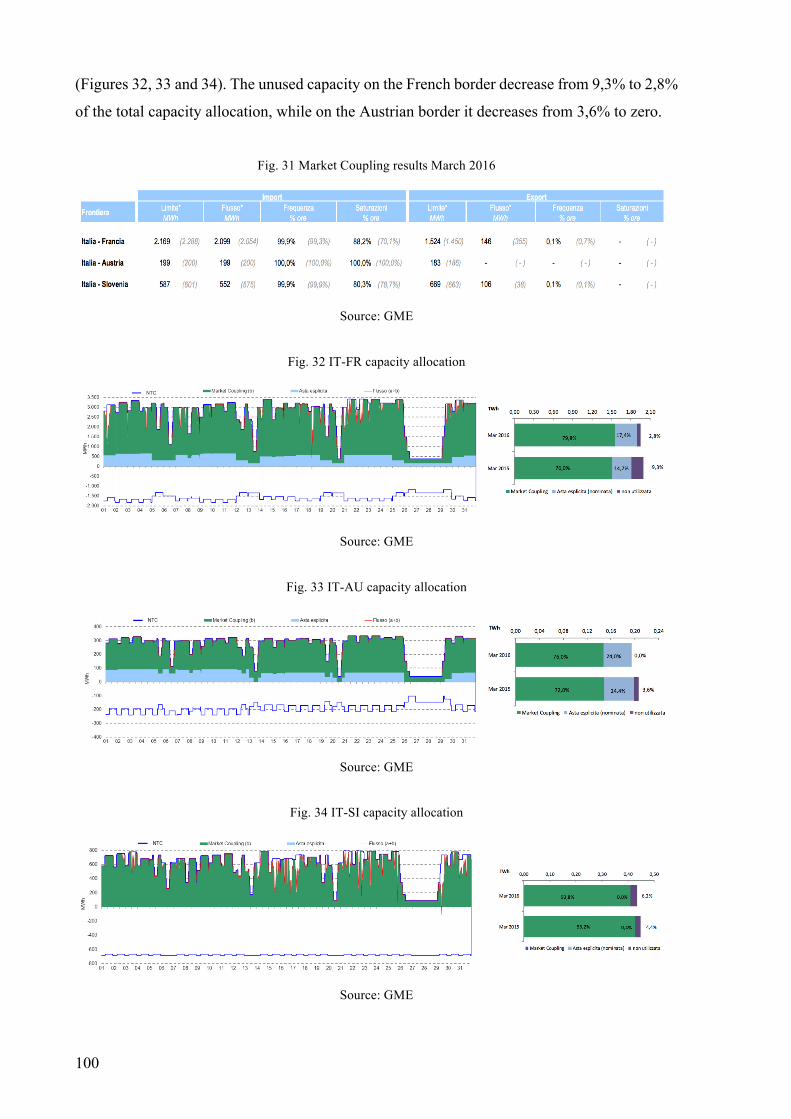
100
(Figures 32, 33 and 34). The unused capacity on the French border decrease from 9,3% to 2,8%
of the total capacity allocation, while on the Austrian border it decreases from 3,6% to zero.
Fig. 31 Market Coupling results March 2016
Source: GME
Fig. 32 IT-FR capacity allocation
Source: GME
Fig. 33 IT-AU capacity allocation
Source: GME
Fig. 34 IT-SI capacity allocation
Source: GME
101
4.3 Euphemia
Euphemia, i.e. Pan-European Hybrid Electricity Market Integration Algorithm, is the algorithm
that has been developed to solve the problem associated with the coupling of the day-ahead
power markets in the PCR region.
The development of Euphemia starts in July 2011 using one of the existing local algorithms
COSMOS, used by CWE since November 2010. Euphemia starts working on the 4th February
2014: it is used for the first time to couple the NWE Region with the South-Western Europe
(SWE) region. On 20 November 2014 the 4M Market Coupling (4M MC)90 starts. On the 25th
February 2015, GME is successfully coupled. On the 21st May 2015, CWE is coupled using for
the first time the Flow-Based model.
4.3.1 How it works
Euphemia matches energy demand and supply for all the periods of a single day at once while
taking into account the market and network constraints. The main goal of Euphemia is to
maximise the social welfare – this is what is called the “master problem” –, i.e. the total market
value of the Day-ahead auction expressed as a function of the consumer surplus, the supplier
surplus and the congestion rent including tariff rates on the interconnectors, in the case they
exist. Euphemia returns the market clearing prices, the matched volumes and the net position
of each bidding area as well as the flow through the interconnectors. It also returns the selection
of block, complex, merit and PUN orders.
In order to solve problems, Euphemia runs a combinatorial optimisation process based on the
modelling of the market coupling problem. Euphemia aims to solve a welfare maximisation
problem and three independent sub-problems: the price determination sub-problem, the PUN
search sub-problem and the volume indeterminacy sub-problem.
About the welfare maximisation problem, Euphemia searches among the set of solutions
(solution space) for a good selection of block and Max Import Capacity (MIC) orders that
maximises the social welfare. In this problem, the PUN and merit orders requirements are not
enforced. Once an integer solution has been found for this problem, Euphemia moves on to
determine the market clearing prices.
On the other hand, the goal of the price determination sub-problem is to determine, for each
bidding area, the appropriate market clearing price while ensuring that no block and complex
MIC orders are paradoxically accepted and the flows price-network requirements are respected.
If the sub-problem does not have any solution, the block and complex orders selection is not
90 4M MC is composed by OTE in Czech Republic, HUPX in Hungary, OPCOM in Romania and OKTE in Slovakia

102
acceptable, and the integer solution must be rejected. Subsequently, the algorithm resumes the
welfare maximisation problem searching for a new integer solution for the problem. In the case
a feasible solution could be found for the price determination sub-problem, Euphemia proceeds
with the PUN search sub-problem.
Aim of the PUN search sub-problem is to find valid PUN volumes and prices for each period
of the day while satisfying the PUN imbalance constraint and enforcing the strong
consecutiveness of accepted PUN orders. When the PUN search sub-problem is completed,
Euphemia verifies that the obtained PUN solution does not introduce any complex orders or
paradoxically accepted block. If some orders become paradoxically accepted, a new cut is
introduced to the welfare maximisation problem that renders the current solution infeasible.
Otherwise, Euphemia proceeds with the lifting of volume indeterminacies.
In the previous sub-problem, the algorithm has determined the market clearing prices for each
bidding area, the PUN prices and volumes for the area with PUN orders, and a selection of
block and complex MIC orders that are feasible all together. Though, there might exist several
aggregated hourly volumes, net positions, and flows that are coherent with these prices and that
yield the same welfare. Among all these possible solutions, Euphemia pays special attention to
the price-taking orders, enforces the merit order number and maximises the traded volume. It
is called the Volume Indeterminacy Sub-Problem.
4.3.2 Welfare maximisation problem (Master Problem)
As mentioned previously, the objective of this problem is to maximize the social welfare, i.e.
the total market value of the Day-Ahead auction. The social welfare is computed as the sum of
the consumer surplus, the supplier surplus, and the congestion rent. The latter takes into account
the presence of tariff rates for the flows through defined interconnectors.
EUPHEMIA ensures that the returned results are coherent with the following constraints:
• The acceptance criteria for aggregated hourly demand and supply curves and merit orders;
• The capacities and ramping constraints imposed on the ATC interconnectors while taking into
account the losses and the tariff rates if applicable;
• The flow limitation through some critical elements of the network for bidding areas managed
by the flow-based network model. All bidding areas should be balanced: the net position equals
the total export minus the total imports for this area, and this should match the area’s imbalance:
the difference between total matched supply and total matched demand;
• The hourly and daily net position ramping should be respected.
It should be noted that the strict consecutiveness requirement of merit and PUN orders is not
enforced in this problem. In other words, the merit orders are considered in this problem as

103
aggregated hourly orders while, the PUN orders are just ignored. The main difficulty of the
welfare maximization problem resides in selecting the block/MIC orders that are to be accepted
and those to be rejected.
4.3.3 Price determination sub-problem
In the master problem, EUPHEMIA has determined an integer solution with a given selection
of block and complex orders. In addition, EUPHEMIA has also determined the matched volume
of merit and aggregated hourly orders. In this sub-problem, EUPHEMIA must check whether
there exist market clearing prices that are coherent with this solution while still satisfying the
market requirements. More precisely, EUPHEMIA must ensure that the returned results satisfy
the following constraints:
• The market clearing price of a given bidding area at a specific period of the day is coherent with
the offered prices of the demand orders and the desired prices of the supply orders in this
particular market;
• The market clearing price of a bidding area is compatible with the minimum and maximum
price bounds fixed for this particular market.
However, the solution of this price determination sub-problem is not straightforward because
of the constraints preventing the paradoxical acceptance of block and MIC orders, or preventing
the presence of non-intuitive Flow-based results. Indeed, whenever EUPHEMIA deems that
the price determination sub-problem is infeasible, it will investigate the cause of infeasibility
and a specific type of cutting plane will be added to the welfare maximisation problem aiming
at enforcing compliance with the corresponding requirement. This cutting plane will discard
the current selection of block and complex orders.
When the market coupling problem at hand features both block and complex orders,
EUPHEMIA associates both cutting strategies in a combined cutting plane. Cuts are generated
under the following circumstances:
• If the bilateral intuitiveness mode is selected for the flow based model, the prices obtained at
the end of the price determination sub-problem must satisfy an additional requirement. This
requirement states that there cannot be adverse flows, i.e. flows exporting out of more expensive
markets to cheaper ones. If the intuitiveness property is not satisfied, appropriate cutting planes
are added as well to the welfare maximization problem;
• In the presence of losses in a situation where a market clears at a negative price bi-directional
flows may occur: energy is send back and forth between two areas only to pick up losses.

104
4.3.4 PUN search sub-problem
The PUN search is launched as soon as a first candidate solution has been found at the end of
the price determination sub-problem. This first candidate solution respects all PCR
requirements but PUN. The objective of the PUN search is to find, for each period, valid PUN
volumes and prices while satisfying the PUN imbalance constraint and enforcing the strong
consecutiveness of accepted PUN orders. If the solution found for all periods of the day, is
compatible with the solution of the master problem, it means that a solution is found after
Paradoxically Rejected complex MIC (PRMIC) reinsertion has been performed. Otherwise, the
process will resume calculating, for each period, new valid PUN volumes and prices to apply
to PUN Merit orders.
The PUN search is essentially an hourly sub-problem where the requirements are defined on an
hourly basis, in which:
• Strong consecutiveness of PUN order acceptance is granted: a PUN order at a lower price cannot
be satisfied until PUN orders at higher price are fully accepted;
• PUN imbalance is within accepted tolerances.
For a given period, the selected strategy consists in selecting the maximum PUN volume
(negative imbalance), and then trying to select smaller volumes until a feasible solution is found
that minimises the PUN imbalance. As soon as PUN search is completed, EUPHEMIA verifies
that the obtained PUN solution does not introduce any paradoxically accepted block orders or
violates any other PCR constraints.
4.3.5 Volume Indeterminacy sub-problem
With calculated prices and a selection of accepted block, MIC and PUN orders provide together
a feasible solution to market coupling problem. There still might be several matched volumes,
net positions and flows coherent with these prices. Among them, EUPHEMIA must select one
according to the volume indeterminacy rules, the curtailment rules, the merit order rules and
the flow indeterminacy rules. These rules are implemented by solving five closely related
optimization problems:
• Curtailment minimization: A bidding area is said to be in curtailment when the market clearing
price is at the maximum or the minimum allowed price of that bidding area and submitted
quantity at these extreme prices if not fully accepted. The curtailment ratio is the proportion of
price-taking orders which are not accepted. All orders have to be submitted within a (technical)
price range set in the respective bidding area. Hourly supply orders at the minimum price of this
range and hourly demand orders at the maximum price of this range are interpreted as price-
taking orders, indicating that the member is willing to sell/buy the quantity irrespective of the
market clearing price.

105
• Curtailment sharing: The aim of curtailment sharing is to equalize as much as possible the
curtailment ratios between those bidding areas that are simultaneously in a curtailment situation,
and that are configured to share curtailment.
• Maximising accepted volumes: the algorithm maximizes the accepted volume.
• Merit order enforcement: This step enforces merit order numbers of the hourly orders if
applicable. The acceptance of hourly orders with merit order numbers at-the-money is relaxed
and re-distributed according to their acceptance priority. This problem is solved only if the
solution found satisfies the PUN requirements (after the PUN search) or if there are no PUN
orders but there exist some merit orders.
• Flow indeterminacy: re-attributes flows on the ATC lines based on the linear and quadratic cost
coefficients of these lines.

106

107
Chapter 5. The benefits of Market Coupling The aim of Chapter 5 is to quantify the inefficiencies of explicit auctions between Italy and its
neighbouring countries. The Chapter takes into consideration two different inefficiencies: one
is the inefficiency of prices and flows, and the other one is the inefficiency of the Net Transfer
Capacity. The first measure the anti-economic flows between two countries. The second type
of system inefficiency is the unused cross-border capacity.
The results show that the
5.1 IT-SI Market Coupling
The IT-SI Market Coupling started on 2011. In the following 3 days from the go-live of the
Market Coupling between Italy and Slovenia, the mechanism runs properly. The price
convergence occurs only in 17% of the total. However, comparing the different allocation
mechanisms – implicit daily auction on the BSP zone and explicit auction on the Slovenia
foreign virtual zone – it is possible to highlight the efficiency of the coupling mechanism.
The BSP zone has to face the offers presented on BSP. Its interconnection capacity with the
Slovenian system represents the shares of allocated capacity on a daily basis through the Market
Coupling. On the other hand, the shares of interconnection capacity allocated by the explicit
auction continue to converge on the foreign virtual zone Slovenia
Fig. 35 BSP import, Nord and BSP prices
Source: GME, Newsletter January 2011

108
In fact, taking into account the capacity, the Market Coupling took into consideration the price
differential within the borders. As it is possible to see from Figure 35, the coupling mechanism
resulted in import for the Italian border in the hours with a positive price differential (83% of
hours) and in export with price differential equal to zero (17% of hours).
Figure 36 shows that the price differential between the North price and the BSP price affects
only the import from the BSP zone, while the Slovenia zone exports energy constantly.
Fig. 36 Net import on Slovenia BSP, Slovenia Nord and on the SI-North border
compared to the price differential SI-North
Source: GME, Newsletter January 2011
5.2 Price inefficiencies The price inefficiencies of the Italian market have been observed between Italy and its
neighbouring countries: France (FR), Switzerland (CH), Austria (AT), Slovenia (SI) and
Greece (GR). With the exception of Greece, the price of energy in each country was compared
to the Italian Northern zonal price (IT-North). On the other hand, Greece is compared to the
Italian Southern zonal price (IT-South).
A price inefficiency – in this case an anti-economic flow – is when the electricity flow, that
usually goes from a zone with the lowest price to another zone with the highest price, goes in
the reverse direction. In other words, if we have two zones 𝐴 and 𝐵, with prices 𝑃$ > 𝑃&, the
flows usually go from 𝐵 to 𝐴. In this situation the difference between the prices of the markets
(𝑃$ − 𝑃&) is positive (∆>0). An anti-economic flow is when the flows continue to go in the
same direction, but 𝑃$ is lower than 𝑃&. In this case, the difference between 𝑃$ and 𝑃& is

109
negative (∆<0). So, the country that usually has the highest price and imports electricity, when
an anti-economic flow occurs, it continues to import electricity at an higher price.
5.2.1 Methodology
The data used for the analyses were taken from the PXs sites of each neighbouring countries,
GME, Terna and ENTSO-E database. The data are evaluated during the time period 2013-2015.
The sites of the PXs have provided the data of the daily hourly prices of period considered. The
prices are the Baseload Wholesale Day-Ahead Prices of each market while the volumes used
for the analyses are the Scheduled Commercial Exchange by country, provided by the ENTSO-
E site. First it was necessary to sort the data in order to compare them with each other. Secondly,
it was necessary to couple each country with the Italian data. Finally, it was possible to process
the data.
In order to observe the price inefficiencies, it was necessary to conduct three different analyses.
The first analysis is the difference between the prices of the compared price markets. The
difference of the prices compared during the years shows the trends of the price and the level
of harmonisation that the markets reach.
The second analysis is on the price convergence of the markets. It is analysed the hourly price
difference of the markets, more in detail how many hours during the year had a difference of
less than 0,05 €/MWh, less than 1 €/MWh, less than 10 €/MWh and more than 10 €/MWh.
Aim of the third analysis is to calculate the real price inefficiency. The inefficiencies are
calculated both for imports and for exports. The analysis counts the amount of hours in which
there was an anti-economic flows and the GWh imported and exported by the system under
anti-economic flows.
Through these three analyses it is possible to see the change of the price trends over the time,
the change in the price difference during the years and the amount of anti-economic flows.
5.2.2 Price differences
The graphs representing the price differences between the wholesale baseload prices show the
price trends during the period 2013-2015. As it is possible to see, the Italian price is still higher
than the other price, except for Greece. The trend during the years is downward and the Italian
price remain higher than the others. Also, the price difference trend narrowed during the years,
especially between Italy and Greece.
This part of the analysis is useful in order to find the price difference value, which will be used
later in the analysis. The graphs below represent the prices and their difference. The Graphs are
sorted by country in chronological order.

110
Graph 8 IT-AT Price Differential. Source: GME, EPEX

111
Graph 9 IT-FR Price Differential. Source: GME, EPEX
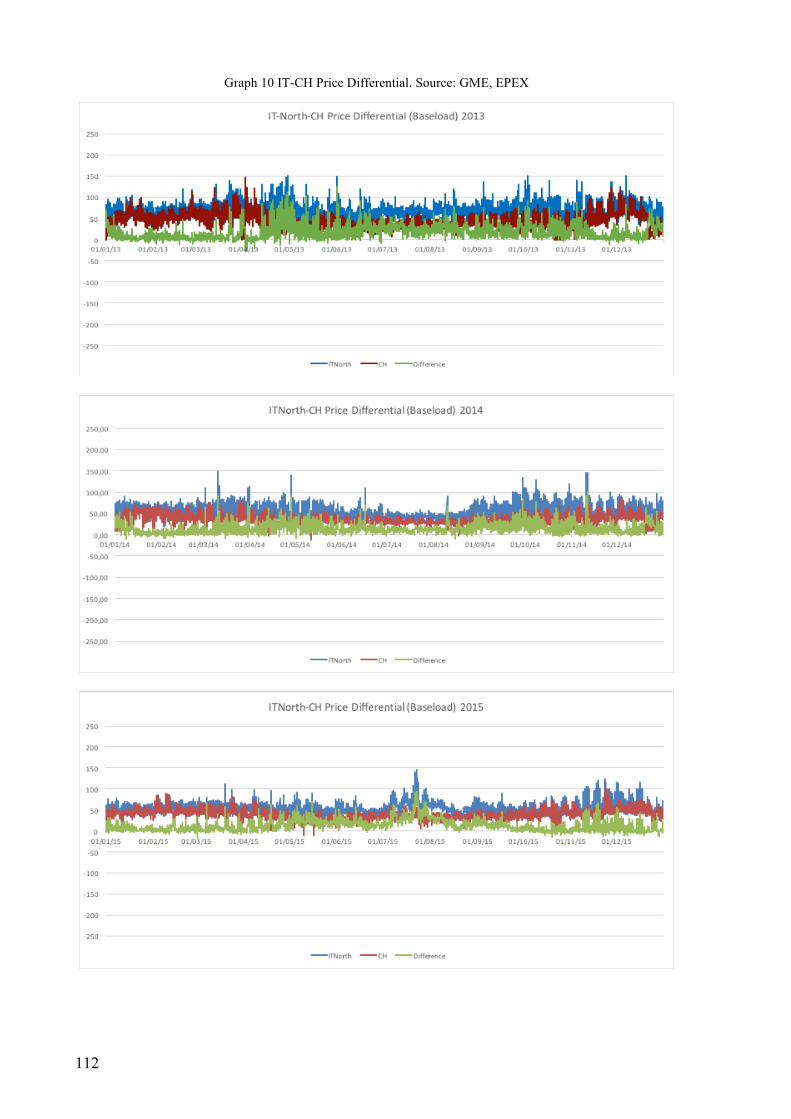
112
Graph 10 IT-CH Price Differential. Source: GME, EPEX

113
Graph 11 IT-SI Price Differential. Source: GME, BSP
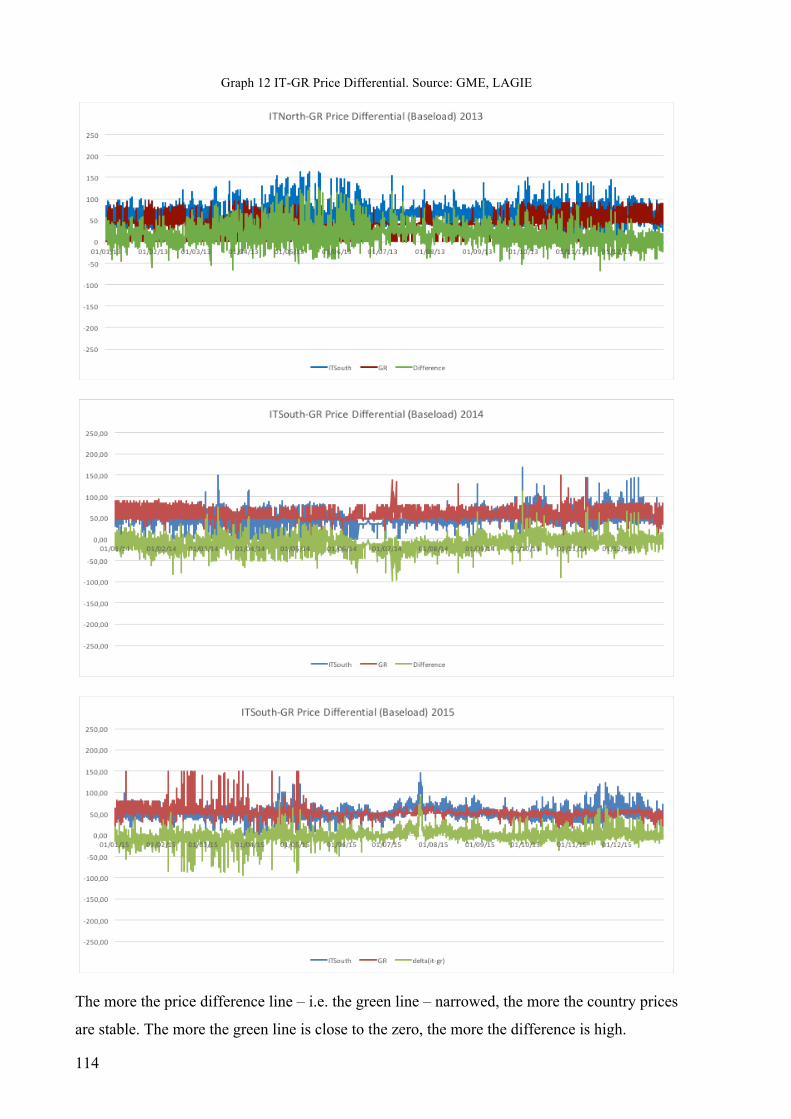
114
Graph 12 IT-GR Price Differential. Source: GME, LAGIE
The more the price difference line – i.e. the green line – narrowed, the more the country prices
are stable. The more the green line is close to the zero, the more the difference is high.

115
5.2.3 Price convergence
The analyses on the price convergence consist of the observation of the hourly price difference
between the country prices. First, the prices have been converted into their absolute value.
Subsequently, the prices have been grouped in slots, from a slot composed by low price
differences to the highest price difference. The price slots are four: prices lower than 0,05
€/MWh, between 0,05 €/MWh and 1 €/MWh, between 1 €/MWh and 10 €/MWh and higher
than 10 €/MWh. Finally, they have been organised in pillar. Each pillar is the 100% of the
yearly hours, that is 8760 hours per year. The percentage on the left of the graphs reveals the
percentage that the slots occupy in the pillar. For example, the price convergence between the
Italian and French prices in 2013 is composed by a difference of more than 10 €/MWh in the
60% of the yearly hours. In 2015 this slot is reduced about 10% and the slot with the lower
value (0,05 €/MWh) increases up to 10%.
As it is possible to see in the Graphs below, the slots in yellow reduce their value during the
period 2013-2015. Most of the time the grey slots increase their amount against the red and the
blue slots. Only the IT-SI graph shows a market increase in the blue slot, the one with the
slowest value. The IT-SI price difference is clearly going towards the price harmonisation.
A similar phenomenon is highlighted in the IT-FR price difference, although lower than the IT-
SI difference.
Graph 13 IT-AT Price Convergence 2013-2015
Source: GME, EPEX
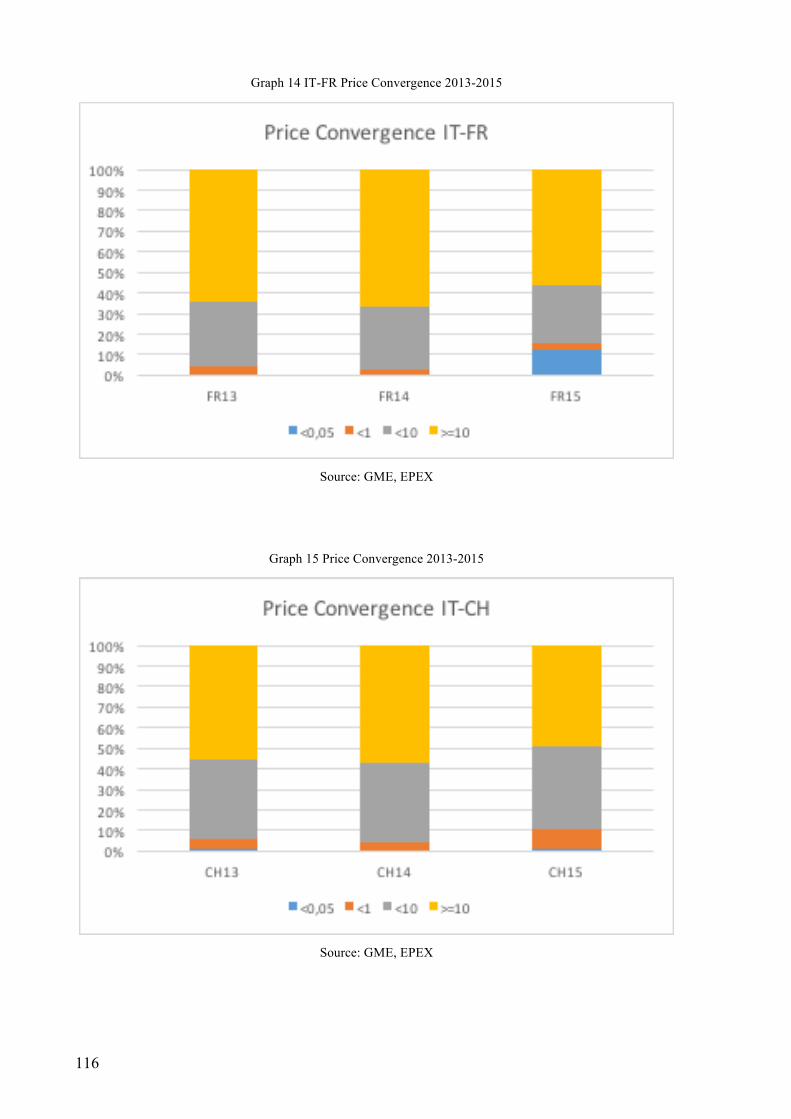
116
Graph 14 IT-FR Price Convergence 2013-2015
Source: GME, EPEX
Graph 15 Price Convergence 2013-2015
Source: GME, EPEX

117
Graph 16 IT-SI Price Convergence 2013-2015
Source: GME, BSP
Graph 17 Price Convergence 2013-2015
Source: GME, LAGIE

118
The graphs show that there is a real price convergence during the years, and the price difference
is composed by differences smaller a day after another. However, price differences hold
between countries.
5.2.4 Anti-economic flows
In order to calculate the inefficiency of the markets, were used hourly price data of each year
compared to the volumes in import and export direction.
The first line of the charts refers to the hours with import anti-economic flows. The second line
refers to the hours with export anti-economic flows. The last two lines refers to the amount of
GWh of the anti-economic flows.
In order to calculate the amount of hours with anti-economic flows was necessary to compare
price differences and import flow: inefficiency occurs when the price difference is negative and
the volume is positive. The hours with negative price difference and volume equal to zero were
not considered.
On the other hand, the amount of hours with anti-economic flows was calculated in the same
way. The price difference between Italy and the importing country, and the volume considered
were both positive. As before, the volume equals to zero were not considered.
The volume of the import and the export are the hourly volume considered with the negative
prices (import) or the positive prices (export).
5.1.4.1 Anti-economic flows 2013
FR CH AT SI GR Total
Hours with Anti-
economic Flow
(import)
820 615 214 46 793 2.488
Hours with Anti-
economic Flow
(export)
25 47 23 68 164 327
Anti-economic Flow
(import) GWh 1.383 1.297 41 12 169 2902
Anti-economic Flow
(export) GWh 4 5 1 1 10 21
Chart 10 Anti-economic flows 2013. Source: GME, EPEX, BSP, LAGIE, TERNA, ENTSO-E

119
It is possible to see that all the borders considered have anti-economic flows and especially the
import flows. France has an adverse flow in the 10% of the hours, and the Greece is slightly
lower. The Slovenian border is the lower, thanks to the already functioning Market Coupling
mechanism of the market.
5.2.4.2 Anti-economic flows 2014
FR CH AT SI GR Total
Hours with Anti-
economic Flow
(import)
457 333 220 2 125 1.137
Hours with Anti-
economic Flow
(export)
24 33 32 44 503 636
Anti-economic Flow
(import) GWh 976 802 38 0,6 18 1.834,6
Anti-economic Flow
(export) GWh 7 15 1 5 149 177
Chart 11 Anti-economic flows 2014. Source: GME, EPEX, BSP, LAGIE, TERNA, ENTSO-E
In 2014, the data show a decrease of about 50% than 2013. The Greek data show an increase in
exports that also increase the inefficiencies in the total hours on import. The Slovenian border
inefficiency is even lower than the previous year.
5.2.4.3 Anti-economic flows 2015
In 2015, the data show a significant increase of inefficiencies in each borders, except for the
Slovenian border. The Market Coupling mechanism resets both the import and the export
Slovenian flows inefficiencies.
Starting from February 2015 was activated the Market Coupling mechanism on the other
borders, with the exception of Greece and Switzerland. The results observed until now are based
on the volumes of the Foreign Virtual Zone of Austria, France and Switzerland. In order to
estimate the inefficiencies of the Market Coupling it is necessary to use the import and export
data referred to the Market Coupling between the foreign markets and Italy. The data are taken
from the GME internet site that provides the Austrian and French data on the Market Coupling.

120
As it is possible to see from the Chart, the inefficiencies are significantly lower than the
previous years in the countries coupled. From hundreds to few dozens of inefficiency hours,
from thousands of GWh to less than a hundred.
So, the Market Coupling allows the system to better control the flows in the wrong direction.
The price harmonisation of the different countries helps stabilise the Cross-Border Exchange
between the markets.
Chart 12 Anti-economic flows before February 2015
FR CH AT SI GR Total
Hours with Anti-
economic Flow
(import)
526 1.330 68 0 2.500 4.424
Hours with Anti-
economic Flow
(export)
680 1.047 104 0 1 1832
Anti-economic Flow
(import) GWh 1.044 3.455 14 0 246 4.759
Anti-economic Flow
(export) GWh 98 238 4 0 213 553
Source: GME, EPEX, BSP, LAGIE, TERNA, ENTSO-E
Chart 13 Anti-economic flows on MC markets post Februardy 2015
FR CH AT SI GR Total
Hours with Anti-
economic Flow
(import)
50 - 11 0 - 61
Hours with Anti-
economic Flow
(export)
8 - 1 0 - 9
Anti-economic Flow
(import) GWh 65 - 2,9 0 - 67,9
Anti-economic Flow
(export) GWh 2 - 0,099 0 - 2,099
Source: GME, EPEX, BSP, LAGIE, TERNA, ENTSO-E

121
5.3 Unused cross-border capacity
The second system inefficiency considered is the unused cross-border capacity between Italy
and the neighbouring countries.
The unused capacity is defined as the difference between the hourly Net Transfer Capacity
(NTC), in the direction from the lower price area to the higher price area, and the hourly day-
ahead net commercial schedule – i.e. the FLOW.
So, the unused capacity is:
𝑁𝑇𝐶,→. − 𝐹𝐿𝑂𝑊,→.
where H and L are, respectively, the higher price area and the lower price area.
Another useful index of the inefficiency of the market is the estimated value of the unused
cross-border capacity. It consists of:
𝑁𝑇𝐶,→. − 𝐹𝐿𝑂𝑊,→. ∗ (𝑃𝑟. − 𝑃𝑟,)
where 𝑃𝑟. and 𝑃𝑟, are, respectively, the hourly prices of the higher and lower price area.
The data of the hourly NTC day-ahead volumes were provided by the ENTSO-E database and
the FLOW – i.e. the Commercial Schedules – was provided by ENTSO-E or, alternatively, by
the GME historical database.
The countries considered are France, Switzerland, Austria and Slovenia. Greece is not
considered because the lack of data. It is only considered the unused import flow between
countries because of Italy is a net importer on all the Northern borders.
2013 Unused NTC
FR CH AT SI Total
Import Unused
(GWh) 1.950 3.863 38 0 5.851
Estimated Value
(€) 6.380.762 11.546.643 58.223 0 17.985.628
Chart 14 Unused NTC 2013. Source: GME, TERNA, ENTSO-E
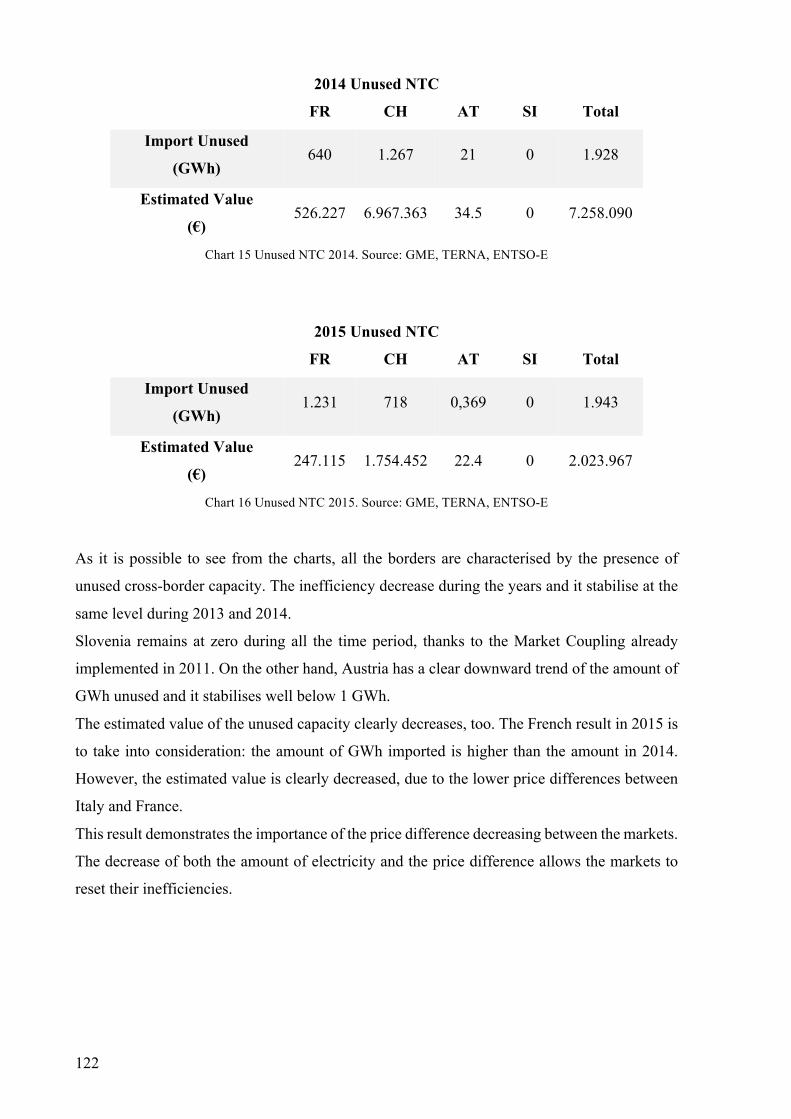
122
2014 Unused NTC
FR CH AT SI Total
Import Unused
(GWh) 640 1.267 21 0 1.928
Estimated Value
(€) 526.227 6.967.363 34.5 0 7.258.090
Chart 15 Unused NTC 2014. Source: GME, TERNA, ENTSO-E
2015 Unused NTC
FR CH AT SI Total
Import Unused
(GWh) 1.231 718 0,369 0 1.943
Estimated Value
(€) 247.115 1.754.452 22.4 0 2.023.967
Chart 16 Unused NTC 2015. Source: GME, TERNA, ENTSO-E
As it is possible to see from the charts, all the borders are characterised by the presence of
unused cross-border capacity. The inefficiency decrease during the years and it stabilise at the
same level during 2013 and 2014.
Slovenia remains at zero during all the time period, thanks to the Market Coupling already
implemented in 2011. On the other hand, Austria has a clear downward trend of the amount of
GWh unused and it stabilises well below 1 GWh.
The estimated value of the unused capacity clearly decreases, too. The French result in 2015 is
to take into consideration: the amount of GWh imported is higher than the amount in 2014.
However, the estimated value is clearly decreased, due to the lower price differences between
Italy and France.
This result demonstrates the importance of the price difference decreasing between the markets.
The decrease of both the amount of electricity and the price difference allows the markets to
reset their inefficiencies.
123
5.4 Results
The analyses adopted in order to quantify the inefficiencies of the Italian market confirm the
hypotheses on the good results of the Market Coupling mechanism. The Italian market is
proceeding towards the harmonisation with some of the neighbouring countries and the gains
of the integration between countries are clear: the decrease of the wholesale electricity prices,
the better use of the transmission mechanism between countries and the reduction of welfare
losses of the system are significant.
More in detail the anti-economic flows clearly decrease in 2015, year of the Market Coupling
go-live on the Austrian and French borders. The decrease of the anti-economic flows on these
two borders from 2013 to 2015 is about 94%, from 1034 anti-economic hours to 61 hours, equal
to 68 GWh of inefficiency, compared to 1424 GWh in 2013.
The unused cross border capacity on the import data with France and Austria decreases about
77%, from 5851 GWh in 2013 to 1231,4 GWh on 2015. The estimated value of the unused
cross-border capacity decrease from about 6,4 million/€ to 269.515 € in 2015. The Swiss border
presents a clear decrease from 2013 to 2015. The amount of GWh of inefficiency are 3.863,
with an estimated value of 11,5 million/€. In 2013 the situation improves: the unused amount
of electricity is equal to 718 GWh and the estimated value is “only” equal to 1,7 million/€.

124
Conclusions The aim of this thesis was to explain the steps taken from European Commission for the fully
energy integration. After World War II the energetical issue has become a central element in
European Commission policy. First Euratom and then all the legislative packages described in
the first chapter contributed to a higher integration between markets. The European Union
understood the importance of the European energy integration between countries. During the
years events like economic crisis, oil shocks and nuclear disaster reminded to Europe that
energy was essential for the survival of the Union. The liberalisation of the power markets first,
and then the creation of European supranational institutions able to coordinate all the countries
through the market harmonisation, allowed to improve the integration of the markets.
The Italian energy market changed considerably after the liberalisation process since it signed
the end of ENEL’s monopoly and allowed other actors to operate on the market. In fact the
capacity divestitures imposed to ENEL decrease its market share in generation up to 50% of
the national market share. It is evident that no clear choice has been made by the Government
either in favour of an electricity market, where firms operate freely and competition is the main
driving force, or in favour of an administered system, where public presence is paramount.
These unclear perspectives had a negative impact on one of most relevant issues of the
electricity industry in Italy.
At the end of the liberalisations process the European Commission started with an intensive
process for the integration of the markets which can be considered a necessary step for the real
unification of Europe. In fact, the national power markets had to cope with the one single
currency – i.e. Euro – thus cumulating constraints from the monetary union with the costs of
the continuing partition of the markets. The Italian market needs to improve its position. With
particular strength Italy had the higher average prices of energy than European average. This
situation was mainly caused by the sources mix of electricity production and from the lack of
interconnections with the neighbouring countries. The hardware and software aspects of the
European market integration process promoted by the EU helped the Italian system to continue
the market reforms and the improvement market infrastructures and rules.
The hardware contributes to improve the interconnections with others markets, allowing the
country to achieve good results. On the improvement side of the already existing
interconnections permits Italy experienced a clear decrease in its national price. One the latest
project developed connects Italy to the Balkan area that is a completely new market and its
evolution could be an important Italian national target, in order to create a new and potentially
profitable interconnection.

125
In addition the software implemented by the European Commission is the real core of the
integration process of the markets: the Network Codes and the single algorithm for the markets
allow the coupling of the power systems all over Europe. The first factor allows the
harmonisation of the systems and the implementation of the second factor which is the
algorithm. Indeed, the algorithm – and the implicit auction rules – is the mechanism that allows
a better coordination, a better management and, so, a better transmission of energy. Improving
the efficiency of the cross-border trade over interconnections is a key part of the Target
Electricity Model (TEM) of the EU.
Newbery (2016) finds out that the increase in benefits hoped by lower inefficiencies has two
policy implications. First, the gains obtained need to be reflected in payments to the
infrastructure providing the services. Second, the clear profitability of interconnectors will help
the European Commission to implement its ambitious targets for cross-border links.
This thesis measured two inefficiencies in the Italian markets and the results reflect the initial
expectations. The markets that implemented the Market Coupling mechanism obtained welfare
gains as the decrease of market inefficiencies. The inefficiencies measured in the thesis are two:
one measured the Anti-Economic Flows on the cross-border trade of the Italian borders, the
other one is the Unused Cross-Border Capacity of the market. The first inefficiency is measured
in terms of hours of inefficiencies and the equivalent amount of GWh. The second inefficiency
is measured as the amount (GWh) of unused imported electricity from the foreign countries to
Italy. Both the analyses are realised on France, Switzerland, Austria and Slovenia.
The results of the analyses show the effective welfare gains of the MC mechanism. On the one
hand the decrease of the anti-economic flows of about 97% on all the countries considered,
equal to about 2400 hours less. On the other hand, the decrease of the unused capacity allowed
the system to gain about 15 million during the 2013-2015 period.
In conclusion the Italian power market will surely obtain gains from the Market Coupling
mechanism implementation. Obviously, in order to have a better idea of the amount of the total
gains it is necessary a deeper and more exhaustive analysis. In fact, if on one hand it is possible
to collect good amount of data whilst on the other hand some data are still incomplete or not
available to the public with free access.
In my opinion, the European electricity market is an opportunity that Italy cannot and shouldn’t
lose. Italy, in this historic moment, does not have the strength and the ability to play the game
on its own.
Finally, the recent events that took place in UK should have no consequences on the European
market in the short term, according to Grubb and Tindale (2016). Initially the impact would be
126
limited because EU rules would remain in place. Post-2020 the effect would depend on the
extent to which Brexit slowed down the construction of new electricity interconnectors, because
of the lack of European funds, and on the arrangements the UK negotiated with the rest of the
EU. The impact of Brexit on UK climate and energy policy would also depend on the
referendum’s domestic consequences. The Leave campaign appears significantly aligned with
desire to weaken environmental policy. In fact 70% of the environmental safeguards and
legislation is European Legislation, and is at risk. A substantial weakening could restrict the
terms of energy trade, and would be inconsistent with UK legislation. Brexit, in the end, will
probably make UK a weaker actor on energy.
This situation involves Italian companies investing in UK, especially in the energy sector with
ENI. The raise of UK defensive barriers both import and for trade relations certainly will
decrease opportunities of trade agreements and reduce the possibility of expanding the Italian
market.
127
Reference list Aitken, N. D. (1973). The effect of the EEC and EFTA on European trade: A temporal
cross-section analysis. The American Economic Review, 63(5), 881-892.
American Public Power Association, 2004, APPA Report 2004.
An Electric History, 2015, Archivio Storico ENEL. Atti parlamentari, Camera dei Deputati, Seduta di martedì 27 Novembre 1962, Disegno
di Legge, Istituzione dell’Ente per l’energia elettrica e trasferimento ad esso delle imprese
esercenti le industrie elettriche, 1962.
Authority, F. C. (2015). Annual Report and Accounts 2014/15.
Balassa, B. (1967). Trade creation and trade diversion in the European Common Market.
The Economic Journal, 77(305), 1-21.
Bergman, L., & Vaitilingam, R. (1999). A European market for electricity? (Vol. 2).
Centre for Economic Policy Research.
Bigerna, S., & Bollino, C. A. (2014). Optimal design for hourly electricity price in the
Italian market. Atlantic Economic Journal, 42(1), 111.
Black-out del sistema elettrico italiano del 29 Settembre 2003, Rapporto della
Commissione di Indagine, 28 Novembre 2003.
Blair, A. (2012). The European Union Since 1945 (Longman Seminar Studies in
History Series), 166 pp. ISBN: 0-582-42393-7.
Böhringer, C., Hoffmann, T., & Vögele, S. (2002). The cost of phasing out nuclear
power: a quantitative assessment of alternative scenarios for germany. Energy economics,
24(5), 469-490.
Borenstein, S., Bushnell, J., & Stoft, S. (1997). The competitive effects of transmission
capacity in a deregulated electricity industry (No. w6293). National Bureau of Economic
Research.
Bosco, B. P., Parisio, L. P., & Pelagatti, M. M. (2007). Deregulated wholesale electricity
prices in Italy: an empirical analysis. International Advances in Economic Research, 13(4),
415-432.
Bower, J., & Bunn, D. W. (2000). Model-based comparisons of pool and bilateral
markets for electricity. The energy journal, 1-29.
128
Bührer, W., & Griffiths, R. T. (2001). Explorations in OEEC History (OECD Historical
Series).
Chaudry, M., Ekins, P., Ramachandran, K., Shakoor, A., Skea, J., Strbac, G., ... &
Whitaker, J. (2011). Building a resilient UK energy system.
Chick, M. (2007). Electricity and energy policy in Britain, France and the United States
since 1945. Edward Elgar Publishing.
Churchill, W., 1946, The United States of Europe as the sole guarantee for peace,
University of Zurich, 19 September.
Completing the Internal Market, 1985, White Paper from the Commission to the
European Council.
Conejo, A. J., Contreras, J., Espinola, R., & Plazas, M. A. (2005). Forecasting electricity
prices for a day-ahead pool-based electric energy market. International Journal of Forecasting,
21(3), 435-462.
Council Resolution of 17 September 1974 concerning a new energy policy strategy for
the Community, Official Journal C 153 , 09/07/1975 P. 0001 – 0002.
Cramton, P., Kahn, A. E., Porter, R. H., & Tabors, R. D. (2001). Pricing in the California
Power Exchange Electricity Market: should California switch from uniform pricing to pay-as-
bid pricing?.
Creti, A., Fumagalli, E., & Fumagalli, E. (2010). Integration of electricity markets in
Europe: relevant issues for Italy. Energy Policy, 38(11), 6966-6976.
Deane, J. P., Gracceva, F., Chiodi, A., Gargiulo, M., & Gallachóir, B. P. (2015).
Assessing power system security. A framework and a multi model approach. International
Journal of Electrical Power & Energy Systems, 73, 283-297.
De la Torre, J., & Rubio, M. M. (2014). El Estado y el desarrollo de la energía nuclear
en España, c. 1950-1985. DT AEHE, (1403).
Decreto del Presidente del Consiglio dei Ministri, GU n.115 18/05/2004.
Decreto Legislativo 16 marzo 1999, n.79, Attuazione della direttiva 96/92/CE
recante norme comuni per il mercato interno dell’energia elettrica, GU n.75 31 marzo
1999.
Di Cosmo, V. (2015). Forward Price, Renewables and the Electricity Price: The
Case of Italy (No. WP511).

129
Dinan, D. (1999). Ever closer union: an introduction to European integration. Boulder:
London.
Ding, F., & Fuller, J. D. (2005). Nodal, uniform, or zonal pricing: distribution of
economic surplus. IEEE Transactions on Power Systems, 20(2), 875-882.
Domah, P., & Pollitt, M. G. (2001). The restructuring and privatisation of the electricity
distribution and supply businesses in England and Wales: a social cost-benefit analysis. Fiscal
Studies, 22(1), 107-146.
Dutton, J. (2015), EU Energy Policy and the Third Package, EPG Working Paper.
Ehrenmann, A., & Neuhoff, K. (2009). A comparison of electricity market designs
in networks. Operations research, 57(2), 274-286.
Eising, R. (2002). Policy learning in embedded negotiations: Explaining EU
electricity liberalization. International Organization, 56(01), 85-120.
Electricity Consumers Resource Council, 2002, ELCON Report 2002.
Endoh, M. (1999). Trade creation and trade diversion in the EEC, the LAFTA and
the CMEA: 1960-1994. Applied Economics, 31(2), 207-216.
ENTSO-E, (2012), Network Code on Capacity Allocation and Congestion
Management, Purpose and Objectives.
ENTSO-E, (2014), Network Code on Electricity Balancing, Version 3.0.
European Commission, 1997, Directive 96/92/EC of the European Parliament and
of the Council of 19 December 1996 concerning common rules for the internal market in
electricity, Official Journal L 027.
European Commission, 1998, Conclusions on the Review of Energy Sources for Power
Generation and Government response to fourth and fifth Reports of the Trade and Industry
Committee.
European Commission, 2003, Directive 2003/54/EC, Concerning common rules
for the internal market in electricity.
European Commission, 2010, Communication from the Commission Europe 2020
A strategy for smart , sustainable and inclusive growth, Brussels.
European Commission, 2013, Regulation (EU) No 347/2013.
Fabra, N. (2003). Tacit collusion in repeated auctions: uniform versus
discriminatory. The Journal of Industrial Economics, 51(3), 271-293.
130
Fabra, N., & Toro, J. (2003). The fall in British electricity prices: market rules,
market structure, or both?.
Fabra, N., Fehr, N. H., & Harbord, D. (2006). Designing electricity auctions. The
RAND Journal of Economics, 37(1), 23-46.
Federico, G., & Rahman, D. (2003). Bidding in an electricity pay-as-bid auction. Journal
of Regulatory Economics, 24(2), 175-211.
Ferrari, A., & Giulietti, M. (2005). Competition in electricity markets: international
experience and the case of Italy. Utilities Policy, 13(3), 247-255.
Gianfreda, A., & Grossi, L. (2009, May). Zonal price analysis of the Italian wholesale
electricity market. In 2009 6th International Conference on the European Energy Market (pp.
1-6). IEEE.
Gianfreda, A., & Grossi, L. (2012). Forecasting Italian electricity zonal prices with
exogenous variables. Energy Economics, 34(6), 2228-2239.
Giulietti, M., & Sicca, R. (1999). The liberalisation of the internal market for electricity:
what choices for Italy?. Utilities Policy, 8(3), 173-182.
GME (2009). Vademecum of the Italian Power Exchange (IPEX).
Goto, M., & Karolyi, G. A. (2004). Understanding electricity price volatility within and
across markets.
Goormahgtigh, J. (1953). European Coal and Steel Community. Int'l Conciliation, 30,
341.
Green, R. J., & Newbery, D. M. (1992). Competition in the British electricity spot
market. Journal of political economy, 929-953.
Green, R. (2006). Electricity liberalisation in Europe—how competitive will it be?.
Energy Policy, 34(16), 2532-2541.
Green, R. (1999). Draining the pool: the reform of electricity trading in England and
Wales. Energy Policy, 27(9), 515-525.
Guerci, E., & Rastegar, M. A. (2012). Comparing system-marginal-price versus
pay-as-bid auctions in a realistic electricity market scenario. In Managing Market
Complexity (pp. 141-153). Springer Berlin Heidelberg.
Haberler, G. (1948). Some economic problems of the European Recovery Program. The
American Economic Review, 38(4), 495-525.
Hancher, L. (1997). Slow and not so sure: Europe's long march to electricity market
liberalization. The Electricity Journal, 10(9), 92-101.
131
Harvey, S. M., & Hogan, W. W. (2000). Nodal and zonal congestion management and
the exercise of market power. Harvard University.
Haskel, J., & Szymanski, S. (1993). Privatization, liberalization, wages and
employment: theory and evidence for the UK. Economica, 161-181.
Hecht, G., & Callon, M. (2009). The radiance of France: Nuclear power and national
identity after World War II. MIT press.
Hertog, S., & Venn, F. (2006). The Oil Crisis.
Ikenberry, G. J. (1986). The irony of state strength: comparative responses to the oil
shocks in the 1970s. International Organization, 40(01), 105-137.
Jamasb, T., & Pollitt, M. (2005). Electricity market reform in the European Union:
review of progress toward liberalization & integration. The Energy Journal, 11-41.
Kahn, A. E., Cramton, P. C., Porter, R. H., & Tabors, R. D. (2001). Uniform
pricing or pay-as-bid pricing: a dilemma for California and beyond. The Electricity
Journal, 14(6), 70-79.
Kalantzis, F., & Milonas, N. T. (2010, June). Market integration and price
dispersion in the European electricity market. In 2010 7th International Conference on the
European Energy Market (pp. 1-6). IEEE.
Karakatsani, N. V., & Bunn, D. W. (2008). Forecasting electricity prices: The
impact of fundamentals and time-varying coefficients. International Journal of
Forecasting, 24(4), 764-785.
Kayikci, M. S. (2011). The European Third Energy Package: How Significant for
the Liberalisation of Energy Markets in the European Union?.
Koopman, S. J., Ooms, M., & Carnero, M. A. (2007). Periodic seasonal Reg-
ARFIMA–GARCH models for daily electricity spot prices. Journal of the American
Statistical Association, 102(477), 16-27.
Kube, M., & Wadhwa, P. (2007). Does size matter? The effect of market
integration on wholesale prices in the Nordic electricity market (Doctoral dissertation,
Master’s thesis, Stockholm School of Economics).
Kurpas, S., Crum, B., Schoutheete, P., Keller, J., Dehousse, F., Andoura, S., ... &
Bribosia, H. (2007). The Treaty of Lisbon: implementing the institutional innovations. Joint
Study Ceps. EGMONT. EPC Study.
132
Laffer, Arthur B. and Patrick N. Giordano, (2005), Exelon Rex, Will power
deregulation in Illinois benefit consumers or utilities?, Wall Street Journal.
Larsen, A., Pedersen, L. H., Sørensen, E. M., & Olsen, O. J. (2006). Independent
regulatory authorities in European electricity markets. Energy Policy, 34(17), 2858-2870.
Legge n. 481/95, 1995, Norme per la concorrenza e la regolazione dei servizi di
pubblica utilità. Istituzione delle Autorità di regolazione dei servizi di pubblica utilità,
GU n.270.
Lehtonen, M., & Nye, S. (2009). History of electricity network control and distributed
generation in the UK and Western Denmark. Energy Policy, 37(6), 2338-2345.
Licklider, R. (1988). The power of oil: the Arab oil weapon and the Netherlands, the
United Kingdom, Canada, Japan, and the United States. International Studies Quarterly, 32(2),
205-226.
Lise, W., Kemfert, C., & Tol, R. S. (2003). Strategic action in the liberalised German
electricity market (No. 2003.3).
McDaniel, T. M., & Newbery, D. M. (2002). Auctions and trading in energy
markets—an economic analysis. Regulatory Review, 3.
Meeus, L., Purchala, K., & Belmans, R. (2005). Development of the internal
electricity market in Europe. The Electricity Journal, 18(6), 25-35.
Moravcsik, A., & Nicolaidis, K. (1998). Keynote article: federal ideals and
constitutional realities in the Treaty of Amsterdam. In Journal of Common Market Studies:
Annual Review.
Murphy, M. E. (1948). PRESIDENT'S COMMITTEE ON FOREIGN AID. European
Recovery and American Aid. Pp. x, 286. Washington: US Govern ment Printing Office, 1947.
60 cents. The ANNALS of the American Academy of Political and Social Science, 257(1), 209-
210.
Neuhoff, K. (2003). Combining transmission and energy markets mitigates market
power. University of Cambridge Department of Applied Eeconomics Working Paper, (310).
Newbery, D. M. (1998). The regulator's review of the English Electricity Pool. Utilities
Policy, 7(3), 129-141.
Newbery, D. A. V. I. D. (1999). The UK experience: privatization with market power.
A European Market for Electricity, 2.

133
Newbery, D. M. (2002). Problems of liberalising the electricity industry. European
Economic Review, 46(4), 919-927.
Newbery, D. M. (2002). Regulatory challenges to European electricity liberalisation.
Swedish Economic Policy Review, 9(2), 9-44.
Newbery, D. (2005). Electricity liberalisation in Britain: the quest for a satisfactory
wholesale market design. The Energy Journal, 43-70.
Newbery, D., Strbac, G., Pudjianto, D., Noel, P., & Fisher, L. (2013). Benefits of an
integrated European energy market. Final report Prepared for Directorate-General Energy,
European Commission, 20.
Newbery, D., Strbac, G., & Viehoff, I. (2016). The benefits of integrating European
electricity markets. Energy Policy, 94, 253-263.
Oggioni, G., & Smeers, Y. (2013). Market failures of Market Coupling and counter-
trading in Europe: An illustrative model based discussion. Energy Economics, 35, 74-87.
OFFER, 1998, Review of Electricity Trading Arrangements: Framework Document.
Oren, S. (2004, October). When is a pay-as bid preferable to uniform price in electricity
markets. In Power Systems Conference and Exposition (Vol. 3, pp. 1618-1620).
Parker, D., & Martin, S. (1995). The impact of UK privatisation on labour and total
factor productivity. Scottish Journal of Political Economy, 42(2), 201-220.
Pavan, M. (2002). What's up in Italy? Market liberalization, tariff regulation and
incentives to promote energy efficiency in end-use sectors. In Proceedings of the 2002 ACEEE
Summer Study on Energy Efficiency in Buildings (Vol. 5, pp. 259-70).
Pearson, P., & Watson, J. (2012). UK Energy Policy 1980-2010: A History and Lessons
to be Learnt: a Review to Mark 30 Years of the Parliamentary Group for Energy Studies.
Parliamentary Group for Energy Studies.
Pellini, E. (2012). Measuring the impact of market coupling on the Italian electricity
market. Energy Policy, 48, 322-333.
Percebois, J. (2008). Electricity liberalization in the European Union: Balancing
benefits and risks. The Energy Journal, 1-19.
Petrella, A., & Sapio, A. (2012). Assessing the impact of forward trading, retail
liberalization, and white certificates on the Italian wholesale electricity prices. Energy policy,
40, 307-317.
134
Pettiss, S. T., & Taylor, L. (2004). After the Shooting Stopped: The Memoir of an
UNRRA Welfare Worker, Germany 1945-1947. Trafford on Demand Pub.
Pollitt, M. (2004). Electricity reform in Chile-lessons for developing countries. J.
Network Ind., 5, 221.
Pollitt, M. G. (2009). Electricity Liberalisation in Progress Report.
Polo, M., & Scarpa, C. (2003). The liberalization of energy markets in Europe and Italy.
Pond, R. (2006). Liberalisation, privatisation and regulation in the UK electricity sector.
Working Lives Research Institute.
Pycia, Marek, and Kyle Woodward, (2015), Pay-as-Bid: Selling Divisible Objects
to Uninformed Bidders.
Rassenti, S. J., Smith, V. L., & Wilson, B. J. (2003). Discriminatory price auctions
in electricity markets: low volatility at the expense of high price levels. Journal of
regulatory Economics, 23(2), 109-123.
Reinisch, J. (2011). Internationalism in Relief: The Birth (and Death) of UNRRA. Past
& present, 210(suppl 6), 258-289.
Ren, Y., & Galiana, F. D. (2004). Pay-as-bid versus marginal pricing-part I: strategic
generator offers. IEEE Transactions on Power Systems, 19(4), 1771-1776.
Reuter, G., 2015, France tilting toward nuclear phase-out, Deutsche Welle (DW).
Ringel, M. (2003). Liberalising European electricity markets: opportunities and risks
for a sustainable power sector. Renewable and Sustainable Energy Reviews, 7(6), 485-499.
Roger Cashmore, 2014, Chairman’s Statement, UKAEA Annual Report and Accounts.
Serrallés, R. J. (2006). Electric energy restructuring in the European Union: Integration,
subsidiarity and the challenge of harmonization. Energy Policy, 34(16), 2542-2551.
Sileo, A., 2008, Breve storia nucleare d’Italia, AGI Energia.
Sioshansi, F. P. (2001). Opportunities and perils of the newly liberalized European
electricity markets. Energy Policy, 29(6), 419-427.
Soriano, F. H., & Mulatero, F. (2010). Knowledge policy in the EU: From the Lisbon
strategy to Europe 2020. Journal of the Knowledge Economy, 1(4), 289-302.
Stern, J. P. (1997). The British Gas market 10 years after privatisation: a model or a
warning for the rest of Europe?. Energy Policy, 25(4), 387-392.
135
Stoft, S. (2002). Power system economics. Journal of Energy Literature, 8, 94-99.
Sturm, J. E., Fritsche, U., Graff, M., Lamla, M., Lein, S., Nitsch, V., ... & Triet, D.
(2009). The euro and prices: changeover-related inflation and price convergence in the euro
area (No. 381). Directorate General Economic and Financial Affairs (DG ECFIN), European
Commission.
Tehrani, B. S., Attias, D., & De Lavergne, J. G. D. (2013, May). Historical and
theoretical approach of European market: How does electricity investment decision evolve with
historical context?. In 2013 10th International Conference on the European Energy Market
(EEM) (pp. 1-7). IEEE.
Tierney, S. F., Schatzki, T., & Mukerji, R. (2008). Uniform-pricing versus pay-as-
bid in wholesale electricity markets: does it make a difference?. Analysis Group AMD
New York Independent System Operator, March.
Treaties Establishing the European Communities, 1986, The Single European Act,
Luxembourg.
TREATY, E. (1957). Treaty Establishing the European Atomic Energy Community
(Euratom).
TREATY, E. (1957). Treaty establishing the European Economic Community (EEC).
Treaty Establishing the European Community, 1957, Treaty of Rome.
Toth, A. G. (1992). The principle of subsidiarity in the Maastricht Treaty. Common
Market Law Review, 29(6), 1079-1105.
UK Government, 1983, Energy Act 1983, Chapter 25.
UK Government, 1989, Electricity Act 1989, Chapter 29.
van der Veen, R. A., Abbasy, A., & Hakvoort, R. A. (2012). Agent-based analysis of
the impact of the imbalance pricing mechanism on market behavior in electricity balancing
markets. Energy Economics, 34(4), 874-881.
von der Fehr, N. H. M., & Harbord, D. (1993). Spot market competition in the UK
electricity industry. The Economic Journal, 103(418), 531-546.
Wang, A., & Ramsay, B. (1997, June). Prediction of system marginal price in the
UK power pool using neural networks. In Neural Networks, 1997., International
Conference on (Vol. 4, pp. 2116-2120). IEEE.
136
Weron, R., & Misiorek, A. (2008). Forecasting spot electricity prices: A
comparison of parametric and semiparametric time series models. International Journal of
Forecasting, 24(4), 744-763.
Wexler, I. (1983). The Marshall Plan revisited: the European recovery program in
economic perspective (No. 55). Westport, Conn.: Greenwood Press.
Wilson, F. M. (1947). Aftermath: France, Germany, Austria, Yugoslavia, 1945 and
1946 (Vol. 614). Penguin Books.
Woo, C. K., Lloyd, D., & Tishler, A. (2003). Electricity market reform failures: UK,
Norway, Alberta and California. Energy policy, 31(11), 1103-1115.
Woodward, K. (2016). Strategic ironing in pay-as-bid auctions: Equilibrium
existence with private information. Working paper.
Yannopoulos, G. N. (1990). Foreign direct investment and European integration: the
evidence from the formative years of the European Community. JCMS: Journal of Common
Market Studies, 28(3), 235-259.

137


![universita' degli studi di padova - [email protected] - Universit](https://img.pdfslide.us/doc/110x75/620619ec8c2f7b1730049ab8/universita-degli-studi-di-padova-emailprotected-universit.jpg)