


c.2
WORKING PAPER
ALFRED P. SLOAN SCHOOL OF MANAGEMENT
Turnaround Strategies for Businesses as a
Function of Their Competitive Characteristics
by
R. A. Thietart
October 17, 1984Revised 12/11/84
1597-84
MASSACHUSETTS
INSTITUTE OF TECHNOLOGY
50 MEMORIAL DRIVE
CAMBRIDGE, MASSACHUSETTS 02139


Turnaround Strategies for Businesses as a
Function of Their Competitive Characteristics
by
R. A. Thietart
October 17, 1984 1597-84Revised 12/11/84
Visiting Professor of Management, Sloan School of Management,
Massachusetts Institute of Technology. The author is on leave of
absence from the University of Paris X-Nanterre and Essec, France.
He gratefully acknowledges the help of the Strategic Planning
Institute, which has provided the PIMS data base, and the assistanceof Pascal Constantini.

Turnaround Strategies for Businesses as a
Function of Their Competitive Characteristics
by
R. A. Thietart
Visiting Professor of Management
Sloan School of Management
Massachusetts Institute of Technology
The author is on leave of absence from the University of ParisX-Nanterre and Essec, France. He gratefully acknowledges the help ofthe Strategic Planning Institute, which has provided the PIMS database, and the assistance of Pascal Constantini.


Turnaround Strategies for Businesses as a
Function of Their Competitive Characteristics
by
R. A. Thietart
Abstract
Failing industries, poor business performance, lagging
productivity, and remedies for such problems such as revitalization,
rejuvenation, innovation and adaptation are fashionable topicsnowadays. However, few studies have dealt comprehensively with the
actions which could help in turning poorly performing businesses into
healthy ones. Most of the analyses to date have either focused on
the firm as a whole or on some very specific types of businesses.
Also, the qualitative methodologies used in some studies have yieldedresults which are difficult to generalize.
The objective of the present research is to evaluate the
effectiveness of alternative turnaround strategies in achievingmarket share, cash flow and ROI objectives. This study is made on
different low performance businesses clustered as a function of the
nature of the business —consumer durable, consumer non-durable,
capital goods, raw and semi finished materials, components for
finished goods, supplies and other consumer products— and their
competitive characteristics —entry and exit barriers, industrycharacteristics, suppliers' and customers' bargaining power,
businesses' competitive strength.
A sample of approximately 220 turnaround condidates is drawn
from the PIMS data base. A cluster analysis is run to identify
natural groupings of homogenous businesses. For each of the six
groups of turnaround candidates, linear regression models are
estimated to study the impact of turnaround actions on three perform-
ance criteria. The actions studied include organizationaldecentralization, reorientation of the marketing effort, productdifferentiation, asset divestiture, efficiency improvement andvertical integration.
The research indicates that the effectiveness of a given
turnaround strategy depends on the nature of the firm's objective—market share, cash flow or ROI— and that these strategies are
contingent upon the nature and the competitive characteristics of the
business.

M.LT. UBRAfttES
JAN 1 6 1985
REOEJVED

Introduction
The recent story of Chrysler's successful turnaround highlights
the potential for carefully conceived strategic action to dramatically
improve a business situation. Chrysler's chairman, Lee A. Iacocca,
when he first came to the poorly performing company —Chrysler lost
nearly 3.5 billions between 1978 and 1981— found it plagued with the
same maladies as those troubling firms today. These include poor
product quality, low productivity, and weak competitive position
(Iacocca, 1983). A short time later, the situation had completely
changed. The company, in the second quarter of 1984, was making a
profit of 803 million dollars.
Iacocca is part of a group of men including McPherson of Dana,
Romney from AMC, Wilson of Memorex or 0' Green at Litton that Kanter
(1983) would call the "change masters". A case study of what they
did would certainly provide interesting insights into the appropriate
actions to choose in order to get troubled businesses back on the
track of profitability and growth. However, looking at these peoples'
decision problems, we find that the business characteristics, the
competitive situation and the strategies which they adopted show some
similarities as well as some Important differences. In order to keep
track of this variety and to be able to generalize the results, it is
essential to undertake a more extensive investigation of successful
turnarounds.
Despite the importance for the business community of such a
problem, few extensive studies of this subject have been undertaken
0751.116


-2-
(Bibeault, 1982; Hambrick and Schecter, 1983; Hofer, 1980; Khandwalla,
1984; Schendel and Patton, 1976; Schendel, Patton and Rlggs, 1976;
Starbuck, Greve and Hedberg, 1978). Bibeault (1982) surveyed 81 turn-
around situations and determined from interviews with CEOs the
characteristics of successful turnarounds. Hambrick and Schecter
(1983) using the PIMS data base for studying mature industrial
products found that diverse turnaround strategies were possible and
that they depended partly on contingency factors. Hofer (1980)
examined 12 low performance firms. He argued that two types of
turnaround exist —strategic and operating— and that their
appropriateness depends on the firm's strategic and operating
health. Khandwalla (198A) looked at turnarounds in nine public and
private firms. He emphasized the importance and the role of a
powerful change agent as being the necessary condition for a
successful turnaround. Schendel, Patton and Riggs (1976) studied
compustat data on 54 poorly performing firms which subsequently
improved their position. They identified a mix of organizational,
marketing, technical, and strategic variables as being the key to
successful turnarounds. Finally, Starbuck, Greve and Hedberg (1978)
suggested that the change of the top managers coupled with
rejuvenating moves in terms of product, technology, operations and
people was very efficient.
These different studies stress the existence of several turn-
around actions: strategic, operational, organizational, and economic.
Some of them have also pointed out the importance of various contin-
gent factors: market share, level of capacity utilization, proximity
to breakeven. However, no extensive account has been made of such
factors as entry and exit barriers, industry characteristics,

-3-
suppliers' and customers' bargaining power, business competitive
strength. These different factors are analyzed in the industrial
economics and strategic management literature (Andrews, 1971; Bain,
1956; Caves and Porter, 1976; Harrigan, 1980; Porter, 1980; Scherer,
1980; Uyterhoeven, Ackerman and Rosenblum, 1973). They are shown to
influence the competitive situation and, as a consequence, the
strategies firms should implement.
In the same vein, the firm's strategic behavior may also vary
depending on its goal. The pursuit of a long term objective, such as
market share, has a different strategic implication than the pursuit
of short term goals such as cash flow or ROI (Norburn and Miller,
1981; Stonich, 1981). Organizational goals and performance measures
are multivariate and hierarchical in nature. A tradeoff often exists
between long term and short term goals. Thus, goals of market share,
cash flow, and ROI should be analyzed.
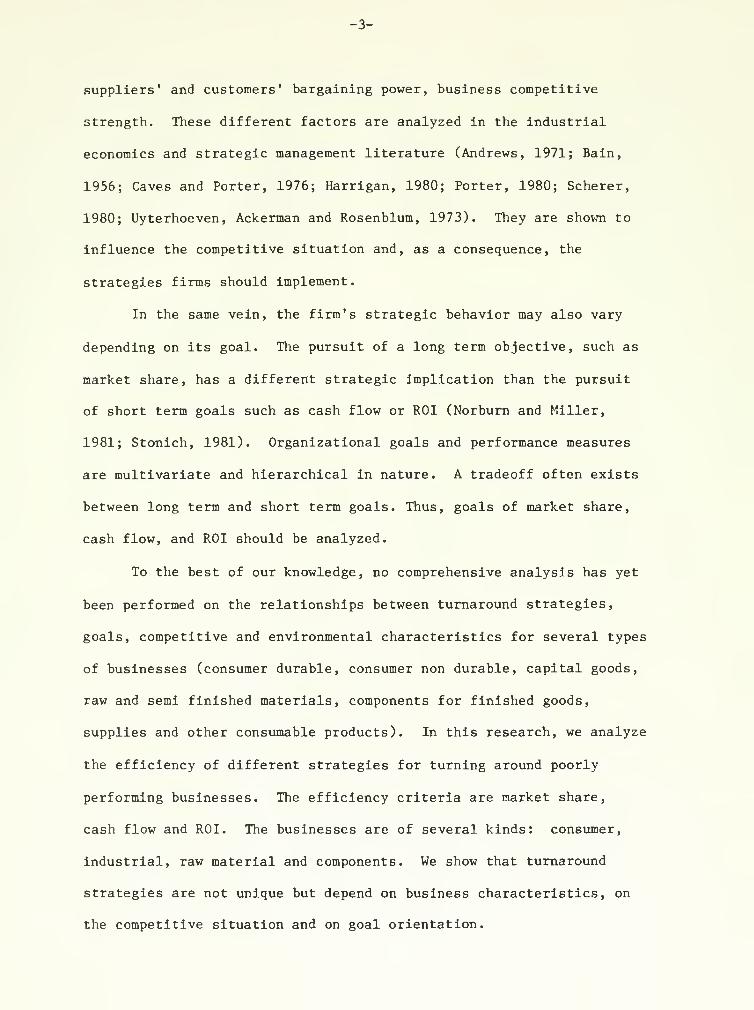
To the best of our knowledge, no comprehensive analysis has yet
been performed on the relationships between turnaround strategies,
goals, competitive and environmental characteristics for several types
of businesses (consumer durable, consumer non durable, capital goods,
raw and semi finished materials, components for finished goods,
supplies and other consumable products). In this research, we analyze
the efficiency of different strategies for turning around poorly
performing businesses. The efficiency criteria are market share,
cash flow and ROI. The businesses are of several kinds: consumer,
industrial, raw material and components. We show that turnaround
strategies are not unique but depend on business characteristics, on
the competitive situation and on goal orientation.

-4-
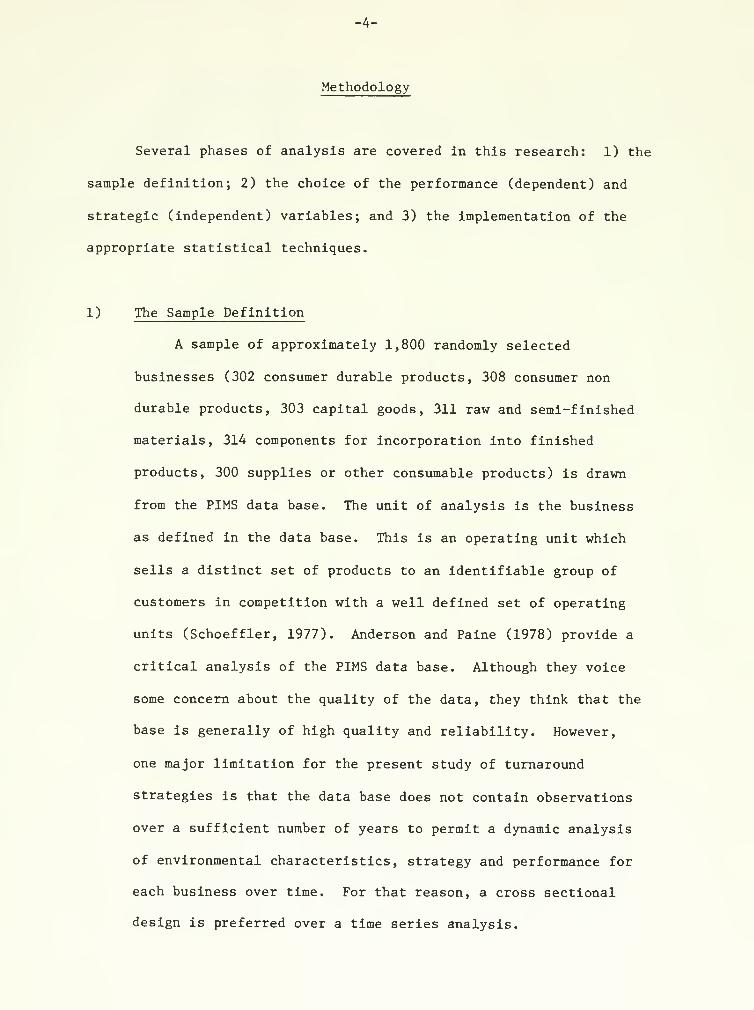
Methodology
Several phases of analysis are covered in this research: 1) the
sample definition; 2) the choice of the performance (dependent) and
strategic (independent) variables; and 3) the implementation of the
appropriate statistical techniques.
1) The Sample Definition
A sample of approximately 1,800 randomly selected
businesses (302 consumer durable products, 308 consumer non
durable products, 303 capital goods, 311 raw and semi-finished
materials, 314 components for incorporation into finished
products, 300 supplies or other consumable products) is drawn
from the PIMS data base. The unit of analysis is the business
as defined in the data base. This is an operating unit which
sells a distinct set of products to an identifiable group of
customers in competition with a well defined set of operating
units (Schoeffler, 1977). Anderson and Paine (1978) provide a
critical analysis of the PIMS data base. Although they voice
some concern about the quality of the data, they think that the
base is generally of high quality and reliability. However,
one major limitation for the present study of turnaround
strategies is that the data base does not contain observations
over a sufficient number of years to permit a dynamic analysis
of environmental characteristics, strategy and performance for
each business over time. For that reason, a cross sectional
design is preferred over a time series analysis.

-5-
o A Contingency Approach
Several recent researches (Hambrick, 1983b; Harrigan,
1980; Hofer, 1975; McMillan, Hambrick and Day, 1982; Miles and
Snow, 1978; Miller and Friesen, 1977, 1980; Porter, 1980;
Thietart and Vivas, 1984) show the influence of strategic,
organizational and environmental dimensions in shaping the
business competitive behavior. As a consequence, with respect
to the business strategic performance and the competitive
environment conditions, the businesses should exhibit a great
deal of heterogeneity.
For that reason, cluster analysis of the sample is
necessary. Theil (1965), Bass, Cattin and Wittink (1977),
Schendel and Patton (1978) stress that aggregation of
observations, without accounting for their nature and the
underlying models, produces incorrect and misleading results.
At a highly aggregate level, the results may be completely
different from the real phenomenon observed at a more
disaggregated level.
Each business has its own characteristics such as the age
of the product, the nature of technological change, the type of
customer, the organizational relationship, the production
process, and so on. These characteristics permit grouping of
the businesses and allow us to infer, for each group, the
existence of the same strategic behavior. With this in mind,
then, a search for groups of homogeneous businesses in terms of
external and internal characteristics is undertaken. To do so,
the businesses are divided into six main sets on the basis of

-6-
the nature of the business. A cluster analysis (Schlaifer,
1978) is then made to identify the natural groups in each set.
To assess the stability of the groupings, three different
clustering methods are used. The first one is the "nearest-
neighbor" method which aims to maximize the minimum between -
cluster distance. The second one is the "progressive-threshold"
method (Wishart, 1969) where the distance from each business to
its k'th nearest neighbor sets up a new threshold for ordinary
nearest-neighbor mergers. If the business being processed is
within the threshold of an already existing cluster it is
clustered with it; if not, it becomes the center of a new
cluster. After all businesses are analyzed the remaining groups
are clustered by the "nearest-neighbor" algorithm. The third
method is the "unimodal" method (Gitman and Levine, 1970) which
makes two separate analyses of the businesses in order of
decreasing density. In the first analysis, points which
represent local maxima of the density function are identified.
Then, in a second analysis, the method takes the local maxima
as cluster nuclei and merges the other point in order of
decreasing density according to the nearest neighbor procedure.
To select the appropriate number of clusters, the program
"Clustr" of the PIMS ' AQD statistical package (Schlaifer, 1978)
provides a "dendogram", which is a diagram describing the
contents of the clusters existing at each stage of the merging
process. The businesses in each cluster are listed in order of
decreasing density. The inspection of the plot, which gives
the number of clusters as a function of a density index, allows

-7-
us to empirically determine the level at which the clustering
should take place. The three different methods, in some cases,
lead to slightly different business clustering. However, the
natural groups which are identified are quite stable under the
three procedures.
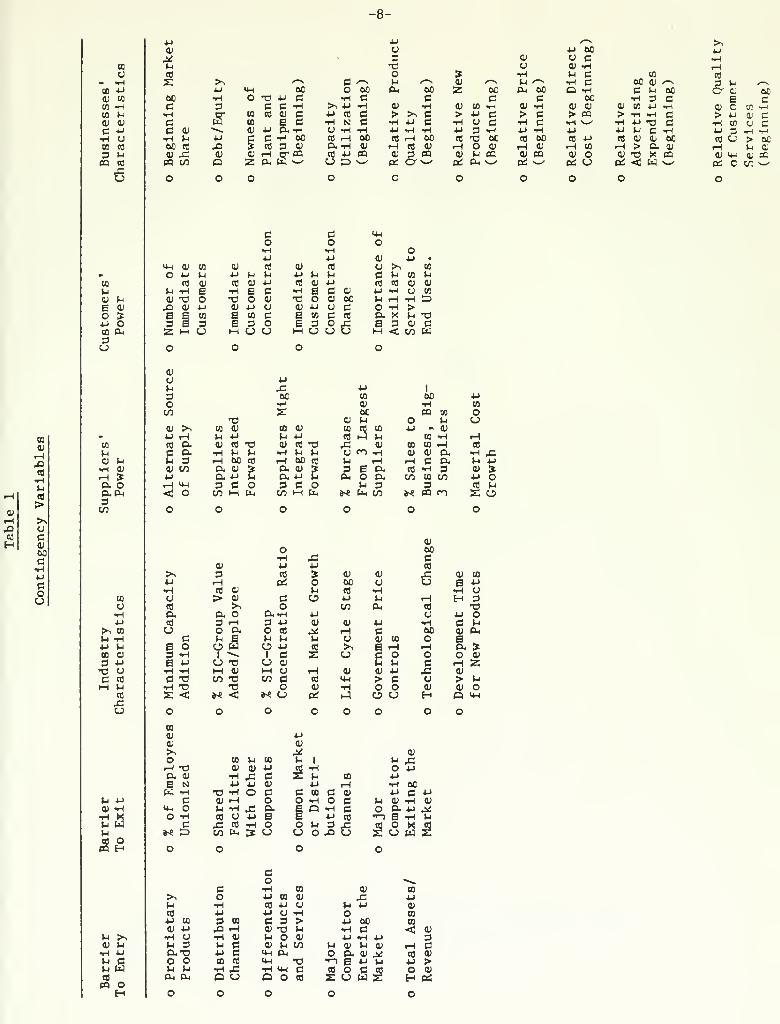
Forty-one contingency variables are used for the
clustering. These variables deal with environmental and
business-related factors. These variables fall into four main
groups:
1) Entry and exit barriers;
2) Industry characteristics;
3) Suppliers' and customers' bargaining power;
A) Business competitive strength.
Table 1 gives a summary of the main contingency
variables. 32 clusters of homogeneous businesses in term of
environment and business-related characteristics are obtained.
o The Turnaround Candidates
Two main criteria are used to identify the "turnaround
candidates":
1) low profitability;
2) declining market share.
The criteria of profitability has been used by Hambrick
and Schecter (1983). A criteria of growth has been used by
Schendel, Patton and Riggs (1976). In the present research, a
business is considered to be a turnaround candidate if 1) the

-8-


-9-
ROI, for the first two years under study, is below 50% the
group's average ROI; and 2) if the real sales growth, for the
first two years under study, is lower than the real market
growth, meaning that the business is losing market share
(Table 2).
Table 2
Turnaround Candidates Sample
Business' ROI <y50% Sample's ROI
Business' ROI 450% Sample's ROI
Real Sales Growth^Real Market Growth
Real Sales Growth^Real Market Growth
Turnaround Candidates
Because of this very stringent, but necessary, definition of
turnaround candidates, many of the clusters which were previously
identified had to be eliminated due to lack of sufficient
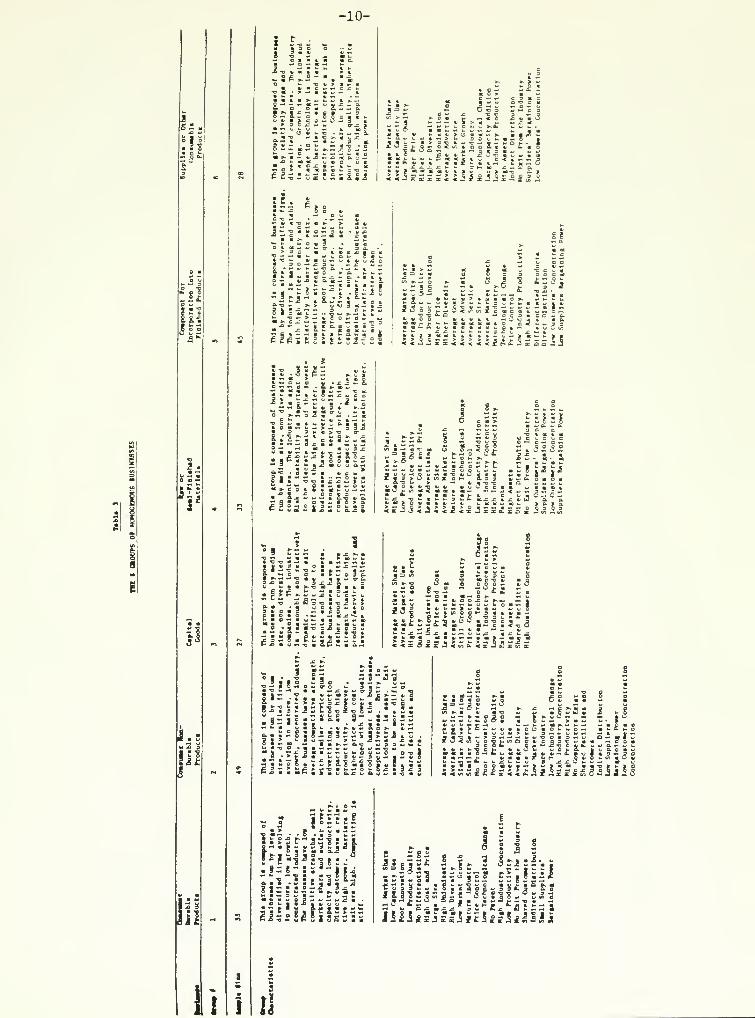
observations. Six groups of homogenous turnaround candidates are
kept for statistical treatment. The composition and the
characteristics of the groups are shown in Table 3.
1-26 small clusters with less than 22 observations have been elimi-nated after the turnaround candidates selection.

2X
.1m p3'
sU
.'Ii .c .- •.
5"
i.' X 3
ill
Si:
s
-10-
m a a o •• u


-11-
2) The Variables
o Dependent Variables
Three dependent variables measuring performance have been
selected. These three variables have been selected because:
1) they appear frequently in the literature as measures of
performance (Bass, 1969; Buzzell and Wiersema, 1981; Montgomery
and Silk, 1972; Hofer, 1980); 2) they are fairly well
approximated by a normal distribution in the sample of
businesses which are analyzed.
One dependent variable measures the firm's performance in
its market. Two others measure profitability.
The dependent variables are
:
- % change market share: P..
- ROI point change (corrected for inflation): P21
- Cash-Flow/Revenue: P22
Correlations between P. (market share), P~, (ROI) and
P22
(Cash Flow) are given in Table 4.
Table 4
Correlation Matrix of the Dependent Variables


-12-
The choice of either a market or a profitability criteria
as the business objective may be determined by the orientation
of the firm. On one hand, building up market share is usually
motivated by a long term strategic orientation. On the other
hand, increasing cash flow or aiming at a high ROI is motivated
by a short term financial objective. The use of these
dependent variables provides insight into which strategic
actions should be implemented depending on the decision horizon
selected.
o Independent Variables
2Twelve independent variables are selected over 51
variables representing different strategic actions. These
variables are chosen for the following reasons: 1) they
represent the different strategic turnaround actions which are
usually recommended in the management literature and by
practitioners (organizational decentralization, reorientation
of the marketing effort, product differentation, asset
divestiture, efficiency improvement and vertical integration)
and; 2) because of their low correlation with one another, and
their strong correlation with other variables having the same
conceptual meaning (Table 5).
^Some variables are expressed in absolute values (S]_, S2, S7,
sll» Si2)« Some correspond to changes defined as the difference
of the absolute values between periods t and t-1 (S3, S5, S^) .
Finally, % change is defined as 100 [S t - St-i/S,--!] (S4,
S8» S9, S^p.


-13-
CMtHco
•HtHCO
o>oo
oiHCO
sr
o esto
mCD
H.£>
(0H
en
a
(8H
c
ca;c
c
0)
4-1
O
KH4-1
§4-1
«.H01
I-
1-
ou
ONco
00CO
en
co
co
co
vO

-14-
The twelve independent variables are:
o Organizational Decentralization:
- % purchased from company (S^)
- % sold to company (S2)
o Reorientation of the Marketing Effort:
- % new product (Sj
- % change marketing expenses /revenue (S^)
o Product Market Differentiation:
- relative product quality (S^)
- relative price (S,)
- relative immediate customer concentration (S^)
o Assets Divestiture:
- % change total assets /revenue (Sg)
o Efficiency Improvement:
- % change employee productivity (Sg)
- % change capacity utilization (S,q)
o Vertical Integration:
- backwards integration (S,,)
- forwards integration (S-j^)
3) The Testing Procedures
To evaluate the relationships between the different
strategic actions and the variables representing the business'
performance —market share change, ROI and cash flow— a cross

-15-
sectional regression analysis is performed for each of the
groups. Linear additive models are used for the six groups.
Although theoretically, percent change in market share should
exhibit nonlinear behavior, it is difficult to propose an a
priori function to describe the market share change. To address
this problem, the pre-existing market share is controlled. In
fact, this variable is used as one of the criteria for the
clustering of the businesses into the six homogenous groups.
Futhermore, such models are often used in research (Bass,
Cattin and Wittink, 1977; Buzzell and Wiersema, 1981; Farris
and Reibstein, 1979; Hambrick, 1983a; Hambrick and Schecter,
1983; McMillan, Hambrick and Day, 1982; Schendel and Patton,
1978) to determine the influence of strategic actions on
3performance criterion such as market share, cash flow or ROI .
The equation pramaters are estimated and found to be significant
at .001, .01, .05 and .10 levels of significance.
JTwo variables S4 (% change marketing expenses/revenue) and S^q(% change capacity utlization) exhibit collinearlty. However, thesevariables bear different concepts. The two variables are kept inthe model. Their elimination would not make sense from a conceptualpoint of view. Tests for model mispecification are run on theresiduals. No evidence of mispecification is found.


-16-
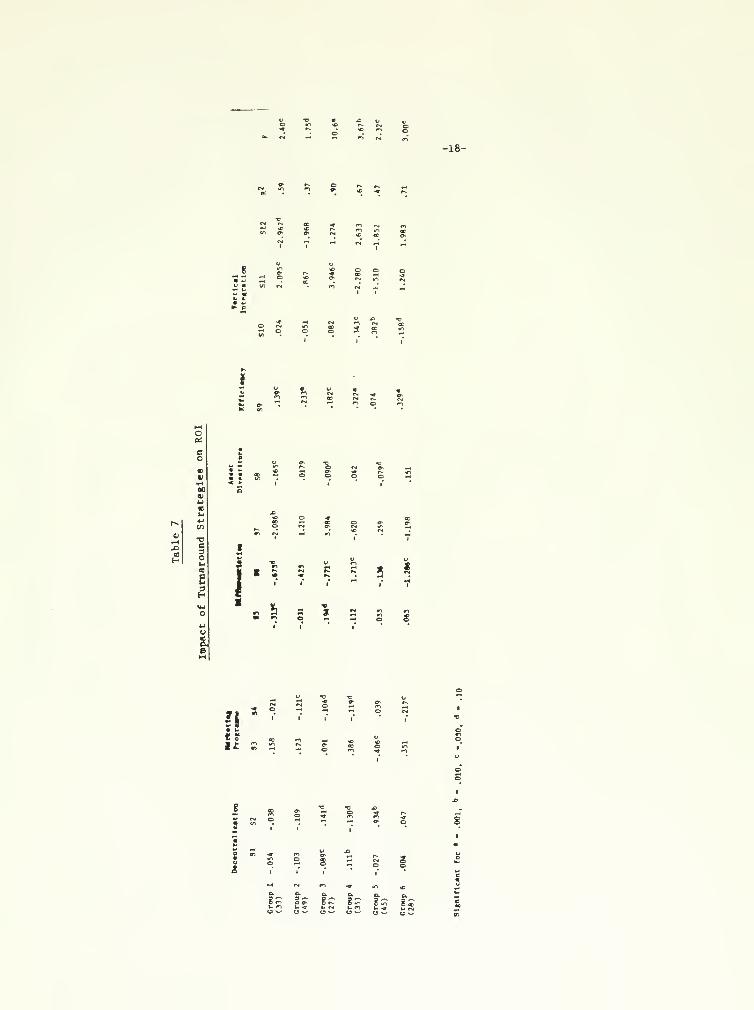
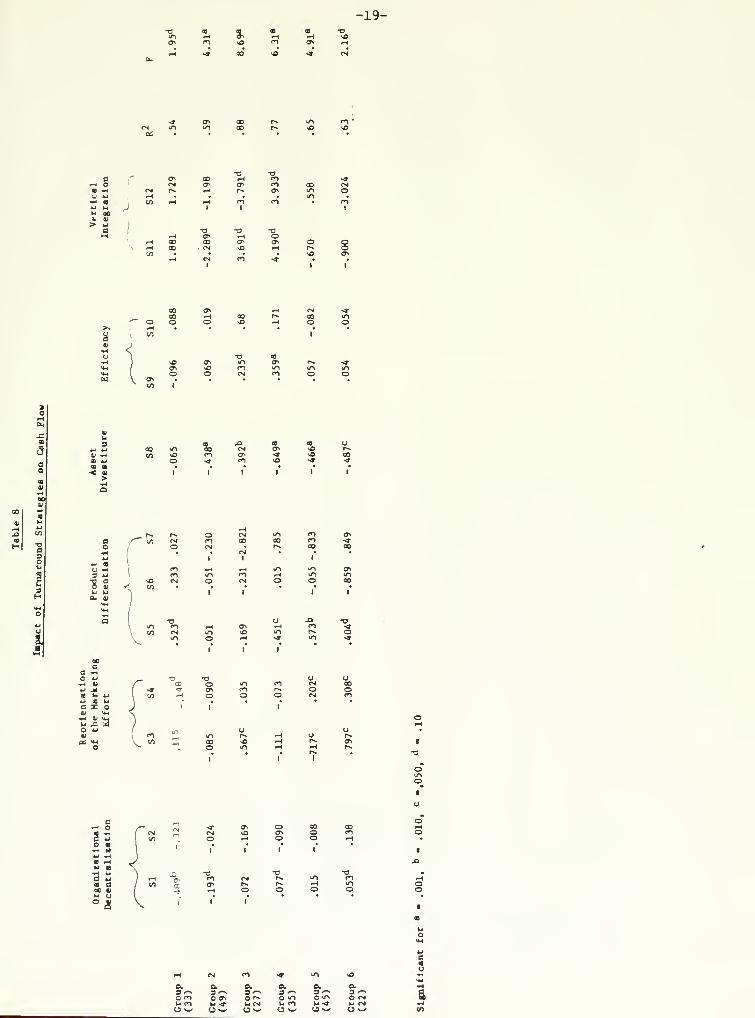
Results
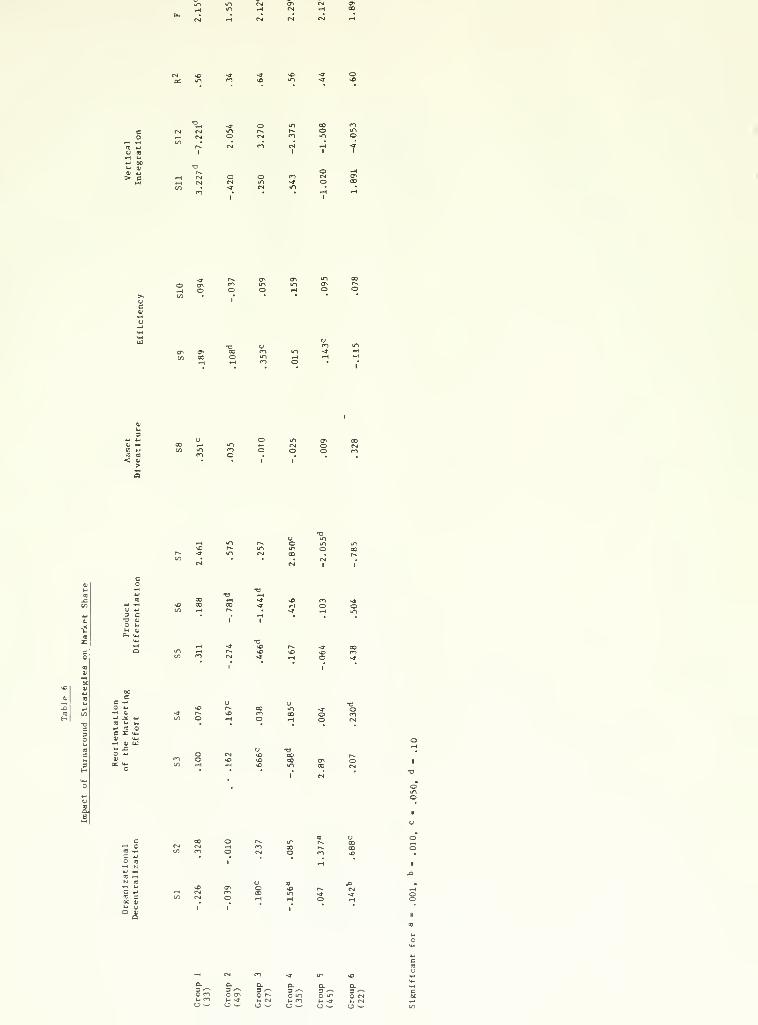
The first remark we can make concerning the results (Tables 6,
7, and 8) is that the strategic actions which are implemented depend
on the goal the firm pursues. On one hand, market share is
substantially improved after marketing changes or product
redefinitions are made. On the other hand, profitability, which is
measured in terms of ROI and Cash Flow, greatly increases when some
efficiency and asset reduction moves are undertaken. This self
evident observation is valid for the six different groups, regardless
of their specific competitive conditions.
A second remark concerns the existence of some potential
conflicts between actions aimed at growth objectives (market share)
and profitability goals (ROI or Cash Flow). For example, Group 2
achieves a successful turnaround in terms of market share when a
marketing effort, among other actions, is made. However, this same
group has to cut marketing expenses to improve its profitability in
terms of Cash Flow and ROI. This observation leads us to the
conclusion that unless a well conceived turnaround plan is devised,
some actions could be detrimental to the simultaneous achievement of
both goals.
The third remark deals with the diversity of actions which seem
to be effective in improving either market share or profitability.
For instance, for increasing market share, efforts to improve product
quality are, in some cases, quite effective (Group 3). In other
cases, price cuts (Group 2 and 3) and marketing efforts (Group 4 and
6) are more appropriate. In the same vein, ROI is influenced

I- £O «
3 <-v

-18-
c
0/
6
• -a
c3O
E
5 I"'
s
?lisIt s
jM!
t
t
i
s
o <n o^ Bn S£ 8 C^ §qOw (J — W^ O^ Ow od

-19-
a-I o
COCOo
o->o
a
3 V --
a a< v
1a
5
I
CM

-20-
by a price cut aimed at generating revenue (Group 1, 3 and 6). In
some other instances (Group 4) a price increase, seems to be more
effective in improving ROI. As far as Cash Flow is concerned, the
same observation can be made. For example, a cut in marketing
expenses is the best action to implement for some of the businesses
(Group 1 and 2), while a marketing effort is preferable for some
others (Group 5 and 6). This great diversity of appropriate
turnaround strategies can be attributed to the nature of the
business, i.e. its characteristics and the conditions of its
competitive environment.
To emphasize this last point, an analysis of the different
groups' competitive conditions and their related successful turnaround
actions is helpful. Group 1, for instance, is composed of businesses
with small market shares in highly competitive environments and has
few alternatives for improving its market share. Neither marketing
nor easy product-related Improvements seem to be effective in a
situation where quality is low, innovation is slow, and goods are
standardized. The only actions which have a positive impact involve
reorganization of the way products are manufactured and marketed.
Capital investment in new equipment, substantial changes in product
quality and their cost structure seem to be a first step towards an
effective turnaround. Also, backward integration, aimed at gaining
control over raw materials and other basic input supplies, is an
effective means of influencing product quality and cost. Finally, a
forward disengagement may facilitate market penetration by improving
relationships with dealers.
With regard to ROI, some actions similar to the market share
oriented strategies are found. In fact, backward integration aimed


-21-
at better control of raw materials costs and supplies is quite
effective. Similarly, a forward disengagement coupled with an active
selection of the distributorship may also be effective. This action
is aimed at increasing revenues by buying the good will of an
indirect distribution system and at improving earnings through better
and more compact dealers. Actions aimed directly at earnings include
productivity enhancement and quality cuts. These different moves are
typical of a cost leadership strategy. Price cutting is fully
consistent with this strategy. Finally, asset reduction, which has a
direct influence on ROI, also helps in decreasing production
over-capacity.
Actions influencing cash flow are different from those
influencing ROI. Though, both sets of actions may be directed at
decreasing cost or increasing revenue. A differentiation strategy
based on product quality improvement seems to be effective. It
allows the firm to charge a price premium and consequently to
increase revenue. Also, actions aimed at lowering cost such as cuts
in marketing expenses or increased freedom from the parent company
for purchasing basic components and supplies enhance the
competitiveness of the business.
Group 2 embodies a different set of underlying conditions. It
is composed of lagging businesses evolving in maturing industries.
In this situation, improvements can be achieved through a more
straightforward set of actions than is the case for the weak
businesses of the first group. For instance, market share is
enhanced by following a marketing effort coupled with an aggressive
pricing strategy and higher labor productivity. This aggressive

-22-
pricing strategy works because the group sells non differentiated
consumer non durable products for which the product quality dimension
is not of prime importance if it is compensated by attractive
prices. Profitability, in terms of ROI or Cash Flow, is improved by
a cut in marketing expenses. This action seems to be the most
effective in permitting these price sensitive consumer businesses to
improve earnings. However, it is in conflict with the achievement of
higher market share.
Other actions may also prove to be quite effective. On one
hand, productivity enhancement has a direct positive effect on ROI by
improving profitability. On the other hand, due to the low bargaining
power of the suppliers of this group of businesses it seems
appropriate to eliminate backward integration into activities not
directly related to the business core. This action enables
management to concentrate more on what the firm is good at and on its
profit making sector. It also allows a better and richer selection
of suppliers to the extent It is not forced to rely on a single
source. In the same vein, a greater decentralization of the
businesses' decision making with regard to its supplies is the basis
for a better control of the material costs and, consequently, of
earnings. Finally, assets reduction involving non fully utilized
capacity leads to a leaner and more productive organization.
The third group, which is composed of potentially competitive
businesses in a relatively dynamic and protected environment, tends
to improve its market share by reinforcing its strength and decreasing
its weaknesses. On one hand, it improves even more its product
quality (quality is already one of the groups' s major strengths).

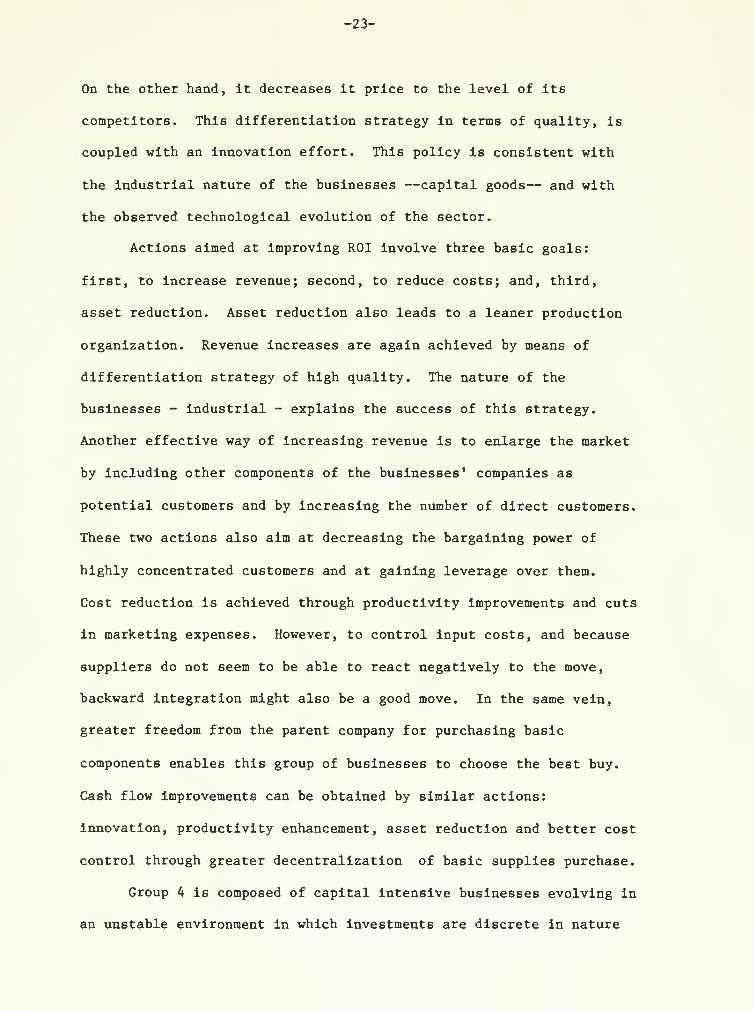
-23-
On the other hand, it decreases it price to the level of its
competitors. This differentiation strategy in terms of quality, is
coupled with an innovation effort. This policy is consistent with
the industrial nature of the businesses —capital goods— and with
the observed technological evolution of the sector.
Actions aimed at improving ROI involve three basic goals:
first, to increase revenue; second, to reduce costs; and, third,
asset reduction. Asset reduction also leads to a leaner production
organization. Revenue increases are again achieved by means of
differentiation strategy of high quality. The nature of the
businesses - industrial - explains the success of this strategy.
Another effective way of increasing revenue is to enlarge the market
by including other components of the businesses' companies as
potential customers and by increasing the number of direct customers.
These two actions also aim at decreasing the bargaining power of
highly concentrated customers and at gaining leverage over them.
Cost reduction is achieved through productivity improvements and cuts
in marketing expenses. However, to control input costs, and because
suppliers do not seem to be able to react negatively to the move,
backward integration might also be a good move. In the same vein,
greater freedom from the parent company for purchasing basic
components enables this group of businesses to choose the best buy.
Cash flow improvements can be obtained by similar actions:
innovation, productivity enhancement, asset reduction and better cost
control through greater decentralization of basic supplies purchase.
Group 4 is composed of capital intensive businesses evolving in
an unstable environment in which investments are discrete in nature

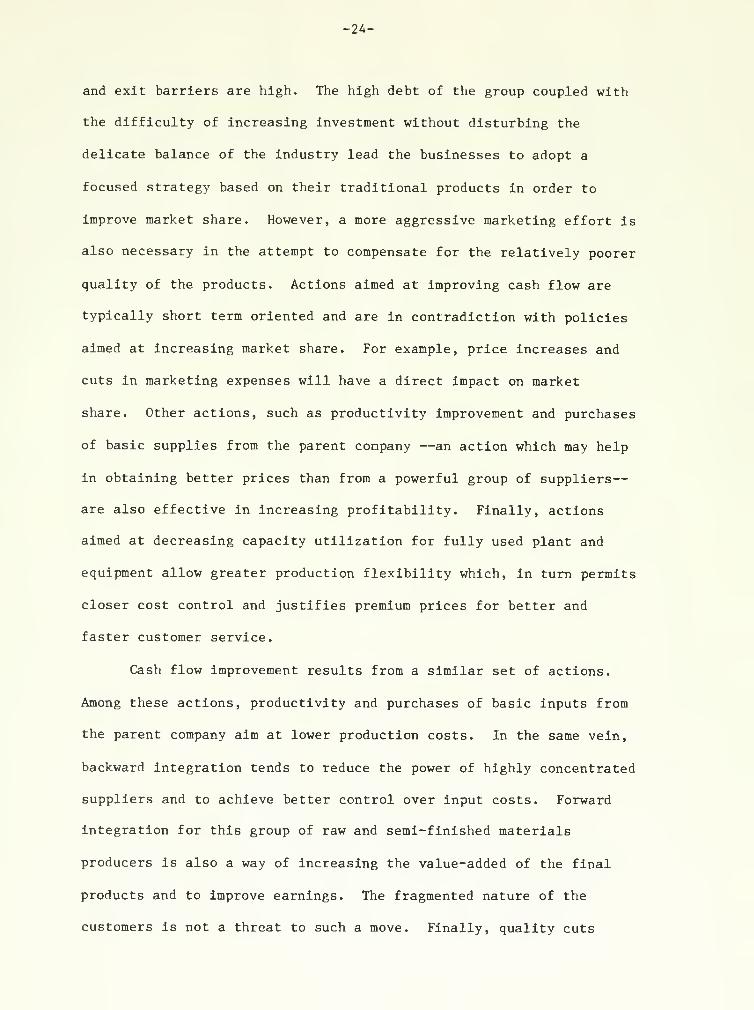
-24-
and exit barriers are high. The high debt of the group coupled with
the difficulty of increasing investment without disturbing the
delicate balance of the industry lead the businesses to adopt a
focused strategy based on their traditional products in order to
improve market share. However, a more aggressive marketing effort is
also necessary in the attempt to compensate for the relatively poorer
quality of the products. Actions aimed at improving cash flow are
typically short term oriented and are in contradiction with policies
aimed at increasing market share. For example, price increases and
cuts in marketing expenses will have a direct impact on market
share. Other actions, such as productivity improvement and purchases
of basic supplies from the parent company —an action which may help
in obtaining better prices than from a powerful group of suppliers
—
are also effective in increasing profitability. Finally, actions
aimed at decreasing capacity utilization for fully used plant and
equipment allow greater production flexibility which, in turn permits
closer cost control and justifies premium prices for better and
faster customer service.
Cash flow improvement results from a similar set of actions.
Among these actions, productivity and purchases of basic inputs from
the parent company aim at lower production costs. In the same vein,
backward integration tends to reduce the power of highly concentrated
suppliers and to achieve better control over input costs. Forward
integration for this group of raw and semi-finished materials
producers is also a way of increasing the value-added of the final
products and to improve earnings. The fragmented nature of the
customers is not a threat to such a move. Finally, quality cuts

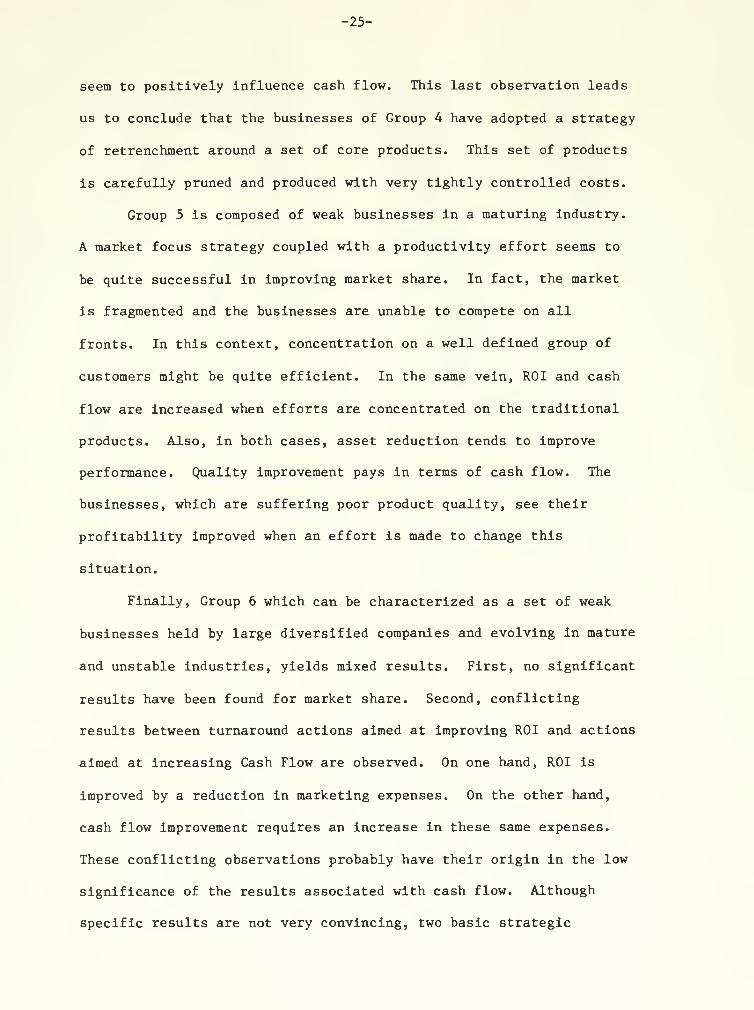
-25-
seem to positively influence cash flow. This last observation leads
us to conclude that the businesses of Group 4 have adopted a strategy
of retrenchment around a set of core products. This set of products
is carefully pruned and produced with very tightly controlled costs.
Group 5 is composed of weak businesses in a maturing industry.
A market focus strategy coupled with a productivity effort seems to
be quite successful in improving market share. In fact, the market
is fragmented and the businesses are unable to compete on all
fronts. In this context, concentration on a well defined group of
customers might be quite efficient. In the same vein, ROI and cash
flow are increased when efforts are concentrated on the traditional
products. Also, in both cases, asset reduction tends to improve
performance. Quality improvement pays in terms of cash flow. The
businesses, which are suffering poor product quality, see their
profitability improved when an effort is made to change this
situation.
Finally, Group 6 which can be characterized as a set of weak
businesses held by large diversified companies and evolving in mature
and unstable industries, yields mixed results. First, no significant
results have been found for market share. Second, conflicting
results between turnaround actions aimed at improving ROI and actions
aimed at increasing Cash Flow are observed. On one hand, ROI is
improved by a reduction in marketing expenses. On the other hand,
cash flow improvement requires an increase in these same expenses.
These conflicting observations probably have their origin in the low
significance of the results associated with cash flow. Although
specific results are not very convincing, two basic strategic


-26-
alternatives appear to be viable. The first one is a strategy of
retrenchement as illustrated by the actions related with ROI. The
second one is a strategy of differentiation as illustrated by the
actions associated with cash flow. These two strategies are quite
consistent with the relative strengths of the businesses and with
this group's industrial environment characterized by low growth, low
technological change, capital intensive and mature industry.
A last remark concerning the results of this study should be
made. It has to do with the existence of definite patterns of turn-
around actions. These actions seem to be associated with the relative
strengths of the businesses and with the nature of their competitive
environment. More pro-active type of strategies such as differentia-
tion based on innovation effort and quality increase are more likely
to be associated with relatively strong and competitive businesses
evolving in a dynamic environment (Group 3). More defensive types of
strategies, such as retrenchement based on product and market consoli-
dation and cost leadership, are more likely to be found with weak
businesses evolving in quite difficult environments (Group 1 and 4).
Finally, businesses having a mixed position in terms of strengths and
environment seem to be better off by adopting a more focused type of
strategy (Group 5).
Another observation is that the mix of strategic actions is
generally complex. For instance, a differentiation or a focused
strategy is often coupled with a cost and asset reduction effort to
turnaround a poor performance situation. Likewise, specific actions
are implemented depending on the nature of the competition and the
characteristics of the business. For example, the existence of a


-27-
fragmented market facilitates the implementation of a forward
integration strategy which would be risky to undertake if the
customers were concentrated and powerful.
Table 9 gives a summary of the study results and illustrates
the diversity of turnaround actions as the function of the nature of
the business.

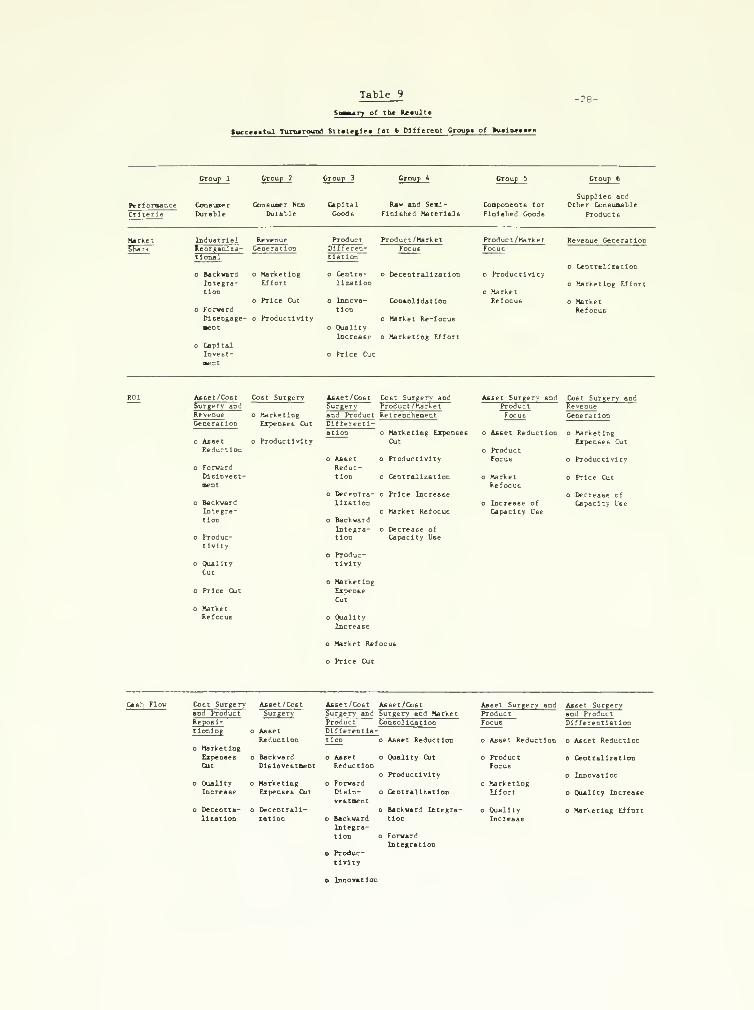
Table 9
of the Results
tuctmtul Turnaround Str«tcglt» for 6 Different Group! of Kulmuti
-28-


-29-
Conclusion
In this study, a cross sectional regression analysis of six
different types of businesses —consumer durable, consumer
non-durable, capital goods, raw and semi-finished materials,
components and supplies— is performed. An analysis of the relation-
ships between turnaround strategic actions —organizational
decentralization, reorientation of the marketing effort, product
differentiation, asset divestiture, efficiency improvement, vertical
integration— and performance variables —market share, ROI and cash
flow— is made. The analysis is performed over different businesses
clustered within homogenous groups as a function of their competitive
characteristics - entry and exit barriers, industry specifics,
suppliers' and customers' bargaining power, and the businesses'
competitive strengths.
This research is different from earlier studies for the
following reasons:
- it takes into account different objectives in evaluating the
effectiveness of a strategic turnaround;
- it deals with a greater number of diverse businesses and
competitive situations;
- it adopts a contingent perspective by relating the strategic
actions to the nature of the business and the
characteristics of its competitive environment.
The findings are the following:
1.) strategic turnaround actions depend on the objectives
pursued by the business: growth vs. profitability;

-30-
2.) some typical turnaround actions are effective regardless
of the nature of the business and its competitive
environment;
3.) strategic turnaround actions differ depending on the
business and the characteristics of the sector in which it
is competing;
4.) definite patterns of strategic turnaround exist. They are
dependent on the relative strength of the business and the
competitive conditions.
5.) selection of complementary actions is essential to
successful turnarounds. The joint impacts of several
strategies seem to be the most effective.
The results also show that the two goals of high market share
and of cash flow improvement require different types of strategies.
The first ones aim at increasing sales and revenues. The others are
directed at improving earnings. Although, actions differ as a
function of objectives, some common strategies across groups of
businesses can be identified. For instance, higher market shares are
generally associated with some market-oriented strategies such as
marketing effort. Higher profitability is easily achieved through
productivity and cost cutting types of actions. The effectiveness of
these strategies depends on diverse competitive conditions and on
business characteristics. For example, capital goods businesses with
a favorable competitive position and evolving in a dynamic
environment tend to rely on turnaround actions based on some kind of
differentiation. Low share and weak consumer durable businesses

-31-
evolving in a difficult environment tend to concentrate their efforts
and to prune their activities. Finally, no single action is
sufficient to achieve a successful turnaround. For example, asset
and cost reduction is paired with innovation and quality improvement
efforts to achieve high profitability in the case of the capital
goods group of business.
The results of this research underscore the fact that no unique
turnaround strategy exists. Thus, they reinforce previous findings
in the field. They also provide guidelines for decision makers to
the extent they can identify the competitive conditions of the
businesses they are in and decide from the appropriate strategic
actions to implement. They also emphasize the existence of a
tradeoff between objectives to be pursued —growth vs.
profitability— and the potential conflicts which may arise between
strategies to achieve these objectives. By analyzing the
characteristics of the business and its environment and by taking
account the objectives, the decision maker can choose the right
actions to implement and achieve an effective turnaround.
This research has several limitations. First, the analysis has
been made on cross sectional data. Consequently, it does not take
into account the time lag we might expect between strategic action
implementation and the observation of results. However, the results
of the research should fairly represent general tendencies which
reflect the dynamics of the relationship. Second, the time span
—five years— might be too short to observe a turnaround. This time
horizon, however, has already been used in previous studies.
Furthermore, the only potential problem that could arise from the

-32-
five year time span is that some businesses may not have entirely
completed their turnaround. But, as long as the general tendencies
are not altered, results should not be affected. Third, a more
precise investigation of the relationship between types of strategic
actions and the nature of the competitive characteristics of the
businesses should be made. In the present research, broad directions
have been identified. However, greater refinement is needed to make
the results operational.
This research complements and enlarges previous findings on
turnaround strategies. Thanks to its comprehensive approach to
turnaround situations this study has revealed the existence of
definite patterns of strategic actions. Some directions for new
research are indicated. In particular, greater precision concerning
the influence of the business' characteristics upon turnaround
actions should be the focus of future work. This would enhance the
value of the results in aiding poorly performing firms to select the
most appropriate turnaround strategy.


-33-
Bibliography
Anderson, C. R. and F. T. Paine, "PIMS: A Re-Examination," Academy ofManagement Review 1978, Vol. 3, pp. 602-612.
Andrews, D. R. , The Concept of Corporate Strategy , Homewood, 111.
:
Dow Jones-Irwin, 1971.
Bain, J. S., Barriers to New Competition , Cambridge, Mass: HarvardUniversity Press, 1956.
Bass, F. M. , Cattin, P. J. and D. R. Wittink, "Market Structure andIndustry Influence on Profitability," in Thorelli, H. G.
,
(ed.), Strategy + Structure = Performance . Bloomington, Ind.
:
Indiana University Press, 1977.
Bibeault, P. G., Corporate Turnaround: How Managers Turn Losers Into
Winners , New York: McGraw Hill, 1982.
Buzzell, R. D. and F. D. Wiersema, "Successful Share-BuildingStrategy," Harvard Business Review , January-February 1981, pp.135-144.
Caves, R. E. and M. E. Porter, "Barriers to Exit," in Quails, D. P.
and R. T. Massow (eds.) Essays in Industrial Organization in
Honor of J. S. Bain , Cambridge, Mass: Ballinger, 1976.
Farris, D. W. and D. J. Reibstein, "How Prices, Ad Expenditures and
Profits are Linked," Harvard Business Review , November-December1979, pp. 173-184.
Gitman, I. and M. D. Levine, "An Algorithm for Detecting UnimodalFuzzy Sets and Its Application as a Clustering Technique," IEEETransactions on Computers 1970, C-19, pp. 583-593.
Hambrick, D. C. , "Some Tests of the Effectiveness and FunctionalAttributes of Miles and Snow's Strategic Types," Academy of
Management Journal 1983a, Vol. 26, pp. 5-26.
Hambrick, D. C, "An Empirical Typology of Mature Industrial Product
Environments," Academy of Management Journal 1983b, Vol. 26,
pp. 213-230.
Hambrick, D. C. and S. M. Schecter, "Turnaround Strategies for MatureIndustrial-Product Business Units," Academy of ManagementJournal , 1983, Vol. 26, pp. 231-248.
Harrigan, K. R. , Strategies for Declining Businesses , Lexington,Mass: Heath, 198U.
Hofer, C. W. , "Toward a Contingency Theory of Business Strategy,"Academy of Management Journal, 1975, Vol. 18, pp. 784-810.

-34-
Hofer, C. W. , "Turnaround Strategies," Journal of Business Strategy
1980, Vol. 1, pp. 19-31.
Iacocca, L. A., "The Rescue and Resuscitation of Chrysler," Journalof Business Strategy , 1983, Vol. 14, pp. 67-69.
Kanter, R. M. , The Change Masters; Innovations for Productivity in
the American Corporation , New York: Simon and Schuster, 1983.
Khandwalla, R. N., "Turnaround Management of Mismanaged ComplexOrganizations," International Studies of Management andOrganization , 1984, Vol. XIII, pp. 5-41.
McMillan, I. C, D. C. Hambrick and D. L. Day, "The Product Portfolioand Profitability —A PIMS Based Analysis of Industrial
—
Product Businesses," Academy of Management Journal , 1982, Vol.
25, pp. 733-755.
Miles, R. E. and C. C. Snow, Organizational Strategy, Structure and
Processes , New York: McGraw-Hill, 1978.
Miller, D. and P. H. Friesen, "Strategy-Making in Context: TenEmpirical Archetypes," Journal of Management Studies , 1977,Vol. 14, pp. 253-280.
Norburn, D. and P. Miller, "Strategy and Executive Reward: The MisMatch in the Strategic Process," Journal of General Management ,
1981, Vol. 6, pp. 17-27.
Porter, M. E. , Competitive Strategy: Techniques for AnalyzingIndustries and Competitors , New York: Free Press, 1980.
Schendel, D. and G. R. Patton, "Corporate Stagnation andTurnaround," Journal of Economics and Business , 1976, Vol. 28,
pp. 236-241.
Schendel, D. G., G. R. Patton and J. Riggs, "Corporate TurnaroundStrategies: A Study of Profit Decline and Recovery," Journalof General Management , 1976, Vol. 3, pp. 3-11.
Schendel, D. G., and G. R. Patton, "A Simultaneous EquationModel of Corporate Strategy," Management Science , 1978, Vol.
24, pp. 1611-1621.
Scherer, F. M. , Industrial Market Structure and Economic Performance ,
Chicago: Rand McNally, 1980.
Schlaifer, R. , User's Guide to the AQD Collection , Cambridge, Mass:Harvard Business School, 1978.
Schoeffler, S., "Cross-Sectional Study of Strategy, Structure andPerformance" in Thorelli H. (ed.), Strategy + Structure =
Performance, Bloomington, Ind. : Indiana University Press, 1977.

-35-
Starbuck, W. H., A. Greve and B. L. T. Heldberg, "Responding to
Crises: Theory and the Experience of European Business," inSmart C. F., and W. T. Stanbury (eds.), Studies on CrisesManagement , Toronto: Butterworth, 1978.
Stonich, P. J., "Using Rewards in Implementing Strategy," StrategicManagement Journal , 1981, Vol. 2, pp. 245-252.
Theil, H., Linear Aggregation of Economic Relations , Amsterdam:North Holland, 1965.
Thietart, R. A. and R. Vivas, "An Empirical Investigation of SuccessStrategies for Businesses Along the Product Life Cycle,"Management Science , 1984 (forthcoming).
Uyterhoeven, H. E. R. R. W. Ackerman and J. W. Rosenblum, Strategyand Organization: Text and Case in General Management ,
Homewood, 111.: Irwin, 1973.
Wishart, D. in A. J. Cole (ed.) Numerical Taxonomy , New York, NewYork: Academic Press, 1969.

790 b> i

Ml! LIBRARltS
3 TOAD DDM 461 T4fl


Lib-26-67

0* f^

Recommended