NBER WORKING PAPER SERIES
TRADE AND THE GREENHOUSE GAS EMISSIONS FROM INTERNATIONALFREIGHT TRANSPORT
Anca D. CristeaDavid HummelsLaura Puzzello
Misak G. Avetisyan
Working Paper 17117http://www.nber.org/papers/w17117
NATIONAL BUREAU OF ECONOMIC RESEARCH1050 Massachusetts Avenue
Cambridge, MA 02138June 2011
We thank the OECD for funding, Ron Steenblik for suggesting and encouraging the work. We alsothank Bruce Blonigen, Tim Cason, Lata Gangadharan, Tom Hertel, Pete Minor, Paul Raschky, ChristisTombazos, Terrie Walmsley, and seminar participants at the ASSA meetings 2011, and the InternationalWorkshop on Current Issues in CGE Analysis for suggestions and help. The views expressed hereinare those of the authors and do not necessarily reflect the views of the National Bureau of EconomicResearch.
NBER working papers are circulated for discussion and comment purposes. They have not been peer-reviewed or been subject to the review by the NBER Board of Directors that accompanies officialNBER publications.
© 2011 by Anca D. Cristea, David Hummels, Laura Puzzello, and Misak G. Avetisyan. All rightsreserved. Short sections of text, not to exceed two paragraphs, may be quoted without explicit permissionprovided that full credit, including © notice, is given to the source.
Trade and the Greenhouse Gas Emissions from International Freight TransportAnca D. Cristea, David Hummels, Laura Puzzello, and Misak G. AvetisyanNBER Working Paper No. 17117June 2011JEL No. F17,F18,Q56
ABSTRACT
We collect extensive data on worldwide trade by transportation mode and use this to provide detailedcomparisons of the greenhouse gas emissions associated with output versus international transportationof traded goods. International transport is responsible for 33 percent of world-wide trade-related emissions,and over 75 percent of emissions for major manufacturing categories like machinery, electronics andtransport equipment. US exports intensively make use of air cargo; as a result two-thirds of its export-relatedemissions are due to international transport, and US exports by themselves generate a third of transportemissions worldwide. Inclusion of transport dramatically changes the ranking of countries by emissionintensity. US production emissions per dollar of exports are 16 percent below the world average, butonce we include transport US emissions per dollar exported are 59 percent above the world average.We use our data to systematically investigate whether trade inclusive of transport can lower emissions.In one-quarter of cases, the difference in output emissions is more than enough to compensate forthe emissions cost of transport. Finally, we examine how likely patterns of trade growth will affectmodal use and emissions. Full liberalization of tariffs and GDP growth concentrated in China andIndia lead to transport emissions growing much faster than the value of trade, due to trade shiftingtoward distant trading partners. Emissions growth from growing GDP dwarfs any growth from tariffliberalization.
Anca D. CristeaUniversity of [email protected]
David HummelsKrannert School of Management403 West State StreetPurdue UniversityWest Lafayette, IN 47907-1310and [email protected]
Laura PuzzelloMonash [email protected]
Misak G. AvetisyanPurdue University425 W State Str, KCTR 237West Lafayette, IN [email protected]
1
TradeandtheGreenhouseGasEmissionsfrom
InternationalFreightTransport
AncaCristea,UniversityofOregonDavidHummels,PurdueUniversityandNBER
LauraPuzzello,MonashUniversityMisakAvetisyan,UniversityofSouthernCalifornia
May2011
Abstract:Wecollectextensivedataonworldwidetradebytransportationmodeandusethistoprovidedetailedcomparisonsofthegreenhousegasemissionsassociatedwithoutputversusinternationaltransportationoftradedgoods.Internationaltransportisresponsiblefor33percentofworld‐widetrade‐relatedemissions,andover75percentofemissionsformajormanufacturingcategorieslikemachinery,electronicsandtransportequipment.USexportsintensivelymakeuseofaircargo;asaresulttwo‐thirdsofitsexport‐relatedemissionsareduetointernationaltransport,andUSexportsbythemselvesgenerateathirdoftransportemissionsworldwide.Inclusionoftransportdramaticallychangestherankingofcountriesbyemissionintensity.USproductionemissionsperdollarofexportsare16percentbelowtheworldaverage,butonceweincludetransportUSemissionsperdollarexportedare59percentabovetheworldaverage.Weuseourdatatosystematicallyinvestigatewhethertradeinclusiveoftransportcanloweremissions.Inone‐quarterofcases,thedifferenceinoutputemissionsismorethanenoughtocompensatefortheemissionscostoftransport.Finally,weexaminehowlikelypatternsoftradegrowthwillaffectmodaluseandemissions.FullliberalizationoftariffsandGDPgrowthconcentratedinChinaandIndialeadtotransportemissionsgrowingmuchfasterthanthevalueoftrade,duetotradeshiftingtowarddistanttradingpartners.EmissionsgrowthfromgrowingGDPdwarfsanygrowthfromtariffliberalization.
JELclassification:Q56;F18.Keywords:Greenhousegasemissions;internationaltransportemissions;worldtradegrowth;internationaltradebytransportmodeAcknowledgements:WethanktheOECDforfunding,RonSteenblikforsuggestingandencouragingthework.WealsothankBruceBlonigen,TimCason,LataGangadharan,TomHertel,PeteMinor,PaulRaschky,ChristisTombazos,TerrieWalmsley,andseminarparticipantsattheASSAmeetings2011,andtheInternationalWorkshoponCurrentIssuesinCGEAnalysisforsuggestionsandhelp.
E‐mailaddresses:[email protected](A.Cristea);[email protected](D.Hummels);[email protected](L.Puzzello);[email protected](M.Avetisyan).
I. Introduction
Internationaltradegeneratesgreenhousegas(GHG)emissionsfromtwosources:theproductionof
tradedgoods,andtheirtransportationbetweentradingpartners.Alargeliteraturehasfocusedon
2
theemissionsassociatedwithproduction,examiningquestionsrelatedtohowtrademayreallocate
productionbetweencountrieswithdifferingemissionintensities,orundermineeffortstocontrol
emissionsvia“carbonleakage”.1However,theemissionsassociatedwithinternational
transportationarelargelyoverlooked,bothinthetextofexistingagreementssuchastheKyoto
Protocolregulations,andindatacollectionefforts.2
EffortstomeasurethecontributionofinternationalfreighttransporttoGHGemissionshave
beenlimitedinscope.Thecasestudybasedlifecycleanalyses(LCA)literaturetypicallyfocuseson
aparticularproductandgeographicmarket,andassessestheenvironmentalimpactofeveryinput
intheproductionanddeliveryofthatproduct.Forexample,Simetal.(2007)estimatethatthe
globalwarmingimpactofKenyanandGuatemalanbeansshippedtotheUKare20‐26timeslarger
thanUKproduction.Incontrast,Williams(2007)findsthatcutrosesairdeliveredfromKenyato
theUKgenerateemissionsthataresignificantlylowerthanrosessourcedfromtheneighboring
Netherlands(Williams,2007).WhileLCAstudiesprovidedetailedcalculationsoftransport
emissionsforaparticularproductandtradeflow,theyarenotinformativefortheworldtrading
systemasawhole.3Moregenerally,welackdatasourcesthatattributeinternationaltransport
emissionstooriginanddestinationcountries.Asaconsequence,thereislittlesystematic
informationregardingthemagnitudeoftransportationemissionsrelativetoproduction,andhow
theyaredistributedacrosstradeflows.
1ExamplesincludeEderingtonandMinier(2003),Babiker(2005),Levinson(2009),LevinsonandTaylor(2008)amongothers.SeealsoCopelandandTaylor(2004)foracomprehensiveliteraturesurvey. 2vanVeen‐GrootandNijkamp(1999)arguethatthekeyresearchfocusinadvancingtheinvestigationontheenvironmentaleffectsofinternationaltradeshouldbeon“buildingupamonitoringsystemanddatabase”tofacilitate“measuringtheenvironmentaleffectsofinternationaltransport”.ForadiscussionofthechallengesinmeasurementandtheomissionofinternationaltransportfrompolicyprotocolsseeOlivierandPeters(1999),MiljøstyrelsenMiljøministeriet(2003)–theDanishEnvironmentalProtectionAgency,DanishMinistryfortheEnvironment,aswellastheTransportationResearchBoard,2009. 3 Afewrecentpapersemployinput‐outputtablestomeasureinternationaltradeemissions,andattempttoincorporateinternationaltransportemissionsintothecalculation(Gretheretal.,2010;PetersandHertwich,2008;Cadarsoetal.,2010).However,dataonthemodesoftransportbywhichgoodstravelisnotreadilyavailableataglobalscale,sothesepaperseitherrestricttheirattentiontoasingleimportingcountryortheybasetheircalculationsonentirelyimputeddata.
3
Howimportantareinternationaltransportemissionsrelativetoemissionsfromtheoutput
oftradedgoods?TheInternationalTransportForum(ITF2010)providesaggregatetransport
emissionsdataforinternationalaviationandmaritimetransportbycombiningdataonfuel
consumptionfromtheInternationalEnergyAgency(IEA2010),alongwithinformationonGHG
emissionsbyfueltype.Table1providestheITFestimatesalongwithadditionalcalculationsbythe
authors.From1990‐2004,internationaltransportemissionsroseslightlyfasterthantotal
emissionsoremissionsfromalltransport.Focusingon2004,internationalmaritimeplus
internationalaviationtransportationwasresponsibleforjust3.5percentoftotalemissions.This
seemssmall,buttotalemissionsincludemanyactivities(e.g.,residentialenergyusage,domestic
transportation),whicharenotdirectlyrelatedtotradeortheoutputoftradablegoods.TheIEA
estimatesthatindustrialproductionrepresentsonlyafifthofworldwideemissions,andmost
industrialoutputemissionsareunrelatedtotrade–e.g.,ifaquarterofsteeloutputistradedthen
threequartersoftheoutputemissionsfromsteelcorrespondtodomesticconsumption.This
suggeststhatinternationaltransportmeasuredasashareoftrade‐relatedemissions(whichwe
defineasemissionsgeneratedbytheproductionandtransportofexportedgoods)couldbe
substantial,butcarefulmeasurementisneeded.
BymeasuringactualfuelusetheITF“top‐down”approachisanaccuratewaytoassess
worldwideaviationandmaritimeemissionsinaparticularyear.However,theITFapproachhas
twokeydrawbacks.First,roadandrailtransportrepresentasignificantfractionofinternational
tradeforland‐adjacentpartnersbuttheiremissionsareomittedfromtheITFnumbersbecause
internationalanddomesticfuelusageisindistinguishable.Thisisespeciallyproblematicbecause
roadandrailtransportisarisingshareofworldtradeasregionaltradeliberalization,especiallyin
NorthAmericaandEurope,concentratedtradegrowthbetweenpartnercountriessharingland
borders.RoadandrailgrowthisomittedfromITFemissionnumbers,whichraisesthequestionof
whetherthesharpdeclineinemissionsperdollaroftradeshowninTable1isrealorspurious.
4
TheseconddrawbackisthatonecannotusetheaggregateITFnumberstoassesswhereorhow
maritimeoraviationfuelwasused.Evenifoneweretotrackfuelloadedtoindividualportsthis
wouldbeoflimiteduseasshipsandplanesrefuelinginaparticularportcouldbecarryingcargoof
anytypebetweenanycountrypairintheworld.Withoutknowingwherefuelisusedwecannot
evaluatethetotalemissionsassociatedwithaparticulartradeflow(i.e.,aspecificproducttraded
betweenacountrypair).Norcanweestimatewhetheremissionswillrisefasterorslowerthan
overalltradegrowth,orunderstandwhichtradeflowswouldbemostaffectedbyeffortstomitigate
emissions.
Complicatingmattersfurther,thecontributionoftransporttotrade‐relatedemissionscan
differdramaticallyacrosstradeflows.Standardanalysesinthetradeliteraturefocusontrade
value,whileignoringtheweightoftradeandhowgoodsmove.Butemissionsdependonthemode
employedandweight,notvalue,transported.Onemilliondollarsofcoalisvastlyheavierthana
milliondollarsofmicrochips,withcorrespondinglylargertransportemissions.Trucks,rail,
airplanesandshipshavesignificantlydifferentGHGemissionsandmodalusevarieswidelyacross
tradeflows.Onekilogramofcargoflownonekilometeronaplanegeneratesbetween50and200
timestheemissionsofthatsamekg‐kmonabulkcargocarrier.Theproductandpartner
compositionoftradehasafirst‐orderimpactonthetypesoftransportationemployed,andonthe
associatedGHGemissions.Asaconsequence,welearnlittlefromtheaggregateincidenceof
transportemissionsthatcanbedirectlyappliedtoparticulartradeflows.
Thepurposeofthispaperistoprovidetwoexercises,bothofwhicharenovelinthe
literature.Inthefirstwebuildanextensivedatabaseonoutputandtransportemissionsassociated
witheveryorigin‐destination‐producttradeflowworldwideinabaseyear2004.Weemploythis
databasetoquantifythecontributionofinternationaltransporttototalemissions,andtohighlight
systematicpatternsoftransportemissionintensitiesacrossproductsandtradepairs.Inthesecond
exercise,wecalculatetheemissionsgrowthduetoasimulatedchangeinglobaltradearisingfrom
5
tariffliberalizationandunevenlydistributedGDPgrowth.Inanalyzingthesimulatedchangesin
overallGHGemissions,wedistinguishbetweenscale(i.e.,changesinthederiveddemandfor
internationaltransportservices)andcompositioneffects(i.e.,changesintherelativeuseof
transportmodesofvaryingemissionintensities).4
Webeginbycombiningtradeandemissionsdatabymodeinordertoprovideafull
accountingoftheemissionsassociatedwithinternationaltransportationforeachindividualtrade
flow.This“bottom‐up”accountingofemissionsyieldsaggregateworldwideemissionsthatare
remarkablyclosetomatchingthe“top‐down”accountingprovidedbytheITF2010.UnliketheITF
aggregatedata,theseemissionsnumbersarespecifictoeachorigin‐product‐industrialsector.This
allowsustocalculatetheemissionsassociatedwithadollaroftradeanddecomposeitintoa
productionandatransportcomponent.
Wenextdescribetheimportanceoftransportrelativetoproductionemissionsforspecific
tradeflows,andshowwhichtradeflowsareespeciallyemissionsintensiveoncebothcomponents
aretakenintoaccount.World‐wide,33percentoftrade‐relatedemissionscomefrominternational
transport,thoughthisnumberisconsiderablyhigherinthemanufacturingsectors:80percentof
trade‐relatedemissionsinmachineryexportscomefrominternationaltransportation.Thereis
alsowidevariationacrosscountriesinthecontributionoftransporttotrade‐relatedemissions.At
thelowend,only14percentofIndianandChineseexportemissionscomefromtransport,while
transportisresponsiblefor66percentofUSexportemissionsduetosubstantialuseofaircargo.
Themagnitudeoftransport’scontributiontototalemissionssuggeststhatpoliciesdesignedto
mitigatecarbonoutputmusttakeinternationaltransportintoaccountandfurther,thatthedesign
ofsuchpoliciescouldhavepronounceddistributionaleffects.Forexample,theUSisresponsible
foronethirdoftransportemissionsbutonly12percentofoutputemissions.AndwhileUSimports
4Inoursimulationexercises,thetechniqueeffect(i.e.,changesintheemissionintensityoftransportservices)isheldconstantatthebaseyearlevel.Noticethatwhileseveralstudieshavedecomposedtheoverallchangeinproductionemissionsintoscale,compositionandtechniqueeffects(seeforexampleLevinson,2009;Gretheretal.,2010),ourfocusinthispaperisontrade‐relatedemissions.
6
andexportsareverysimilarintermsoftheemissionintensitiesofproduction,onceweinclude
transport,itsexportshavedoubletheemissionintensity.Whethertransportemissionsare
allocatedtotheexporterortheimporterthusbecomesasignificantissueforwelfareanalysis.
Risingtradeinducesemissionchangesbyboostingtransportemissions,andbyreallocating
productiontowardcountrieswithdifferentproductionemissionintensities.Bycharacterizingboth
productionandtransportemissionsfromtradeflowswecanaddresssystematicallythequestions
answeredpreviouslyusingcasestudies,namely,doesconsumingforeigngoodsraiseorlowerGHG
emissionsonceinternationaltransportisaccountedfor?Weexamineasetof“partialequilibrium”
reallocationsinwhichacountrylowersitsownproductionandinsteadbuysthegoodfromabroad.
Justoveraquarterofchangesinspecializationwouldleadtoareductioninemissions,withmuch
highernumbersinresource‐basedindustriesandinthedevelopingworld.5
Thesepartialequilibriumreallocationsaremeanttobeillustrative.Theydonot
contemplatewhetherthereallocationisfeasible,whatkindsofshockswouldinduceit,orwhat
possiblegeneralequilibriumeffectsmightexacerbateorattenuatethechange.Toconsiderthese
issueswenextsimulatethelevelandcompositionoftradegrowthinfourscenariosrelatedtotrade
liberalizationandafifthscenarioexaminingdifferentialchangesincountryGDPgrowthrates
throughtheyear2020.Tradeliberalizationandoutputgrowtharelikelytoleadnotonlytogrowth
inthequantityoftradebutalsotochangesinitsproductandcountry‐paircomposition.The
questionisthenwhethergrowthwilloccurinhighorlowemissionscategories,andwhether
transportemissionsarelikelytogrowmorerapidlythanoutputemissions.Combiningsimulated
outputandtradechangeswithouremissionsdatawecanthencalculatethepredictedgrowthin
emissionsfromtrade.
Ourfindingsareasfollows.TradeliberalizationscenarioscurrentlycontemplatedundertheDoha
WTOroundgenerateverysmallchangesinoutput,exports,andGHGemissions.Fullliberalization
5Theseemission‐reducingtradepairsarenon‐trivial,correspondingto31percentofglobaltradebyvalue.
7
resultsina6percentincreaseintrade,concentratedinthoseproductsthataresubjecttothe
highestratesofprotection.Moreimportantly,liberalizationeliminatestariffpreferencesenjoyed
primarilybynearbytradingpartners(e.g.,NAFTAandtheEU).Tradeshiftsawayfromproximate
partnersandtowarddistantpartnerswhocannotbereachedbylandtransport.Useofaircargo
rises,andwithit,GHGemissionrise23‐42percentfasterthantrade.
Incontrasttothemodesteffectsfromtariffliberalization,projectedoutputgrowth(a75percent
increaseingrossworldproductby2020)leadstoprofoundchangesintradeandemissions.
Exportsriseat3.8percentperyear,80percentcumulatively,whiletransportservices(kg‐km)rise
173percentcumulativelyastradeshiftstodistantbutrapidlygrowingChinaandIndia.Transport
emissionsgrowfasterthantradebyvalueandfasterthanoutputemissions,withespeciallyrapid
growthinmaritimeemissions.
Thepaperproceedsasfollows.SectionTwodescribesthemethodologyandSectionThree
describestheconstructionofthemaindatacomponentsforourexercises.SectionFourprovides
evidenceoncurrentcontributionofinternationaltransportationtoGHGemissionsfrom
internationaltrade.SectionFiveprovidessimulationsoftradegrowth,andcalculateshowthis
growthwouldaffectmodaluseandemissions.SectionSixconcludes.
II. Methodology:BaseYearEmissions
TheInternationalTransportForum(ITF2010)usesdataonfuelconsumptiontocalculate
emissionsassociatedwithinternationaltransport.Asdiscussedintheintroduction,this“top‐
down”approachprovidesaccuratemeasuresofworldwideemissions,buthasanumberof
significantdrawbacksbecauseitcannotassignemissionstoparticulartradeflows.Weusea
“bottom‐up”approachinwhichweconstructtheemissionsassociatedwithatradeflowby
calculatingthequantityoftransportationservicesforthatflowprovidedbyeachtransportation
mode,andmultiplyingbyemissionsperunitoftransportationservices.
8
Denote astheGHGemissions6associatedwithtransportinggoodgfromoriginoto
destinationd.VAListhevalueofthatflow,andWVistheweighttovalueratiosothat
isthequantityoftheflowinkilograms.Acountrypairmayshipproductgusingmultiple
transportationmodes.Thequantityshareofmodeminthatflowis ,so
givesthequantityoftheflowforeachmode,inkg.Multiplyingby thedistancetraveled
fromotodformodemgivesusameasureoftransportationservices,foreachmode,measuredina
commonunit(onekgofcargomovedonekilometer).Finally,multiplyingby ,theGHG
emissionsproducedbymodemwhenprovidingonekg‐kmoftransportationservices,and
summingoverallmodesyieldsthetotalemissionsassociatedwiththattradeflow.
(1)
Thisbottomupapproachhasafewlimitationsowingtodataavailability.Thisformulationimposes
aconstraintthatemissionsforagivenmodearecommontoallproductsandcountrypairsandare
linearinweightanddistance.Assuchitmaskstwopotentiallyimportantsourcesofheterogeneity.
One,sometradeflowsmayemployolder,smallershipsandplaneswithhigheremissionsperkg‐km
oftransportationservices.Wepartiallyadjustforthisprobleminthedatabyallowingformultiple
typesofoceanvesselsthatarespecifictocertaincargos,andbyexperimentingwithaviation
emissionsdatathatreflectthemostefficientplanesversusthoseinuseinexistingfleets.Two,
thereareemissionsassociatedwith“fixedcosts”oftransport,incurredindependentofdistance
traveled,includingporttimeforshipsandhigherlanding/takeoffemissionsforplanes.We
providecalculationstosuggestthattheseproblems,whilesignificantatveryshortdistances,
becomeinsignificantattheinternationaldistancesseeninthedata.
Anadditionallimitationrelatestoemissionsfromdomestictransportlinkedtotrade.All
productionrequiresdomestictransport,andwecapturethisinputanditsassociatedemissionsas
6“GHGemissions”refertobothCO2andnon‐CO2emissions,representedasCO2equivalents.
TodgE
*odg ogVAL WV
modgQS * * m
odg og odgVAL WV QS
modDIST
me
* * * *T m m modg odg og odg odm
E VAL WV QS DIST e
9
partofoutputemissions.Ifproductionforexternaltradeusesdomestictransporttothesame
extentasproductionfordomesticuse,thenwecapturedomestictransportemissionsaccurately.
However,insomeinstancesexternaltrademayrequiremovementofgoodsovergreatinternal
distances,whileinothers(productionnearborders,ornearairorseaports)externaltrademay
employverylittledomestictransport.Thismayresultinunder‐orover‐countingtrade‐related
emissions,butwehavenoclearindicationifthereisabiasorwhichwayitruns.Notethatthisis
fundamentallysimilartoanycaseinwhichaheterogeneousproductiontechnologyischaracterized
byanaggregatetechnology.
Startingfromequation(1),wecanprovideanumberofcomparisonsandcalculations.
Tradeflowsaremostcommonlyreportedinvalueterms.Pullingthevalueofthetradeflowoutof
thissummationwecandecomposethequantityoftransportationemissionsfromtheflowintoa
scalemeasureandanintensitymeasure
(2)
Usingthisbasicdecompositionwecancomparethetransportemissionsfromexportsacross
countries.Summingoverimportersandproducts,anexportero’semissionsare
(3)
where istheshareofdestinationd,goodgintotaltradefororigino.Transportemissions
dependonthescaleoftradeandthetransportemissionintensityofadollaroftrade.Thelatterisa
trade‐weightedaverageofemissionsfromindividualflows.Ifanexporterengagesintradewith
moredistantpartners,tradesheaviergoods,orusesaviationmorethanmaritimetransportitwill
haveahigheraggregatetransportemissionintensity.Wecanprovidesimilaraggregationsby
importers(aggregatingoverexportersandproducts)orbyproducts(aggregatingovercountry
pairs).
* * * *T T T m m modg odg odg odg og odg odm
E VAL e where e WV QS DIST e
* * *T T To o o o odg odgdg
E VAL e VAL s e
odgs
10
Wecanalsousethisdecompositiontocomparetheemissionintensityoftradearisingfrom
twodistinctsources:productionoftradedgoodsandtransportoftradedgoods.Beginbywriting
theemissionsfromoutputofgood(orservice)gincountryoastheproductofoutput(indollars)
andemissionsperdollarofoutput,
(4)
sothataggregateemissionsinacountryareanoutputweightedaverageofemissionsforeach
activity.
EoY Yo * sgg
*eogY
Aggregatingagainoverallcountriesyieldsworldwideemissions,similartothatfoundinTable1.
Ifweinsteadmeasurebothoutputandtransportemissionsasanintensity(i.e.,CO2equivalentsper
dollar),wecancalculatethecontributionofeachemissioncomponenttothetotalemission
associatedwithaparticulartradeflow.Foranyparticularo‐d‐gflowwehave:
(5)
Thisrepresentationisalsoconvenientasitallowsforanimmediatecalculationofthetariff
equivalentofpoliciesdesignedtoreducetotaltrade‐relatedemissions.Supposeatradeflow
produces200gramsofCO2equivalentemissionsperdollaroftrade,andfacesacarbontaxof$50
perton.Thecarbontaxraisesthecostofthattradeflowbyonepercent,andsoisequivalenttoa
1%tariff.
Muchofouranalysiswillconsistofafewbasicbutinformativecalculations.Wewill
comparethemagnitudesof forparticulartradeflows,andintheaggregatefordifferent
regions.Wewillalsoanalyzewhethermovingoutputfromahighemissiontoalowemission
producerinducesemissionchangesthatarelargeorsmallrelativetoreallocatingtradeacross
partnersfromhightransportemissiontradeflowtoalowtransportemissiontradeflow.
*Y Yog og ogE Y e
*T Yodg odg og odgE e e VAL
,T Yodg oge e
11
III. Data
InthissectionwedescribethemaindatacomponentsnecessarytodescribeGHGemissionsfrom
outputandinternationaltransportationinthebaseyear.Thesedatacomponentsare:theweight,
value,andmodalsharesoftradeforeachbilateralpairandproduct;theGHGemissionintensityfor
eachtransportationmode;andGHGemissionsassociatedwithoutputforeachproducerxsector.
Giventheimprovementinqualityandcoveragethatthesenewsourcesofdataprovide,andtheir
likelyuseinfutureresearchontransportandtrade‐relatedemissions,wedevotemuchattentionto
documenttheconstructionofthedataset.
A. Aggregation
Thesedisparatedatacomponentsmustfittogetherprecisely,usingthesamelevelofregionaland
productaggregation.Inthiswearemostconstrainedbythedataavailableforoutputemissions,
whichwetakefromthedatabaseunderlyingversion7oftheGlobalTradeAnalysisProject(GTAP)
model.TheGTAPdatabaseisidealforourpurposesbecauseitcontainsdetailedinformationon
energyusageandGHGemissionsbyorigincountryandsector,andbecausewecanusetheGTAP
computablegeneralequilibriummodelinthefinalsectionofthepaperforperformingtrade
liberalizationandoutputgrowthsimulations.
Atitsmaximumdisaggregation,GTAP7allowsonetomodelproductionandtradefor57
tradedandnon‐tradedsectorsbetween113countries.Whileitisnotcomputationallyfeasibleto
runtradeexperimentswiththefull113countryx57sectorversionofthemodel,GTAPallowsfor
flexibleaggregationacrossregionsandsectorsinordertoexaminecertainespeciallyinteresting
subsetsofthewholedataset.Forcurrentpurposes,weemployanaggregationofthemodelwith40
regions(i.e.,1600bilateralpairs),and23tradedgoodsand6non‐tradedgoodssectors,thedetailed
listingofwhichisreportedinAppendix1.
Thisparticularaggregationschemewaschosentoservetwopurposes.One,countriesand
sectorswith“similar”transportationcharacteristicsareaggregatedtogether.Forexample,allsub‐
12
categoriesofbulkagriculture,whichprimarilyusesmaritimetransport,areaggregatedintoone
categorywhilesub‐categoriesofprocessedagriculture,whichismorelikelytoemployair
transport,areaggregatedintoasecondcategory.Two,weemploycountrylevelaggregationin
caseswherewehavedetailedweight/valueandtransportationmodedata,andbroadergeographic
aggregationforregionswherethesedataarelacking.Forexample,werepresenttheMiddleEast
andAfricainonly3aggregatedregions,whileEuropeisrepresentedwith15individualcountries
and3aggregatedregions.Thisallowsustominimizetheamountofimputationthatmustbe
employedtocompletethedatabase.
B. TradeandOutputintheBaseYear:Weight/Value,andModalShares
Recallingequation(1),weneeddataonthevalueoftrade,theweight/valueratio,andthequantity
sharesofeachmode.
OurbasedatasetforthevalueofoutputandtradecomesfromtheGTAP7database,
aggregatedto40regionsand29sectors(23traded)in2004.Bymultiplyingvaluesindollarsbya
weight/valueratio(kg/dollar)thatisspecifictoeachoriginxsector,weconvertthesevalueof
tradenumbersintokilograms.Thisphysicalunitofmeasurementisconsistentacrosscountries
andproducts,ismeaningfulfromatransportationperspective,andcanbeuseddirectlytocalculate
GHGemissionsfromtransport.
Toconstruct wedrawonthreeprimarydatasourcesthatreporttradebyvalueand
weightatthe6digitleveloftheHarmonizedsystem(roughly5000products).Theseare:US
ImportsandExportsofMerchandise;EurostatsTrade(coveringtheimportsandexportsof27EU
countries)7,andtheALADItradedatabase,coveringtheimportsof11LatinAmericancountries
(Argentina,Bolivia,Brazil,Chile,Colombia,Ecuador,Mexico,Paraguay,Peru,Uruguayand
7DataontradeoutsidetheEUbytransportmodeareavailableattheHS6level.DataonexportsfromEU15toEU25countries(excludingBulgariaandRomania)bytransportmodearereportedatthe3digitleveloftheNSTRandwerecompiledonspecialrequestbystatisticiansatEurostats.
ogWV
13
Venezuela)fromallexportersworldwide.Thebilateralpaircoveragerepresentedbythesethree
datasetsisdisplayedinAppendix2.
ItisnecessarytoconcordtheHS6datatothe23merchandisetradesectorsusedinour
aggregationoftheGTAPmodel.Thismeansthatforeachimporterandexportertheremaybe
severalhundredHScodescorrespondingtoasingleGTAPsectorsuchas"electronicequipment".
Toarriveataweight/valueratioforeachexporterandproduct,weseparatelysumtheweightof
tradeandthevalueoftradeandexpressthemasaratio.Thisisequivalenttoashare‐weighted
averageoftheweight/valueratioforeachHS6producttradedbythatexporter.8
ForreferencewereportdatabycommodityinAppendixTableA1.Thisincludesinitialtariffrates
andweight/valueratios(eachexpressedasatrade‐weightedaverageoverallcountrypairs),along
withtheshareofeachcommodityinworldoutput,worldtradebyvalue,andworldtradeby
transportationservicesunits(kg‐km).Ofinterest,someofthegoodsthatrepresentalargervalue
shareintrade(electronicequipmentandmachinery)representasignificantlysmallersharein
transportationservices.Thisreflectslargedifferencesinweight/valuebetweenthese
manufacturedgoodsandheavyproductssuchasbulkagriculture,minerals,andoil.
Thedataformodalshares, ,comefromthesamethreesourcesastheweight/value
datadescribedabove.Eachofthosedatasetscontainsinformationontheweightandvalueoftrade
byorigin‐destination‐productandtransportmode.TheUSdatasplittradeintoairandocean
modes,buthasnomodalinformationonoverlandtransportfromMexicoandCanada.To
disaggregatetheseflowsintotruckandrailweusesupplementarydatafromtheTransborder
8Wedonotemployweight/valueratiosthatvaryacrossimportersbecausewedonothaveweightdataforeveryo‐d‐gtripletinthedata.Apartfromtheo‐dpairswithnodata,theweightfieldismissingfromroughly20percentofEUobservations,thoughthesetendstoberelativelysmallvalueflowsandunrelatedtomodaluse.Ingeneral,becauseaggregatingoverimportersforagivenexporterandproductreducesmeasurementerrorinthemorenoisyweightdata.
modgQS
14
SurfaceFreightData.9TheEUandALADIdatasetsreporttradebyair,ocean,rail,andtruckmodes.
ModalusefortheUS,ALADI,andEUtradewithnon‐EUpartnersaremeasuredattheHS6level.
Intra‐EUtradeismeasuredattheNSTR3digitlevel.Toconstructmodalquantityshares,wefirst
concordtheHS6(orNSTR3)productcodestoGTAPsectorgroupings,andaggregatesothatwe
havetheweightoftradeforeachmodewithineacho‐d‐gtriplet.
For35percentofworldtradebyvaluewehavenodirectdataonmodaluse.Inthesecases
weestimatemodalsharesasafunctionofgeography,country,andproductcharacteristicsbasing
ourestimationsampleonthosecountrypairsthatdoreportmodaldata.Theseregressionshave
goodexplanatorypower,especiallyinthevastmajority(allbut2percent)oftheremainingcases
wherelandtransportisnotanoption.DetailsareprovidedinAppendix2.
Theresultsofourdatacollectiongenerateafullmatrixofmodalsharesforeachorigin‐destination‐
GTAPsectorbyvalue,weight,andtransportationserviceunits(kg‐km).Table2providesmodal
sharesfortheimportsandexportsofeachcontinent,bytradevalueandKG‐KM.AppendixTable
A2reportsthenumbersbytradedsectors.
Afewthingsarenotable.Therearelargedifferencesacrossregionsinthevaluesharesof
thetransportationmodesthatlargelyreflectgeography.Forexample,NorthAmericaandEurope,
withimportantland‐adjacenttradepartners,relymuchmoreheavilyonroadtransport.10
Substitutionbetweenairandoceancargoisespeciallyimportantasitreflectsthelargestgapin
emissionintensities.Worldwide18percentoftradebyvalueisair‐borne,withmuchhigherratios
inNorthAmericanandEastAsianexports.Excludingland‐basedmodes,airtransportrepresents
9TheTBSFdatahaverailv.roadsplitsattheHS2level.Wetakeeachland‐basedtradeflowfromthemoredisaggregatedHS6dataanddivideitusingthesplitsfoundinthecorrespondingHS2data.Wethenaggregatetothebroader23sectorsfoundintheGTAPdata. 10MostofAsiahasverysmallsharesoflandtransportbecausethelargesttradingpartnersareseparatedby(short)stretchesofocean.SouthAmerica,forwhichlandtransportisactuallyanoptionhasratherlowlandtransportshares,probablybecauseeconomicactivityisconcentratedoncoastsratherthanintheinteriorsclosetolandborders.Whenwedisaggregatetothecountryleveltherearemoredramaticdifferences.Europeasawholehasveryhighsharesofrailandroadtransport,exceptforcountriesliketheUK,Ireland,andFinland.
15
48percentofinternational(air+ocean)cargoforNorthAmericanexportsand27percentfor
EuropeanandAsianexports.
Itisalsoinstructivetocontrastthevalueoftradewiththetransportationservices(KG‐KM)
employedbytrade.Here,seatransportdominateswith95percentoftransportationservices
provided.Productsthatareheavy,andthataretransportedlongdistances,aremuchmorelikelyto
besea‐borne.Thelargestdifferencerelativetovaluesharescomesintheuseofroad‐based
transport:whileitrepresentsnearlyhalfofEuropeanimportsbyvalueitisonly5percentof
EuropeanimportsbyKG‐KM.Roadtransportconstitutesalargeshareofvalueandweightmoved
inEuropeantrade;howeveritisconcentratedinthetradeofproximatepartners.Asaresult,road
transportrepresentsaverysmallshareofkilogram‐kilometersshipped.
C.GreenhouseGasEmissionsbyTransportMode
Wedrawondatafromseveralstudiestocalculateemissionsperkg‐kmofcargomovedbyeachof
thefourtransportmodes:ocean,air,rail,androad.Thesesources,anddataonemissions,are
reportedinTable3.Webrieflyremarkonthedataformaritimeandaviationemissionshere.
Themostrecentandcomprehensivestudyformaritimetransportcomesfrom"ShipEmissions
Study",NationalTechnicalUniversityofAthensLaboratoryforMaritimeTransport(2008).It
reportsemissionsingramsofCO2pertonne‐kmshippedformanydistinctshiptypes,aswellas
variabilityacrossvesselsofdifferentsizeswithineachtype.11InTable3,wereproducethefleet
averagesforsixshiptypes,andnotetheshiptypesemployedforeachtradedgoodssectorinour
model.Whileotherstudieslackthedetaileddatabyshiptypereportedinthatstudy,thosestudies
(Kristensen2006,GiannouliandMellios,2005)thatprovidedataforcontainerizedcargoarriveat
similaremissionnumbers.
11Ingeneral,CO2emissionspertonne‐kmshippedaremuchlowerforlargervesselswithineachtype.Forexample,post‐Panamax(>4400TEU)containershipsproduce1/3theemissionsofalessthan500TEUfeedership.Becausewehavenodataontheshipsizecompositionofflows,weemployfleetaveragesforeachfleettype.ThestudyalsoprovidesdataforhighlyspecializedshiptypessuchasReefersandRo‐Ros.Wedonotemploythisdataasourbroadertradeaggregatescontainamixofgoodsthatwouldemploythesespecializedtypesasasmallsubsetofgoodsthatgenerallyemploycontainervessels.
16
Insearchingtheliteraturewefoundfewestimatesofemissionsassociatedwithaircargo.These
arriveatwidelyvaryingestimatesofemissionspertonne‐km,andprovidelittledetailon
methodology.Forexample,aMaersk2007pamphletcitedintheUniversityofAthens(2008)study
reportsthataBoeing747‐400emits552gramsofCO2pertonne‐kmshipped.ACaliforniaClimate
Changepamphletfor2006reportsemissionspertonne‐kmshippedrangingfrom476‐1020grams
ofCO2.
Giventhiswiderange,weattemptedourowncalculationsbasedonfuelusageandfleet
characteristics.TheAirTransportAssociationofAmericareportsfleetwidefuelusageandton‐
milesofcargoshippedforUScargoairlines.UsingthesetotalswecalculatethatUScargoairlines
used163.6gallonsofjetfuelperthousandton‐milesshipped.Convertinggallonsofjetfuelinto
gramsofCO2andcargosintotonne‐km,wecalculateCO2emissionsof963.5gramsofCO2per
tonne‐km.
WealsoattemptedtoconstructanindependentestimateofCO2emissionsassociatedwith
aircargousingdatatakenfromAircraftEconomics,1999,“FreighterCostComparisons”.This
sourceprovidesdatafor14majorcargoplanetypesincludingtotalfueluse,revenueton‐miles
flown,andshareinthefleet.Combiningfueluse,emissionspergallonofjetfuel,andton‐kmflown
itispossibletoconstructameasureofaverageCO2emissionspertonne‐kmflown.Thenumbers
rangefrom493to1834,dependingontheplanetypeandhowitwasused(i.e.forshortv.longhaul
cargocarriage).Forcomparison,applyingthismethodtotheBoeing747yieldsemissionsof700
gramsofCO2pertonne‐km,whichisclosetotheMaerskstudy.Takingaweightedaverageof
theseemissionnumbersoverthefleetsharesreported,wearriveataverageemissionrateof972
grams.Finally,ifweupdatethefleetcompositionusing2008shares(fromATA)wearriveat
averageemissionsof912.1grams.
Inthecalculationsthatfollowweemploy552g/t‐kmasa“LOW”emissionsvaluefor
aviation.Thiscorrespondstouseofthemostefficientaircraftonthelongestflights.Weuse950
17
g/t‐kmasa“HIGH”emissionsscenario,anditcorrespondstoauseofamixedfleetofsmaller
planesonshorterflights.
Toamplifythislastpoint,landing/takeoff(LTO)requireshighfueluserelativetocruising,but
thiseffectismostpronouncedatshortdistances.WecollecteddetaileddatafromEEAEmission
InventoryGuidebook2007onfuelusageonLTOandcruiseforavarietyofplanesandcalculated
emissionsperton‐kmforvarioustriplengthstoseehowthiswouldaffectourcalculations.For
example,a747‐400witha60%loadfactorona1852kmflightemits556g/t‐km(closetoourLOW
scenario),whilethatsameplaneandloadfactoremits912g/t‐kmona463kmflight.This
representsanimportantdiseconomyofscaleformuchshorterflightsofthekindonewouldsee
withdomesticUScargousage.However,onceonegetstoflightsofinternationaldistances,the
effectsbecomemuted.At463km,LTOfuelrepresentsnearly55%oftotalfueluse,droppingbelow
5%fordistancesabove6000km.Themediantraveldistanceinourdatais8000km.
Thefinalcomponentweneedtocalculatetransportemissionsisdistancetraveled.Forrail,
road,andairtransportwerelyonthesimpledistancesreportedbytheCEPII.12Bilateraldistances
betweencountrypairsarecalculatedfollowingthegreatcircleformula,whichuseslatitudesand
longitudesofthemostimportantcityineachcountry.13Foroceantransportdirectlinedistances
significantlyunderstateactualdistancestraveled.Containershipsrarelytravelpointtopoint
betweenimporterandexporterandfrequentlystopatmultipleportsofcallenroute.Wedrawona
datasetofactualshipitinerariesfromHummelsandSchaur(2011)thatallowustocalculateactual
distancestraveledduetotheseindirectroutings.
D.GreenhouseGasEmissionsfromOutput
TheGTAP7databaseprovidesdataonGHGemissionsproducedbyeachsectorgineachcountryo,
inequation(4).Webrieflysummarizehowthesedatawereconstructed,anddirectreadersto
12TheCEPIIdatasetisavailablefordownloadathttp://www.cepii.fr/anglaisgraph/bdd/distances.htm. 13Foraggregationattheregionallevelweweightedeachconstituentcountry’sdistancebyitsGDPshareintheregion’sGDP.
YogE
18
moredetaileddiscussionsavailablefromLee(2008)andRoseetal(2010).Foreacho‐gpair,the
databasecontainsinformationonuseofsixenergyinputs(coal,oil,gas,petroleumproducts,
electricity,andgasdistribution).Energyusediffersacrosscountriesandsectorsasafunctionof
theenergyintensityofproduction,theefficiencywithwhichenergyisused,andtheavailabilityof
energyinputsintherespectivecountry.UsingastandardformulationprovidedbyIPCC(1997)
guidelines,thequantityofenergyinputsisthenconvertedintoCO2emissions.Finally,thesedata
aresupplementedbycalculatingnon‐CO2greenhousegasesemittedasaby‐productofproduction
(primarilyinagriculture).TheseareconvertedintoCO2equivalentsbasedontheirglobalwarming
potentials,followingthemethodologyinUSEPA(2006).
CombiningthesedatawehavetotalGHGemissionsforeachcountryoandsectorg.To
providecomparisonstoourtransportationemissions,wedescribetheseasemissionintensitiesper
dollarofoutput bydividingtotalemissionsforo‐gbythemarketvalueofoutput.
IV. TransportandOutputEmissionsintheBaseYear
Inthissectionweprovidethreemainexercises.First,wecompareour“bottom‐up”approachto
calculatinginternationaltransportemissionstotheITF“top‐down”approachasamethodological
check.Second,wecomparetransporttooutputemissionsforagiventradeflowtogaugethe
importanceoftransportemissionsintrade.Third,weusethetransportandoutputdatain
combinationtoconsiderwhethersomepartialequilibriumchangesinthepatternofspecialization
andtradewillyieldrisingorfallingGHGemissions.
A. AggregateEmissionsfromInternationalTransport:ComparingMethodologies
Our“bottom‐up”approachtoemissionscalculatesthequantityoftransportationservices(KG‐KM)
performedbyeachmodeineachorigin‐destination‐producttradeflow,andthenmultipliesby
emissionsperKG‐KMforeachmode.Thisyieldstransportationemissionsthatarespecificto
nearly36,000individualtradeflows.Summingoveralltradeflowswehaveanalternativeestimate
Yoge
19
oftotalCO2emissionsfrominternationaltransport.Howdoesthisbottomupapproachcompareto
thetopdownITF(2010)approachbasedonworldwidefuelusage?Theansweris:surprisingly
well.In2004,theITFcalculatesthatinternationalaviationandmaritimetransportwasresponsible
for910milliontonsofCO2production,520frommaritimeand390fromaviation.Wecalculate
522milliontonsofmaritimeemissions.WhenweemploytheLOWemissionsintensitywe
calculateaviationemissionsof419(andatotalof941milliontons)in2004.14Accordingly,wewill
focusmostofoursubsequentcalculationsontheLOWaviationemissionsscenario.Whilethereare
largemethodologicaldifferencesbetweenourapproachandtheITF,wematchemissionaggregates
quiteclosely.Thisgivesusconfidencethatourestimatesfordisaggregatedflowswillalsobe
informative.
Usingourmorecomprehensiveemissionsdatawecalculatethattotalinternational
transportemissionsare1205milliontonsin2004.Measuredrelativetothevalueofworldtrade,
internationaltransportemits146gramsperdollaroftrade,whileoutputoftradedgoodsgenerates
300gramsperdollaroftrade.Thatis,totaltrade‐relatedemissionsare446gramsperdollar,of
which33percentcomefrominternationaltransport.Forperspective,a$50pertoncarbontax
appliedtotheaverageinternationaltransportemissionswouldbeequivalenttoa0.73percent
tariff.
Ourcalculationof1200milliontonsofCO2equivalentcontrastswiththe910milliontons
calculatedbytheITF.Byomittingroadandrail,theITFcalculationmisses28percentof
internationaltransportemissions.ThismayhelptoexplainacuriouspatterninTable1.Usingthe
ITFemissionnumbersweseethatinternational(maritimeplusaviation)transportemissionsper
dollarofworldtradedroppedsharplyfrom159g/$in1990to93g/$in2004.Whydidtrade
14NotethattheHIGHaviationintensity,basedonthecurrentcompositionoftheUSaircargofleet,yieldsaviationemissionsof721milliontons,muchhigherthantheITFvalues.Therearetwopossibleexplanationshere.One,theITFseparatesfueluseintodomesticandinternationalusage.Ifsomeinternationalfuelusewereinaccuratelyrecordedasdomesticusage,theywouldunder‐estimateemissions.Two,itmaybethatthecompositionoftheUSaircargofleet,includingsmallerplanesandshorterroutesthanaretypicallyfoundininternationalaviation,mayoverstateemissions.
20
appeartobecomelessemissionintensivefrom1990‐2004?Thekeyisthatland‐basedtrade,
omittedfromtheITFemissionvalues,interactsinaninterestingwaywiththestructureof
protection.Inthisperiodtradegrewespeciallyfastwithland‐adjacentpartners,15promotedby
policymeasuresthatofferpreferentialtariffrates,investmentrules,regulatoryharmonizationand
currencyunionwiththoseclosepartners.Table2showsthatinternationalroadandrailare
responsiblefornearlyathirdofworld‐tradebyvalue–halfofintra‐Europeantradebyvalueisland
based.
Note,however,thatthispatternneednotpersist.Weretradeliberalizationatthe
multilateralleveltoerodepreferentialtariffrates,orwereoutputtogrowmorerapidlyoutsideof
NorthAmericaandEurope,tradewouldlikelyshifttowardsdistantpartners.Werevisitthispoint
inSectionFive.
B. EmissionsfromTrade:ComparingOutputandInternationalTransportation
Webeginbycomparingtrade‐relatedemissionsfromoutputoftradedgoodsandinternational
transportatthelevelof35,880individualtradeflows(thatis,40exportersx39importersx23
tradedgoodssectors).WeplotthedistributionofemissionintensitiesasCO2gramsperdollarof
tradeinFigure1.Outputandtransportemissionsaresimilarlydistributedbecausetheyhave
similarmedians(transport‐120g/$,output‐137g/$)andarehighlycorrelatedatthelevelof
individualtradeflows.16
Thereisawidevarianceinbothtransportandoutputemissions,rangingfromclosetozero
gramsofcarbonperdollartowellover2kgofCO2.Thisvarianceisnotablebecausetheaverage
15Thispattern,insharpcontrasttotheconventionalwisdompointingtothe“deathofdistance”hasbeenpointedoutbyseveralauthorslookingattheeffectofdistancevariablesingravityregressions(DisidierandHead,2008;BerthelonandFreund2008),andotherswhohavenotedtheremarkablylargeeffectofNAFTAandEUliberalizationpoliciesontradewithinthoseregions. 16Tradeflowswithhighoutputemissionsalsohavehightransportemissions,andthisistruewhetherwelookattotalemissionsoremissionsintensities.Aregressionoftransportemissionintensitiesonoutputemissionintensitiesfortheexporteryieldsanelasticityof0.26andanR2=0.10.Aregressionoftotalemissionsfromtransportontotaloutputemissionsyieldsanelasticityof0.76andanR2=0.73.
21
valueof145grams/$fortransportasawholeisdrivenbyaconcentrationoftradeino‐d‐gflows
withverylowemissionintensities.Therearemanyflowswithmuchhigheremissions,andcarbon
taxationwouldhaveapronouncedeffectonthesegoods.Forcomparison,theworld‐wideaverage
tariffrateinourdatais3.2percent,whichisequivalenttoacarbontaxof$50appliedtoatrade
flowwithtransportemissionsof650grams/$.
Nextweexaminethecontributionoftransportemissionstotrade‐relatedemissionswhen
calculatedonacommonperdollarbasis.Weaggregatetransportemissionsforeachindustryby
summingoverallcountrypairs.Takingthetransportemissionsforeachindustryanddividingby
thevalueoftradeyieldsa(weightedaverage)transportemissionintensityforthatindustry.A
similarprocedureyieldstheaverageoutputemissionsintensity.Addingthesetogetherasin
equation(5)enablesustocalculatetheshareoftransportemissionsintotaltrade‐related
emissionsforeachindustry.Figure2providesthiscomparisonwithindustriessortedfrom
smallesttolargesttransportemissionsshare(dataingrey,scaledisplayedontherightvertical
axis).Forperspectivewealsodisplaytransportemissionsforthatindustryasashareoftotal
transportemissions(datainblue,scaledisplayedontheleftverticalaxis).
Recallthatworldwidetransportisresponsiblefor33percentoftraderelatedemissions.Atthe
industrylevelweseewidedispersioninthesenumbers.Atthelowendarebulkproducts
(agriculture,mining)withsignificantoutputemissions,andwhichtendtobeshippedusingthe
mostefficientmaritimebulkcarriers.Atthehighendaremanufacturedgoods.Over75percentof
thetrade‐relatedemissionsoftransportequipment,electronicequipment,machinery,and
manufacturesnotelsewhereclassifiedcomefromtransportation.
InTable4weprovidesimilarcalculationsforinternationaltransportandoutputemissions
byregionalgroupingsandforselectedcountries(forthefullsampleofcountriesseeAppendix
TableA3).Thefirstthreecolumnsshowthecontributionofeachregiontotrade‐relatedemissions
worldwide,includingemissionsfromindustrialoutputandfrominternationaltransport.Thereare
22
severalnotablepatternshere.First,thereisasignificantdifferencebetweentheoutputshareof
emissionsandthetradeshareofemissions.NorthAmericaandEuropearetogetherresponsible
forjustoverathirdofoutputemissionsbutover60percentoftransportemissions.TheUSaloneis
responsibleforalmostathirdofworldemissionsfromtransportationofexports.Theopposite
patternholdsforChina,whichisresponsiblefor20.8percentofoutputemissions,andonly3.5
percentoftransportemissionsfromexports.Second,formanyregionsthereisalargeimbalance
betweeninternationaltransportemissionsinimportsandexports.TheUSexportemissionsshare
ismuchlargerthanitsimportemissionssharewhilethisimbalanceisreversedfromtheEuropean
andEastAsianperspective.
Tosomeextentthesesharesaredrivenbythesizeofeachregion,relianceontrade,and
tradeimbalances.Toeliminatetheseeffects,intheremainingcolumnswecalculateemission
intensitiesforexportsandimports,measuredingramsofCO2equivalentperdollaroftrade.To
makethenumberscomparable,bothoutputandtransportemissionsarereportedasweighted
averagesofcountryxsectoremissions,wheretheweightsineachcasereflecttradeshares.17
Hereweseelargedifferencesbetweenregionsintheemissionintensitiesofoutputandtransport.
Thereissignificantvariationinoutputintensities,drivenlargelybythecommoditycompositionof
trade.SouthAmerica,OceaniaandtheMiddleEast/Africahaveveryhighoutputemissionsper
dollaroftrade,drivenbytheirrelianceonemissionintensivecommodityproduction.
Manufacturingorientedexportersseemuchsmalleroutputintensities.Perhapsmoresurprising
therearealsoverylargedifferencesinthetransportintensities.ThetransportationofUSexportsis
nearlyeighttimesmoreemissionintensivethanthetransportationofChineseexports,andsix
timesmoreemissionintensivethanEurope.Thisisaconsequenceofanunusuallylargerelianceon
aircargoinUSexports.
17Byusingtradeshares,theimportanceofaparticularsectoristhesameforbothoutputandtransportemissions.Werewetouseoutputsharesforoutput,goodswithalargeshareofoutputbutasmallshareoftradewouldskewtheaverages.

23
Thesenumbersmakeclearthatincludingtransportsignificantlychangesourperspectiveon
whichregionshaveemissionintensivetrade.India’sproductionoftradedgoodshas143percent
moreemissionsthantheUSperdollaroftrade,butafterincorporatingtransportation,itsexports
arelessemissionintensiveintotal.Wealsoseeastrongimbalanceinemissionintensities.East
Asianimportsaremuchmoreemissionintensivethantheexports,whilethereverseistrueforthe
US.
Asignificantadvantageofourapproachtoassessingtransportemissionsisthatitgivesus
theabilitytosortoutwhichregionsareengagedinespeciallyemissionintensivetrade.Aclear
implicationofthesenumbersisthatbothproductionandtransportationemissionsshouldbe
consideredwhenevaluatingpolicychangesdesignedtocurtailemissions.Insomecountriesthe
impactwillbefeltmostacutelyontheproductionside,whereasincountriesliketheUS,themain
effectwillprimarilybeontransport.Similarly,insomeclimatechangemitigationproposals,
internationaltransportemissionsaretobeincludedaspartofacountry’scarbonallocation.The
largedifferencesbetweenimportandexportemissionsshowninTable4suggesttheprecise
mannerinwhichthisisdonecouldbeveryimportant.Thatis,NorthAmericawouldmuchprefer
animportbasedallocationratherthananexportbasedallocation,whileEastAsiancountrieswould
prefertheopposite.
C. ReallocatingProduction:DoesMoreTradeMeanMoreEmissions?
Acentralquestionofthepreviousliteratureontradeandcarbonemissionsisthis:willrisingtrade
leadtohigherorloweremissions?Iftwocountriesengagedintradehavesimilaroutputemission
intensities,thenmoretrademeansmoreinternationaltransportandhigheremissions.However,if
thedifferenceinoutputemissionsislargeenoughtooffsetthetransportemissions,tradecould
loweremissions.
Thisquestionhasbeenpreviouslyaddressedwithcasestudies(Jones,2006;Simsetal.,
2007;Williams,2007)orwithlargelyimputeddata(PetersandHertwich,2008).Wecanuseour
24
datatoaddressitcomprehensively.Tobeginweprovideastraightforwardpartialequilibrium
calculation.Welookatallpossiblereallocationsofproductioninwhichacountryreducesdomestic
productionofasectorandimportsthesamevalueofthegoodfromabroad.Denotingtheexporter
ororiginas“o”,thedestinationcountryas“d”,andthegood“g”,wecancalculatethechangein
emissionsassociatedwithconsumingthegoodas
(6) eodgc (edg
Y eogY ) eodg
T
Wewillconsiderallpossiblereallocationsoverallcountrypairs,whichmeansthatthefirsttermin
bracketswillbesymmetricallydistributedaroundzero.(Forexample,therearetwoobservations
fortheUSandChinatradingelectronics,oneinwhichtheUSistheorigin,andanotherinwhich
Chinaistheorigin.)Thequestioncanthenbeframedas:isthevariationinoutputemissionslarge
orsmallrelativetotransportemissions,andwhatfractionofreallocationscouldreduceemissions
despiteincorporatingtransport?
InFigure3aweprovideahistogramof29,300productionreallocations,withunitsingrams
ofCO2perdollartraded.18Themedianreallocationfromtradeincreasesemissionsby123grams
perdollartraded,whilethemeanreallocationincreasesemissionsby554grams.Negative
observationsrepresentareductioninemissionsfromtrade;26.5%ofallpossiblereallocations
reduceemissions,andthesetradepairsaccountforabout31percentofworldtradebyvaluein
2004.
Tounderstandthemechanicsofthisreallocationbetter,weprovideasimilardistribution
fortwoillustrativesectors:wearingapparelandbulkagriculture.Forwearingapparel,thereare
quitesmalldifferencesacrosscountriesinoutputemissions.Thismeansthatrisingtradeacts
primarilytoincreaseemissionsfromtransport.Only15.8%ofproductionreallocationsreduce
emissions,andtheaggregatechangesinemissionsfromtradearequitesmall(mean136).In
contrast,therearelargedifferencesacrosscountriesinoutputemissionsfrombulkagriculture,and
18Wedropthetopandbottom5%ofvaluestoeliminateoutliersthatdistortthehistogram.
25
aswenotedinFigure2,transportisasmallshareoftrade‐relatedemissions.Inthiscase,41.6
percentofproductionreallocationsreduceemissions,andtheaggregatechangeinemissionsfrom
tradeisverylarge(mean764grams).
Table5providesdataforeachcountryandproducingsectorincludingthefractionoftrade
reallocationsthatareGHGemissionreducing,andtheaveragechangeinemissionsfromtrade.
Highincomecountriestendtohavelowoutputemissionsandintensivelyuseairplanesintrade,
andhere,fewtradeexchangesareCO2reducing.Lowincomecountrieshavehighoutputemissions
andintensivelyusemaritimetransport.Here,morethanhalfoftradereallocationsareemission
reducing.
ThesecalculationsaremechanicallyfocusedonlyonGHGemissions,anddonotaddress
whetheranyparticulartradeflowislikelytotakeplace.Assuchtheyaremeanttobeillustrativeof
thecapacityofthetradingsystemtoincreaseordecreaseemissions,butnotthefeasibilityofthe
change.Inthenextsectionweconsidergeneralequilibriumshockstothetradingsysteminorder
toanalyzehowlikelyfuturepatternsoftradegrowthwillaffectemissions.
V. TradeGrowthandChangesinInternationalTransportEmissions
Theemissionintensityofindividualtradeflowsvariesdramaticallydependingonwhatproductis
beingtraded,whichcountriesaretrading,andhowtheyaretransportingit.Asaconsequence,
tradegrowththatalsochangesthecompositionoftradecanresultinpronounceddifferencesin
trade‐relatedemissions.
InthissectionwewilluseaCGEsimulationtogeneratechangesinthevalueand
compositionoftraderesultingfromtariffliberalizationandGDPgrowth.Combiningthiswithour
scalevs.intensitydecompositionwecancalculatetheeffectofgrowingtradeonemissionsgrowth.
Fixingtheemissionintensityofaparticularoutputsectoro‐g,thegrowthinoutputrelated
emissionsis:
26
(7)
Fixingtheemissionintensityofaparticularo‐d‐gtradeflow,thegrowthoftrade‐relatedemissions
isthen
(8)
Thisexerciseholdsfixedthemodalsharesforeacho‐d‐gflow,andtheemissionintensityofeach
mode.Putanotherway,thisexercisetakesthetransportationsystemasgivenandexamineshow
changesintradeaffectthegreenhousegasemissionsfrominternationaloutputandtransport.We
donotmodelhowchangesinfuelprices,spurredeitherbyrisingdemandforfuelorchangesin
carbon/fueltaxes,affectmode‐specificprices.Nordoweexplicitlyexamineendogenous
technologicalchangeintransportation,althoughwedoexploresensitivityofourresultsto
assumptionsonthefuelandemissionintensityofairtransport.Onecanimagineanadditional
exercise,motivatedbyandmadepossiblebythedataconstructedinthispaper,focusedonthe
effectofcarbontaxationonfuelpricesandthereforemodalchoice,andhowthatwouldfeedback
intochangesintradepatterns.Weleavethisconsiderablymoreinvolvedexerciseforfuturework.
Ourapproachoffixingmodalsharesforeacho‐d‐gflowyieldsareasonableapproximationof
aggregatechangesinmodaluseandemissionsintwocases.One,iftariffliberalizationorGDP
growthdoesnotgeneratelargechangesinrelativetransportationprices(e.g.thepriceofair
relativetooceanshipping),thenwewouldnotexpectmodalshareswithinano‐d‐gflowtochange
much.Thiswouldbethecaseiftherearefewaggregatechangesinmodaluse,oriftradegrowth
doesnotaffectinputcostsdifferentiallyacrossmodes.Two,supposethatmodalusevaries
primarilyacross(ratherthanwithin)o‐d‐gflowsduetoimmutablegeography,infrastructure,and
productcharacteristics.Forexample,land‐adjacentcountrieswillcontinuetomovegoodsviaroad
andrailindependentofoceanshippingpriceswhilecountriesseparatedbyanoceanwillbeunable
touseroadandrail.Similarly,productweightwillforcegrainontobulkcargocarriersregardless
*Y Yog og ogE Y e
*T Todg odg odgE VAL e
27
ofthepriceofaircargo.Inthesecases,smallchangesovertimeinmodalusewithineacho‐d‐gflow
willbeswampedbychangesinthetradesharesofflowsthatuseonemodemorethananother.19
A. SimulatedTradeGrowth
Wewishtosimulatethechangesinworldwideoutputandtrade( and inequations(7)
and(8)respectively)associatedwithvarioustariffliberalizationandoutputgrowthscenarios,
whichrequirestheuseofacomputablegeneralequilibrium(CGE)modeloftrade.Weemploy
version7oftheGTAPmodel,aggregatingthemodelto40regionsand23tradedand6non‐traded
goods.AhighlydetaileddescriptionofthiswidelyusedmodelcanbefoundinHertelandTsigas
(1997).Webrieflysummarizekeycharacteristicshere.
Withineachsectorfirmsareconstantreturnstoscalewithaproductionstructurethatis
Leontiefinfactorinputs(labor,capital,andland)andintermediateinputsincludingenergy
commodities.SubstitutionbetweenfactorinputsisgovernedbyaCESstructure,asissubstitution
betweenintermediateinputsthatareArmingtondifferentiatedbyorigin.Ontheconsumptionside,
householdshaveCobb‐Douglaspreferencesoverconsumption,governmentspendingandsaving.
DemandsoverconsumptiongoodsemployaCDE(constantdifferenceofelasticities)form,and
householdsregardtheoutputofeachsourcecountryasArmingtondifferentiated.
Tocapturepossibleeffectsoftradeliberalizationweexplorefourscenarios.Therehave
beenawidevarietyofliberalizationproposalsaspartoftheDoharoundoftheWTOtalks.We
choosearepresentativethree,referredtoinMinor(2006)asDohaScenarios4,5,and9,because
theirdesignisclosesttotheproposalscurrentlyunderconsideration.Appendix3containsdetailed
notesonthesescenarios.Insummary,scenarios4and5focusonagriculturalmarketaccessonly
withtariffcutsfordevelopedcountriesrangingfrom40to60percent,andthosefordeveloping
countriesbeingonethirdsmaller.Scenario9accountsforbothagriculturalandnon‐agricultural
marketaccess(NAMA),andherenon‐agriculturaltariffsarecutprogressively,i.e.peaktariffsare 19Wealsoholdfixedthewvratiooftradeforagivenflow,assumingthatsmallchangesovertimeinwvwithinano‐d‐gflowwillbeswampedbychangesinthetradesharesoflightversusheavyflows.
ogY odgVAL
28
cutmorethanlowertariffs.Inafinal“fullliberalization”scenario,allimportandexporttariffsand
subsidiesaresettozero.
Tariffliberalizationmayleadtomodestincreasesintrade,butrisingoutputislikelytolead
tomuchmorerapidtradegrowth.Moreover,outputgrowthislikelytobeasymmetricwithsome
developingcountriessuchasChinaandIndiagrowingmuchfasterthandevelopedcountries.To
experimentwithoutputgrowthweuseaspecializedversionoftheGTAPmodelcalledGDyn(or
DynamicGTAP).ThisversionofthemodelcontainsdetailedprojectionsofGDPandfactor
endowmentgrowthratesfrom2004‐2020foreachcountryinthedatabase(Walmsley2006).20
ThismodeltakesbothrealGDPgrowthandfactorinputgrowthasexogenous(valuesshownin
AppendixTableA4),andallowsaHicksneutraltechnologicalchangevariabletoreconcilethese
changeswithothermodelvalues.
Thissimulationallowsustoexaminetwokeypoints.First,predictedGDPgrowthrates
varywidelyacrosscountries,withespeciallyrapidgrowthinChinaandIndia,andslowergrowthin
developedEuropeaneconomies.Second,thisgrowthoccursthroughunevenratesoffactor
accumulation,withsomecountriesrapidlyaccumulatingcapitalandskilledlaborwhileotherssee
relativelyrapidgrowthinunskilledlabor.Thisallowsustomodelchangesinboththescaleofeach
economyandincomparativeadvantagearisingfromchangingfactorsupplies.
B. Results
Table6summarizesthechangesinoutput,exports,modaluse(byvalueandbyKG‐KM),andCO2
emissionsundereachofthefivescenarios.Changesinoutputvalue,outputemissions,andexport
valuescomedirectlyfromtheGTAPmodel.Combiningthesewithourdataontradeweight/value
20Walmsley2006inturnbuildsGDPandinputgrowthestimatesbasedonGlobalEconomicProspects2005,AhujaandFilmer1995,andCPB1999.GDynexplicitlymodelsthedynamicsofcapitalaccumulation,whichmakesiteasierforthemodelertohitagivenGDPgrowthtarget.Itallowsforinternationalcapitalmobilitysothatclosingthemodelrequiresustoallowinvestmenttovaryendogenouslyinonecountry(wechoseSouthAfrica,givenitsrelativeunimportanceforthemajorissuesathand).TheresultwasanunrealisticallyhighrateofcapitalaccumulationinSouthAfrica.Howeverallresultsarerobusttoincluding/excludingSouthAfrica,exceptforthoseinTable7.
29
anddistancewecalculatechangesinexportsbyweightandbytransportationservices.Combining
changesintransportationserviceswithdataonmodaluseandemissionswecalculatechangesin
modaluseandemissions.Forrobustnesswecalculatechangesintransportintensityassuming
bothaHIGHemissionsscenario(aviationemissionsmatchingtheUScargofleet),andaLOW
emissionsscenario(aviationemissionscorrespondingtothemostefficientlongrangeplanes,and
matching2004totalemissionvaluesfromtheITF).
ThethreeDohascenariosarelargelyuninterestingfromatransportandemissions
perspective.Simply,theseliberalizationeffortsaresomodestthattheyyieldlittlegrowthintrade,
intransport,orinemissions.Themostfar‐reachingscenarioyieldsa1.1percentincreaseintrade
(byvalueorKG‐KM),andaslightlyhigher(1.7‐2.1percent)riseintransportemissions.
Thefullliberalizationscenarioeliminatesallimportandexporttariffs.Whilethisisnotcurrently
onthenegotiatingagenda,itisaninterestingexercisebecauseitrevealsanimportantintersection
betweenthestructureofprotectionandemissions.Tariffratesarenotsetuniformlyacrosstrading
partnersandsignificantpreferencesaregiventopartnerswithintradingblocssuchastheEUand
NAFTA.Becausetradingblocstendtobegeographicallyconcentrated,tariffsarelowerformore
proximatepartnersandespeciallyforland‐adjacentpartners.Inourbaseyear,thetrade‐weighted
averagetariffrateforland‐adjacentpartnersis1percent,whiletheaveragetarifffornon‐adjacent
partnersis5.5percent.Thisisanimportantphenomenonfromatransportationperspective
becauserailandroadtransportdominateinternationaltradebetweenland‐adjacentcountries.
Tariffliberalizationthatremovestariffpreferencesforland‐adjacentcountrieswillthenshifttrade
towarddistantpartnersandawayfromroadandrailtransport.
Theseeffectsshowupclearlyinourresults.InTable6weseethatfullliberalization
increasestradeby6percent,concentratedinthoseproducts(agriculture,textilesandwearing
apparel)thataresubjecttothehighestratesofprotection.21Internationaltransportemissionsrise
21Thesmallnegativeeffectonoutputvalueisduetotermsoftradeeffects.Realquantitiesoftraderise.
30
fasterthantrade,dueinparttoariseintradeatadistanceandinparttoanexpansionofemission
intensiveaircargo.AsweseeinTable6,railandroadusageshrinkssubstantiallywhile
internationalaviationandmaritimetransportgrowquickly.
Incontrasttothetariffliberalizationsimulations,theGDPgrowthscenarioyieldsprofoundchanges
inoutput,trade,andgreenhouse‐gasemissions.Outputandtradevaluerisesatsimilarrates,
accumulatingto75‐80percentgrowthoverthisperiod.Trademeasuredbytransportservices(KG‐
KM)risesmuchfaster,6.5percentperannum,accumulatingto173percentgrowth.Not
surprisinglythen,transportemissionsrisefasterthanoutputandtradebyvalue,andfasterthan
outputemissions.
Tounderstandthis,notethattariffliberalizationcreatedtradegrowthbiasedtowardlong
distancetradebecauseoftheerosionofproximity‐basedtariffpreferences.TheGDPgrowth
experimentcreatestradegrowthbiasedtowardlongdistancetradebecausethefastestgrowing
countries(China,India)arefarawayfromotherlargemarkets.Aswithtariffliberalizationthereis
fastergrowthinairandseatransportrelativetorailandroadtransport.
Theseaggregatednumbershideawealthofinterestingvariationwewishtoexplore.Recalling
equation(8),weask:whatistherelationshipbetweentransportemissionintensityinthebase
year,andthesubsequentgrowthintrade?InthetopleftpanelofTable7wegroup30,906o‐d‐g
tradeflowsintoquartilesusingtransportemissionintensity,andassigneacho‐d‐gobservationa
quartiledummyvariable.22Wethenregresstradegrowth(byo‐d‐g)onemissionsquartileswith
theconstantrepresentinggrowthinthelowestemissionquartile.Inboththefullliberalizationand
GDPgrowthscenarios,thehigherthetransportemissionintensityofthetradeflowthefastertrade
grew.ThiseffectwasconsiderablystrongerintheGDPgrowthscenario,bothinthesizeofthe
coefficientsandintheregressionR‐squared.Inthebottomleftpanelweexaminecorrelatesof
22WealsoomittheGASsectorandincorporatefixedeffectsforSouthAfrica.GASisanoutlierthatskewsresultsbadlybecauseitsweight/valueratioandtransportmodalusearepoorlymeasured.FortechnicalreasonsnotedaboveSouthAfricaistreateddifferentlyinthemodelclosure,whichresultsinunrealisticmeasuresofcapitalgrowth.
31
transportemissionintensities.Tradegrowthinbothscenariosisfastestfortradeflowsthatoccur
overlongerdistances,anduseahighershareofaircargo,andinproductswithhigherweight/value
ratios.
ThetoprightpanelofTable7performsasimilarexerciseonoutputemissions.Foreachof
879origin‐productswegroupproductionintoquartilesbasedonoutputemissionintensities,and
regressoutputgrowthonthesequartiles.Fullliberalizationhasverylittleeffectinreorienting
outputgrowthtowardmoreorlessemissionintensiveproduction.However,GDPgrowthorients
outputgrowthtowardthosecountriesandproductswithhighoutputemissions.Thisisprimarily
theeffectofrapidGDPgrowthinChinaandIndia.Becausetheiroutputismoreemissionintensive
(inthefourthquartileofintensities),morerapidGDPgrowthinthosecountrieswillpushoverall
emissionshigher.
VI. ConclusionsandImplications
Mostoftheworkontradeandclimatechangehasignoredinternationaltransportation,or
considereditinthecontextofcasestudies.Thisneglectisdueinparttoalackofdata,andinpart
tothebeliefthatinternationaltransportationrepresentsasmallportionofoverallemissions.
Inthispaperwecombineddataontrade,transportationmodes,transportemissions,andoutput
emissionstocalculatethecontributionoftransportationtotrade‐relatedgreenhousegasemissions
intheaggregateandforalltradeflowsworld‐wide.Whileinternationaltransportationisasmall
fractionofoverallemissionsitisasurprisinglylargefractionoftrade‐relatedemissions.Two‐
thirdsoftrade‐relatedemissionsinUSexportsareduetointernationaltransportation,andworld‐
wideover75percentofthetrade‐relatedemissionsoftransportequipment,electronicequipment,
machinery,andmanufacturesneccomefromtransportation.
Weusedourdatatosystematicallyevaluatewhetherincreasingtradecouldbeemission
reducing.Ifacountryhasveryhighoutputemissions,andtransportsgoodsefficiently,importing
32
thegoodfromalowemissionproducercanreduceemissions.Wefindthatinonequarterof
possibleproductionreallocations,tradecanreduceemissions.Emissionreducingtradesaremore
likelytooccurinagricultureandminingsectorswhilereducingemissionsthroughtrading
manufacturesisrelativelydifficult.
Thesereallocationsaresimplepartialequilibriumchangesanddonotaddresswhether
suchareallocationwouldbefeasibleorlikely.Toexaminelikelychangeswecombinedourdata
withaseriesoftradegrowthsimulationsdesignedtoilluminatetheroleoftariffliberalizationand
GDPgrowth.Tariffliberalizationundoestariffpreferencesthatfavorproximateandland‐adjacent
partnerswhouserailandroadtransportandmovegoodsshortdistances.Thisresultsinashiftin
tradetowarddistantpartners,amoreintensiveuseofaircargo,andtransportemissionsgrowth
thatismorerapidthantradegrowth.Theshareoftransportintrade‐relatedemissionsrises,
reversingadownwardtrendcreatedbypreferentialtradeagreements.However,thesechangesare
smallrelativetothosecausedbyGDPgrowthinChinaandIndia.Weprojecttransportemissions
risingat5percentayearaseconomicgrowthinthesecountriessignificantlyincreasesthedistance
oftrade.
Aclearimplicationofourcalculationsisthatproductionandtransportationemissions
shouldbeconsideredwhenevaluatingpolicychangesdesignedtocurtailemissions.Many
exportersandproductsthatlookrelatively“clean”whenwefocusonlyonoutputemissionsarein
factheavyemittersonceincorporatingtransportation.Insomecountriestheimpactofmitigation
willbefeltmostacutelyontheproductionside,whereasincountriesliketheUS,themaineffect
willprimarilybeontransport.
Therearealsosignificantimplicationsformechanismdesign,specifically,howtotreatthe
internationaltransportsectorwithintheglobalframeworkforemissions.Doesinternational
transport“belong”totheexporter,totheimporter,orshoulditbetreatedasaseparatelycapped
sector,inessenceacountryuntoitself?GiventheimbalanceintransportemissionstheUSwould
33
muchpreferanimportbasedallocationratherthananexportbasedallocation,whileEastAsian
countrieswouldprefertheopposite.Weretransporttreatedasaseparatelycapped“country”the
higherrateoftransportservicesgrowth(andthedifferencesingrowthratesacrossmodes)would
yieldpotentiallylargedistortionaryeffectsontradeascapsbindfasterontransportthanonoutput.
Finally,ourtradeandemissionsgrowthcalculationstakethetransportsectorasgivenandassuch
abstractfromimportantsubstitutionmargins.Weassumeawaychangesinmodalusagewithina
particulartradeflowovertime,anddonotallowfortechnologicalchangeinemissionintensities
dueeithertoinnovationortoupdatingthevintageofthetransportationfleetcapitalstock.
Includingtheseadditionalmarginsofresponseisbeyondthescopeofthecurrentstudy,butin
futureworkthiscouldbeusefulforunderstandinginteractionsbetweentrade,transportationand
emissions.Inparticular,themuchhigherfuelintensityofaircargo,anditsassociatedCO2
emissions,suggeststhatclimatemitigationpoliciescouldhavepronouncedeffectsonhowgoods
moveandthekindsofgoodsthatnationstrade.Thisisespeciallyimportantforcountrieslikethe
US,whoserelianceonaircargoresultsinunusuallyhightransportationemissions.
References
AircraftEconomics,1999.FreighterCostComparisons.AircraftEconomics,45,50‐56.
Ahuja,V.andFilmer,D.,1995.“EducationalAttainmentinDevelopingCountries;NewEstimatesandprojectionsDisaggregatedbyGender,”WorldBankPolicyResearchWorkingPaper1489.
Babiker,M.,2005.ClimateChangePolicy,MarketStructureandCarbonLeakage.JournalofInternationalEconomics,65(2),421‐445.
Berthelon,M.,andFreund,C.,2008.“OntheConservationofDistanceinInternationalTrade”.
JournalofInternationalEconomics,75,310‐20.
Cadarso,M.‐A.,Lopez,L.‐A.,Gomez,N.,Tobarra,M.‐A.,2010.CO2EmissionsofInternationalFreightTransportandOffshoring:MeasurementandAllocation.EcologicalEconomics69,1682‐1694.
CaliforniaClimateChange2006.ComparingEnergyOptions.
Canals,L.M.,Cowell,S.J.,Sims,S.andBesson,L.,2007.ComparingDomesticversusImported
34
Apples:AfocusonEnergyUse.EnvironmentalScienceandPollutionResearch,14(5),
338‐344.
Carlsson‐Kanyama,A.,PippingEkstrom,M.andShanahan,H.,2003.Foodandlifecycleenergy
inputs:consequencesofdietandwaystoincreaseefficiency.EcologicalEconomics,44,
293‐307.
Copeland,B.R.andTaylor,M.S.,2004.Trade,Growth,andtheEnvironment.JournalofEconomicLiterature42(1),7‐71.
CPB,1999.“WorldScan:theCoreVersion,”CPBNetherlandsBureauforEconomicPolicyAnalysis.
De,Prabir,2007.FacilitatingOverlandTradeinSouthAsia.mimeo.
Disdier,A.C.andHead,K.,2008.“ThePuzzlingPersistenceoftheDistanceEffectonBilateral
Trade”.TheReviewofEconomicsandStatistics,90(1),37‐41.
Ederington,J.andMinier,J.,2003.Isenvironmentalpolicyasecondarytradebarrier?Anempiricalanalysis.CanadianJournalofEconomics,36(1),137‐155.
EEA.2007.“EMEP/CORINAIREmissionInventoryGuidebook”,Group8.
Giannouli,M.,andMellios,G.,2005.OverallEnergyEfficiencyandspecificCO2emissionsforpassengerandfreighttransport.EuropeanEnvironmentalAgency,TERM200527EEA32.
Grether,J.‐M.,Mathys,N.A.,deMelo,J.,2010.GlobalManufacturingSO2Emissions:DoesTradeMatter?.ReviewofWorldEconomics145(4),713‐729.
Hertel,T.andTsigas,M.,1997.TheStructureofGTAP.GTAPWorkingPaper413.
Hummels,D.L.,2009.“GlobalizationandTransportCosts”.StudyPreparedforOECDInternationalTransportationForumMeetings.
Hummels,D.L.andSchaurG.,2011.“TimeasaTradeBarrier”.Mimeo.
InternationalTransportForum,2010.TransportGreenhouseGasEmissions2010.ITF/OECD.
InternationalEnergyAgency,2010.Co2EmissionsfromFuelCombustion2010.IEA/OECD.
IPCC/OECD/IEA.1997.Revised1996IPCCGuidelinesforNationalGreenhouseGasInventories.Paris:IntergovernmentalPanelonClimateChange(IPCC),OrganizationforEconomicCo‐operationandDevelopment(OECD),InternationalEnergyAgency(IEA).
Jones,A.,2006.AlifecycleanalysisofUKsupermarketimportedgreenbeansfromKenya.FreshInsightsNo.4.InternationalInstituteforEnvironmentandDevelopment,London,UnitedKingdom.
Kristensen,H.O.,2006.CargoTransportbySeaandRoad–TechnicalandEnvironmentalFactors.NavalEngineersJournal,118,115‐129.
35
Lee,H.‐L.,2008.TheCombustion‐basedCO2EmissionsDataforGTAPversion7DataBase.GTAPWorkingPaper4470.
Levinson,A.,2009.Technology,InternationalTradeandPollutionfromUSManufacturing.AmericanEconomicReview,99(5),2177‐2192.
Levinson,A.andTaylor,M.,2008.UnmaskingthePollutionHavenEffect.InternationalEconomicReview,49(1),223‐253.
MaerskLine,2007.ConstantCarefortheEnvironment.
MiljøstyrelsenMiljøministeriet(DanishEnvironmentalProtectionAgency,DanishMinistryfortheEnvironment),2003.“GreenhouseGasEmissionsfromInternationalAviationandAllocationOptions”.URL:http://www2.mst.dk/common/Udgivramme/Frame.asp?http://www2.mst.dk/udgiv/publications/2003/87‐7972‐489‐2/html/helepubl_eng.htm.
Minor,P.,2006.ProjectedImpactsoftheDohaDevelopmentRoundonEgypt’sTradeandProduction.GTAPWorkingPaper3363.
NationalTechnicalUniversityofAthensLaboratoryforMaritimeTransport,2008.ShipEmissionsStudy.
Olivier,J.,Peters,J.,1999.Internationalmarineandaviationbunkerfuel:trends,rankingofcountriesandcomparisonwithnationalCO2emissions.RIVMreport773301002.NationalInstituteofPublicHealthandtheEnvironment(RIVM),TheNetherlands.
URL:http://www.rivm.nl/bibliotheek/rapporten/773301002.pdf
Peters,G.P.,Hertwich,E.G.,2008.CO2EmbodiedinInternationalTradewithImplicationsforGlobalClimatePolicy.EnvironmentalScienceandTechnology42(5),1401‐1407.
Rose,S.,Avetisyan,M.andHertel,T.,2010.DevelopmentofthePreliminaryVersion7Non‐CO2GHGEmissionsDataset.GTAPWorkingPaper4618.
Sim,S.,Barry,M.,Clift,R.andCowell,S.,2007.Therelativeimportanceoftransportindetermininganappropriatesustainabilitystrategyforfoodsourcing.Acasestudyoffreshproducesupplychains.InternationalJournalofLifeCycleAssessment,12,422‐431.
TransportationResearchBoard,2009.“GuidebookonPreparingAirportGreenhouseGasEmissionsInventories”.ResearchsponsoredbytheFederalAviationAdministration.
USEPA,2006.GlobalEmissionsofNon‐CO2GreenhouseGases:1990‐2020.UnitedStatesEnvironmentalProtectionAgency(US‐EPA),Washington,D.C.,EPAReport430‐R‐06‐003.
VanVeen‐Groot,D.,Nijkamp,P.,1999.Globalization,transportandtheenvironment:newperspectivesforecologicaleconomics.EcologicalEconomics31,331–346.
Walmsley,T.,2006.ABaselineScenariofortheDynamicGTAPModel.GTAPWorkingPaper2854.
Williams,A.,2007.ComparativestudyofcutrosesfortheBritishmarketproducedinKenyaandtheNetherlands.PrécisReportforWorldFlowers,February.
WorldBank,2005.GlobalEconomicProspects2005.
36
Appendix1:ModelAggregation
RegionAggregation:Webeginwith113constituentcountries/regionsavailableintheGTAP
database,thenaggregateintothe40“regions”listedinbold.Someregionsaresinglecountriesand
othersareaggregationsofthe87constituentcountriesavailableintheGTAPdatabase.
NorthAmerica:(2regions)Canada,UnitedStates
CentralAmerica:(2regions)Mexico,OtherCentralAmericaandCaribbean(CentralAmerica,
RestofFTAA,RestofCaribbean)
SouthAmerica:(4regions)Argentina,Brazil,Chile,RestofSouthAmerica(Colombia,Peru,
Uruguay,Venezuela,RestofAndeanPact,RestofSouthAmerica)
Europe:(18regions)Austria,Belgium‐Luxemburg,Denmark,Finland,France,Germany,
Greece,Ireland,Italy,Netherlands,Portugal,Spain,Sweden,UnitedKingdom,Russia,Restof
EuropeanUnion(Cyprus,CzechRepublic,Estonia,Hungary,Latvia,Lithuania,Malta,Poland,
Slovakia,Slovenia,Bulgaria,Romania),OtherEurope–EFTA(Switzerland,Iceland,Liechtenstein,
Norway),OtherCEEandOtherCIS(Albania,Croatia,Turkey,RestofFormerSovietUnion)
SouthAsia:(2regions)India,OtherSouthAsia(Bangladesh,SriLanka,Afghanistan,Restof
SouthAsia)
EastAsia(8regions)Japan,Korea,Singapore,Malaysia‐Indonesia,China‐HongHong,
Taiwan,OtherEastAsia(NorthKorea,Macau,Mongolia),OtherSouthEastAsia(Philippines,
Thailand,Vietnam,RestofSoutheastAsia)
MiddleEast/Africa:(3regions)SouthAfrica,MiddleEastandNorthAfrica(MiddleEast,
Morocco,Tunisia,RestofNorthAfrica),Sub‐SaharanAfrica(Botswana,Malawi,Mozambique,
Tanzania,Zambia,Zimbabwe,Madagascar,Uganda,RestofSouthAfricanCustomsUnion,Restof
SouthernAfricanDevelopmentCommunity,RestofSub‐SaharanAfrica)
OceaniaCountries(1region):(Australia,NewZealand,RestofOceania)
SectoralAggregation.GTAPprovidesdataon57sectors.Weaggregatetheseto27sectors,and
focuson23tradablesectorsdescribedinTableA1below.Manufacturingandminingsectorsare
analyzedusingthesamelevelofdetailasintheGTAPdata.Agriculturalsectorsareaggregatedas
follows.
BulkAgriculture(Paddyrice;Wheat;Cerealgrainsnec;Oilseeds;Sugarcane,sugarbeet;Plant‐
basedfibers;Cropsnec);
ProcessedAgriculture(Vegetables,fruit,nuts;Bovinecattle,sheepandgoats,horses;Animal
productsnec;Rawmilk;Wool,silk‐wormcocoons;Bovinemeatproducts;Meatproductsnec;
37
Vegetableoilsandfats;Dairyproducts;Processedrice;Sugar;Foodproductsnec;Beveragesand
tobaccoproducts);
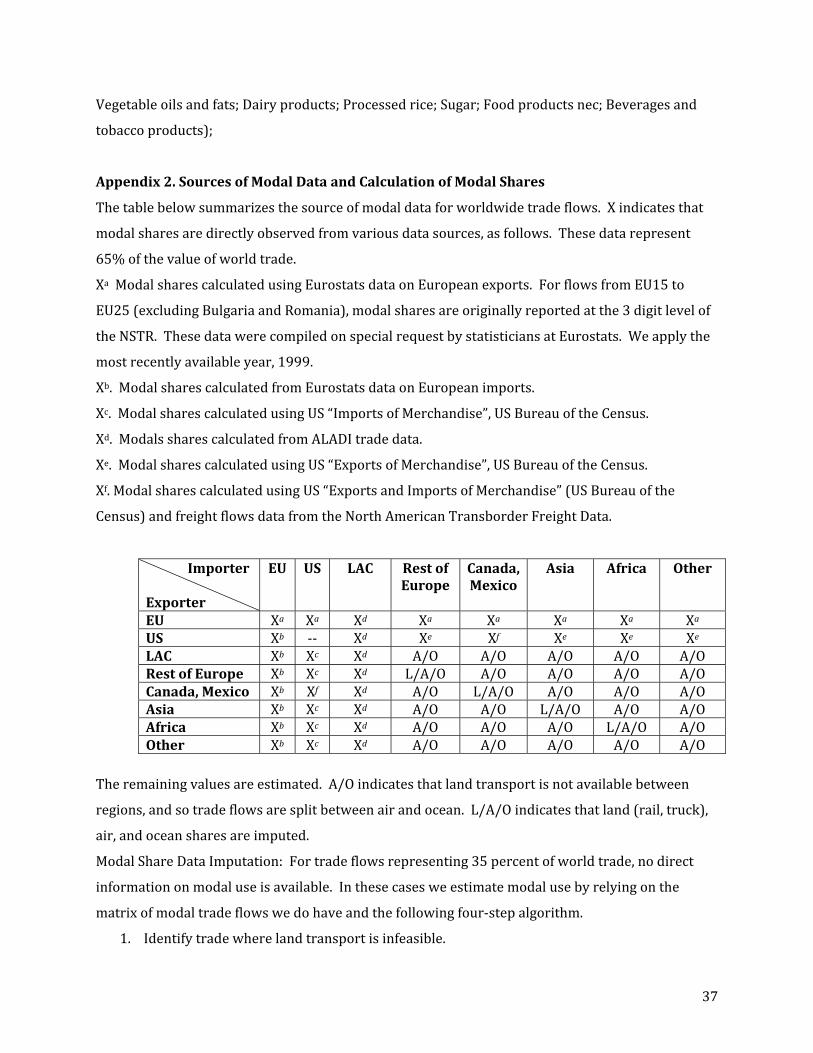
Appendix2.SourcesofModalDataandCalculationofModalShares
Thetablebelowsummarizesthesourceofmodaldataforworldwidetradeflows.Xindicatesthat
modalsharesaredirectlyobservedfromvariousdatasources,asfollows.Thesedatarepresent
65%ofthevalueofworldtrade.
XaModalsharescalculatedusingEurostatsdataonEuropeanexports.ForflowsfromEU15to
EU25(excludingBulgariaandRomania),modalsharesareoriginallyreportedatthe3digitlevelof
theNSTR.ThesedatawerecompiledonspecialrequestbystatisticiansatEurostats.Weapplythe
mostrecentlyavailableyear,1999.
Xb.ModalsharescalculatedfromEurostatsdataonEuropeanimports.
Xc.ModalsharescalculatedusingUS“ImportsofMerchandise”,USBureauoftheCensus.
Xd.ModalssharescalculatedfromALADItradedata.
Xe.ModalsharescalculatedusingUS“ExportsofMerchandise”,USBureauoftheCensus.
Xf.ModalsharescalculatedusingUS“ExportsandImportsofMerchandise”(USBureauofthe
Census)andfreightflowsdatafromtheNorthAmericanTransborderFreightData.
ImporterExporter
EU US LAC RestofEurope
Canada,Mexico
Asia Africa Other
EU Xa Xa Xd Xa Xa Xa Xa XaUS Xb ‐‐ Xd Xe Xf Xe Xe XeLAC Xb Xc Xd A/O A/O A/O A/O A/ORestofEurope Xb Xc Xd L/A/O A/O A/O A/O A/OCanada,Mexico Xb Xf Xd A/O L/A/O A/O A/O A/OAsia Xb Xc Xd A/O A/O L/A/O A/O A/OAfrica Xb Xc Xd A/O A/O A/O L/A/O A/OOther Xb Xc Xd A/O A/O A/O A/O A/O
Theremainingvaluesareestimated.A/Oindicatesthatlandtransportisnotavailablebetween
regions,andsotradeflowsaresplitbetweenairandocean.L/A/Oindicatesthatland(rail,truck),
air,andoceansharesareimputed.
ModalShareDataImputation:Fortradeflowsrepresenting35percentofworldtrade,nodirect
informationonmodaluseisavailable.Inthesecasesweestimatemodalusebyrelyingonthe
matrixofmodaltradeflowswedohaveandthefollowingfour‐stepalgorithm.
1. Identifytradewherelandtransportisinfeasible.
38
Ifano‐dcountrypairisnotonthesamecontinent,oradestinationcouldnotreasonablybereached
bylandtransport,railandroadsharesaresettozero.(Thatis,JapanispartofAsia,butlacksaland
bridgesoitsrailandroadsharesarezero.).Ofthe35percentofworldtradenotcoveredbyour
explicitmodalsharedata,33percenthavenoland‐basedtrade.Forthesecases,skiptostepthree.
2. Estimatetheshareoftradethatmovesbyland.
Forthe2percentofworldtradewithoutmodaldata,andwherelandtransportisanoption,we
proceedonacasebycasebasis.ForEuropeancountrypairsnotcoveredexplicitlybytheEUdata,
weestimateamodalsharemodelwithfirsttherailshareoftradeandthentheroadshareasa
dependentvariable.Regressorsincludefixedeffectsfororigin,destination,andGTAPsector,the
distancebetweencountries,adummyforland‐adjacency,andtheweight/valueratioofthe
exporter‐sector.ThesampleemployedistheEUdataforwhichwedohavemodalinformation–
recallthatalltheEU27countriesreporttheirimportsfromallEuropeancountriesandtheir
exportstoallEuropeancountries.Wethenuseoutofsamplepredictiontogeneratemodalsplits
fortheremainingcountries.Thisallowsustoestimate,forexample,theshareofrailinRussian
exportsofcoalbycalculatingRussia’sconditionalaverageshareofrailtotheEU27countries(the
originfixedeffect),theweight/valueofRussiancoal,andthedistancetoeachmarket.
Thisleavesintra‐continentaltradewithinAfricaandland‐adjacentAsiancountries,roughly1.8
percentofworldtradebyvalue.ForAsiaweusecalculationsbyPrabirDe(2007)thatreportthe
modalsharesofIndiantradewithitsland‐adjacentneighbors,summedoverallproductsand
partners.Thesesharesdonotvaryoversectors.Forintra‐Africantrade(avanishinglysmallshare
ofworldtrade)wecouldfindnodataonmodalsharesandsoimposedroadsharesof75percent
andrailsharesof0.
3. Splitthe(air+ocean)share
Recallthatinalmostallcases(33percentofthe35percentoftradewithnodata),theocean+air
shareis100%.Intheremaining2percentofcaseswesplitairv.oceanforthetradethatisleftover
aftersubtractingoffthesharesoftradegoingtorailandroadtransport.
Weestimateamodelwherethedependentvariableistheratioofair/oceanandtheregressors
includetheweight/valueratiooftheexporter‐product,distancebetweenmarkets,whetherthey
areland‐adjacentandvectorsoffixedeffectsbyorigin,destination,andGTAPsector.Theseorigin
anddestinationfixedeffectscaptureallmarketcharacteristicssuchaslevelofdevelopment,and
qualityandcompositionofinfrastructurethatstronglyaffectthismodalsplit.Theproductfixed
effectsabsorbfactorsthatexplainmodalusesuchasbulk,spoilage,theneedforspecialpacking,
andtimelydelivery.Again,theestimationsampleincludestheEU,US,andALADIdataforwhichwe
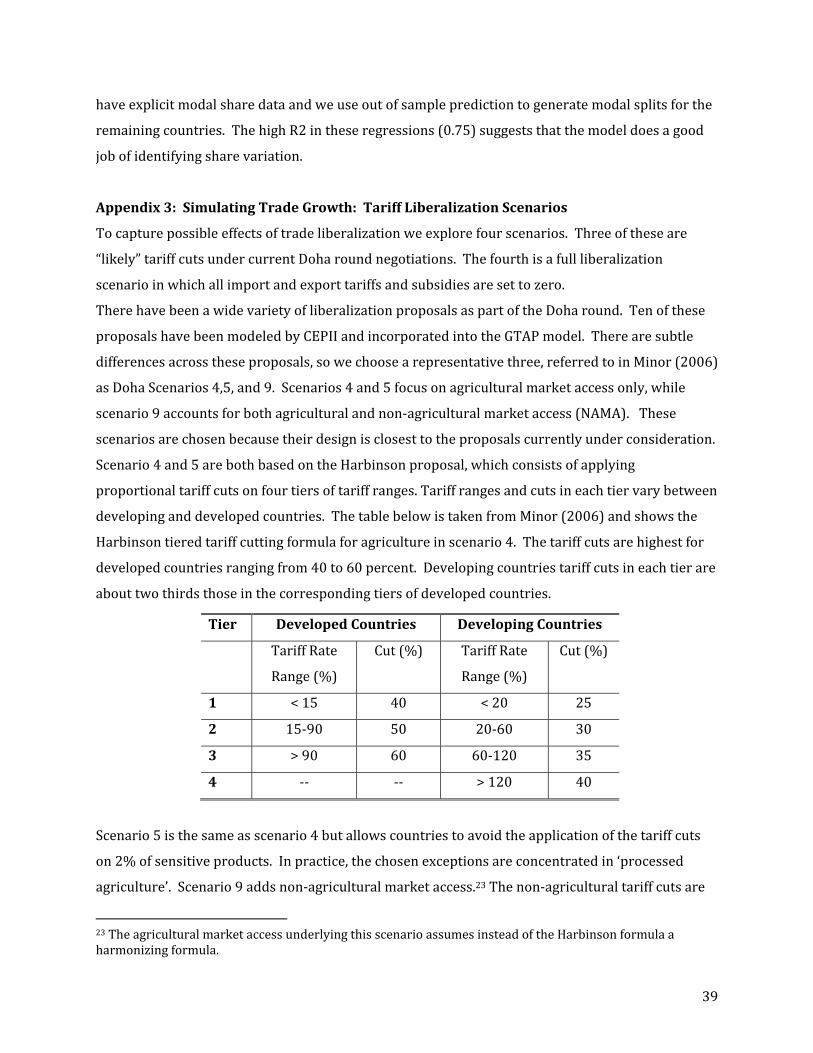
39
haveexplicitmodalsharedataandweuseoutofsamplepredictiontogeneratemodalsplitsforthe
remainingcountries.ThehighR2intheseregressions(0.75)suggeststhatthemodeldoesagood
jobofidentifyingsharevariation.
Appendix3:SimulatingTradeGrowth:TariffLiberalizationScenarios
Tocapturepossibleeffectsoftradeliberalizationweexplorefourscenarios.Threeoftheseare
“likely”tariffcutsundercurrentDoharoundnegotiations.Thefourthisafullliberalization
scenarioinwhichallimportandexporttariffsandsubsidiesaresettozero.
TherehavebeenawidevarietyofliberalizationproposalsaspartoftheDoharound.Tenofthese
proposalshavebeenmodeledbyCEPIIandincorporatedintotheGTAPmodel.Therearesubtle
differencesacrosstheseproposals,sowechoosearepresentativethree,referredtoinMinor(2006)
asDohaScenarios4,5,and9.Scenarios4and5focusonagriculturalmarketaccessonly,while
scenario9accountsforbothagriculturalandnon‐agriculturalmarketaccess(NAMA).These
scenariosarechosenbecausetheirdesignisclosesttotheproposalscurrentlyunderconsideration.
Scenario4and5arebothbasedontheHarbinsonproposal,whichconsistsofapplying
proportionaltariffcutsonfourtiersoftariffranges.Tariffrangesandcutsineachtiervarybetween
developinganddevelopedcountries.ThetablebelowistakenfromMinor(2006)andshowsthe
Harbinsontieredtariffcuttingformulaforagricultureinscenario4.Thetariffcutsarehighestfor
developedcountriesrangingfrom40to60percent.Developingcountriestariffcutsineachtierare
abouttwothirdsthoseinthecorrespondingtiersofdevelopedcountries.
Scenario5isthesameasscenario4butallowscountriestoavoidtheapplicationofthetariffcuts
on2%ofsensitiveproducts.Inpractice,thechosenexceptionsareconcentratedin‘processed
agriculture’.Scenario9addsnon‐agriculturalmarketaccess.23Thenon‐agriculturaltariffcutsare
23TheagriculturalmarketaccessunderlyingthisscenarioassumesinsteadoftheHarbinsonformulaaharmonizingformula.
Tier DevelopedCountries DevelopingCountries
TariffRate
Range(%)
Cut(%) TariffRate
Range(%)
Cut(%)
1 <15 40 <20 25
2 15‐90 50 20‐60 30
3 >90 60 60‐120 35
4 ‐‐ ‐‐ >120 40
40
non‐proportional,sothatpeaktariffsarereducedmorethanlowertariffs.Non‐lineartariffcuts
formulasareusuallyreferredasSwiss‐type.WhiletheadoptionofSwiss‐typeformulaonnon‐
agriculturalproductsisagreedamongnegotiatorstheexacttypeisnot.Ourscenarioassumesthe
Girard(WTO03‐4322)formula:
WhereT1isthenewboundtariffrate,Bisthecoefficienttobedeterminedforreductions,T0isthe
baseboundrate,andTaistheaverageofbaseboundratesforNAMAproducts.Bisequalto1for
developedcountriesand2fordevelopingcountries.
01
0
a
a
B T TT
B T T
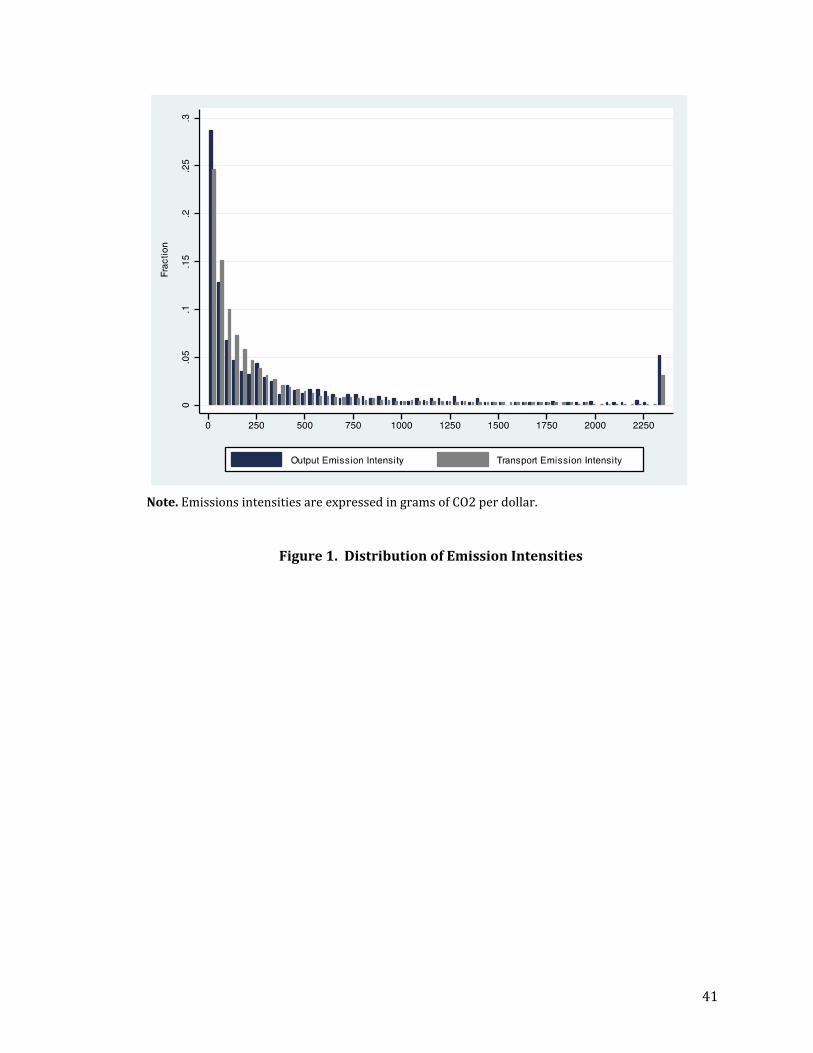
41
Note.EmissionsintensitiesareexpressedingramsofCO2perdollar.
Figure1.DistributionofEmissionIntensities
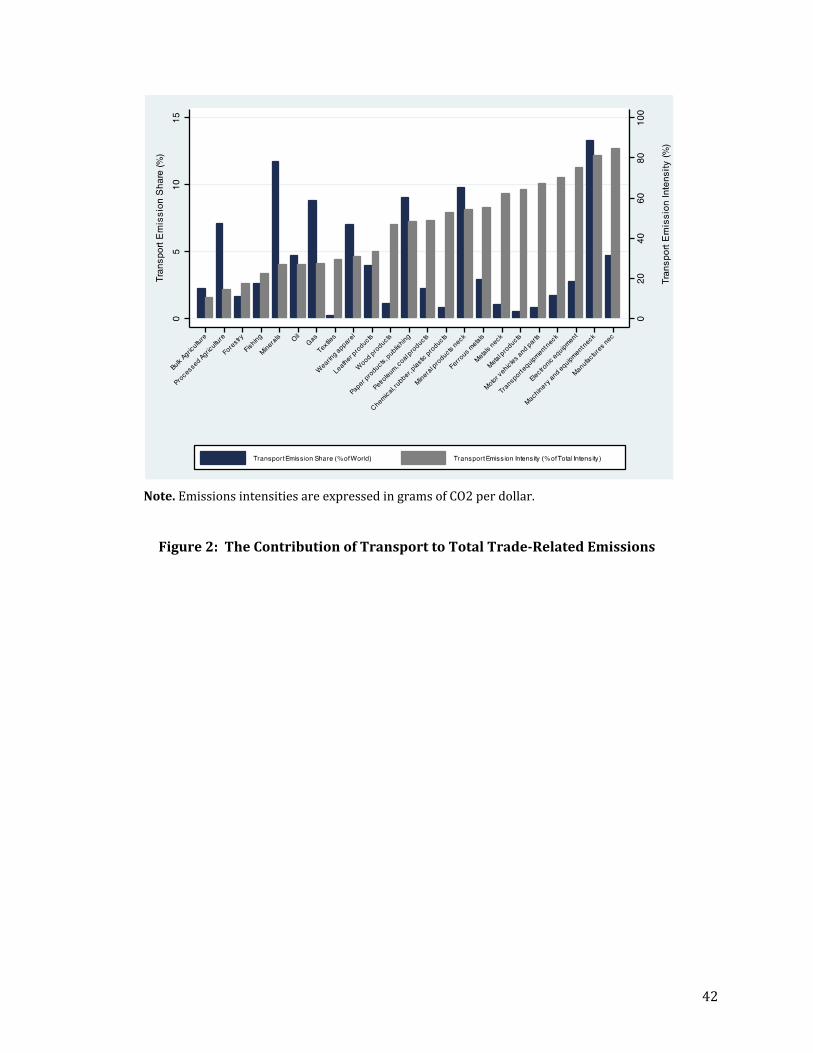
42
Note.EmissionsintensitiesareexpressedingramsofCO2perdollar.Figure2:TheContributionofTransporttoTotalTrade‐RelatedEmissions
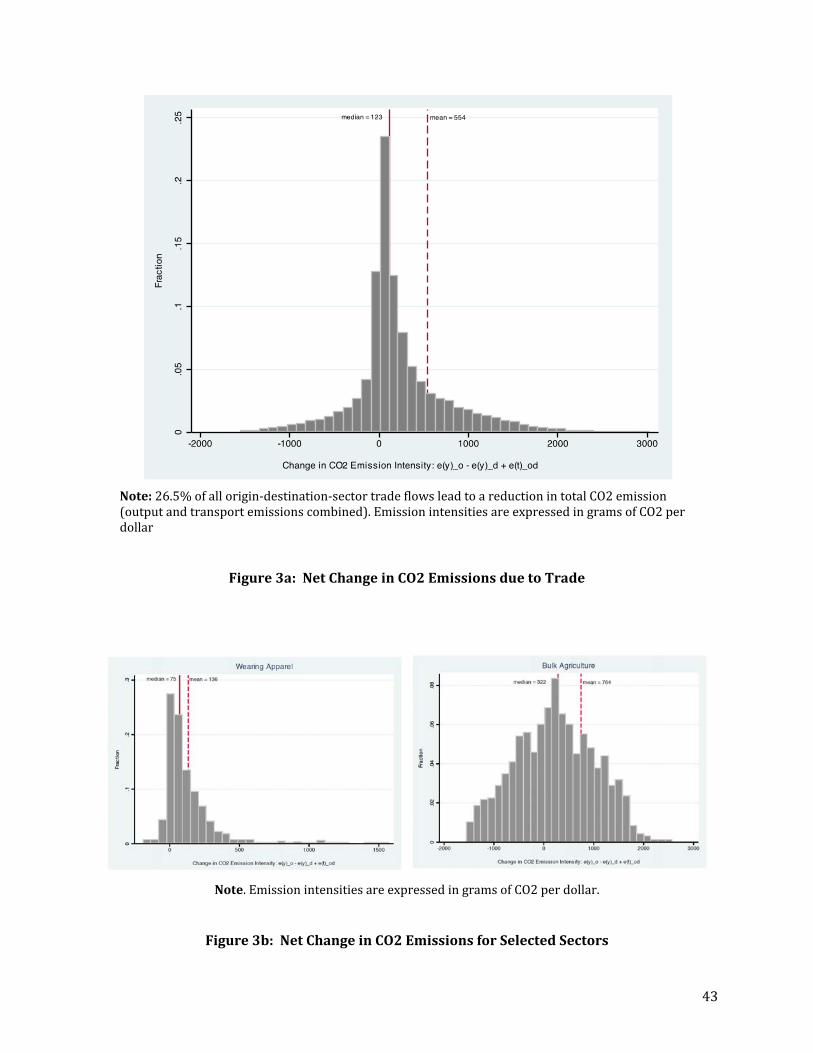
43
Note:26.5%ofallorigin‐destination‐sectortradeflowsleadtoareductionintotalCO2emission(outputandtransportemissionscombined).EmissionintensitiesareexpressedingramsofCO2perdollar
Figure3a:NetChangeinCO2EmissionsduetoTrade
Note.EmissionintensitiesareexpressedingramsofCO2perdollar.
Figure3b:NetChangeinCO2EmissionsforSelectedSectors
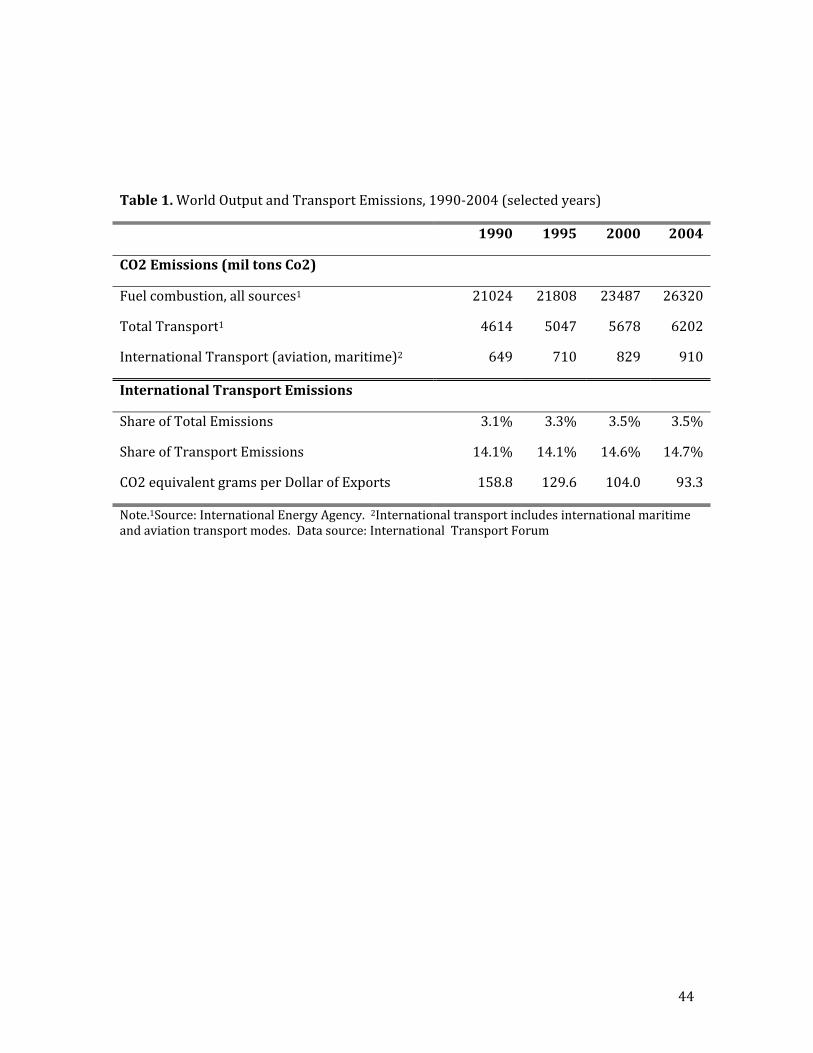
44
Table1.WorldOutputandTransportEmissions,1990‐2004(selectedyears)
1990 1995 2000 2004
CO2Emissions(miltonsCo2)
Fuelcombustion,allsources1 21024 21808 23487 26320
TotalTransport1 4614 5047 5678 6202
InternationalTransport(aviation,maritime)2 649 710 829 910
InternationalTransportEmissions
ShareofTotalEmissions 3.1% 3.3% 3.5% 3.5%
ShareofTransportEmissions 14.1% 14.1% 14.6% 14.7%
CO2equivalentgramsperDollarofExports 158.8 129.6 104.0 93.3
Note.1Source:InternationalEnergyAgency.2Internationaltransportincludesinternationalmaritimeandaviationtransportmodes.Datasource:InternationalTransportForum
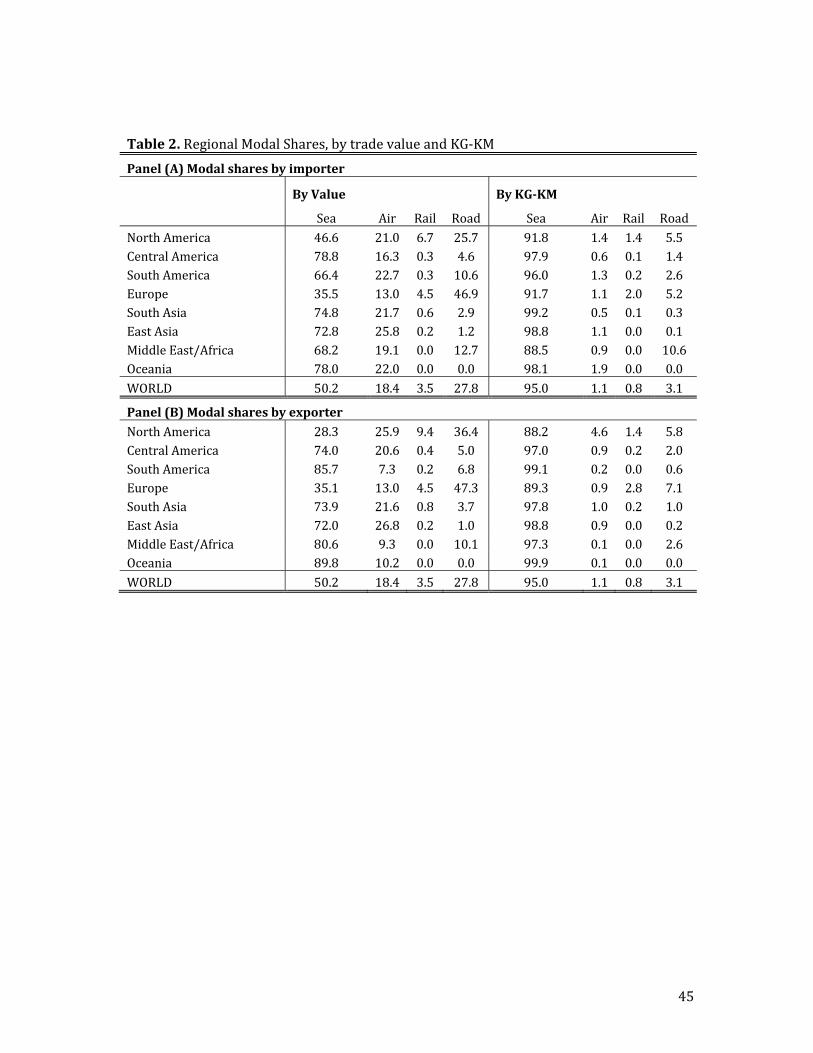
45
Table2.RegionalModalShares,bytradevalueandKG‐KM
Panel(A)Modalsharesbyimporter
ByValue ByKG‐KM
Sea Air Rail Road Sea Air Rail RoadNorthAmerica 46.6 21.0 6.7 25.7 91.8 1.4 1.4 5.5CentralAmerica 78.8 16.3 0.3 4.6 97.9 0.6 0.1 1.4SouthAmerica 66.4 22.7 0.3 10.6 96.0 1.3 0.2 2.6Europe 35.5 13.0 4.5 46.9 91.7 1.1 2.0 5.2SouthAsia 74.8 21.7 0.6 2.9 99.2 0.5 0.1 0.3EastAsia 72.8 25.8 0.2 1.2 98.8 1.1 0.0 0.1MiddleEast/Africa 68.2 19.1 0.0 12.7 88.5 0.9 0.0 10.6Oceania 78.0 22.0 0.0 0.0 98.1 1.9 0.0 0.0WORLD 50.2 18.4 3.5 27.8 95.0 1.1 0.8 3.1
Panel(B)ModalsharesbyexporterNorthAmerica 28.3 25.9 9.4 36.4 88.2 4.6 1.4 5.8CentralAmerica 74.0 20.6 0.4 5.0 97.0 0.9 0.2 2.0SouthAmerica 85.7 7.3 0.2 6.8 99.1 0.2 0.0 0.6Europe 35.1 13.0 4.5 47.3 89.3 0.9 2.8 7.1SouthAsia 73.9 21.6 0.8 3.7 97.8 1.0 0.2 1.0EastAsia 72.0 26.8 0.2 1.0 98.8 0.9 0.0 0.2MiddleEast/Africa 80.6 9.3 0.0 10.1 97.3 0.1 0.0 2.6Oceania 89.8 10.2 0.0 0.0 99.9 0.1 0.0 0.0WORLD 50.2 18.4 3.5 27.8 95.0 1.1 0.8 3.1
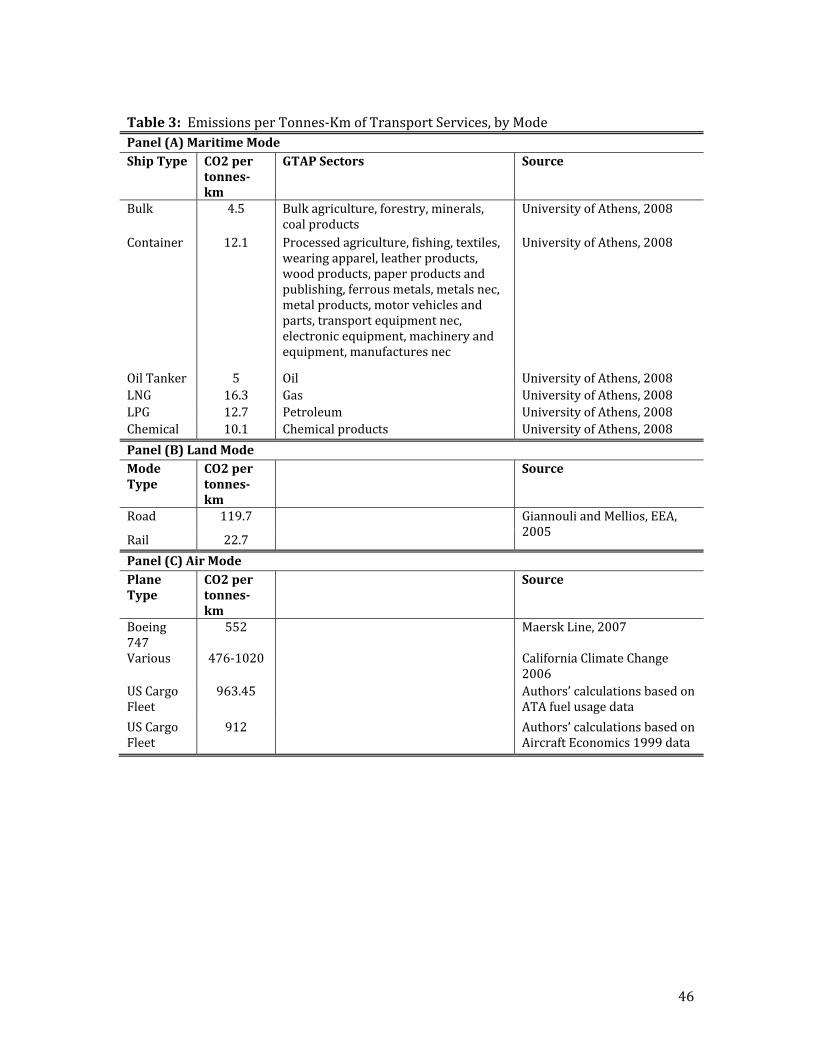
46
Table3:EmissionsperTonnes‐KmofTransportServices,byModePanel(A)MaritimeModeShipType CO2per
tonnes‐km
GTAPSectors Source
Bulk 4.5 Bulkagriculture,forestry,minerals,coalproducts
UniversityofAthens,2008
Container 12.1 Processedagriculture,fishing,textiles,wearingapparel,leatherproducts,woodproducts,paperproductsandpublishing,ferrousmetals,metalsnec,metalproducts,motorvehiclesandparts,transportequipmentnec,electronicequipment,machineryandequipment,manufacturesnec
UniversityofAthens,2008
OilTanker 5 Oil UniversityofAthens,2008LNG 16.3 Gas UniversityofAthens,2008LPG 12.7 Petroleum UniversityofAthens,2008Chemical 10.1 Chemicalproducts UniversityofAthens,2008
Panel(B)LandModeModeType
CO2pertonnes‐km
Source
Road 119.7 GiannouliandMellios,EEA,2005
Rail 22.7
Panel(C)AirModePlaneType
CO2pertonnes‐km
Source
Boeing747
552 MaerskLine,2007
Various 476‐1020 CaliforniaClimateChange2006
USCargoFleet
963.45 Authors’calculationsbasedonATAfuelusagedata
USCargoFleet
912 Authors’calculationsbasedonAircraftEconomics1999data
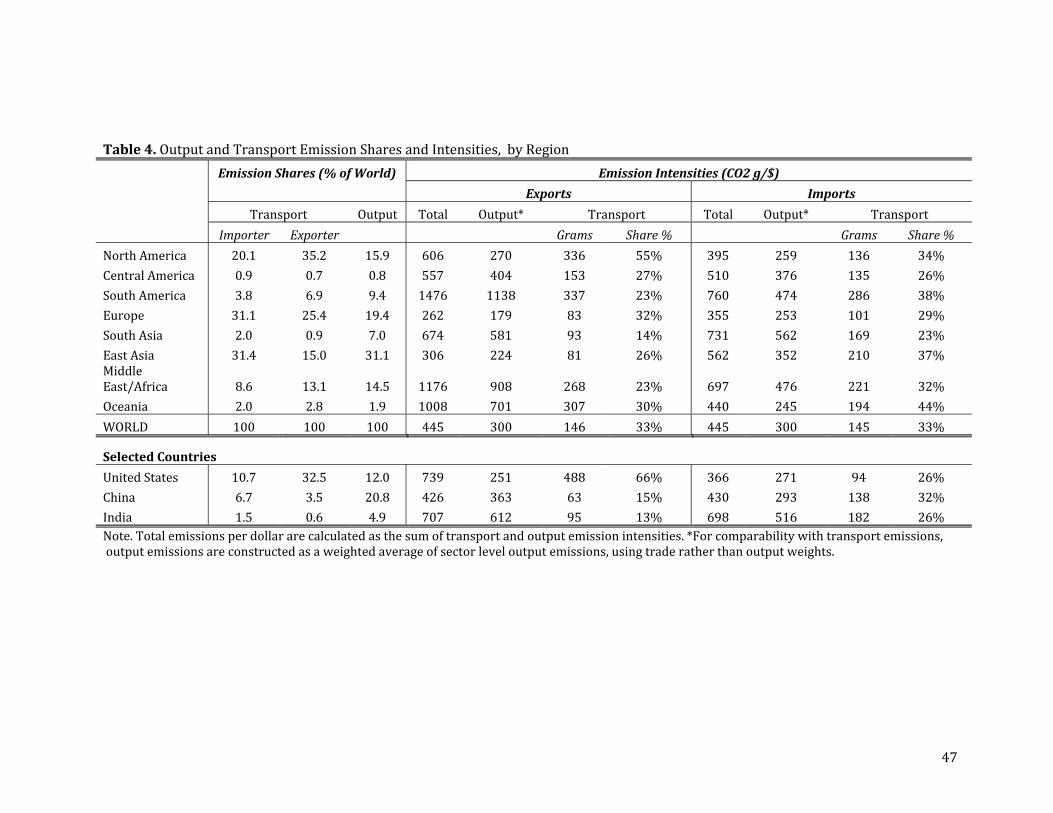
47
Table4.OutputandTransportEmissionSharesandIntensities,byRegion
EmissionShares(%ofWorld) EmissionIntensities(CO2g/$) Exports Imports Transport Output Total Output* Transport Total Output* Transport
Importer Exporter Grams Share% Grams Share%
NorthAmerica 20.1 35.2 15.9 606 270 336 55% 395 259 136 34%
CentralAmerica 0.9 0.7 0.8 557 404 153 27% 510 376 135 26%
SouthAmerica 3.8 6.9 9.4 1476 1138 337 23% 760 474 286 38%
Europe 31.1 25.4 19.4 262 179 83 32% 355 253 101 29%
SouthAsia 2.0 0.9 7.0 674 581 93 14% 731 562 169 23%
EastAsia 31.4 15.0 31.1 306 224 81 26% 562 352 210 37%MiddleEast/Africa 8.6 13.1 14.5 1176 908 268 23% 697 476 221 32%
Oceania 2.0 2.8 1.9 1008 701 307 30% 440 245 194 44%
WORLD 100 100 100 445 300 146 33% 445 300 145 33%
SelectedCountries
UnitedStates 10.7 32.5 12.0 739 251 488 66% 366 271 94 26%
China 6.7 3.5 20.8 426 363 63 15% 430 293 138 32%
India 1.5 0.6 4.9 707 612 95 13% 698 516 182 26%Note.Totalemissionsperdollararecalculatedasthesumoftransportandoutputemissionintensities.*Forcomparabilitywithtransportemissions,outputemissionsareconstructedasaweightedaverageofsectorleveloutputemissions,usingtraderatherthanoutputweights.
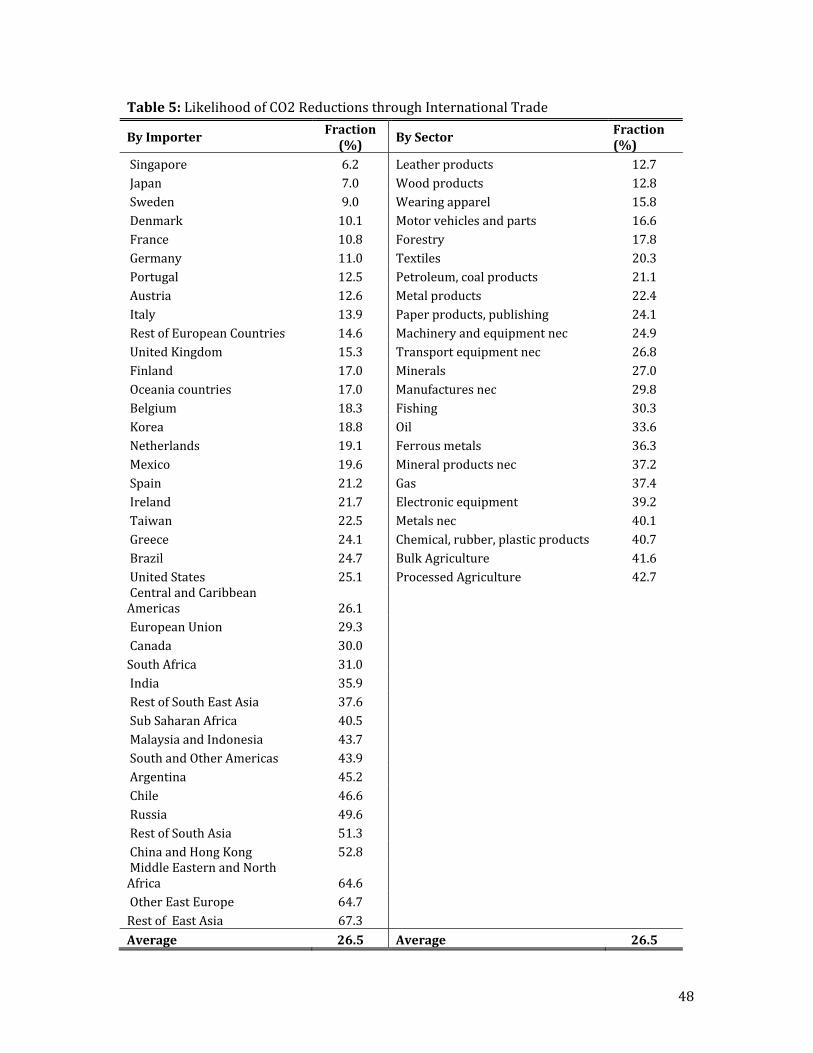
48
Table5:LikelihoodofCO2ReductionsthroughInternationalTrade
ByImporter Fraction(%)
BySector Fraction(%)
Singapore 6.2 Leatherproducts 12.7Japan 7.0 Woodproducts 12.8Sweden 9.0 Wearingapparel 15.8Denmark 10.1 Motorvehiclesandparts 16.6France 10.8 Forestry 17.8Germany 11.0 Textiles 20.3Portugal 12.5 Petroleum,coalproducts 21.1Austria 12.6 Metalproducts 22.4Italy 13.9 Paperproducts,publishing 24.1RestofEuropeanCountries 14.6 Machineryandequipmentnec 24.9UnitedKingdom 15.3 Transportequipmentnec 26.8Finland 17.0 Minerals 27.0Oceaniacountries 17.0 Manufacturesnec 29.8Belgium 18.3 Fishing 30.3Korea 18.8 Oil 33.6Netherlands 19.1 Ferrousmetals 36.3Mexico 19.6 Mineralproductsnec 37.2Spain 21.2 Gas 37.4Ireland 21.7 Electronicequipment 39.2Taiwan 22.5 Metalsnec 40.1Greece 24.1 Chemical,rubber,plasticproducts 40.7Brazil 24.7 BulkAgriculture 41.6UnitedStates 25.1 ProcessedAgriculture 42.7CentralandCaribbeanAmericas 26.1 EuropeanUnion 29.3 Canada 30.0 SouthAfrica 31.0 India 35.9 RestofSouthEastAsia 37.6 SubSaharanAfrica 40.5 MalaysiaandIndonesia 43.7 SouthandOtherAmericas 43.9 Argentina 45.2 Chile 46.6 Russia 49.6 RestofSouthAsia 51.3 ChinaandHongKong 52.8 MiddleEasternandNorthAfrica 64.6 OtherEastEurope 64.7 RestofEastAsia 67.3 Average 26.5 Average 26.5

49
Table6.WorldwideChangesinOutput,TradeandAssociatedEmissionsbyScenario
Full GDPgrowth2004‐2020 DohaS04 DohaS05 DohaS09 Liberalization PerAnnum Cummulative
%Change Output ‐0.09 ‐0.04 ‐0.22 ‐1.22 3.57 75.2Exports:
Value 0.07 ‐0.13 1.12 6.09 3.76 80.4Weight 0.24 ‐0.08 0.57 5.72 5.83 147.8Kg‐Km 0.46 ‐0.06 1.10 6.05 6.48 173.3
ModalUse(value) Sea 0.54 0.03 2.70 12.25 4.52 102.8Air ‐0.31 ‐0.34 1.78 7.41 3.82 82.1Rail ‐0.23 ‐0.23 ‐1.20 ‐3.72 2.88 57.6Road ‐0.50 ‐0.27 ‐1.85 ‐4.66 2.21 41.8
ModalUse(KG‐KM) Sea 0.51 ‐0.04 1.16 6.32 6.59 177.5Air ‐0.48 ‐0.44 3.60 13.14 4.93 116.1Rail ‐0.33 ‐0.60 ‐0.63 5.21 4.82 112.5Road ‐0.52 ‐0.27 ‐1.33 ‐4.73 3.69 78.7
CO2Emissions(%change) Output 0.84 0.42 0.92 0.41 4.50 102.2Transport:
HIGHScenario ‐0.06 ‐0.22 2.10 8.63 5.10 121.7LOWScenario 0.04 ‐0.16 1.72 7.51 5.14 123.1
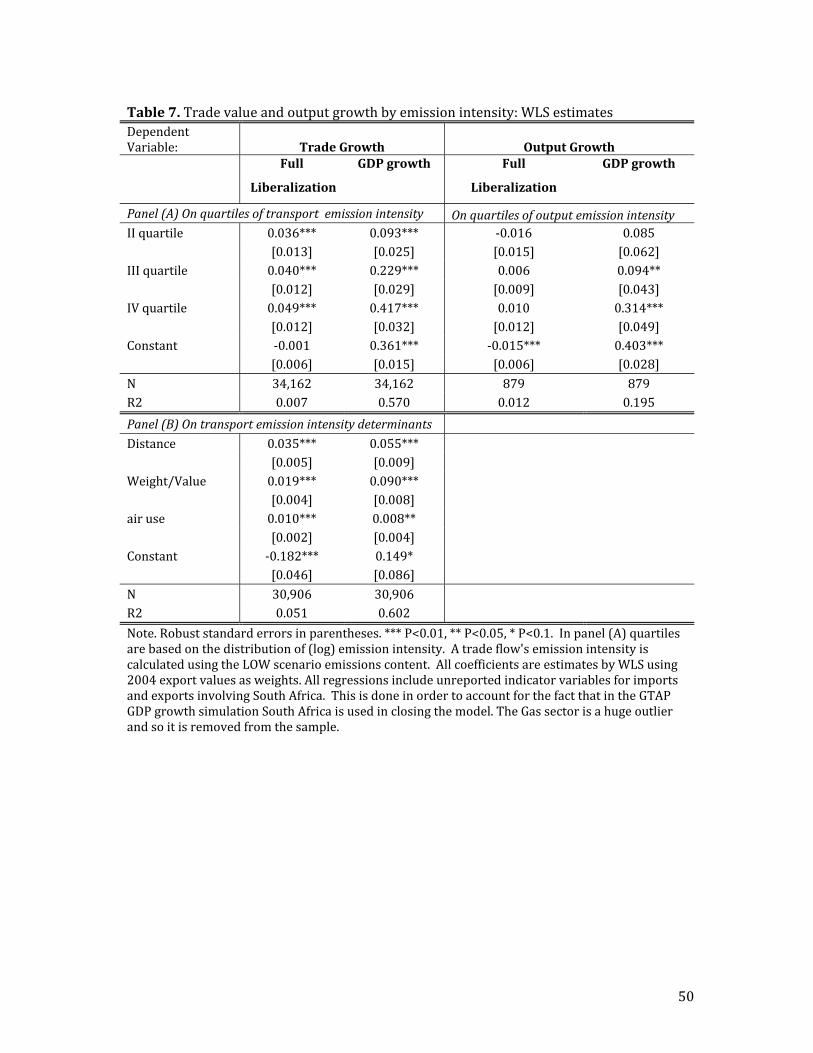
50
Table7.Tradevalueandoutputgrowthbyemissionintensity:WLSestimatesDependentVariable: TradeGrowth OutputGrowth Full GDPgrowth Full GDPgrowth
Liberalization Liberalization
Panel(A)Onquartilesoftransportemissionintensity OnquartilesofoutputemissionintensityIIquartile 0.036*** 0.093*** ‐0.016 0.085 [0.013] [0.025] [0.015] [0.062]IIIquartile 0.040*** 0.229*** 0.006 0.094** [0.012] [0.029] [0.009] [0.043]IVquartile 0.049*** 0.417*** 0.010 0.314*** [0.012] [0.032] [0.012] [0.049]Constant ‐0.001 0.361*** ‐0.015*** 0.403*** [0.006] [0.015] [0.006] [0.028]N 34,162 34,162 879 879R2 0.007 0.570 0.012 0.195
Panel(B)Ontransportemissionintensitydeterminants Distance 0.035*** 0.055*** [0.005] [0.009] Weight/Value 0.019*** 0.090*** [0.004] [0.008] airuse 0.010*** 0.008** [0.002] [0.004] Constant ‐0.182*** 0.149* [0.046] [0.086] N 30,906 30,906 R2 0.051 0.602
Note.Robuststandarderrorsinparentheses.***P<0.01,**P<0.05,*P<0.1.Inpanel(A)quartilesarebasedonthedistributionof(log)emissionintensity.Atradeflow'semissionintensityiscalculatedusingtheLOWscenarioemissionscontent.AllcoefficientsareestimatesbyWLSusing2004exportvaluesasweights.AllregressionsincludeunreportedindicatorvariablesforimportsandexportsinvolvingSouthAfrica.ThisisdoneinordertoaccountforthefactthatintheGTAPGDPgrowthsimulationSouthAfricaisusedinclosingthemodel.TheGassectorisahugeoutlierandsoitisremovedfromthesample.
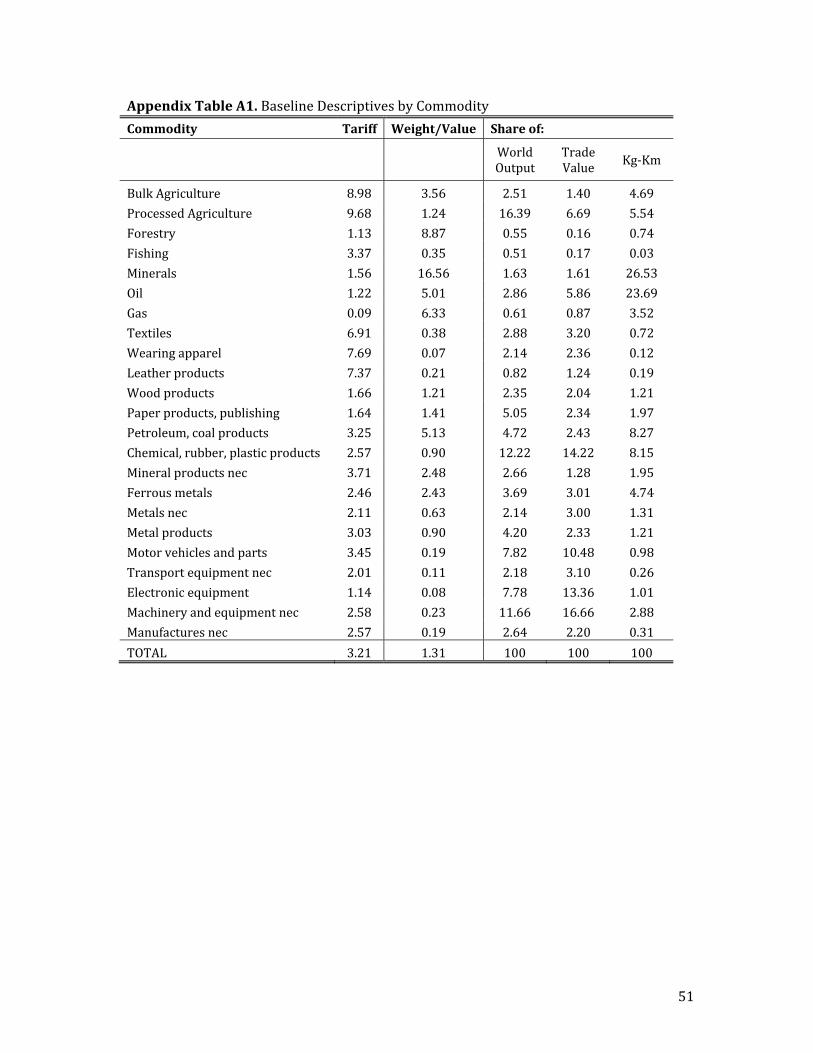
51
AppendixTableA1.BaselineDescriptivesbyCommodity
Commodity Tariff Weight/Value Shareof:
WorldOutput
TradeValue
Kg‐Km
BulkAgriculture 8.98 3.56 2.51 1.40 4.69
ProcessedAgriculture 9.68 1.24 16.39 6.69 5.54
Forestry 1.13 8.87 0.55 0.16 0.74
Fishing 3.37 0.35 0.51 0.17 0.03
Minerals 1.56 16.56 1.63 1.61 26.53
Oil 1.22 5.01 2.86 5.86 23.69
Gas 0.09 6.33 0.61 0.87 3.52
Textiles 6.91 0.38 2.88 3.20 0.72
Wearingapparel 7.69 0.07 2.14 2.36 0.12
Leatherproducts 7.37 0.21 0.82 1.24 0.19
Woodproducts 1.66 1.21 2.35 2.04 1.21
Paperproducts,publishing 1.64 1.41 5.05 2.34 1.97
Petroleum,coalproducts 3.25 5.13 4.72 2.43 8.27
Chemical,rubber,plasticproducts 2.57 0.90 12.22 14.22 8.15
Mineralproductsnec 3.71 2.48 2.66 1.28 1.95
Ferrousmetals 2.46 2.43 3.69 3.01 4.74
Metalsnec 2.11 0.63 2.14 3.00 1.31
Metalproducts 3.03 0.90 4.20 2.33 1.21
Motorvehiclesandparts 3.45 0.19 7.82 10.48 0.98
Transportequipmentnec 2.01 0.11 2.18 3.10 0.26
Electronicequipment 1.14 0.08 7.78 13.36 1.01
Machineryandequipmentnec 2.58 0.23 11.66 16.66 2.88
Manufacturesnec 2.57 0.19 2.64 2.20 0.31
TOTAL 3.21 1.31 100 100 100
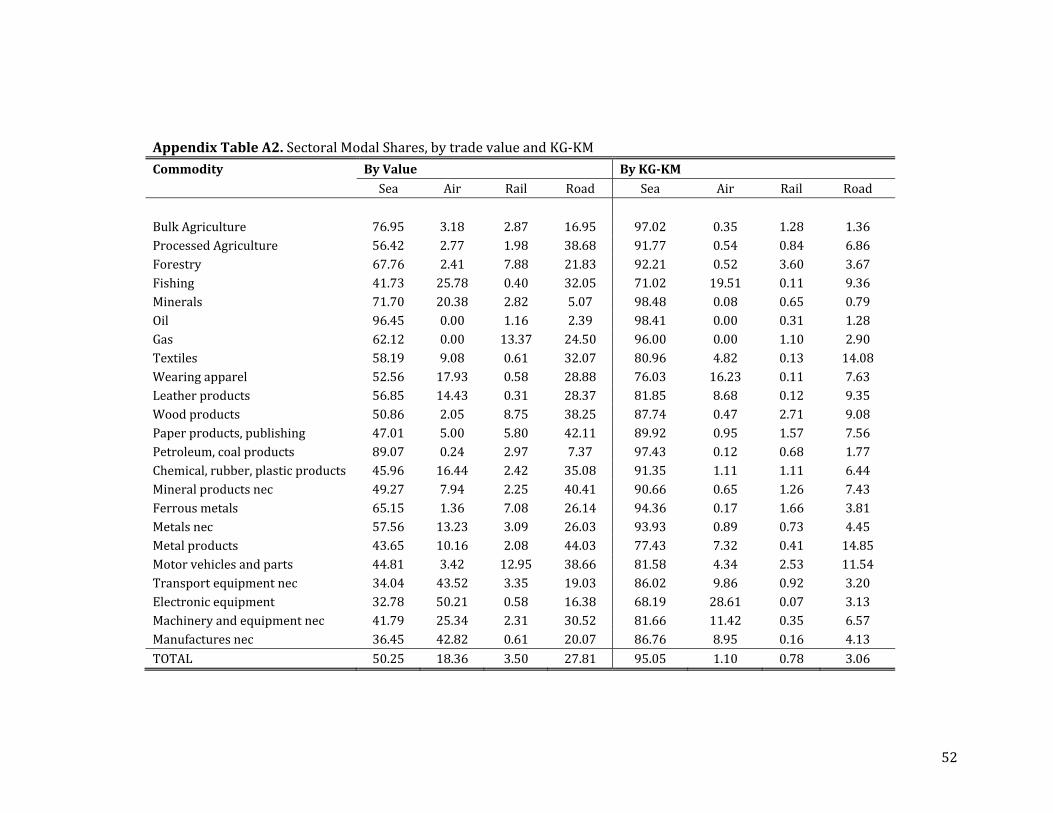
52
AppendixTableA2.SectoralModalShares,bytradevalueandKG‐KMCommodity ByValue ByKG‐KM Sea Air Rail Road Sea Air Rail Road BulkAgriculture 76.95 3.18 2.87 16.95 97.02 0.35 1.28 1.36ProcessedAgriculture 56.42 2.77 1.98 38.68 91.77 0.54 0.84 6.86Forestry 67.76 2.41 7.88 21.83 92.21 0.52 3.60 3.67Fishing 41.73 25.78 0.40 32.05 71.02 19.51 0.11 9.36Minerals 71.70 20.38 2.82 5.07 98.48 0.08 0.65 0.79Oil 96.45 0.00 1.16 2.39 98.41 0.00 0.31 1.28Gas 62.12 0.00 13.37 24.50 96.00 0.00 1.10 2.90Textiles 58.19 9.08 0.61 32.07 80.96 4.82 0.13 14.08Wearingapparel 52.56 17.93 0.58 28.88 76.03 16.23 0.11 7.63Leatherproducts 56.85 14.43 0.31 28.37 81.85 8.68 0.12 9.35Woodproducts 50.86 2.05 8.75 38.25 87.74 0.47 2.71 9.08Paperproducts,publishing 47.01 5.00 5.80 42.11 89.92 0.95 1.57 7.56Petroleum,coalproducts 89.07 0.24 2.97 7.37 97.43 0.12 0.68 1.77Chemical,rubber,plasticproducts 45.96 16.44 2.42 35.08 91.35 1.11 1.11 6.44Mineralproductsnec 49.27 7.94 2.25 40.41 90.66 0.65 1.26 7.43Ferrousmetals 65.15 1.36 7.08 26.14 94.36 0.17 1.66 3.81Metalsnec 57.56 13.23 3.09 26.03 93.93 0.89 0.73 4.45Metalproducts 43.65 10.16 2.08 44.03 77.43 7.32 0.41 14.85Motorvehiclesandparts 44.81 3.42 12.95 38.66 81.58 4.34 2.53 11.54Transportequipmentnec 34.04 43.52 3.35 19.03 86.02 9.86 0.92 3.20Electronicequipment 32.78 50.21 0.58 16.38 68.19 28.61 0.07 3.13Machineryandequipmentnec 41.79 25.34 2.31 30.52 81.66 11.42 0.35 6.57Manufacturesnec 36.45 42.82 0.61 20.07 86.76 8.95 0.16 4.13TOTAL 50.25 18.36 3.50 27.81 95.05 1.10 0.78 3.06
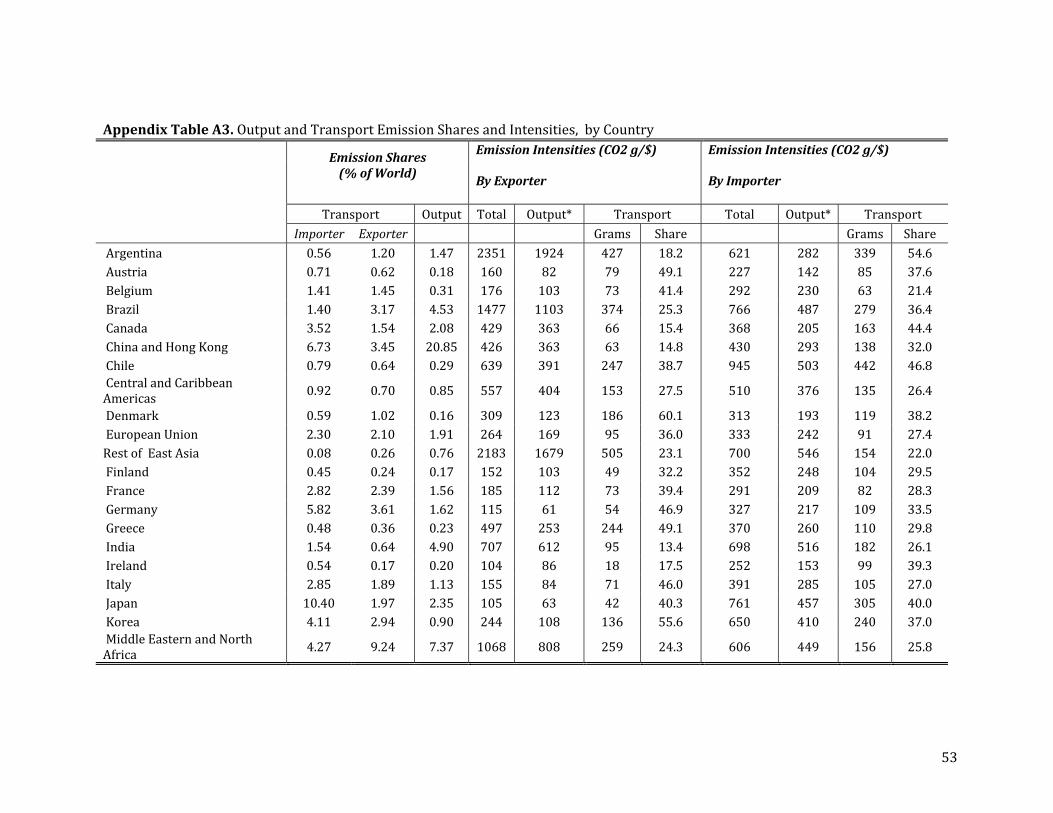
53
AppendixTableA3.OutputandTransportEmissionSharesandIntensities,byCountry EmissionShares
(%ofWorld)
EmissionIntensities(CO2g/$)ByExporter
EmissionIntensities(CO2g/$)ByImporter
Transport Output Total Output* Transport Total Output* Transport Importer Exporter Grams Share Grams ShareArgentina 0.56 1.20 1.47 2351 1924 427 18.2 621 282 339 54.6Austria 0.71 0.62 0.18 160 82 79 49.1 227 142 85 37.6Belgium 1.41 1.45 0.31 176 103 73 41.4 292 230 63 21.4Brazil 1.40 3.17 4.53 1477 1103 374 25.3 766 487 279 36.4Canada 3.52 1.54 2.08 429 363 66 15.4 368 205 163 44.4ChinaandHongKong 6.73 3.45 20.85 426 363 63 14.8 430 293 138 32.0Chile 0.79 0.64 0.29 639 391 247 38.7 945 503 442 46.8CentralandCaribbeanAmericas 0.92 0.70 0.85 557 404 153 27.5 510 376 135 26.4
Denmark 0.59 1.02 0.16 309 123 186 60.1 313 193 119 38.2EuropeanUnion 2.30 2.10 1.91 264 169 95 36.0 333 242 91 27.4RestofEastAsia 0.08 0.26 0.76 2183 1679 505 23.1 700 546 154 22.0Finland 0.45 0.24 0.17 152 103 49 32.2 352 248 104 29.5France 2.82 2.39 1.56 185 112 73 39.4 291 209 82 28.3Germany 5.82 3.61 1.62 115 61 54 46.9 327 217 109 33.5Greece 0.48 0.36 0.23 497 253 244 49.1 370 260 110 29.8India 1.54 0.64 4.90 707 612 95 13.4 698 516 182 26.1Ireland 0.54 0.17 0.20 104 86 18 17.5 252 153 99 39.3Italy 2.85 1.89 1.13 155 84 71 46.0 391 285 105 27.0Japan 10.40 1.97 2.35 105 63 42 40.3 761 457 305 40.0Korea 4.11 2.94 0.90 244 108 136 55.6 650 410 240 37.0MiddleEasternandNorthAfrica 4.27 9.24 7.37 1068 808 259 24.3 606 449 156 25.8
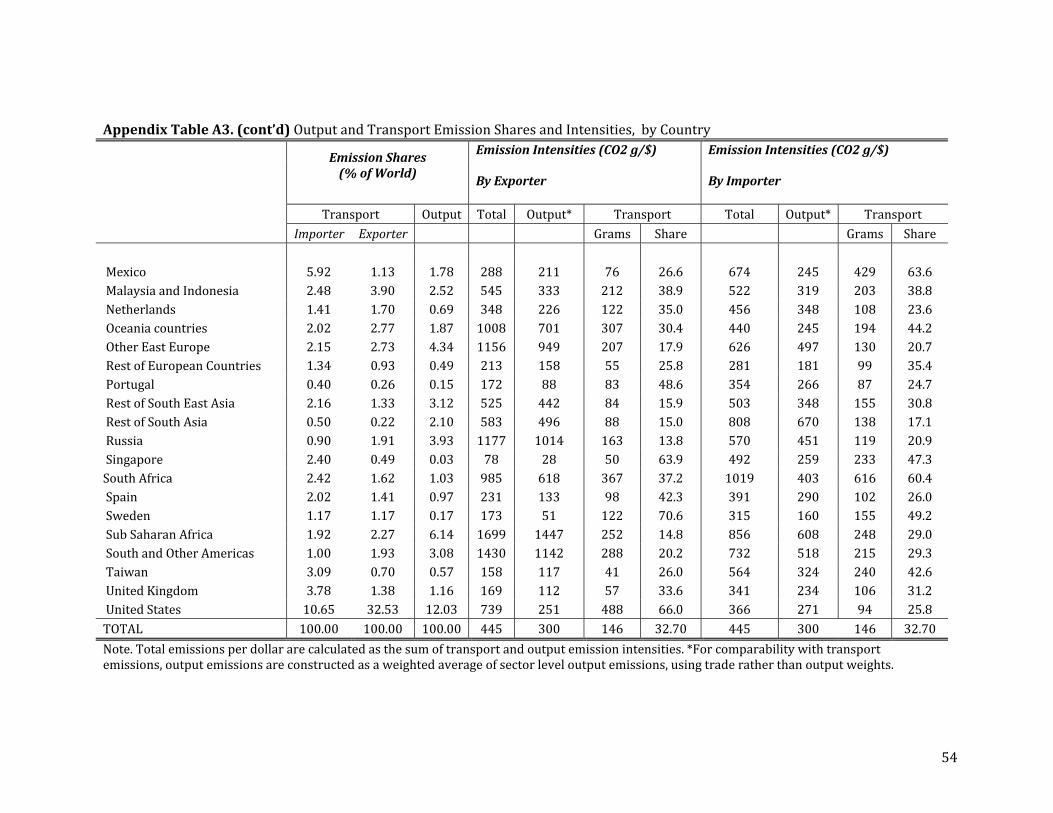
54
AppendixTableA3.(cont’d)OutputandTransportEmissionSharesandIntensities,byCountry EmissionShares
(%ofWorld)
EmissionIntensities(CO2g/$)ByExporter
EmissionIntensities(CO2g/$)ByImporter
Transport Output Total Output* Transport Total Output* Transport Importer Exporter Grams Share Grams Share Mexico 5.92 1.13 1.78 288 211 76 26.6 674 245 429 63.6MalaysiaandIndonesia 2.48 3.90 2.52 545 333 212 38.9 522 319 203 38.8Netherlands 1.41 1.70 0.69 348 226 122 35.0 456 348 108 23.6Oceaniacountries 2.02 2.77 1.87 1008 701 307 30.4 440 245 194 44.2OtherEastEurope 2.15 2.73 4.34 1156 949 207 17.9 626 497 130 20.7RestofEuropeanCountries 1.34 0.93 0.49 213 158 55 25.8 281 181 99 35.4Portugal 0.40 0.26 0.15 172 88 83 48.6 354 266 87 24.7RestofSouthEastAsia 2.16 1.33 3.12 525 442 84 15.9 503 348 155 30.8RestofSouthAsia 0.50 0.22 2.10 583 496 88 15.0 808 670 138 17.1Russia 0.90 1.91 3.93 1177 1014 163 13.8 570 451 119 20.9Singapore 2.40 0.49 0.03 78 28 50 63.9 492 259 233 47.3SouthAfrica 2.42 1.62 1.03 985 618 367 37.2 1019 403 616 60.4Spain 2.02 1.41 0.97 231 133 98 42.3 391 290 102 26.0Sweden 1.17 1.17 0.17 173 51 122 70.6 315 160 155 49.2SubSaharanAfrica 1.92 2.27 6.14 1699 1447 252 14.8 856 608 248 29.0SouthandOtherAmericas 1.00 1.93 3.08 1430 1142 288 20.2 732 518 215 29.3Taiwan 3.09 0.70 0.57 158 117 41 26.0 564 324 240 42.6UnitedKingdom 3.78 1.38 1.16 169 112 57 33.6 341 234 106 31.2UnitedStates 10.65 32.53 12.03 739 251 488 66.0 366 271 94 25.8TOTAL 100.00 100.00 100.00 445 300 146 32.70 445 300 146 32.70
Note.Totalemissionsperdollararecalculatedasthesumoftransportandoutputemissionintensities.*Forcomparabilitywithtransportemissions,outputemissionsareconstructedasaweightedaverageofsectorleveloutputemissions,usingtraderatherthanoutputweights.
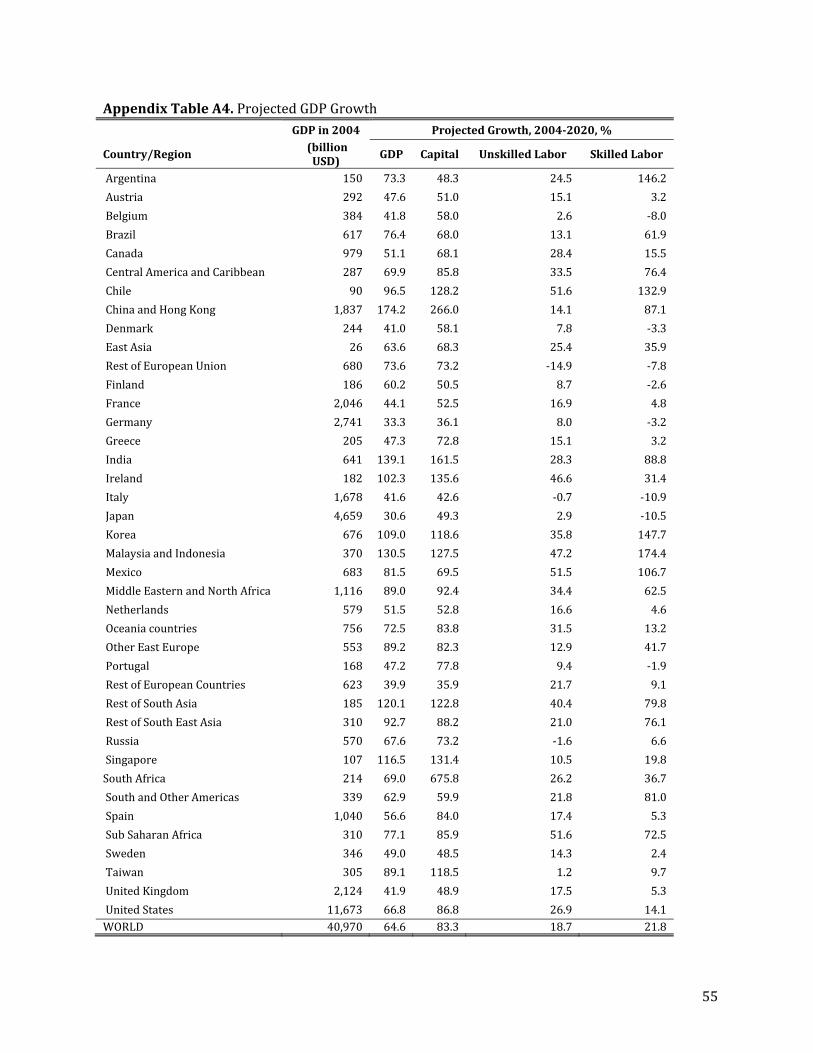
55
AppendixTableA4.ProjectedGDPGrowth GDPin2004 ProjectedGrowth,2004‐2020,%
Country/Region (billionUSD)
GDP Capital UnskilledLabor SkilledLabor
Argentina 150 73.3 48.3 24.5 146.2
Austria 292 47.6 51.0 15.1 3.2
Belgium 384 41.8 58.0 2.6 ‐8.0
Brazil 617 76.4 68.0 13.1 61.9
Canada 979 51.1 68.1 28.4 15.5
CentralAmericaandCaribbean 287 69.9 85.8 33.5 76.4
Chile 90 96.5 128.2 51.6 132.9
ChinaandHongKong 1,837 174.2 266.0 14.1 87.1
Denmark 244 41.0 58.1 7.8 ‐3.3
EastAsia 26 63.6 68.3 25.4 35.9
RestofEuropeanUnion 680 73.6 73.2 ‐14.9 ‐7.8
Finland 186 60.2 50.5 8.7 ‐2.6
France 2,046 44.1 52.5 16.9 4.8
Germany 2,741 33.3 36.1 8.0 ‐3.2
Greece 205 47.3 72.8 15.1 3.2
India 641 139.1 161.5 28.3 88.8
Ireland 182 102.3 135.6 46.6 31.4
Italy 1,678 41.6 42.6 ‐0.7 ‐10.9
Japan 4,659 30.6 49.3 2.9 ‐10.5
Korea 676 109.0 118.6 35.8 147.7
MalaysiaandIndonesia 370 130.5 127.5 47.2 174.4
Mexico 683 81.5 69.5 51.5 106.7
MiddleEasternandNorthAfrica 1,116 89.0 92.4 34.4 62.5
Netherlands 579 51.5 52.8 16.6 4.6
Oceaniacountries 756 72.5 83.8 31.5 13.2
OtherEastEurope 553 89.2 82.3 12.9 41.7
Portugal 168 47.2 77.8 9.4 ‐1.9
RestofEuropeanCountries 623 39.9 35.9 21.7 9.1
RestofSouthAsia 185 120.1 122.8 40.4 79.8
RestofSouthEastAsia 310 92.7 88.2 21.0 76.1
Russia 570 67.6 73.2 ‐1.6 6.6
Singapore 107 116.5 131.4 10.5 19.8
SouthAfrica 214 69.0 675.8 26.2 36.7
SouthandOtherAmericas 339 62.9 59.9 21.8 81.0
Spain 1,040 56.6 84.0 17.4 5.3
SubSaharanAfrica 310 77.1 85.9 51.6 72.5
Sweden 346 49.0 48.5 14.3 2.4
Taiwan 305 89.1 118.5 1.2 9.7
UnitedKingdom 2,124 41.9 48.9 17.5 5.3
UnitedStates 11,673 66.8 86.8 26.9 14.1WORLD 40,970 64.6 83.3 18.7 21.8
Recommended