The Best Evidence Encyclopedia is a free web site created by the Johns Hopkins University School of Education’s Center for Data-Driven Reform in Education (CDDRE) under funding from the Institute of Education Sciences, U.S. Department of Education.
1
The Effectiveness of Educational Technology
Applications for Enhancing
Mathematics Achievement in K-12 Classrooms:
A Meta-Analysis
Alan C. K. Cheung Johns Hopkins University
Robert E. Slavin
Johns Hopkins University
and University of York
July, 2011
The Best Evidence Encyclopedia is a free web site created by the Johns Hopkins University School of Education’s Center for Data-Driven Reform in Education (CDDRE) under funding from the Institute of Education Sciences, U.S. Department of Education.
2
Introduction
According to a recently released report by the U.S. Department of Education (SETDA,
2010), American teenagers are still trailing behind their counterparts in other industrialized
countries in their academic performance, especially in mathematics. In the most recent PISA
assessments, U.S. 15-year-olds had an average mathematics score below the average of countries
in the Organization for Economic Cooperation and Development (OECD). Among the 33 other
OECD countries, over half had higher average scores than the U.S., 5 had lower average scores,
and 11 had average scores that were not substantially different than the U.S. Similar patterns
were found in tests given in 2003 and 2006.
Importantly, the problem of students’ performance in mathematics is not equally
distributed. While many middle class schools in the U.S. do perform at world class standards,
poor and minority students are much less likely to do so. On the 2009 National Assessment of
Educational Progress (NAEP, 2009), only 17% of eighth graders eligible for free lunch scored at
proficient or better, while 45% of middle class students scored this well. Among African
American students, only 12% scored proficient or better, and the percentages were 17% for
Hispanics and 18% for American Indians, compared to 44% for Whites and 54% for Asian-
Americans. All of these scores have been improving over time, but the gaps remain.
In response to these and other indicators, policy makers, parents, and educators have been
calling for reform and looking for effective approaches to boost student mathematics
performance. One of the long-standing approaches to improving the mathematics performance
in both elementary and secondary schools is the use of educational technology. The National
Council of Teachers of Mathematics (NCTM), for example, highly endorsed the use of
educational technology in mathematics education. As stated in the NCTM Principles and
Standards for School Mathematics, “Technology is essential in teaching and learning
mathematics; it influences the mathematics that is taught and enhances students’ learning”
(National Council of Teachers of Mathematics, 2011).
The use of educational technology in K-12 classrooms has been gaining tremendous
momentum across the country since the 1990s. Many school districts have been investing
heavily in various types of technology, such as computers, mobile devices, internet access, and
interactive whiteboards. Almost all public schools have access to the internet and computers in
their schools. Educational digital games have also been growing significantly in the past few
years. To support the use of educational technology, the U.S. Department of Education provides
grants to state education agencies. For example, in fiscal year 2009, the Congress allocated $650
million in educational technology through the Enhancing Education Through Technology (E2T2)
program (SETDA, 2010). Given the importance of educational technology, it is the intent of this
review to examine the effectiveness of various types of educational technology applications for
enhancing mathematics achievement in K-12 classrooms.
The Best Evidence Encyclopedia is a free web site created by the Johns Hopkins University School of Education’s Center for Data-Driven Reform in Education (CDDRE) under funding from the Institute of Education Sciences, U.S. Department of Education.
3
Working Definition of Educational Technology
In this meta-analysis, educational technology is defined as a variety of electronic tools
and applications that help deliver learning materials and support learning processes in K-12
classrooms to improve academic learning goals (as opposed to learning to use the technology
itself). Examples include computers-assisted instruction (CAI), integrated learning systems
(ILS), video, and interactive whiteboards.
Previous Reviews of Educational Technology on Mathematics Achievement
Research on educational technology has been abundant. In the past three decades, over
twenty major reviews have been conducted in this area (e.g. Bangert-Drowns, Kulik, & Kulik,
1985; Christmann & Badgett, 2003; Hartley, 1977; C. L. C. Kulik & Kulik, 1991; J. A. Kulik,
2003; Ouyang, 1993; Rakes, Valentine, McGatha, & Ronau, 2010; Slavin & Lake, 2008; Slavin,
Lake, & Groff, 2009). The majority of these examined a wide range of subjects (e.g., reading,
mathematics, social studies, science) and grades from K to 12. Seven out of the 21 reviews
focused on mathematics achievement (Burns, 1981; Hartley, 1977; Lee, 1990; Li & Ma, 2010;
Rakes, et al., 2010; Slavin & Lake, 2008; Slavin, et al., 2009). The majority of the reviews
concluded that there were positive effects of educational technology on mathematics
achievement, with an overall study-weighted effect size of +0.31. However, effect sizes ranged
widely, from +0.10 to +0.62. Table 2 presents a summary of the findings for mathematic
outcomes for these 21 major reviews.
Though several narrative and box-score reviews had been conducted in the 1970s
(Edwards, Norton, Taylor, Weiss, & Dusseldoph, 1975; Jamison, Suppes, & Wells, 1974;
Vinsonhaler & Bass, 1972), their findings were criticized by other researchers because of their
vote-counting methods (Hedges & Olkins, 1980). The reviews carried out by Hartley (1977) and
Burns (1981) were perhaps the earliest reviews on computer technology that used a more
sophisticated meta-analytic method. The focus of Hartley’s review was on the effects of
individually-paced instruction in mathematics using four techniques: computer-assisted
instruction (CAI), cross-age and peer tutoring, individual learning packets, and programmed
instruction. Twenty-two studies involving grades 1-8 were included in his review. The average
effect size for these grades was +0.42.
Like Hartley (1977), Burns’ (1981) review was also on the impact of computer-based
drill and practice and tutorial programs on students’ mathematics achievement. Burns (1981)
included a total of 32 studies in her review and came up with a similar effect size of +0.37.
Other important reviews conducted in the 1980s were conducted by Kulik et al. (1985) and
Bangert-Drowns et al. (1985). Compared to the earlier reviews by Hartley (1977) and Burns
(1981), both Kulik and Bangert-Drowns adopted much stricter inclusion criteria to select their

The Best Evidence Encyclopedia is a free web site created by the Johns Hopkins University School of Education’s Center for Data-Driven Reform in Education (CDDRE) under funding from the Institute of Education Sciences, U.S. Department of Education.
4
studies. For instance, to be included in their review, studies had to meet the following three key
criteria. First, the studies had to take place in actual classroom settings. Second, the studies had
to have a control group that was taught in a conventionally instructed class. Third, the studies
had to be free from methodological flaws such as high attrition rate or unfair teaching of the
criterion test to one of the comparison groups. Kulik et al. (1985) and Bangert-Drowns et al.
(1985) included a total of 22 and 18 studies for the elementary and secondary mathematics
reviews, respectively. They found a positive effect of computer-based teaching, with an effect
size of +0.26 for elementary and +0.54 for secondary grades.
Two recent reviews by Slavin and his colleagues (Slavin & Lake, 2008; Slavin et al.,
2009) applied even more stringent inclusion criteria than Kulik’s to select only studies with high
methodological quality. In addition to the key inclusion criteria set by Kulik and his colleagues,
Slavin and his colleagues added the following criteria: a minimum of 12-week duration, evidence
of initial equivalence between the treatment and control group, and a minimum of two teachers
in each group to avoid possible confounding of treatment effect with teacher effect (see Slavin
(2008) for a rationale). Slavin et al. (2008; 2009) included a total of 38 educational technology
studies in their elementary review and 38 in a secondary review and found a modest effect size
of +0.19 for elementary schools and a small effect size of +0.10 for secondary schools.
The two most recent reviews were conducted by Rakes et al. (2010) and Li & Ma (2010).
In their meta-analysis, Rakes and his colleagues examined the effectiveness of five categories of
instructional improvement strategies in algebra: technology curricula, non-technology curricula,
instructional strategies, manipulative tools, and technology tools. Out of the 82 included studies,
15 were on technology-based curricula such as Cognitive Tutor, and 21 were instructional
technology tools such as graphing calculators. Overall, the technology strategies yielded a
statistically significant but small effect size of +0.16. The effect sizes for technology-based
curriculum and technology tools were +0.15 and +0.17, respectively. Similar to Rakes et al.
(2010), Li & Ma (2010) examined the impact of computer technology on mathematics
achievement. A total of 41 primary studies were included in their review. The findings provide
promising evidence in enhancing mathematics achievement in K-12 classrooms, with an effect
size of +0.28.
Problems with Previous Reviews
Though reviews in the past 30 years produced suggestive evidence of the effectiveness of
educational technology on mathematics achievement, the results must be interpreted with
caution. As is evidenced by the great variations in average effect sizes across reviews, it makes a
great deal of difference which procedures are used for study inclusion and analysis. Many
evaluations of technology applications suffer from serious methodological problems. Common
problems include a lack of a control group, limited evidence of initial equivalence between the
treatment and control group, large pretest differences, or questionable outcome measures. In
The Best Evidence Encyclopedia is a free web site created by the Johns Hopkins University School of Education’s Center for Data-Driven Reform in Education (CDDRE) under funding from the Institute of Education Sciences, U.S. Department of Education.
5
addition, many of these reviews included studies that had a very short duration. Furthermore, a
few of the reviews did not list their included studies (Burns & Bozeman, 1981; J. A. Kulik,
Bangert-Drowns, & Williams, 1983), so readers do not know which studies were included in the
reviews. Lastly, important descriptive information, such as outcome measures and
characteristics of individual studies, was often left out (e.g. Hartley, 1977). Unfortunately,
studies with poor methodologies tend to report much higher effect sizes than those with more
rigorous methods (see Slavin & Smith, 2009; Slavin & Madden, in press), so failing to screen out
such studies inflates the average effect sizes of meta-analyses. In the following section, we will
be discussing some of these problems and the issues associated with them.
No Control Group
As mentioned earlier, many previous reviews included studies that did not have a
traditionally taught control group. Earlier reviews such as those by Hartley (1977) and Burns
(1981) are prime examples, where a high percentage of their included studies did not have a
traditional control group. Though reviews after the 1980s employed better inclusion criteria,
some still included pre-post designs or correlational studies in their selection. For example, in
his dissertation, Ouyang (1993) examined a total of 79 individual studies in an analysis on the
effectiveness of CAI on mathematics achievement. He extracted a total of 267 effect sizes and
came up with an overall effect size of +0.62 for mathematics. Upon closer examination,
however, 60 of these effect sizes (22%) came from pre-post studies. Lacking a control group, of
course, a pre-post design attributes any growth in achievement to the program, rather than to
normal, expected gain. Liao (1998) is another case in point. In his review, he included a total of
35 studies to examine the effects of hypermedia on achievement. Five of these studies were one-
group repeated measures without a traditional control group. What he found was that the
average effect size of these five repeated measures studies (ES=+1.83) was much larger than that
of studies with a control group (ES=+0.18).
Brief Duration
Including studies with brief durations could also potentially bias the overall results of
meta-analyses, because short-duration studies tend to produce larger effects than long-duration
studies. This may be true due to novelty factors, a better controlled environment, and the likely
use of non-standardized tests. In particular, experimenters often create highly artificial
conditions in brief studies that could not be maintained for a whole school year, and which
contribute to unrealistic gains. Brief studies may advantage experimental groups that focus on a
particular set of objectives during a limited time period, while control groups spread that topic
over a longer period. In their review, Bangert-Drowns et al. (1985) included a total of 22 studies
that looked at the impact of computer-based education on mathematics achievement in secondary
schools. One third of these studies (32%) had a study duration ranging from two to 10 weeks.
In a similar review in secondary schools (J. A. Kulik et al., 1985), a similar percentage (33%) of
The Best Evidence Encyclopedia is a free web site created by the Johns Hopkins University School of Education’s Center for Data-Driven Reform in Education (CDDRE) under funding from the Institute of Education Sciences, U.S. Department of Education.
6
short-duration studies was also included. In evaluating the effectiveness of microcomputer
applications in elementary schools, Ryan (1991) examined 40 studies across several subject
areas, including mathematics, with an overall effect size of +0.31. However, 29 out of the 40
included studies (73%) had a duration of less than 12 weeks. In their 1991 updated review,
Kulik & Kulik (1991) included 53 new studies, covering students from elementary school to
college. However, out of the 53 added studies, over half had a duration of less than 12 weeks.
Eleven of them were only one-week experiments.
No Initial Equivalence
Establishing initial equivalence is also of great importance in evaluating program
effectiveness. Some reviews included studies that used a post-test only design. Such designs
make it impossible to know whether the experimental and control groups were comparable at the
start of the experiment. Since mathematics posttests are so highly correlated with pretests, even
modest (but unreported) pretest differences can result in important bias in the posttest. Meyer &
Feinberg (1992) had this to say with regards to the importance of establishing initial equivalence
in educational research, “It is like watching a baseball game beginning in the fifth inning. If you
are not told the score from the previous innings nothing you see can tell you who is winning the
game.” Several studies included in the Li & Ma (2010) review did not establish initial
equivalence (Funkhouser, 2003; Wodarz, 1994; Zumwalt, 2001). In his review, Becker (1992)
found that among the seven known studies of WICAT, only one provided some evidence on the
comparability of comparison populations and provided data showing changes in achievement for
the same students in both experimental and control groups. Studies with huge pretest differences
also posed another threat to validity, even if statistical controls were used. Ysseldyke and
colleagues (2003; 2003) conducted two separate studies on the impact of educational technology
programs on mathematics achievement. Both of the studies had large pretest differences
(ES>0.50). Large pretest differences cannot be adequately controlled for, as underlying
distributions may be fundamentally different even with the use of ANCOVAs or other control
procedures (Shadish, Cook, & Campbell, 2002).
Cherry-Picking Evidence
Cherry-picking is a strategy used by some developers or vendors to pick favorite findings
to support their cause. When analyzing the effectiveness of Integrated Learning Systems (ILS),
Becker (1992) included 11 Computer Curriculum Corporation (CCC) evaluation studies in his
review. Four of the 11 studies were carried out by the vendor. Each of these studies was a one-
year-long study involving sample sizes of a few hundred students. Effect sizes provided by the
vendor were suspiciously large, ranging from +0.60 to +1.60. Upon closer examination, Becker
(1992) found that the evaluators used an unusual procedure to exclude students in the
experimental group, those who showed a sharp decline in scores at posttest, claiming that these
scores were atypical portraits of their abilities. However, the evaluators did not exclude those

The Best Evidence Encyclopedia is a free web site created by the Johns Hopkins University School of Education’s Center for Data-Driven Reform in Education (CDDRE) under funding from the Institute of Education Sciences, U.S. Department of Education.
7
who had a large gain, arguing that the large gain might have been caused by the program. In a
study conducted in 11 Milwaukee Chapter 1 schools, the evaluators compared the impact of the
CCC program on 600 students in grades 2-9 to the test-normed population. The evaluators
excluded 8% of the negative outliers in math but did not exclude any positive outliers. The
overall effect size reported was +0.80. However, after making reasonable adjustments, Becker
estimated the average effect size to be around +0.35, not the reported +0.80. Another example
was a WICAT study reported in Chicago (Becker, 1992). Only scores of a select sample of 56
students across grades 1-8 in two schools were reported. It raised the issue of why results for
this particular group of students were reported but not results for other students. Becker (1992)
suspected that achievement data might have been collected for all students by the schools, but the
schools simply did not report disappointing results.
Rationale for Present Review
The present review hopes to overcome the major problems seen in previous meta-
analyses by applying rigorous, consistent inclusion criteria to identify high-quality studies. In
addition, we will examine how methodological and substantive features affect the overall
outcome of educational technology on mathematics achievement. Furthermore, the findings of
two recent randomized, large-scale third-party federal evaluations involved hundreds of schools
by Dynarski et al. (2007) and Campuzzano et al. (2009) revealed a need to re-examine research
on the effectiveness of technology on mathematics outcomes. In contrast to the findings of
previous reviews, both the Dynarski and Campuzzano studies found minimal effects of various
types of education technology applications (e.g., Cognitive Tutor, PLATO, Larson Pre-Algebra)
on math achievement. These two studies are particularly important not only because of their size
and use of random assignment, but also because they assess modern, widely used forms of CAI,
unlike many studies of earlier technology reported in previous reviews. The present study seeks
to answer three key research questions:
1. Do education technology applications improve mathematics achievement in K-12
classrooms as compared to traditional teaching methods without education technology?
2. What study and research features moderate the effects of education technology
applications on student mathematics achievement?
3. Do the Dynarski/Campuzzano findings conform with those of other high-quality
evaluations?
The Best Evidence Encyclopedia is a free web site created by the Johns Hopkins University School of Education’s Center for Data-Driven Reform in Education (CDDRE) under funding from the Institute of Education Sciences, U.S. Department of Education.
8
Methods
The current review employed meta-analytic techniques proposed by Glass, McGaw &
Smith (Glass, McGaw, & Smith, 1981) and Lipsey & Wilson (2001). Comprehensive Meta-
analysis Software Version 2 (Borenstein, Hedges, Higgins, & Rothstein, 2009) was used to
calculate effect sizes and to carry out various meta-analytical tests, such as Q statistics and
sensitivity analyses. The meta-analytic procedures followed several key steps: 1) Locate all
possible studies; 2) screen potential studies for inclusion using preset criteria; 3) code all
qualified studies based on their methodological and substantive features; 4) calculate effect sizes
for all qualified studies for further combined analyses; and 5) carry out comprehensive statistical
analyses covering both average effects and the relationships between effects and study features.
Locating all possible studies and literature search procedures
All the qualifying studies from the present review come from four major sources.
Previous reviews provided the first source, and references from the studies cited in the reviews
were further investigated. A second group of studies was generated from a comprehensive
literature search of articles written between 1970 and 2011. Electronic searches were made of
educational databases (e.g., JSTOR, ERIC, EBSCO, Psych INFO, Dissertation Abstracts), web-
based repositories (e.g., Google Scholar), and educational technology publishers’ websites, using
different combinations of key words (e.g., educational technology, instructional technology,
computer-assisted instruction, interactive whiteboards, multimedia, mathematics interventions,
etc.). In addition, we also conducted searches by program name. We attempted to contact
producers and developers of educational technology programs to check whether they knew of
studies that we had missed. Furthermore, we also conducted searches of recent tables of contents
of key journals from 2000 to 2011: Educational Technology and Society, Computers and
Education, American Educational Research Journal, Journal of Educational Research, Journal
of Research on Mathematics Education, and Journal of Educational Psychology. We sought
papers presented at AREA, SREE, and other conferences. Citations in the articles from these
and other current sources were located. Over 700 potential studies were generated for
preliminary review as a result of the literature search procedures.
Criteria for Inclusion
To be included in this review, the following inclusion criteria were established.
1. The studies evaluated any type of educational technology, including computers,
multimedia, interactive whiteboards, and other technology, used to improve mathematics
achievement.
2. The studies involved students in grades K-12.

The Best Evidence Encyclopedia is a free web site created by the Johns Hopkins University School of Education’s Center for Data-Driven Reform in Education (CDDRE) under funding from the Institute of Education Sciences, U.S. Department of Education.
9
3. The studies compared students taught in classes using a given technology-assisted
mathematics program to those in control classes using an alternative program or standard
methods.
4. Studies could have taken place in any country, but the report had to be available in
English.
5. Random assignment or matching with appropriate adjustments for any pretest differences
(e.g., analyses of covariance) had to be used. Studies without control groups, such as pre-
post comparisons and comparisons to “expected” scores, were excluded. Studies in
which students selected themselves into treatments (e.g., chose to attend an after-school
program) or were specially selected into treatments (e.g., gifted or special education
programs) were excluded unless experimental and control groups were designated after
selections were made.
6. Pretest data had to be provided, unless studies used random assignment of at least 30
units (individuals, classes, or schools), and there were no indications of initial inequality.
Studies with pretest differences of more than 50% of a standard deviation were excluded
because, even with analyses of covariance, large pretest differences cannot be adequately
controlled for as underlying distributions may be fundamentally different (Shadish, Cook,
& Campbell, 2002).
7. The dependent measures included quantitative measures of mathematics performance,
such as standardized mathematics measures. Experimenter-made measures were
accepted if they were comprehensive measures of mathematics, which would be fair to
the control groups, but measures of mathematics objectives inherent to the program (but
unlikely to be emphasized in control groups) were excluded.
8. A minimum study duration of 12 weeks was required. This requirement is intended to
focus the review on practical programs intended for use for the whole year, rather than
brief investigations. Studies with brief treatment durations that measured outcomes over
periods of more than 12 weeks were included, however, on the basis that if a brief
treatment has lasting effects, it should be of interest to educators.
9. Studies had to have at least two teachers in each treatment group to avoid the
confounding of treatment effects with teacher effects.
10. Programs had to be replicable in realistic school settings. Studies providing
experimental classes with extraordinary amounts of assistance that could not be provided
in ordinary applications were excluded.
Study Coding
To examine the relationship between effects and the studies’ methodological and
substantive features, studies needed to be coded. Methodological features included research
design and sample size. Substantive features included grade levels, types of educational
technology programs, program intensity, level of implementation, and socio-economic status.
The study features were categorized in the following way:
The Best Evidence Encyclopedia is a free web site created by the Johns Hopkins University School of Education’s Center for Data-Driven Reform in Education (CDDRE) under funding from the Institute of Education Sciences, U.S. Department of Education.
10
1. Types of publication: Published or unpublished.
2. Year of publication: 1980s and before, 1990s, or 2000s and later.
3. Research design: Randomized, randomized quasi-experiment, matched control, or
matched post hoc.
4. Sample size: Small (N ≤250 students) or large (N>250).
5. Grade level: Elementary (Grade 1-6), or secondary (Grade 7-12).
6. Program types: Computer-managed learning (CML), integrated, or supplemental.
7. Program intensity: Low (≤30 minutes per week), medium (between 30 and 75
minutes per week), or high (>75 minutes per week).
8. Implementation: Low, medium, or high (as rated by study authors).
9. Socio-economic status: Low (free and reduced lunch >40%) or high (F/R lunch
<40%).
Study coding was conducted by two researchers working independently. The inter-rater
agreement was 95%. When disagreements arose, both researchers reexamined the studies in
question together and came to a final agreement.
Effect Size Calculations and Statistical Analyses
In general, effect sizes were computed as the difference between experimental and
control individual student posttests after adjustment for pretests and other covariates, divided by
the unadjusted posttest pooled standard deviation. Procedures described by Lipsey & Wilson
(2001) and Sedlmeier & Gigerenzer (1989) were used to estimate effect sizes when unadjusted
standard deviations were not available, as when the only standard deviation presented was
already adjusted for covariates or when only gain score standard deviations were available. If
pretest and posttest means and standard deviations were presented but adjusted means were not,
effect sizes for pretests were subtracted from effect sizes for posttests. Studies often reported
more than one outcome measure. Since these outcome measures were not independent, we
produced an overall average effect size for each study. After calculating individual effect sizes
for all 74 qualifying studies, Comprehensive Meta-Analysis software was used to carry out all
statistical analyses, such as Q statistics and overall effect sizes.
Limitations
Before presenting our findings and conclusion, it is important to mention several
limitations in this review. First, due to the scope of this review, only studies with quantitative
measures of mathematics were included. There is much to be learned from other non-
experimental studies, such as qualitative and correlational research, that can add depth and
insight to understanding the effects of these educational technology programs. Second, the
review focuses on replicable programs used in realistic school settings over periods of at least 12
weeks, but it does not attend to shorter, more theoretically-driven studies that may also provide
The Best Evidence Encyclopedia is a free web site created by the Johns Hopkins University School of Education’s Center for Data-Driven Reform in Education (CDDRE) under funding from the Institute of Education Sciences, U.S. Department of Education.
11
useful information, especially to researchers. Finally, the review focuses on traditional measures
of math performance, primarily standardized tests. These are useful in assessing the practical
outcomes of various programs and are fair to control as well as experimental teachers, who are
equally likely to be trying to help their students do well on these assessments. However, the
review does not report on experimenter-made measures of content taught in the experimental
group but not the control group, although results on such measures may also be of importance to
researchers or educators.
Findings
Overall Effects
A total of 74 qualifying studies were included in our final analysis with a total sample
size of 56,886 K-12 students: 45 elementary studies (N=31,555) and 29 secondary studies
(N=25,331). As indicated in Table 2, the overall weighted effect size is +0.16. The large Q
value indicated that the distribution of effect sizes in this collection of studies is highly
heterogeneous (Q=345.80, df=73, p<0.00). In other words, the variance of study effect sizes is
larger than can be explained by simple sampling error. Thus, a random effects model was used1
(Borenstein et al., 2009; Dersimonian & Laird, 1986; Schmidt, Oh, & Hayes, 2009). In order to
explain this variance, key methodological features (e.g., research design, sample size) and
substantive features (e.g., type of intervention, grade level, SES) were used to model some of the
variation.
==============
Insert Table 2 here
==============
1 A random-effects model was used for three reasons. First, the test of heterogeneity in effect sizes was statistically
significant. Second, the studies for this review were drawn from populations that are quite different from each
other, e.g., age of the participants, types of intervention, research design, etc. Third, the random-effects model has
been widely used in meta-analysis because the model does not discount a small study by giving it a very small
weight, as is the case in the fixed-effects model (Borenstein, Hedges, Higgins, & Rothstein, 2009; Dersimonian &
Laird, 1986; Schmidt, Oh, & Hayes, 2009). The average effect size using a fixed-effects procedure was only +0.11
(see Table 2).
The Best Evidence Encyclopedia is a free web site created by the Johns Hopkins University School of Education’s Center for Data-Driven Reform in Education (CDDRE) under funding from the Institute of Education Sciences, U.S. Department of Education.
12
Sensitivity Analysis
To avoid the impact of potential outliers that might skew the overall results, a sensitivity
analysis was conducted to check for extreme positive as well as negative effect sizes. Using a
“one-study removal” analysis (Borenstein et al., 2009), the range of effect sizes still falls within
the 95% confidence interval (0.11 to 0.20). In other words, the removal of any one effect size
does not substantially affect the overall effect sizes.
Publication Bias
To check whether there was a significant number of studies with null or negative results
that have not been uncovered in the literature search which might nullify the effects found in the
meta-analysis, classic fail-safe N and Orwin’s fail-safe N analyses were performed. As
suggested in Table 3, the classic fail-safe N test determined that a total of 3,506 studies with null
results would be needed in order to nullify the effect. The Orwin’s test (Table 4) estimates the
number of missing null studies that would be required to bring the mean effect size to a trivial
level. We set 0.01 as the trivial value. The result indicated that the number of missing null
studies to bring the existing overall mean effect size to 0.01 was 701. Both tests suggest that
publication bias could not account for the significant positive effects observed across all studies.
==============
Insert Tables 3 & 4 here
==============
We also used a mixed-effects model to test whether there was a significant difference
between published journal articles and unpublished publications, such as conference papers,
technical reports, and dissertations. As indicated in Table 5, published articles and unpublished
reports produced the same effect size of +0.15. Thus, no publication bias was found (p<0.94).
==============
Insert Table 5 here
==============
Year of Publication
One might expect that the overall effectiveness of educational technology applications
would be improving over time as technology becomes more advanced and sophisticated.
The Best Evidence Encyclopedia is a free web site created by the Johns Hopkins University School of Education’s Center for Data-Driven Reform in Education (CDDRE) under funding from the Institute of Education Sciences, U.S. Department of Education.
13
However, this evidence is mixed. Kulik & Kulik (1987) reported that the average effect of
computer-based instruction was improving over time. For example, the average effect size for
studies from 1966-1972 was +0.24 as compared to +0.36 for studies from 1974-1984. On the
other hand, researchers such as Fletcher-Finn & Gravatt (1995) and Liao (1998) did not find a
consistent upward pattern for more recent studies. Christmann & Badgett (2003) found a
negative trend over a 14 year time span with effect sizes dropping from +0.73 in 1969 to +0.36
in 1998. Our present review found no trend toward more positive results in recent years (see
Table 6). The mean effect sizes for studies in the 80s, 90s, and after 2000 were +0.23, +0.15,
and +0.12, respectively.
==============
Insert Table 6 here
==============
Methodological Features
As indicated in Table 2, the large Q-value (Q=345.80, df=73, p<0.00) in the test of
heterogeneity in effect sizes suggests that there are some underlying systematic differences in
this collection of studies. Two key potential methodological features were examined: research
design and sample size.
Research Design. One potential source of variation may lie in the research design of the
different studies (e.g., Abrami & Bernard, 2006). There were four main types of research
designs in this review: randomized experiments, randomized quasi-experiments, matched control
studies, and post-hoc studies. Randomized experiments (N=26) were those in which students,
classes, or schools were randomly assigned to conditions and the unit of analysis was at the level
of the random assignment. Randomized quasi-experiments (RQE) (N=8) also used random
assignment at the school or class level but due to a limited sample of schools or classes, the
analysis had to be done at the student level. Matched control studies (N=20) were ones in which
experimental and control groups were matched on key variables at pretest, before posttests were
known. Matched post-hoc studies (MPH) (N=20) were ones in which groups were matched
retrospectively, after posttests were known. Table 7 summarizes the outcomes by research
design. The average effect size for randomized experimental studies, randomized quasi-
experiments, matched control studies, and matched post hoc studies were +0.08, +0.24, +0.20,
and +0.15, respectively. Since there were only eight RQE studies, and the effect sizes of the
matched and MPH studies were similar, we decided to combine these three quasi-experimental
categories into one category and compare it to the randomized experiments. Results are found in
Table 8. The mean effect size for quasi-experimental studies was +0.20, twice the size of that for
randomized studies (+0.08).
The Best Evidence Encyclopedia is a free web site created by the Johns Hopkins University School of Education’s Center for Data-Driven Reform in Education (CDDRE) under funding from the Institute of Education Sciences, U.S. Department of Education.
14
==============
Insert Tables 7 and 8 here
==============
Sample Size. Another potential source of variation may be study sample size (Slavin &
Smith, 2008). Previous studies suggest that studies with small sample sizes are likely to produce
much larger effect sizes than do large studies (Cheung & Slavin, 2011; Liao, 1999). In this
collection of studies, there were a total of 44 large studies with sample sizes greater than 250 and
30 small studies with fewer than 250 students. As indicated in Table 9, we found a statistically
significant difference between large studies and small studies. The mean effect size for the 30
small studies (ES=+0.26) was about twice that of large studies (ES=+0.12, p<0.01).
==============
Insert Table 9 here
==============
Design/Size. Within each research design, the effect sizes of the small studies were
about twice as large as those of the large studies. Large matched control studies produced an
effect size of ES=+0.16, as compared to +0.31 for small matched control studies. A similar
pattern was also found within the randomized group. Large randomized studies had an effect
size of +0.06, whereas small randomized studies had an effect size that was twice as large
(ES=+0.17). The findings for the large, randomized studies, as a group, resembled those of the
Dynarski/Campuzzano studies, with very small effect sizes.
==============
Insert Table 10 here
==============
Substantive Features
Five key substantive features were identified and examined in this review: Grade levels,
types of intervention, program intensity, level of implementation, and socio-economic status.
Grade levels. The results by grade levels are shown in Table 11. The effect size for
elementary studies (ES=+0.17) was higher than that for secondary studies (ES=+0.14), but the
The Best Evidence Encyclopedia is a free web site created by the Johns Hopkins University School of Education’s Center for Data-Driven Reform in Education (CDDRE) under funding from the Institute of Education Sciences, U.S. Department of Education.
15
difference was not statistically significant (p<0.51). Our finding is consistent with previous
reviews (Bangert-Drowns et al., 1985; J. A. Kulik et al., 1985), suggesting that educational
technology had a more positive effect on elementary students than secondary students.
Types of intervention. With regards to intervention types, the studies were divided into
three major categories: Computer-Managed Learning (CML) (N=10), Comprehensive Models
(N=9), and Supplemental CAI Technology (N=55). Over 70% of all studies fell into the
supplemental program category, which consists of individualized computer-assisted instruction
(CAI). These supplemental CAI programs, such as Jostens, PLATO, Larson Pre-Algebra, and
SRA Drill and Practice, provide additional instruction at students’ assessed levels of need to
supplement traditional classroom instruction. Computer-managed learning systems included
only Accelerated Math, which uses computers to assess students’ mathematics levels, assign
mathematics materials at appropriate levels, score tests on this material, and chart students’
progress. One of the main functions of the computer in Accelerated Math is clerical (Niemiec et
al., 1987). Comprehensive models, such as Cognitive Tutor and I Can Learn, use computer-
assisted instruction along with non-computer activities as the students’ core approach to
mathematics.
==============
Insert Table 11 here
==============
Table 12 presents the summary results of the analyses by program types. A significant
between-group effect (QB =7.25, df=2, p<0.03) was found, indicating some variation among the
three programs. The 55 supplemental technology programs produced the largest effect size,
+0.19, and the 10 computer-managed learning programs and the nine comprehensive models
produced similar small effect sizes of +0.09 and +0.06, respectively. The results of the analyses
of CML and the comprehensive models must be interpreted with caution due to the small number
of studies in these two categories, however.
==============
Insert Table 12 here
==============
Program intensity. Program intensity (frequency of intended use) was divided into three
major categories: low intensity (the use of technology less than 30 minutes a week), medium
intensity (between 30 and 75 minutes a week), and high intensity (over 75 minutes a week).
The Best Evidence Encyclopedia is a free web site created by the Johns Hopkins University School of Education’s Center for Data-Driven Reform in Education (CDDRE) under funding from the Institute of Education Sciences, U.S. Department of Education.
16
Analyzing the use of technology as a moderator variable, a statistically significant difference was
found between the three intensity categories (QB=5.85, df=2, p=0.05). The effect sizes for low,
medium, and high intensity were +0.06, +0.20, and +0.14, respectively. In general, programs
that were used more than 30 minutes a week had a bigger effect than those that were used less
than 30 minutes a week.
==============
Insert Table 13 here
==============
Level of implementation. We also found significant differences among low, medium,
and high levels of implementation. It is important to note that almost half of the studies (41%)
did not provide sufficient information about implementation, and levels of program
implementation were estimated by the authors. The average effect size of studies with a high
level of implementation (ES=+0.26) was significantly greater than those of low and medium
levels of implementation (ES=+0.12). However, the implementation ratings must be considered
cautiously because researchers who knew that there were no experimental-control differences
may have described poor implementation as the reason, while those with positive effects might
be less likely to describe implementation as poor.
==============
Insert Table 14 here
==============
Socio-economic status (SES). Effect sizes were similar in schools serving children of
low and high SES. Low SES refers to studies in which 40% or more students received free and
reduced-price lunches, and high SES refers to studies in which fewer than 40% of students
received free and reduced-price lunches. The 13 studies that involved a diverse population,
including both low and high SES students, and the 10 studies that had no SES information, were
excluded in this analysis. The p-value (0.53) of the test of heterogeneity in effect sizes suggests
that the variance in the sample of effect sizes was within the range that could be expected based
on sampling error alone. The effect sizes for low and high SES were +0.12 and +0.25,
respectively (see Table 15).
The Best Evidence Encyclopedia is a free web site created by the Johns Hopkins University School of Education’s Center for Data-Driven Reform in Education (CDDRE) under funding from the Institute of Education Sciences, U.S. Department of Education.
17
==============
Insert Table 15
==============
Discussion
The findings of this review indicate that educational technology applications produce a
positive but small effect (ES=+0.16) on mathematics achievement. Our findings are consistent
with the more recent reviews conducted by Slavin et al. (2008; 2009) and Rakes et al. (2010).
Our overall effect size falls somewhere between that of the two recent large-scale randomized
studies by Campuzzano and Dynarski (ES=+0.03) and that of previous reviews (ES=+0.31).
There are at least two possible factors that may explain the difference between our review and
previous reviews. First, as mentioned earlier, many of the previous reviews included studies of
marginal quality, which often inflate effect size estimates. In this review, we applied strict
inclusion criteria to select our studies. As a result, many studies included in other reviews were
not included in the present review. Second, none of the previous reviews included the six effect
sizes from the two most recent large-scale third party evaluation reports by Campuzzano and
Dynarski, which found minimal effects of educational technology in middle and high schools on
math achievement. Since these two reports contained studies that had large sample sizes,
including them has a negative effect on the overall effect size. For example, the overall effect
size would have changed from +0.16 to +0.18 had we excluded the six effect sizes from these
two large-scale evaluation reports. The change was more obvious at the secondary level where
the six effect sizes from these two reports changed the overall effect size from +0.14 to +0.19.
The effect size of all large randomized studies (ES=+0.06) was similar to those reported in the
Dynarski and Campuzzano studies.
Second, among the three types of educational technology applications, supplemental CAI
had the largest effect on mathematics achievement, with an effect size of +0.19. The other two
interventions, computer-management learning (CML) and comprehensive programs, had a much
smaller effect size, +0.09 and +0.06, respectively. The effect size of CML is similar to that
reported in reviews by Kulik et al. (1985) and Niemiec et al. (1987), who also found CML to
have a minimal effect on student mathematics achievement. In a recent meta-analysis
conducted by Cheung & Slavin (2011) that examined the effectiveness of educational technology
programs on reading achievement, it was found that integrated approaches such as Read 180 and
Voyager Passport, which integrated computer and non-computer instruction in the classroom,
produced a larger effect (ES=+0.28) than supplemental programs (ES=+0.11). However,
integrated approaches such as Cognitive Tutor and I Can Learn in mathematics did not produce
the same kind of effects as in reading. These findings provide some suggestive evidence that a
more integrated approach may be more effective in reading than in mathematics.
The Best Evidence Encyclopedia is a free web site created by the Johns Hopkins University School of Education’s Center for Data-Driven Reform in Education (CDDRE) under funding from the Institute of Education Sciences, U.S. Department of Education.
18
In addition to these overall findings, this review also looked at the differential impact of
educational technology on mathematics by various study and methodological features. It is
worth mentioning some of the key findings generated from these variables and how they might
impact student math outcomes.
First, 65% in this review were quasi-experimental, including matched control,
randomized quasi-experiments, and matched post-hoc experiments, and only one-third (35%)
were randomized experiments. Six out of the 26 randomized studies were conducted by
Campuzzano et al. (2009) and Dynarski et al. (2007). We also found that the effect sizes of the
quasi-experimental studies (+0.20) were about twice the size of the randomized studies (+0.08).
Our finding is consistent with findings reported by Cheung & Slavin (2011), who found very
similar differences between randomized and non-randomized studies of technology in reading.
In their review, Niemiec et al. (1987) found that “methodologically weaker studies produced
different results than strong studies … [and] the results of quasi-experimental studies have larger
variances.” Unequal variances may produce results that could be potentially unreliable and
misleading (Hedges, 1984). The present findings point to an urgent need for more practical
randomized studies in the area of educational technology for mathematics.
Second, our findings indicate that studies with small sample sizes produce, on average,
twice the effect sizes of those with large sample sizes. Similar results were also found within
each research design. The results support the findings of other research studies that made similar
comparisons (Cheung & Slavin, 2011; Pearson, Ferdig, Blomeyer, & Moran, 2005; Slavin &
Smith, 2008). This should come as no surprise for three reasons. First, small-scale studies are
often more tightly controlled than large-scale studies and, therefore, are more likely to produce
positive results. In addition, standardized tests are more likely to be used in large scale studies,
and these are usually less sensitive to treatments. For example, Li & Ma (2011) found that
studies that used non-standardized tests had larger effect sizes than those that used standardized
tests. Finally, the file-drawer effect is more likely to apply to small-scale studies with null
effects than to large-scale studies.
Third, previous reviews suggested that the use of educational technology had a bigger
effect on elementary students than secondary students (Li & Ma, 2010; Niemiec et al., 1987;
Slavin & Lake, 2008; Slavin et al., 2009). We found a similar result, but the difference between
elementary studies (ES=+0.17) and secondary studies (ES=+0.14) was not statistically different.
As Kulik (1985) argued, “High school … students apparently have less need for highly
structured, highly reactive instruction provided in computer drills and tutorials. They may be
able to acquire basic textbook information with the cues and feedback that CAI systems
provide.”
Fourth, a statistically significant difference was found among the three categories of
program intensity. Applications that required computer use of more than 30 minutes or more had
The Best Evidence Encyclopedia is a free web site created by the Johns Hopkins University School of Education’s Center for Data-Driven Reform in Education (CDDRE) under funding from the Institute of Education Sciences, U.S. Department of Education.
19
a larger effect than those that required less than 30 minutes a week. Some researchers argued
that the small effect produced by these supplemental programs could be due to low
implementation. For instance, in their study of Integrated Learning Systems (ILS), Van Dusen
and Worthen (1995) found that few teachers followed the actual ILS usage guidelines. Thus,
students typically only ended up spending between 15% and 30% of the recommended time on
the computer. Some used less than 10 minutes per week. Teachers, who often saw ILS as
supplemental technology, rarely integrated ILS instruction into regular classroom instruction.
Reviewers and researchers often treat the limited time devoted to technology as an
implementation problem, but perhaps it speaks to a fundamental problem that separate CAI
programs are not well accepted or seen as central to instruction by teachers, so teachers may not
make sure that students get the full amount of time on technology recommended by vendors.
Future studies should investigate more closely the impact of the time and integration factors for
various grade levels.
Fifth, in terms of the relationship between study recency and effectiveness, recent
reviews are consistent in failing to find improvements over time in effects of technology on
learning. It has long been assumed that, with technological advancement, student achievement
effects of technology would be improved. On the other hand, Liao (1998) and Christmann &
Badgett (2003) found no positive trend in outcomes for recent studies. We found no such
positive trend in recent studies in our review, and Cheung & Slavin (2011) also found that effects
of technology in reading were not improving over time.
Sixth, in contrast to some earlier reviews (Niemiec et al., 1987; Smith, 1980; Sterling,
1959), we found no statistically significant difference between published articles and
unpublished reports. Published articles and unpublished reports, such as dissertations and
technical reports, produced the same effect size of +0.15. There were more unpublished reports
(N=56) than published articles (N=18) in this review. However, our selection criteria screen out
studies of poor quality, so only the higher-quality unpublished studies were included.
Finally, new educational technologies such as interactive whiteboards have become
increasingly popular in US public schools. However, there is little experimental research in this
area. We found no qualifying studies on interactive whiteboards. High quality evaluations in
this area are much needed.
Conclusion
Technology has infiltrated every aspect of modern life. Classrooms are no exception.
School districts across the country have been investing a substantial amount of their annual
budgets on educational technology in an effort to boost academic performance in the past two
decades. In addition, compared to the situation a couple of decades ago, schools are in a much
The Best Evidence Encyclopedia is a free web site created by the Johns Hopkins University School of Education’s Center for Data-Driven Reform in Education (CDDRE) under funding from the Institute of Education Sciences, U.S. Department of Education.
20
better position to implement educational technology in their classrooms. Many teachers now are
more experienced and willing to use educational technology in their classroom instruction, and
educational technology is more affordable compared to a decade ago. Undoubtedly, educational
technology will continue to play an increasingly important role in the years to come. So the
question is no longer whether teachers should use educational technology or not, but rather how
best to incorporate various educational technology applications into classroom settings. The
present review indicates that incorporating supplemental programs into regular classroom
curriculum may be beneficial (Eisenberg & Johnson, 1996; C. L. C. Kulik & Kulik, 1991), and
adhering to program usage guidelines suggested by technology providers may be helpful in
improving student achievement.
Educational technology is making a modest difference in learning of mathematics. It is a
help, but not a breakthrough. However, the evidence to date does not support complacency.
New and better tools are needed to harness the power of technology to enhance mathematics
achievement for all children.
The Best Evidence Encyclopedia is a free web site created by the Johns Hopkins University School of Education’s Center for Data-Driven Reform in Education (CDDRE) under funding from the Institute of Education Sciences, U.S. Department of Education.
21
Qualifying Studies Included in the Review
Abram, S. L. (1984). The effect of computer assisted instruction on first grade phonics and
mathematics achievement computation. Unpublished doctoral dissertation, Northern
Arizona University.
Alifrangis, C. M. (1991). An integrated learning system in an elementary school:
Implementation, attitudes, and results. Journal of Computing in Childhood Education,
2(3), 51-66.
Atkins, J. (2005). The association between the use of Accelerated Math and students' math
achievement. Unpublished doctoral dissertation, East Tennessee State University.
Bailey, T. E. (1991). The effect of computer-assisted instruction in improving mathematics
performance of low achieving ninth grade students. Unpublished doctoral dissertation,
The College of William and Mary.
Barrow, L., Markman, L., & Rouse, C. E. (2008). Technology's edge: The educational benefits
of computer-aided instruction. Unpublished Working paper. National Bureau of
Economic Research.
Bass, G., Ries, R., Sharpe, W. (1986). Teaching basic skills through microcomputer assisted
instruction. Journal of Educational Computing Research, 2(2), 207-219.
Becker, H. J. (1990). Effects of computer use on mathematics achievement: Findings from a
nationwide field experiment in grade five to eight. Baltimore, Maryland: Center for
Research on Elementary and Middle Schools. (ERIC Document Reproduction Service
No. ED 342684).
Becker, H. J. (1994). MIndless or mindful use of integrated learning systems. International
Journal of Educational Research, 21(1), 65-79.
Birch, J. (2002). The effects of the Delaware Challenge Grant Program on the standardized
reading and mathematics test scores of second and third grade students in the Caesar
Rodney School District. Unpublished doctoral dissertation, Wilmington College.
Borton, W. M. (1988). The effects of computer managed mastery learning on mathematics test
scores in the elementary school. Journal of Computer-Based Instruction, 15(3), 95-98.
The Best Evidence Encyclopedia is a free web site created by the Johns Hopkins University School of Education’s Center for Data-Driven Reform in Education (CDDRE) under funding from the Institute of Education Sciences, U.S. Department of Education.
22
Boster, F. J., Yun, J. A., Strom, R., & Boster, L. J. (2005). Evaluation of New Century education
software: 7th grade mathematics academic year 2004-2005 at Grant Joint Union high
schools district: Cometrika, Inc.
Brehmer-Evans, K. A. (1994). The effects of the integrated learning system on reading and
mathematics achievement of magnet program students in the school district of the city of
River Rouge. Unpublished doctoral dissertation, Wayne State University, Detriot, MI.
Cabalo, J. V., & Vu, M. T. (2007). Comparative effectiveness of Carnegie Learning's Cognitive
Tutor Algebra I Curriculum: A report of a randomized experiment in the Maui school
district. Palo Alto, CA: Empirical Education, Inc.
Campuzano L., Dynarski, M., Agodini, R., & Rall, K. (2009). Effectiveness of reading and
mathematics software products: Findings from two student cohorts Washington, DC:
Institute of Education Sciences.
Carrier, C., Post, T. R., & Heck, W. (1985). Using microcomputers with fourth-grade students to
reinforce arithmetic skills. Journal for Research in Mathematics Education 16(1), 45-51.
Clarke, W. R. (1993). The effects of computerized instruction on the improvement and transfer of
math skills for low-skilled and below average-skilled sophomore students, considering
student gender, ethnicity, and learning style preferences. Unpublished doctoral
dissertation, University of La Verne.
Dynarski, M., Agodini, R., Heaviside, S. N., Carey, N., Campuzano, L., Means, B., et al. (2007).
Effectiveness of reading and mathematics software products: Findings from the first
student cohort. Washington, DC: Institute of Education Sciences.
Easterling, B. (1982). The effects of computer-assisted instruction as a supplement to a
classroom instruction in reading comprehension and arithmetic. Unpublished doctoral
dissertation, North Texas State University.
Estep, S. G., McInerney, W. D., Vockell, E., & Kosmoski, G. (1999-2000). An investigation of
the relationship between integrated learning systems and academic achievement. Journal
of Educational Technology Systems, 28(1), 5-19.
Fletcher, J. D., Hawley, D. E., & Piele, P. K. (1990). Costs, effects, and utility of microcomputer
assisted instruction in the classroom. American Educational Research Journal, 27(4),
783-806.
The Best Evidence Encyclopedia is a free web site created by the Johns Hopkins University School of Education’s Center for Data-Driven Reform in Education (CDDRE) under funding from the Institute of Education Sciences, U.S. Department of Education.
23
Gaeddert, T. J. (2001). Using Accelerated Math to enhance student achievement in high school
mathematics courses. Unpublished master thesis, Friends University.
Gatti, G. G., & Petrochenkov, K. (2010). Pearson SuccessMaker Math efficacy study: 2009-10
final report. Pittsburgh, PA: Gatti Evaluation Inc.
Hess, R. D., & McGarvey, L. J. (1987). School-relevant effects of educational uses of
microcomputers in kindergarten classrooms and homes. Journal of Educational
Computing Research, 3(3), 269-287.
Hotard, S. R., & Cortez, M. J. (1983). Computer assisted instruction as an enhancer of
remediation. (ERIC Document Reproduction Service No. ED 139655).
Howell, C. A. (1996). A comparison of Chapter One middle school students who received
Jostens Integrated Learing instruction and those who received Chapter One services
only. Unpublished doctoral dissertation, University of Georgia.
Hunter, C. T. L. (1994). A study of the effect of instructional method on the reading and
mathematics achievement of chapter one students in rural georgia. Unpublished doctoral
dissertation, South Carolina State University.
Johnson-Scott, P. L. (2006). The impact of Accelerated Math on student achievement.
Unpublished doctoral dissertation, Mississippi State University.
Khalili, A., & Shashaani, L. (1994). The effectiveness of computer applications: A meta-
analysis. Journal of Research on Computing in Education, 27(1), 48-62.
Kirby, P. C. (2004). Comparison of I Can Learn and traditionally-taught 8th grade general math
student performance on the California standard test, Spring 2004. New Orleans, LA: Ed-
cet, Inc.
Kirby, P. C. (2006a). I CAN Learn in Orleans parish public schools: Effects on LEAP 8th grade
math achievement, 2003-2004. New Orleans, LA: Ed-cet, Inc.
Kirby, P. C. (2006b). I CAN Learn in Orleans parish public schools: Effects on LEAP 10th grade
math achievement, 2003-2004. New Orleans, LA: Ed-cet, Inc.
Laub, C. (1995). Computer-integrated learning system and elementary student achievement in
mathematics: An evaluation study. Unpublished doctoral dissertation, Temple University.
The Best Evidence Encyclopedia is a free web site created by the Johns Hopkins University School of Education’s Center for Data-Driven Reform in Education (CDDRE) under funding from the Institute of Education Sciences, U.S. Department of Education.
24
LeapFrog Schoolhouse. (2004). An evaluation of the LeapTrack assessment and instruction
system in Oakland 1st-4th grade classrooms. Emeryville, CA: LeapFrog Schoolhouse.
Levy, M. H. (1985). An evaluation of computer-assisted instruction upon the achievement of fifth
grade students as measured by standardized tests. Unpublished doctoral dissertation,
University of Bridgeport.
Manuel, S. L. Q. (1987). The relationship between supplemental computer assisted mathematics
instruction and student achievement. Unpublished doctoral dissertation, The University
of Nebraska.
McCart, C. L. (1996). Use of an Integrated Learning System in improving achievement for at-
risk students on the New Jersey Early Warning Test. Unpublished doctoral dissertation,
Temple University.
Metrics Associates Inc. (1981). Evaluation of the computer-assisted instruction Title I project,
1980-1981. Chelmsford, MA: Metrics Associates, Inc. (ERIC Document Reproduction
Service No. ED 233122).
Meyer, P. A. F. (1986). A comparative analysis of the value of intrinsic motivation in computer
software on the math achievement, attitudes, attendance, and depth-of-involvement of
underachieving students. Unpublished Doctoral dissertation, The College of William and
Mary, Virginia.
Miller, H. (1997). Quantitative analyses of student outcome measures. International Journal of
Education Research, 25, 119-136.
Mintz, K. S. (2000). A comparison of computerized and traditional instruction in elementary
mathematics. Unpublished doctoral dissertation, The University of Alabama.
Moore, B. M. (1988). Achievement in basic math skills for low performing students: A study of
teachers' affect and CAI. The Journal of Experimental Education, 57(1), 38-44.
Morgan, C. E., Sangston, B. J., & Pokras, R. (1977). Evaluation of computer-assisted
instruction, 1975-1976. Rockville, MD: Montgomery County Public Schools. (ERIC
Document Reproduction Service No. ED 139655).
Nunnery, J. A., Ross, S. M. (2007). Effects of the School Renaissance program on student
achievement in reading and mathematics. Research in the Schools, 14(1), 40.
The Best Evidence Encyclopedia is a free web site created by the Johns Hopkins University School of Education’s Center for Data-Driven Reform in Education (CDDRE) under funding from the Institute of Education Sciences, U.S. Department of Education.
25
Pane, J. F., McCaffrey, D. F., Slaughter, M. E., Steele, J. L., & Ikemoto, G. S. (2010). An
experiment to evaluate the efficacy of Cognitive Tutor Geometry. Journal of Research on
Educational Effectiveness, 3, 254-281.
Pike, D. C. (1991). Computer-assisted instruction and student achievement in Chapter I schools.
Unpublished doctoral dissertation, University of Georgia, Georgia.
Resendez, M., Azrin, M., & Strobel, A. (2009). A study on the effects of Pearson's 2009
enVisionMATH program: Final summative report. Jackson, WY: PRES Associates.
Rogosta, M. (1983). Computer-assisted instruction and compensatory education: A longitudinal
analysis. Machine-Mediated Learning, 1(1), 97-127.
Ross, S. M., & Nunnery, J. A. (2005). The effect of School Renaissance on student achievement
in two Mississippi school districts. Memphis: Center for Research in Educational Policy.
Rutherford, T., Kibrick, M., Burchinal, M., Richland, L., Conley, A., Osborn, K., et al. (2010).
Spatial Temporal Mathematics at scale: An innovative and fully developed paradigm to
boost math achievement among all learners. Paper presented at the American
Educational Research Association.
Schmidt, S. (1991). Technology for the 21st century: The effects of an integrated distributive
computer network system on student achievement. Unpublished doctoral dissertation,
University of La Verne.
Shanoski, L. A. (1986). An analysis of the effectiveness of using microcomputer assisted
mathematics instruction with primary and intermediate level students. Unpublished
doctoral dissertation, Indiana University of Pennsylvania.
Shneyderman, A. (2001). Evaluation of the Cognitive Tutor Algebra I Program. Miami, FL:
Office of Evaluation and Research, Miami-Dade County Public Schools.
Smith, J. E. (2001). The effect of the Carnegie Algebra Tutor on student achievement and
attitude in introductory high school algebra. Unpublished doctoral dissertation, Virginia
Polytechnic Institute and State University, Blacksburg, VA.
Spencer, T. M. (1999). The systemic impact of integrated learning system on mathematics
achievement. Unpublished doctoral dissertation, Eastern Michigan University.

The Best Evidence Encyclopedia is a free web site created by the Johns Hopkins University School of Education’s Center for Data-Driven Reform in Education (CDDRE) under funding from the Institute of Education Sciences, U.S. Department of Education.
26
Spicuzza, R., Ysseldyke, J., Lemkuil, A., Kosciolek, S., Boys, C., & Teelucksingh, E. (2001).
Effects of curriculum-based monitoring on classroom instruction and math achievement.
Journal of School Psychology, 39(6), 521-542.
Thayer, J. (1992). The effect of the use of computer-assisted instruction (CAI) on attitudes and
computational scores of developmental mathematics students at two inner-city schools
with predominately Black enrollment. Unpublished doctoral dissertation, Florida
International University.
Todd, W. E. (1985). Effects of computer-assisted instruction on attitudes and achievement of
fourth grade students in reading and mathematics. Unpublished Doctoral dissertation,
University of North Texas, Texas.
Turner, L. G. (1985). An evaluation of the effects of paired learning in a mathematics computer-
assisted-instruction program. Unpublished doctoral dissertation, Arizona State
University.
Van Dusen, L. M., & Worthen, B. R. (1995). Can intergrated instructional technology transform
the classroom? Educational Leadership, 53(2), 28-33.
Watkins, M. W. (1986). Microcomputer-based math instruction with first-grade students.
Computers in Human Behavior, 2, 71-75.
Webster, A. H. (1990). The relationship of computer assisted instruction to mathematics
achievement, student cognitive styles, and student and teacher attitudes. Unpublished
doctoral dissertation, Delta State University, Cleveland, MI.
Whitaker, J. C. (2005). Impact of an integrated learning system on reading and mathematics
achievement. Unpublished doctoral dissertation, Tennessee State University.
Wijekumar, K., Hitchcock, J., Turner, H., Lei, P. W., & Peck, K. (2009). A multisite cluster
randomized trial of the effects of CompassLearning Odyssey Math on the math
achievement of selected grade 4 students in the mid-Atlantic region: Final report.
Washington, D. C.: Institute of Education Sciences, U. S. Department of Education.
Ysseldyke, J., & Bolt, D. M. (2007). Effect of technology-enhanced continuous progress
monitoring on math achievement. School Psychology Review, 36(3), 453-467.
Ysseldyke, J., Spicuzza, R., Kosciolek, S., Teelucksingh, E., Boys, C., & Lemkuil, A. (2003).
Using a curriculum-based instructional management system to enhance math
The Best Evidence Encyclopedia is a free web site created by the Johns Hopkins University School of Education’s Center for Data-Driven Reform in Education (CDDRE) under funding from the Institute of Education Sciences, U.S. Department of Education.
27
achievement in urban schools. Journal of Education for Students Placed at Risk, 8(2),
247-265.
The Best Evidence Encyclopedia is a free web site created by the Johns Hopkins University School of Education’s Center for Data-Driven Reform in Education (CDDRE) under funding from the Institute of Education Sciences, U.S. Department of Education.
28
References
Bangert-Drowns, R. L., Kulik, J. A., & Kulik, C. L. C. (1985). Effectiveness of computer-based
education in secondary schools. Journal of Computer-Based Instruction, 12, 59-68.
Becker, H. J. (1992). Computer-based integrated learning systems in the elementary and middle
grades: A critical review and synthesis of evaluation reports. Journal of Educational
Computing Research, 8(1), 1-41.
Borenstein, M., Hedges, L. V., Higgins, J. P. T., & Rothstein, H. R. (2009). Introduction to
Meta-analysis. West Sussex: Wiley.
Brush, T. A. (1997). The effects on student achievement and attitudes when using integrated
learning systems with cooperative pairs. Educational Technology Research and
Development, 45(1), 51-54.
Burns, P. K. (1981). A quantitative synthesis of research findings relative to the pedagogical
effectiveness of computer-assisted instruction in elementary and secondary schools.
Burns, P. K., & Bozeman, W. C. (1981). Computer-assisted instruction and mathematics
achievement: Is there a relationship? Educational Technology, 21(10), 32-39.
Campuzano L., Dynarski, M., Agodini, R., & Rall, K. (2009). Effectiveness of reading and
mathematics software products: Findings from two student cohorts Washington, DC:
Institute of Education Sciences.
Cheung, A., & Slavin, R. E. (2011). The effectiveness of education technology for enhancing
reading achievement: A meta-analysis. from The Center for Research and Reform in
Education, Johns Hopkins University:
http://www.bestevidence.org/reading/tech/tech.html
Christmann, E. P., & Badgett, J. L. (2003). A meta-analytic comparison of the effects of
computer-assisted instruction on elementary students' academic achievement.
Information Technology in Childhood Education Annual, 91-104.
Dersimonian, R., & Laird, N. (1986). Meta-analysis in clinical trials. Controlled Clinical Trials,
7, 177-188.
Dynarski, M., Agodini, R., Heaviside, S. N., Carey, N., Campuzano, L., Means, B., et al. (2007).
Effectiveness of Reading and Mathematics Software Products: Findings from the First
Student Cohort. Washington, DC: Institute of Education Sciences.
The Best Evidence Encyclopedia is a free web site created by the Johns Hopkins University School of Education’s Center for Data-Driven Reform in Education (CDDRE) under funding from the Institute of Education Sciences, U.S. Department of Education.
29
Edwards, J., Norton, S., Taylor, S., Weiss, M., & Dusseldoph, R. (1975). How effective is CAI?
A review of research. Educational Leadership, 33(2), 147-153.
Eisenberg, M. B., & Johnson, D. (1996). Computer skills for information problem-solving:
Learning and teaching technology in context. (ERIC Document Reproduction Service
No. ED 392463).
Fletcher-Finn, C., & Gravatt, B. (1995). The efficacy of computer-assisted instruction (CAI): A
meta-analysis. Journal of Educational Computing Research, 12(3), 219-241.
Funkhouser, C. (2003). The effects of computer-augmented geometry instruction on student
performance and attitudes. Journal of Research on Technology in Education, 35, 163-
175.
Glass, G., McGaw, B., & Smith, M. L. (1981). Meta-analysis in social research. Beverly Hills,
CA: Sage.
Hartley, S. S. (1977). Meta-analysis of the effects of individually paced instruction in
Mathematics. Unpublished Doctoral dissertation, University of Colorado at Boulder.
Hedges, L. V. (1984). Meta-analysis: Statistics issues. Paper presented at the American
Educational Research Association, New Orleans, USA.
Hedges, L. V., & Olkins, I. (1980). Vote counting methods in research synthesis. Psychological
Bulletin, 88, 359-369.
Jamison, D. N., Suppes, P., & Wells, S. (1974). Effectiveness of alternative instructional media.
Review of Educational Research, 44(1), 1-67.
Khalili, A., & Shashaani, L. (1994). The effectiveness of computer applications: A meta-
analysis. Journal of Research on Computing in Education, 27(1), 48-62.
Kulik, C. L. C., & Kulik, J. A. (1991). Effectiveness of computer-based instruction: An updated
analysis. Computers in Human Behavior, 7(1-2), 75-94.
Kulik, J. A. (2003). Effects of using instructional technology in elementary and secondary
schools: What controlled evaluation studies say. Arlington, VA: SRI International.
Kulik, J. A., Bangert-Drowns, R. L., & Williams, G. W. (1983). Effects of computer based
teaching on secondary school students. Journal of Educational Psychology, 75, 19-26.

The Best Evidence Encyclopedia is a free web site created by the Johns Hopkins University School of Education’s Center for Data-Driven Reform in Education (CDDRE) under funding from the Institute of Education Sciences, U.S. Department of Education.
30
Kulik, J. A., & Kulik, C. L. C. (1987). Review of recent research literature on computer-based
instruction. Contemporary Educational Psychology, 12, 222-230.
Kulik, J. A., Kulik, C. L. C., & Bangert-Browns, R. L. (1985). Effectiveness of computer-based
education in elementary schools. Computers in Human Behavior, 1, 59-74.
Lee, W. C. (1990). The effectiveness of computer assisted instruction and computer
programming in elementary and secondary mathematics: A meta-analysis. University of
Massachusetts-Amherst, Amherst.
Li, Q., & Ma, X. (2010). A meta-analysis of the effects of computer technology on school
students' mathematics learning. Educational Psychology Review, 22, 215-243.
Liao, Y. K. (1998). Effects of hypermedia versus traditional instruction on students'
achievement: A meta-analysis. Journal of Research on Computing in Education 30(4),
341-359.
Liao, Y. K. (1999). Effects of hypermedia on students' achievement: A meta-analysis. Journal of
Educational Multimedia and Hypermedia, 8(3), 255-277.
Lipsey, M. W., & Wilson, D. B. (2001). Practical meta-analysis. Thousand Oaks: Sage.
Mevarech, Z. R. (1994). The effectiveness of individualized versus cooperative compute-based
integrated learning systems. International Journal of Education Research, 27(2), 39-52.
Meyer, M. M., & Feinberg, S. E. (1992). Assessing evaluation studies: The case of bilingual
education strategies. Washington, DC: National Academy of Sciences.
National Assessment of Educational Progress. (2011). Grade 4 and 8 National Mathematics
Results. Retrieved May, 1, 2011, from http://nationsreportcard.gov/math_2009/
National Council of Teachers of Mathematics. (2011). Principles and standards for mathematics
education. Retrieved April 23, 2011, from
http://www.nctm.org/standards/content.aspx?id=26792
Niemiec, R. P., Samson, G., Weinstein, T., & Walberg, H. J. (1987). The effects of computer
based instruction in elementary schools: A quantitative synthesis. Journal of Research on
Computing in Education, 20(2), 85-103.
Niemiec, R. P., & Walberg, H. J. (1987). Comparative effects of computer-assisted instruction:
A synthesis of reviews. Journal of Educational Computing Research, 3, 19-37.
The Best Evidence Encyclopedia is a free web site created by the Johns Hopkins University School of Education’s Center for Data-Driven Reform in Education (CDDRE) under funding from the Institute of Education Sciences, U.S. Department of Education.
31
Ouyang, R. (1993). A meta-analysis: Effectiveness of computer-assisted instruction at the level
of elementary education. Unpublished Dissertation, Indiana University of Pennsylvania,
Indiana.
Pearson, P. D., Ferdig, R. E., Blomeyer, R. L., & Moran, J. (2005). The effects of technology on
reading performance in the middle-school grades: A meta-analysis with
recommendations for policy. Naperville, IL: Learning Point Associates.
Rakes, C. R., Valentine, J. C., McGatha, M. B., & Ronau, R. N. (2010). Methods of instructional
improvement in Algebra: A systematic review and meta-analysis. Review of Educational
Research, 80(3), 372-400.
Schmidt, F. L., Oh, I. S., & Hayes, T. L. (2009). Fixed- versus random-effects models in meta-
analysis: Model properties and an empirical comparison of differences in results. British
Journal of Mathematical and Statistical Psychology, 62, 97-128.
Sedlmeier, P., & Gigerenzer, G. (1989). Do studies of statistical power have an effect on the
power of studies? Psychological Bulletin, 105, 309-316.
SETDA. (2010). National educational technology trends: 2010. Retrieved August 1, 2010:
www.setda.org
Shadish, W. R., Cook, T. D., & Campbell, D. T. (2002). Experimental and quasi-experimental
designs for generalized causal inference. Boston: Houghton-Mifflin.
Slavin, R. E., & Lake, C. (2008). Effective programs in elementary mathematics: A best
evidence synthesis. Review of Educational Research, 78(3), 427-455.
Slavin, R. E., Lake, C., & Groff, C. (2009). Effective programs in middle and high school
mathematics: A best evidence synthesis. Review of Educational Research, 79(2), 839-
911.
Slavin, R. E., & Madden, N.A. (In press). Measures inherent to treatments in program
effectiveness reviews. Journal of Research on Educational Effectiveness.
Slavin, R. E., & Smith, D. (2008). Effects of sample size on effect size in systematic reviews in
education. Educational Evaluation and Policy Analysis, 31(4), 500-506.
Smith, M. (1980). Publication bias and meta-analysis. Evaluation in Education, 4, 22-24.
The Best Evidence Encyclopedia is a free web site created by the Johns Hopkins University School of Education’s Center for Data-Driven Reform in Education (CDDRE) under funding from the Institute of Education Sciences, U.S. Department of Education.
32
Sterling, T. (1959). Publication decisions and their possible effects on inferences drawn from
tests of significance--or vice versa. Journal of the American Statistical Association,
54(30-34).
Van Dusen, L. M., & Worthen, B. R. (1995). Can intergrated instructional technology transform
the classroom? Educational Leadership, 53(2), 28-33.
Vinsonhaler, J. F., & Bass, R. K. (1972). A summary of ten major studies on CAI drill and
practice. Educational Technology, 12, 29-32.
Wodarz, N. (1994). The effects of computer usage on elementary students' attitudes, motivation
and achievement in mathematics. Unpublished doctoral dissertation, Northern Arizona
University.
Ysseldyke, J., Spicuzza, R., Kosciolek, S., & Boys, C. (2003). Effects of a learning information
system on mathematics achievment and classroom structure. Journal of Educational
Research, 96(163-173).
Ysseldyke, J., Spicuzza, R., Kosciolek, S., Teelucksingh, E., Boys, C., & Lemkuil, A. (2003).
Using a curriculum-based instructional management system to enhance math
achievement in urban schools. Journal of Education for Students Placed at Risk, 8(2),
247-265.
Zumwalt, D. (2001). The effectiveness of computer aided instruction in eighth grade pre-algebra
classrooms in Idaho. Unpublished doctoral dissertation, Idaho State University.
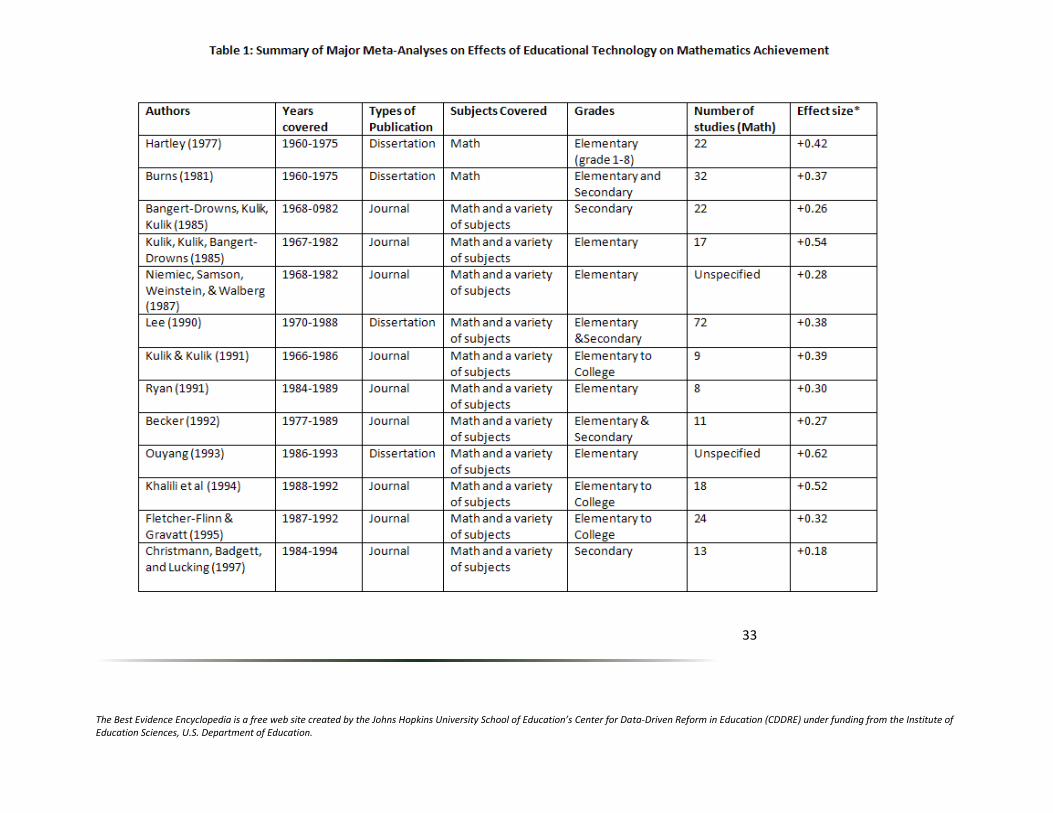
The Best Evidence Encyclopedia is a free web site created by the Johns Hopkins University School of Education’s Center for Data-Driven Reform in Education (CDDRE) under funding from the Institute of Education Sciences, U.S. Department of Education.
33
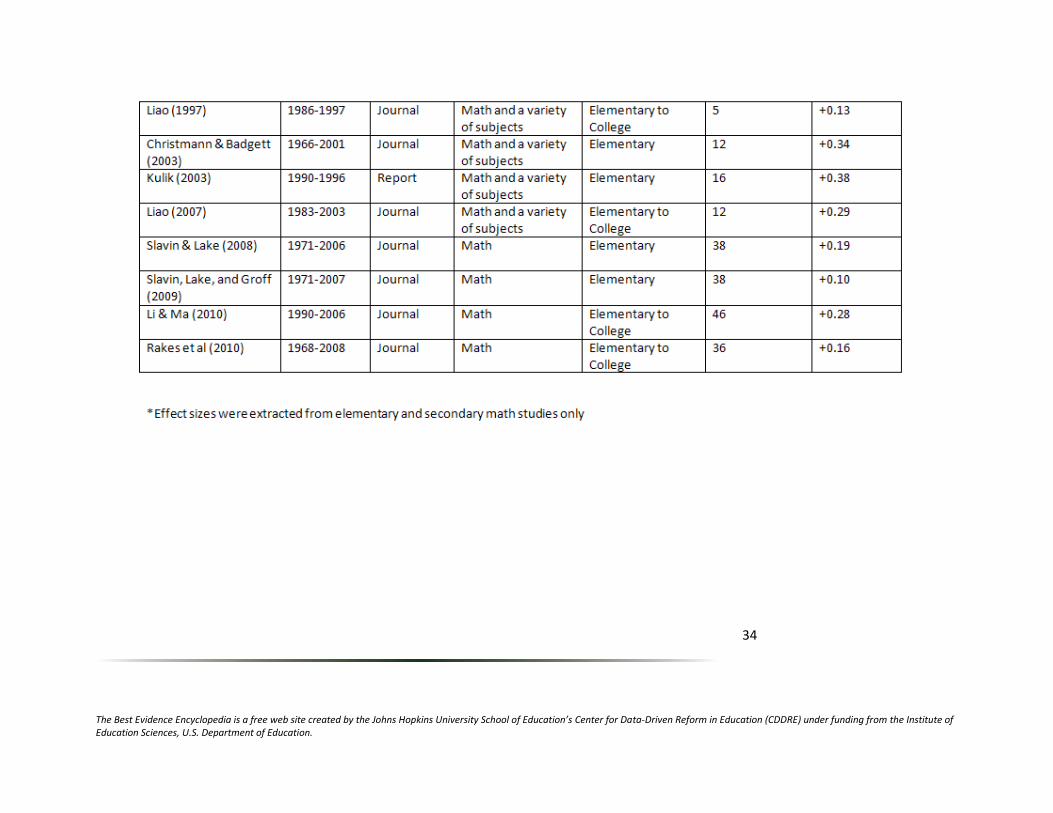
The Best Evidence Encyclopedia is a free web site created by the Johns Hopkins University School of Education’s Center for Data-Driven Reform in Education (CDDRE) under funding from the Institute of Education Sciences, U.S. Department of Education.
34

The Best Evidence Encyclopedia is a free web site created by the Johns Hopkins University School of Education’s Center for Data-Driven Reform in Education (CDDRE) under funding from the Institute of Education Sciences, U.S. Department of Education.
35
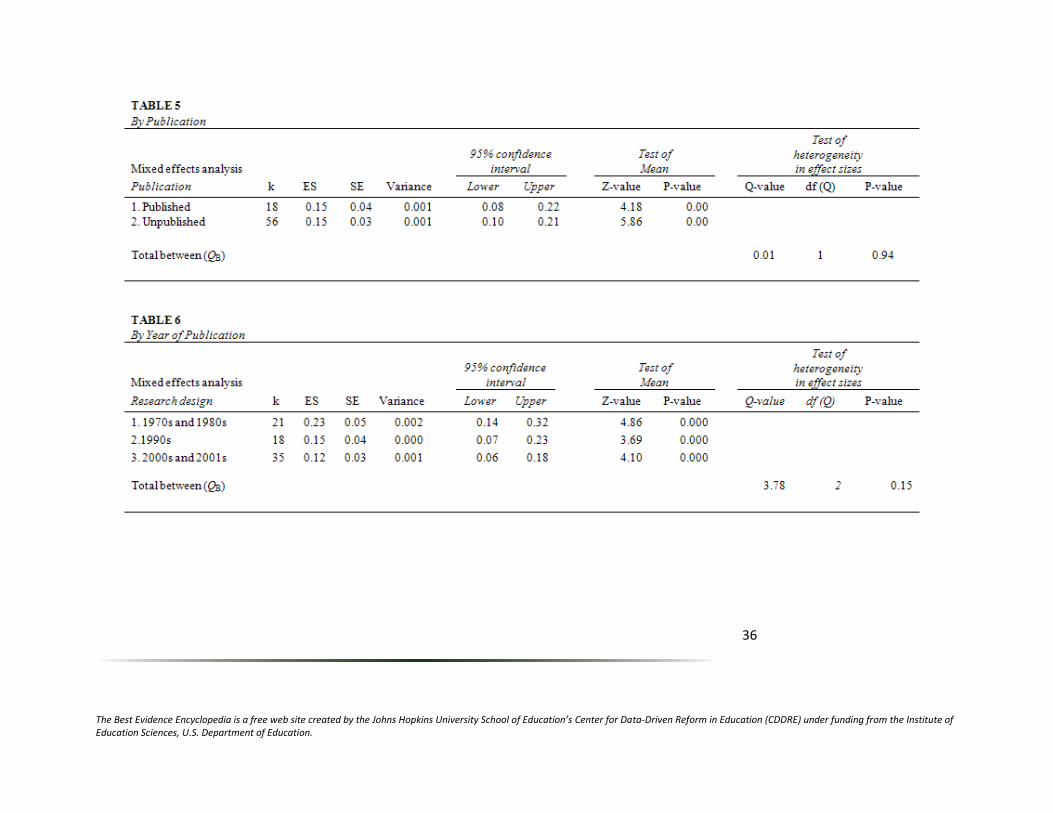
The Best Evidence Encyclopedia is a free web site created by the Johns Hopkins University School of Education’s Center for Data-Driven Reform in Education (CDDRE) under funding from the Institute of Education Sciences, U.S. Department of Education.
36
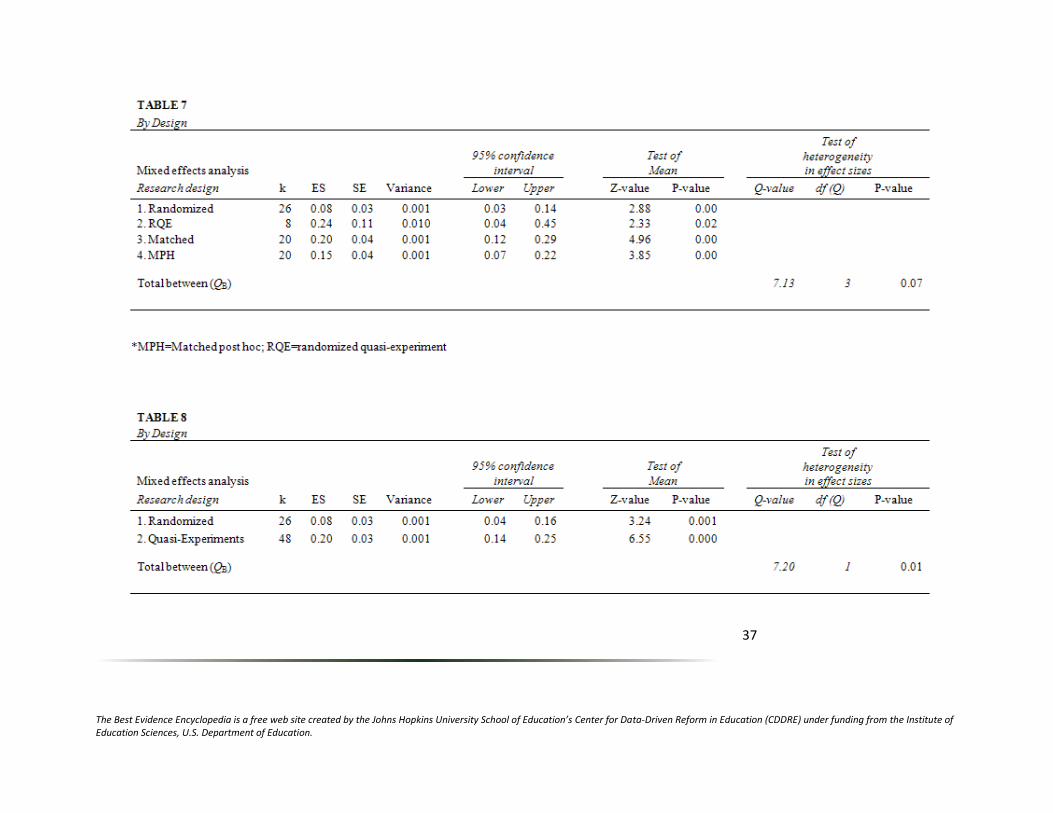
The Best Evidence Encyclopedia is a free web site created by the Johns Hopkins University School of Education’s Center for Data-Driven Reform in Education (CDDRE) under funding from the Institute of Education Sciences, U.S. Department of Education.
37

The Best Evidence Encyclopedia is a free web site created by the Johns Hopkins University School of Education’s Center for Data-Driven Reform in Education (CDDRE) under funding from the Institute of Education Sciences, U.S. Department of Education.
38
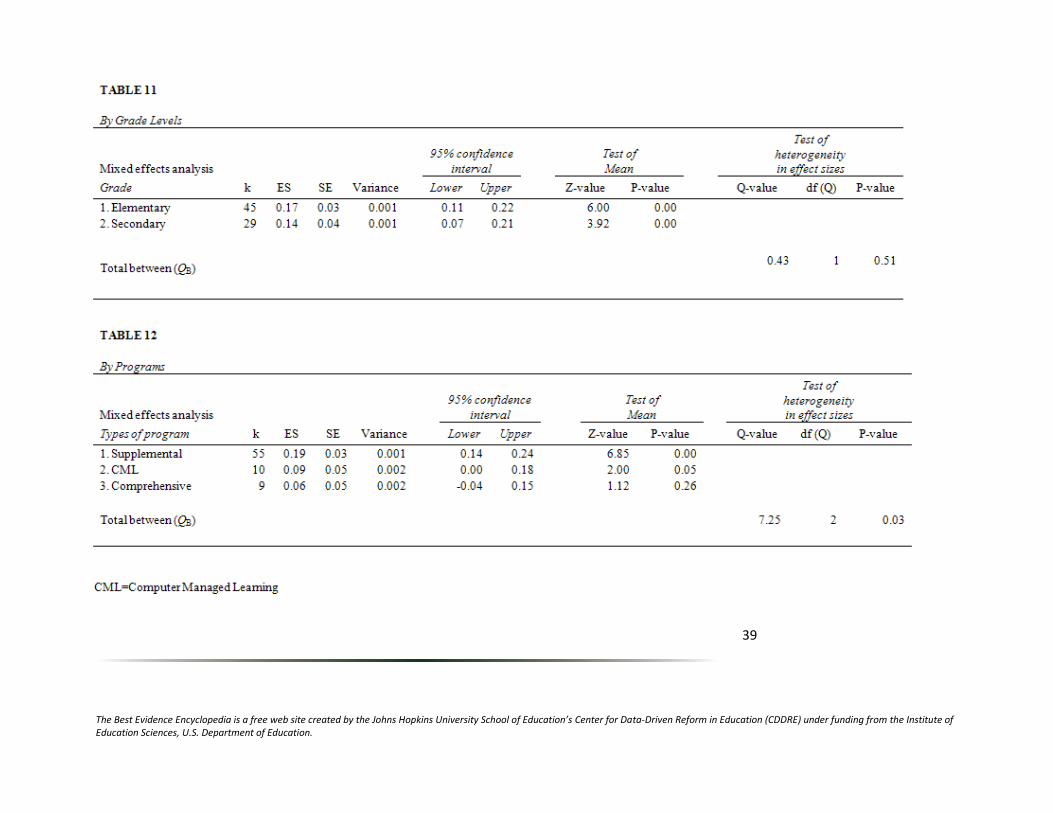
The Best Evidence Encyclopedia is a free web site created by the Johns Hopkins University School of Education’s Center for Data-Driven Reform in Education (CDDRE) under funding from the Institute of Education Sciences, U.S. Department of Education.
39
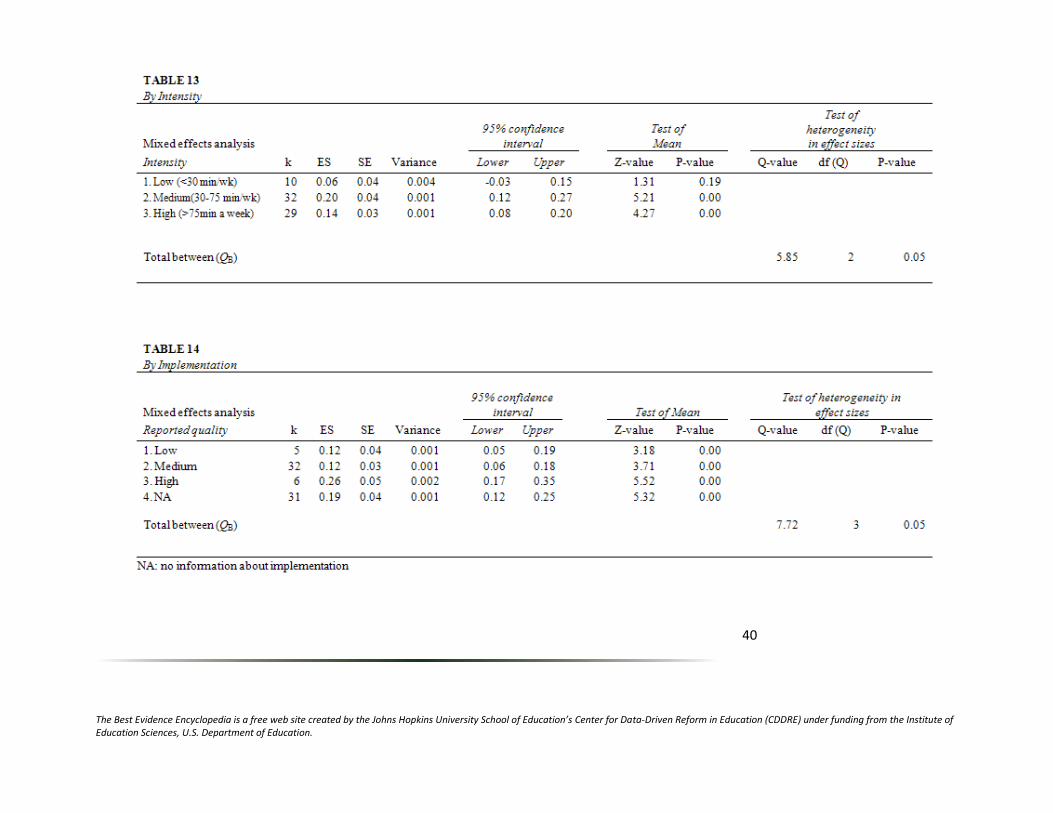
The Best Evidence Encyclopedia is a free web site created by the Johns Hopkins University School of Education’s Center for Data-Driven Reform in Education (CDDRE) under funding from the Institute of Education Sciences, U.S. Department of Education.
40
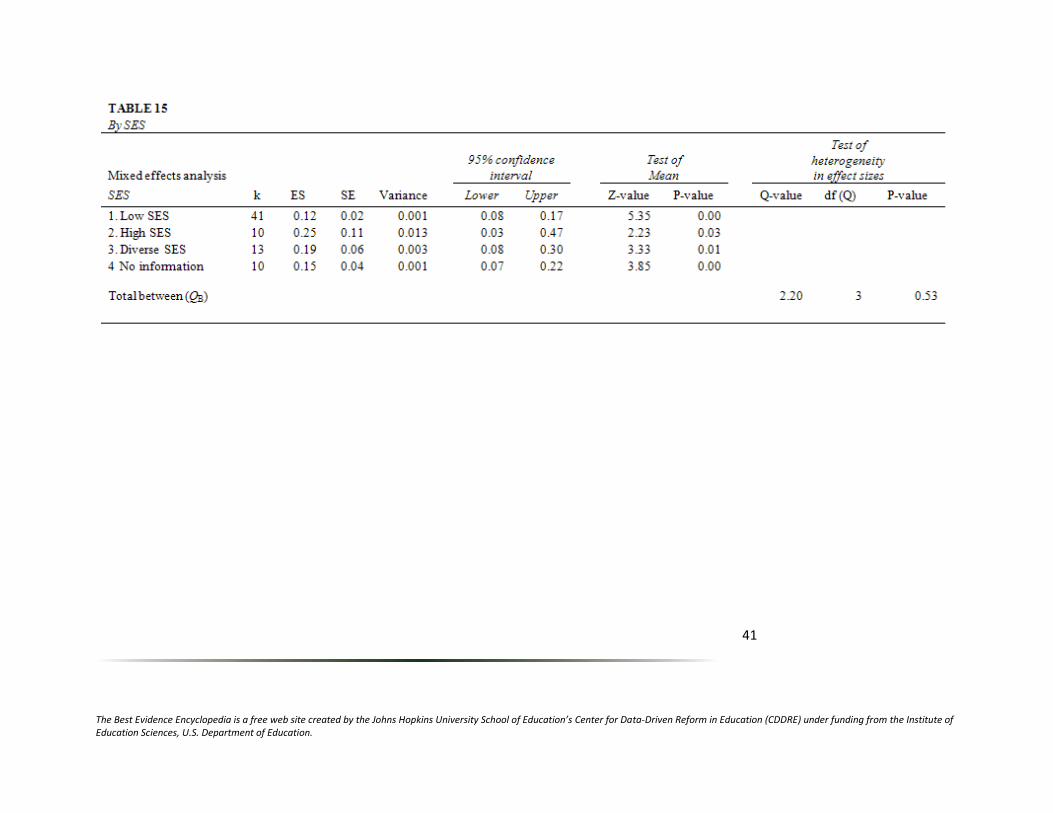
The Best Evidence Encyclopedia is a free web site created by the Johns Hopkins University School of Education’s Center for Data-Driven Reform in Education (CDDRE) under funding from the Institute of Education Sciences, U.S. Department of Education.
41
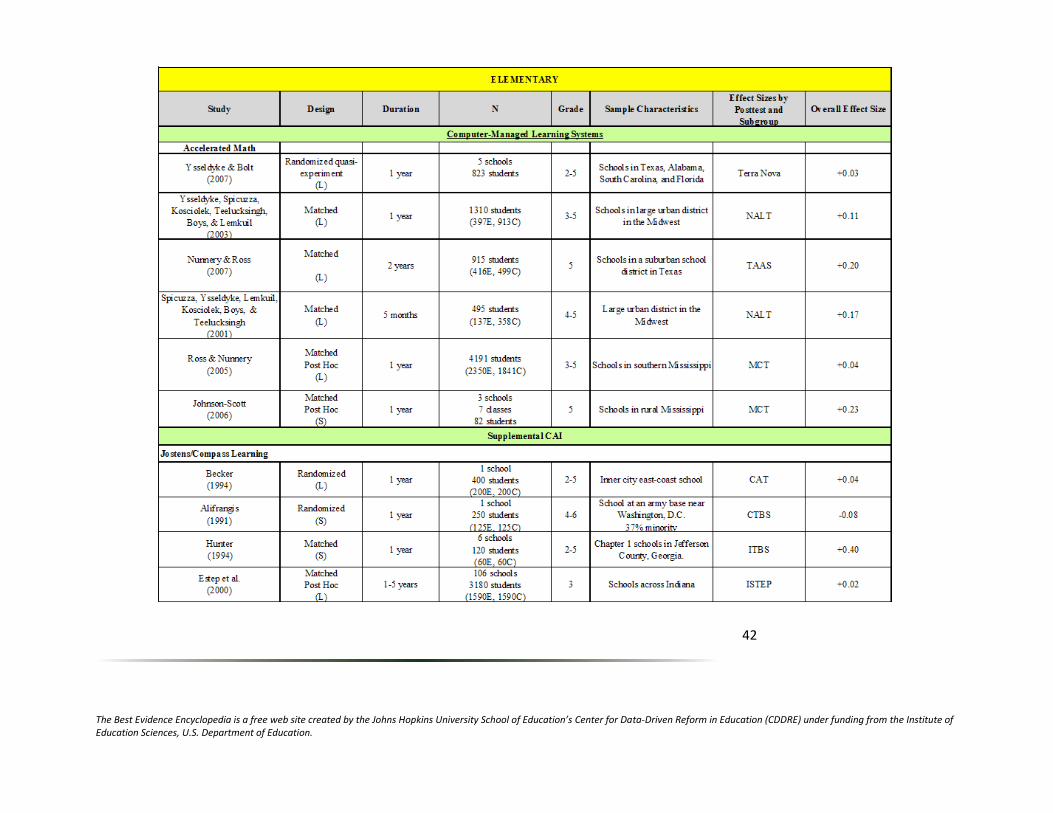
The Best Evidence Encyclopedia is a free web site created by the Johns Hopkins University School of Education’s Center for Data-Driven Reform in Education (CDDRE) under funding from the Institute of Education Sciences, U.S. Department of Education.
42
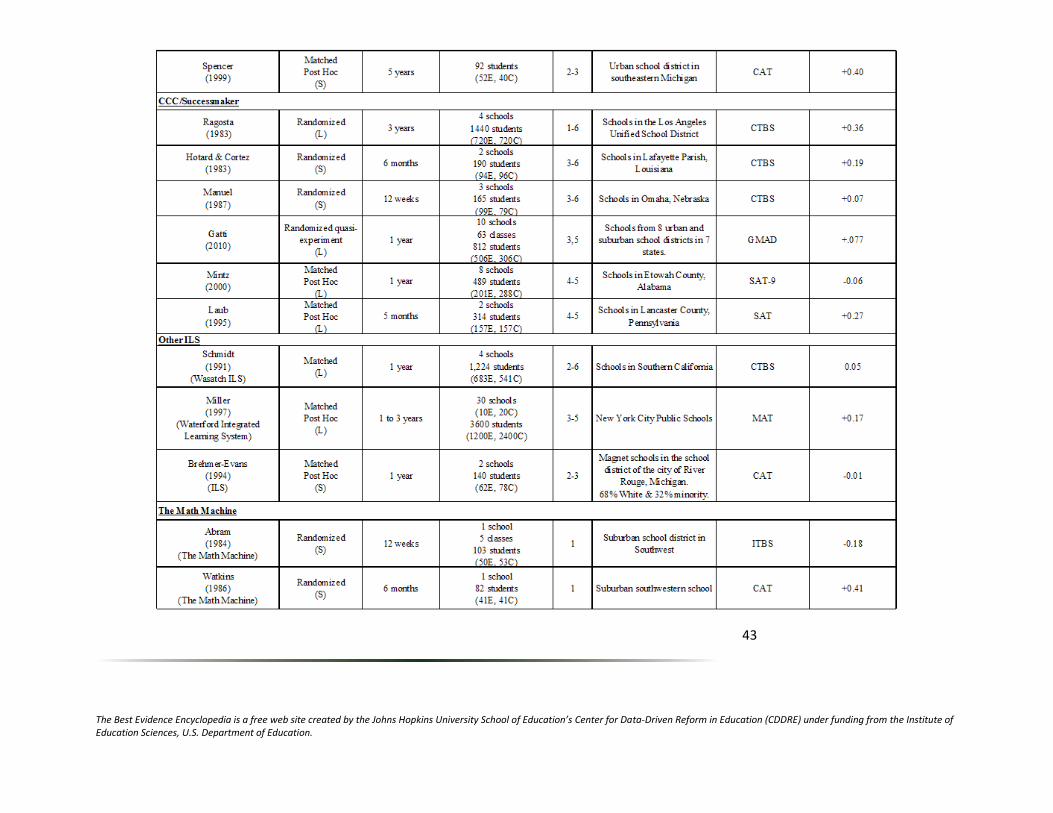
The Best Evidence Encyclopedia is a free web site created by the Johns Hopkins University School of Education’s Center for Data-Driven Reform in Education (CDDRE) under funding from the Institute of Education Sciences, U.S. Department of Education.
43

The Best Evidence Encyclopedia is a free web site created by the Johns Hopkins University School of Education’s Center for Data-Driven Reform in Education (CDDRE) under funding from the Institute of Education Sciences, U.S. Department of Education.
44
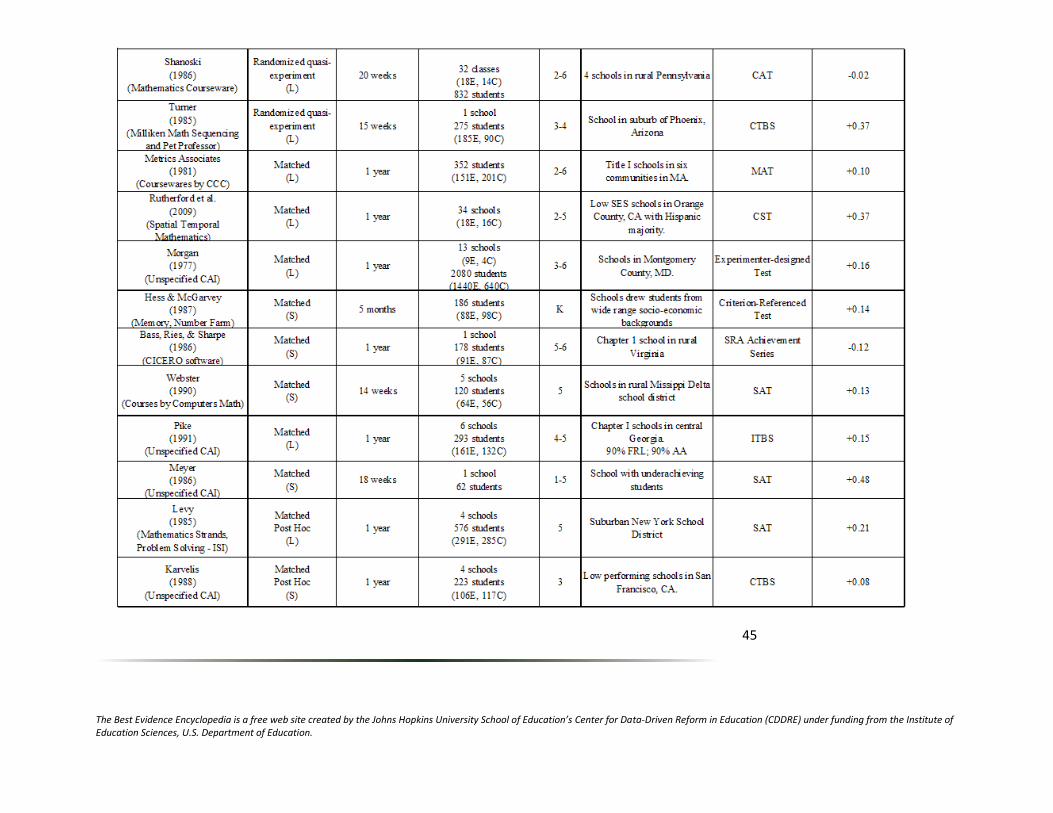
The Best Evidence Encyclopedia is a free web site created by the Johns Hopkins University School of Education’s Center for Data-Driven Reform in Education (CDDRE) under funding from the Institute of Education Sciences, U.S. Department of Education.
45
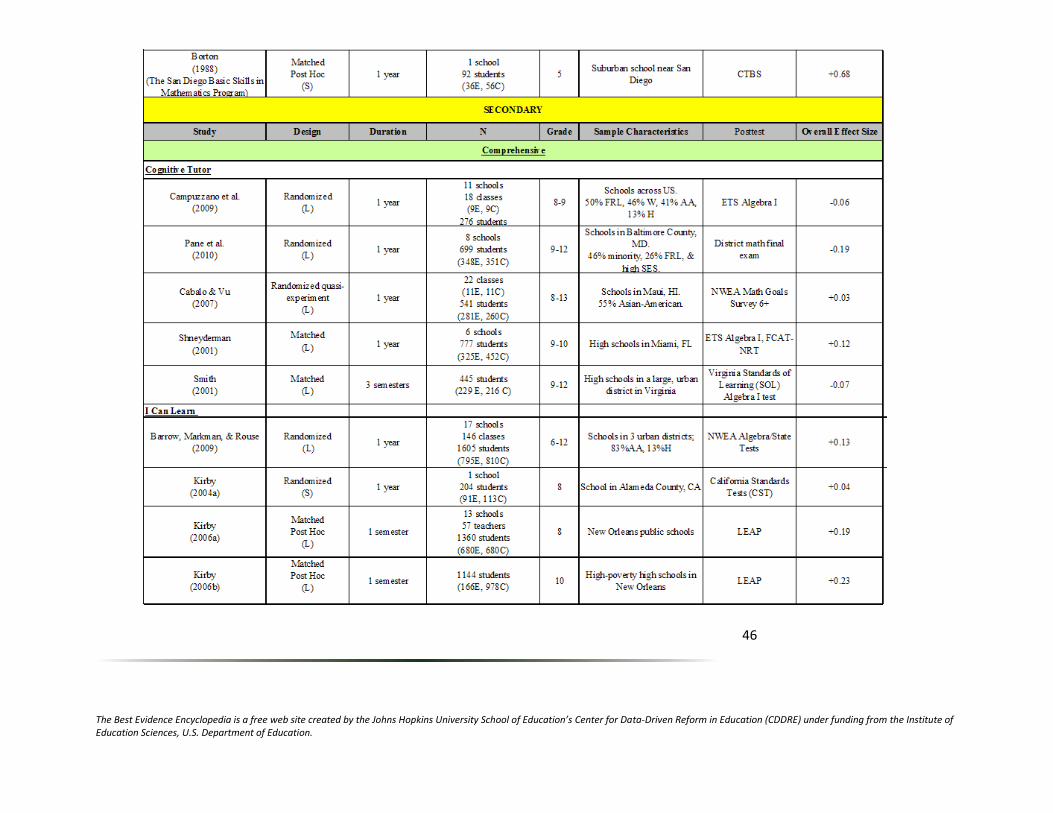
The Best Evidence Encyclopedia is a free web site created by the Johns Hopkins University School of Education’s Center for Data-Driven Reform in Education (CDDRE) under funding from the Institute of Education Sciences, U.S. Department of Education.
46
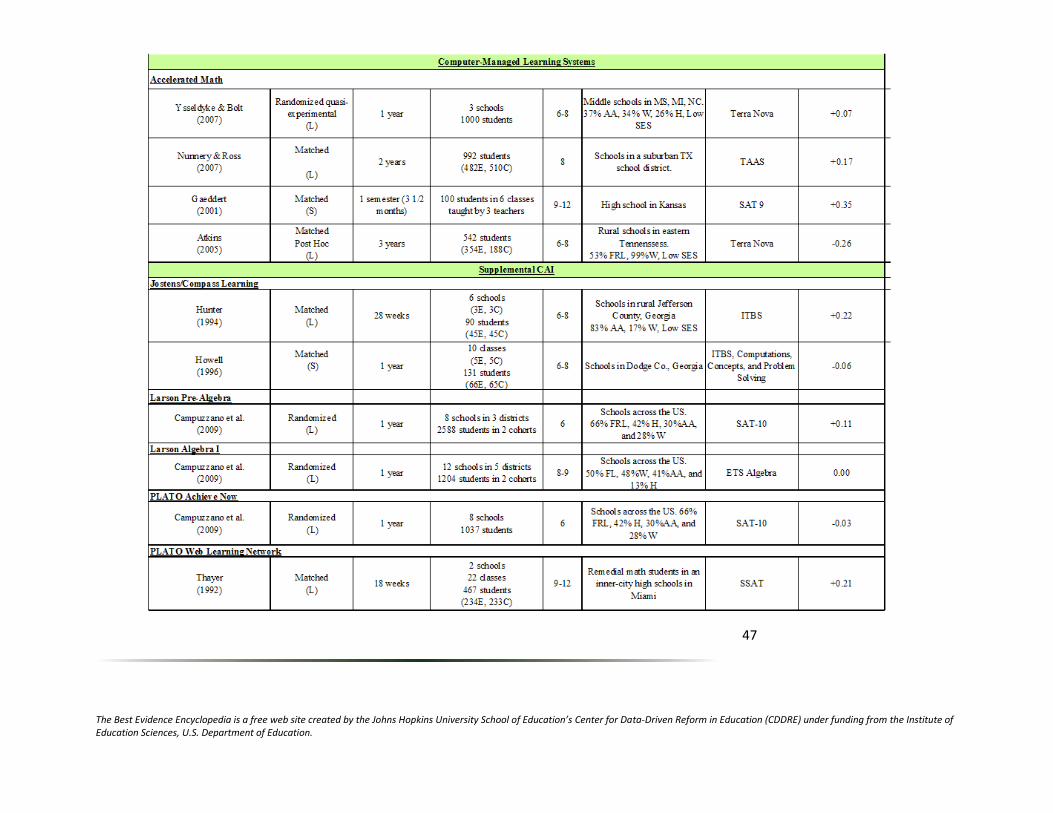
The Best Evidence Encyclopedia is a free web site created by the Johns Hopkins University School of Education’s Center for Data-Driven Reform in Education (CDDRE) under funding from the Institute of Education Sciences, U.S. Department of Education.
47
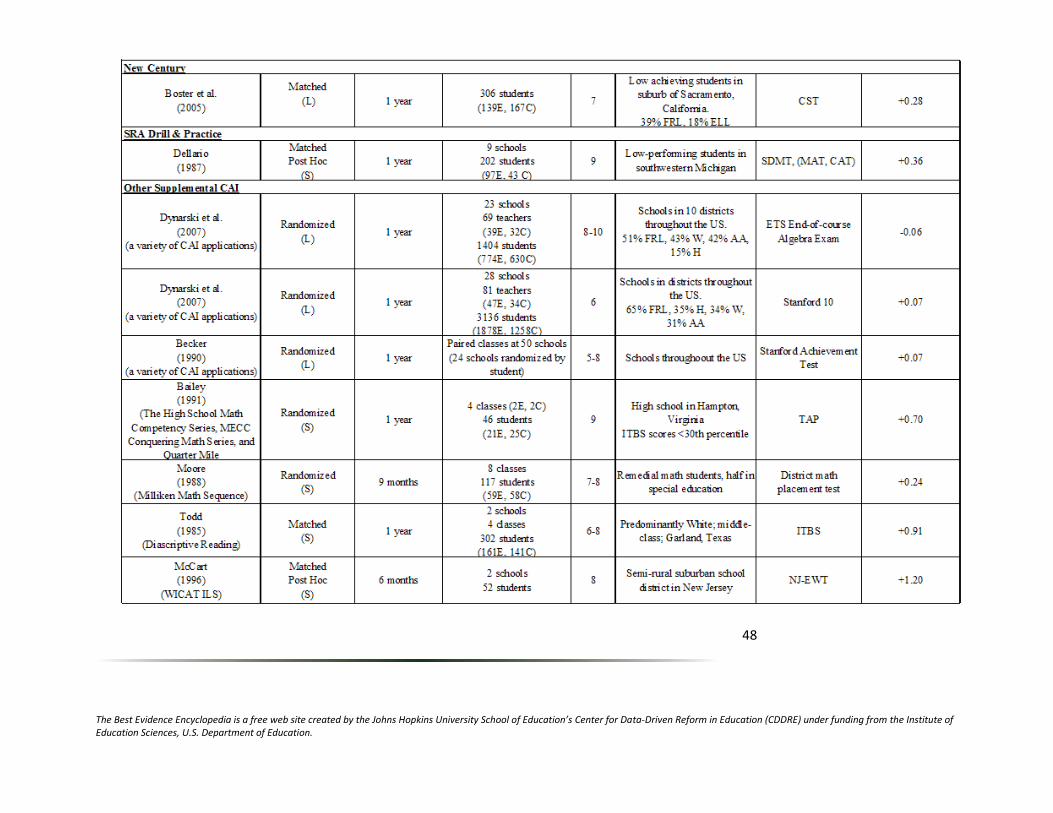
The Best Evidence Encyclopedia is a free web site created by the Johns Hopkins University School of Education’s Center for Data-Driven Reform in Education (CDDRE) under funding from the Institute of Education Sciences, U.S. Department of Education.
48
Recommended