Embed Size (px)
Citation preview
The Best Evidence Encyclopedia is a free web site created by the Johns Hopkins University School of Education’s Center for Data-Driven Reform in Education (CDDRE) under funding from the Institute of Education Sciences, U.S. Department of Education.
1
The Effectiveness of Educational Technology
Applications for Enhancing Reading
Achievement in K-12 Classrooms:
A Meta-Analysis
Alan C. K. Cheung
Johns Hopkins University
Robert E. Slavin
Johns Hopkins University
and University of York
Updated April 2012
The Best Evidence Encyclopedia is a free web site created by the Johns Hopkins University School of Education’s Center for Data-Driven Reform in Education (CDDRE) under funding from the Institute of Education Sciences, U.S. Department of Education.
2
Abstract
The purpose of this review is to learn from rigorous evaluations of alternative technology
applications how features of using technology programs and characteristics of their evaluations
affect reading outcomes for students in grades K-12. The review applies consistent inclusion
standards to focus on studies that met high methodological standards. A total of 84 qualifying
studies based on over 60,000 K-12 participants were included in the final analysis. Consistent
with previous reviews of similar focus, the findings suggest that educational technology
applications generally produced a positive, though small, effect (ES=+0.16) in comparison to
traditional methods. There were differential impacts of various types of educational technology
applications. In particular, the types of supplementary computer-assisted instruction programs
that have dominated the classroom use of educational technology in the past few decades were
not found to produce educationally meaningful effects in reading for K-12 students (ES=+0.11),
and the higher the methodological quality of the studies, the lower the effect size. In contrast,
innovative technology applications and integrated literacy interventions with the support of
extensive professional development showed more promising evidence. Although many more
rigorous, especially randomized, studies of newer applications are needed, what unifies the
methods found in this review to have great promise is the use of technologies in close connection
with teachers’ efforts.
Keywords: Educational technology applications, reading achievement, K-12, meta-analysis
The Best Evidence Encyclopedia is a free web site created by the Johns Hopkins University School of Education’s Center for Data-Driven Reform in Education (CDDRE) under funding from the Institute of Education Sciences, U.S. Department of Education.
3
Introduction
The classroom use of educational technology such as computers, interactive whiteboards,
multimedia, and the internet, has been growing at a phenomenal rate in the last two decades.
According to a recent survey conducted by the U.S. Department of Education (SETDA, 2010) on
the use of educational technology in U.S. public schools, almost all public schools had one or
more instructional computers with internet access, and the ratio of students to instructional
computers with internet access was 3.1 to 1. In addition, 97% of schools had one or more
instructional computers located in classrooms and 58% of schools had laptops on carts. A
majority of public schools surveyed also indicated their schools provided various educational
technology devices for instruction: LCD (liquid crystal display) and DLP (digital light
processing) projectors (97%), digital cameras (93%), and interactive whiteboards (73%). The
U.S. Department of Education provides generous grants to state education agencies to support
the use of educational technology in K-12 classrooms. For example, in fiscal year 2009, the
Department made a $900 million investment in educational technology in elementary and
secondary schools (SETDA, 2010).
The debate around the effectiveness of educational technology for improving student
learning has been carried on for over three decades. Perhaps the most widely cited debate was
between Clark (1983) and Kozma (1994). Clark (1983) first argued that educational technology
had no impact on student learning under any condition and that “media are mere vehicles that
deliver instruction but do not influence student achievement any more than the truck that delivers
our groceries causes changes in our nutrition.” He continued to argue that the impact of
technology on student learning was mainly due to novelty effects or instructional strategies, but
not technology itself. Kozma (1994) responded to Clark’s argument by saying the analogy of
“delivery truck” creates an “unnecessary schism between medium and method.” Kozma
believed that technology had an actual impact on student learning and played an important role
in student learning.
The Clark-Kozma debate of the 1980’s has been overtaken by the extraordinary
developments in technology applications in education in recent years. It may be theoretically
interesting to ask whether the impact of technology itself can be separated from the impact of
particular applications, but as a practical matter, machine and method are intertwined. As is the
case for many educational interventions with many components, currently available technology
applications can be seen as packages of diverse elements and evaluated as such. If a particular
combination of hardware, software, print materials, professional development for teachers, and
other elements can be reliably replicated in many classrooms, then it is worth evaluating as a
potential means of enhancing student outcomes. Components of effective multi-element
treatments can be varied to find out which elements contribute to effectiveness and to advance
theory, but it is also of value for practice and policy to know the overall impact for students even
if the theoretical mechanisms are not yet fully understood. Technology is here to stay, and
pragmatically, the question is how to make the best use of the many technologies now available.

The Best Evidence Encyclopedia is a free web site created by the Johns Hopkins University School of Education’s Center for Data-Driven Reform in Education (CDDRE) under funding from the Institute of Education Sciences, U.S. Department of Education.
4
Research on Educational Technology Applications
Research on the effectiveness of various forms of educational technology applications for
improving learning outcomes has been abundant since the 1980s. Several major meta-analyses
of the impact of educational technology on reading have also been conducted in the past two
decades (Becker, 1992; Blok, Oostdam, Otter, & Overmatt, 2002; Fletcher-Finn & Gravatt,
1995; C. L. C. Kulik & J. A. Kulik, 1991; J. A. Kulik, 2003; Ouyang, 1993; Soe, Koki, & Chang,
2000). Overall, all came to a similar conclusion, that educational technology generally produced
small to moderate effects on reading outcomes with effect sizes ranging from +0.06 to +0.43.
For example, Blok, Oostedam, Otter, & Overmatt (2002) examined 42 studies from 1990 onward
and found an overall effect size of +0.l9 in support of educational technology for K-3 students.
Their conclusion was consistent with the findings of earlier reviews by Becker (1992), and
Fletcher-Finn & Gravatt (1995), Ouyang (1993). Of particular relevance to our review are the
two meta-analyses by Kulik & Kulik (1991) and Soe, Koki, & Chang (2000), which had a focus
on K-12 classrooms. Both reviews found a positive but modest effect of educational technology
on reading performance (ES=+0.25 and +0.13, respectively) for K-12 students.
Probably the most often-cited review in educational technology was conducted by Kulik
and Kulik (1991), who viewed computers as valuable tools for teaching and learning.
Specifically, they claimed that:
1. Educational technology was capable of producing positive but small effects on
student achievement (ES=+0.30).
2. Educational technology could produce substantial savings in instruction time
(ES=+0.70).
3. Educational technology fostered positive attitudes toward technology (ES=+0.34).
4. In general, educational technology could be used to help learners become better
readers, calculators, writers, and problem solvers.
==============
Insert Table 1 here
==============
A more recent review was conducted by Kulik (2003) on the impact of educational
technology on various subjects. For reading, a total of 27 studies focusing on three major
applications of technology to reading instruction were included: integrated learning systems,
writing-based reading programs, and reading management programs. Results varied by program
type. No significant positive effect was found in the nine controlled studies of integrated
learning systems. However, moderate positive effects were found in the 13 studies of writing-
based reading programs such as Writing to Read, with an overall effect size of +0.41, and in the

The Best Evidence Encyclopedia is a free web site created by the Johns Hopkins University School of Education’s Center for Data-Driven Reform in Education (CDDRE) under funding from the Institute of Education Sciences, U.S. Department of Education.
5
three studies of a reading management program (Accelerated Reader), with an average effect
size of +0.43.
However, many of the studies included in these major reviews do not meet minimal
standards of methodological adequacy. For example, 10 of the 42 studies included in Blok’s
review did not include a control group. Many of the studies included by Kulik (2003) were
extremely brief, only 2 weeks or less. Perhaps the biggest problem is that many studies claiming
to be studies of technology confound use of technology with one-to-one tutoring, small-group
tutorials, or other teaching strategies known to be effective without technology (e.g., Barker &
Torgesen, 1995; Ehri, Dreyer, Flugman, & Gross, 2007; Torgensen, Wagner, Rashotte, Herron,
& Lindamood, 2010; Wentink, Van Bon, & Schreuder, 1997). In addition, few examine how
features of these programs and characteristics of the evaluations affect reading outcomes.
The need to re-examine research on the effectiveness of technology for reading outcomes
has been heightened by the publication of a large-scale, randomized evaluation of modern
computer-assisted instruction reading programs by Dynarski et al. (2007) and Campuzano et al.
(2009). Teachers within schools were randomly assigned to use any of 5 first grade CAI reading
programs and any of 4 fourth grade CAI reading programs, or to control groups. At both grade
levels and in both years of the evaluation, reading effect sizes were near zero. The overall effect
size was +0.04 for first grade and +0.02 for fourth grade. The second-year evaluation allowed for
computation of effect sizes for each CAI program separately, and these comparisons found that
none of the programs had notable success in reading. The programs evaluated, including Plato,
Destination Reading, Headsprout, Waterford, and Leap Track, are among the most widely used
of all CAI applications.
This large-scale, third-party federal evaluation raises troubling questions about the
effectiveness of CAI for elementary reading outcomes. The Dynarski et al. (2007) and
Campuzano et al. (2009) effect sizes were much lower than the effect sizes reported from all of
the earlier research reviews. The study’s use of random assignment, a large sample size, and
careful measurement to evaluate several modern commercial CAI programs, calls into question
the effectiveness of the technology applications that have been most common in education for
many years. Do the Dynarski/Campuzano findings conform with those of other high-quality
evaluations? Are there newer technology applications different from the supplemental CAI
programs studied by Dynarski/Campuzano that have greater promise? What can we learn from
the whole literature on technology applications to inform future research and practice in this
critical area?
The present review was undertaken to examine research on applications of educational
technology in the teaching of reading in elementary and secondary schools. The purpose of the
review is to learn from rigorous evaluations of alternative technology applications how features
of the programs and characteristics of the evaluations affect reading outcomes for children. For
example, do different types of technology applications have different reading outcomes? Does
program intensity (hours per week) affect reading outcomes? Are outcomes different according
to grade level, ability level, gender, or race? Do characteristics of experiments, such as use of
random assignment, sample size, duration, or types of measures, affect reading outcomes? These
The Best Evidence Encyclopedia is a free web site created by the Johns Hopkins University School of Education’s Center for Data-Driven Reform in Education (CDDRE) under funding from the Institute of Education Sciences, U.S. Department of Education.
6
mediators and moderators are critical in informing researchers, developers, and educators about
where technology applications may be most profitable in reading instruction and about how to
design research to best detect reading outcomes. Many of these questions could not have been
addressed until recently, because there were too few studies to synthesize, but the burgeoning of
rigorous experimental research evaluating all sorts of technological innovations has made it
possible to ask and answer more sophisticated questions. Unlike most previous reviews, this
review applies consistent inclusion standards to focus on studies that met high methodological
standards. It is important to note that this review does not attempt to determine the unique
contribution of technology itself but rather the effectiveness of programs that incorporate use of
educational technology. Technological components, as Clark (1983, 1985a, and 1985b) argued,
are often confounded with curriculum contents, instructional strategies, and other elements.
Working Definition of Educational Technology
Since the term “educational technology” has been used very broadly and loosely in the
literature and it could mean different things to different people, it is important to provide a
working definition of the term. In this meta-analysis, educational technology is defined as a
variety of electronic tools and applications that help deliver learning materials and support
learning process in K-12 classrooms. Examples include computer-assisted instruction (CAI),
integrated learning systems (ILS), and use of video and embedded multimedia as components of
reading instruction.
In this review, we identified four major types of educational technology applications:
Supplemental Technology, Innovative Technology Applications, Computer-Managed Learning
(CML) Systems, and Comprehensive models. Supplemental programs, often called CAI or
integrated learning systems, including programs such as Destination Reading, Plato Focus,
Waterford, and WICAT. They provide additional instruction at students’ assessed levels of need
to supplement traditional classroom instruction. These were the types of programs evaluated in
the Dynarski/Campuzano evaluation. Innovative Technology Applications included Fast
ForWord, Reading Reels, and Lightspan. Fast ForWord supplements traditional CAI with
software designed to help children discriminate sounds. Reading Reels provides brief, embedded
multimedia in whole-class first grade reading instruction to model letter sounds, sound blending,
and vocabulary. Lightspan provides CAI-type content on Sony Playstations at home as well as at
school. Computer-Managed Learning Systems included only Accelerated Reader, which uses
computers to assess students’ reading levels, assigning reading materials at students’ levels,
scoring tests on those readings, and charting students’ progress. Comprehensive models,
represented by READ 180, Writing to Read, and Voyager Passport, use computer-assisted
instruction along with non-computer activities as students’ core reading approach.
How Might Technology Enhance Reading Outcomes?
Before embarking on the review, it is useful to consider how, in theory, technology might
be expected to enhance student reading. A useful schema for discussing the potential impacts of
various reading technologies is the QAIT model (Slavin, 1994, 2009), which posits that effective
teaching is a product of four factors: Quality of instruction (clear, well-organized, interesting
The Best Evidence Encyclopedia is a free web site created by the Johns Hopkins University School of Education’s Center for Data-Driven Reform in Education (CDDRE) under funding from the Institute of Education Sciences, U.S. Department of Education.
7
lessons), Appropriate levels of instruction (teaching content that is at the right level according to
students’ prior knowledge and skills and learning rates), Incentive (motivating children
intrinsically or extrinsically to want to learn the material), and Time (providing adequate
instructional time). This model is intended to help understand the likely achievement impacts of
various innovations, as changes on some QAIT elements often involve tradeoffs with others, and
as innovations that benefit multiple QAIT elements may be more impactful than those that
benefit just one.
Quality of Instruction. Technology can positively impact the quality of instruction. Both
individualized computer assisted instruction (CAI) and whole-class technologies such as
interactive whiteboards can present content that is visual, varied, well-designed, and compelling.
Video, animations, and static graphics can illustrate key concepts. To the extent that such content
and visuals are well-organized and closely aligned with desired outcomes, they can be beneficial,
but they can also become “seductive details” that distract learners from key objectives and
interfere with learning (Mayer, 2008, 2009). Also, using technology to teach can replace the
teacher’s own instruction. This may sacrifice the learning benefits teachers contribute by
delivering interesting and compelling lessons, by forming positive relationships with their
students, and by knowing and adapting to what the students already know, what interests them,
and how they learn. Also, technological teaching may reduce or interfere with peer-to-peer
discussions or cooperative learning. These problems may be avoided in the design of technology-
enhanced systems, but they need to be considered.
Appropriate Levels of Instruction. From the earliest applications of computer-assisted
instruction in the 1970’s, the benefit of technology most often cited has been the capacity to
completely individualize the pace and level of instruction to the needs of each child (e.g.,
Atkinson, 1968; Atkinson & Fletcher, 1972). Building on the “teaching machines” and
programmed instruction of the 1960’s, CAI was seen as a solution to the great diversity in prior
knowledge and learning rates present in every classroom. Just as human tutors can completely
adapt to every child’s needs, modern computer software can readily determine what children
already know and provide them the next steps in a learning progression. They can then allow the
learner to move through material as quickly or slowly as needed, adding explanation or
scaffolding for children who need it while allowing fast-moving pupils to encounter challenging
material.
Much as individualization may solve a key problem of teaching, providing appropriate
levels of instruction to diverse groups of learners, it may also come at a cost in instructional
efficiency. When students are all working at their own paces on different materials, it becomes
difficult for teachers to spend much time teaching any particular content, as they must divide
time among many children. A teacher with a class of 25 working on common lessons can
demonstrate, explain, and ask and answer questions more effectively than the teacher can do
working with 25 individuals at different points in the curriculum. The instruction provided on the
software itself may be of sufficient quality to solve this problem, but the point is that there is an
inherent tradeoff between individualization and effective whole-class teaching. The design of
the software and the software-teaching interface may determine whether the benefits provided by
The Best Evidence Encyclopedia is a free web site created by the Johns Hopkins University School of Education’s Center for Data-Driven Reform in Education (CDDRE) under funding from the Institute of Education Sciences, U.S. Department of Education.
8
the technology outweigh or compensate for any reduction in benefits of whole-class teaching, at
least in technology applications that individualize instruction.
Computers are very good at providing formative and summative assessments of most
aspects of reading (except oral responses) and they can facilitate record keeping and monitoring
of children’s progress. Further, computers can easily adapt assessments according to children’s
responses or performance levels. This information can help teachers tailor their instruction to the
needs of individuals or of whole classes. However, while computerized assessments may save
work for the teacher and may allow for more timely and frequent assessments, this may or may
not improve teaching effectiveness.
Incentive. It is impossible for any educator to watch children engage for hours on home
computers and other technology and not wish that the obvious motivational potential of
technology could be harnessed to teach school subjects. Studies invariably find that most
children love to work on computers (Bucleitner, 1996; Hyson, 1986). Educational computer
games of all sorts directly try to mimic the motivational aspects of computer games, and for
some objectives this can be effective (Alessi & Trollip, 2001; Gee, 2003; Rieber, 1996; Virvou,
Katsionis, & Manos, 2005). Yet once again, there are tradeoffs, and details of the software and
its use in the context of instruction determine whether the computer in fact motivates children to
learn the specific reading skills that are essential in school. Enjoyment is important to learning,
of course, but if content coverage or appropriate levels of challenge or complexity are sacrificed
for fun, the tradeoff may not be beneficial for learning.
Time for practice and feedback. Computer technology invariably provides opportunities
for a great deal of practice and feedback. Computers are endlessly patient and can provide
effectively infinite opportunities to practice reading skills.
In the teaching of reading, especially in the primary grades, there is a limitation on
practice and feedback for certain skills because, at least until voice recognition is made practical
for young children (see Adams, 2010), the computer cannot “hear” your children read. As a
result, CAI for reading can, for example, have children click on the letter representing a given
sound, but it cannot show a letter and ask for the sound. Listening to your children reading
connected text and providing useful feedback to the reader will not be practical for some time.
However, for many reading objectives that do not require oral responses, the practice-feedback
capabilities of technology are presumably as important as they are for any other subject.
Method
The current review employed meta-analytic techniques proposed by Glass, McGaw &
Smith (1981) and Lipsey & Wilson (2001). Comprehensive Meta-analysis Software Version 2
(Borenstein, Hedges, Higgins, & Rothstein, 2005) was used to calculate effect sizes and to carry
out various meta-analytical tests, such as Q statistics and sensitivity analyses. Like many
previous meta-analyses, this study follows several key steps: 1. Locating all possible studies; 2.
Screening potential studies for inclusion using preset criteria; 3. Coding all qualifying studies
based on their methodological and substantive features; 4. Calculating effect sizes for all
The Best Evidence Encyclopedia is a free web site created by the Johns Hopkins University School of Education’s Center for Data-Driven Reform in Education (CDDRE) under funding from the Institute of Education Sciences, U.S. Department of Education.
9
qualifying studies for further combined analyses; and 5. Carrying out comprehensive statistical
analyses covering both average effects and the relationships between effects and study features.
Literature Search Procedures
In an attempt to locate every study that could possibly meet the inclusion criteria, a
search of articles written between 1980 and 2010 was carried out. Electronic searches were
made of educational databases (e.g., JSTOR, ERIC, EBSCO, Psych INFO, Dissertation
Abstracts), web-based repositories (e.g., Google Scholar), and educational technology
publishers’ websites, using different combinations of key words (e.g. educational technology,
instructional technology, computer-assisted instruction, interactive whiteboards, multimedia,
reading interventions, etc). We also conducted searches by program name. We attempted to
contact producers and developers of educational technology programs to check whether they
knew of studies that we had missed. References from other reviews of educational technology
programs were further investigated. We also conducted searches of recent tables of contents of
key journals from 2000 to 2010: Educational Technology and Society, Computers and
Education, American Educational Research Journal, Reading Research Quarterly, Journal of
Educational Research, Journal of Adolescent & Adult Literacy, Journal of Educational
Psychology, and Reading and Writing Quarterly. Citations in the articles from these and other
current sources were located.
Criteria for Inclusion
In order to be included in this review, studies had to meet the following inclusion criteria
(see Slavin, 2008, for rationales).
1. The studies evaluated applications of any type of educational technology designed to
improve reading outcomes, including computers, multimedia, and interactive
whiteboards.
2. The studies involved students in grades K-12.
3. The studies compared students taught in classes using a given technology-assisted
reading program to those in control classes using an alternative program or standard
methods.
4. Studies could have taken place in any country, but the report had to be available in
English.
5. Random assignment or matching with appropriate adjustments for any pretest differences
(e.g., analyses of covariance) had to be used. Studies without control groups, such as pre-
post comparisons and comparisons to “expected” scores, were excluded. Studies in which
students selected themselves into treatments (e.g., chose to attend an after-school
program) or were specially selected into treatments (e.g., gifted or special education
programs) were excluded unless experimental and control groups were designated after
selections were made.
6. Pretest data had to be provided, unless studies used random assignment of at least 30
units (individuals, classes, or schools) and there were no indications of initial inequality.
Studies with pretest differences of more than 50% of a standard deviation were excluded
The Best Evidence Encyclopedia is a free web site created by the Johns Hopkins University School of Education’s Center for Data-Driven Reform in Education (CDDRE) under funding from the Institute of Education Sciences, U.S. Department of Education.
10
because, even with analyses of covariance, large pretest differences cannot be adequately
controlled for as underlying distributions may be fundamentally different (Shadish, Cook,
& Campbell, 2002).
7. The dependent measures included quantitative measures of reading performance, such as
standardized reading measures. Experimenter-made measures were accepted if they were
comprehensive measures of reading, which would be fair to the control groups, but
measures of reading objectives inherent to the program (but unlikely to be emphasized in
control groups) were excluded. Measures of skills that do not require interpretation of
print, such as phonemic awareness, oral vocabulary, or writing, were excluded.
8. A minimum study duration of 12 weeks was required. This requirement was intended to
focus the review on practical programs intended for use for the whole year, rather than
brief investigations. Brief studies may not allow programs to show their full effect. On
the other hand, brief studies often advantage experimental groups that focus on a
particular set of objectives during a limited time period while control groups spread that
topic over a longer period. Studies with brief treatment durations that measured outcomes
over periods of more than 12 weeks were included, however, on the basis that if a brief
treatment has lasting effects, it should be of interest to educators.
9. Studies had to have at least two teachers in each treatment group to avoid compounding
of treatment effects with teacher effect.
10. Studied programs had to be replicable in realistic school settings. Studies providing
experimental classes with extraordinary amounts of assistance (e.g., additional staff in
each classroom to ensure proper implementation) that could not be provided in ordinary
applications were excluded.
Both the first and second author examined at each potential study independently according to
these criteria. When disagreement arose, both authors reexamined the studies in question
together and came to a final agreement.
Study Coding
To examine the relationship between effects and studies’ methodological and substantive
features, studies were coded. Methodological features included research design and sample size.
Substantive features included grade levels, types of educational technology programs, program
intensity, level of implementation, and socio-economic status. In addition, ability, SES, gender,
and race were coded for subgroup analyses. Study coding was conducted by two researchers
working independently. The inter-rater agreement was 95%. When disagreement arose, both
researchers reexamined the studies in question together and came to a final agreement. The
study features were categorized in the following way:
1. Types of publication: Published and unpublished
2. Year of publication: 1980s, 1990s, 2000s, and 2010s
3. Research design: Randomized, randomized quasi-experiment, matched control, and
matched post hoc. A randomized quasi-experiment is a study in which clusters, such
as classes or schools, were randomly assigned to conditions, but there were too few
clusters to allow for cluster-level analysis.
The Best Evidence Encyclopedia is a free web site created by the Johns Hopkins University School of Education’s Center for Data-Driven Reform in Education (CDDRE) under funding from the Institute of Education Sciences, U.S. Department of Education.
11
4. Sample size: small (N ≤250) and large (N>250)
5. Grade level: Kindergarten, elementary (Grade 1-6), and secondary (Grade7-12)
6. Program types: Computer-managed learning system, innovative technology
application, comprehensive program, and supplemental program (defined above).
7. Program intensity: low (≤75 minutes per week) and high (>75 minutes per week)
8. Implementation: low, medium, and high
9. Socio-economic status: low (% of free and reduced lunch>40%) and high (≤40%)
10. Academic abilities: low, middle, and high
11. Gender: male and female
12. Ethnicity: African-American, Hispanic, and White, and Asian American
13. English language learners: yes and no
Effect Size Calculations and Statistical Analyses
In general, effect sizes were computed as the difference between experimental and
control individual student posttests after adjustment for pretests and other covariates, divided by
the unadjusted posttest pooled SD. Procedures described by Lipsey & Wilson (2001) and
Sedlmeier & Gigerenzor (1989) were used to estimate effect sizes when unadjusted standard
deviations were not available, as when the only standard deviation presented was already
adjusted for covariates or when only gain score SD’s were available. If pretest and posttest
means and SD’s were presented but adjusted means were not, effect sizes for pretests were
subtracted from effect sizes for posttests. F ratios and t ratios were used to convert to effect sizes
when means and standard deviations were not reported. After calculating individual effect sizes
for all qualifying studies, Comprehensive Meta-Analysis software was used to carry out all
statistical analyses such as Q statistics and overall effect sizes.
Findings
Overall Effects
A total of 84 qualifying studies based on 60,553 K-12 participants were included in the
final analysis: 8 kindergarten studies (N=2,068), 59 elementary studies (N=34,200), and 18
secondary studies (N=24,285). As indicated in Table 2, the overall mean effect size for the 84
qualifying studies is +0.16. The distribution of effect sizes in this collection of studies is highly
heterogeneous (Q=362.52, df=83, p<0.00), indicating that the variance of study effect sizes is
larger than can be explained by simple sampling error. Thus, a random effects model was used1.
1 A random-effects model was used for three reasons. First, the test of heterogeneity in effect sizes was statistically
significant. Second, the studies for this review were drawn from populations that are quite different from each
other, e.g. age of the participants, types of intervention, research design, etc. Third, the random-effects model has
been widely used in meta-analysis because the model does not discount a small study by giving it a very small
weight, as is the case in the fixed-effects model (Borenstein, Hedges, Higgins, & Rothstein, 2009; Dersimonian &
Laird, 1986; Schmidt, Oh, & Hayes, 2009). The average effect size using a fixed-effects procedure was only +0.11
(see Table 2)
The Best Evidence Encyclopedia is a free web site created by the Johns Hopkins University School of Education’s Center for Data-Driven Reform in Education (CDDRE) under funding from the Institute of Education Sciences, U.S. Department of Education.
12
As will be discussed in a later section, some substantive features (e.g., type of intervention, grade
level, SES) and methodological features (e.g., research design, sample size) were used to model
some of these variations.
==============
Insert Table 2 here
==============
Substantive Features of the Studies
The most important findings of the current review relate to effects of alternative types of
interventions, program intensity, levels of implementation, and effects for different types of
students by grade levels, socio-economic status, gender, race, English learning status.
Types of interventions. As mentioned earlier, the intervention types in this collection of
studies were divided into four major categories: Computer-Managed Learning (CML) (N=4),
Innovative Technology Applications (ITA) (N=6), Comprehensive models (N=18), and
Supplemental Technology (N=56). The majority of the studies (67%) fell into the supplementary
program category, which consists of individualized computer-assisted instruction (CAI).
Table 3 presents the summary results of the analyses by program types. A marginally
significant between-group effect (QB =7.15, df=3, p<0.07) was found, indicating some variations
among the four types of programs. The 18 comprehensive model studies produced the largest
effect size, +0.28, and the four computer managed learning and the six innovative technology
applications produced similar moderate effect sizes of +0.19 and +0.18, respectively. The
average effect size for the 56 supplemental technology programs (traditional CAI) was only
+0.11. The results of the analyses of comprehensive and innovative programs have to be
considered carefully, however, due to the small number of studies in these categories.
==============
Insert Table 3 here
==============
Program intensity. Program intensity may help explain some of the variation in the
model. Program intensity was divided into two categories: low intensity (the use of technology
less than 15 minutes a day or less than 75 minutes a week) and high intensity (over 15 minutes a
day or 75 minutes a week). Analyzing the use of technology as a moderator variable, only a
marginally significant difference was found between the two intensity categories (QB=3.04,
df=1, p=0.08). The effect sizes for low and high intensity are +0.11 and +0.19, respectively.
The Best Evidence Encyclopedia is a free web site created by the Johns Hopkins University School of Education’s Center for Data-Driven Reform in Education (CDDRE) under funding from the Institute of Education Sciences, U.S. Department of Education.
13
==============
Insert Table 4 here
==============
Levels of Implementation. Significant differences were found among low, medium, and
high levels of implementation, as reported by the researchers. The mean effect sizes for low,
medium, and high implementation were +0.01, +0.18, and, +0.22, respectively. Over half of the
studies (53%) did not provide sufficient information about implementation. It is clear from the
findings that no effect was found when implementation was described as low. A significant and
positive effect was detected for groups that had a medium or high level of implementation rating.
The implementation ratings must be considered cautiously, however, because authors who knew
that there were no experimental-control differences may have described poor implementation as
the reason, while those with positive effects might be less likely to describe implementation as
poor. For example, Patterson et al (2003) did not find significant differences between the
treatment and control groups for their study of the Waterford program and concluded that “it
could be argued that the Waterford failed to produce promised results because the teachers did
not implement it appropriately or that differences in use among the eight classrooms contributed
to better results for some than for others” (p. 200).
==============
Insert Table 5 here
==============
Grade Levels. Studies were organized in three grade levels: Kindergarten (N=8),
Elementary (N=59), and Secondary (N=18). The results by grade levels are shown in Table 6.
The effect sizes for kindergarten, elementary, and secondary levels were +0.15, +0.10, and
+0.31, respectively. The between-group difference (QB =9.52, df=2, p<0.01) was significant.
The post hoc test suggests that the effect size at the secondary level was significantly higher than
that at the elementary levels.
==============
Insert Table 6 here
==============
Socio-economic status (SES). Studies were divided into three categories: Low, mixed,
and high SES. Low SES refers to studies that had 40% or more students receiving free and
reduced-price lunch, and high SES Refers to studies in which less than 40% of students received
free lunches. Four studies that involved a diverse population, including both low and high SES
The Best Evidence Encyclopedia is a free web site created by the Johns Hopkins University School of Education’s Center for Data-Driven Reform in Education (CDDRE) under funding from the Institute of Education Sciences, U.S. Department of Education.
14
students, were excluded in these analyses. The p-value (0.31) of the test of heterogeneity in
effect sizes suggests that the variance in the sample of effect sizes were within the range that
could be expected based on sampling error alone. The effect sizes for low and high SES were
+0.17 and +0.12, respectively, indicating a minimal effect of SES (Table 7). In addition to the
between-study comparison, we also looked at the differential impact of instructional technology
on students with different SES background within studies. There were a total of ten studies
identified. As shown in Table 8, educational technology had a slightly higher positive impact on
low SES students with an average effect of +0.31, whereas the effect for high SES students was
+0.20. Due to the small number of studies, however, no significant difference was found between
low SES and high SES groups.
==============
Insert Table 7 and 8 here
==============
Within-Study Subgroup Analyses
Subgroup analyses of comparisons within studies were conducted to compute differential
effect sizes based on student demographic characteristics such as ability, gender, race, and
language. Because the number of studies in these subgroup analyses was small, it is difficult to
estimate the between-studies variance (Tau Square) with any precision. Thus the fixed-effects
model was used. These initial findings need to be verified with additional studies.
Ability. Out of the 84 qualifying studies, there were a total of 13 studies that examined the
impact of instructional technology on students with different academic abilities, yielding 29 effect
sizes. The mean effect sizes for low, middle, and high ability students were +0.37, +0.27, and
+0.08, respectively. The post hoc tests suggest that instructional technology had a more positive
impact on low and middle ability students than it did on high ability students.
==============
Insert Table 9 here
==============
Gender. As indicated in Table 10, instructional technology generated a more positive
impact among males than females. The effect sizes for males and females were +0.28 and +0.12,
respectively. No significant difference according to gender was found, however, due to the small
number of studies reporting effects by gender.
The Best Evidence Encyclopedia is a free web site created by the Johns Hopkins University School of Education’s Center for Data-Driven Reform in Education (CDDRE) under funding from the Institute of Education Sciences, U.S. Department of Education.
15
==============
Insert Table 10 here
==============
Race. A total of nine studies examined the interaction effect of race with the use of
educational technology. The mean effect sizes for students who were African American,
Hispanic, and White were +0.12, +0.42, and +0.11. The numbers of studies with each group
was small, however, and there was only one study on a Hispanic population.
==============
Insert Table 11 here
==============
English Language Learners. Only three studies examined the effect of instructional
technology on English language learners. The effect size was +0.29 (p<0.05).
==============
Insert Table 12 here
==============
Methodological Features of Studies
Sensitivity Analysis
A sensitivity analysis was performed to check whether any outliers might skew the
overall results. Using a “one-study removal” analysis (Borenstein, et al., 2009) we found that
the range of effect sizes still falls within the 95% confidence interval (0.12 to 0.21). In other
words, the removal of any one effect size does not substantially affect the overall effect sizes.
Publication Bias
Two statistical analyses were performed to check whether there was a significant number
of studies with null results that have not been uncovered in the literature search might nullify the
effects found in the meta-analysis: Classic fail-safe N and Orwin’s fail-safe N. As indicated in
Table 13, the classic fail-safe N test determined that a total of 4,198 studies with null results
would be needed in order to nullify the effect. The Orwin’s test (Table 14) estimates the number
of missing null studies that would be required to bring the mean effect size to a trivial level. We

The Best Evidence Encyclopedia is a free web site created by the Johns Hopkins University School of Education’s Center for Data-Driven Reform in Education (CDDRE) under funding from the Institute of Education Sciences, U.S. Department of Education.
16
set 0.01 as the trivial value. The result indicated that the number of missing null studies to bring
the existing overall mean effect size to 0.01 was 880. Taken together, these results suggest that
there is no reason to believe that publication bias could account for the positive effect size.
==============
Insert Table 13 & 14 here
==============
As an additional test of the possibility of publication bias, we used a mixed-effects model
to test whether there was a significant difference between published journal articles and
unpublished publications such as technical reports and dissertations. As indicated in Table 15,
the overall effect sizes for published articles and unpublished reports are +0.25 and +0.14,
respectively. The Q-value (QB =4.44, df=1, and p<0.04) does indicate publication bias in this
collection of studies. In other words, the effect sizes from the published journal articles were
significantly larger than those in technical reports and dissertations, a difference that is very
typical in meta-analyses (Lipsey & Wilson, 2001).
==============
Insert Table 15 here
==============
Year of Publication
We examined the data to determine whether there were any differences among studies
according to their publication year. We found no trend toward more positive results in recent
years (see Table 16). Means for each time period were close to the overall mean effect size of
+0.16.
==============
Insert Table 16 here
==============
Methodological Features
As indicated in Table 2, the value of the Q statistic suggests that there is considerable
variation in effect sizes across studies. In order to understand possible reasons for such
variation, we examined two key potential methodological features that may help explain some of
the variation: research design and sample size.

The Best Evidence Encyclopedia is a free web site created by the Johns Hopkins University School of Education’s Center for Data-Driven Reform in Education (CDDRE) under funding from the Institute of Education Sciences, U.S. Department of Education.
17
Research Design. One potential source of variation is the presence of different research
designs (e.g., Abrami & Bernard, 2006). Four categories of research design were identified in
this collection of studies. Randomized experiments (N=25) were those in which students,
classes, or schools were randomly assigned to conditions and the unit of analysis was at the level
of the random assignment. Randomized quasi-experiments (RQE) (N=3) refer to studies that
used random assignment at the school or class level but the analysis was done at the student level
due to too few schools or classes. Matched control (N=47) studies were ones in which
experimental and control groups were matched on key variables at pretest, before posttests were
known, while matched post-hoc studies (MPH) (N=9) were ones in which groups were matched
retrospectively, after posttests were known. Table 17 presents the outcomes of the analyses
according to research designs. The average effect size for randomized experimental studies,
randomized quasi experiments, matched control studies, and matched post hoc studies were
+0.08, +0.16, +0.19, and +0.19, respectively. Since there were only three RQE studies and the
effect sizes of the matched and MPH studies were similar, we decided to combine these three
quasi-experimental categories into one category and compared it to randomized experiments.
Results are shown in Table 18. The mean effect size for quasi-experimental studies was +0.19,
twice the size of that for randomized studies. As a group, randomized evaluations had (minimal)
effect sizes like those reported in the Dynarski/Campuzano study, while quasi-experiments had
higher estimates.
==============
Insert Table 17 and 18 here
==============
Sample Size. Another potential source of variations may lie in differences in study sample
size. Previous studies suggest that studies with small sample sizes produce much larger effect
sizes than do large studies (Liao, 1999; Slavin & Smith, 2009). In this collection of studies,
there were a total of 49 large studies with sample sizes greater than 250 and 35 small studies with
fewer than 250 students. As indicated in Table 19, a statistically significant difference was
found between large studies and small studies (QB =4.66, df=1, and p<0.03). The mean effect
size for the 40 small studies (ES=+0.25) was twice that of large studies (ES=+0.13).
==============
Insert Table 19 here
==============
Design/Size. After examining the effect of research design and sample sizes separately,
we looked at the combined effect of these two moderator variables together. As shown in Table
20, the difference among the four groups was significant (QB =12.37 and p<0.00). Small
matched control studies produced the largest effect size (ES=+0.24), followed by small
The Best Evidence Encyclopedia is a free web site created by the Johns Hopkins University School of Education’s Center for Data-Driven Reform in Education (CDDRE) under funding from the Institute of Education Sciences, U.S. Department of Education.
18
randomized studies (ES=+0.21), large matched control studies (ES=+0.16), and large
randomized studies (ES=+0.07). Within each research design, the effect sizes of small studies
were about twice as large as those of large studies. The findings for the large randomized
studies, as a group, resembled those of the Dynarski/Campuzano study.
==============
Insert Table 20 here
==============
Discussion
The purpose of this review was to examine the overall effectiveness of educational
technology applications on reading outcomes in K-12 classrooms. Consistent with previous
reviews of similar focus (Kulik, 2003, Kulik & Kulik, 1991; Soe, Koki, & Chang, 2000), the
findings of this study suggest that applications of educational technology generally produced a
positive, though small, effect (ES=+0.16) in comparison to traditional methods. This effect is
much larger than those reported in the recent large, randomized evaluation of current commercial
CAI models by Dynarski et al. (2007) and Campuzano et al. (2009). Yet to the degree other
studies have resembled aspects of Dynarski/Campuzano, the outcomes have also been more
similar. In particular, studies of traditional, supplementary CAI, studies that used random
assignment, and studies with large sample sizes (all of which are characteristics of the
Dynarski/Campuzano studies) found smaller effect sizes than other studies.
Qualifying studies provide greater support for technology applications other than
supplementary CAI, which had an overall effect size of +0.11. Out of the 57 qualifying
supplemental instructional technology studies, 19 of them were rigorous randomized
experiments (e.g., Alifranglis, 1991; Becker, 1994, Campuzzano et al. 2009; Vaughan, Serio &
Wilhelm, 2006), involving a total of approximately 11,000 students. The majority of these
qualifying studies (53%) were conducted since 2000. Only one study was conducted in the 70s,
12 studies in the 80s, and 13 in the 90s. We found no trend toward more positive effects in
more recent studies. The study by Dynarski et al. (2007) and Campuzzano et al. (2009) evaluated
a total of six supplemental programs, including Destination Reading, Headsprout, Plato Focus,
Waterford Early Reading Program, Academy of Reading, and LeapTrack, and found minimal
effects of these supplemental programs, with effect sizes ranging from -0.01 to +0.11. The
evidence from these high quality randomized studies with large samples suggests that the types
of supplementary computer-assisted instruction programs that have dominated the classroom use
of educational technology in the past few decades may not be producing educationally
meaningful effects in reading for K-12 students.
In contrast to studies of supplementary CAI, the largest effects were found in the 18
studies of comprehensive models, including READ 180, Writing to Read, and Voyager Passport,
with an overall effect size of +0.28. Unlike supplemental computer-assisted instruction models,
READ 180 and Voyager Passport, the two widely used secondary reading approaches, are
The Best Evidence Encyclopedia is a free web site created by the Johns Hopkins University School of Education’s Center for Data-Driven Reform in Education (CDDRE) under funding from the Institute of Education Sciences, U.S. Department of Education.
19
intended to serve as integrated literacy interventions, which combine computer and non-
computer instruction in their classrooms, with the support of extensive professional
development. For example, in READ 180, a widely used model for struggling secondary readers,
classrooms are provided with 90 minutes a day of instruction in a group of 15. Each period
begins with a 20-minute shared reading and skills lesson, and then students in groups of 5 rotate
among three activities: computer-assisted instruction in reading, modeled or independent
reading, and small-group instruction with the teacher. Teachers are given materials and
professional development to support instruction in reading strategies, comprehension, word
study, and vocabulary (Davidson & Miller, 2002). Our findings provide some suggestive
evidence that linking non-technology classroom instruction and computer-assisted instruction
could be beneficial. These comprehensive approaches have a much greater impact on reading
instruction and on reading outcomes than the ordinary CAI models, but studies of them do not
isolate the unique contribution made by the use of technology. Further, none of the studies
conducted to date for READ 180 and Voyager Passport were randomized, and our findings
suggest that non-randomized studies of technology applications overstate effect sizes. In short,
too few randomized studies for comprehensive approaches are available at this point for firm
conclusions. Researchers and developers need to examine the effect of these promising programs
by using rigorous experimental designs.
Other technology applications may also have greater promise than supplementary CAI,
but again, the numbers of studies of each is small. A single matched evaluation of Lightspan
(Birch, 2002), which integrates video and computer content on Sony Playstations used at school
and at home, found substantial positive effects (ES=+0.42), but this was a matched evaluation
involving only two schools. Reading Reels, a program that embeds multimedia content in the
Success for All whole-school reform model’s first grade program, was found in two randomized
experiments to add significantly to the reading outcomes of Success for All, with effect sizes of
+0.17 (Chambers et al, 2006), and +0.27 (Chambers et al, 2008). These approaches do more
than fully integrate technology into the school day, they infuse technology in teachers’ actual
reading lessons. The results provide partial support for the utility of video, computer content,
and embedded multimedia as components of beginning reading instruction.
No significant differences were found regarding program intensity. More technology
does not necessarily result in better outcomes. Future studies may want to investigate the
impact of the time variable factor in depth for various grades.
A differential impact of educational technology at different grade levels was found. The
use of educational technology had a larger impact at the secondary level than at any other grade
levels, with a mean effect size of +0.31. However, the results need to be interpreted with
caution. First, only two of the eighteen qualifying secondary studies were randomized
experiments. As mentioned earlier, the effects were likely to be larger in quasi-experiments. In
addition, the 18 qualifying secondary studies were dominated by two intervention programs:
three from Accelerated Reader, and eight from READ 180. The findings suggest that
randomized studies are particularly needed at the secondary level.

The Best Evidence Encyclopedia is a free web site created by the Johns Hopkins University School of Education’s Center for Data-Driven Reform in Education (CDDRE) under funding from the Institute of Education Sciences, U.S. Department of Education.
20
Finally, it appears that the use of educational technology had somewhat greater benefits
for low ability and ELL students. Given the current focus on intervention for low performing
and ELL students, schools and districts may consider adopting appropriate proven educational
technology programs in order to close the language and ability gaps, especially in reading.
However, there are few studies that compare outcomes by ability or ELL status. Further studies
on these subgroups are needed in order to improve internal and external validity of these
findings.
In addition to these overall findings, several key findings emerging from this review
warrant mention. Important methodological and substantive moderator variables, such as
research design, sample size, type of intervention, and program intensity were used to examine
whether outcomes were different according to these study features. Furthermore, sub-analyses
were conducted to look at the differential impact on key subgroups such as gender, race, and
SES.
First, the majority of the qualifying studies (71%) included in this review were quasi-
experiments, including matched control, randomized quasi-experiments, and matched post-hoc
experiments. Out of the 85 qualifying studies, only 25 (29%) were randomized experiments.
Eight out of the 25 randomized studies were conducted by Campuzzano et al. (2009) and
Dynarski et al. (2007). The present findings point to an urgent need for more practical
randomized studies in the area of educational technology.
Second, our findings indicate that studies with small sample sizes generally produced
twice the effect sizes of those with large sample sizes. The results support the findings of other
research studies that made similar comparisons (Slavin & Smith, 2009; Pearson, Ferding,
Blomeyer, & Moran, 2005). This should come as no surprise for three reasons. First, it is much
easier for researchers to maintain high implementation fidelity in small-scale studies as
compared to large-scale studies. In addition, standardized tests were more likely to be used in
large scale studies, which are usually less sensitive to treatments. Finally, small studies with null
effects may have never been written up or made available in published or report forms.
Third, in contrast to previous reviews (e.g., Kulik & Kulik, 1991), we found a significant
difference between experimental and quasi-experimental designs. Our findings suggest that the
effect sizes were generally twice as large in quasi-experiments than in true experiments
.
Practical Implications for Designing Effective Technology Applications
The findings of this study have some practical implications for designing effective
technology applications for reading. First, it is important to discuss the potential benefits and
drawbacks of technology applications to illustrate how design of software and the human
systems in which technology applications operate might determine reading outcomes. It may be
impossible to determine the unique contribution of technology itself, but it should be possible to
learn how to maximize technology’s inherent benefits and minimize drawbacks, to create
effective technology-enhanced systems.
The Best Evidence Encyclopedia is a free web site created by the Johns Hopkins University School of Education’s Center for Data-Driven Reform in Education (CDDRE) under funding from the Institute of Education Sciences, U.S. Department of Education.
21
A few examples might illustrate this perspective. Computers can clearly individualize
instruction for children, yet individualization may result in less teacher instruction, or may make
the linkage between non-technology classroom instruction and computer-assisted instruction
problematic. When children go down the hall to a computer lab and then return to whole-class
teaching, as in traditional forms of CAI, there is little opportunity for teachers or children to
capitalize on the linkage between the very different content in the two settings. However, in
programs such as Writing to Read and Read 180 (Hasselbring & Goin, 2004), children cycle
through computer and non-computer activities, including direct teaching, that are designed to
directly complement each other. In a computer-assisted tutoring program called Alphie’s Alley
(Chambers et al, 2006, 2008), human tutors work one-to-one with struggling first and second
graders, allowing for total coordination between human tutor and technology. In a small-group
adaptation of Alphie’s Alley, called Team Alphie (Chambers et al, 2011), children work in pairs
on computers with a teacher for every three pairs. The children serve as “voice recognition
devices” for each other, as when the computer shows the word “cat,” the tutee responds orally,
and then the computer asks the partner, “Did your partner read ‘cat’?” Again, this human-
technology system maximizes integration of resources, trying to make optimal use of the
capabilities of human tutors, peers, and computers.
In recent years, the integration of benefits of technology with those of human teaching
have been facilitated by expanding use of technologies intended to facilitate whole-class
teaching, rather than replacing it. Audiovisual devices, such as video, filmstrips, and overhead
projectors have long played this role, and today, interactive whiteboards are expanding on this
function with the capability to show children anything that can be shown on a computer. The
interactive whiteboard provides teachers with opportunities to illustrate key ideas, to show
multimedia content from many sources, and to use compelling prepared lessons. Such
technologies eliminate the disconnect between teachers and technology inherent to traditional
CAI applications, but may lose some of the benefits of immediate feedback and
individualization. However, hand-held learner response devices, including new versions that
allow for individualization, may bring the benefits of immediate, personalized feedback and
individualization into whole-class technology applications.
The point of this discussion is not to argue for the superiority of one or another
technology application, but rather to illustrate the issues that designers of technology systems
need to address in getting the best from each of several technologies and from human teachers
and peers.
Conclusions
The findings of this review support those of earlier reviews by other researchers. The
classroom use of educational technology will undoubtedly continue to expand and play an
increasingly significant role in public education in the years to come as technology becomes
more sophisticated and more cost-effective. This review highlights the need for more
randomized studies. In addition, schools and districts should make concerted efforts to identify
and adopt research-proven educational technology programs to improve student academic
The Best Evidence Encyclopedia is a free web site created by the Johns Hopkins University School of Education’s Center for Data-Driven Reform in Education (CDDRE) under funding from the Institute of Education Sciences, U.S. Department of Education.
22
achievement as well as to close the ability and language gaps in their schools. The technology
approaches most widely used in schools, especially supplemental computer-assisted instruction,
have the least evidence of effectiveness. Alternative uses of technology applications have greater
promise. For example, the integration of non-technology classroom instruction and computer-
assisted instruction and the utility of video, computer content, and embedded multimedia as a
component of beginning reading instruction have shown particular promise. Government and
foundation funders should continue to invest in evaluation of innovative programs and in
creation of new technology applications. For example, interactive whiteboards have become
increasingly popular. Yet there is little experimental research on their outcomes or on effective
ways of using these and other whole-class technologies.
The findings of limited impacts of traditional CAI illustrate that for reading instruction
there is no magic in the machine. What matters is how technology integrates with non-
technology components of reading instruction. Although many more rigorous studies of newer
applications are needed, what unifies the methods found in this review to have greater promise
than CAI is the use of technologies in close coordination with teachers’ efforts. As replacements
for teaching computers have yet to show substantial benefits for reading outcomes, but in line
with the perspective outlined earlier in this article, uses of technology to support and facilitate
teachers’ instruction could potentially reap greater gains than either technologies or teaching by
themselves. Further research is needed on comprehensive and innovative approaches, to
determine how specific technology applications and specific teaching methods contribute to
reading outcomes.
Limitations
It is important to mention several limitations in this review. First, due to the scope of this
review, only studies with quantitative measures of reading were included. There is much to be
learned from other non-experimental studies such as qualitative and correlational research that
can add depth and insight to understanding the effects of these educational technology programs.
Second, the review focuses on replicable programs used in realistic school settings over periods
of at least 12 weeks, but it does not attend to shorter, more theoretically-driven studies that may
also provide useful information, especially to researchers. Finally, the review focuses on
traditional measures of reading performance, primarily standardized tests. These are useful in
assessing the practical outcomes of various programs and are fair to control as well as
experimental teachers, who are equally likely to be trying to help their students do well on these
assessments. However, the review does not report on experimenter-made measures of content
taught in the experimental group but not the control group, although results on such measures
may also be of importance to researchers or educators.
The Best Evidence Encyclopedia is a free web site created by the Johns Hopkins University School of Education’s Center for Data-Driven Reform in Education (CDDRE) under funding from the Institute of Education Sciences, U.S. Department of Education.
23
References
References marked with an asterisk indicate studies included in the meta-analysis
*Abram, S.L. (1984). The effect of computer assisted instruction on first grade phonics and
mathematics achievement computation. Unpublished doctoral dissertation, Northern
Arizona University.
Abrami, P. C., & Bernard, R. M. (2006). Research on distance education: In defense of field
experiments. Distance Education 27(1), 5-26.
Adams (2010). Technology for developing children’s language and literacy: Bringing speech-
recognition to the classroom. Providence, RI: Brown University.
Alessi, M. S., & Trollip, S. R. (2001). Multimedia for learning: Methods and development (3rd
ed.). Boston: Allyn and Bacon.
*Alifrangis, C.M. (1991). An integrated learning system in an elementary school:
Implementation, attitudes, and results. Journal of Computing in Childhood Education,
2(3), 51-66.
Atkinson, R. C. Computerized instruction and the learning process. American Psychologist, 23
(4), 225-239.
Atkinson, R. C., & Fletcher, J. D. (1972). Teaching children to read with a computer. The
Reading Teacher, 25, 319-327.
Barker, T. A., & Torgesen, J. K. (1995). An evaluation of computer-assisted instruction in
phonological awareness with below average readers. Journal of Educational Computing
Research, 13, 89-103.
*Barnett, L. B. (2006). The effect of computer-assisted instruction on the reading skills of
emergent readers. Unpublished doctoral dissertation, Florida Atlantic University.
*Bass, G., Ries, R., Sharpe, W. (1986). Teaching basic skills through microcomputer assisted
instruction. Journal of Educational Computing Research, 2(2), 207-219.
*Beasley, N. (1989). The effects of IBM Writing to Read program on the achievement of
selected first grade students. Dissertation Abstracts International, 51 (3), 739A. (UMI No
9122247).
Becker, H. J. (1992). Computer-based integrated learning systems in the elementary and middle
grades: A critical review and synthesis of evaluation reports. Journal of Educational
Computing Research, 8(1), 1-41.
The Best Evidence Encyclopedia is a free web site created by the Johns Hopkins University School of Education’s Center for Data-Driven Reform in Education (CDDRE) under funding from the Institute of Education Sciences, U.S. Department of Education.
24
*Becker, H.J. (1994). Mindless or mindful use of integrated learning systems. International
Journal of Educational Research, 21(1), 65-79.
*Biggs, M. C., Homan, S. P., Dedrick, R., Minick, V., Rasinski, T. (2008). Using an Interactive
Singing Software Program: A Comparative Study of Struggling Middle School Readers.
Reading Psychology, 29(3), 195-213.
*Birch, J. (2002). The effects of the Delaware Challenge Grant Program on the standardized
reading and mathematics test scores of second and third grade students in the Caesar
Rodney School District. Unpublished doctoral dissertation, Wilmington College.
*Block, C. C., Campbell, M. J., Ninon, K., Williams, C., Helgert, M. (2007). Effects of AWARD
Reading, a technology-based Approach to Literacy Instruction, on the Reading
Achievement and Attitudes Toward Reading of Diverse K-1 Students in the United States
of America, . Charlotte, NC: The Institute of Literacy Enhancement, Research Report
124811.
Blok, H., Oostdam, R., Otter, M. E., & Overmatt, M. (2002). Computer-assisted instruction in
support of beginning reading instruction: A review. Review of Educational Research,
72(1), 101-130.
Borenstein, M., Hedges, L. V., Higgins, J. P. T., & Rothstein, H. R. (2005). Comprehensive
meta-analysis (Version 2). Englewood, NJ: Biostat.
Borenstein, M., Hedges, L. V., Higgins, J. P. T., & Rothstein, H. R. (2009). Introduction to
Meta-analysis. West Sussex: Wiley.
*Bryg, V. (1984). The effect of computer assisted instruction upon reading achievement with
selected fourth grade children. Unpublished doctoral dissertation, University of
Nebraska.
Bucleitner, W. (1996). Why do kids love computers? Scholastic Early Childhood Today, 11, 15.
*Caggiano, J.A. (2007). Addressing the learning needs of struggling adolescent readers: The
impact of a reading intervention program on students in a middle school
setting. Unpublished doctoral dissertation, The College of William and Mary.
*Campbell, J.P. (2000). A comparison of computerized and traditional instruction in the area of
elementary reading. Unpublished doctoral dissertation, University of Alabama.
*Campuzano, L., Dynarski, M., Agodini, R., & Rall, K. (2009). Effectiveness of reading and
mathematics software products: Findings from two student cohorts. Washington, DC:
Institute of Education Sciences.
The Best Evidence Encyclopedia is a free web site created by the Johns Hopkins University School of Education’s Center for Data-Driven Reform in Education (CDDRE) under funding from the Institute of Education Sciences, U.S. Department of Education.
25
*Cassady, J., & Smith, L. (2005). The impact of a structured integrated learning system on first
grade students' reading gains. Reading and Writing Quarterly, 21(4), 361-376.
*Chambers, B., Cheung, A., Madden, N., Slavin, R. E., & Gifford, R., (2006). Achievement
effects of embedded multimedia in a Success for All reading program. Journal of
Educational Psychology, 98 (1), 232-237.
Chambers, B., Slavin, R. E., Madden, N. A., Abrami, P. C., Karanzalis, M., & Gifford, R.
(2011). Small-group computer-assisted tutoring to improve reading outcomes for
struggling first and second graders. Elementary School Journal, 111 (4).
*Chambers, B., Slavin, R. E., Madden, N. A., Abrami, P.C., Tucker, B. J. Cheung, A., &
Gifford, R. (2008). Technology infusion in success for All: Reading outcomes for first
graders. Elementary School Journal, 109, (1), 1-15.
*Clariana, R.B. (1994). The effects of an integrated learning system on third graders’
mathematics and reading achievement. San Diego, CA: Jostens Learning Corporation.
(ERIC Document Reproduction Service No. ED 409 181).
Clark, R. E. (1983). Reconsidering research on learning from media. Review of Educational
Research, 53(4), 445-449.
Clark, R. E. (1985a). Confounding in education computing research. Journal of Educational
Computing Research, 1(2), 445-460.
Clark, R. E. (1985b). Evidence for confounding in computer-based instruction studies:
Analyzing the meta-analyses. Educational Communication and Technology Journal,
33(4), 249-262.
Clark, R. E. (1994). Media will never influence learning. Educational Technology Research and
Development, 42(2), 21-29.
*Clayton, I.L. (1992). The relationship between computer-assisted instruction in reading and
mathematics achievement and selected student variables. Unpublished doctoral
dissertation, The University of Southern Mississippi.
*Collis, B., Ollila, L., & Ollila, K. (1990). Writing to Read: An evaluation of a Canadian
installation of a computer-supported initial language environment. Journal of Educational
Computing Research, 6(4), 411-427.
*Coomes, P. (1985). The effects of computer assisted instruction on the development of reading
and language skills. Unpublished doctoral dissertation, North Texas State University.
*Cooperman, K.S. (1985). An experimental study to compare the effectiveness of a regular
classroom reading program to a regular classroom reading program with a computer-
The Best Evidence Encyclopedia is a free web site created by the Johns Hopkins University School of Education’s Center for Data-Driven Reform in Education (CDDRE) under funding from the Institute of Education Sciences, U.S. Department of Education.
26
assisted instruction program in reading comprehension skills in grades two through four.
Unpublished doctoral dissertation, The American University.
Davidson, J. & Miler, J. (2002). Scholastic’s READ 180: A heritage of research. New York:
Scholastic.
*Denson, K. (2008). Passport Reading Journeys Effectiveness with Ninth Grade Students
Identified for Reading Improvement Instruction in an Urban High School: Voyager
Expanded Learning, Inc., http://www.voyagerlearning.com.
Dersimonian, R., & Laird, N. (1986). Meta-analysis in clinical trials. Controlled Clinical Trials,
7, 177-188.
*DiLeo, J. (2007). A Study of a Specific Language Arts and Mathematics Software Program: Is
There a Correlation Between Usage Levels and Achievement? , Unpublished doctoral
dissertation, Indiana University of Pennsylvania.
*Dynarski, M., Agodini, R., Heaviside, S. N., Carey, N., Campuzano, L., Means, B., et al.
(2007). Effectiveness of Reading and Mathematics Software Products: Findings from the
First Student Cohort. Washington, DC: Institute of Education Sciences.
*Easterling, B. (1982). The effects of computer assisted instruction as a supplement to classroom
instruction in reading comprehension and arithmetic. Unpublished doctoral dissertation,
North Texas State University.
Ehri, L. C., Dreyer, L. G., Flugman, B., & Gross, A. (2007). Reading Rescue: An effective
tutoring intervention model for language-minority students who are struggling readers in
first grade. American Educational Research Journal, 44(2), 414-448.
*Erdner, R., Guy, R., & Bush, A. (1997). The impact of a year of computer assisted instruction
on the development of first grade reading skills. Journal of Educational Computing
Research, 18 (4), 369-388.
*Estep, S. (1997). An investigation of the relationship between integrated learning systems and
academic achievement. Unpublished doctoral dissertation, Purdue University.
*Faux, R. (2004). Evaluation of Lexia Software in Boston Public Schools, Final Report: Davis
Square Research Associates.
Fletcher-Finn, C., & Gravatt, B. (1995). The efficacy of computer-assisted instruction (CAI): A
meta-analysis. Journal of Educational Computing Research, 12(3), 219-241.
Foster, K. C., Erickson, G. C., Foster, D. F., Brinkman, D., & Torgesen, J. K. (1994). Computer
administered instruction in phonological awareness: Evaluation of the DaisyQuest
program. The journal of Research and Development in Education, 27(126-137).

The Best Evidence Encyclopedia is a free web site created by the Johns Hopkins University School of Education’s Center for Data-Driven Reform in Education (CDDRE) under funding from the Institute of Education Sciences, U.S. Department of Education.
27
*Frechtling, J. A., Zhang, X., Silverstein, G. (2006). Voyager Universal Literacy System: Results
From a Study of Kindergarten Students in Inner-City Schools. Journal of Education for
Students Placed at Risk, 11(1), 75-95.
Gee, J. P. (2003). What video games have to teach us about learning and literacy. New York:
Palgrave MacMillan.
Glass, G., McGaw, B., & Smith, M. L. (1981). Meta-analysis in social research. Beverly Hills,
CA: Sage.
*Granick, L., & Reid, E. (1987). Writing to Read program, FY 87. Baltimore: Baltimore City
Public Schools.
Gray, L., Thomas, N., Lewis, L., & Tice, P. (2010). Teachers' use of educational technology in
U.S. public schools: 2009: First look. Washington, D. C.: National Center for Education
Statistics, IES.
*Hagerman, T. E. (2003). A quasi-experimental study on the effects of Accelerated Reader at
middle school. Unpublished doctoral dissertation, University of Oregon.
*Haslam, B. M., White, R. N., Klinge, A. (2006). Improving student literacy: READ 180 in the
Austin independent school district 2004-05. Washington, DC: Policy Studies Associates.
Hasselbring, T. S. & Goin, L. I. (2004). Literacy instruction for struggling readers: What is the
role of technology? Reading and Writing Quarterly, 20, 123-144.
*Hecht, S. A. (2003). A Study Between Voyager and Control Schools in Orange County, Florida:
Florida Atlantic University, http://www.voyagerlearning.com.
*Hoffman, J.T. (1984). Reading achievement and attitude toward reading of elementary
students receiving supplementary computer assisted instruction compared with students
receiving supplementary traditional instruction. Unpublished doctoral dissertation, Ball
State University.
*Hunter, C.T.L. (1994). A study of the effect of instructional method on the reading and
mathematics achievement of chapter one students in rural georgia. Unpublished Doctoral
Dissertation, South Carolina State University.
Hyson, M. C. (1986). "Computers? I love them!": Young children's concepts and attitudes about
computers. Early Childhood Development and Care, 23(1), 17-29.
*Interactive, Inc. (2002). Final report: Study of READ 180 in the Council of Great City Schools.
New York, NY: Interactive Inc.
The Best Evidence Encyclopedia is a free web site created by the Johns Hopkins University School of Education’s Center for Data-Driven Reform in Education (CDDRE) under funding from the Institute of Education Sciences, U.S. Department of Education.
28
*James-Burdumy, S., Mansfield, W., Deke, J., Carey, N., Lugo-Gil, J., Hershey, A., et al. (2009).
Effectiveness of Selected Supplemental Reading Comprehension Interventions: Impacts
on a First Cohort of Fifth-Grade Students. . Washington, DC: Institute of Education
Sciences.
*Kadel Research Consulting. (2006). Garfield Heights City Schools Maple Leaf Intermediate,
Enhancing Education Through Technology, End-year evaluation. Kadel Research
Consulting.
*Knox, M. (1996). An experimental study of the effects of The Accelerated Reader program and
a teacher directed program on reading comprehension and vocabulary of fourth and fifth
grade students. Dissertation Abstracts International, 57 (10), 4208A (UMI No.
9710798).
Kozma, R. B. (1994). Will media influence learning? Reframing the debate. Educational
Technology Research and Development, 42(2), 7-19.
Kulik, C. L. C., & Kulik, J. A. (1991). Effectiveness of computer-based instruction: An update
analysis. Computers in Human Behavior, 7(1-2), 75-94.
Kulik, J. A. (2003). Effects of using instructional technology in elementary and secondary
schools: What controlled evaluation studies say. Arlington, VA: SRI International.
Kulik, J. A., & Kulik, C. L. C. (1987). Review of recent research literature on computer-based
instruction. Contemporary Educational Psychology, 12, 222-230.
*Lang, L., Torgesen, J., Vogel, W., Chanter, C., Lefksy, E., Petscher, Y. (2009). Exploring the
Relative Effectiveness of Reading Interventions for High School Students. Journal of
Research on Educational Effectiveness, 2(2), 149-175.
Liao, Y. K. (1999). Effects of hypermedia on students' achievement: A meta-analysis. Journal of
Educational Multimedia and Hypermedia, 8(3), 255-277.
*Levy, M.H. (1985). An evaluation of computer assisted instruction upon the achievement of
fifth grade students as measured by standardized tests. Unpublished Doctoral
Dissertation, University of Bridgeport.
Lipsey, M. W., & Wilson, D. B. (2001). Practical meta-analysis. Thousand Oaks: Sage.
Moseley, D. (1993). Visual and linguistic determinants of reading fluency in dyslexics: A
classroom study with talking computers. In S. F. Wright & R. Groner (Eds.), Facets of
dyslexia and its remediation: Studies in visual information processing (Vol. 3, pp. 567-
584).
The Best Evidence Encyclopedia is a free web site created by the Johns Hopkins University School of Education’s Center for Data-Driven Reform in Education (CDDRE) under funding from the Institute of Education Sciences, U.S. Department of Education.
29
*Liston, W. R. (1991). The effects of computer-assisted instruction on remedial reading
students’ achievement in grade 10 identified South Carolina High Schools as measured
by BSAP state testing in school years 1988-89 and 1989-90. Unpublished doctoral
dissertation, University of South Carolina.
*Macaruso, P., Hook, P.E., & McCabe, R. (2006). The efficacy of computer-based
supplementary phonics programs for advancing reading skills in at-risk elementary
students. Journal of Research in Reading, 29, 162-172.
*Marion, G.G. (2004). An examination of the relationship between students’ use of the Fast
ForWord Reading Program and their performance on standardized assessments in
elementary schools. Unpublished doctoral dissertation, East Tennessee State University.
Mayer, R. (2009). Multimedia learning (2nd
ed). New York: Cambridge University Press.
Mayer, R. (2008). Information processing. In T. L. Good (Ed.), 21st century learning: Vol. 1
(pp.168-174). Thousand Oaks, CA: Sage.
*Metrics Associates. (1981). Evaluation of the Computer Assisted Instruction Title I Project,
1980-81. Research Report. Chelmsford, MA: Merrimack Education Center.
*Miller, H. (1997). Quantitative analyses of student outcome measures. International Journal of
Educational Research, 25, 119-136.
*Mims, C., Lowther, D., Strahl, J.D., & Nunnery, J. (2006). Little Roch School District READ
180 evaluation: Technical Report. Memphis, TN: The Center for Research in Educational
Policy.
*Mys, D.P. & Petrie, J. (1988). Evaluation of student reading and math WICAT computer
managed instructional program Salina Elementary School November, 1985 - June 1988.
Bulletin No 1345, Office of Research and Evaluation, Public Schools, Bearhorn, MI.
*Nave, J. (2007). An assessment of READ 180 regarding its association with the academic
achievement of at-risk students in Sevier County schools. Unpublished doctoral
dissertation, East Tennessee State University.
*Nunnery, J., Ross, S.M. & Goldfeder, E. (2003). The effect of School Renaissance on TAAS
scores in the McKinney ISD. Memphis: University of Memphis, Center for Research in
Educational Policy.
*Nunnery, J. A., Ross, S. M. (2007). Effects of the School Renaissance Program on Student
Achievement in Reading and Mathematics. Research in the Schools, 14(1), 40.
Niemiec, R., & Walberg, H. J. (1987). Comparative effects of computer-assisted instruction: A
synthesis of reviews. Journal of Educational Computing Research, 3, 19-37.
The Best Evidence Encyclopedia is a free web site created by the Johns Hopkins University School of Education’s Center for Data-Driven Reform in Education (CDDRE) under funding from the Institute of Education Sciences, U.S. Department of Education.
30
Ouyang, J. (1993). Meta-analysis: CAI at the level of elementary education. Paper presented at
the World Conference on Education Multimedia and Hypermedia.
*Papalewis, R. (2004). Struggling middle school readers: Successful, accelerating intervention.
Sacramento, CA: California State University.
*Paterson, W., Henry, J., O'Quin, K., Ceprano, M., & Blue, E. (2003). Investigating the
effectiveness of an integrated learning system on early emergent readers. Reading
Research Quarterly, 38(2), 172-206.
*Rabiner, D. L., Murray, D. W., Skinner, A. T., Malone, P. S. (2010). Randomized Trial of Two
Promising Computer-Based Interventions for Students with Attention Difficulties.
Journal of Abnormal Child Psychology, 38(1), 131-142.
*Ragosta, M. (1983). Computer-assisted instruction and compensatory education: A longitudinal
analysis. Machine-Mediated Learning, 1(1) 97-127.
*Ramey, M. (1991). Compensatory Education Sustained Gains from Spring 1988 to Spring
1990. Seattle School District Report No. 9-1, March.
Rieber, L. P. (1996). Seriously considering play: Design interactive learning environments based
on the blending of microworlds, simulations, and games. Educational Technology
Research and Development, 44(2), 43-58.
*RMC (2004). The literacy center K-1 Las Vegas project. [Retrieved March 17, 2007]. from
www.leapfrogschoolhouse.com/do/findpage?pageKey=research.
*Ross, S. M. & Nunnery, J. A. (2005). The effect of school renaissance on student achievement
in two Mississippi school districts. Memphis: Center for Research in Educational Policy.
*Ross, S. M., Nunnery, J., Avis, A., & Borek, T. (2005). The effects of School Renaissance on
student achievement in two Mississippi school districts: A longitudinal quasi-
experimental study. Memphis: TN: Center for Research in Education Policy.
*Roth, S. & Beck, I. (1987). Theoretical and instructional implications of the assessment of two
microcomputer word recognition programs. Reading Research Quarterly, 22(2), 197-218.
*Rouse, C. E., Krueger, Alan B. (2004). Putting computerized instruction to the test: A
randomized evaluation of a "scientifically based" reading program. Economics of
Education Review, 23(4), 323-338.
*Roy, J.W. (1993). An investigation of the efficacy of computer-assisted mathematics, reading,
and language arts instruction. Unpublished doctoral dissertation, Baylor University.
The Best Evidence Encyclopedia is a free web site created by the Johns Hopkins University School of Education’s Center for Data-Driven Reform in Education (CDDRE) under funding from the Institute of Education Sciences, U.S. Department of Education.
31
*Saine, N. L., Lerkkanen, Marja-Kristiina, Ahonen, Timo, Tolvanen, Asko, Lyytinen, Heikki
(2010). Predicting word-level reading fluency outcomes in three contrastive groups:
Remedial and computer-assisted remedial reading intervention, and mainstream
instruction. Learning and Individual Differences, 20(5), 402-414.
*Saracho, O. (1982). The effects of a computer-assisted computer program on basic skills
achievement and attitudes toward instruction of Spanish-speaking migrant children.
American Educational Research Journal, 19(2), 201-219.
*Schardt, A. M. (1997). A Comparison of English Language and Reading Skills of Limited
English Proficient Students With and Without Use of Multimedia CD-ROM Literature-
Based Software. Unpublished doctoral dissertation, The University of Texas at Austin.
*Schmidt, S. (1991). Technology for the 21st century: The effects of an integrated distributive
computer network system on student achievement. Unpublished doctoral dissertation,
University of La Verne, LaVerne, CA.
Schmidt, F. L., Oh, I. S., & Hayes, T. L. (2009). Fixed- versus random-effects models in meta-
analysis: Model properties and an empirical comparison of differences in results. British
Journal of Mathematical and Statistical Psychology, 62, 97-128.
*Scholastic Research (2008). Desert Sands Unified School District, CA. New York, NY:
Scholastic Inc.
*Scientific Learning Corporation. (2006). Improved reading skills by students in Boone County
School District who used Fast ForWord products. Maps for Learning: Educator Reports,
10 (15), 1-7.
Sedlmeier, P., & Gigerenzer, G. (1989). Do studies of statistical power have an effect on the
power of studies? Psychological Bulletin, 105, 309-316.
SETDA (2010). National educational technology trends: 2010. Retrieved August 1, 2010:
www.setda.org.
Shadish, W. R., Cook, T. D., & Campbell, D. T. (2002). Experimental and quasi-experimental
designs for generalized causal inference. Boston: Houghton-Mifflin.
*Shneyderman, A., (2006). Some Results of the Voyager Passport Reading Intervention System
in Several District Schools. Miami, FL: Miami-Dade County Public Schools Office of
Program Evaluation.
*Sinkis, D. M., & A. (1993). A Comparison of Chapter One student achievement with and
without computer-assisted instruction. University of Massachusetts.
The Best Evidence Encyclopedia is a free web site created by the Johns Hopkins University School of Education’s Center for Data-Driven Reform in Education (CDDRE) under funding from the Institute of Education Sciences, U.S. Department of Education.
32
Slavin, R.E., & Smith, D. (2009). The relationship between sample sizes and effect sizes in
systematic reviews in education. Educational Evaluation and Policy Analysis, 31 (4),
500-506.
Slavin, R. E. (2009). Educational psychology: Theory into practice (9th
Ed.). Boston: Allyn &
Bacon
Slavin, R. E. (2008). What works? Issues in synthesizing education program evaluations.
Educational Researcher, 37(1), 5-14.
Slavin, R. E. (1994). Quality, appropriateness, incentive, and time: A model of instructional
effectiveness. International Journal of Educational Research, 21, 141-157.
Soe, K., Koki, S., & Chang, J. M. (2000). Effect of computer assisted instruction (CAI) on
reading achievement: A meta-analysis. Washington, DC: OERI.
*Standish, D. (1995). The effects on reading comprehension of Jostens' Integrated Language
Arts for second-grade students along with Jostens' Basic Learning System for second-
grade Chapter 1 students. Dissertation Abstracts International, 57 (3), 1079A. (UMI No.
9623238).
*Stein, M., Berends, M. Fuchs, D., McMaster, K., Saenz, L., Yen, L., Fuchs, L., & Comption, D.
(2008). Scaling up an early reading program: Relationships among teacher support,
fidelity of implementation, and student performance across different sites and years.
Educational Evaluation and Policy Analysis, 30 (4), 368-388.
*Stevenson, Z., Cathey-Pugh, J., & Kosmidis, M. (1988). Achievement in the Writing to Read
program: A comparative evaluation study. Washington, DC: District of Columbia Public
Schools, Division of Quality Assurance and Management Planning. (ERIC No.
ED293147).
Torgesen, J. K., Wagner, R. K., Rashotte, C. A., Herron, J., & Lindamood, P. (2010). Annals of
Dyslexia, 60, 40-56.
*Tracey, D. & Young, J. (2006). Technology and early literacy: The impact of an integrated
learning system on high-risk kindergartners' achievement. Pearson Digital Learning, Inc.
*Tracey, D. H., Young, J. W. (2004). Evaluation of KidBiz3000: Bayonne Study Final Report.
Lakewood, NJ: www.achieve3000.com.
*Vaughan, J., Serido, J., & Wilhelm, M. (2006). The effects of My Reading Coach on Reading
Achievement of elementary education students. Phoenix, AZ: Arizona Board of Regents.
Virvou, M., Katsionis, G., & Manos, K. (2005). Combining software games with education:
Evaluation of educational effectiveness. Educational Technology and Society, 8(2), 54-
65.
The Best Evidence Encyclopedia is a free web site created by the Johns Hopkins University School of Education’s Center for Data-Driven Reform in Education (CDDRE) under funding from the Institute of Education Sciences, U.S. Department of Education.
33
Wentink, H., Van Bon, W. H. J., & Schreuder, R. (1997). Training of poor readers' phonological
decoding skills: Evidence for syllable-bound processing. Reading and Writing: An
Interdisciplinary Journal 9, 163-192.
*Whitaker, J.C. (2005). Impact of an integrated learning system on reading and mathematics
achievement. Unpublished doctoral dissertation, Tennessee State University.
*White, R. N., Haslam, M. B., Hewes, G. M. (2006). Improving student literacy in the Phoenix
Union High School District, 2003-04 and 2004-05. Final Report. Washington, DC:
Policy Studies Associates.
*Williams, B.J. (2005). A quasi-experimental study on the effects of the OpenBook to Literacy
program on fourth-grade students. Unpublished doctoral dissertion, Tennessee State
University.
*Woods, D.E. (2007). An investigation of the effects of a middle school reading intervention on
school dropout rates. Unpublished doctoral dissertation, Virginia Polytechnic Institute
and State University.
*Yee, V.N. (2007). An evaluation of the impact of a standards-based intervention on the
academic achievement of English language learners. Unpublished doctoral dissertation,
University of Southern California.
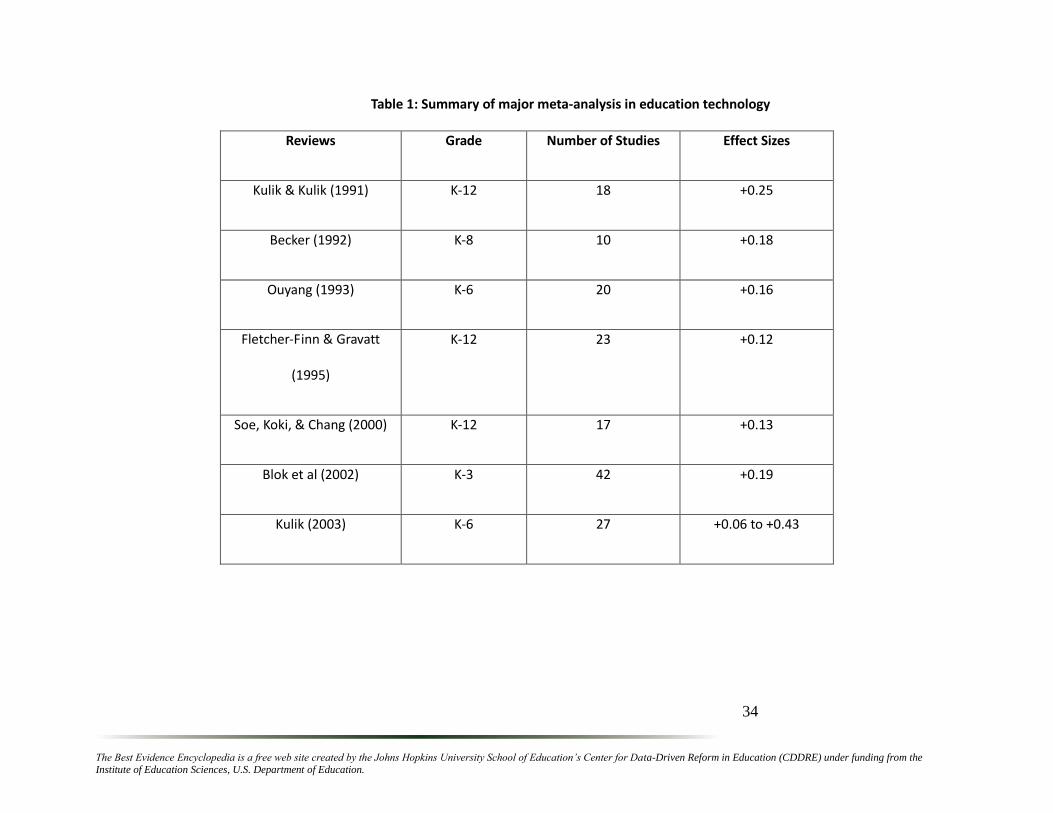
The Best Evidence Encyclopedia is a free web site created by the Johns Hopkins University School of Education’s Center for Data-Driven Reform in Education (CDDRE) under funding from the Institute of Education Sciences, U.S. Department of Education.
34
Table 1: Summary of major meta-analysis in education technology
Reviews Grade Number of Studies Effect Sizes
Kulik & Kulik (1991) K-12 18 +0.25
Becker (1992) K-8 10 +0.18
Ouyang (1993) K-6 20 +0.16
Fletcher-Finn & Gravatt
(1995)
K-12 23 +0.12
Soe, Koki, & Chang (2000) K-12 17 +0.13
Blok et al (2002) K-3 42 +0.19
Kulik (2003) K-6 27 +0.06 to +0.43
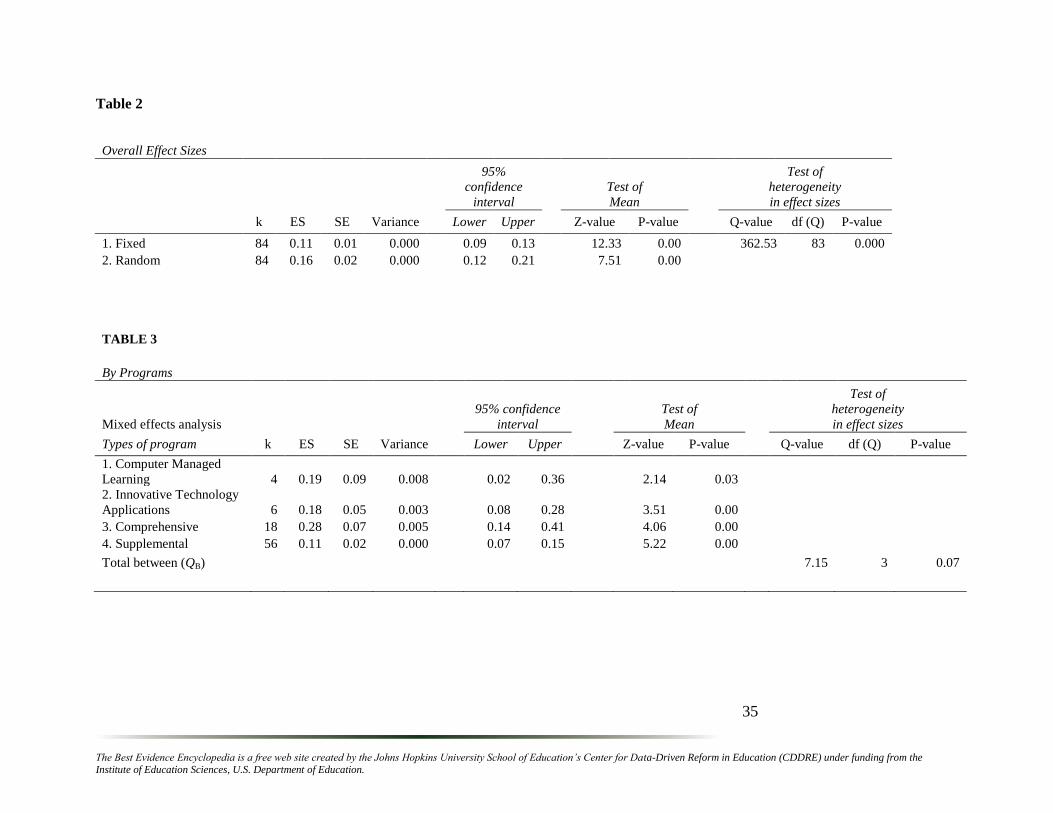
The Best Evidence Encyclopedia is a free web site created by the Johns Hopkins University School of Education’s Center for Data-Driven Reform in Education (CDDRE) under funding from the Institute of Education Sciences, U.S. Department of Education.
35
Table 2
Overall Effect Sizes
95%
confidence
interval
Test of
Mean
Test of
heterogeneity
in effect sizes
k ES SE Variance Lower Upper Z-value P-value Q-value df (Q) P-value
1. Fixed 84 0.11 0.01 0.000
0.09 0.13
12.33 0.00
362.53 83 0.000
2. Random 84 0.16 0.02 0.000
0.12 0.21
7.51 0.00
TABLE 3
By Programs
Mixed effects analysis
95% confidence
interval
Test of
Mean
Test of
heterogeneity
in effect sizes
Types of program k ES SE Variance Lower Upper Z-value P-value Q-value df (Q) P-value
1. Computer Managed
Learning 4 0.19 0.09 0.008
0.02 0.36
2.14 0.03
2. Innovative Technology
Applications 6 0.18 0.05 0.003
0.08 0.28
3.51 0.00
3. Comprehensive 18 0.28 0.07 0.005
0.14 0.41
4.06 0.00
4. Supplemental 56 0.11 0.02 0.000
0.07 0.15
5.22 0.00
Total between (QB)
7.15 3 0.07
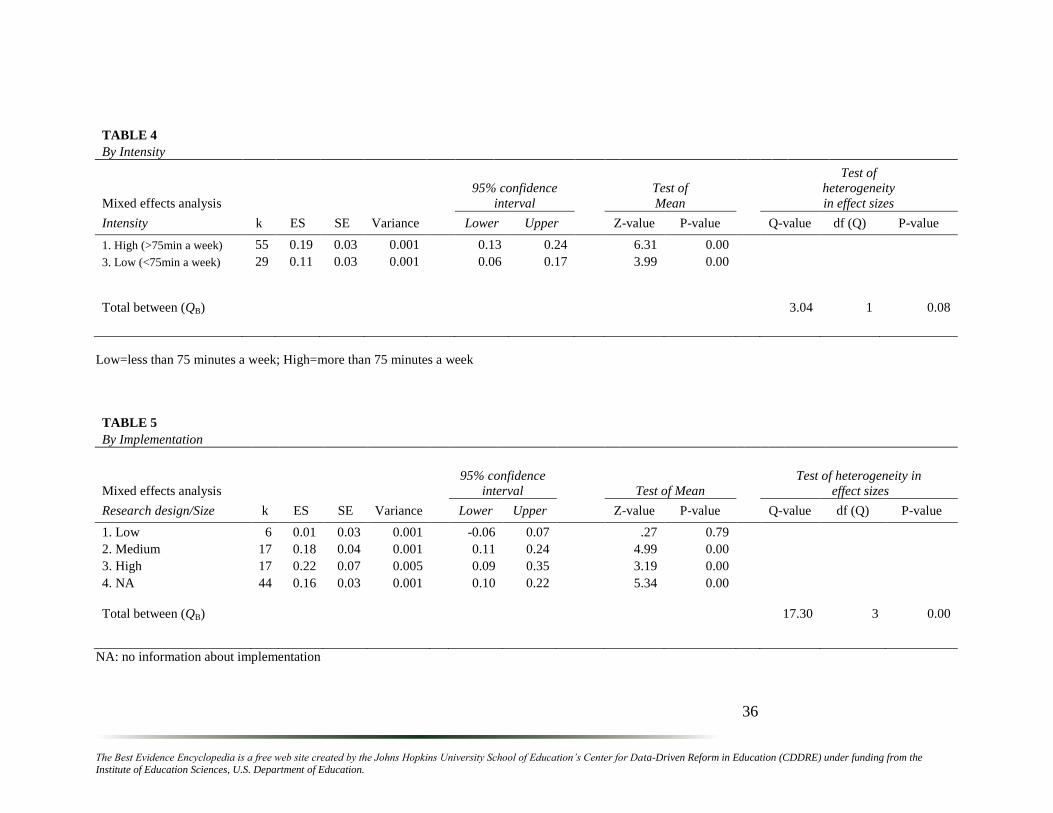
The Best Evidence Encyclopedia is a free web site created by the Johns Hopkins University School of Education’s Center for Data-Driven Reform in Education (CDDRE) under funding from the Institute of Education Sciences, U.S. Department of Education.
36
TABLE 4
By Intensity
Mixed effects analysis
95% confidence
interval
Test of
Mean
Test of
heterogeneity
in effect sizes
Intensity k ES SE Variance Lower Upper Z-value P-value Q-value df (Q) P-value
1. High (>75min a week) 55 0.19 0.03 0.001
0.13 0.24
6.31 0.00
3. Low (<75min a week) 29 0.11 0.03 0.001
0.06 0.17
3.99 0.00
Total between (QB)
3.04 1 0.08
Low=less than 75 minutes a week; High=more than 75 minutes a week
TABLE 5
By Implementation
Mixed effects analysis
95% confidence
interval Test of Mean
Test of heterogeneity in
effect sizes
Research design/Size k ES SE Variance Lower Upper Z-value P-value Q-value df (Q) P-value
1. Low 6 0.01 0.03 0.001
-0.06 0.07
.27 0.79
2. Medium 17 0.18 0.04 0.001
0.11 0.24
4.99 0.00
3. High 17 0.22 0.07 0.005
0.09 0.35
3.19 0.00
4. NA 44 0.16 0.03 0.001
0.10 0.22
5.34 0.00
Total between (QB)
17.30 3 0.00
NA: no information about implementation
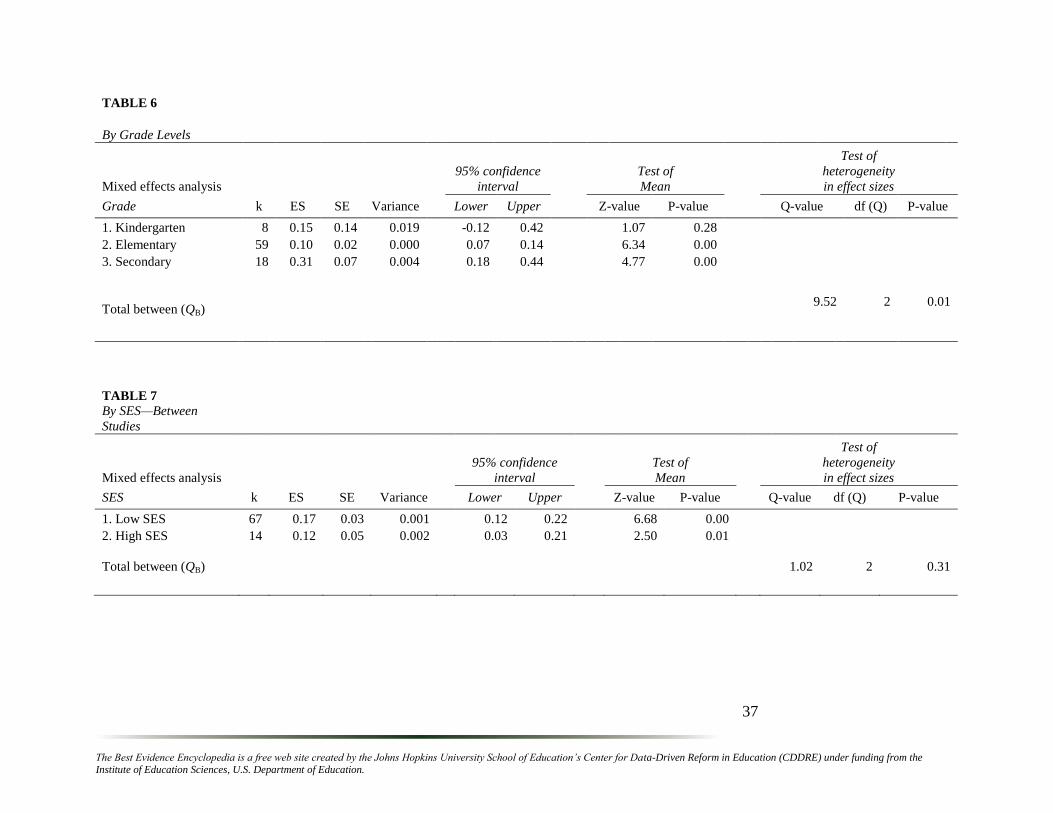
The Best Evidence Encyclopedia is a free web site created by the Johns Hopkins University School of Education’s Center for Data-Driven Reform in Education (CDDRE) under funding from the Institute of Education Sciences, U.S. Department of Education.
37
TABLE 6
By Grade Levels
Mixed effects analysis
95% confidence
interval
Test of
Mean
Test of
heterogeneity
in effect sizes
Grade k ES SE Variance Lower Upper Z-value P-value Q-value df (Q) P-value
1. Kindergarten 8 0.15 0.14 0.019
-0.12 0.42
1.07 0.28
2. Elementary 59 0.10 0.02 0.000
0.07 0.14
6.34 0.00
3. Secondary 18 0.31 0.07 0.004
0.18 0.44
4.77 0.00
Total between (QB)
9.52 2 0.01
TABLE 7
By SES—Between
Studies
Mixed effects analysis
95% confidence
interval
Test of
Mean
Test of
heterogeneity
in effect sizes
SES k ES SE Variance Lower Upper Z-value P-value Q-value df (Q) P-value
1. Low SES 67 0.17 0.03 0.001
0.12 0.22
6.68 0.00
2. High SES 14 0.12 0.05 0.002
0.03 0.21
2.50 0.01
Total between (QB)
1.02 2 0.31
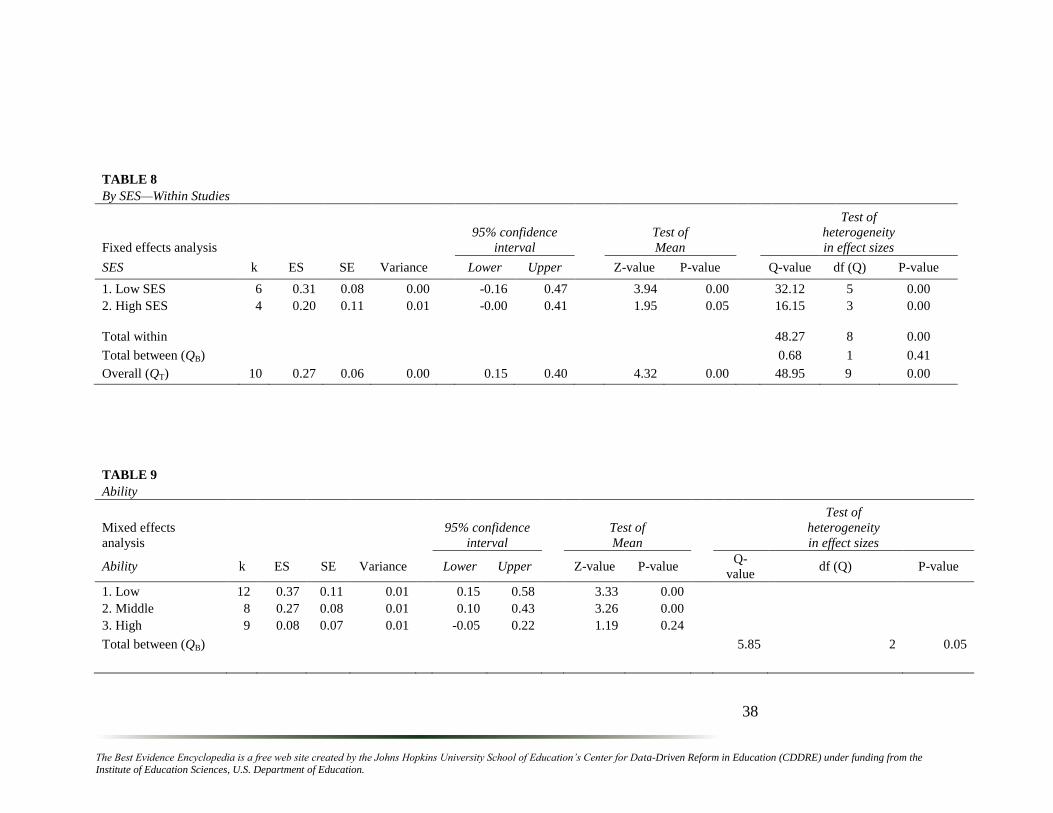
The Best Evidence Encyclopedia is a free web site created by the Johns Hopkins University School of Education’s Center for Data-Driven Reform in Education (CDDRE) under funding from the Institute of Education Sciences, U.S. Department of Education.
38
TABLE 8
By SES—Within Studies
Fixed effects analysis
95% confidence
interval
Test of
Mean
Test of
heterogeneity
in effect sizes
SES k ES SE Variance Lower Upper Z-value P-value Q-value df (Q) P-value
1. Low SES 6 0.31 0.08 0.00
-0.16 0.47
3.94 0.00
32.12 5 0.00
2. High SES 4 0.20 0.11 0.01
-0.00 0.41
1.95 0.05
16.15 3 0.00
Total within
48.27 8 0.00
Total between (QB)
0.68 1 0.41
Overall (QT) 10 0.27 0.06 0.00 0.15 0.40 4.32 0.00 48.95 9 0.00
TABLE 9
Ability
Mixed effects
analysis
95% confidence
interval
Test of
Mean
Test of
heterogeneity
in effect sizes
Ability k ES SE Variance Lower Upper Z-value P-value Q-
value df (Q) P-value
1. Low 12 0.37 0.11 0.01
0.15 0.58
3.33 0.00
2. Middle 8 0.27 0.08 0.01
0.10 0.43
3.26 0.00
3. High 9 0.08 0.07 0.01
-0.05 0.22
1.19 0.24
Total between (QB)
5.85 2 0.05
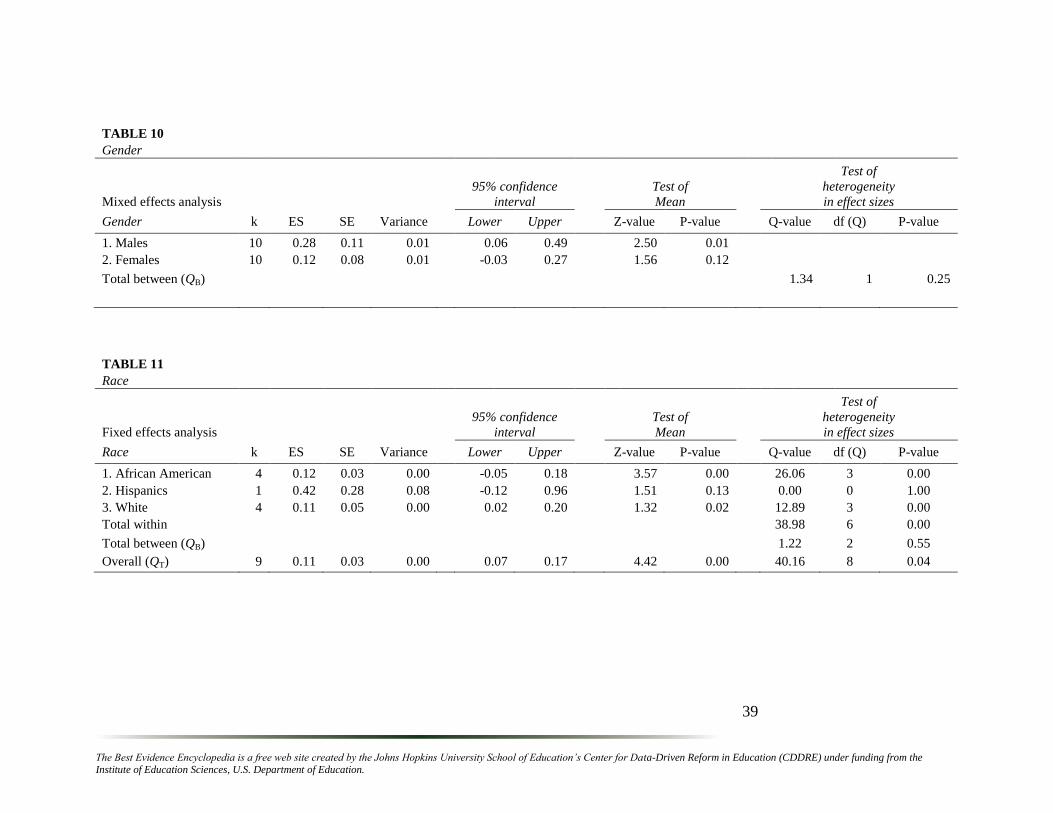
The Best Evidence Encyclopedia is a free web site created by the Johns Hopkins University School of Education’s Center for Data-Driven Reform in Education (CDDRE) under funding from the Institute of Education Sciences, U.S. Department of Education.
39
TABLE 10
Gender
Mixed effects analysis
95% confidence
interval
Test of
Mean
Test of
heterogeneity
in effect sizes
Gender k ES SE Variance Lower Upper Z-value P-value Q-value df (Q) P-value
1. Males 10 0.28 0.11 0.01
0.06 0.49
2.50 0.01
2. Females 10 0.12 0.08 0.01
-0.03 0.27
1.56 0.12
Total between (QB)
1.34 1 0.25
TABLE 11
Race
Fixed effects analysis
95% confidence
interval
Test of
Mean
Test of
heterogeneity
in effect sizes
Race k ES SE Variance Lower Upper Z-value P-value Q-value df (Q) P-value
1. African American 4 0.12 0.03 0.00
-0.05 0.18
3.57 0.00
26.06 3 0.00
2. Hispanics 1 0.42 0.28 0.08
-0.12 0.96
1.51 0.13
0.00 0 1.00
3. White 4 0.11 0.05 0.00
0.02 0.20
1.32 0.02
12.89 3 0.00
Total within
38.98 6 0.00
Total between (QB)
1.22 2 0.55
Overall (QT) 9 0.11 0.03 0.00 0.07 0.17 4.42 0.00 40.16 8 0.04
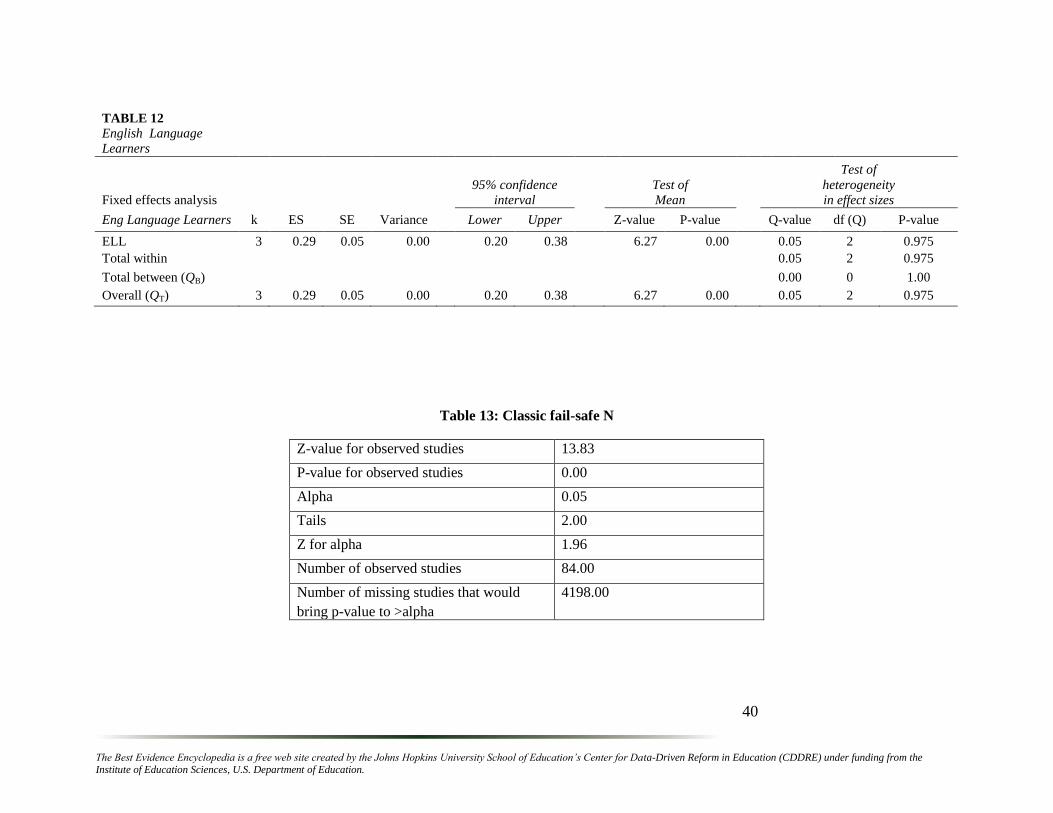
The Best Evidence Encyclopedia is a free web site created by the Johns Hopkins University School of Education’s Center for Data-Driven Reform in Education (CDDRE) under funding from the Institute of Education Sciences, U.S. Department of Education.
40
TABLE 12
English Language
Learners
Fixed effects analysis
95% confidence
interval
Test of
Mean
Test of
heterogeneity
in effect sizes
Eng Language Learners k ES SE Variance Lower Upper Z-value P-value Q-value df (Q) P-value
ELL 3 0.29 0.05 0.00
0.20 0.38
6.27 0.00
0.05 2 0.975
Total within
0.05 2 0.975
Total between (QB)
0.00 0 1.00
Overall (QT) 3 0.29 0.05 0.00 0.20 0.38 6.27 0.00 0.05 2 0.975
Table 13: Classic fail-safe N
Z-value for observed studies 13.83
P-value for observed studies 0.00
Alpha 0.05
Tails 2.00
Z for alpha 1.96
Number of observed studies 84.00
Number of missing studies that would
bring p-value to >alpha
4198.00
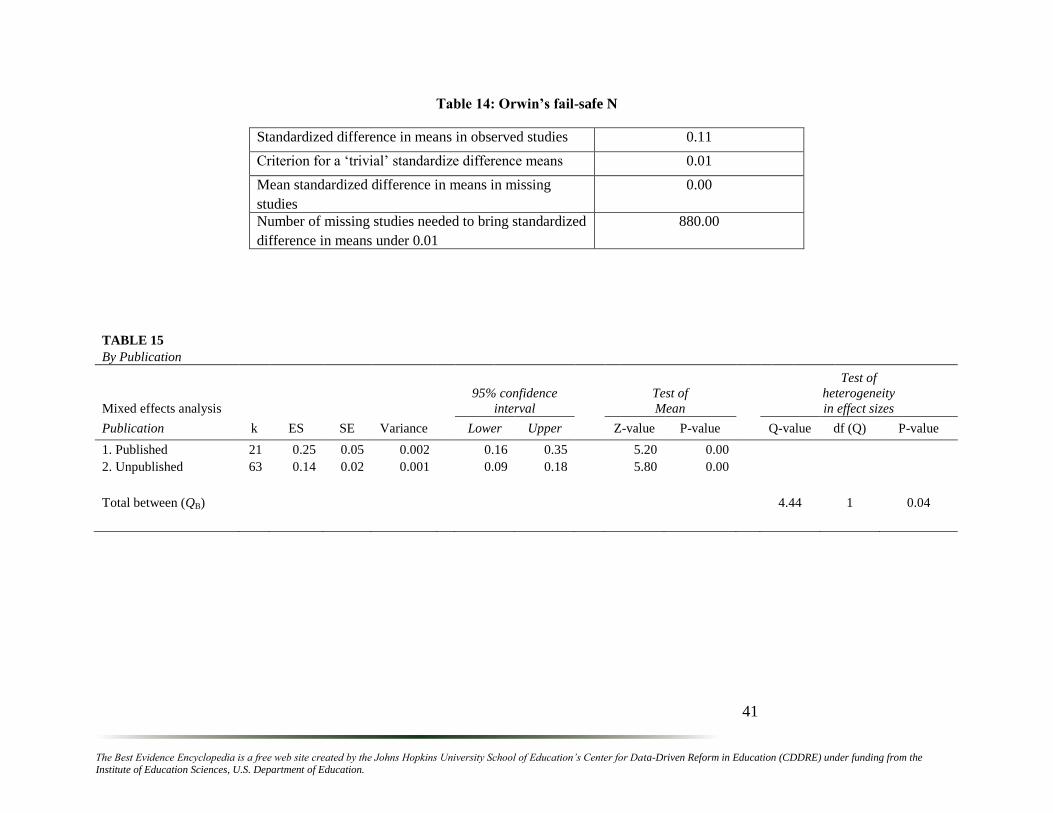
The Best Evidence Encyclopedia is a free web site created by the Johns Hopkins University School of Education’s Center for Data-Driven Reform in Education (CDDRE) under funding from the Institute of Education Sciences, U.S. Department of Education.
41
Table 14: Orwin’s fail-safe N
Standardized difference in means in observed studies 0.11
Criterion for a ‘trivial’ standardize difference means 0.01
Mean standardized difference in means in missing
studies
0.00
Number of missing studies needed to bring standardized
difference in means under 0.01
880.00
TABLE 15
By Publication
Mixed effects analysis
95% confidence
interval
Test of
Mean
Test of
heterogeneity
in effect sizes
Publication k ES SE Variance Lower Upper Z-value P-value Q-value df (Q) P-value
1. Published 21 0.25 0.05 0.002
0.16 0.35
5.20 0.00
2. Unpublished 63 0.14 0.02 0.001
0.09 0.18
5.80 0.00
Total between (QB)
4.44 1 0.04
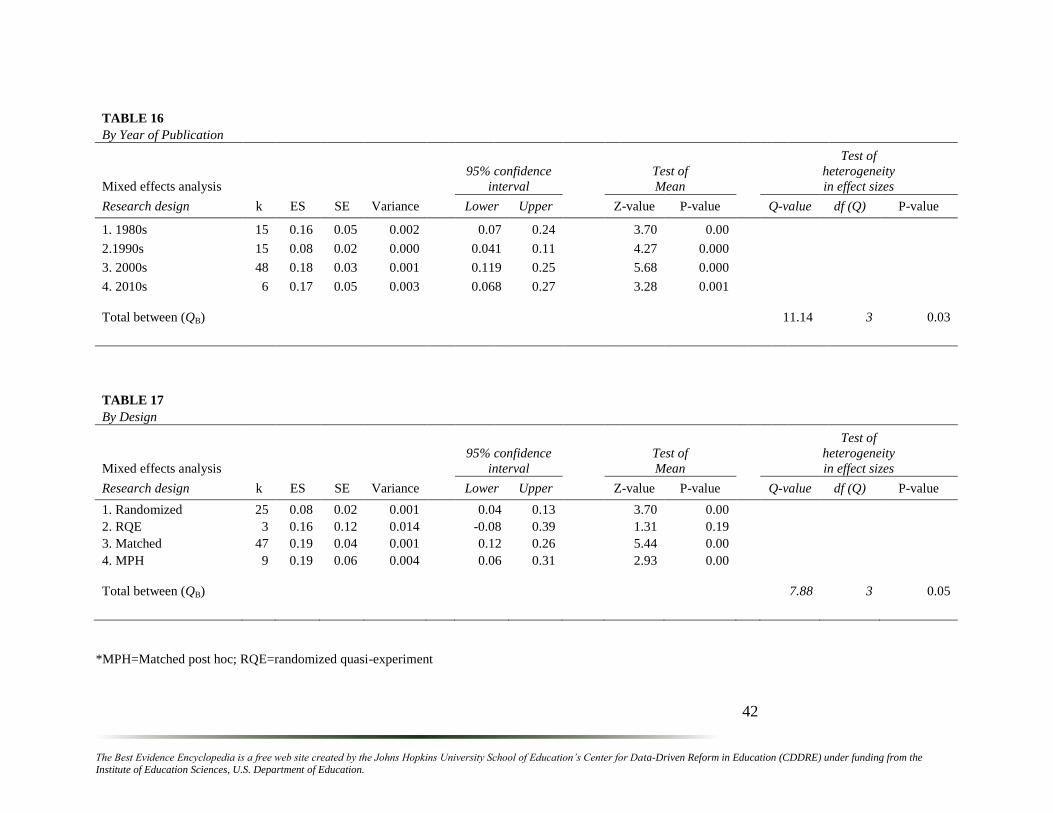
The Best Evidence Encyclopedia is a free web site created by the Johns Hopkins University School of Education’s Center for Data-Driven Reform in Education (CDDRE) under funding from the Institute of Education Sciences, U.S. Department of Education.
42
TABLE 16
By Year of Publication
Mixed effects analysis
95% confidence
interval
Test of
Mean
Test of
heterogeneity
in effect sizes
Research design k ES SE Variance Lower Upper Z-value P-value Q-value df (Q) P-value
1. 1980s 15 0.16 0.05 0.002
0.07 0.24
3.70 0.00
2.1990s 15 0.08 0.02 0.000
0.041 0.11
4.27 0.000
3. 2000s 48 0.18 0.03 0.001
0.119 0.25
5.68 0.000
4. 2010s 6 0.17 0.05 0.003
0.068 0.27
3.28 0.001
Total between (QB)
11.14 3 0.03
TABLE 17
By Design
Mixed effects analysis
95% confidence
interval
Test of
Mean
Test of
heterogeneity
in effect sizes
Research design k ES SE Variance Lower Upper Z-value P-value Q-value df (Q) P-value
1. Randomized 25 0.08 0.02 0.001
0.04 0.13
3.70 0.00
2. RQE 3 0.16 0.12 0.014
-0.08 0.39
1.31 0.19
3. Matched 47 0.19 0.04 0.001
0.12 0.26
5.44 0.00
4. MPH 9 0.19 0.06 0.004
0.06 0.31
2.93 0.00
Total between (QB)
7.88 3 0.05
*MPH=Matched post hoc; RQE=randomized quasi-experiment
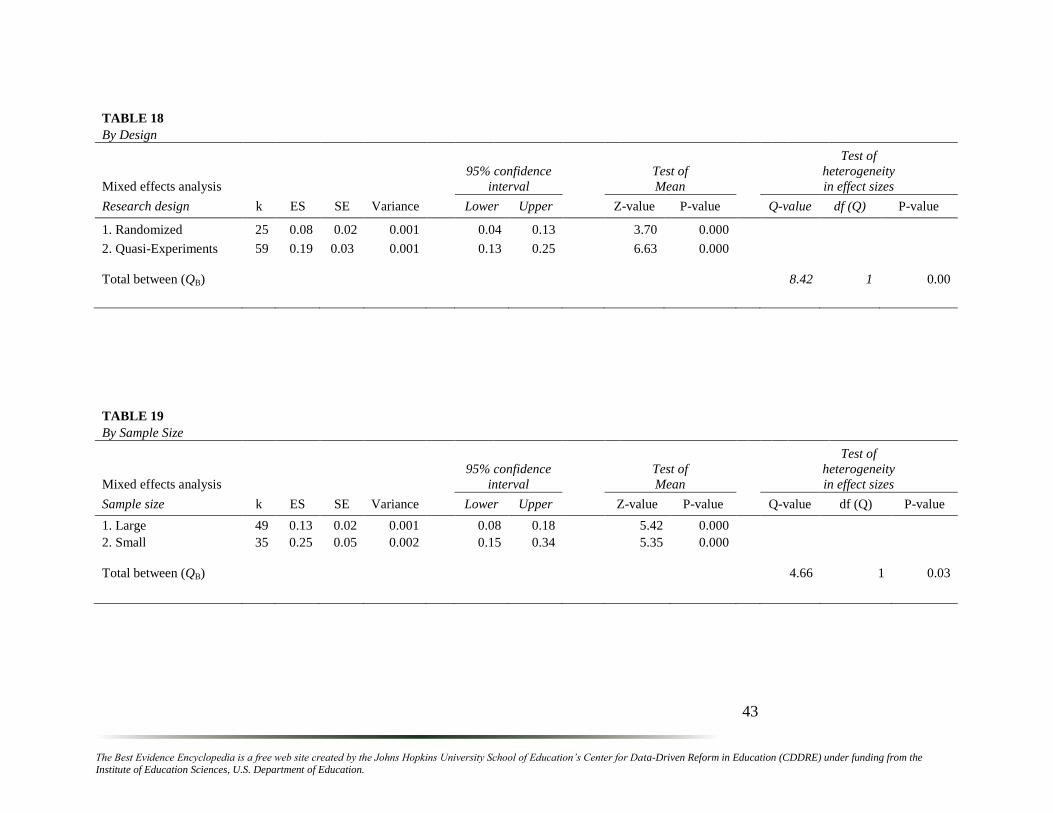
The Best Evidence Encyclopedia is a free web site created by the Johns Hopkins University School of Education’s Center for Data-Driven Reform in Education (CDDRE) under funding from the Institute of Education Sciences, U.S. Department of Education.
43
TABLE 18
By Design
Mixed effects analysis
95% confidence
interval
Test of
Mean
Test of
heterogeneity
in effect sizes
Research design k ES SE Variance Lower Upper Z-value P-value Q-value df (Q) P-value
1. Randomized 25 0.08 0.02 0.001
0.04 0.13
3.70 0.000
2. Quasi-Experiments 59 0.19 0.03 0.001
0.13 0.25
6.63 0.000
Total between (QB)
8.42 1 0.00
TABLE 19
By Sample Size
Mixed effects analysis
95% confidence
interval
Test of
Mean
Test of
heterogeneity
in effect sizes
Sample size k ES SE Variance Lower Upper Z-value P-value Q-value df (Q) P-value
1. Large 49 0.13 0.02 0.001
0.08 0.18
5.42 0.000
2. Small 35 0.25 0.05 0.002
0.15 0.34
5.35 0.000
Total between (QB)
4.66 1 0.03
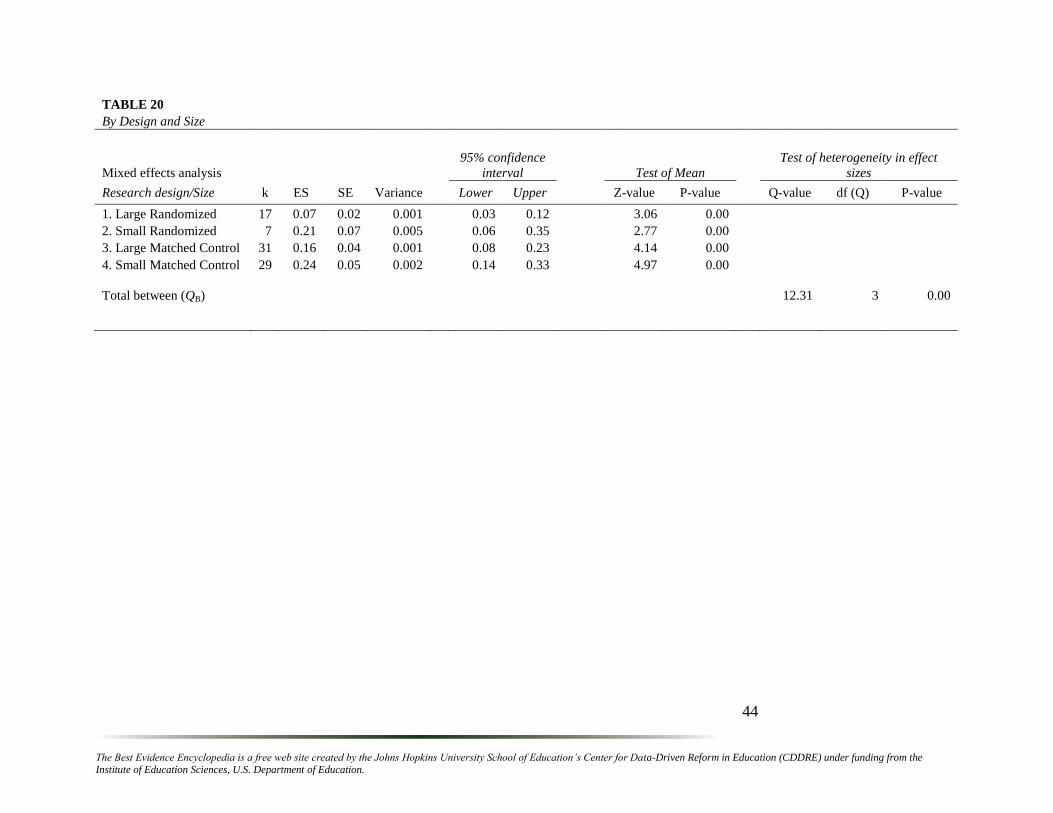
The Best Evidence Encyclopedia is a free web site created by the Johns Hopkins University School of Education’s Center for Data-Driven Reform in Education (CDDRE) under funding from the Institute of Education Sciences, U.S. Department of Education.
44
TABLE 20
By Design and Size
Mixed effects analysis
95% confidence
interval Test of Mean
Test of heterogeneity in effect
sizes
Research design/Size k ES SE Variance Lower Upper Z-value P-value Q-value df (Q) P-value
1. Large Randomized 17 0.07 0.02 0.001
0.03 0.12
3.06 0.00
2. Small Randomized 7 0.21 0.07 0.005
0.06 0.35
2.77 0.00
3. Large Matched Control 31 0.16 0.04 0.001
0.08 0.23
4.14 0.00
4. Small Matched Control 29 0.24 0.05 0.002
0.14 0.33
4.97 0.00
Total between (QB)
12.31 3 0.00
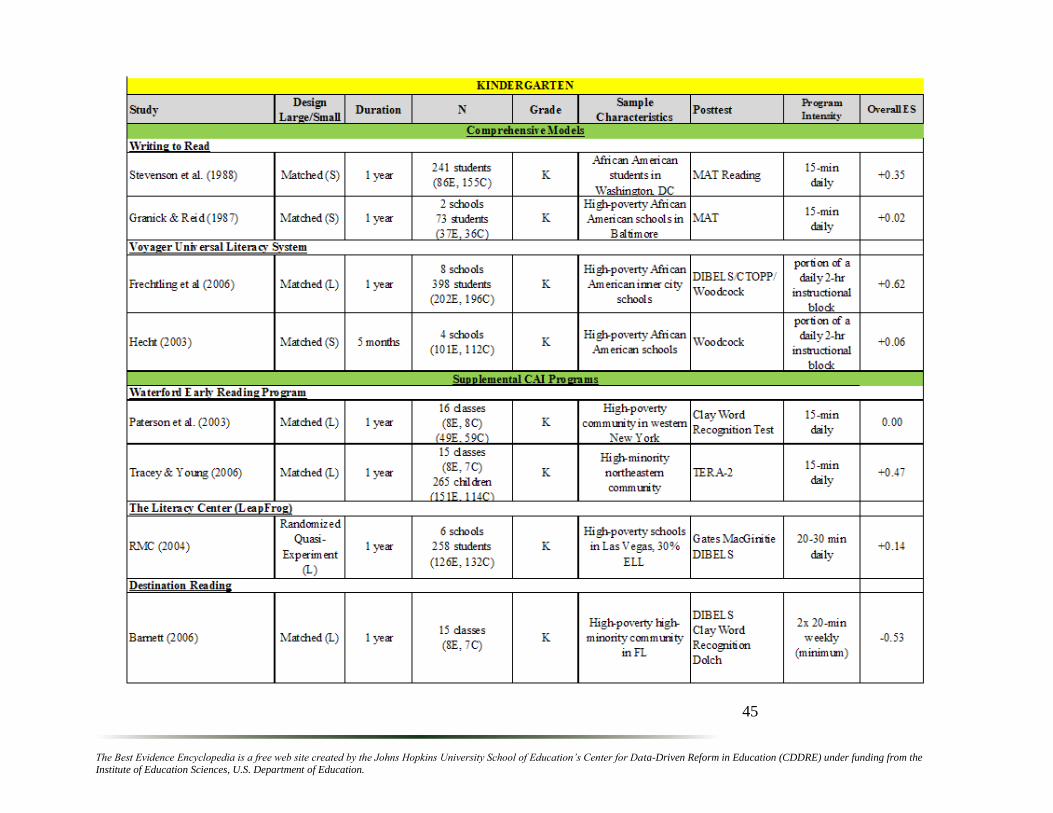
The Best Evidence Encyclopedia is a free web site created by the Johns Hopkins University School of Education’s Center for Data-Driven Reform in Education (CDDRE) under funding from the Institute of Education Sciences, U.S. Department of Education.
45
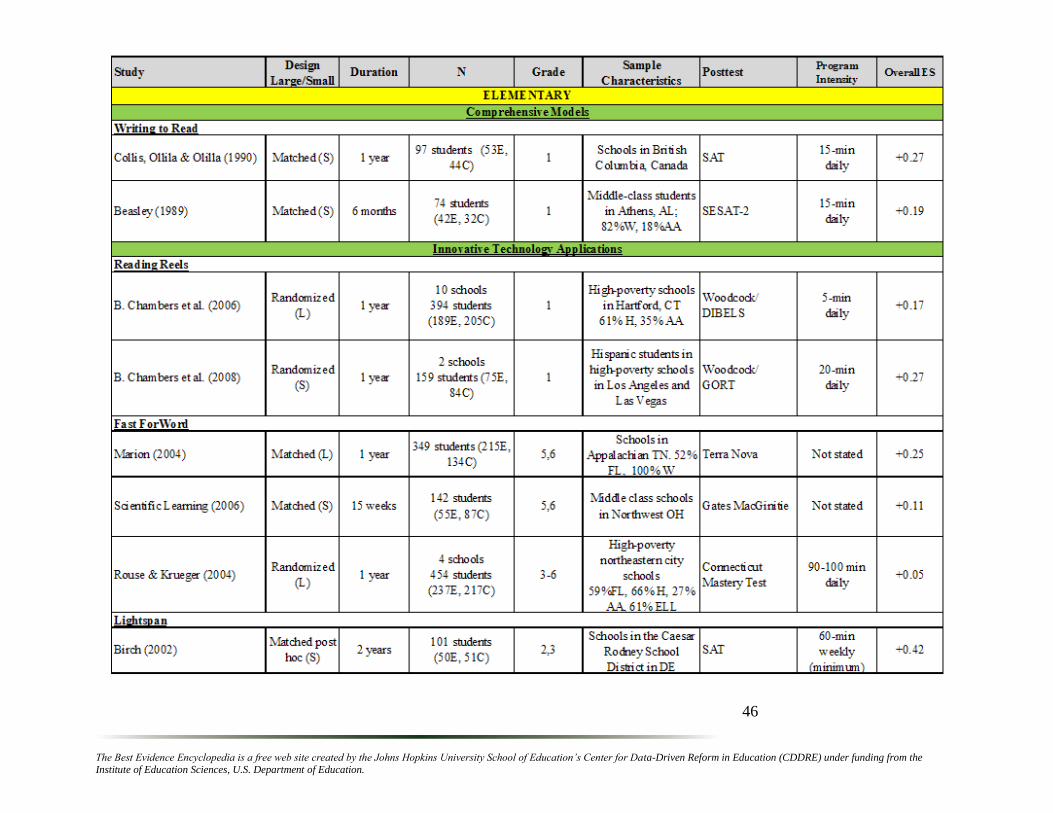
The Best Evidence Encyclopedia is a free web site created by the Johns Hopkins University School of Education’s Center for Data-Driven Reform in Education (CDDRE) under funding from the Institute of Education Sciences, U.S. Department of Education.
46
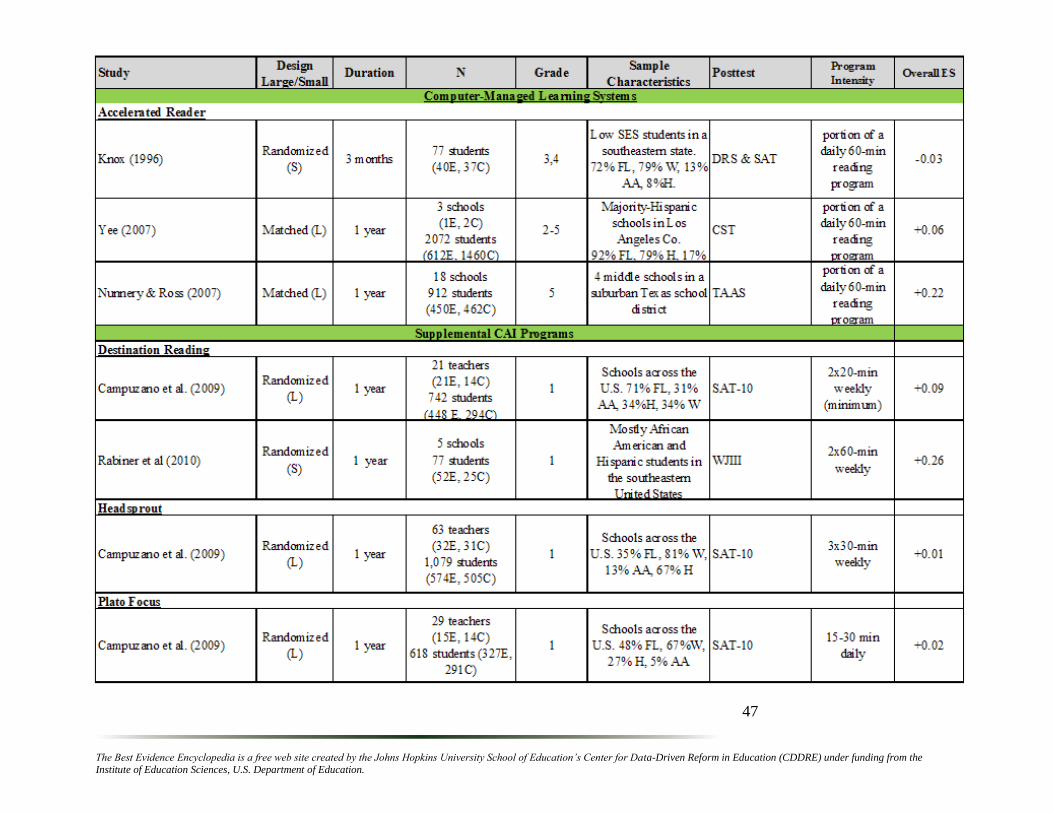
The Best Evidence Encyclopedia is a free web site created by the Johns Hopkins University School of Education’s Center for Data-Driven Reform in Education (CDDRE) under funding from the Institute of Education Sciences, U.S. Department of Education.
47
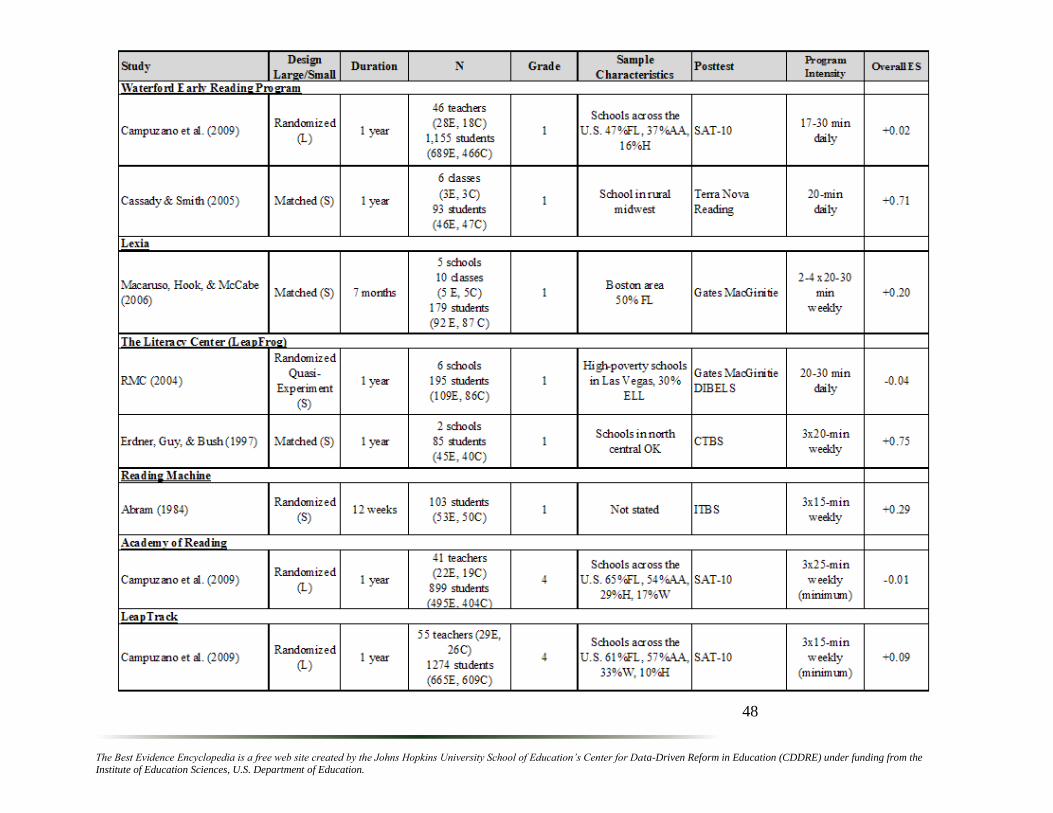
The Best Evidence Encyclopedia is a free web site created by the Johns Hopkins University School of Education’s Center for Data-Driven Reform in Education (CDDRE) under funding from the Institute of Education Sciences, U.S. Department of Education.
48
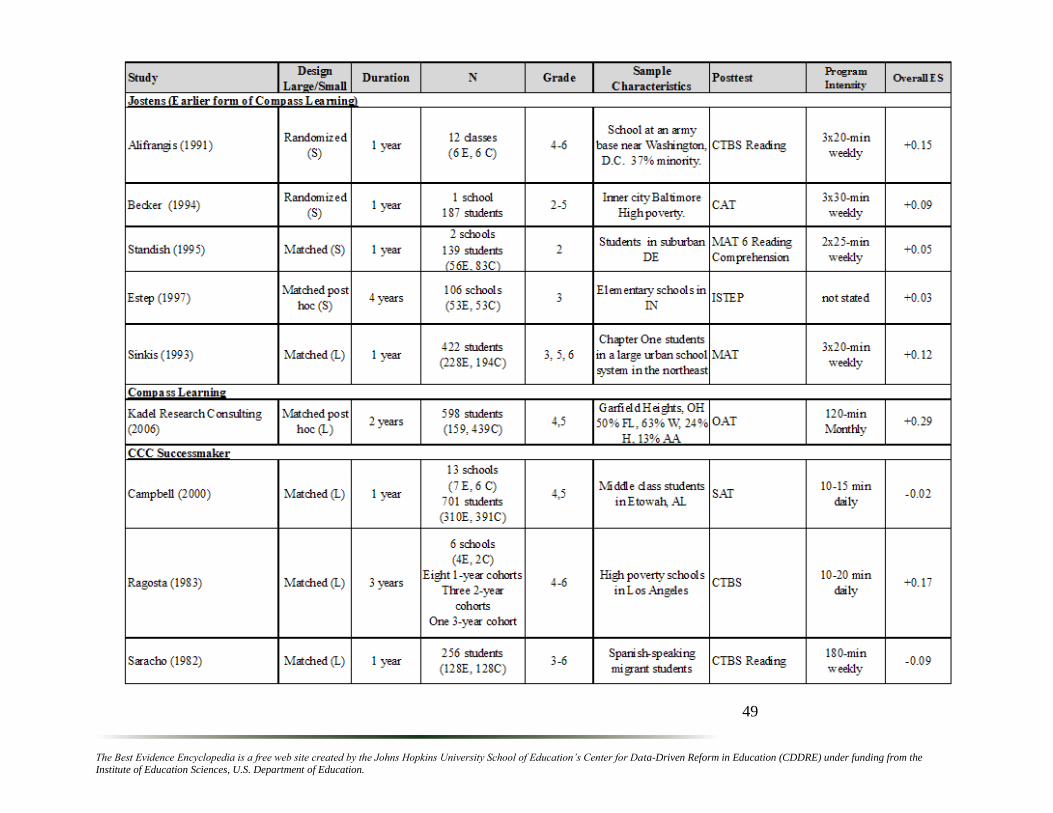
The Best Evidence Encyclopedia is a free web site created by the Johns Hopkins University School of Education’s Center for Data-Driven Reform in Education (CDDRE) under funding from the Institute of Education Sciences, U.S. Department of Education.
49
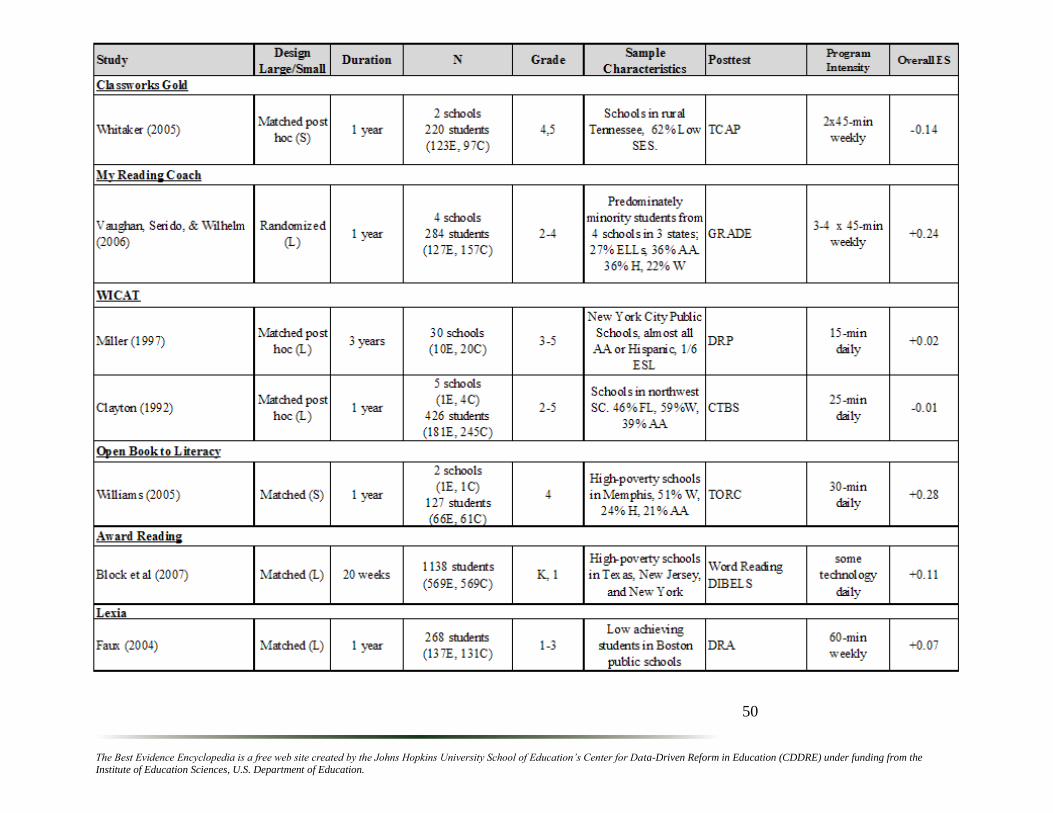
The Best Evidence Encyclopedia is a free web site created by the Johns Hopkins University School of Education’s Center for Data-Driven Reform in Education (CDDRE) under funding from the Institute of Education Sciences, U.S. Department of Education.
50
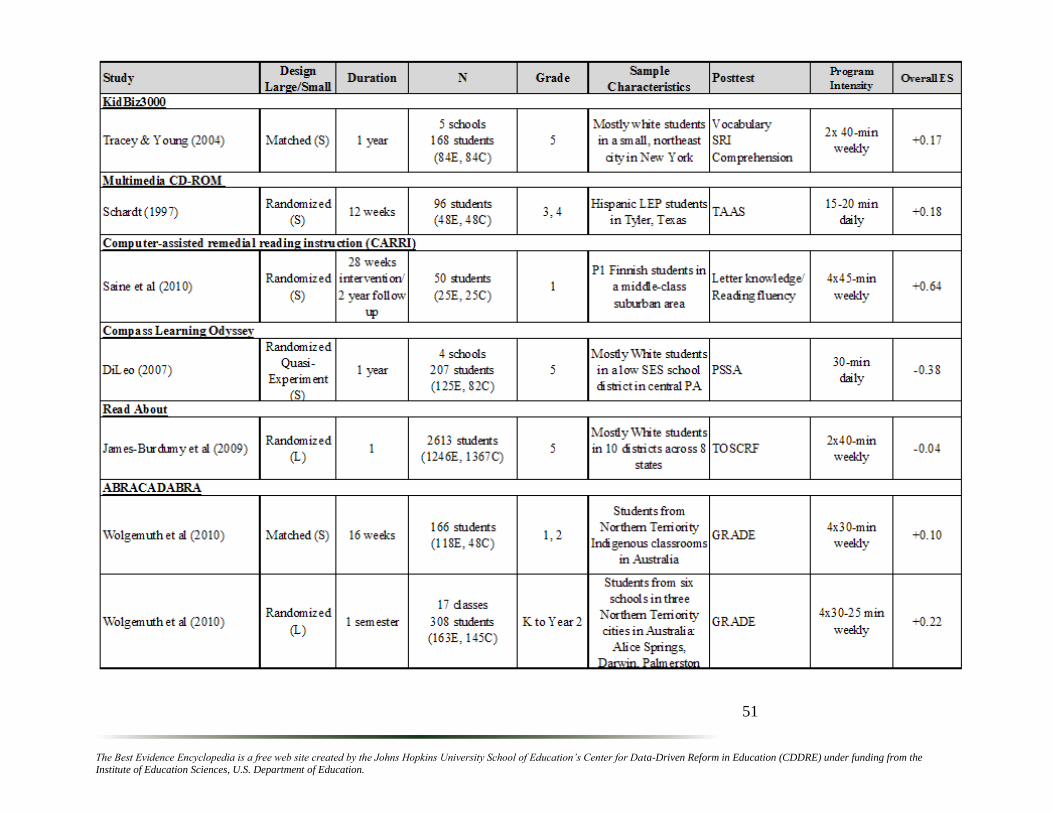
The Best Evidence Encyclopedia is a free web site created by the Johns Hopkins University School of Education’s Center for Data-Driven Reform in Education (CDDRE) under funding from the Institute of Education Sciences, U.S. Department of Education.
51
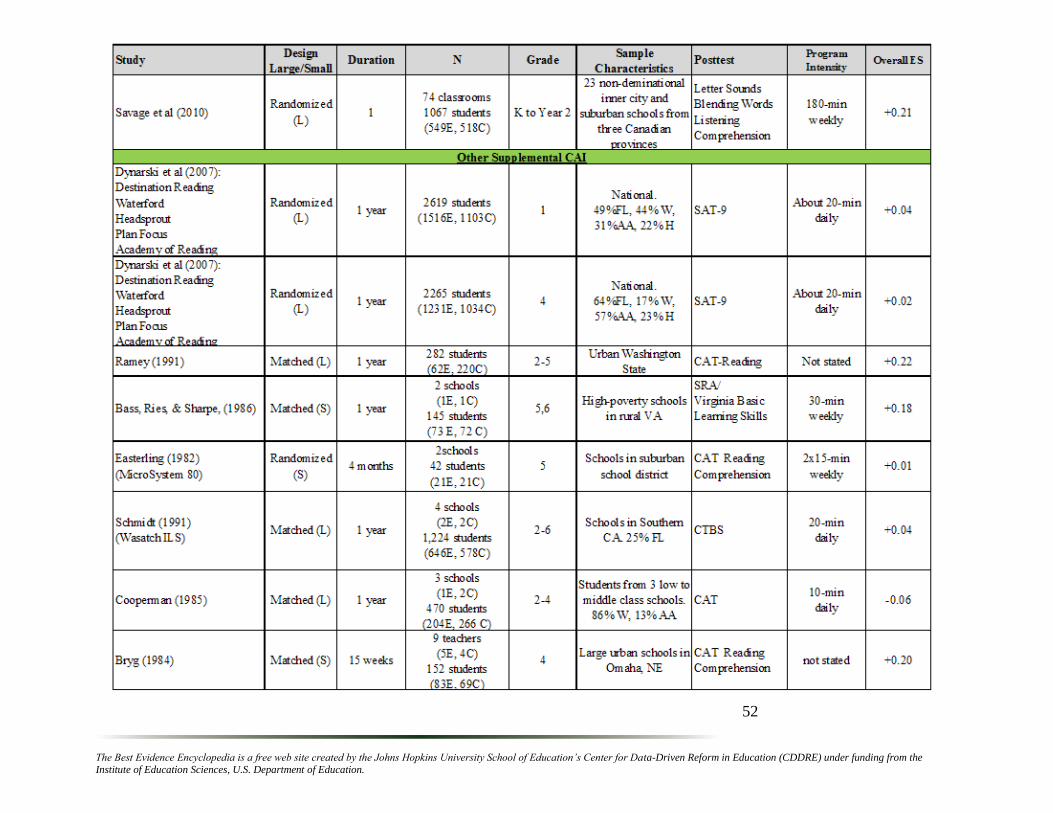
The Best Evidence Encyclopedia is a free web site created by the Johns Hopkins University School of Education’s Center for Data-Driven Reform in Education (CDDRE) under funding from the Institute of Education Sciences, U.S. Department of Education.
52

The Best Evidence Encyclopedia is a free web site created by the Johns Hopkins University School of Education’s Center for Data-Driven Reform in Education (CDDRE) under funding from the Institute of Education Sciences, U.S. Department of Education.
53
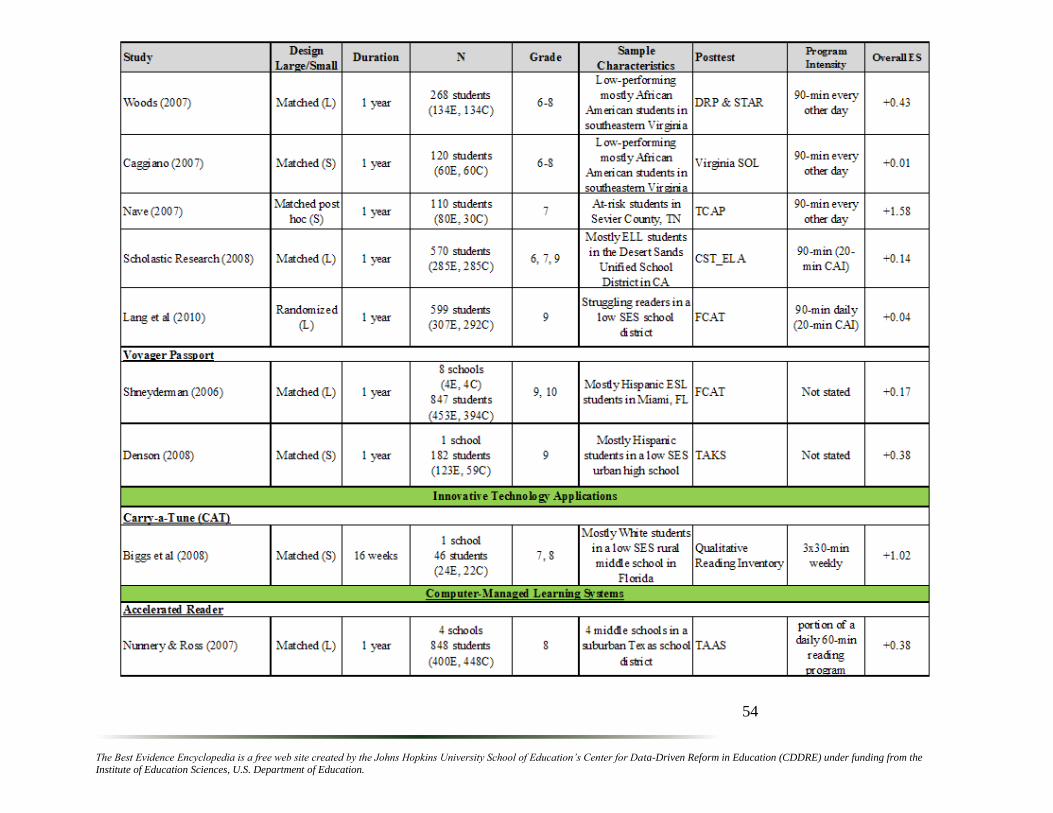
The Best Evidence Encyclopedia is a free web site created by the Johns Hopkins University School of Education’s Center for Data-Driven Reform in Education (CDDRE) under funding from the Institute of Education Sciences, U.S. Department of Education.
54
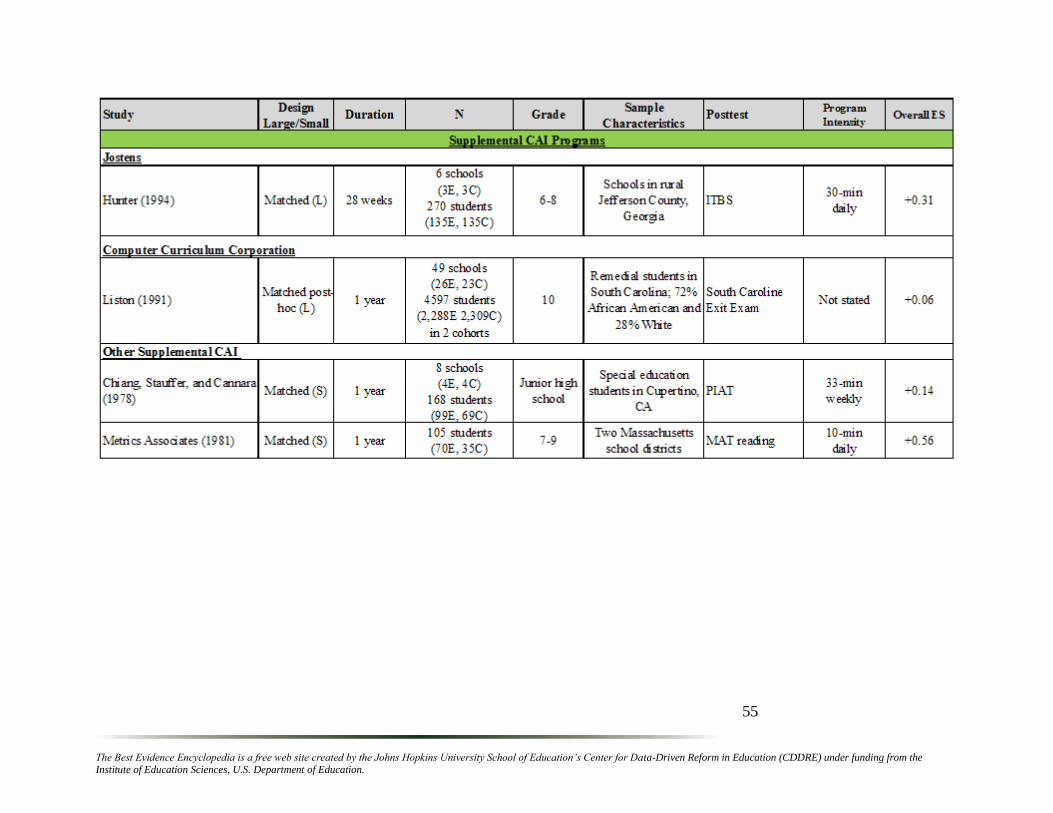
The Best Evidence Encyclopedia is a free web site created by the Johns Hopkins University School of Education’s Center for Data-Driven Reform in Education (CDDRE) under funding from the Institute of Education Sciences, U.S. Department of Education.
55