25TH ST
24TH ST
23RD ST
22ND ST
26TH ST
NO
E ST
21ST ST
CLIPPER ST
CA
STRO
ST
CH
UR
CH
ST
DIA
MO
ND
ST
SAN
CH
EZ ST
JERSEY ST
DO
UG
LASS ST
ELIZABETH ST
CESAR CHAVEZ ST
HILL ST
HO
FFMA
N A
VE
VIC
KSB
UR
G ST
CH
ATTAN
OO
GA
ST
DO
LOR
ES ST
ALVARADO ST
1/4 Mile
25TH ST
24TH ST
23RD ST
22ND ST
26TH ST
NO
E ST
21ST ST
CLIPPER ST
CA
STRO
ST
CH
UR
CH
ST
DIA
MO
ND
ST
SAN
CH
EZ ST
JERSEY ST
DO
UG
LASS ST
ELIZABETH ST
CESAR CHAVEZ ST
HILL ST
HO
FFMA
N A
VE
VIC
KSB
UR
G ST
CH
ATTAN
OO
GA
ST
DO
LOR
ES ST
ALVARADO ST
1/4 Mile
25TH ST
24TH ST
23RD ST
22ND ST
26TH ST
NO
E ST
21ST ST
CLIPPER ST
CA
STRO
ST
CH
UR
CH
ST
DIA
MO
ND
ST
SAN
CH
EZ ST
JERSEY ST
DO
UG
LASS ST
ELIZABETH ST
CESAR CHAVEZ ST
HILL ST
HO
FFMA
N A
VE
VIC
KSB
UR
G ST
CH
ATTAN
OO
GA
ST
DO
LOR
ES ST
ALVARADO ST
1/4 Mile
25TH ST
24TH ST
23RD ST
22ND ST
26TH ST
NO
E ST
21ST ST
CLIPPER ST
CA
STRO
ST
CH
UR
CH
ST
DIA
MO
ND
ST
SAN
CH
EZ ST
JERSEY ST
DO
UG
LASS ST
ELIZABETH ST
CESAR CHAVEZ ST
HILL ST
HO
FFMA
N A
VE
VIC
KSB
UR
G ST
CH
ATTAN
OO
GA
ST
DO
LOR
ES ST
ALVARADO ST
1/4 Mile
NOE VALLEY
24TH STREET FROM DOUGLASS STREET TO DOLORES STREET
NEIGHBORHOOD PROFILE
I N V E S T I N N E I G H B O R H O O D S2
Neighborhood Features
Noe Valley, located in central San Francisco, was historically a working-class neighborhood and has since undergone successive waves of demographic change. Today, the neighborhood is home to many urban professionals and young families. The area is primarily served by the 24th Street commercial corridor from Douglass to Dolores, and Castro Street from 24th to 25th. The district is a destination for shoppers and is served by public transportation lines including the J Church and the 24, 35, and 48 Muni buses.
Most of the commercial district lies within the boundaries of the Noe Valley Association (NVA). NVA was established in August 2005 as a community benefit district with an annual assessment from 208 properties within the district. The Noe Valley Merchants Association is also active; the two entities work together to sponsor events—such as the ever growing, annual Harvest Festival—and implement neighborhood improvements and beautification activities.
Commercial District Health
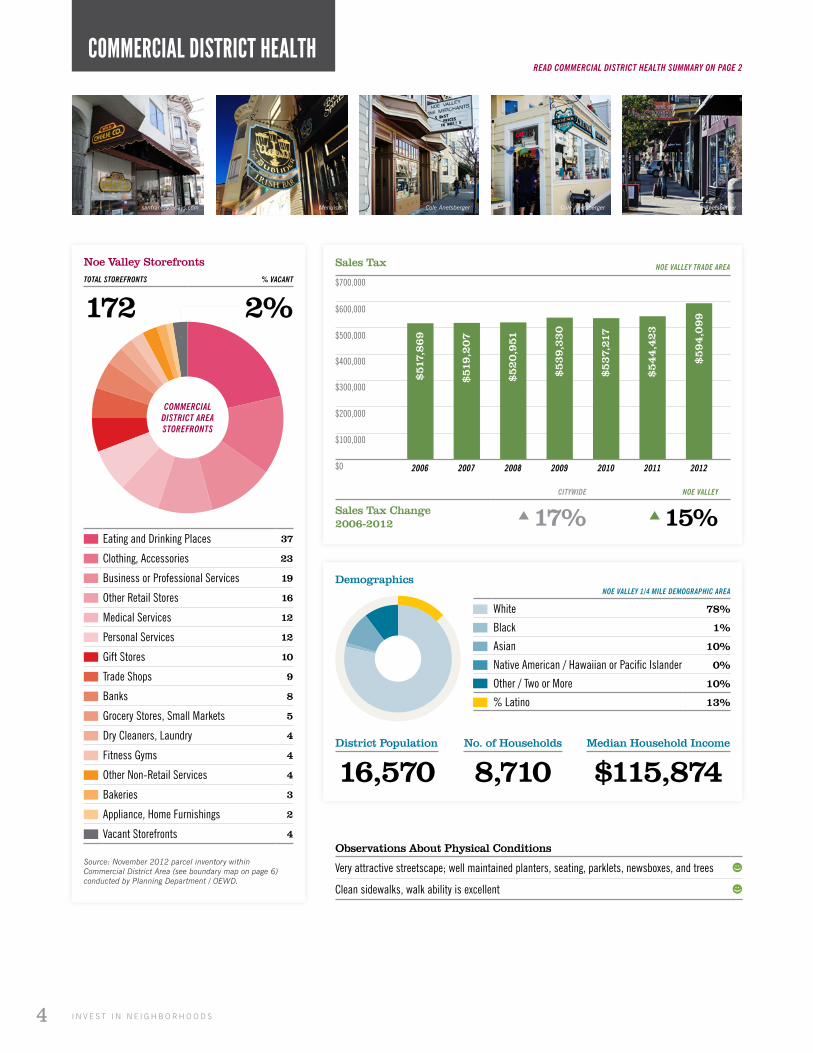
Noe Valley is a destination for shoppers, well known for its restaurants, boutiques, home goods retailers, pet supply stores, fitness studios, cafes, and Whole Foods. Sales tax captured in the district has grown 15% since 2006, compared with 17% growth Citywide. The corridor’s growth opportunities include home furnishings and general merchandise.
Stakeholders in Noe Valley reported that the neighborhood feels very safe. From 2010 to 2012, one rape was reported and no homicides occurred. The neighborhood experienced steady decrease in assault and robbery over the three-year period, while vehicle theft/theft from vehicles increased by 33%.
Demographics
Over 16,570 people live within a one-quarter mile radius of the Noe Valley commercial corridor. Its population is slightly younger than San Francisco’s overall, with a smaller proportion of residents over 60 years old. The 24th/Noe corridor is predominantly white, with few black residents and a smaller proportion of Asian residents. Its Latino population is also smaller than the City overall. There are about 9,370 housing units in the area, mostly single family or small two to four unit multi-family structures. About half the households are renters. The proportions of household types (family, single-person, and non-family households) are roughly equal and similar to the distribution found in San Francisco. Noe Valley households incomes are higher than Citywide averages.
SEE MORE ON PAGE 3
SEE MORE ON PAGE 4
SEE MORE ON PAGE 7
NOE VALLEY SUMMARY
Invest in Neighborhoods is a City initiative to provide focused, customized assistance to meet the specific needs of San Francisco’s neighborhood commercial corridors.
This assessment is a snapshot of existing conditions in Noe Valley as of February 2013. It will help to inform the City’s investments in the neighborhood, and provide a resource for neighborhood stakeholders.
Contents include:
- Neighborhood Features
- Commercial District Health
- Key Takeaways
- Demographics
- Land Use
- Business Mix
- Transportation
- Existing Plans & Interventions
Note: This document includes some subjective descriptions of the neighborhood based on findings gathered through direct observation and interviews with key neighborhood stakeholders.
3N E I G H B O R H O O D P R O F I L E : N O E V A L L E Y / 2 4 T H S T R E E T
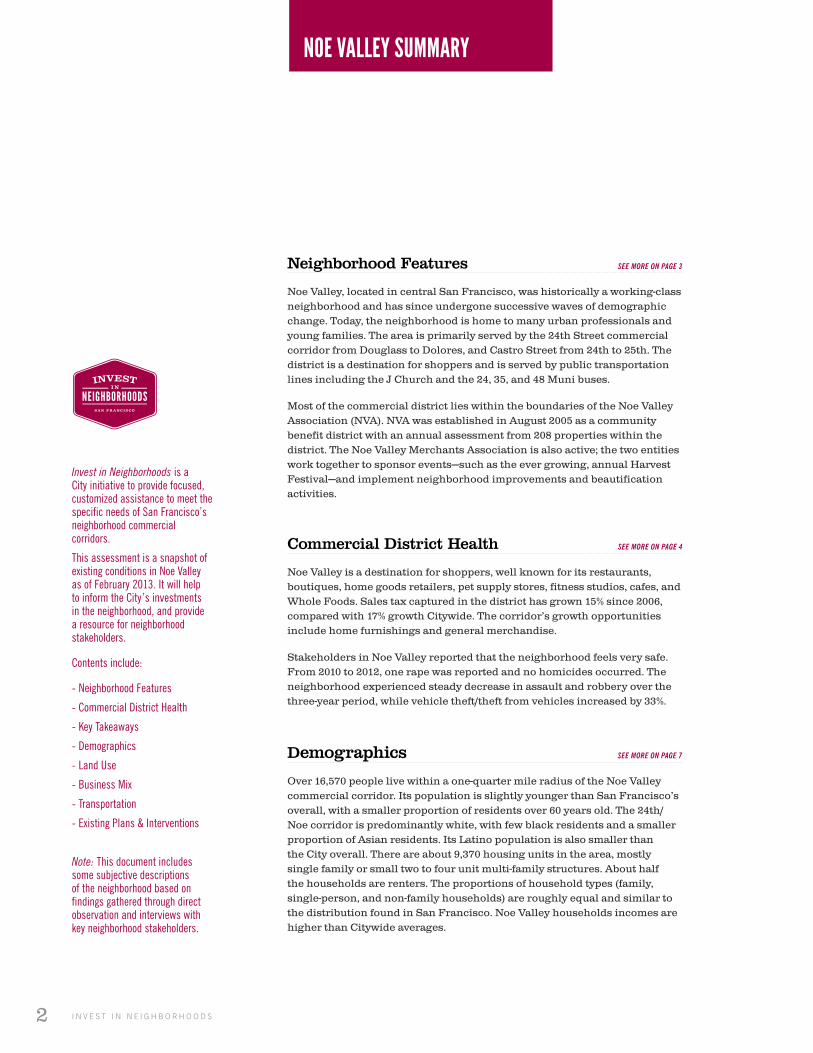
Notable Places in Noe Valley
1 Noe Valley Farmers’ Market
2 Post Office
3 St. Phillip’s Church
4 St. Phillip’s School
Merchant & Resident Groups
Friends of Noe Valley
Noe Valley Association CBD
Noe Valley Merchants Association
Cultural Festivals
5 Noe Valley Harvest Festival
Pipeline Projects
A 3820 24th Street 4 units
B 4159 24th Street 1 unit + commercial
C 4205 24th Street convert 1 unit to commercial
Kite Hill
DouglassPlayground
MISSION BRANCHLIBRARY
NOE VALLEYBRANCH LIBRARY
CCSF MISSION CAMPUS
JAMES LICKMIDDLE SCHOOL
HORACE MANNMIDDLE SCHOOL
ROOFTOPALTERNATIVEK-4 SCHOOL
ALVARADOSCHOOL
THERESA S MAHLERCDC
JURICOMMONS
CLIPPER TERRACECOMMUNITY
GARDEN
CORWINCOMMUNITY
GARDEN
DOWNTOWNHIGH SCHOOL
CPMC - ST. LUKE’S CAMPUS& HEALTH CARE CENTER
Kite Hill
DouglassPlayground
25TH ST
24TH ST
24TH ST
23RD ST
22ND ST
26TH ST
NO
E ST
21ST ST
CLIPPER ST
CA
STRO
ST
DUNCAN ST
CH
UR
CH
ST
27TH ST
28TH ST
DIA
MO
ND
ST
SAN
CH
EZ ST
JERSEY ST
DO
UG
LASS ST
ELIZABETH ST
CESAR CHAVEZ ST
HILL ST
VALEN
CIA
ST
20TH ST
MA
RK
ET
ST
FAIR
OA
KS ST
EUR
EKA
ST
GR
AND
VIE
W A
VE
QU
AN
E ST
LIBERTY ST
VALLEY ST
CO
RB
ETT
AVE
HO
FFMA
N AV
E
AM
ES ST
BA
RTLETT ST
VIC
KSB
UR
G ST
PO
PLA
R ST
CH
ATTAN
OO
GA
ST
PO
RTO
LA D
R
NELLIE ST
CO
LLING
WO
OD
ST
OR
AN
GE A
LY
HIG
H ST SA
N J
OSE
AV
E
CORWIN ST
FOU
NTA
IN ST
CARNELIA
N WAY
ROMAIN ST
BLA
NC
HE ST
DIAMOND HEIGHTS BLVD
GU
ERR
ERO
ST
WO
RTH
ST
HO
MESTEA
D ST
NEW
BURG
ST
SEVER
N ST
MER
SEY ST
GLENDAL
E ST
DO
LOR
ES ST
HILL ST
SAN
JOSE AV
E
ALVARADO ST
21ST ST
Noe Valley (24th Street)1/4 Mile
Kite Hill
DouglassPlayground
MISSION BRANCHLIBRARY
NOE VALLEYBRANCH LIBRARY
CCSF MISSION CAMPUS
JAMES LICKMIDDLE SCHOOL
HORACE MANNMIDDLE SCHOOL
ROOFTOPALTERNATIVEK-4 SCHOOL
ALVARADOSCHOOL
THERESA S MAHLERCDC
JURICOMMONS
CLIPPER TERRACECOMMUNITY
GARDEN
CORWINCOMMUNITY
GARDEN
DOWNTOWNHIGH SCHOOL
CPMC - ST. LUKE’S CAMPUS& HEALTH CARE CENTER
Kite Hill
DouglassPlayground
25TH ST
24TH ST
24TH ST
23RD ST
22ND ST
26TH ST
NO
E ST
21ST ST
CLIPPER ST
CA
STRO
ST
DUNCAN ST
CH
UR
CH
ST
27TH ST
28TH ST
DIA
MO
ND
ST
SAN
CH
EZ ST
JERSEY ST
DO
UG
LASS ST
ELIZABETH ST
CESAR CHAVEZ ST
HILL ST
VALEN
CIA
ST
20TH ST
MA
RK
ET
ST
FAIR
OA
KS ST
EUR
EKA
ST
GR
AND
VIE
W A
VE
QU
AN
E ST
LIBERTY ST
VALLEY ST
CO
RB
ETT
AVE
HO
FFMA
N AV
E
AM
ES ST
BA
RTLETT ST
VIC
KSB
UR
G ST
PO
PLA
R ST
CH
ATTAN
OO
GA
ST
PO
RTO
LA D
R
NELLIE ST
CO
LLING
WO
OD
ST
OR
AN
GE A
LY
HIG
H ST SA
N J
OSE
AV
E
CORWIN ST
FOU
NTA
IN ST
CARNELIA
N WAY
ROMAIN ST
BLA
NC
HE ST
DIAMOND HEIGHTS BLVD
GU
ERR
ERO
ST
WO
RTH
ST
HO
MESTEA
D ST
NEW
BURG
ST
SEVER
N ST
MER
SEY ST
GLENDAL
E ST
DO
LOR
ES ST
HILL ST
SAN
JOSE AV
E
ALVARADO ST
21ST ST
Noe Valley (24th Street)1/4 Mile
1
34 2
CB
A
4
5
11 2
5
Brian McConnellyodelodelay L
Cole Anetsberger
NEIGHBORHOOD FEATURES
www.noevalleyharvestfestival.com www.noevalleyharvestfestival.com
READ NEIGHBORHOOD FEATURES SUMMARY ON PAGE 2
Linda Yung
I N V E S T I N N E I G H B O R H O O D S4
Noe Valley StorefrontsTOTAL STOREFRONTS % VACANT
172 2%
Sales Tax
Demographics
NOE VALLEY TRADE AREA
Observations About Physical Conditions
Very attractive streetscape; well maintained planters, seating, parklets, newsboxes, and trees
:)
Clean sidewalks, walk ability is excellent
:)
CITYWIDE NOE VALLEY
Sales Tax Change 2006-2012
17% 15%
No. of Households
8,710Median Household Income
$115,874District Population
16,570
Eating and Drinking Places 37
Clothing, Accessories 23
Business or Professional Services 19
Other Retail Stores 16
Medical Services 12
Personal Services 12
Gift Stores 10
Trade Shops 9
Banks 8
Grocery Stores, Small Markets 5
Dry Cleaners, Laundry 4
Fitness Gyms 4
Other Non-Retail Services 4
Bakeries 3
Appliance, Home Furnishings 2
Vacant Storefronts 4
Source: November 2012 parcel inventory within Commercial District Area (see boundary map on page 6) conducted by Planning Department / OEWD.
$100,000
$200,000
$300,000
$400,000
$500,000
$600,000
$700,000
$0 20072006 2008 2009 2010 2011 2012
$51
7,869
$51
9,207
$52
0,951
$53
9,330
$53
7,21
7
$544,4
23
$59
4,0
99
COMMERCIAL DISTRICT HEALTH
Menuism Cole Anetsberger Cole Anetsberger Cole Anetsbergersanfranciscodays.com
READ COMMERCIAL DISTRICT HEALTH SUMMARY ON PAGE 2
NOE VALLEY 1/4 MILE DEMOGRAPHIC AREA
White 78%
Black 1%
Asian 10%
Native American / Hawaiian or Pacific Islander 0%
Other / Two or More 10%
% Latino 13%
COMMERCIAL DISTRICT AREA STOREFRONTS
5N E I G H B O R H O O D P R O F I L E : N O E V A L L E Y / 2 4 T H S T R E E T
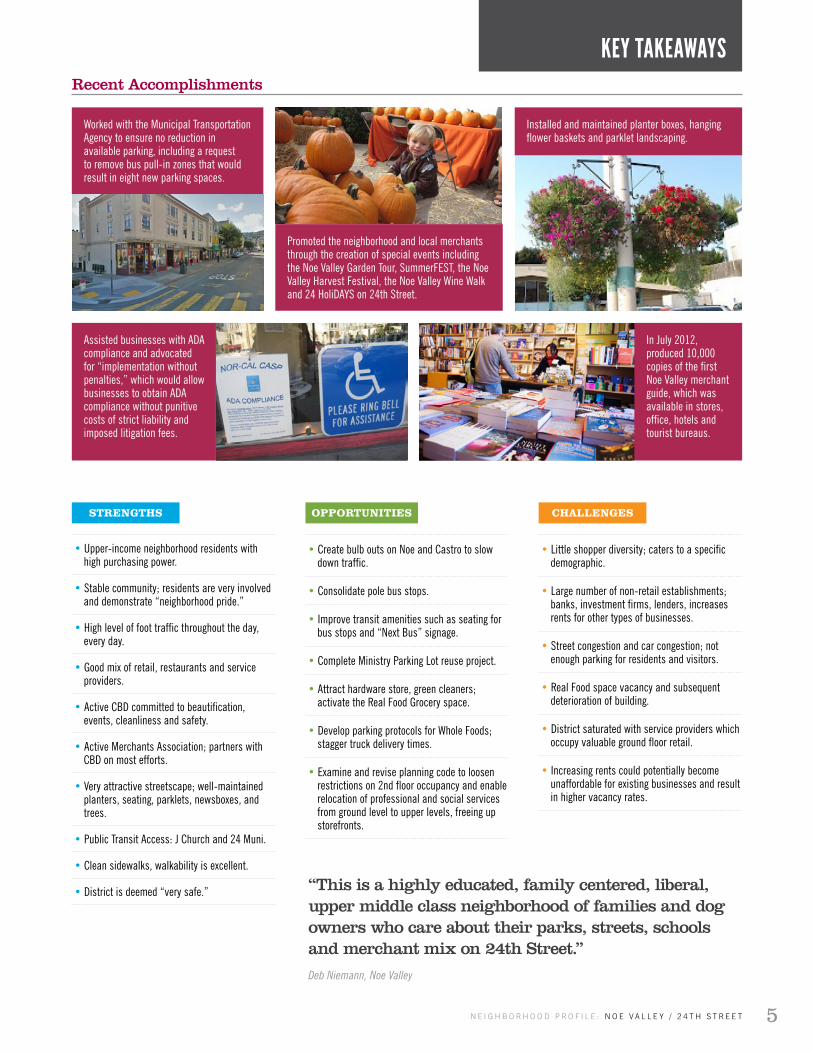
“This is a highly educated, family centered, liberal, upper middle class neighborhood of families and dog owners who care about their parks, streets, schools and merchant mix on 24th Street.”Deb Niemann, Noe Valley
Recent Accomplishments
Assisted businesses with ADA compliance and advocated for “implementation without penalties,” which would allow businesses to obtain ADA compliance without punitive costs of strict liability and imposed litigation fees.
STRENGTHS
• Upper-income neighborhood residents with high purchasing power.
• Stable community; residents are very involved and demonstrate “neighborhood pride.”
• High level of foot traffic throughout the day, every day.
• Good mix of retail, restaurants and service providers.
• Active CBD committed to beautification, events, cleanliness and safety.
• Active Merchants Association; partners with CBD on most efforts.
• Very attractive streetscape; well-maintained planters, seating, parklets, newsboxes, and trees.
• Public Transit Access: J Church and 24 Muni.
• Clean sidewalks, walkability is excellent.
• District is deemed “very safe.”
CHALLENGES
• Little shopper diversity; caters to a specific demographic.
• Large number of non-retail establishments; banks, investment firms, lenders, increases rents for other types of businesses.
• Street congestion and car congestion; not enough parking for residents and visitors.
• Real Food space vacancy and subsequent deterioration of building.
• District saturated with service providers which occupy valuable ground floor retail.
• Increasing rents could potentially become unaffordable for existing businesses and result in higher vacancy rates.
OPPORTUNITIES
• Create bulb outs on Noe and Castro to slow down traffic.
• Consolidate pole bus stops.
• Improve transit amenities such as seating for bus stops and “Next Bus” signage.
• Complete Ministry Parking Lot reuse project.
• Attract hardware store, green cleaners; activate the Real Food Grocery space.
• Develop parking protocols for Whole Foods; stagger truck delivery times.
• Examine and revise planning code to loosen restrictions on 2nd floor occupancy and enable relocation of professional and social services from ground level to upper levels, freeing up storefronts.
Promoted the neighborhood and local merchants through the creation of special events including the Noe Valley Garden Tour, SummerFEST, the Noe Valley Harvest Festival, the Noe Valley Wine Walk and 24 HoliDAYS on 24th Street.
Installed and maintained planter boxes, hanging flower baskets and parklet landscaping.
In July 2012, produced 10,000 copies of the first Noe Valley merchant guide, which was available in stores, office, hotels and tourist bureaus.
KEY TAKEAWAYS
Worked with the Municipal Transportation Agency to ensure no reduction in available parking, including a request to remove bus pull-in zones that would result in eight new parking spaces.
I N V E S T I N N E I G H B O R H O O D S6
NOE VALLEYDATA
APPENDIX
Kite Hill
DouglassPlayground
Noe Valley (24th Street)1/4 Mile
25TH ST
24TH ST
24TH ST
23RD ST
22ND ST
26TH ST
NO
E ST
21ST ST
CLIPPER ST
CA
STRO
ST
DUNCAN ST
CH
UR
CH
ST
27TH ST
28TH ST
DIA
MO
ND
ST
SAN
CH
EZ ST
JERSEY ST
DO
UG
LASS ST
ELIZABETH ST
CESAR CHAVEZ ST
HILL ST
VALEN
CIA
ST
20TH ST
MA
RK
ET
ST
FAIR
OA
KS ST
EUR
EKA
ST
GR
AND
VIE
W A
VE
QU
AN
E ST
LIBERTY ST
VALLEY ST
CO
RB
ETT
AVE
HO
FFMA
N AV
E
AM
ES ST
BA
RTLETT ST
VIC
KSB
UR
G ST
PO
PLA
R ST
CH
ATTAN
OO
GA
ST
PO
RTO
LA D
R
NELLIE ST
CO
LLING
WO
OD
ST
OR
AN
GE A
LY
HIG
H ST SA
N J
OSE
AV
E
CORWIN ST
FOU
NTA
IN ST
CARNELIA
N WAY
ROMAIN ST
BLA
NC
HE ST
DIAMOND HEIGHTS BLVD
GU
ERR
ERO
ST
WO
RTH
ST
HO
MESTEA
D ST
NEW
BURG
ST
SEVER
N ST
MER
SEY ST
GLENDAL
E ST
DO
LOR
ES ST
HILL ST
SAN
JOSE AV
E
ALVARADO ST
21ST ST
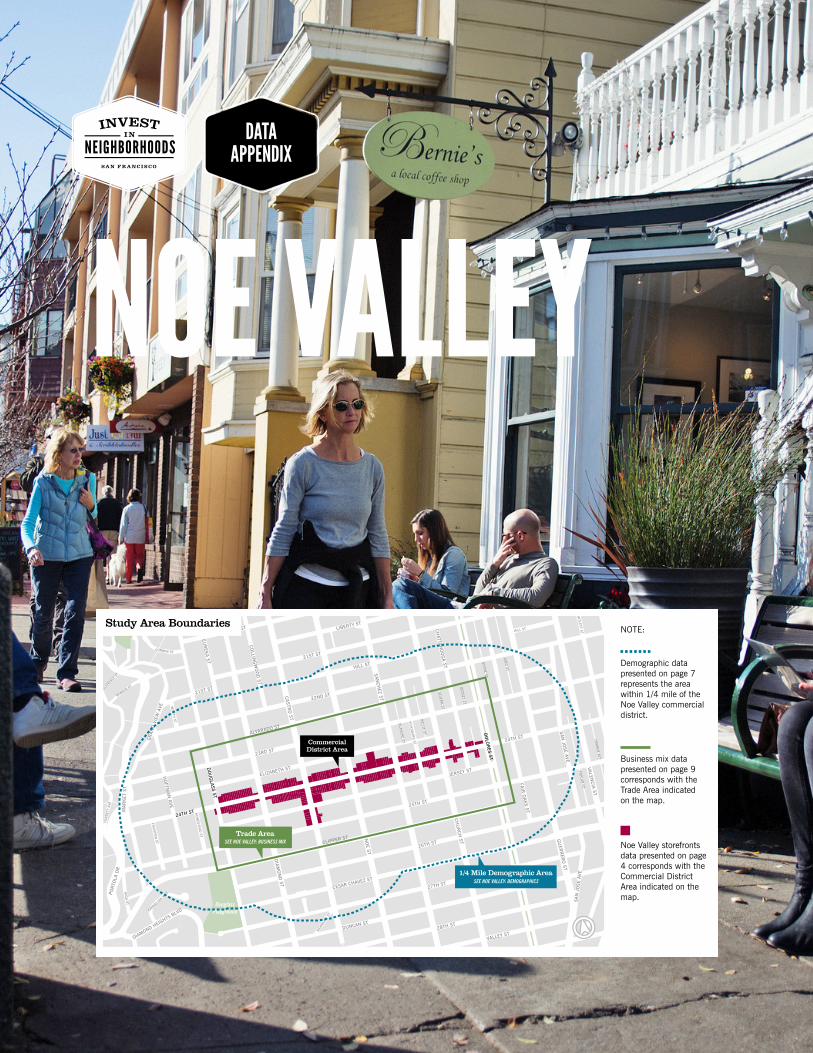
Trade AreaSEE NOE VALLEY: BUSINESS MIX
CommercialDistrict Area
1/4 Mile Demographic AreaSEE NOE VALLEY: DEMOGRAPHICS
NOTE:
Demographic data presented on page 7 represents the area within 1/4 mile of the Noe Valley commercial district.
Business mix data presented on page 9 corresponds with the Trade Area indicated on the map.
Noe Valley storefronts data presented on page 4 corresponds with the Commercial District Area indicated on the map.
Study Area Boundaries
7D A T A A P P E N D I X : N O E V A L L E Y / 2 4 T H S T R E E T
AP
PE
ND
IX
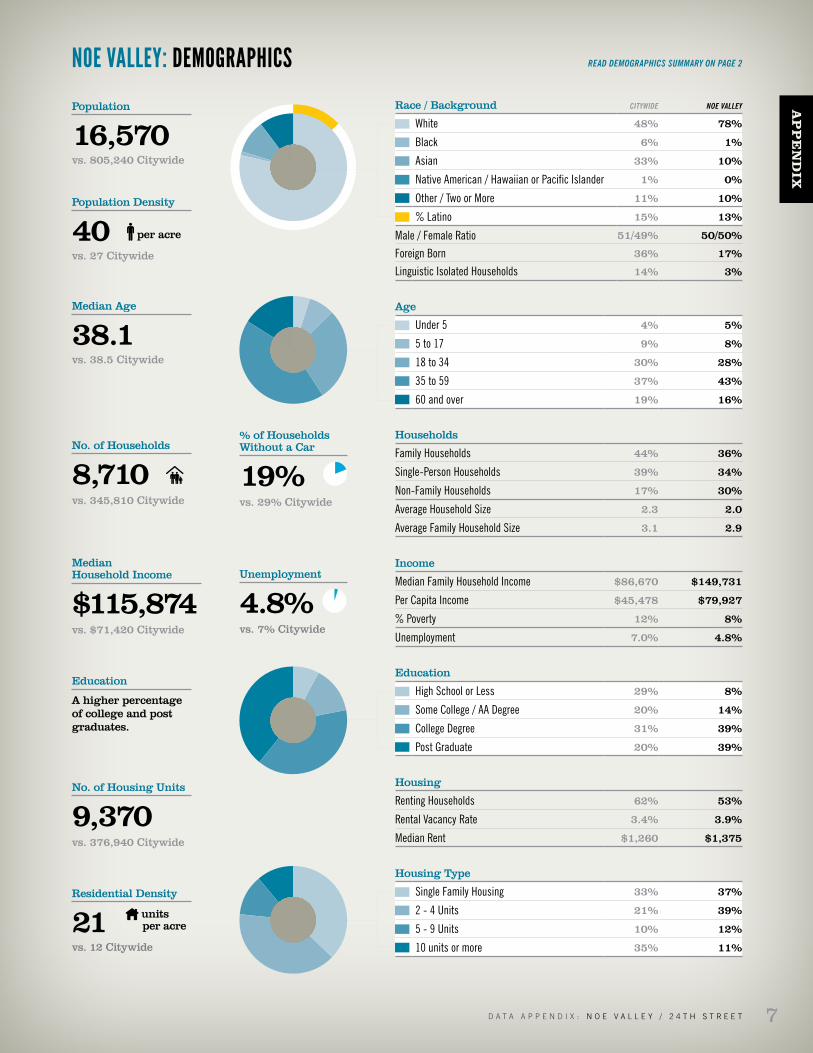
NOE VALLEY: DEMOGRAPHICS
Race / Background CITYWIDE NOE VALLEY
White 48% 78%
Black 6% 1%
Asian 33% 10%
Native American / Hawaiian or Pacific Islander 1% 0%
Other / Two or More 11% 10%
% Latino 15% 13%
Male / Female Ratio 51/49% 50/50%
Foreign Born 36% 17%
Linguistic Isolated Households 14% 3%
Age
Under 5 4% 5%
5 to 17 9% 8%
18 to 34 30% 28%
35 to 59 37% 43%
60 and over 19% 16%
Households
Family Households 44% 36%
Single-Person Households 39% 34%
Non-Family Households 17% 30%
Average Household Size 2.3 2.0
Average Family Household Size 3.1 2.9
Income
Median Family Household Income $86,670 $149,731
Per Capita Income $45,478 $79,927
% Poverty 12% 8%
Unemployment 7.0% 4.8%
Education
High School or Less 29% 8%
Some College / AA Degree 20% 14%
College Degree 31% 39%
Post Graduate 20% 39%
Housing
Renting Households 62% 53%
Rental Vacancy Rate 3.4% 3.9%
Median Rent $1,260 $1,375
Housing Type
Single Family Housing 33% 37%
2 - 4 Units 21% 39%
5 - 9 Units 10% 12%
10 units or more 35% 11%
No. of Households
8,710 vs. 345,810 Citywide
No. of Housing Units
9,370vs. 376,940 Citywide
% of Households Without a Car
19% vs. 29% Citywide
Median Household Income
$115,874vs. $71,420 Citywide
Population
16,570vs. 805,240 Citywide
Population Density
40 per acre
vs. 27 Citywide
Median Age
38.1vs. 38.5 Citywide
Education
A higher percentage of college and post graduates.
READ DEMOGRAPHICS SUMMARY ON PAGE 2
Residential Density
21 units per acre
vs. 12 Citywide
Unemployment
4.8% vs. 7% Citywide
I N V E S T I N N E I G H B O R H O O D S8
AP
PE
ND
IX
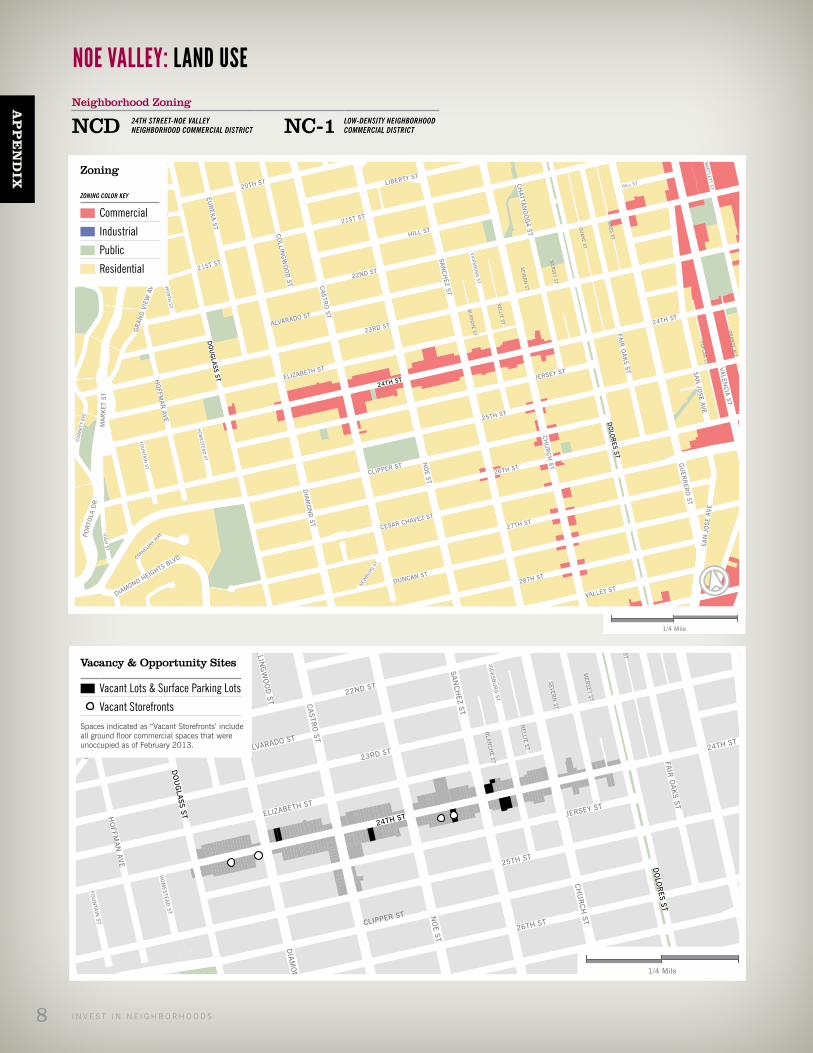
NOE VALLEY: LAND USE
Kite Hill
DouglassPlayground
25TH ST
24TH ST
24TH ST
23RD ST
22ND ST
26TH ST
NO
E ST
21ST ST
CLIPPER ST
CA
STRO
ST
DUNCAN ST
CH
UR
CH
ST
27TH ST
28TH ST
DIA
MO
ND
ST
SAN
CH
EZ ST
JERSEY ST
DO
UG
LASS ST ELIZABETH ST
CESAR CHAVEZ ST
HILL ST
VALEN
CIA
ST
20TH ST
MA
RK
ET
ST
FAIR
OA
KS ST
EUR
EKA
ST
GR
AND
VIE
W A
VE
QU
AN
E ST
LIBERTY ST
VALLEY ST
CO
RB
ETT
AVE
HO
FFMA
N AV
E
AM
ES ST
BA
RTLETT ST
VIC
KSB
UR
G ST
PO
PLA
R ST
CH
ATTAN
OO
GA
ST
PO
RTO
LA D
R
NELLIE ST
CO
LLING
WO
OD
ST
OR
AN
GE A
LY
HIG
H ST SA
N J
OSE
AV
E
CORWIN ST
FOU
NTA
IN ST
CARNELIA
N WAY
ROMAIN ST
BLA
NC
HE ST
DIAMOND HEIGHTS BLVD
GU
ERR
ERO
ST
WO
RTH
ST
HO
MESTEA
D ST
NEW
BURG
ST
SEVER
N ST
MER
SEY ST
GLENDAL
E ST
DO
LOR
ES ST
HILL ST
SAN
JOSE AV
E
ALVARADO ST
21ST ST
Noe Valley (24th Street)1/4 Mile
Kite Hill
DouglassPlayground
25TH ST
24TH ST
24TH ST
23RD ST
22ND ST
26TH ST
NO
E ST
21ST ST
CLIPPER ST
CA
STRO
ST
DUNCAN ST
CH
UR
CH
ST
27TH ST
28TH ST
DIA
MO
ND
ST
SAN
CH
EZ STJERSEY ST
DO
UG
LASS ST ELIZABETH ST
CESAR CHAVEZ ST
HILL ST
VALEN
CIA
ST
20TH ST
MA
RK
ET
ST
FAIR
OA
KS ST
EUR
EKA
ST
GR
AND
VIE
W A
VE
QU
AN
E ST
LIBERTY ST
VALLEY ST
CO
RB
ETT
AVE
HO
FFMA
N AV
E
AM
ES ST
BA
RTLETT ST
VIC
KSB
UR
G ST
PO
PLA
R ST
CH
ATTAN
OO
GA
ST
PO
RTO
LA D
R
NELLIE ST
CO
LLING
WO
OD
ST
OR
AN
GE A
LY
HIG
H ST SA
N J
OSE
AV
E
CORWIN ST
FOU
NTA
IN ST
CARNELIA
N WAY
ROMAIN ST
BLA
NC
HE ST
DIAMOND HEIGHTS BLVD
GU
ERR
ERO
ST
WO
RTH
ST
HO
MESTEA
D ST
NEW
BURG
ST
SEVER
N ST
MER
SEY ST
GLENDAL
E ST
DO
LOR
ES ST
HILL ST
SAN
JOSE AV
E
ALVARADO ST
21ST ST
Noe Valley (24th Street)1/4 Mile
Zoning
ZONING COLOR KEY
Commercial
Industrial
Public
Residential
Kite Hill
DouglassPlayground
25TH ST
24TH ST
24TH ST
23RD ST
22ND ST
26TH ST
NO
E ST
21ST ST
CLIPPER ST
CA
STRO
ST
DUNCAN ST
CH
UR
CH
ST
27TH ST
28TH ST
DIA
MO
ND
ST
SAN
CH
EZ ST
JERSEY ST
DO
UG
LASS ST ELIZABETH ST
CESAR CHAVEZ ST
HILL ST
VALEN
CIA
ST
20TH ST
MA
RK
ET
ST
FAIR
OA
KS ST
EUR
EKA
ST
GR
AND
VIE
W A
VE
QU
AN
E ST
LIBERTY ST
VALLEY ST
CO
RB
ETT
AVE
HO
FFMA
N AV
E
AM
ES ST
BA
RTLETT ST
VIC
KSB
UR
G ST
PO
PLA
R ST
CH
ATTAN
OO
GA
ST
PO
RTO
LA D
R
NELLIE ST
CO
LLING
WO
OD
ST
OR
AN
GE A
LY
HIG
H ST SA
N J
OSE
AV
E
CORWIN ST
FOU
NTA
IN ST
CARNELIA
N WAY
ROMAIN ST
BLA
NC
HE ST
DIAMOND HEIGHTS BLVD
GU
ERR
ERO
ST
WO
RTH
ST
HO
MESTEA
D ST
NEW
BURG
ST
SEVER
N ST
MER
SEY ST
GLENDAL
E ST
DO
LOR
ES ST
HILL ST
SAN
JOSE AV
E
ALVARADO ST
21ST ST
Noe Valley (24th Street)1/4 Mile
Kite Hill
DouglassPlayground
25TH ST
24TH ST
24TH ST
23RD ST
22ND ST
26TH ST
NO
E ST
21ST ST
CLIPPER ST
CA
STRO
ST
DUNCAN ST
CH
UR
CH
ST
27TH ST
28TH ST
DIA
MO
ND
ST
SAN
CH
EZ ST
JERSEY ST
DO
UG
LASS ST ELIZABETH ST
CESAR CHAVEZ ST
HILL ST
VALEN
CIA
ST
20TH ST
MA
RK
ET
ST
FAIR
OA
KS ST
EUR
EKA
ST
GR
AND
VIE
W A
VE
QU
AN
E ST
LIBERTY ST
VALLEY ST
CO
RB
ETT
AVE
HO
FFMA
N AV
E
AM
ES ST
BA
RTLETT ST
VIC
KSB
UR
G ST
PO
PLA
R ST
CH
ATTAN
OO
GA
ST
PO
RTO
LA D
R
NELLIE ST
CO
LLING
WO
OD
ST
OR
AN
GE A
LY
HIG
H ST SA
N J
OSE
AV
E
CORWIN ST
FOU
NTA
IN ST
CARNELIA
N WAY
ROMAIN ST
BLA
NC
HE ST
DIAMOND HEIGHTS BLVD
GU
ERR
ERO
ST
WO
RTH
ST
HO
MESTEA
D ST
NEW
BURG
ST
SEVER
N ST
MER
SEY ST
GLENDAL
E ST
DO
LOR
ES ST
HILL ST
SAN
JOSE AV
E
ALVARADO ST
21ST ST
Noe Valley (24th Street)1/4 Mile
Vacancy & Opportunity Sites
Vacant Lots & Surface Parking Lots
Vacant Storefronts
Spaces indicated as “Vacant Storefronts’ include all ground floor commercial spaces that were unoccupied as of February 2013.
Neighborhood Zoning
NCD 24TH STREET-NOE VALLEY NEIGHBORHOOD COMMERCIAL DISTRICT NC-1 LOW-DENSITY NEIGHBORHOOD
COMMERCIAL DISTRICT
9D A T A A P P E N D I X : N O E V A L L E Y / 2 4 T H S T R E E T
AP
PE
ND
IX
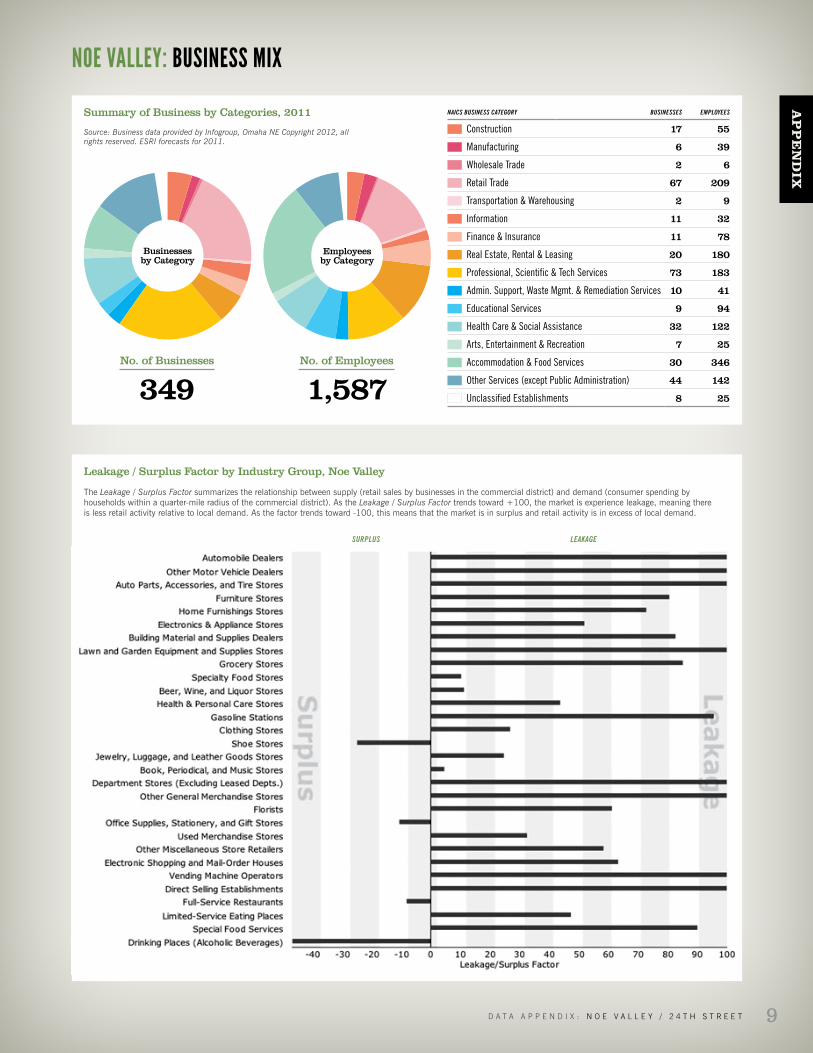
Summary of Business by Categories, 2011
Source: Business data provided by Infogroup, Omaha NE Copyright 2012, all rights reserved. ESRI forecasts for 2011.
NOE VALLEY: BUSINESS MIX
NAICS BUSINESS CATEGORY BUSINESSES EMPLOYEES
Construction 17 55
Manufacturing 6 39
Wholesale Trade 2 6
Retail Trade 67 209
Transportation & Warehousing 2 9
Information 11 32
Finance & Insurance 11 78
Real Estate, Rental & Leasing 20 180
Professional, Scientific & Tech Services 73 183
Admin. Support, Waste Mgmt. & Remediation Services 10 41
Educational Services 9 94
Health Care & Social Assistance 32 122
Arts, Entertainment & Recreation 7 25
Accommodation & Food Services 30 346
Other Services (except Public Administration) 44 142
Unclassified Establishments 8 25
Leakage / Surplus Factor by Industry Group, Noe Valley
The Leakage / Surplus Factor summarizes the relationship between supply (retail sales by businesses in the commercial district) and demand (consumer spending by households within a quarter-mile radius of the commercial district). As the Leakage / Surplus Factor trends toward +100, the market is experience leakage, meaning there is less retail activity relative to local demand. As the factor trends toward -100, this means that the market is in surplus and retail activity is in excess of local demand.
Businesses by Category
Employees by Category
No. of Businesses
349No. of Employees
1,587
SURPLUS LEAKAGE
I N V E S T I N N E I G H B O R H O O D S10
AP
PE
ND
IX
munidave
Kite Hill
DouglassPlayground
25TH ST24TH ST
24TH ST
23RD ST
22ND ST
26TH ST
NO
E ST
21ST ST
CLIPPER ST
CA
STRO
ST
DUNCAN ST
CH
UR
CH
ST
27TH ST
28TH STD
IAM
ON
D ST
SAN
CH
EZ ST
JERSEY ST
DO
UG
LASS ST
ELIZABETH ST
CESAR CHAVEZ ST
HILL ST
VALEN
CIA
ST20TH ST
MA
RK
ET
ST
FAIR
OA
KS ST
EUR
EKA
ST
GR
AND
VIE
W A
VE
QU
AN
E ST
LIBERTY ST
VALLEY ST
CO
RB
ETT
AVE
HO
FFMA
N AV
E
AM
ES ST
BA
RTLETT ST
VIC
KSB
UR
G ST
PO
PLA
R ST
CH
ATTAN
OO
GA
ST
PO
RTO
LA D
R
NELLIE ST
CO
LLING
WO
OD
ST
OR
AN
GE A
LY
HIG
H ST SA
N J
OSE
AV
E
CORWIN ST
FOU
NTA
IN ST
CARNELIA
N WAY
ROMAIN ST
BLA
NC
HE ST
DIAMOND HEIGHTS BLVD
GU
ERR
ERO
ST
WO
RTH
ST
HO
MESTEA
D ST
NEW
BURG
ST
SEVER
N ST
MER
SEY ST
GLENDAL
E ST
DO
LOR
ES ST
HILL ST
SAN
JOSE AV
E
ALVARADO ST
21ST ST
48
48
52
48
4837
J
24
24
35
35
35
27
12
Noe Valley (24th Street)1/4 Mile
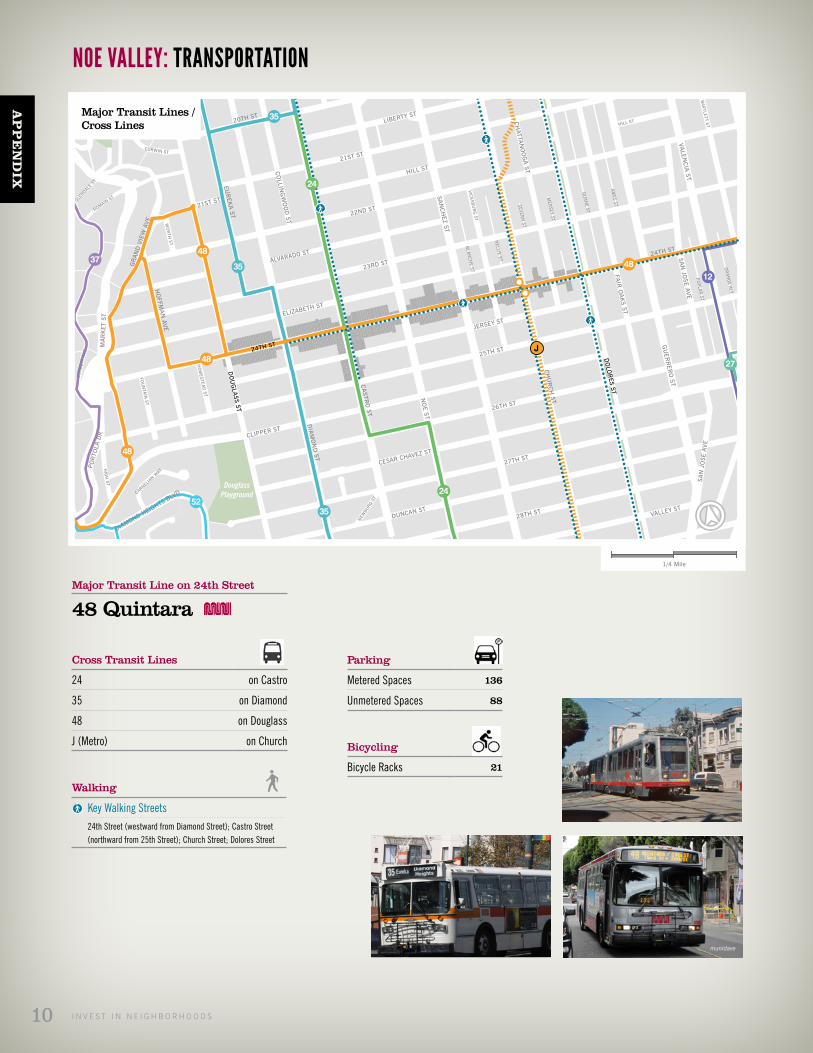
NOE VALLEY: TRANSPORTATION
Major Transit Lines / Cross Lines
Cross Transit Lines
24 on Castro
35 on Diamond
48 on Douglass
J (Metro) on Church
Walking
Key Walking Streets24th Street (westward from Diamond Street); Castro Street (northward from 25th Street); Church Street; Dolores Street
Major Transit Line on 24th Street
48 Quintara
Parking
Metered Spaces 136
Unmetered Spaces 88
Bicycling
Bicycle Racks 21
11D A T A A P P E N D I X : N O E V A L L E Y / 2 4 T H S T R E E T
AP
PE
ND
IX
Noe Valley Association Annual Report for Fiscal Year 2011-2012
DATE: 2012 SOURCE: Noe Valley Association
SUMMARY: A summary of the Noe Valley Association’s activities from July 2011 through June 2012.
URL: http://www.noevalleyassociation.org/app/download/6270661183/NVA+annual+report+2012_FINAL_WEB.pdf
Noe Valley Community Benefit District Management Plan
DATE: 2005 SOURCE: OEWD
SUMMARY: The Noe Valley Community Benefit District Management District Plan is a review of the district boundaries, the service plan and budget, the assessments and assessment methodology, the time and manner of collecting assessments, the number of years assessments will be levied, the timeline for implementation and completion of the plan, the proposed rules and regulations, the list of assessed properties, and the continuation of City services.
URL: http://www.oewd.org/media/docs/Noe%20Valley%20CBD%20Management%20Plan.pdf
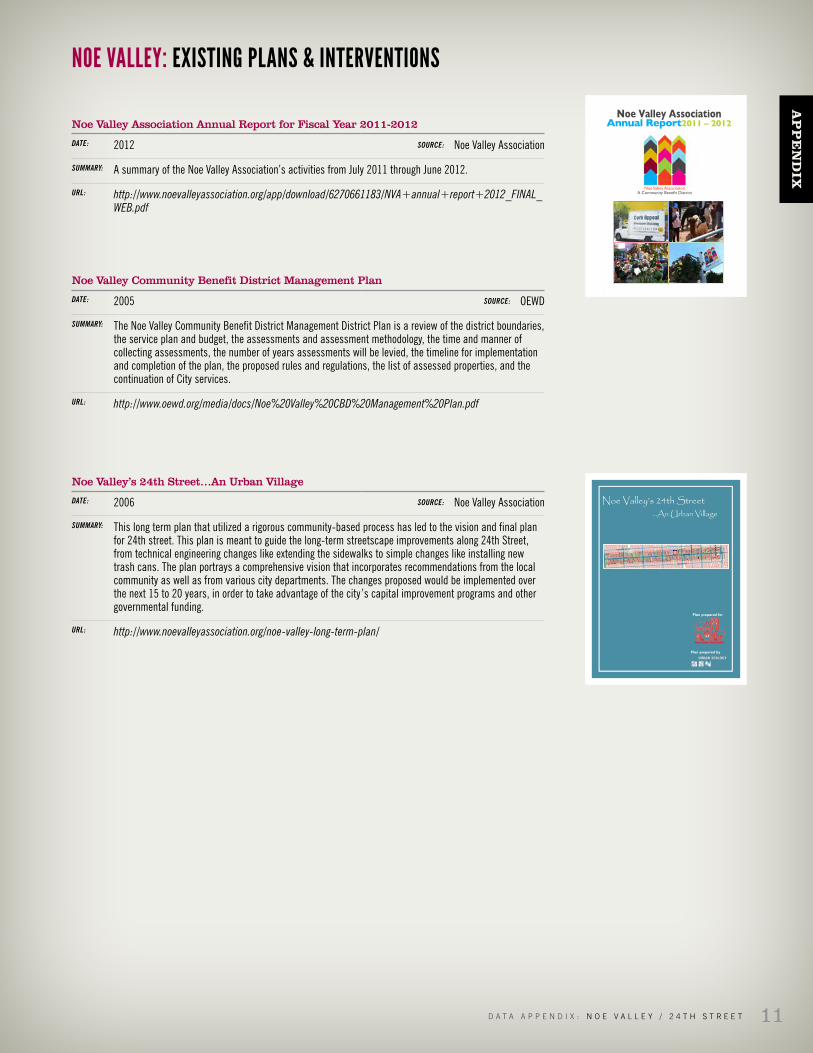
Noe Valley’s 24th Street…An Urban Village
DATE: 2006 SOURCE: Noe Valley Association
SUMMARY: This long term plan that utilized a rigorous community-based process has led to the vision and final plan for 24th street. This plan is meant to guide the long-term streetscape improvements along 24th Street, from technical engineering changes like extending the sidewalks to simple changes like installing new trash cans. The plan portrays a comprehensive vision that incorporates recommendations from the local community as well as from various city departments. The changes proposed would be implemented over the next 15 to 20 years, in order to take advantage of the city’s capital improvement programs and other governmental funding.
URL: http://www.noevalleyassociation.org/noe-valley-long-term-plan/
NOE VALLEY: EXISTING PLANS & INTERVENTIONS
Noe Valley’s 24th Street …An Urban Village
Plan prepared by
Plan prepared for
Noe Valley Association
V . 0 4 . 2 9 . 2 0 1 3
Mayor
Edwin M. Lee
Board of Supervisors
Eric Mar
Mark Farrell
Katy Tang
London Breed
Jane Kim
Norman Yee
Scott Wiener
David Campos
Malia Cohen
John Avalos
The Invest in Neighborhoods Commercial District Profiles have been brought to you by:
To learn more about Invest in Neighborhoods please visit our website at http://oewd.org/IIN.aspx, or contact the Office of Economic and Workforce Development at (415) 554-6969 or [email protected] and ask to speak with a member of the Invest in Neighborhoods team.
Recommended