Sunk costs 1
Sunk costs Carbon capture and storage will miss every target set for it
The IEA, the IPCC, the G8, the Australian Government, the Australian Coal Association and
the Council of the European Union have set targets for carbon capture and storage. None of these
targets have been met, and none of these targets are on track to be met.
Discussion paper
Bill Browne
November 2018
Sunk costs 2
ABOUT THE AUSTRALIA INSTITUTE
The Australia Institute is an independent public policy think tank based in Canberra. It
is funded by donations from philanthropic trusts and individuals and commissioned
research. We barrack for ideas, not political parties or candidates. Since its launch in
1994, the Institute has carried out highly influential research on a broad range of
economic, social and environmental issues.
OUR PHILOSOPHY
As we begin the 21st century, new dilemmas confront our society and our planet.
Unprecedented levels of consumption co-exist with extreme poverty. Through new
technology we are more connected than we have ever been, yet civic engagement is
declining. Environmental neglect continues despite heightened ecological awareness.
A better balance is urgently needed.
The Australia Institute’s directors, staff and supporters represent a broad range of
views and priorities. What unites us is a belief that through a combination of research
and creativity we can promote new solutions and ways of thinking.
OUR PURPOSE – ‘RESEARCH THAT MATTERS’
The Institute publishes research that contributes to a more just, sustainable and
peaceful society. Our goal is to gather, interpret and communicate evidence in order to
both diagnose the problems we face and propose new solutions to tackle them.
The Institute is wholly independent and not affiliated with any other organisation.
Donations to its Research Fund are tax deductible for the donor. Anyone wishing to
donate can do so via the website at https://www.tai.org.au or by calling the Institute
on 02 6130 0530. Our secure and user-friendly website allows donors to make either
one-off or regular monthly donations and we encourage everyone who can to donate
in this way as it assists our research in the most significant manner.
Level 1, Endeavour House, 1 Franklin St
Canberra, ACT 2601
Tel: (02) 61300530
Email: [email protected]
Website: www.tai.org.au
ISSN: 1836-9014
Sunk costs 3
Summary
Industry, government and international organisations have given CCS credibility by
making predictions about its success and setting targets that give it a clear place in
emissions reductions plans.
The only institutional target that CCS has met concerns the number of CCS projects
launched. All targets for number of projects actually built and operating or for millions
of tonnes of CO2 actually stored each year (“Mtpa”) have either not been met, or are
not on track to be met.
The floundering of CCS over the past decade means that we cannot rely on it to reduce
emissions from electricity generation. That sector should be decarbonised through
uptake of renewable energy, closure of fossil fuel power plants and increased energy
efficiency.
Sunk costs 4
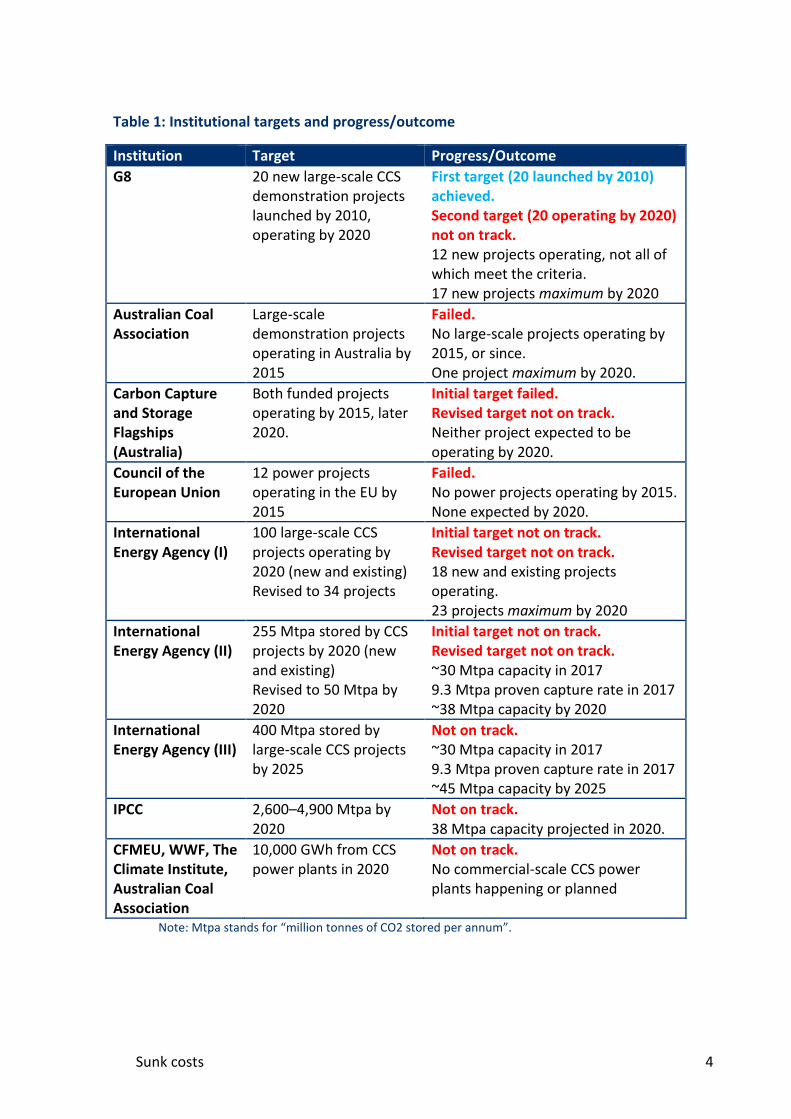
Table 1: Institutional targets and progress/outcome
Institution Target Progress/Outcome
G8 20 new large-scale CCS demonstration projects launched by 2010, operating by 2020
First target (20 launched by 2010) achieved. Second target (20 operating by 2020) not on track. 12 new projects operating, not all of which meet the criteria. 17 new projects maximum by 2020
Australian Coal Association
Large-scale demonstration projects operating in Australia by 2015
Failed. No large-scale projects operating by 2015, or since. One project maximum by 2020.
Carbon Capture and Storage Flagships (Australia)
Both funded projects operating by 2015, later 2020.
Initial target failed. Revised target not on track. Neither project expected to be operating by 2020.
Council of the European Union
12 power projects operating in the EU by 2015
Failed. No power projects operating by 2015. None expected by 2020.
International Energy Agency (I)
100 large-scale CCS projects operating by 2020 (new and existing) Revised to 34 projects
Initial target not on track. Revised target not on track. 18 new and existing projects operating. 23 projects maximum by 2020
International Energy Agency (II)
255 Mtpa stored by CCS projects by 2020 (new and existing) Revised to 50 Mtpa by 2020
Initial target not on track. Revised target not on track. ~30 Mtpa capacity in 2017 9.3 Mtpa proven capture rate in 2017 ~38 Mtpa capacity by 2020
International Energy Agency (III)
400 Mtpa stored by large-scale CCS projects by 2025
Not on track. ~30 Mtpa capacity in 2017 9.3 Mtpa proven capture rate in 2017 ~45 Mtpa capacity by 2025
IPCC 2,600–4,900 Mtpa by 2020
Not on track. 38 Mtpa capacity projected in 2020.
CFMEU, WWF, The Climate Institute, Australian Coal Association
10,000 GWh from CCS power plants in 2020
Not on track. No commercial-scale CCS power plants happening or planned
Note: Mtpa stands for “million tonnes of CO2 stored per annum”.
Sunk costs 5
Introduction
International organisations and carbon capture and storage (CCS) boosters have made
bold predictions about the uptake and success of CCS technologies. The G8, the
International Energy Agency, Australian Coal Association and the Council of the
European Union have all set targets for CCS uptake.
CCS’ progress towards these targets is used to justify taking money from renewables
and energy efficiency projects in order to fund more CCS. Last year, the Minerals
Council of Australia argued for the Clean Energy Finance Corporation to extend to
funding CCS projects, partly on the grounds that the world has met the G8 target of 20
large-scale CCS projects by 20201 (although this is not the case; see below).
The targets that were set represent credible milestones for how CCS must advance if it
is to play a key role in the fight against climate change. If it has failed to meet these
targets, the technology is less developed than expected – and cannot be depended on.
1 Minerals Council of Australia (2018) Clean Energy Finance Corporation Amendment (Carbon Capture
and Storage) Bill 2017, p 4,
https://web.archive.org/web/20180416063911/http://www.minerals.org.au/file_upload/files/annual_
reports/180921_CEFC_Amendment_(CCS)_Bill_2017.pdf

Sunk costs 6
Target categories and criteria
Ambitions for carbon capture and storage projects fall into two main categories, each
with its own sub-categories:
Number of large-scale projects: These targets specify how many large-scale
projects must exist to meet the target.
o Launched: Count of projects “launched” or otherwise progressed (but
not necessarily complete)
o Completed: Count of projects operational
Capture and storage volume: These targets specify how many Mtpa of CO2
should be captured and stored to meet the target.
o Potential capture: Total potential for capture (“capacity”) in a year
o Actual capture: Total actually captured in a year
o Proven capture: Total “proven” to be captured (meeting strict
standards around reporting, reliability and safety) in a year
Some targets fall into both categories, for example the IEA 2009 Roadmap’s target of
100 large-scale projects capturing 255 Mtpa between them.
The particular criteria set for the target will determine whether projects, capacity and
storage count towards the target. For example, the definition of “large-scale” differs
across projects, as does what level of verification is required for storage to be
“proven”.
There is also a temptation to blur the lines, for example counting storage capacity as
“actually captured”, even if the project’s potential is not fully utilised, or to count
“launched” projects towards the completed projects target. However, this is not
appropriate. If the target is completed projects or CO2 actually captured, that is what
progress must be measured against.
LARGE-SCALE PROJECTS
A number of targets reference the number of “large-scale” projects launched or
operational (completed). The main criteria are:
What counts as a large-scale project
Whether existing completed projects count towards the target
Sunk costs 7
Large-scale
The definition of large-scale has changed over the years, even within organisations.
The Global CCS Institute worked with the G8 to set the particular criteria required for
its targets. They initially used a threshold of 1 Mtpa captured as the measure of “large-
scale” or “commercial-scale”. By the time the G8 criteria were settled, the threshold
for non-coal projects had been lowered to “in the order of” 0.5 Mtpa captured (coal
projects remained at “in the order of” 1 Mtpa captured).2
The Global CCS Institute further revised its criteria to capturing “not less than 80 per
cent” of 1 Mtpa for coal-fired power stations (i.e., 0.8 Mtpa captured and stored) and
capturing “not less than 80 per cent” of 0.5 Mtpa for other projects (i.e., 0.4 Mpta
captured and stored), which is the threshold adopted by the IEA.3
Existing completed projects
A key detail is whether a project that pre-dates the target counts towards it. In other
words, is it a target for X new projects by a certain year, or just a target for X total
projects by a certain year.
Where there were no existing projects, this is a moot point. For example, since the EU
had no large-scale projects to begin with, its goal of 12 power projects by 2015 is
necessarily for 12 new projects.
On the other hand, this is a vital question for the G8 target. There are six CCS projects
that pre-date the G8 target being set, five of which would probably meet the G8’s
definition of “large-scale”. If these projects are not counted, there is no conceivable
way for the G8 target to be met.
2 Global CCS Institute (2009) Strategic analysis of the global status of carbon capture and storage, report
5: Synthesis report, p 9,
https://hub.globalccsinstitute.com/sites/default/files/publications/5751/report-5-synthesis-
report.pdf; Global CCS Institute (2010) The global status of CCS: 2010, p 71,
http://hub.globalccsinstitute.com/sites/default/files/publications/12776/global-status-ccs-2010.pdf;
IEA and CSLF (2010) Carbon capture and storage: Progress and next steps, p 9-10,
http://hub.globalccsinstitute.com/sites/default/files/publications/5701/iea-cslf-report-muskoka-2010-
g8-summit.pdf 3 IEA (2013) Technology Roadmap: Carbon capture and storage, 2013 edition, p 19,
https://www.iea.org/publications/freepublications/publication/TechnologyRoadmapCarbonCapturean
dStorage.pdf; see also Global CCS Institute (2010) The global status of CCS: 2010, p 48,
http://hub.globalccsinstitute.com/sites/default/files/publications/12776/global-status-ccs-2010.pdf

Sunk costs 8
POTENTIAL AND ACTUAL CAPTURE
A number of targets involve the potential to capture and store or the actual capture
and storage of a certain volume of CO2. The main criteria are:
Whether potential, actual or proven capture is the measure
Whether the capture from any project counts towards the total, or just that
done by large-scale projects
Potential, actual or proven capture/storage
A project might have the nominal ability to capture some amount of CO2, but whether
it actually captures that amount is a key question. In addition, a project’s actual
capture may be higher than its proven capture if it cannot satisfactorily demonstrate
that its capture is secure for the long-term.
In fact, all existing targets specify that it is the actual or proven capture – and not the
capture potential – that is the criteria. However, it is worth emphasising because
capture potential is the data that is more readily available – and so it is tempting to use
it as a proxy for actual or proven capture.
ENHANCED OIL RECOVERY (“EOR”)
Whether to count EOR projects and EOR capture towards CCS development is a
contentious question, for a number of reasons as provided by the Global CCS
Institute:4
EOR projects may also require dedicated geological storage because EOR
projects do not use a constant volume of CO2 over their lifetime
Not all regions and countries have opportunities for EOR
Not all oil fields are suitable for EOR
The timeframe for EOR is narrow
Public support for taxpayer funding of EOR is limited
The G8 target does include EOR projects, despite describing EOR as a “distraction to
CCS development” and saying that “the majority of the CO2 EOR experience has
yielded very little information on CO2 storage, monitoring and risk assessment”.5
4 Global CCS Institute (2011) Global storage resources gap analysis for policy makers, report: 2011/10,,
http://hub.globalccsinstitute.com/sites/default/files/publications/23707/2011-10-global-storage-
resources-gap-analysis-policy-makers.pdf
Sunk costs 9
Targets
This documents the institutional targets and projections that have been made for CCS.
IEA TARGETS
Roadmaps
2009 Roadmap:
100 projects capturing 255 Mtpa by 2020
OECD Pacific has seven projects storing 17 Mtpa by 2020
Coal makes up 37% of CCS, storing 94 Mtpa, by 2020
2013 Roadmap:
34 projects capturing 50 Mtpa by 2020
In the IEA’s 2009 roadmap, the IEA proposed a “BLUE Map” scenario in which CCS
reduced carbon emissions by 9.5 Gt CO2 in 2050, or 19% of the total. This would
require 100 projects by 2020, storing 255 Mtpa.6
In 2011, the IEA confirmed:
Some 100 projects globally are still required by 2020 if we are to set CCS
technologies on the right pathway to delivery.7
However, in 2013 the Roadmap was re-published and the IEA cut its ambition from 100
CCS projects to “upwards of 30”, not including the four that were operational in 2013,8
5 Global CCS Institute (2009) Strategic analysis of the global status of carbon capture and storage, report
5: Synthesis report, p 25-26,
https://hub.globalccsinstitute.com/sites/default/files/publications/5751/report-5-synthesis-
report.pdf; Global CCS Institute (2011) Global storage resources gap analysis for policy makers, report:
2011/10, http://hub.globalccsinstitute.com/sites/default/files/publications/23707/2011-10-global-
storage-resources-gap-analysis-policy-makers.pdf 6 IEA (2009) Technology roadmap: Carbon capture and storage, p 6, 14–22,
https://www.iea.org/publications/freepublications/publication/CCSRoadmap2009.pdf 7 Lipponen, Burnard, Beck, Gale and Pegler (2011) The IEA CCS Technology Roadmap: One Year On, p
5755, https://www.sciencedirect.com/science/article/pii/S1876610211008502
Sunk costs 10
capturing around 50 Mt CO2 p.a.9 The explanation given was practical – too few
projects were in the advanced stages of planning and the revised goal was “set in this
context” – rather than based on what was required for fossil fuel technology to remain
viable in a carbon-constrained world.10
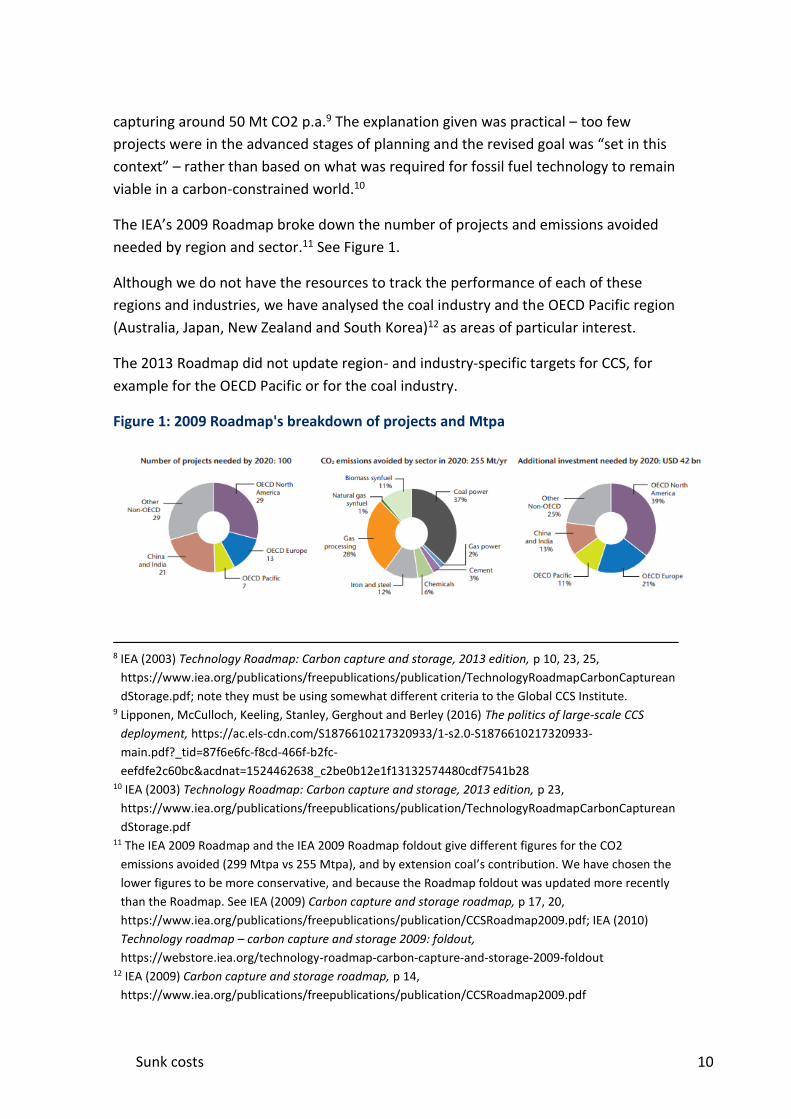
The IEA’s 2009 Roadmap broke down the number of projects and emissions avoided
needed by region and sector.11 See Figure 1.
Although we do not have the resources to track the performance of each of these
regions and industries, we have analysed the coal industry and the OECD Pacific region
(Australia, Japan, New Zealand and South Korea)12 as areas of particular interest.
The 2013 Roadmap did not update region- and industry-specific targets for CCS, for
example for the OECD Pacific or for the coal industry.
Figure 1: 2009 Roadmap's breakdown of projects and Mtpa
8 IEA (2003) Technology Roadmap: Carbon capture and storage, 2013 edition, p 10, 23, 25,
https://www.iea.org/publications/freepublications/publication/TechnologyRoadmapCarbonCapturean
dStorage.pdf; note they must be using somewhat different criteria to the Global CCS Institute. 9 Lipponen, McCulloch, Keeling, Stanley, Gerghout and Berley (2016) The politics of large-scale CCS
deployment, https://ac.els-cdn.com/S1876610217320933/1-s2.0-S1876610217320933-
main.pdf?_tid=87f6e6fc-f8cd-466f-b2fc-
eefdfe2c60bc&acdnat=1524462638_c2be0b12e1f13132574480cdf7541b28 10 IEA (2003) Technology Roadmap: Carbon capture and storage, 2013 edition, p 23,
https://www.iea.org/publications/freepublications/publication/TechnologyRoadmapCarbonCapturean
dStorage.pdf 11 The IEA 2009 Roadmap and the IEA 2009 Roadmap foldout give different figures for the CO2
emissions avoided (299 Mtpa vs 255 Mtpa), and by extension coal’s contribution. We have chosen the
lower figures to be more conservative, and because the Roadmap foldout was updated more recently
than the Roadmap. See IEA (2009) Carbon capture and storage roadmap, p 17, 20,
https://www.iea.org/publications/freepublications/publication/CCSRoadmap2009.pdf; IEA (2010)
Technology roadmap – carbon capture and storage 2009: foldout,
https://webstore.iea.org/technology-roadmap-carbon-capture-and-storage-2009-foldout 12 IEA (2009) Carbon capture and storage roadmap, p 14,
https://www.iea.org/publications/freepublications/publication/CCSRoadmap2009.pdf
Sunk costs 11
Source: IEA (2009) Carbon capture and storage roadmap,
https://www.iea.org/publications/freepublications/publication/CCSRoadmap2009.pdf; IEA
(2010) Technology roadmap – carbon capture and storage 2009: foldout,
https://webstore.iea.org/technology-roadmap-carbon-capture-and-storage-2009-foldout
Criteria
The IEA provided criteria for projects to count as eligible towards the Roadmaps
targets:
Large-scale: The IEA defined the projects needed by 2020 as “large-scale”,13
later clarifying that they were using the new Global CCS Institute definition of
0.8 Mtpa captured and stored for coal-fired power stations and 0.4 Mtpa
captured and stored for other projects.14
Storage: The Mtpa target is based on storage, not storage potential.
New and existing: The 2009 Roadmap target did not require new projects. The
2013 Roadmap target did require 30 new projects, but also identified that there
were only four existing projects that met its criteria.
This paper therefore sets the target at 34 new and existing projects.
2DS Target
Over 400 Mtpa stored in 2025
The IEA’s 2DS scenario identifies changes required for the world to have a 50% chance
of limiting global warming to 2 degrees Celsius.15
In 2017, the IEA reviewed 26 technologies to assess how they were tracking towards
“2DS”. Large-scale CCS received the worse assessment of “red”, significantly off-
track.16
13 “The roadmap’s recommendation [is] of 100 large-scale projects”: IEA (2009) Carbon capture and
storage roadmap,
https://www.iea.org/publications/freepublications/publication/CCSRoadmap2009.pdf; Saether (2010)
European Zero Emissions Platform: ‘We are ready to go’, http://bellona.org/news/ccs/2010-10-
european-zero-emissions-platform-we-are-ready-to-go 14 IEA (2013) Technology Roadmap: Carbon capture and storage, 2013 edition, p 19,
https://www.iea.org/publications/freepublications/publication/TechnologyRoadmapCarbonCapturean
dStorage.pdf; see also Global CCS Institute (2010) The global status of CCS: 2010, p 48,
http://hub.globalccsinstitute.com/sites/default/files/publications/12776/global-status-ccs-2010.pdf 15 IEA (n.d.) Scenarios and projections, https://www.iea.org/publications/scenariosandprojections/ 16 IEA (2017) Tracking clean energy progress 2017, p 6, 11,
https://www.iea.org/publications/freepublications/publication/TrackingCleanEnergyProgress2017.pdf

Sunk costs 12
G8 TARGETS
20 new large-scale CCS projects launched by 2010
20 new large-scale CCS projects operating by 2020
In 2008, the G8 leaders announced:
We strongly support the launching of 20 large-scale CCS demonstration projects
globally by 2010, taking into account various national circumstances, with a
view to beginning broad deployment of CCS by 2020.17
The requirement for “broad deployment” was interpreted to mean that the 20
projects would be operational by 2020.18
Criteria
Involved parties set criteria for projects to count as eligible towards the target.19
New projects: The projects must be “in addition to those already operating”
when the target was set.20
Large-scale: 0.5 Mtpa captured (non-coal) or 1 Mtpa captured (coal). This was a
revision down from the initial metric of 1 Mtpa for all projects.21
17 Global CCS Institute (2010) The global status of CCS: 2010, p 71,
http://hub.globalccsinstitute.com/sites/default/files/publications/12776/global-status-ccs-2010.pdf;
sometimes described as a G20 target, see for example: Page (2011) Global status of CCS: 2011,
https://www.youtube.com/watch?v=DxhbLGDig_g 18 Global CCS Institute (2009) Strategic analysis of the global status of carbon capture and storage,
report 5: Synthesis report, p 172,
https://hub.globalccsinstitute.com/sites/default/files/publications/5751/report-5-synthesis-report.pdf 19 Global CCS Institute (2010) The global status of CCS: 2010, p 71,
http://hub.globalccsinstitute.com/sites/default/files/publications/12776/global-status-ccs-2010.pdf;
see also IEA and CSLF (2010) Carbon capture and storage: Progress and next steps, p 9-10,
http://hub.globalccsinstitute.com/sites/default/files/publications/5701/iea-cslf-report-muskoka-2010-
g8-summit.pdf 20 IEA (2016) 20 years of carbon capture and storage, p 10, 17,
https://www.iea.org/publications/freepublications/publication/20YearsofCarbonCaptureandStorage_
WEB.pdf; see also SBC Energy Institute (n.d.) Leading the energy transition: Bringing carbon capture
and storage to market, p 7; see also World Coal Association (2018) Fluctuating policy and political
support for CCS, https://twitter.com/WorldCoal/status/1034498402216824832 21 Global CCS Institute (2009) Strategic analysis of the global status of carbon capture and storage,
report 5: Synthesis report, p 9,
https://hub.globalccsinstitute.com/sites/default/files/publications/5751/report-5-synthesis-
report.pdf; Global CCS Institute (2010) The global status of CCS: 2010, p 71,
http://hub.globalccsinstitute.com/sites/default/files/publications/12776/global-status-ccs-2010.pdf;
Sunk costs 13
Storage: The scale requirement is based on capture, not capacity.
Integrated: The project integrates capture and storage, and transport (if
applicable).
Proven capture: A monitoring, measurement and verification plan must be
provided.
In the Global CCS Institute’s initial assessment in 2010, only one project met all seven
criteria – the Gorgon Gas Project, which is still not operating. Four operating projects
met six criteria (one of these, In Salah, has since closed) and five operating projects
met five criteria.22
The Minerals Council of Australia said in 2017:
there will be over 20 large scale CCS projects operating by 2020 including
Western Australia’s Gorgon Carbon Dioxide Injection Project. This meets the
G8’s 2008 objective of 20 such projects by 2020.23
This is based on a misunderstanding the G8 target, because it is counting projects that
already existed when the target for new projects was set.
CCS academics Lipponen, McCulloch, Keeling, Stanley, Berghout and Berley confirm in
their 2017 paper that the G8 target will be missed because at best, there will be 14
new large-scale CCS projects operating by 2020.24 They must be using more
conservative criteria than the Global CCS Institute – a count of the Global CCS Institute
database of large-scale projects operating or under construction gives a slightly higher
figure of 17.25
IEA and CSLF (2010) Carbon capture and storage: Progress and next steps, p 9-10,
http://hub.globalccsinstitute.com/sites/default/files/publications/5701/iea-cslf-report-muskoka-2010-
g8-summit.pdf 22 Global CCS Institute (2010) The status of CCS projects: Interim report 2010, p 16-17,
http://hub.globalccsinstitute.com/sites/default/files/publications/5686/status-ccs-projects-interim-
report-2010.pdf 23 Minerals Council of Australia (2018) Clean Energy Finance Corporation Amendment (Carbon Capture
and Storage) Bill 2017, p 4,
https://web.archive.org/web/20180416063911/http://www.minerals.org.au/file_upload/files/annual_
reports/180921_CEFC_Amendment_(CCS)_Bill_2017.pdf 24 Lipponen, McCulloch, Keeling, Stanley, Berghout and Berley (2017) The politics of large-scale CCS
deployment, p 7583, https://ac.els-cdn.com/S1876610217320933/1-s2.0-S1876610217320933-
main.pdf?_tid=d215c205-2d22-47ec-bf33-
6fea38654996&acdnat=1524528931_13e1c799ed0a985fb5ef6aeb2361e1f4 25 Global CCS Institute (2018) Large-scale CCS facilities,
http://www.globalccsinstitute.com/projects/large-scale-ccs-projects
Sunk costs 14
In either case, these are best case scenarios. The true number of CCS projects that
meet the G8 target by 2020 could be significantly lower, for several reasons.
Under construction: The five projects “under construction” could be delayed or
cancelled, as so many other CCS projects have been. The rate of failure over
project lifetime is two-to-one.26
Closures: Some of the currently operating CCS projects could close, as the In
Salah project did in 2011.27
EOR projects: Whether to include EOR projects in the count is controversial. At
most five projects would meet the target by 2020 if EOR projects are excluded.
G8 criteria: A project can be operating without meeting all seven G8 criteria. In
2010 (the last time this analysis appears to have been conducted), only one of
the projects met all seven criteria: the Gorgon Gas Project. Half of all operating
projects met fewer than six of the criteria.28
One example is that the Global CCS Institute database lists two different CCS
projects associated with the Alberta Carbon Trunk Line (Agrium CO2 Stream
and Sturgeon Refinery CO2 Stream). However, G8 projects are meant to cover
the whole process – so these two projects may be properly counted as just one.
Large-scale: The Global CCS Institute’s definition of “large-scale” has loosened
since the G8 criteria were fixed, and now includes smaller projects. Two or
three upcoming projects are below 0.5 Mtpa in capacity.29
Even if a project’s capacity exceeds the target, the G8 target is to store that
much CO2. For example, Boundary Dam Power Station is listed as having a
capacity of 1 Mtpa, which meets the G8 requirement for coal-fired power
plants to store 1 Mtpa only if it operates at full capacity. In fact, over the 41
26 Lipponen, McCulloch, Keeling, Stanley, Gerghout and Berley (2016) The politics of large-scale CCS
deployment, https://ac.els-cdn.com/S1876610217320933/1-s2.0-S1876610217320933-
main.pdf?_tid=87f6e6fc-f8cd-466f-b2fc-
eefdfe2c60bc&acdnat=1524462638_c2be0b12e1f13132574480cdf7541b28 27 MIT (n.d.) In Salah Fact Sheet, https://sequestration.mit.edu/tools/projects/in_salah.html 28 Global CCS Institute (2010) The status of CCS projects: Interim report 2010, p 16-17,
http://hub.globalccsinstitute.com/sites/default/files/publications/5686/status-ccs-projects-interim-
report-2010.pdf 29 Sinopec Qilu Petrochemical CCS and Yanchang Integrated Carbon Capture and Storage Demonstration
are 0.4 Mtpa. The Alberta Carbon Trunk Line and Terrell Natural Gas Processing Plant have ranges
given for their capacity, and part of the range falls below the 0.5 Mtpa target. See Global CCS Institute
(2018) Large-scale CCS facilities, http://www.globalccsinstitute.com/projects/large-scale-ccs-projects

Sunk costs 15
months between October 2014 and March 2018, Boundary Dam stored 2
million tonnes of CO2.30 That represents less than 60% of capacity.
Unfortunately, the Global CCS Institute seems to have stopped doing detailed analysis
against G8 criteria for each project. Some projects that were previously non-compliant
may have become compliant (the reverse is also possible), but this analysis would have
to be conducted anew for each project.
The world is not on track to meet the G8 target by 2020 because the target was for
new projects, not counting the six existing ones. Of the 17 new built and under
construction projects, several do not meet the G8’s criteria and would not count
towards the target.
Australian Coal Association Target
G8-style CCS projects in Australia operating by 2015
In 2009, Ralph Hillman of the Australian Coal Association (since merged with the
Minerals Council of Australia) used the G8 targets to justify his claim that Australia will
“have commercial scale demonstration plants with carbon capture and storage in
operation in Australia by 2015”, adding:
Well, we have the whole G8 behind [the target]. There's a G8 commitment,
there's a commitment from the Commonwealth Government, there's a
commitment from state governments and there's commitment from industry.31
As an extension of the G8 target, this target has the same criteria as the G8 target.
IPCC EMISSIONS SCENARIOS
2.6–4.9 Gt CO2 per annum (2,600–4,900 Mtpa) by 2020
In 2000, the IPCC Special Report on Emissions Scenarios considered six scenarios for
the world’s carbon emissions, and identified the “projected potential of CO2 capture”
as being between 2.6 and 4.9 Gtpa by 2020.32
30 SaskPower (2018) SaskPower Carbon Capture and Storage Surpasses Two Million Tonne Mark,
http://www.saskpower.com/about-us/media-information/saskpower-carbon-capture-and-storage-
surpasses-2-million-tonne-mark/ 31 Jones (2009) Ralph Hillman and Richard Denniss join Lateline, http://www.abc.net.au/lateline/ralph-
hillman-and-richard-denniss-join-lateline/1689002

Sunk costs 16
COUNCIL OF THE EUROPEAN UNION TARGET
12 power projects by 2015
The European Union aimed to:
stimulate the construction and operation by 2015 of up to 12 demonstration
plants of sustainable fossil fuel technologies in commercial power generation
[in the European Union].33
CARBON CAPTURE AND STORAGE FLAGSHIPS
TARGET
2–4 projects by 2015 (later 2020)
Prime Minister Kevin Rudd’s CCS Flagships program aimed to have two to four
commercial-scale projects operating in Australia by 2015. Later the target was moved
to 2020 and only two projects were selected for funding.34
PATHWAY TO ACCELERATED DEPLOYMENT OF
CARBON CAPTURE AND STORAGE
10,000 GWh of power generation from integrated CCS technologies in 2020
Commercial-scale (>300 MW) plants operating by 2020
A pathway to accelerated deployment of carbon capture and storage was a strategy to
increase the uptake of CCS in Australia proposed in April 2008 by the Australian Coal
Association (which would later merge with the Minerals Council); the Construction,
Forestry, Mining and Energy Union – Mining and Energy Division; The Climate Institute
32 Referenced in IPCC (2005) Carbon dioxide capture and storage, p 24, https://www.ipcc.ch/pdf/special-
reports/srccs/srccs_wholereport.pdf 33 Council of the European Union (2007) Presidencv conclusions, p 22,
http://www.consilium.europa.eu/ueDocs/cms_Data/docs/pressData/en/ec/93135.pdf; see also
Kapetaki and Scowcroft (2017) Overview of Carbon Capture and Storage (CCS) Demonstration Project
Business Models: Risks and Enablers on the Two Sides of the Atlantic,
https://www.sciencedirect.com/science/article/pii/S1876610217320180#bib0010 34 Van Puyvelde (2016) What about Carbon Capture and Storage?,
https://www.energynetworks.com.au/news/energy-insider/what-about-carbon-capture-and-storage

Sunk costs 17
(the assets and intellectual property of which were bestowed on The Australia
Institute) and WWF Australia.35
35 The Climate Institute (2008) A pathway to accelerated deployment of carbon capture and storage,
http://www.climateinstitute.org.au/verve/_resources/finalpolicydoc.pdf
Sunk costs 18
CCS progress
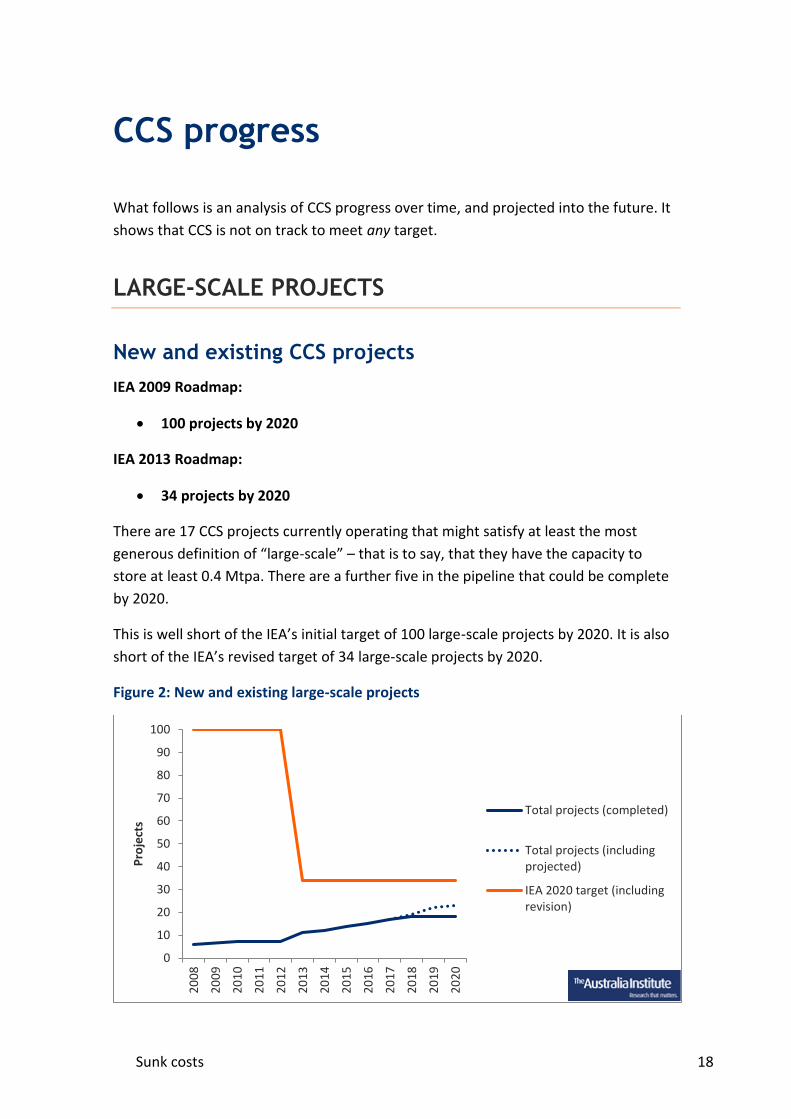
What follows is an analysis of CCS progress over time, and projected into the future. It
shows that CCS is not on track to meet any target.
LARGE-SCALE PROJECTS
New and existing CCS projects
IEA 2009 Roadmap:
100 projects by 2020
IEA 2013 Roadmap:
34 projects by 2020
There are 17 CCS projects currently operating that might satisfy at least the most
generous definition of “large-scale” – that is to say, that they have the capacity to
store at least 0.4 Mtpa. There are a further five in the pipeline that could be complete
by 2020.
This is well short of the IEA’s initial target of 100 large-scale projects by 2020. It is also
short of the IEA’s revised target of 34 large-scale projects by 2020.
Figure 2: New and existing large-scale projects
0
10
20
30
40
50
60
70
80
90
100
20
08
20
09
20
10
20
11
20
12
20
13
20
14
20
15
20
16
20
17
20
18
20
19
20
20
Pro
ject
s
Total projects (completed)
Total projects (includingprojected)
IEA 2020 target (includingrevision)
Sunk costs 19
Source: Global CCS Institute (2018) Large-scale CCS facilities,
http://www.globalccsinstitute.com/projects/large-scale-ccs-projects; Australia Institute
calculations
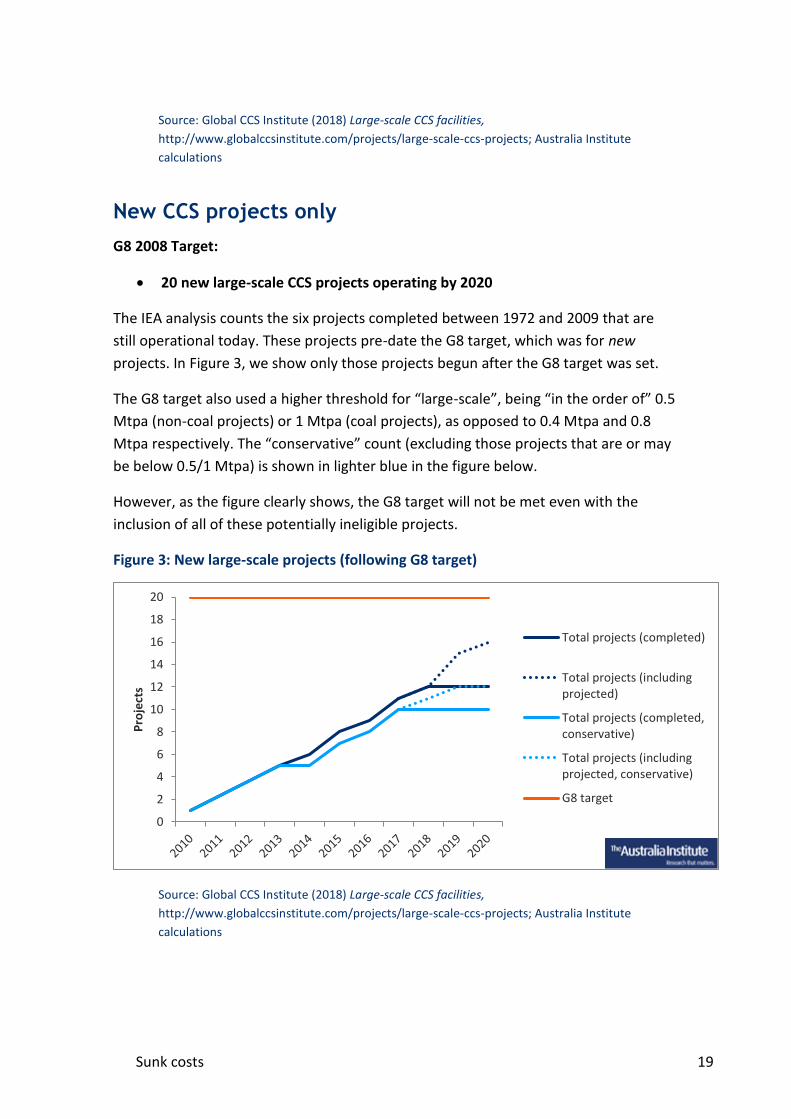
New CCS projects only
G8 2008 Target:
20 new large-scale CCS projects operating by 2020
The IEA analysis counts the six projects completed between 1972 and 2009 that are
still operational today. These projects pre-date the G8 target, which was for new
projects. In Figure 3, we show only those projects begun after the G8 target was set.
The G8 target also used a higher threshold for “large-scale”, being “in the order of” 0.5
Mtpa (non-coal projects) or 1 Mtpa (coal projects), as opposed to 0.4 Mtpa and 0.8
Mtpa respectively. The “conservative” count (excluding those projects that are or may
be below 0.5/1 Mtpa) is shown in lighter blue in the figure below.
However, as the figure clearly shows, the G8 target will not be met even with the
inclusion of all of these potentially ineligible projects.
Figure 3: New large-scale projects (following G8 target)
Source: Global CCS Institute (2018) Large-scale CCS facilities,
http://www.globalccsinstitute.com/projects/large-scale-ccs-projects; Australia Institute
calculations
0
2
4
6
8
10
12
14
16
18
20
Pro
ject
s
Total projects (completed)
Total projects (includingprojected)
Total projects (completed,conservative)
Total projects (includingprojected, conservative)
G8 target

Sunk costs 20
POTENTIAL AND CAPTURE
Potential capture by 2020
The potential capture from CCS projects in 2020 is 38.6 Mtpa. This is so far short of the
IEA 2020 target of 253 Mtpa or the IPCC 2020 projection of between 2,600 and 4,900
Mtpa potential capture that the figure is not even readable. See Figure 4 for the
extreme disparity between projected capture potential in 2020 and the IEA target and
IPCC projection.
Figure 4: New and existing capture capacity
Source: Global CCS Institute (2018) Large-scale CCS facilities,
http://www.globalccsinstitute.com/projects/large-scale-ccs-projects; Australia Institute
calculations
Note: The 2020 IEA target is set at 253 Mtpa to reflect 2 Mtpa of small-scale CCS capacity.
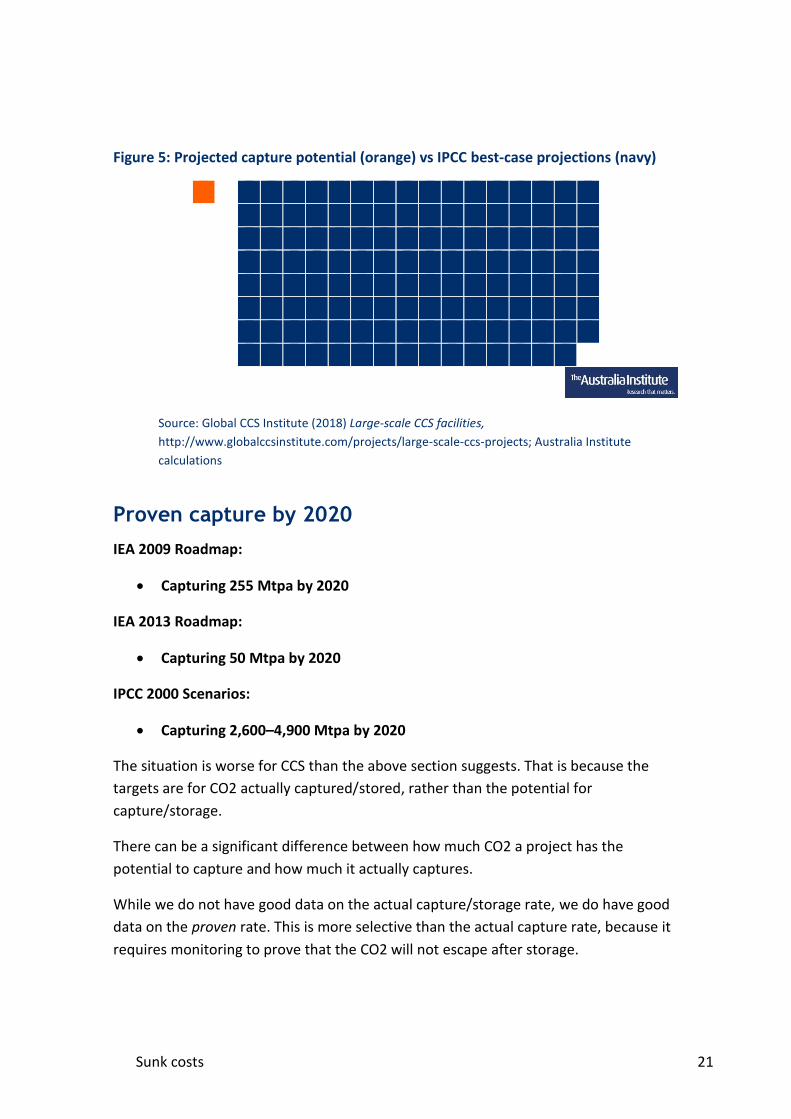
Another way of depicting this is in Figure 5, below, showing in orange how much CCS
capture potential is expected in 2020 versus the upper range of what the IPCC
projected would be needed. There will 1/127th as much as the upper range of the IPCC
projections.
0
500
1,000
1,500
2,000
2,500
3,000
3,500
4,000
4,500
5,000
20
10
20
11
20
12
20
13
20
14
20
15
20
16
20
17
20
18
20
19
20
20
Mtp
a
Operating CCS potentialcapture
Operating CCS potentialcapture (projection)
IEA 2020 target (includingrevision)
IPCC 2020 projection (lowerend)
IPCC 2020 projection (upperend)
Sunk costs 21
Figure 5: Projected capture potential (orange) vs IPCC best-case projections (navy)
Source: Global CCS Institute (2018) Large-scale CCS facilities,
http://www.globalccsinstitute.com/projects/large-scale-ccs-projects; Australia Institute
calculations
Proven capture by 2020
IEA 2009 Roadmap:
Capturing 255 Mtpa by 2020
IEA 2013 Roadmap:
Capturing 50 Mtpa by 2020
IPCC 2000 Scenarios:
Capturing 2,600–4,900 Mtpa by 2020
The situation is worse for CCS than the above section suggests. That is because the
targets are for CO2 actually captured/stored, rather than the potential for
capture/storage.
There can be a significant difference between how much CO2 a project has the
potential to capture and how much it actually captures.
While we do not have good data on the actual capture/storage rate, we do have good
data on the proven rate. This is more selective than the actual capture rate, because it
requires monitoring to prove that the CO2 will not escape after storage.
Sunk costs 22
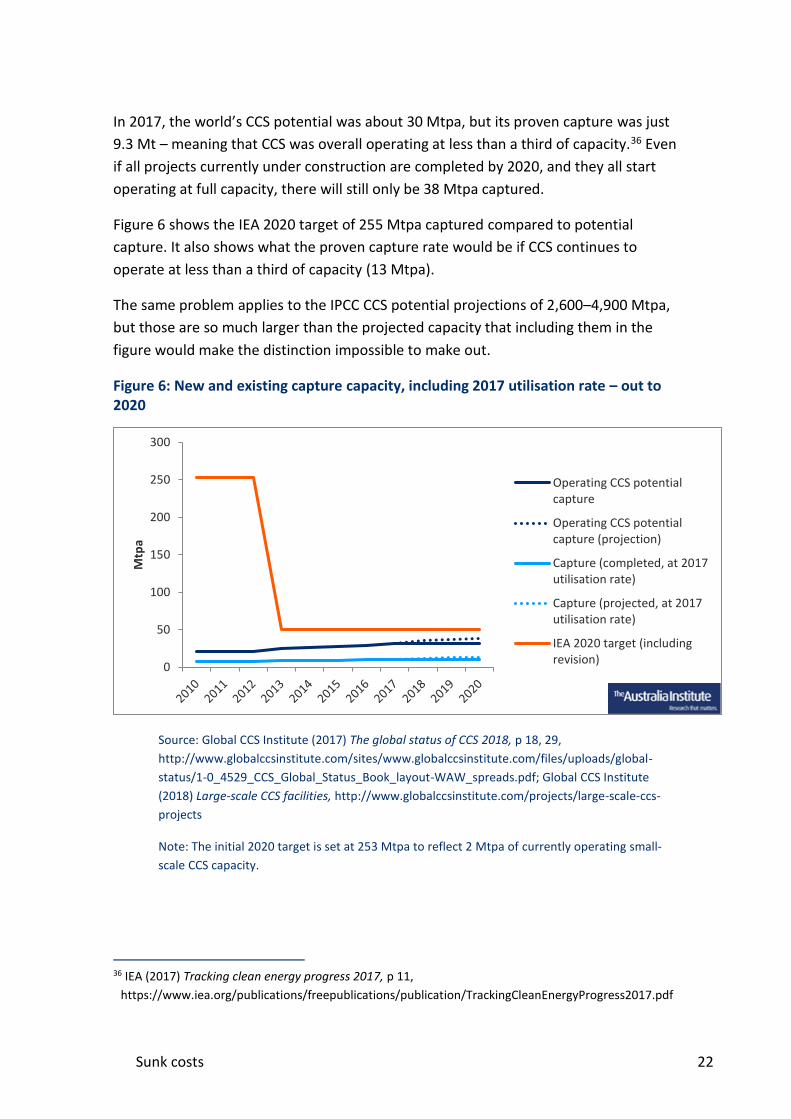
In 2017, the world’s CCS potential was about 30 Mtpa, but its proven capture was just
9.3 Mt – meaning that CCS was overall operating at less than a third of capacity.36 Even
if all projects currently under construction are completed by 2020, and they all start
operating at full capacity, there will still only be 38 Mtpa captured.
Figure 6 shows the IEA 2020 target of 255 Mtpa captured compared to potential
capture. It also shows what the proven capture rate would be if CCS continues to
operate at less than a third of capacity (13 Mtpa).
The same problem applies to the IPCC CCS potential projections of 2,600–4,900 Mtpa,
but those are so much larger than the projected capacity that including them in the
figure would make the distinction impossible to make out.
Figure 6: New and existing capture capacity, including 2017 utilisation rate – out to 2020
Source: Global CCS Institute (2017) The global status of CCS 2018, p 18, 29,
http://www.globalccsinstitute.com/sites/www.globalccsinstitute.com/files/uploads/global-
status/1-0_4529_CCS_Global_Status_Book_layout-WAW_spreads.pdf; Global CCS Institute
(2018) Large-scale CCS facilities, http://www.globalccsinstitute.com/projects/large-scale-ccs-
projects
Note: The initial 2020 target is set at 253 Mtpa to reflect 2 Mtpa of currently operating small-
scale CCS capacity.
36 IEA (2017) Tracking clean energy progress 2017, p 11,
https://www.iea.org/publications/freepublications/publication/TrackingCleanEnergyProgress2017.pdf
0
50
100
150
200
250
300
Mtp
a
Operating CCS potentialcapture
Operating CCS potentialcapture (projection)
Capture (completed, at 2017utilisation rate)
Capture (projected, at 2017utilisation rate)
IEA 2020 target (includingrevision)
Sunk costs 23
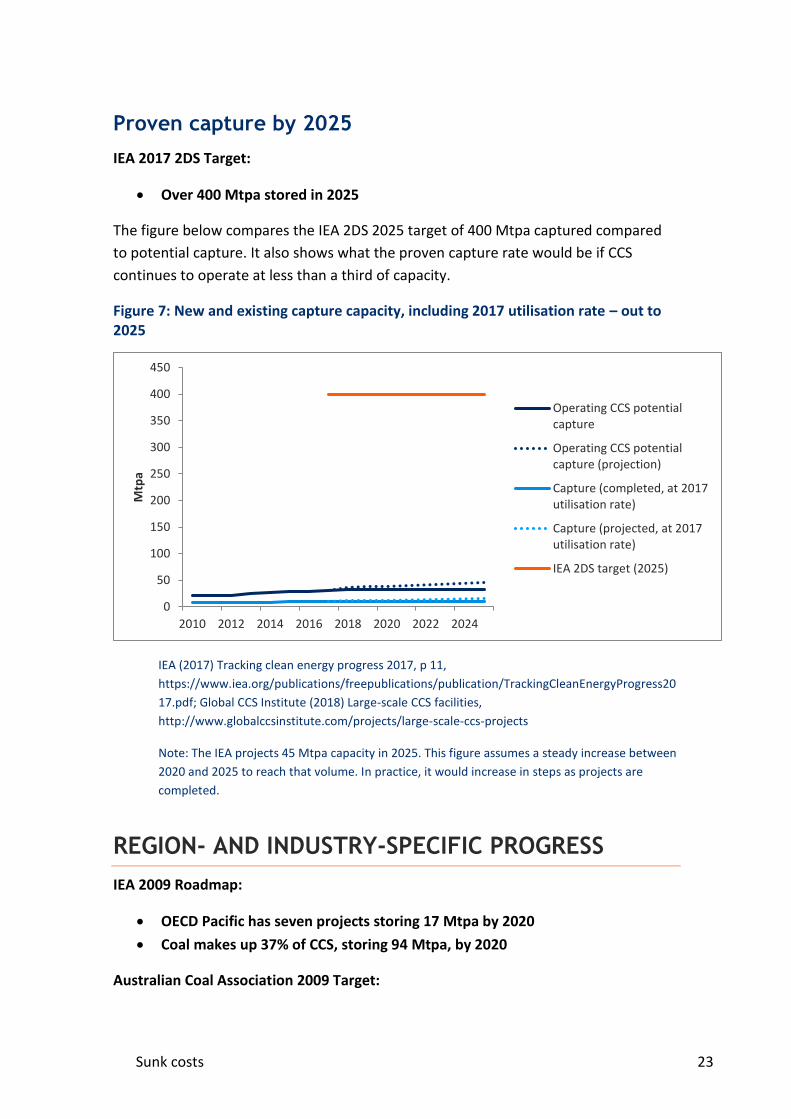
Proven capture by 2025
IEA 2017 2DS Target:
Over 400 Mtpa stored in 2025
The figure below compares the IEA 2DS 2025 target of 400 Mtpa captured compared
to potential capture. It also shows what the proven capture rate would be if CCS
continues to operate at less than a third of capacity.
Figure 7: New and existing capture capacity, including 2017 utilisation rate – out to 2025
IEA (2017) Tracking clean energy progress 2017, p 11,
https://www.iea.org/publications/freepublications/publication/TrackingCleanEnergyProgress20
17.pdf; Global CCS Institute (2018) Large-scale CCS facilities,
http://www.globalccsinstitute.com/projects/large-scale-ccs-projects
Note: The IEA projects 45 Mtpa capacity in 2025. This figure assumes a steady increase between
2020 and 2025 to reach that volume. In practice, it would increase in steps as projects are
completed.
REGION- AND INDUSTRY-SPECIFIC PROGRESS
IEA 2009 Roadmap:
OECD Pacific has seven projects storing 17 Mtpa by 2020
Coal makes up 37% of CCS, storing 94 Mtpa, by 2020
Australian Coal Association 2009 Target:
0
50
100
150
200
250
300
350
400
450
2010 2012 2014 2016 2018 2020 2022 2024
Mtp
a
Operating CCS potentialcapture
Operating CCS potentialcapture (projection)
Capture (completed, at 2017utilisation rate)
Capture (projected, at 2017utilisation rate)
IEA 2DS target (2025)
Sunk costs 24
G8-style CCS projects in Australia operating by 2015
Council of the European Union 2007 Target:
12 power projects by 2015
Carbon Capture and Storage Flagships Target:
2–4 projects by 2015 (later 2020)
Australia’s G8 projects
Australia did not build full-scale projects by 2015, as promised by the Australian Coal
Association. The one full-scale project under construction, Gorgon Gas Project, is four
years behind schedule and now expected in the first half of 2019.37
In 2010, the Global CCS Institute identified seven large-scale CCS projects that could
meet the G8 criteria, including being operational by 2020 or earlier. It also indicated
that Australia had committed to build three to five large-scale CCS projects by 2020.
Those projects were:38
1. Coolimba Power Project: A proposal to build a 400–450 MW coal-fired power
plant in Western Australia, capturing 2 Mtpa. It was scheduled to be
operational by 2015.
2. Wandoan Power IGCC CCS Project: A proposal to build a 400 MW IGCC39 power
plant in Queensland, capturing 2.5 Mtpa. It was scheduled to be operational by
2015 but was cancelled in 2013.40
3. CarbonNet CCS Project: A proposal to build a range of CO2 capture facilities in
Victoria, capturing 4–10 Mtpa. It was planned to be operational between 2015
and 2019. As of November 2018, it has been moved back to an operation date
37 Milne (2017) Carbon hiccup for Chevron with 5 million-tonne greenhouse gas problem at Gorgon LNG
plant, https://thewest.com.au/business/oil-gas/carbon-hiccup-for-chevron-with-5-million-tonne-
greenhouse-gas-problem-at-gorgon-lng-plant-ng-b88694565z 38 Global CCS Institute (2010) The status of CCS projects: Interim report 2010, p 6, Appendix A,
http://hub.globalccsinstitute.com/sites/default/files/publications/5686/status-ccs-projects-interim-
report-2010.pdf 39 “IGCC” refers to “integrated gasification combined cycle” technology, a form of power generation that
turns coal into gas and burns the gas. 40 Queensland Government (2018) Projects discontinued or on hold,
https://www.statedevelopment.qld.gov.au/assessments-and-approvals/discontinued-eis-projects.html

Sunk costs 25
of “2020s”, a reduced capture of 1–5 Mtpa and a capture type of “under
evaluation”.41
4. The Collie South West Hub Project: A proposal to build a range of CO2 capture
facilities in Western Australia, capturing 2.5–7.5 Mtpa. It was planned to be
operational by 2015. As of November 2018, it has been moved back to an
operation date of 2025 and a reduced capture of 2.5 Mtpa.42
5. ZeroGen Commercial Scale Project: A proposal to build a 400 MW IGCC plant in
Queensland, capturing 2 Mtpa. It was planned to be operational by 2015, but it
was cancelled in 2011.43
6. Browse LNG Development: A proposal to build an LNG plant in Western
Australia, capturing 3 Mtpa. It was planned to be operational by 2017 but the
project no longer appears as a current project in the Global CCS Institute
database.44
7. Gorgon Carbon Dioxide Injection Project: A proposal to build an LNG
processing plant in Western Australia, capturing 3.4 Mtpa. It was planned to be
operational in 2014, but the CCS component is now only expected to be
operational in 2019. Since the project began in 2016, it is estimated to have
released 5.5 to 8 million tonnes of CO2 that would have been sequestered if
the CCS technology were functioning.
CarbonNet and the South West Hub Project are the two CCS Flagships projects,
discussed below in reference to the CCS Flagships’ target.
Australia’s CCS Flagships projects
Neither of the CCS Flagships programs were complete by the initial target date of
2015.
It is also unlikely that either CCS project will be complete by the revised target date of
2020.
In 2016, Energy Networks Australia wrote that:
41 Global CCS Institute (2018) Large-scale CCS facilities,
http://www.globalccsinstitute.com/projects/large-scale-ccs-projects 42 Global CCS Institute (2018) Large-scale CCS facilities,
http://www.globalccsinstitute.com/projects/large-scale-ccs-projects 43 Queensland Government (2018) ZeroGen Project,
https://www.statedevelopment.qld.gov.au/assessments-and-approvals/zerogen-project.html 44 Global CCS Institute (2018) Large-scale CCS facilities,
http://www.globalccsinstitute.com/projects/large-scale-ccs-projects
Sunk costs 26
It is unclear whether [the two CCS projects] can achieve this timeframe, as
progress on both projects has been slow.45
Since then, there has been no indication that the projects are now on track.46
Australia’s pathway to accelerated deployment of CCS
Australia has no commercial-scale CCS at its power plants, and no plans to build any.
As such, it will not meet the 10,000 GWh in 2020 target.
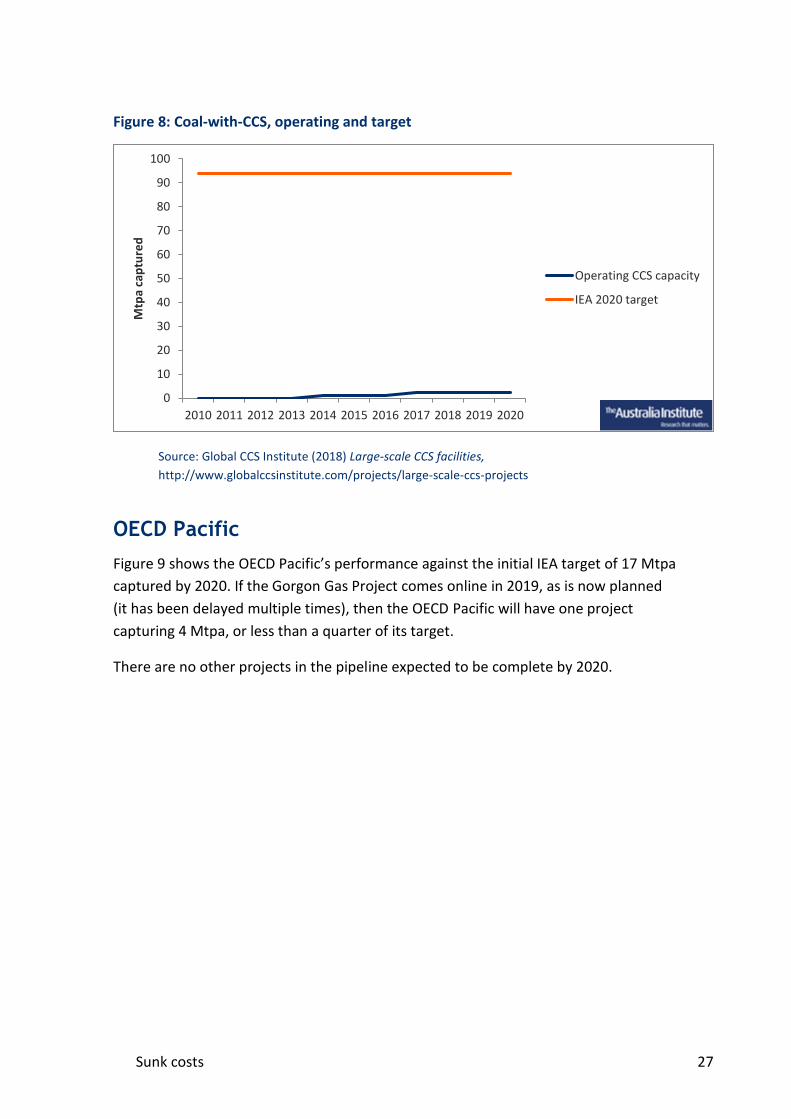
Coal
Figure 8 shows coal’s performance against the initial IEA target of 94 Mtpa captured by
2020. It shows 2.4 Mtpa captured in 2020, or 3% of the target. This reflects the
Boundary Dam Power Station project coming online in 2014 and the Petra Nova
project operating from 2017. This estimate is optimistic because Boundary Dam is
operating significantly below capacity.
There are no other projects in the pipeline that could be complete by 2020.
45 Van Puyvelde (2016) What about Carbon Capture and Storage?,
http://www.energynetworks.com.au/news/energy-insider/what-about-carbon-capture-and-
storage#_ftn1 46 See for example: WA Department of Industry, Innovation and Science (2015) Carbon Capture and
Storage Flagship South West Hub Project: Review report,
https://industry.gov.au/resource/LowEmissionsFossilFuelTech/Documents/CCS-western-australian-
south-west-hub-project-review-report.pdf; Victoria Earth Resources (n.d.) The CarbonNet Project,
http://earthresources.vic.gov.au/earth-resources/victorias-earth-resources/carbon-storage/the-
carbonnet-project
Sunk costs 27
Figure 8: Coal-with-CCS, operating and target
Source: Global CCS Institute (2018) Large-scale CCS facilities,
http://www.globalccsinstitute.com/projects/large-scale-ccs-projects
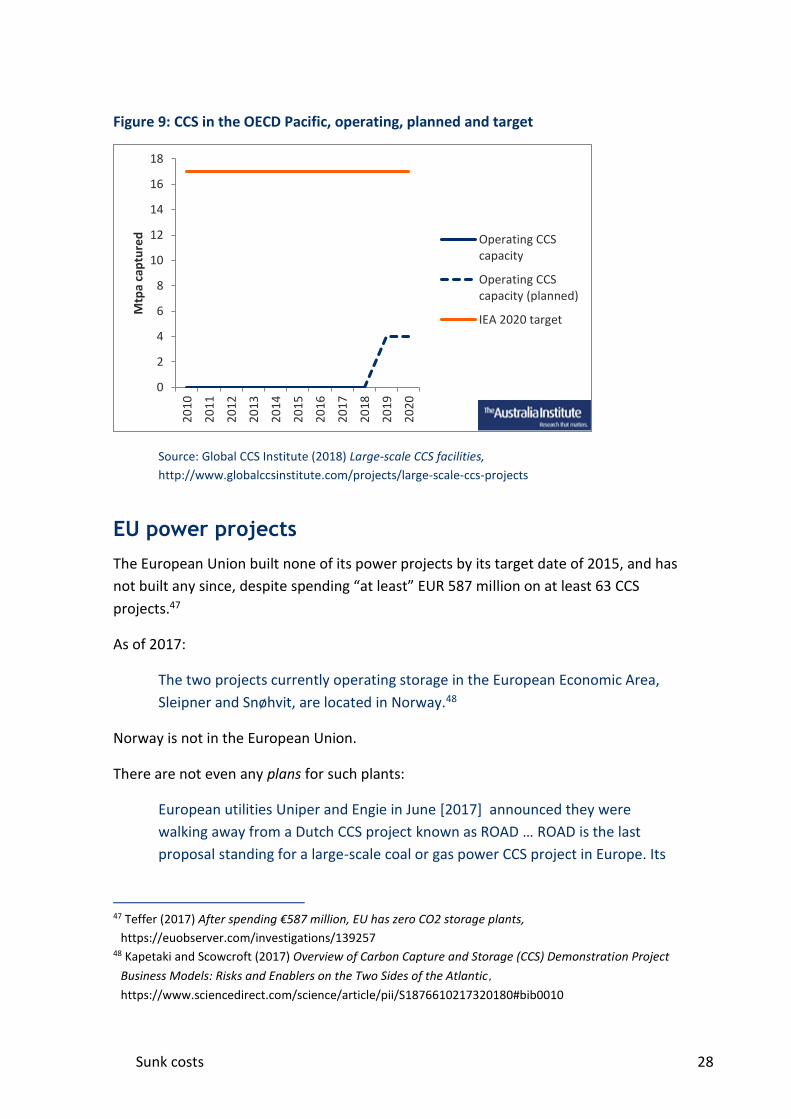
OECD Pacific
Figure 9 shows the OECD Pacific’s performance against the initial IEA target of 17 Mtpa
captured by 2020. If the Gorgon Gas Project comes online in 2019, as is now planned
(it has been delayed multiple times), then the OECD Pacific will have one project
capturing 4 Mtpa, or less than a quarter of its target.
There are no other projects in the pipeline expected to be complete by 2020.
0
10
20
30
40
50
60
70
80
90
100
2010 2011 2012 2013 2014 2015 2016 2017 2018 2019 2020
Mtp
a ca
ptu
red
Operating CCS capacity
IEA 2020 target
Sunk costs 28
Figure 9: CCS in the OECD Pacific, operating, planned and target
Source: Global CCS Institute (2018) Large-scale CCS facilities,
http://www.globalccsinstitute.com/projects/large-scale-ccs-projects
EU power projects
The European Union built none of its power projects by its target date of 2015, and has
not built any since, despite spending “at least” EUR 587 million on at least 63 CCS
projects.47
As of 2017:
The two projects currently operating storage in the European Economic Area,
Sleipner and Snøhvit, are located in Norway.48
Norway is not in the European Union.
There are not even any plans for such plants:
European utilities Uniper and Engie in June [2017] announced they were
walking away from a Dutch CCS project known as ROAD … ROAD is the last
proposal standing for a large-scale coal or gas power CCS project in Europe. Its
47 Teffer (2017) After spending €587 million, EU has zero CO2 storage plants,
https://euobserver.com/investigations/139257 48 Kapetaki and Scowcroft (2017) Overview of Carbon Capture and Storage (CCS) Demonstration Project
Business Models: Risks and Enablers on the Two Sides of the Atlantic,
https://www.sciencedirect.com/science/article/pii/S1876610217320180#bib0010
0
2
4
6
8
10
12
14
16
18
20
10
20
11
20
12
20
13
20
14
20
15
20
16
20
17
20
18
20
19
20
20
Mtp
a ca
ptu
red Operating CCS
capacity
Operating CCScapacity (planned)
IEA 2020 target

Sunk costs 29
demise followed cancellation of CCS funding in Britain, ending prospects for a
European commercial-scale demonstration power plant.49
There is still some room for industrial CCS, with a few such projects under
consideration.50
49 Wynn (2017) The carbon-capture dream is dying, http://energypost.eu/the-carbon-capture-dream-is-
dying/ 50 Wynn (2017) The carbon-capture dream is dying, http://energypost.eu/the-carbon-capture-dream-is-
dying/
Sunk costs 30
Conclusion
The IPCC said in 2000 that by 2020 CCS would have the potential to capture between
2,600 and 4,900 Mtpa of CO2.
CCS will not have the potential to capture 2,600 Mtpa of CO2 by 2020.
The G8 said in 2008 that the world will need to build 20 new large-scale CCS projects
by 2020 to enable the broad deployment of CCS.
The world will not build 20 new CCS projects by 2020.
The IEA said in 2009 that the world will need to build 100 large-scale CCS projects
capturing 255 Mtpa by 2020 to make CCS a viable technology.
The world will not build 100 large-scale projects by 2020; it will not capture 255 Mtpa.
In 2013, the IEA revised its target to 34 large-scale projects capturing 50 Mtpa by 2020.
The world will not build 34 large-scale projects by 2020; it will not capture 50 Mtpa.
The IEA said in 2017 that CCS would have to capture 400 Mtpa by 2025 to be doing its
bit to keeping global warming below 2 degrees Celsius.
CCS will not capture 400 Mtpa by 2025.
The Australian Coal Association said we would have large-scale projects by 2015.
Australia did not complete any large-scale projects by 2015.
Australia’s CCS storage projects were meant to be completed by 2015, then 2020.
Our storage projects were not completed by 2015; they will not be completed by 2020.
The EU was going to demonstrate CCS viability by building 12 power projects by 2015.
The EU did not build any power projects.
Carbon capture and storage has missed every target that involved getting projects up
and running, and it is on track to miss every future target. The sector has never
delivered.
Sunk costs 31
Appendix
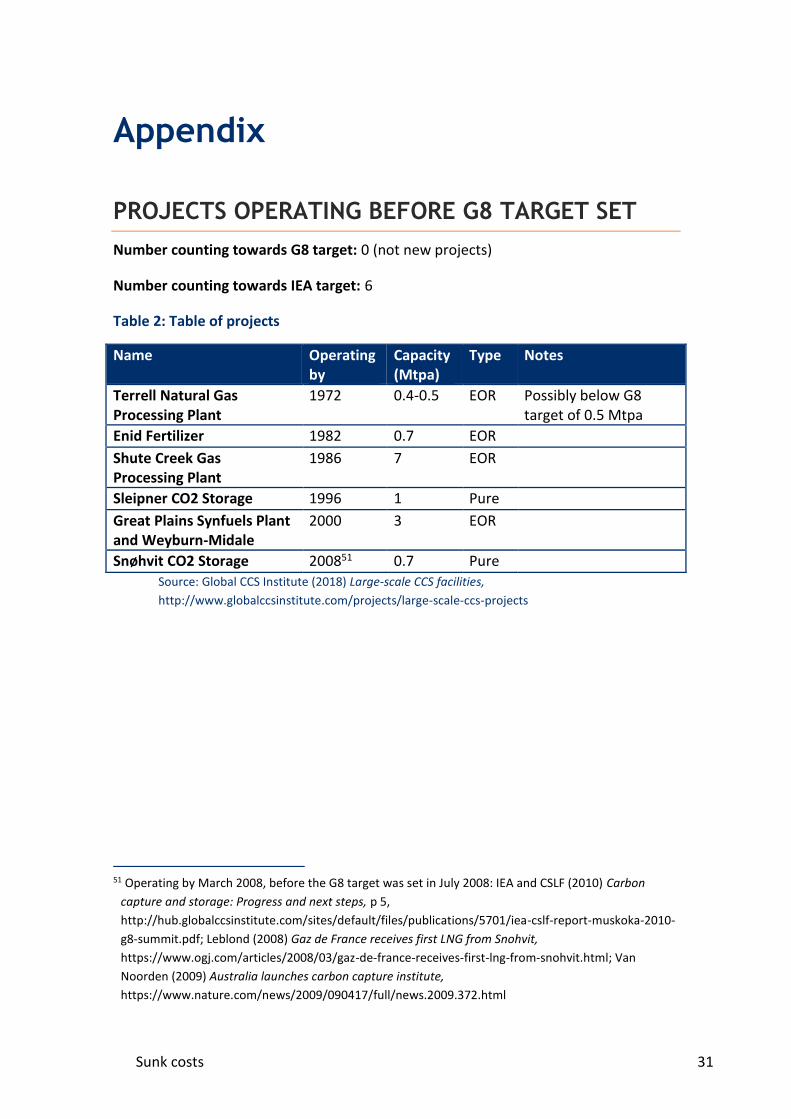
PROJECTS OPERATING BEFORE G8 TARGET SET
Number counting towards G8 target: 0 (not new projects)
Number counting towards IEA target: 6
Table 2: Table of projects
Name Operating by
Capacity (Mtpa)
Type Notes
Terrell Natural Gas Processing Plant
1972 0.4-0.5 EOR Possibly below G8 target of 0.5 Mtpa
Enid Fertilizer 1982 0.7 EOR
Shute Creek Gas Processing Plant
1986 7 EOR
Sleipner CO2 Storage 1996 1 Pure
Great Plains Synfuels Plant and Weyburn-Midale
2000 3 EOR
Snøhvit CO2 Storage 200851 0.7 Pure Source: Global CCS Institute (2018) Large-scale CCS facilities,
http://www.globalccsinstitute.com/projects/large-scale-ccs-projects
51 Operating by March 2008, before the G8 target was set in July 2008: IEA and CSLF (2010) Carbon
capture and storage: Progress and next steps, p 5,
http://hub.globalccsinstitute.com/sites/default/files/publications/5701/iea-cslf-report-muskoka-2010-
g8-summit.pdf; Leblond (2008) Gaz de France receives first LNG from Snohvit,
https://www.ogj.com/articles/2008/03/gaz-de-france-receives-first-lng-from-snohvit.html; Van
Noorden (2009) Australia launches carbon capture institute,
https://www.nature.com/news/2009/090417/full/news.2009.372.html
Sunk costs 32
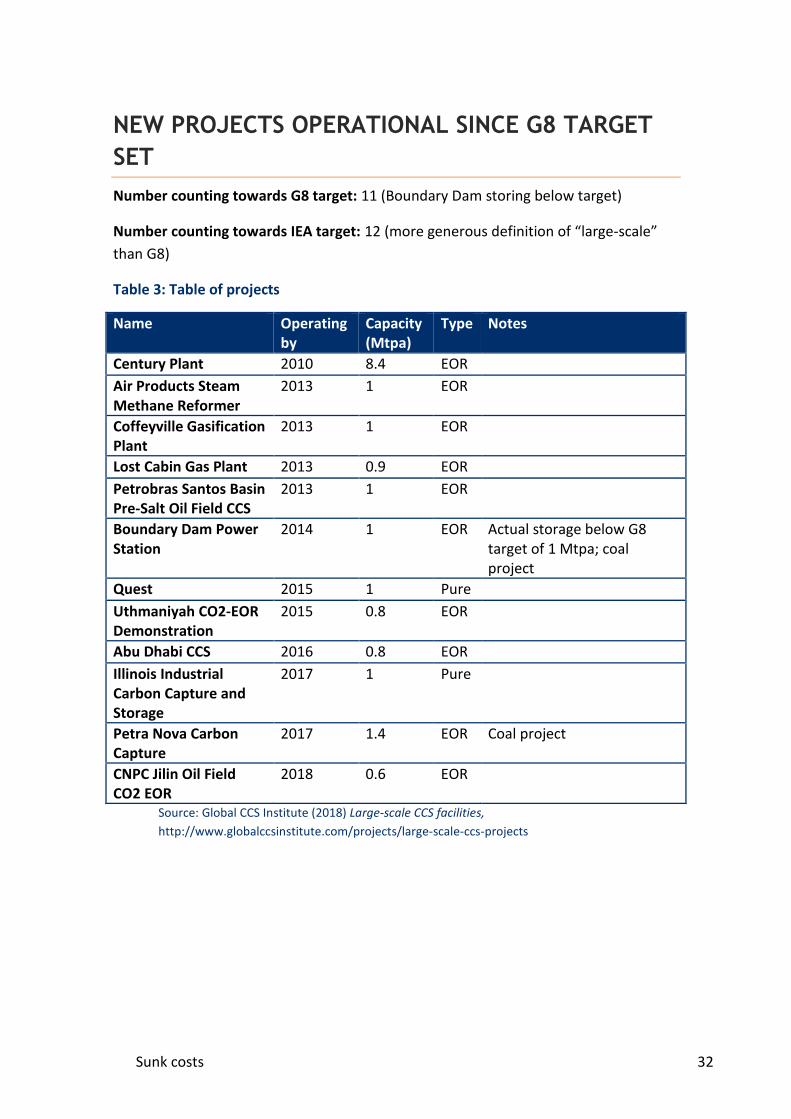
NEW PROJECTS OPERATIONAL SINCE G8 TARGET
SET
Number counting towards G8 target: 11 (Boundary Dam storing below target)
Number counting towards IEA target: 12 (more generous definition of “large-scale”
than G8)
Table 3: Table of projects
Name Operating by
Capacity (Mtpa)
Type Notes
Century Plant 2010 8.4 EOR
Air Products Steam Methane Reformer
2013 1 EOR
Coffeyville Gasification Plant
2013 1 EOR
Lost Cabin Gas Plant 2013 0.9 EOR
Petrobras Santos Basin Pre-Salt Oil Field CCS
2013 1 EOR
Boundary Dam Power Station
2014 1 EOR Actual storage below G8 target of 1 Mtpa; coal project
Quest 2015 1 Pure
Uthmaniyah CO2-EOR Demonstration
2015 0.8 EOR
Abu Dhabi CCS 2016 0.8 EOR
Illinois Industrial Carbon Capture and Storage
2017 1 Pure
Petra Nova Carbon Capture
2017 1.4 EOR Coal project
CNPC Jilin Oil Field CO2 EOR
2018 0.6 EOR
Source: Global CCS Institute (2018) Large-scale CCS facilities,
http://www.globalccsinstitute.com/projects/large-scale-ccs-projects
Sunk costs 33
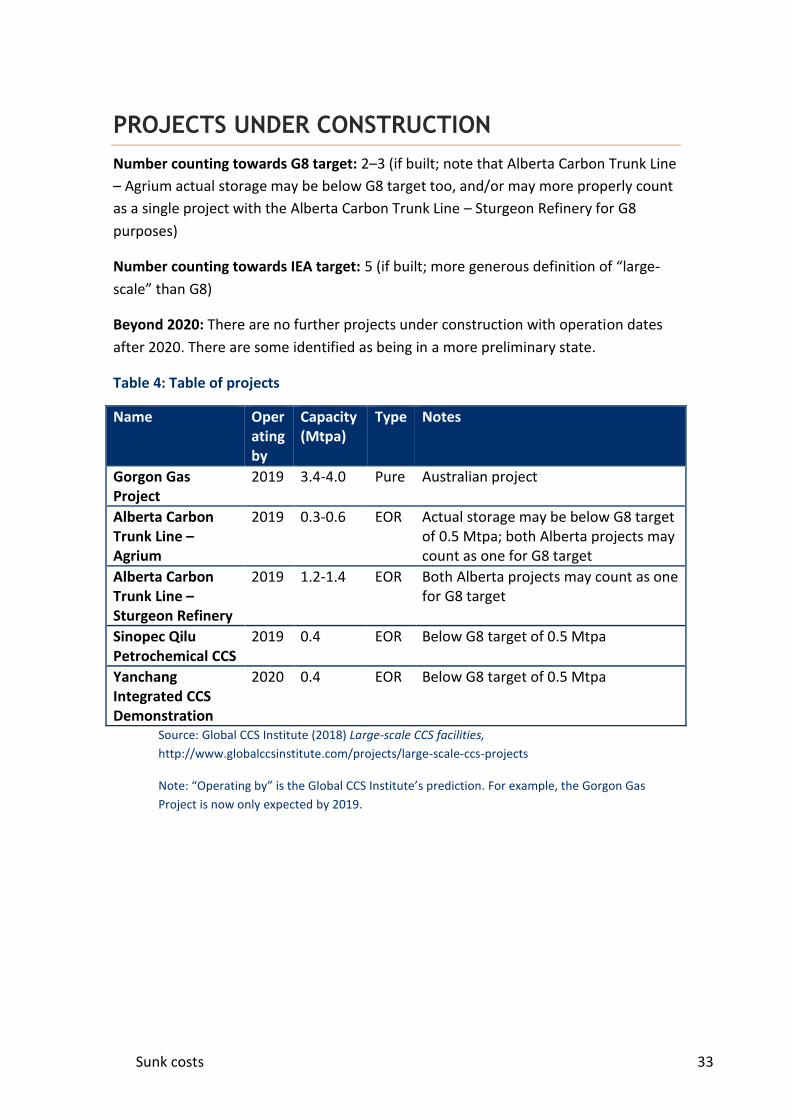
PROJECTS UNDER CONSTRUCTION
Number counting towards G8 target: 2–3 (if built; note that Alberta Carbon Trunk Line
– Agrium actual storage may be below G8 target too, and/or may more properly count
as a single project with the Alberta Carbon Trunk Line – Sturgeon Refinery for G8
purposes)
Number counting towards IEA target: 5 (if built; more generous definition of “large-
scale” than G8)
Beyond 2020: There are no further projects under construction with operation dates
after 2020. There are some identified as being in a more preliminary state.
Table 4: Table of projects
Name Operating by
Capacity (Mtpa)
Type Notes
Gorgon Gas Project
2019 3.4-4.0 Pure Australian project
Alberta Carbon Trunk Line – Agrium
2019 0.3-0.6 EOR Actual storage may be below G8 target of 0.5 Mtpa; both Alberta projects may count as one for G8 target
Alberta Carbon Trunk Line – Sturgeon Refinery
2019 1.2-1.4 EOR Both Alberta projects may count as one for G8 target
Sinopec Qilu Petrochemical CCS
2019 0.4 EOR Below G8 target of 0.5 Mtpa
Yanchang Integrated CCS Demonstration
2020 0.4 EOR Below G8 target of 0.5 Mtpa
Source: Global CCS Institute (2018) Large-scale CCS facilities,
http://www.globalccsinstitute.com/projects/large-scale-ccs-projects
Note: “Operating by” is the Global CCS Institute’s prediction. For example, the Gorgon Gas
Project is now only expected by 2019.
Recommended