2017
AUTONOME PROVINZ
BOZEN - SÜDTIROL
PROVINCIA AUTONOMA
DI BOLZANO - ALTO ADIGE
Istituto provinciale di statisticaLandesinstitut für Statistik
AUTONOMOUS PROVINCE OF SOUTH TYROL
Provincial Statistics Institute
SouthTyrol infigures

General preliminary notes
SIGNS
Signs used in the tables of this publication:
Hyphen (-): a) the attribute doesn’t exist
b) the attribute exists and has been collected, but it doesn’t occur.
Four dots (….): the attribute exists, but its frequency is unknown for various reasons.
Two dots (..): Value which differs from zero but doesn’t reach 50% of the lowest unitthat may be shown in the table.
ABBREVIATIONS
Abbreviations among the table sources: ASTAT: Provincial Statistics Institute ISTAT: National Statistics Institute
ROUNDINGS
Usually the values are rounded without considering the sum. Therefore may be minordifferences between the summation of the single values and their sum in the table. Thisapplies mainly to percentages and monetary values.
PRELIMINARY AND RECTIFIED DATA
Recent data is to be considered preliminary. They will be rectified in future editions. Valuesof older publications which differ from the data in the actual edition have been rectified.

© Copyright:
Autonomous Province of South Tyrol Provincial Statistics Institute - ASTAT
Bozen / Bolzano 2018
Orders are available from:
ASTAT Via Kanonikus-Michael-Gamper-Str. 1 I-39100 Bozen / Bolzano
Tel. 0471 41 84 04 Fax 0471 41 84 19
For further information please contact:
Statistische Informationsstelle / Centro d’informazione statistica
Tel. 0471 41 84 04
The tables of this publication are www.provinz.bz.it/astat
also to be found in internet at www.provincia.bz.it/astat E-mail: [email protected]
Reproduction and reprinting of tables and charts, even partial, is only allowed if the source is cited (title and publisher).
Editor: Gregorio Gobbi Maria Alessandra Fasoli
Layout and graphics: Raimund Lantschner Renata Stauder
Translation: ASTAT
Source of data:
Data was mainly taken from official statistics sources which are partly directly collected by theProvincial Statistics Institute (ASTAT) and partly acquired from various ISTAT publications.
The following public bodies also provided data: Provincial Hydrographic Department, ProvincialHospital Department, Local Education Authority, Bilingual Examination Secretariat, Chamber of Commerce, SIAE, Provincial Employment Office, Provincial Agricultural Division, ProvincialForestry Division, Provincial Department of Industry, ENEL, Provincial Cablecar Department,Telecom, RAI, Banca d'Italia, Autonomous Province of Trento.
ASTAT accepts full responsibilty for the data and its evaluation.
C o n t e n t s
astat: South Tyrol in figures 2017 page 3
Page
T e r r i t o r y a n d e n v i r o n m e n t
1 Surface area by altitude 6
2 Municipalities grouped by surface area - 2016 6
3 Surface area by land use - 2000 7
4 Climate - 2016 7
P o p u l a t i o n a n d s o c i e t y
5 Demographic development in South Tyrol and in its main urban centres - 1754-2011 8
6 Surface area, resident population and population density in South Tyroleandistricts - 31.12.2016 9
7 Resident population of the municipalities and districts in 2016, 2011 and 2001 10
8 Municipalities and resident population by population size groups - 31.12.2016 14
9 Declarations of which language group belong to/affiliated to - Population Cen-sus 2011 15
10 Percentage composition of the three official language groups (based on the declarations made during the Population Census 2011) by municipality 16
11 Resident population by language group according to the Population Censusesfrom 1880 to 2011 19
12 Natural population change - 2014-2016 20
13 Average life expectancy at birth - 2016 20
14 Marriages, separations and divorces - 2014-2016 21
15 Immigration and emigration by source and destination area - 2015 22
16 Households by number of members - 2011 and 2016 23
17 Deaths by causes of death - 2016 23
18 Hospitals, number and bed utilisation rate - 2016 24
19 Legally induced abortions - 2014-2016 24
20 Suicides - 2012-2016 24
21 Schools: number of classes and enrolled students by teaching language -School year 2016/17 25
22 Resident population aged 15 and over by sex and educational level - 2001 and 2011 26
23 Tests of bilingual ability by sex and test level - 2016 26

C o n t e n t s
4 page astat: South Tyrol in figures 2017
Page
24 Museums by type, opening hours and number of visitors - 2016 27
25 Numbers employed by activity sector and sex - 2016 27
26 Unemployment - 2014-2016 28
27 Housing units - Population Census 1981, 1991, 2001 and 2011 29
28 Monthly household consumption by category - 2016 30
E c o n o m y a n d b u s i n e s s
29 Local units and employees by activity sector - 2001 and 2011 31
30 Inflation rates in Bozen / Bolzano, Trento and Italy - 2014-2016 32
31 Use and resources of goods and services - 2013-2015 32
32 Gross and net value-added at basic prices and gross domestic product atmarket prices - 2013-2015 33
33 Per capita values of some economic aggregates in South Tyrol and Italy - 2016 34
34 Farm holdings and holding surface area by land use - 2010 35
35 Farm holdings and livestock population by livestock type - 2010 35
36 Agricultural production by crop type - 2014-2016 36
37 Wine grape harvest - 2015 and 2016 36
38 Apple harvest by variety - 2015 and 2016 37
39 Forestry production by type of wood and utilisation - 2014-2016 38
40 Mining production - 2014-2016 38
41 Electricity production and consumption - 2015 and 2016 39
42 Collected building permits - 2014-2016 39
43 Trade with foreign countries - 2000-2016 40
44 Accommodation capacity, arrivals and overnight stays - 2014-2016 41
45 Traffic network - 2017 42
46 Vehicles registered in the Public Vehicle Register (PRA) per type of vehicle - 2016 42
47 Road accidents and people injured - 2014-2016 43
48 Cableways by category - 2014-2016 43
49 TV subscriptions - 1965-2014 44
50 Deposits, loans, number of banks and customer service - 2014-2016 44

C o n t e n t s
astat: South Tyrol in figures 2017 page 5
Page
P u b l i c a d m i n i s t r a t i o n a n d j u s t i c e
51 Civil servants by administration - 2015 and 2016 45
52 Consolidated expenditure of local public administration by functional classifica-tion - 2014 and 2015 46
53 Declared bankruptcies by activity sector - 2014-2016 47
54 Protests - 2014 and 2015 47
55 Reported crimes leading to prosecution - 2016 47
C h a r t s
1 Demographic development in South Tyrol and in its main urban centres - 1869-2011 8
2 Birth rate, mortality rate and marriage rate - 1950-2016 21
3 Migration balance by source and destination area - 2015 22
4 Students of nursery, primary, lower and upper secondary schools - school years 1970/71-2016/17 25
5 Numbers employed by activity sector and sex - 2016 28
6 Agricultural holdings by livestock type - 2010 34
7 Apple harvest - 2016 37
8 Local administration civil servants - 2016 45
T e r r i t o r y a n d e n v i r o n m e n t
6 page astat: South Tyrol in figures 2017
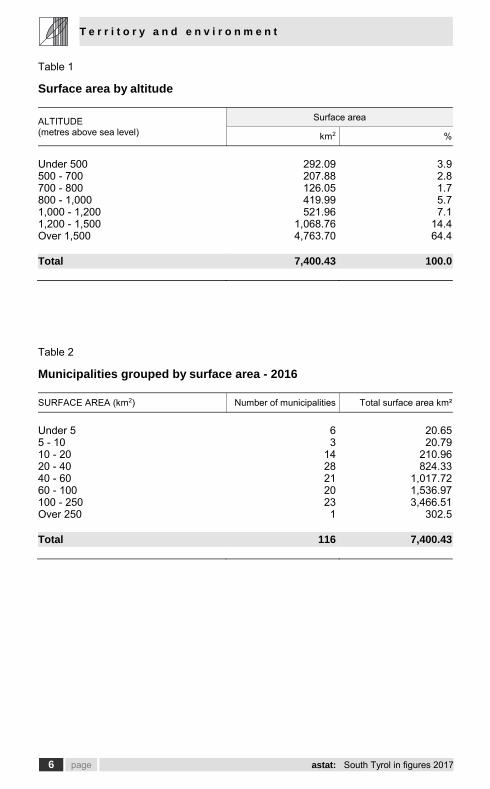
Table 1
Surface area by altitude
ALTITUDE (metres above sea level)
Surface area
km2 %
Under 500 292.09 3.9 500 - 700 207.88 2.8 700 - 800 126.05 1.7 800 - 1,000 419.99 5.7 1,000 - 1,200 521.96 7.1 1,200 - 1,500 1,068.76 14.4 Over 1,500 4,763.70 64.4 Total 7,400.43 100.0 Table 2
Municipalities grouped by surface area - 2016 SURFACE AREA (km2) Number of municipalities Total surface area km²
Under 5 6 20.65 5 - 10 3 20.79 10 - 20 14 210.96 20 - 40 28 824.33 40 - 60 21 1,017.72 60 - 100 20 1,536.97 100 - 250 23 3,466.51 Over 250 1 302.5 Total 116 7,400.43

T e r r i t o r y a n d e n v i r o n m e n t
astat: South Tyrol in figures 2017 page 7
Table 3
Surface area by land use - 2000
TYPE OF LAND USE Surface area
km2 %
Agricultural land in use 2,670 36.1 Forest 2,920 39.5 Agricultural and forest land not in use 145 2.0 Unproductive land 1,665 22.5 Total 7,400 100.0
Source: ISTAT, elaborated by ASTAT Table 4
Climate - 2016
WEATHER STATIONS
Heightabove sea
level m
Mean air temperature - °C
Rainfall
Normal 2016Normal
mm2016mm
2016 days
St.Valentin auf der Haide (Graun i.V.) S.Valentino alla Muta (Curon Venosta)
1,499 4.4 5.6 616.0 648.9 98
Schlanders Silandro
698 9.9 10.7 498.3 542.9 79
St.Leonhard in Pass. S.Leonardo in Pass.
644 10.1 11.3 1,052.9 1.091.3 93
Meran Merano
333 11.7 12.0 716.5 838.6 97
Sterzing Vipiteno
948 8.0 8.5 773.3 701.1 93
St.Magdalena in Gsies S.Maddalena in Casies
1,398 6.1 5.5 871.4 916.2 103
Brixen Bressanone
590 10.0 10.5 666.5 809.0 90
Bozen Bolzano
254 12.3 13.0 715.8 709.0 81

P o p u l a t i o n a n d s o c i e t y
8 page astat: South Tyrol in figures 2017
Table 5
Demographic development in South Tyrol and in its main urban centres- 1754-2011
YEAR Total South TyrolBozen
BolzanoMeran
MeranoBrixen
Bressanone
1754 163,000 .... .... .... 1837 183,727 10,499 .... .... 1869 196,686 14,941 7,142 7,399 1880 205,306 17,441 9,812 7,849 1890 210,285 19,242 13,552 8,534
1900 222,793 23,521 18,544 8,882 1910 251,451 30,424 23,640 10,049 1921 256,610 32,679 21,177 10,424 1931 282,158 37,351 25,196 11,659 1936 298,290 45,505 25,611 11,242
1951 333,900 70,898 27,908 11,797 1961 373,863 88,799 30,614 13,456 1971 414,041 105,757 33,235 16,017 1981 430,568 105,180 33,711 16,101 1991 440,508 98,158 33,504 16,992
2001 462,999 94,989 33,656 18,359
2011 504,643 102,575 37,368 20,677

P o p u l a t i o n a n d s o c i e t y
astat: South Tyrol in figures 2017 page 9
Table 6
Surface area, resident population and population density in South Tyro-lean districts - 31.12.2016 Surface area km2 Resident population Inhabitants per km2
Districts
Vinschgau Val Venosta
1,441.68 35,651 25
Burggrafenamt Burgraviato
1,100.73 102,556 93
Überetsch-Südt. Unterland Oltradige-Bassa Atesina
423.60 74,938 177
Bozen Bolzano
52.34 106,951 2,043
Salten-Schlern Salto-Sciliar
1,036.63 49,661 48
Eisacktal Valle Isarco
623.78 52,269 84
Wipptal Alta Valle Isarco
650.01 20,195 31
Pustertal Val Pusteria
2,071.66 82,035 40
Statistical areas
Meran-Schlanders Merano-Silandro
2,530.07 136,232 54
Bozen Bolzano
1,588.96 238,078 150
Brixen-Sterzing Bressanone-Vipiteno
1,320.27 71,228 54
Bruneck Brunico
1,961.13 78,718 40
Ladin valleys 511.13 20,359 40 Total South Tyrol 7,400.43 524,256 71

P o p u l a t i o n a n d s o c i e t y
10 page astat: South Tyrol in figures 2017
Table 7
Resident population of the municipalities and districts in 2016, 2011 and 2001
MUNICIPALITIES Resident
population
31.12.2016
Resident population
PC 2011
Resident population
PC 2001
001 Aldein / Aldino 1,664 1,651 1,656 002 Andrian / Andriano 1,029 1,035 794 003 Altrei / Anterivo 396 383 387 004 Eppan a.d. Weinstr. / Appiano s.s.d.v. 14,900 13,988 12,657 005 Hafling / Avelengo 763 739 709
006 Abtei / Badia / Badia 3,483 3,360 3,015 007 Barbian / Barbiano / Perbian 1,699 1,596 1,520 008 Bozen / Bolzano / Bulsan-Balsan 106,951 102,575 94,989 009 Prags / Braies / Braies 650 672 633 010 Brenner / Brennero / Prëner 2,190 2,087 2,066
011 Brixen / Bressanone / Persenon-Porsenù 21,688 20,677 18,359 012 Branzoll / Bronzolo 2,791 2,628 2,293 013 Bruneck / Brunico / Burnech-Bornech 16,356 15,397 13,618 014 Kuens / Caines 403 413 318 015 Kaltern a.d. Weinstr. / Caldaro s.s.d.v. 8,004 7,660 6,852
016 Freienfeld / Campo di Trens 2,668 2,671 2,458 017 Sand in Taufers / Campo Tures 5,390 5,272 4,880 018 Kastelbell-Tschars / Castelbello-Ciardes 2,301 2,378 2,328 019 Kastelruth / Castelrotto / Ciastel-Ćiastel 6,872 6,459 5,994 020 Tscherms / Cermes 1,556 1,411 1,228
021 Kiens / Chienes 2,806 2,695 2,641 022 Klausen / Chiusa / Tluses-Tlüses 5,211 5,144 4,613 023 Karneid / Cornedo all'Isarco 3,361 3,312 3,113 024 Kurtatsch a.d. Weinstr. / Cortaccia s.s.d.v. 2,226 2,228 2,085 025 Kurtinig a.d. Weinstr. / Cortina s.s.d.v. 653 656 594
026 Corvara / Corvara i.B. / Curvea-Corvara 1,369 1,320 1,266 027 Graun im Vinschgau / Curon Venosta 2,376 2,423 2,379 028 Toblach / Dobbiaco 3,360 3,314 3,240 029 Neumarkt / Egna 5,257 4,992 4,339 030 Pfalzen / Falzes 2,761 2,668 2,255
031 Völs am Schlern / Fié allo Sciliar / Fíe 3,571 3,451 3,038 032 Franzensfeste / Fortezza 1,009 970 892 033 Villnöß / Funes / Funes 2,593 2,571 2,379 034 Gais / Gais 3,237 3,167 2,865 035 Gargazon / Gargazzone 1,702 1,665 1,366
036 Glurns / Glorenza 888 889 883 037 Latsch / Laces 5,221 5,126 4,870 038 Algund / Lagundo 5,042 4,873 4,169 039 Lajen / Laion / Laion-Laiun 2,656 2,619 2,261 040 Leifers / Laives 17,780 16,909 15,069

P o p u l a t i o n a n d s o c i e t y
astat: South Tyrol in figures 2017 page 11
Table 7 - continued
Resident population of the municipalities and districts in 2016, 2011 and 2001
MUNICIPALITIES Resident
population
31.12.2016
Resident population
PC 2011
Resident population
PC 2001
041 Lana / Lana 12,046 11,251 9,759 042 Laas / Lasa 3,995 3,932 3,700 043 Laurein / Lauregno 341 344 361 044 Lüsen / Luson / Lujon-Lijun 1,529 1,527 1,455 045 Margreid a.d. Weinstr. / Magré s.s.d.v. 1,290 1,281 1,181
046 Mals / Malles Venosta 5,225 5,086 4,835 047 Enneberg / Marebbe / Mareo 3,024 2,907 2,682 048 Marling / Marlengo 2,674 2,533 2,197 049 Martell / Martello 862 879 891 050 Mölten / Meltina 1,676 1,648 1,447
051 Meran / Merano / Maran 40,047 37,368 33,656 052 Welsberg-Taisten / Monguelfo-Tesido 2,892 2,797 2,528 053 Montan / Montagna 1,672 1,627 1,480 054 Moos in Passeier / Moso in Passiria 2,107 2,171 2,170 055 Nals / Nalles 1,975 1,831 1,577
056 Naturns / Naturno 5,777 5,554 5,089 057 Natz-Schabs / Naz-Sciaves 3,171 2,886 2,430 058 Welschnofen / Nova Levante 1,932 1,903 1,825 059 Deutschnofen / Nova Ponente 3,922 3,898 3,565 060 Auer / Ora 3,699 3,554 3,022
061 St.Ulrich / Ortisei / Urtijëi 4,821 4,653 4,484 062 Partschins / Parcines 3,683 3,536 3,192 063 Percha / Perca 1,522 1,460 1,313 064 Plaus / Plaus 721 692 547 065 Waidbruck / Ponte Gardena / Pruca 198 195 181
066 Burgstall / Postal 1,873 1,763 1,435 067 Prad am Stilfser Joch / Prato allo Stelvio 3,566 3,356 3,140 068 Prettau / Predoi 551 604 633 069 Proveis / Proves 263 267 288 070 Ratschings / Racines 4,447 4,389 4,010
071 Rasen-Antholz / Rasun Anterselva 2,866 2,869 2,700 072 Ritten / Renon / Renon 7,847 7,642 6,993 073 Riffian / Rifiano 1,328 1,333 1,192 074 Mühlbach / Rio di Pusteria 3,081 2,912 2,640 075 Rodeneck / Rodengo / Redant 1,198 1,195 1,157
076 Salurn / Salorno 3,793 3,533 2,938 077 Innichen / S.Candido / Sanciana-Sanćiana 3,317 3,204 3,107 079 Jenesien / S.Genesio Atesino 3,046 2,937 2,703 080 St.Leonhard in Pass. / S.Leonardo in Pass. 3,551 3,508 3,437 081 St.Lorenzen / S.Lorenzo d.S. / S.Laurënz 3,894 3,767 3,438

P o p u l a t i o n a n d s o c i e t y
12 page astat: South Tyrol in figures 2017
Table 7 - continued
Resident population of the municipalities and districts in 2016, 2011 and 2001
MUNICIPALITIES Resident
population
31.12.2016
Resident population
PC 2011
Resident population
PC 2001
082 St.Martin i.T. / S.Martino i.B. / S.Martin de Tor 1,719 1,729 1,690 083 St.Martin in Passeier / S.Martino in Passiria 3,242 3,136 2,832 084 St.Pankraz / S.Pancrazio 1,577 1,584 1,608 085 St.Christina i.G. / S.Cristina V.G. / S.Crestina 1,961 1,871 1,738 086 Sarntal / Sarentino 7,058 6,890 6,620
087 Schenna / Scena 2,918 2,838 2,677 088 Mühlwald / Selva dei Molini 1,439 1,473 1,455 089 Wolkenstein in Gröden / Selva V.G. / Sëlva 2,613 2,660 2,513 091 Schnals / Senales 1,241 1,314 1,394 092 Sexten / Sesto / Sest-Le Sest 1,915 1,937 1,906
093 Schlanders / Silandro 6,053 5,947 5,733 094 Schluderns / Sluderno 1,813 1,832 1,848 095 Stilfs / Stelvio 1,138 1,190 1,310 096 Terenten / Terento 1,747 1,733 1,572 097 Terlan / Terlano 4,359 4,139 3,579
098 Tramin a.d. Weinstr. / Termeno s.s.d.v. 3,383 3,305 3,193 099 Tisens / Tesimo 1,936 1,854 1,809 100 Tiers / Tires / Tires 981 967 884 101 Tirol / Tirolo / Tirol 2,457 2,450 2,356 102 Truden im Naturpark / Trodena nel parco nat. 1,027 1,021 957
103 Taufers im Münstertal / Tubre 972 965 949 104 Ulten / Ultimo 2,860 2,920 3,006 105 Pfatten / Vadena 1,015 1,016 842 106 Olang / Valdaora / Valdaura-Valdaora 3,144 3,110 2,797 107 Pfitsch / Val di Vizze 3,006 2,736 2,619
108 Ahrntal / Valle Aurina / Val de Turesc 5,991 5,910 5,517 109 Gsies / Valle di Casies 2,323 2,262 2,098 110 Vintl / Vandoies / Vandoies 3,317 3,251 3,108 111 Vahrn / Varna 4,523 4,253 3,577 112 Vöran / Verano 945 929 880
113 Niederdorf / Villabassa 1,593 1,479 1,308 114 Villanders / Villandro / Olaneres 1,849 1,893 1,830 115 Sterzing / Vipiteno 6,875 6,390 5,785 116 Feldthurns / Velturno 2,873 2,742 2,541 117 Wengen / La Valle / La Val 1,369 1,299 1,232 118 U.L.Frau i.W.-St.Felix / Senale-S.Felice 769 782 787
Total South Tyrol 524,256 504,643 462,999
PC = Population Census

P o p u l a t i o n a n d s o c i e t y
astat: South Tyrol in figures 2017 page 13
Table 7 - continued
Resident population of the municipalities and districts in 2016, 2011 and 2001
MUNICIPALITIES Resident
population
31.12.2016
Resident population
PC 2011
Resident population
PC 2001
Districts
Vinschgau Val Venosta
35,651 35,317 34,260
Burggrafenamt Burgraviato
102,556 97,745 88,645
Überetsch-Südt. Unterland Oltradige-Bassa Atesina
74,938 71,606 63,918
Bozen Bolzano
106,951 102,575 94,989
Salten-Schlern Salto-Sciliar
49,661 48,291 44,917
Eisacktal Valle Isarco
52,269 50,210 44,943
Wipptal Alta Valle Isarco
20,195 19,243 17,830
Pustertal Val Pusteria
82,035 79,656 73,497
Statistical areas
Meran-Schlanders Merano-Silandro
136,232 131,231 121,328
Bozen Bolzano
238,078 228,713 209,363
Brixen-Sterzing Bressanone-Vipiteno
71,228 68,294 61,919
Bruneck Brunico
78,718 76,405 70,389
Ladin valleys 20,359 19,799 18,620 Total South Tyrol 524,256 504,643 462,999
PC = Population Census

P o p u l a t i o n a n d s o c i e t y
14 page astat: South Tyrol in figures 2017
Table 8
Municipalities and resident population by population size groups -31.12.2016
NUMBER OF INHABITANTS
Number ofmunicipalities
Resident population
Number %
Up to 1,000 16 10,356 2.0 1,001 - 2,000 32 49,362 9.4 2,001 - 3,000 20 51,951 9.9 3,001 - 5,000 27 96,996 18.5 5,001 - 10,000 14 85,823 16.4 10,001 - 25,000 5 82,770 15.8
Meran / Merano 1 40,047 7.6
Bozen / Bolzano 1 106,951 20.4 Total 116 524,256 100.0

P o p u l a t i o n a n d s o c i e t y
astat: South Tyrol in figures 2017 page 15
Table 9
Declarations of which language group belong to/affiliated to - Popula-tion Census 2011
LANGUAGE GROUPS Declarations ofwhich languagegroup belong to
Declarations ofwhich language
group affiliated to
Total Valid
Declarations
Absolute values
Italian 115,161 2,959 118,120 German 310,360 4,244 314,604 Ladin 20,126 422 20,548 Total 445,647 7,625 453,272
Percentage composition by type of declaration
Italian 97.49 2.51 100.00 German 98.65 1.35 100.00 Ladin 97.95 2.05 100.00 Total 98.32 1.68 100.00
Percentage composition by language group
Italian 25.84 38.81 26.06 German 69.64 55.66 69.41 Ladin 4.52 5.53 4.53 Total 100.00 100.00 100.00

P o p u l a t i o n a n d s o c i e t y
16 page astat: South Tyrol in figures 2017
Table 10
Percentage composition of the three official language groups (based onthe declarations made during the Population Census 2011) by munici-pality
MUNICIPALITIES Percentage composition
Italian German Ladin
001 Aldein / Aldino 1.74 98.07 0.19 002 Andrian / Andriano 9.53 89.96 0.51 003 Altrei / Anterivo 12.20 87.80 - 004 Eppan a.d. Weinstr. / Appiano s.s.d.v. 13.29 86.23 0.48 005 Hafling / Avelengo 2.42 97.58 -
006 Abtei / Badia / Badia 4.17 1.76 94.07 007 Barbian / Barbiano / Perbian 1.87 97.53 0.60 008 Bozen / Bolzano / Bulsan-Balsan 73.80 25.52 0.68 009 Prags / Braies / Braies 0.61 99.23 0.15 010 Brenner / Brennero / Prëner 18.64 80.86 0.50
011 Brixen / Bressanone / Persenon-Porsenù 25.84 72.82 1.34 012 Branzoll / Bronzolo 62.01 37.34 0.65 013 Bruneck / Brunico / Burnech-Bornech 15.24 82.47 2.29 014 Kuens / Caines 3.47 96.28 0.25 015 Kaltern a.d. Weinstr. / Caldaro s.s.d.v. 7.03 92.61 0.36
016 Freienfeld / Campo di Trens 3.79 95.85 0.36 017 Sand in Taufers / Campo Tures 2.30 97.34 0.36 018 Kastelbell-Tschars / Castelbello-Ciardes 1.28 98.72 - 019 Kastelruth / Castelrotto / Ciastel-Ćiastel 3.69 80.94 15.37 020 Tscherms / Cermes 4.86 94.92 0.23
021 Kiens / Chienes 2.32 96.73 0.95 022 Klausen / Chiusa / Tluses-Tlüses 7.88 91.30 0.81 023 Karneid / Cornedo all'Isarco 10.64 89.03 0.33 024 Kurtatsch a.d. Weinstr. / Cortaccia s.s.d.v. 3.36 96.25 0.38 025 Kurtinig a.d. Weinstr. / Cortina s.s.d.v. 31.15 68.67 0.17
026 Corvara / Corvara i.B. / Curvea-Corvara 6.84 3.46 89.70 027 Graun im Vinschgau / Curon Venosta 2.66 97.34 - 028 Toblach / Dobbiaco 15.58 84.10 0.32 029 Neumarkt / Egna 36.89 62.70 0.42 030 Pfalzen / Falzes 2.36 96.25 1.39
031 Völs am Schlern / Fié allo Sciliar / Fíe 4.46 94.92 0.62 032 Franzensfeste / Fortezza 38.51 59.63 1.86 033 Villnöß / Funes / Funes 1.99 97.69 0.32 034 Gais / Gais 2.65 97.05 0.29 035 Gargazon / Gargazzone 20.33 78.68 0.99
036 Glurns / Glorenza 3.87 96.13 - 037 Latsch / Laces 1.97 97.99 0.04 038 Algund / Lagundo 14.58 85.17 0.25 039 Lajen / Laion / Laion-Laiun 3.93 89.93 6.14 040 Leifers / Laives 71.50 27.99 0.51

P o p u l a t i o n a n d s o c i e t y
astat: South Tyrol in figures 2017 page 17
Table 10 - continued
Percentage composition of the three official language groups (based onthe declarations made during the Population Census 2011) by munici-pality
MUNICIPALITIES Percentage composition
Italian German Ladin
041 Lana / Lana 7.90 91.84 0.26 042 Laas / Lasa 1.67 98.09 0.24 043 Laurein / Lauregno 3.29 96.71 - 044 Lüsen / Luson / Lujon-Lijun 1.39 97.77 0.83 045 Margreid a.d. Weinstr. / Magré s.s.d.v. 15.22 84.33 0.45
046 Mals / Malles Venosta 3.00 96.92 0.08 047 Enneberg / Marebbe / Mareo 5.02 2.89 92.09 048 Marling / Marlengo 13.41 86.41 0.17 049 Martell / Martello - 100.00 - 050 Mölten / Meltina 3.57 96.11 0.31
051 Meran / Merano / Maran 49.06 50.47 0.47 052 Welsberg-Taisten / Monguelfo-Tesido 4.57 95.08 0.35 053 Montan / Montagna 6.94 92.54 0.52 054 Moos in Passeier / Moso in Passiria 0.33 99.58 0.09 055 Nals / Nalles 8.78 90.58 0.64
056 Naturns / Naturno 3.04 96.83 0.14 057 Natz-Schabs / Naz-Sciaves 5.49 93.54 0.97 058 Welschnofen / Nova Levante 5.53 94.00 0.47 059 Deutschnofen / Nova Ponente 2.33 97.42 0.25 060 Auer / Ora 29.59 69.74 0.67
061 St.Ulrich / Ortisei / Urtijëi 6.51 9.30 84.19 062 Partschins / Parcines 3.79 95.94 0.27 063 Percha / Perca 4.29 94.86 0.84 064 Plaus / Plaus 2.42 97.58 - 065 Waidbruck / Ponte Gardena / Pruca 13.37 81.40 5.23
066 Burgstall / Postal 22.78 76.61 0.61 067 Prad am Stilfser Joch / Prato allo Stelvio 2.73 97.21 0.06 068 Prettau / Predoi 2.67 97.33 - 069 Proveis / Proves 2.29 97.71 - 070 Ratschings / Racines 2.14 97.77 0.10
071 Rasen-Antholz / Rasun Anterselva 1.16 98.40 0.44 072 Ritten / Renon / Renon 4.55 95.20 0.25 073 Riffian / Rifiano 1.85 97.76 0.39 074 Mühlbach / Rio di Pusteria 3.93 95.34 0.73 075 Rodeneck / Rodengo / Redant 0.26 99.65 0.09
076 Salurn / Salorno 61.85 37.74 0.40 077 Innichen / S.Candido / Sanciana-Sanćiana 14.64 85.06 0.30 079 Jenesien / S.Genesio Atesino 3.07 96.79 0.14 080 St.Leonhard in Pass. / S.Leonardo in Pass. 1.05 98.83 0.12 081 St.Lorenzen / S.Lorenzo d.S. / S.Laurënz 2.64 95.31 2.05

P o p u l a t i o n a n d s o c i e t y
18 page astat: South Tyrol in figures 2017
Table 10 - continued
Percentage composition of the three official language groups (based onthe declarations made during the Population Census 2011) by munici-pality
MUNICIPALITIES Percentage composition
Italian German Ladin
082 St.Martin i.T. / S.Martino i.B. / S.Martin de Tor 1.47 1.82 96.71 083 St.Martin in Passeier / S.Martino in Passiria 0.86 99.10 0.03 084 St.Pankraz / S.Pancrazio 0.96 98.84 0.19 085 St.Christina i.G. / S.Cristina V.G. / S.Crestina 4.41 4.19 91.40 086 Sarntal / Sarentino 1.82 98.07 0.10
087 Schenna / Scena 1.67 98.18 0.15 088 Mühlwald / Selva dei Molini 0.90 98.90 0.21 089 Wolkenstein in Gröden / Selva V.G. / Sëlva 5.11 5.15 89.74 091 Schnals / Senales 1.76 98.24 - 092 Sexten / Sesto / Sest-Le Sest 4.36 95.37 0.27
093 Schlanders / Silandro 5.19 94.66 0.14 094 Schluderns / Sluderno 1.20 98.80 - 095 Stilfs / Stelvio 1.54 98.46 - 096 Terenten / Terento 0.54 99.40 0.06 097 Terlan / Terlano 16.07 83.61 0.32
098 Tramin a.d. Weinstr. / Termeno s.s.d.v. 3.44 96.37 0.20 099 Tisens / Tesimo 1.96 97.71 0.34 100 Tiers / Tires / Tires 1.20 98.15 0.65 101 Tirol / Tirolo / Tirol 2.89 96.89 0.22 102 Truden im Naturpark / Trodena nel parco nat. 25.42 73.94 0.64
103 Taufers im Münstertal / Tubre 2.15 97.85 - 104 Ulten / Ultimo 0.53 99.40 0.07 105 Pfatten / Vadena 61.50 38.06 0.44 106 Olang / Valdaora / Valdaura-Valdaora 3.18 96.47 0.34 107 Pfitsch / Val di Vizze 8.94 90.98 0.08
108 Ahrntal / Valle Aurina / Val de Turesc 0.93 98.76 0.31 109 Gsies / Valle di Casies 1.62 98.29 0.09 110 Vintl / Vandoies / Vandoies 1.26 98.23 0.52 111 Vahrn / Varna 11.18 87.80 1.02 112 Vöran / Verano 2.10 97.90 -
113 Niederdorf / Villabassa 7.76 92.09 0.15 114 Villanders / Villandro / Olaneres 1.15 98.46 0.38 115 Sterzing / Vipiteno 25.95 73.64 0.41 116 Feldthurns / Velturno 0.91 98.33 0.76 117 Wengen / La Valle / La Val 0.81 1.53 97.66 118 U.L.Frau i.W.-St.Felix / Senale-S.Felice 1.05 98.95 -
Total South Tyrol 26.06 69.41 4.53

P o p u l a t i o n a n d s o c i e t y
astat: South Tyrol in figures 2017 page 19
Table 11
Resident population by language group according to the Population Censuses from 1880 to 2011 (a) YEAR Germans Italians Ladins Others (b) Total
Absolute values
1880 186,087 6,884 8,822 3,513 205,306 1890 187,100 9,369 8,954 4,862 210,285 1900 197,822 8,916 8,907 7,149 222,794 1910 223,913 7,339 9,429 10,770 251,451 1921 193,271 27,048 9,910 24,506 254,735 1961 232,717 128,271 12,594 281 373,863 1971 260,351 137,759 15,456 475 414,041 1981 279,544 123,695 17,736 9,593 430,568 1991 287,503 116,914 18,434 17,657 440,508 2001 296,461 113,494 18,736 34,308 462,999
2011 314,604 118,120 20,548 51,795 505,067
Percentage composition
1880 90.6 3.4 4.3 1.7 100.0 1890 89.0 4.5 4.3 2.3 100.0 1900 88.8 4.0 4.0 3.2 100.0 1910 89.0 2.9 3.8 4.3 100.0 1921 75.9 10.6 3.9 9.6 100.0 1961 62.2 34.3 3.4 0.1 100.0 1971 62.9 33.3 3.7 0.1 100.0 1981 64.9 28.7 4.1 2.2 100.0 1991 65.3 26.5 4.2 4.0 100.0 2001 64.0 24.5 4.0 7.4 100.0
2011 62.3 23.4 4.1 10.3 100.0
(a) Figures up to 1921 refer to the present population, whereas those of 1961, 1971 and 1981 are based on the resident population and those of 1991, 2001 as well as 2011 on the language groupdeclarations. The language analysed up to 1961 is the commonly spoken one, from 1971 to 1981it was the declaration of which language group they belonged to and in 1991, 2001 as well as 2011 the declaration of which language group they belonged to or were affiliated to.
(b) The voice “others” contains different population groups according to the year: 1880: the “locals” with a different commonly spoken language and the “non locals”; the same is
true for 1890 and 1900; 1910: Italian citizens with a different commonly spoken language and non Italian citizens; 1921: foreigners; 1961: all residents with a different commonly spoken language; 1971: all residents, who did not declare which language group they belonged to; 1981: resident Italian citizens without any valid language group declaration, as well as resident
foreigners; 1991: invalid declarations, people temporarily absent and resident foreigners; the same applies
to 2001 as well as 2011.
Source: ISTAT, Österreichisches Statistisches Zentralamt, elaborated by ASTAT

P o p u l a t i o n a n d s o c i e t y
20 page astat: South Tyrol in figures 2017
Table 12
Natural population change - 2014-2016 2014 2015 2016
Live births 5,517 5,337 5,447 per 1,000 inhabitants South Tyrol 10.7 10.3 10.4 Province of Trento 9.1 9.0 8.6 Italy 8.3 8.0 7.8 Stillbirths (a) 15 13 4 per 1,000 births South Tyrol 2.8 2.5 0.8 Province of Trento 2.7 4.1 1.9 Italy …. …. .… Deaths 4,121 4,357 4,249 per 1,000 inhabitants South Tyrol 8.0 8.4 8.1 Province of Trento 8.9 9.4 9.2 Italy 9.8 10.7 10.1 Infant deaths within 1st year of life (a) 14 13 16 per 1,000 live births South Tyrol 2.7 2.5 3.0 Province of Trento 2.1 1.9 3.4 Italy 3.1 …. .… Marriages (a) per 1,000 inhabitants 2,038 2,103 2,135 South Tyrol 3.9 4.0 4.1 Province of Trento 2.8 2.9 (b) 2.8 Italy 3.1 3.2 (b) 3.3
(a) Present population
(b) Estimate Table 13
Average life expectancy at birth - 2016Years Males Females
South Tyrol 81.1 85.9 Italy 80.6 85.0

P o p u l a t i o n a n d s o c i e t y
astat: South Tyrol in figures 2017 page 21
Table 14
Marriages, separations and divorces - 2014-2016 2014 2015 2016
Marriages 2,038 2,103 2,135 Legal separations 598 634 666 per 10,000 inhabitants 11.6 12.2 12.7 Divorces 473 792 875 per 10,000 inhabitants 9.1 15.2 16.7

P o p u l a t i o n a n d s o c i e t y
22 page astat: South Tyrol in figures 2017
Table 15
Immigration and emigration by source and destination area - 2015 SOURCE AND DESTINATION AREA
Immigration Emigration Balance
Another South Tyrolean municipality 9,864 9,864 - Northern Italy (exluding South Tyrol) 1,585 1,143 + 442 Central Italy 514 288 + 226 Southern Italy and island regions 1,077 464 + 613 Austria 164 697 - 533 Switzerland 57 286 - 229 Germany 298 687 - 389 Other foreign countries 2,637 847 + 1,790 Total 16,196 14,276 1,920
of which from abroad 3,156 2,517 + 639

P o p u l a t i o n a n d s o c i e t y
astat: South Tyrol in figures 2017 page 23
Table 16
Households by number of members - 2011 and 2016 № OF HOUSEHOLDS MEMBERS
PC 2011 31.12.20162011-2016
change in %
1 69,083 78,726 + 12.2 2 50,816 55,891 + 9.1 3 34,145 34,949 + 2.3 4 33,105 33,463 + 1.1 5 12,191 11,824 - 3.1 6 and over - Households 5,076 4,767 - 6.5 - Members 32,828 30,677 - 7.0 Total households 204,416 219,620 + 6.9
- Members 499,353 519,004 + 3.8
PC = Population Census Table 17
Deaths by causes of death - 2016
DISEASES Number %per 100,000 inhabitants
Infectious and parasite diseases 72 1.7 13.7
Tumourous (neoformation) 1,254 29.0 239.2
Diseases of the blood and immunopathies 10 0.2 1.9
Endocrine, nutritional and metabolic diseases 73 1.7 13.9
Psychiatric illness and behavioural disordes 151 3.5 28.8
Disorders of the nervous system, the eyes and the ears 222 5.1 42.3
Circulatory system diseases 1,602 37.1 305.6
Respiratory system diseases 321 7.4 61.2
Digestive organ diseases 158 3.7 30.1
Diseases of the urogenital apparatus 72 1.7 13.7
Other diseases 49 1.1 9.3
Symptoms and signs not elsewhere classified 87 2.0 16.6
Traumas and poisoning 249 5.8 47.5 Total 4,320 100.0 824.0

P o p u l a t i o n a n d s o c i e t y
24 page astat: South Tyrol in figures 2017
Table 18
Hospitals, number and bed utilisation rate - 2016 Public Private Total
Hospitals 7 2 9 Beds 1,815 398 2,213 per 1,000 inhabitants 3.5 0.8 4.2 Mean utilisation of beds (%) .... .... 78.2 Table 19
Legally induced abortions - 2014-2016 2014 2015 2016
Number 526 517 563 per 1,000 live births South Tyrol 95.3 96.9 103.4 Province of Trento 161.7 157.4 155.3 Italy 196.2 185.1 .... Abortion rate (a) South Tyrol 4.5 4.4 4.8 Province of Trento 6.4 6.2 5.9 Italy 7.1 6.6 ….
(a) Abortions per 1,000 women in fertile age (range 15-49 years) Table 20
Suicides - 2012-2016 2012 2013 2014 2015 2016
Males 37 36 48 40 34 Females 15 11 15 15 11
Total 52 47 63 55 45 per 100,000 inhabitants 10,3 9,2 12,2 10,6 8,6

P o p u l a t i o n a n d s o c i e t y
astat: South Tyrol in figures 2017 page 25
Table 21
Schools: number of classes and enrolled students by teaching language- School year 2016/17 German Italian Ladin Total
Nursery school Enrolments 12,409 3,569 672 16,650 Classes 571 174 34 779 Primary school Enrolments 20,042 6,342 1,220 27,604 Classes (a) 1,746 378 89 2,213 Lower secondary school Enrolments 12,448 4,110 714 17,272 Classes 637 201 39 877 Upper secondary school Enrolments 13,263 5,941 524 19,728 Classes 723 302 52 1,077
(a) Actual classes, not considering the number of combined classes

P o p u l a t i o n a n d s o c i e t y
26 page astat: South Tyrol in figures 2017
Table 22
Resident population aged 15 and over by sex and educational level -2001 and 2011 Percentage composition
University
degree
Upper secondary certificate
Lower secondary certificate
Primaryschool
certificate
Total (a)
Population Census 2001
Males 7.5 24.3 44.7 22.0 100.0 Females 6.9 27.1 36.2 28.0 100.0 Total 7.2 25.7 40.3 25.1 100.0
Population Census 2011
Males 10.1 39.6 34.7 14.7 100.0 Females 11.1 38.2 30.0 19.4 100.0 Total 10.6 38.9 32.3 17.1 100.0
(a) The total also includes persons without any qualifications. Table 23
Tests of bilingual ability by sex and test level - 2016
№ of participating
candidatesPercentage of candidates
who passed (a)Ladin
language (b)
Sex Males 2,885 41.4 64.9 Females 4,753 34.8 75.3 Levels Level A 2,039 32.9 86.9 Level B 2,715 26.7 52.3 Level C 1,872 40.1 70.4 Level D 1,012 69.2 100.0 Total 7,638 37.2 71.4
(a) Percentage of candidates passing the tests based on total number of participating candidates
(b) Percentage of people who passed the ladin language evaluation exam.

P o p u l a t i o n a n d s o c i e t y
astat: South Tyrol in figures 2017 page 27
Table 24
Museums by type, opening hours and number of visitors - 2016
TYPE OF MUSEUM NumberOpen days
per yearPayingvisitors
Total visitors
Archaeological and prehistoric museums 4 216.8 269,056 285,397
Arts and crafts museums 18 230.9 288,727 559,163
Science and natural history museums 8 190.6 130,974 169,546
Ethnographic and agriculture museums 14 184.6 144,876 168,444
City, town and local museums 8 180.8 28,962 42,457
Specialised art history museums 22 206.9 339,342 531,540
Museums of industry 2 177.5 30,400 31,100
Castle museums 10 188.6 173,006 181,902
Other type of museum 12 167.0 111,285 135,373 Total 98 197.7 1,516,628 2,104,922 Table 25
Numbers employed by activity sector and sex - 2016 ACTIVITY SECTORS Males Females Total %
Agriculture 10,000 4,600 14,600 5.8 Industry 47,400 7,600 55,000 22.0 Services 80,000 100,500 180,500 72.2 Total employed persons 137,400 112,700 250,100 100.0
of which employees 100,000 94,300 194,300 77.6

P o p u l a t i o n a n d s o c i e t y
28 page astat: South Tyrol in figures 2017
Table 26
Unemployment - 2014-2016Yearly average 2014 2015 2016
Job seekers 11,300 9,700 9,700 Males 6,300 5,000 4,900 Females 5,000 4,700 4,800 Unemployment rate (a) 4.4 3.8 3.7 Males 4.5 3.5 3.4 Females 4.3 4.2 4.1 Official unemployed persons 13,969 13,330 13,623 Males 6,238 5,874 5,907 Females 7,731 7,456 7,716
(a) Ratio of job seekers to total labour force

P o p u l a t i o n a n d s o c i e t y
astat: South Tyrol in figures 2017 page 29
Table 27
Housing units - Population Census 1981, 1991, 2001 and 2011
Occupied
housing unitsOther housing
unitsTotal housing
unitsOther types of
dwellings
1981 124,029 18,012 142,041 332 1991 144,661 22,012 166,673 298 2001 172,031 26,047 198,078 444 2011 199,576 19,9841 219,417 423
Population Census 2011
Districts
Vinschgau Val Venosta
12,971 630 13,601 48
Burggrafenamt Burgraviato
39,806 3,256 43,062 106
Überetsch-Südt. Unterland Oltradige-Bassa Atesina
28,910 711 29,621 52
Bozen Bolzano
45,350 1,594 46,944 76
Salten-Schlern Salto-Sciliar
17,535 6,354 23,889 58
Eisacktal Valle Isarco
18,957 1,258 20,215 32
Wipptal Alta Valle Isarco
7,422 1,013 8,435 12
Pustertal Val Pusteria
28,625 5,025 33,650 39
Total South Tyrol 199,576 19,841 219,417 423

P o p u l a t i o n a n d s o c i e t y
30 page astat: South Tyrol in figures 2017
Table 28
Monthly household consumption by category - 2016
CATEGORIES OF CONSUMPTION
Average monthly expenditure (euro) Percentage
composition by household
by household member
Food 563.86 236.45 15.9 Non-food consumption 2.987.23 1,252.64 84.1 Total 3,551.09 1,489.08 100.0

E c o n o m y a n d b u s i n e s s
astat: South Tyrol in figures 2017 page 31
Table 29
Local units and employees by activity sector - 2001 and 2011 ACTIVITY SECTORS 2001 2011
Local units
Agriculture and fishery 418 342 Mining 59 34 Manufacturing industry 4,300 3,400 Energy, gas and water 171 596 Water supply; sewerage and waste management and environmental remediation 117 189 Building 5,536 5,950 Trade and repairs 9,991 9,820 Transport and storage 1,891 1,783 Hotel and catering industry 9,646 8,927 Information and communication 837 983 Financial and insurance services 976 979 Other services 17,265 22,152 Total 51,207 55,155
Employees
Agriculture and fishery 1,103 1,111 Mining 496 222 Manufacturing industry 34,979 30,645 Energy, gas and water 1,5127 2,044 Water supply; sewerage and waste management and environmental remediation 645 907 Building 21,394 20,865 Trade and repairs 34,603 40,673 Transport and storage 10,110 11,229 Hotel and catering industry 27,242 37,594 Information and communication 3,658 3,783 Financial and insurance services 5,863 5,958 Other services 65,760 84,098 Total 207,380 239,129
Source: ISTAT, elaborated by ASTAT

E c o n o m y a n d b u s i n e s s
32 page astat: South Tyrol in figures 2017
Table 30
Inflation rates in Bozen / Bolzano, Trento and Italy - 2014-2016 2014 2015 2016
Bozen / Bolzano 1.1 0.5 0.4 Trento 0.5 -0.2 0.1 Italy 0.2 -0.1 -0.1
Percentage variation of the mean consumer price index of households of workers and clerks compa-red to the year before Table 31
Use and resources of goods and services - 2013-2015Values at current prices in millions of euro AGGREGATES 2013 2014 2015
Resources
Gross domestic product at market prices 20,724.6 21.003,2 21.540,7
Net imports 176.2 356,1 495,1 Total 20,900.8 21.359,3 22.035,8 Uses
Consumer spending 15,613.8 15.674,6 16.116,8
- resident and non-resident households 11,293.8 11.420,1 11.796,2
- non-profit institutions serving households 197.0 215,8 204,4
- general government 4,123.0 4.038,7 4.116,2
Gross fixed capital formation 5,346.1 5.536,8 5.777,6
Change in inventories -59.0 147,9 141,4 Total 20,900.8 21.359,3 22.035,8

E c o n o m y a n d b u s i n e s s
astat: South Tyrol in figures 2017 page 33
Table 32
Gross and net value-added at basic prices and gross domestic productat market prices - 2013-2015Values at current prices in millions of euro ECONOMIC ACTIVITIES 2013 2014 2015
Agriculture and forestry 1,036.9 900.2 885.5 Industry 4,412.2 4,485.7 4,638.1
Partial total 3,164.9 3,258.0 3,385.0
- Mining and quarrying 21.1 22.9 23.7
- Manufacturing industry 2,149.7 2,236.5 2,374.8
- Energy supply 918.9 913.2 914.1
- Water supply: sewage and waste disposal and remeval of pollution 75.3 85.5 72.4
Construction industry 1,247.3 1,227.6 1,253.1 Services 13,255.3 13,537.1 13,894.5
Sales, hotels, transport 4,941.6 4,966.1 5,204.5
- Accomodation and restaurants and bars 2,017.0 2,015.9 2,080.4
Financial intermediation, real estate business and business-related services 337.8 337.3 344.3
- Financial and insurance services 818.7 965.2 914.6
- Real estate and housing industry 1,880.9 1,908.8 2,004.2
- Provision of freelance, scientific and technical services 1,337.2 1,318.9 1,354.6
Public administration 3,339.2 3,438.8 3,433.0
Other services 600.0 602.2 639.2 Value added at basic prices 18,704.4 18,923.0 19,418.1 Net indirect taxes 2,020.2 2,080.2 2,122.6 Gross domestic product at market prices 20,724.6 21,003.2 21,540.7

E c o n o m y a n d b u s i n e s s
34 page astat: South Tyrol in figures 2017
Table 33
Per capita values of some economic aggregates in South Tyrol and Italy- 2016 Values at current prices in euro
South Tyrol Trentino Italy
Gross domestic product at market prices
per inhabitant 42,456 35,005 27,719
per full-time equivalent 70,978 67,063 60,810 Consumer spending per inhabitant (a) 31,012 29,049 22,012 Income from employment per employee 40,734 37,418 35,921
(a) Value 2015

E c o n o m y a n d b u s i n e s s
astat: South Tyrol in figures 2017 page 35
Table 34
Farm holdings and holding surface area by land use - 2010
SOIL USE Number of
holdings
Surface area
ha %
Arable land 2,275 4,044.93 0.8 Vegetable plots 10,950 201.23 .. Permanent pasture 11,070 64,651.53 13.4 Grazing 5,051 147,006.45 30.4 Permanent crops 9,603 24,626.72 5.1 of which: Fruit trees 7,594 18,973.45 3.9 Vines 4,784 5,293.95 1.1 Total utilised agricultural area 20,055 240,535.40 49.7 Arboriculture 10 11.28 .. Farm woodlands 11,121 200,649.05 41.4 Non-utilised agricultural area 25,589 19,313.71 4.0 Other areas 17,970 23,567.07 4.9 Total 20,206 484,076.51 100.00 Table 35
Farm holdings and livestock population by livestock type - 2010
LIVESTOCK TYPE Number of
holdings
Livestock population
Number of animals Animals per holding
Cattle 8,315 132,784 16.0 Horses 1,593 5,281 3.3 Sheep 1,640 29,846 18.2 Goats 946 12,775 13.5 Pigs 427 4,703 11.0 Rabbits 109 942 8.6 Poultry 540 95,847 177.5 Ostriches 2 50 25.0 Bees 353 (a) 8,800 24.9 (a) Beehives

E c o n o m y a n d b u s i n e s s
36 page astat: South Tyrol in figures 2017
Table 36
Agricultural production by crop type - 2014-2016Quantity in 100 kg TYPE OF CROP 2014 2015 2016
Agricultural production Wheat 1,400 1,600 1,600 Rye (a) 2,400 2,400 2,400 Barley 2,100 2,100 2,100 Oats 490 490 450 Potatoes 112,000 112,000 105,600 Cauliflower 24,000 23,800 28,000 Beetroot 23,400 22,620 15,150 Cabbage 4,800 4,200 4,060 Lettuce 3,000 2,790 2,320 Radicchio 7,500 7,930 4,650 Fruit and vine production Apples 11,992,250 11,272,270 10,636,780 Pears 5,410 8,230 5,640 Wine grapes 442,400 479,600 499,800
(a) Including minor cereals Table 37
Wine grape harvest - 2015 and 2016
2015 2016
Hectolitre Hectolitre %
Table wine 1,960 5,100 1.4
Table wine with geographical indication 10,728 9,098 2.6
DOC wine 313,301 341,312 96.0 Total wine 325,989 355,510 100.0
of which: white wine 194,462 214,6781 60.4

E c o n o m y a n d b u s i n e s s
astat: South Tyrol in figures 2017 page 37
Table 38
Apple harvest by variety - 2015 and 2016
VARIETIES 2015 2016
Production in 100 kg Production in 100 kg %
Apples Golden Delicious 4,514,650 4,176,843 39.3 Gala 1,818,614 1,723,943 16.2 Red Delicious 1,251,547 1,122,888 10.6 Granny Smith 870,444 792,371 7.4 Fuji 745,575 799,522 7.5 Braeburn 743,898 569,549 5.4 Morgenduft and Dallago 126,068 108,398 1.0 Jonagold and Jonagored 96,070 78,666 0.7 Winesap 81,294 50,663 0.5 Idared 17,388 7,732 0.1 Other 1,006,722 1,206,205 11.3 Total 11,272,270 10,636,780 100.0

E c o n o m y a n d b u s i n e s s
38 page astat: South Tyrol in figures 2017
Table 39
Forestry production by type of wood and utilisation - 2014-2016Production in m³ TYPE OF WOOD 2014 2015 2016
Industrial timber 533,154 357,661 390,840
Fir and spruce 430,658 280,799 299,443 Larch 55,715 36,424 40,591 Pine 46,589 40,319 50,538 Other coniferous wood 86 2 127 Non-coniferous wood 106 116 141 Firewood 311,215 199,229 217,293
Coniferous wood 303,451 191,314 210,837 Non-coniferous wood 7,764 7,915 6,456 Total 844,369 556,890 608,133 Table 40
Mining production - 2014-2016Tonnes TYPE OF PRODUCT 2014 2015 2016
Porphyry 132,452 167,527 103,016 Marble 362,114 337,268 361,750 Peat 69,394 44,553 36,000 Sand and gravel 1,149,229 996,456 1,102,357 Granite 18,270 22,782 14,941 Gneiss 6,119 3,476 9,796 Diorite 16,516 31,907 28,497 Calcareous and serpentine schist 1,715 1,604 1,635

E c o n o m y a n d b u s i n e s s
astat: South Tyrol in figures 2017 page 39
Table 41
Electricity production and consumption - 2015 and 2016
2015 2016
Millions of kWh Millions of kWh % of Italy
Gross output …. 6,354 2.2
of which: Hydroelectric production …. 5,356 12.1 Consumption 2,950 3,012 1.0 Agriculture 203 195 3.5 Industry 823 817 0.7 Services 1,362 1,433 1.4 Private households 561 567 0.9 Table 42
Collected building permits - 2014-2016 2014 2015 2016
Volume in m³
Residential buildings 1,186,475 1,257,657 1,720,929 New buildings 928,575 1,019,762 1,488,769 Extension constructions 257,900 237,895 232,160 Non-residential buildings 1,748,280 1,731,449 1,979,981 New buildings 1,041,673 1,019,379 1,164,105 Extension constructions 706,607 712,070 815,876
Number
Housing units 2,238 2,544 1,962 In residential buildings 2,151 2,466 1,172 In non-residential buildings 87 78 790 In new buildings 1,677 1,936 1,022 In extension constructions 561 608 940

E c o n o m y a n d b u s i n e s s
40 page astat: South Tyrol in figures 2017
Table 43
Trade with foreign countries - 2000-2016Thousands of euro YEARS Import Export Balance
2000 2,554,243 2,226,479 - 327,764 2001 2,697,341 2,280,728 - 416,613 2002 2,934,814 2,393,510 - 541,304 2003 2,951,759 2,434,048 - 517,711 2004 2,982,334 2,558,444 - 423,890 2005 3,035,076 2,594,888 - 440,188 2006 3,250,316 2,876,579 - 373,737 2007 3,676,248 3,160,576 - 515,672 2008 3,909,761 3,239,323 - 670,439 2009 3,622,527 2,760,891 - 861,636 2010 4,593,731 3,321,896 - 1,271,835 2011 4,556,110 3,664,333 - 891,777 2012 4,181,216 3,684,170 - 497,046 2013 4,023,498 3,852,849 - 170,649 2014 4,035,054 3,968,326 - 66,728 2015 4,113,180 4,367,998 + 254,818 2016 (a) 4,231,471 4,434,134 + 202,664
(a) Preliminary results

E c o n o m y a n d b u s i n e s s
astat: South Tyrol in figures 2017 page 41
Table 44
Accommodation capacity, arrivals and overnight stays - 2014-2016 2014 2015 2016
Accommodation facilities (a) Hotels 4,126 4,084 4,066 Non hotels (b) 5,982 5,957 6,001 Total 10,108 10,041 10,066
Beds (a) Hotels 150,928 149,796 150,707 Non hotels (b) 68,122 69,452 69,888 Total 219,050 219,248 220,595
Arrivals (1,000) Hotels 5,028 5,295 5,669 Non hotels (b) 1,114 1,200 1,333 Total 6,142 6,495 7,002
of which foreigners 4,051 4,187 4,561
Overnight stays (1,000) Hotels 22,372 23,148 24,546 Non hotels (b) 6,066 6,327 6,806 Total 28,438 29,475 31,352
of which foreigners 19,660 20,080 21,506
Average length of stay (days) Hotels 4.4 4.3 4.3 Non hotels (b) 5.4 5.2 5.1 Total 4.6 4.5 4.5
of which foreigners 4.9 4.8 4.7
Utilisation of beds (in percentage) Hotels 40.6 42.3 44.5
(a) The accommodation capacity (accommodation facilities and beds) of a year corresponds to themean values of the months.
(b) Private lets, youth hostels, campsites, holiday resorts, holiday flats, mountain huts and others.

E c o n o m y a n d b u s i n e s s
42 page astat: South Tyrol in figures 2017
Table 45
Traffic network - 2017 RAILWAYS AND ROADS Length in km
Railways 291 Roads (a) 20,127
Motorways 136 State roads 810 - of which Mebo 31 Provincial roads 1,303 Municipal roads 2,827 Rural roads for trucks 3,588 Forest roads for trucks 5,446 Rural roads for tractors 298 Forest roads for tractors 5,719
(a) Including rural and forest roads Table 46
Vehicles registered in the Public Vehicle Register (PRA) per type ofvehicle - 2016
TYPE OF VEHICLE NumberPer 100 inhabitants
South Tyrol Province of Trento Italy
Cars 459,378 87.6 92.5 62.5 Lorries 60,938 11.6 14.1 7.8 Other trucks 2,347 0.4 0.6 0.4 Motorcycles 54,635 10.4 11.5 11.5 Trailers 3,864 0.7 1.1 0.6

E c o n o m y a n d b u s i n e s s
astat: South Tyrol in figures 2017 page 43
Table 47
Road accidents and people injured - 2014-2016 2014 2015 2016
Accidents 1,587 1,644 1,744 Between 2 or more vehicles 1,083 1,086 1,195 Between vehicles and pedestrians 202 223 213 Single vehicles 302 335 336 People injured 2,105 2,122 2,324 Injuries 2,073 2,086 2,286 Deaths 32 36 38 Accidents per 1,000 Vehicles South Tyrol 3.2 3.1 3.0 Province of Trento 2.6 2.4 2.1 Italy 3.6 3.6 3.5 Table 48
Cableways by category - 2014-2016 TYPE OF CABLEWAY 2014 2015 2016
Automatic telecabins 140 143 145 Cable cars 23 23 23 Chair lifts, gondulas, cabin lifts 91 88 85 Ski lifts 114 113 112 Other 4 4 4 Total 372 371 369

E c o n o m y a n d b u s i n e s s
44 page astat: South Tyrol in figures 2017
Table 49
TV subscriptions - 1965-2014
YEARS South TyrolPer 100 households
South Tyrol Province of Trento Italy
1965 25,948 27.0 27.0 41.9 1970 51,279 47.0 58.0 62.5 1975 82,104 71.0 79.0 74.0 1980 98,687 81.0 87.0 76.9 1985 107,646 79.0 86.8 74.3 1990 115,487 77.0 85.0 72.7 1995 122,359 82.9 89.9 80.7 2000 127,536 83.2 87.7 79.0 2005 136,310 76.0 75.8 72.6
2010 149,538 73.6 68.9 66.9 2011 151,727 73.7 68.5 66.4 2012 155,532 75.6 69.5 66.8 2013 157,876 74.6 69.2 65.0 2014 159,036 74.9 68.7 64.8 Table 50
Deposits, loans, number of banks and customer service - 2014-2016 Values in millions of euro 2014 2015 2016
Deposits (a) 16,333 17,561 18,570 Loans (a) 21,354 22,068 21,496 Number of banks (b) 55 55 55 Banks (public limited companies) 4 4 5 Branches of foreign banks 3 3 3 „Banche popolari“ 1 1 - Cooperative banks 47 47 47 Bank counters 402 385 364 Municipalities with bank counters 111 111 111 ATM (c) 578 580 566 POS 25,054 24,327 25,267 Home & corporate banking: Households 223,914 227,883 248,539 Companies 19,923 21,091 22,483
(a) Information based on bank customers residing in South Tyrol
(b) Banks domiciled in South Tyrol
(c) Number of cash dispensers

P u b l i c a d m i n i s t r a t i o n a n d j u s t i c e
astat: South Tyrol in figures 2017 page 45
Table 51
Civil servants by administration - 2015 and 2016 ADMINISTRATION 2015 2016
Government Ministries 6,844 6,811 - of which police/armed forces 6,029 6,029 Social insurance institutions 293 285 ACI (Italian Automobile Association) 18 18 Railway company 539 541 Post office 977 950
Total 8,671 8,605 Local administration Provincial administration, school system 7,940 7,983 Other provincial administration 4,192 4,187 Teachers (a) 8,981 9,080 Municipalities 4,457 4,335 Local Health Authorities 8,904 9,003 Provincial Parliament 62 62 Independent provincial administrations 243 242 Regional administration and Regional Parliament 88 84 Public assistance institutions 2,564 2,742 Districts (b) 2,875 2,958 Other local administrations 173 175
Total 40,479 40,851 Final total 49,150 49,456
(a) Including headmasters
(b) Including Independent Social Services Dept. of Bozen / Bolzano

P u b l i c a d m i n i s t r a t i o n a n d j u s t i c e
46 page astat: South Tyrol in figures 2017
Table 52
Consolidated expenditure of local public administration by functional classification - 2014 and 2015Cash expenditure in thousands of euro 2014 2015 Variation %
General administration 464,654 432,554 -6.9
Defence, public security and justice 72,356 72,443 0.1
Education, culture, sports and leisure 1,498,797 1,504,502 0.4
Building and urbanism 149,033 173,402 16.4
Health care 1,228,119 1,238,146 0.8
Social assistance 799,474 713,151 -10.8
Other social measures 166,393 180,493 8.5
Public transport 333,002 325,577 -2.2
Roads 404,949 379,172 -6.4
Agriculture 170,602 166,533 -2.4
Energy, mining, industry 1,325,403 1,274,790 -3.8
Handicrafts 13,713 16,198 18.1
Tourism 97,450 88,016 -9.7
Trade 26,676 26,561 -0.4
Other economic measures 202,338 214,982 6.2
Waste and sewage disposal 226,144 235,732 4.2
Environmental care 31,828 34,527 8.5
Other public construction 46,622 52,922 13.5
Other non assignable expenditure 122,673 114,807 -6.4 Total 7,380,226 7,244,508 -1.8

P u b l i c a d m i n i s t r a t i o n a n d j u s t i c e
astat: South Tyrol in figures 2017 page 47
Table 53
Declared bankruptcies by activity sector - 2014-2016 ACTIVITY SECTOR 2014 2015 2016
Manufacturing 20 15 10 Building 19 17 14 Trade 15 12 13 Hotels and catering 3 9 5 Other services 8 13 14
Total 65 66 56
of which: companies 60 60 52 Table 55
Protests - 2014 and 2015
Number Total (thousands of euro)
2014 2015 2014 2015
Bills of exchange 1,070 1,000 1,090 1,078 Drafts 14 17 23 30 Cheques 92 99 713 930
Total 1,176 1,116 1,825 2,038
per 1,000 inhabitants South Tyrol 2.3 2.1 3.5 3.9 Italy 15.7 12.7 30.5 22.7 Table 55
Crimes reported by the police at the court by type of crime - 2016 TYPE OF CRIME South Tyrol Province of Trento
Homicide, intentional physical assault and other bloody deeds 575 480 Threat and insult 776 977 Theft and robbery 10,346 9,860 Damage to property 1,442 1,760 Fraud/fraudulent actions via computer systems 842 1,136 Drug offence 204 266 Other crimes 3,677 4,430
Total 17,862 18,909

A S T A T p u b l i c a t i o n s l i s t
48 page astat: South Tyrol in figures 2017
S t a t i s t i s c h e s J a h r b u c h f ü r S ü d t i r o l A n n u a r i o s t a t i s t i c o d e l l a P r o v i n c i a d i B o l z a n o
2014 bilingual edition, 552 pages, 2014 2015 bilingual edition, 546 pages, 2015 2016 bilingual edition, 550 pages, 2017
S ü d t i r o l i n Z a h l e n A l t o A d i g e i n c i f r e S ü d t i r o l n z i f r e s
2015 bilingual and ladin edition, 48 pages, 2015 2016 bilingual and ladin edition, 48 pages, 2016 2017 bilingual and ladin edition, 48 pages, 2018
The english edition „South Tyrol in figures“ is available only online at www.provinz.bz.it/astat.
I n Z a h l e n I n c i f r e
Nr. 17 Soziale Einrichtungen in Zahlen 2015Presidi socio-assistenziali in cifre 2015bilingual edition, 96 pages, 2016
Nr. 18 Bildung in Zahlen 2015-2016Istruzione in cifre 2015-2016bilingual edition, 84 pages, 2016
Nr. 19 Soziale Einrichtungen in Zahlen 2016Presidi socio-assistenziali in cifre 2016bilingual edition, 93 pages, 2017
Nr. 20 Bildung in Zahlen 2016-2017Istruzione in cifre 2016-2017 bilingual edition, 80 pages, 2017
A S T A T - S c h r i f t e n r e i h e C o l l a n a A S T A T
Nr. 216 Bautätigkeit und Immobilienmarkt in Südtirol - 2015Attività edilizia e mercato immobiliare in provincia di Bolzano - 2015bilingual edition, 246 pages, 2016
Nr. 217 Mobilität und Verkehr in Südtirol - 2015Mobilità e traffico in provincia di Bolzano - 2015bilingual edition, 146 pages, 2017
Nr. 218 Sportvereine in Südtirol - 2014Associazioni sportive in Alto Adige - 2014bilingual edition, 156 pages, 2017
Nr. 219 Seilbahnen in Südtirol - 2016Impianti a fune in Alto Adige - 2016bilingual edition, 102 pages, 2017
Nr. 220 Jugendstudie - 2016 Indagine sui giovani - 2016bilingual edition, 258 pages, 2017
Nr. 221 Familienstudie - 2016Indagine sulla famiglia - 2016bilingual edition, 184 pages, 2018
S t a t i s t i k s a m m l u n g 1 9 8 1 - 2 0 1 1 ( D V D ) R a c c o l t a s t a t i s t i c a 1 9 8 1 - 2 0 1 1 ( D V D )
Recommended