8/3/2019 Sino-Forest Poyry Valuation Dec 2006 Final
http://slidepdf.com/reader/full/sino-forest-poyry-valuation-dec-2006-final 1/122
Report
38A0803215 March 2007
Final
Valuation of China Forest Assets
As at 31 December 2006Sino-Forest Corporation

8/3/2019 Sino-Forest Poyry Valuation Dec 2006 Final
http://slidepdf.com/reader/full/sino-forest-poyry-valuation-dec-2006-final 2/122
38A08032
Copyright © Pöyry Forest Industry
All rights are reserved. This document or any part thereof may not be copied or
reproduced without permission in writing from Pöyry Forest Industry.
8/3/2019 Sino-Forest Poyry Valuation Dec 2006 Final
http://slidepdf.com/reader/full/sino-forest-poyry-valuation-dec-2006-final 3/122
38A08032
Copyright © Pöyry Forest Industry i
PREFACE
This report is issued by Pöyry Forest Industry Ltd (Pöyry) to Sino-Forest
Corporation (Sino-Forest) for its own use. No responsibility is accepted for any
other use.
The report contains the opinion of Pöyry as to the Value of Sino-Forest’s
Plantation Forest Assets as at 31 December 2006. Nothing in the report is, or
should be relied upon as, a promise by Pöyry as to the future growth, yields, costs
or returns of the forests. Actual results may be different from the opinion
contained in this report, as anticipated events may not occur as expected and the
variation may be significant. Pöyry has no responsibility to update this report for
events and circumstances occurring after the date of this report.
W B Liley O D Somerville
ASSOCIATE PRINCIPAL CONSULTANT
Contact
Bill Liley
Level 5HSBC Building
1 Queen Street
Auckland, New Zealand
Tel. +64 9 918 1100
Fax +64 9 918 1105
E-mail: [email protected]
Pöyry Forest Industry Ltd
8/3/2019 Sino-Forest Poyry Valuation Dec 2006 Final
http://slidepdf.com/reader/full/sino-forest-poyry-valuation-dec-2006-final 4/122
38A08032
Copyright © Pöyry Forest Industry ii
CERTIFICATION
Pöyry certifies to the following statements to the best of our knowledge and belief:
The statements of fact contained in this report are true and correct. The reported analyses, opinions, and conclusions are limited only by the
reported assumptions and limiting conditions, and are our personal, impartial,
and unbiased professional analyses, opinions, and conclusions.
Pöyry has no present or prospective interest in the subject property, and no
personal interest or bias with respect to the parties involved.
Pöyry’s compensation for completing this assignment is not contingent upon:
1. the development or reporting of a predetermined value or direction in
value that favours the cause of the client,
2. the amount of the value opinion,
3. the attainment of a stipulated result, or
4. the occurrence of a subsequent event directly related to the intended use
of this appraisal. Previous high level inspections have been associated with valuations carried
out by Pöyry in 2000, 2001, 2003, 2004 and 2005.
Qualitative inspections were made of a sample of Sino-Forest areas in the
provinces of Hunan and Guangxi over the period 15 January 2007 to 25
January 2007.
The report has been prepared by staff consultants, retained consultants and
office support personnel of Pöyry.
Pöyry is a global consulting and engineering firm focusing on the energy, forest
industry and infrastructure & environment sectors. Pöyry employs 6000 experts,
and Pöyry Plc is listed on the OMX Nordic Stock Exchange.
Management Consulting is one of the key practice areas of the Pöyry Forest
Industry Group. The Management Consulting segment of this group maintains
permanent offices in 11 countries. This includes offices in Vantaa, Stockholm,
Moscow, Munich, London, New York, Montreal, Singapore, Shanghai, Auckland
and Melbourne. The Auckland office currently values some USD4 billion worth of
forest assets annually, located in all parts of the world.
Our clients include a range of forest sector participants; forest owners, managers,
institutional investors and financiers. Forest valuations are prepared for a variety
of purposes:
Financial reporting
Insurance
Taxation
Compensation
Acquisition/divestment/restructuring
8/3/2019 Sino-Forest Poyry Valuation Dec 2006 Final
http://slidepdf.com/reader/full/sino-forest-poyry-valuation-dec-2006-final 5/122
38A08032
Copyright © Pöyry Forest Industry iii
Clients cover a wide spectrum including governments, commercial and private
sector owners and investors. Changing international accounting standards are
increasingly emphasizing the concept of “fair-market value” as the basis for asset
reporting. This requires careful attention to transaction evidence for which Pöyry’s
global presence is invaluable.
All Pöyry’s valuation activities for the Asia-Pacific area including China, South
America, North and South East Asia, South Africa, Australia, New Zealand and the
Pacific Islands are coordinated from the Auckland office. The Auckland team,
includes personnel with specialist skills in forest valuation and modelling. Within
the firm's substantial track record are valuations of natural and planted forests
throughout the Southern Hemisphere and Asia, including: Australia, New Zealand,
Brazil, Argentina, Uruguay, Suriname, Guyana, Chile, Fiji, South Africa,
Indonesia, Malaysia, the Philippines and China.
Pöyry Forest Industry Ltd
W B Liley
ASSOCIATE PRINCIPAL
8/3/2019 Sino-Forest Poyry Valuation Dec 2006 Final
http://slidepdf.com/reader/full/sino-forest-poyry-valuation-dec-2006-final 6/122
38A08032
Copyright © Pöyry Forest Industry iv
ASSUMPTIONS AND LIMITING CONDITIONS
This report was prepared at the request of and for the exclusive use of the client,
Sino-Forest Corporation. This report may not be used for any purpose other than
the purpose for which it was prepared. Its use is restricted to consideration of its
entire contents. This valuation represents an update of Pöyry’s 31 December 2005
forest valuation that was presented in Report 38A06804 Valuation of China Forest
Assets as at 31 December 2005.
Details concerning the location and basic physical characteristics of the subject
property were taken from data provided by Sino-Forest.
Pöyry has viewed a sample of cutting right purchase contracts and has assumed
legal descriptions to be authoritative. Maps, diagrams and pictures presented in this
report are intended merely to assist the reader.
Pöyry has undertaken a limited visual inspection of the forest resource from the
ground in January 2007. Previous limited inspections have been associated with
valuations carried out by Pöyry in 2000, 2001, 2003, 2004 and 2005. This appraisal
assumes that the sites visited by Pöyry during its January 2007 field inspection
represent the full range of conditions present. The forest inspection process has
been limited to a high-level review.
Legal matters are beyond the scope of this report, and any existing liens and
encumbrances have been disregarded, and the forest resource has been appraised as
though free and clear under responsible ownership and competent management.
Unless otherwise stated in this report, the existence of hazardous materials or other
adverse environmental conditions, which may or may not be present on the
property, were neither called to the attention of Pöyry, nor did the consultants
become aware of such during the inspection.
Pöyry recognizes the possibility that any valuation can eventually become the
subject of audit or court testimony. If such audit or testimony becomes necessary
as a result of this valuation, it will be a new assignment subject to fees then in
effect. Pöyry has no responsibility to update this report for events and
circumstances occurring after the date of this report.
Any liability on the part of Pöyry is limited to the amount of fee actually collected
for work conducted by Pöyry. Nothing in the report is, or should be relied upon as,
a promise by Pöyry as to the future growth, yields, costs or returns of the forests.Actual results may be different from the opinion contained in this report, as
anticipated events may not occur as expected and the variation may be significant.
8/3/2019 Sino-Forest Poyry Valuation Dec 2006 Final
http://slidepdf.com/reader/full/sino-forest-poyry-valuation-dec-2006-final 7/122
38A08032
Copyright © Pöyry Forest Industry v
SUMMARY
Valuation
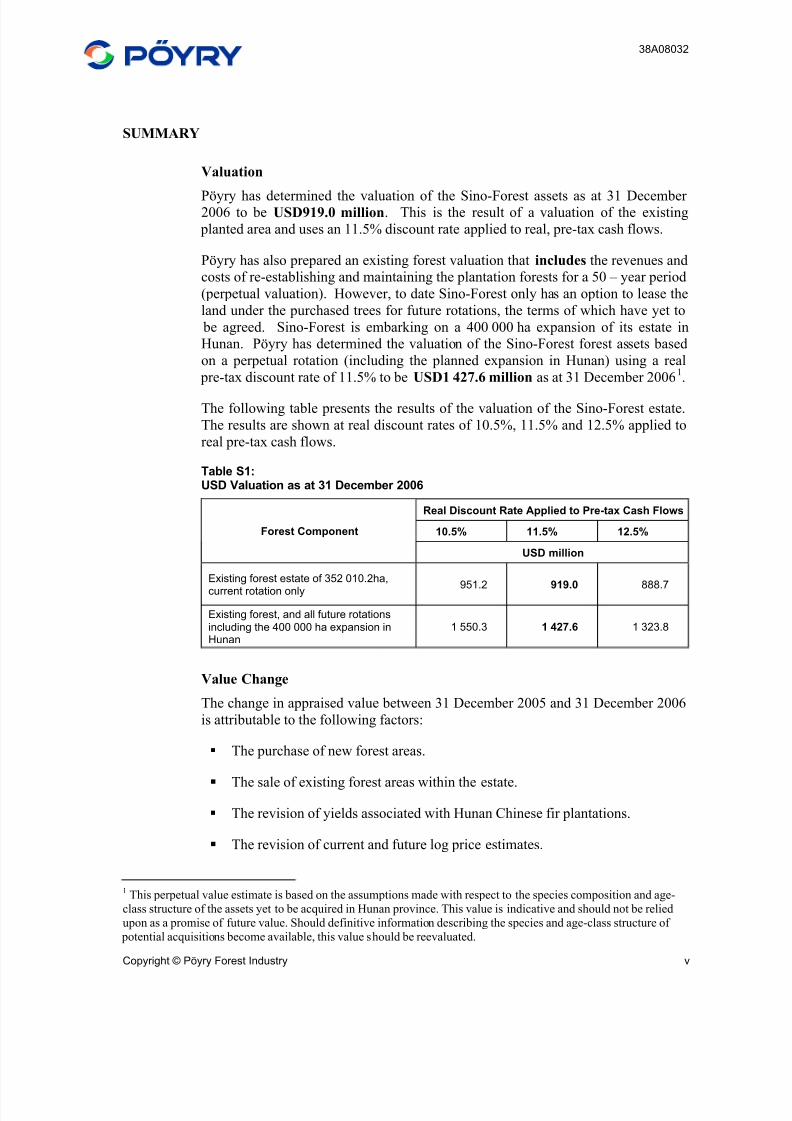
Pöyry has determined the valuation of the Sino-Forest assets as at 31 December 2006 to be USD919.0 million. This is the result of a valuation of the existing
planted area and uses an 11.5% discount rate applied to real, pre-tax cash flows.
Pöyry has also prepared an existing forest valuation that includes the revenues and
costs of re-establishing and maintaining the plantation forests for a 50 – year period
(perpetual valuation). However, to date Sino-Forest only has an option to lease the
land under the purchased trees for future rotations, the terms of which have yet to
be agreed. Sino-Forest is embarking on a 400 000 ha expansion of its estate in
Hunan. Pöyry has determined the valuation of the Sino-Forest forest assets based
on a perpetual rotation (including the planned expansion in Hunan) using a real
pre-tax discount rate of 11.5% to be USD1 427.6 million as at 31 December 20061.
The following table presents the results of the valuation of the Sino-Forest estate.
The results are shown at real discount rates of 10.5%, 11.5% and 12.5% applied to
real pre-tax cash flows.
Table S1:USD Valuation as at 31 December 2006
Real Discount Rate Applied to Pre-tax Cash Flows
10.5% 11.5% 12.5%Forest Component
USD million
Existing forest estate of 352 010.2ha,
current rotation only 951.2 919.0 888.7
Existing forest, and all future rotationsincluding the 400 000 ha expansion inHunan
1 550.3 1 427.6 1 323.8
Value Change
The change in appraised value between 31 December 2005 and 31 December 2006
is attributable to the following factors:
The purchase of new forest areas.
The sale of existing forest areas within the estate.
The revision of yields associated with Hunan Chinese fir plantations.
The revision of current and future log price estimates.
1This perpetual value estimate is based on the assumptions made with respect to the species composition and age-
class structure of the assets yet to be acquired in Hunan province. This value is indicative and should not be relied
upon as a promise of future value. Should definitive information describing the species and age-class structure of
potential acquisitions become available, this value should be reevaluated.
8/3/2019 Sino-Forest Poyry Valuation Dec 2006 Final
http://slidepdf.com/reader/full/sino-forest-poyry-valuation-dec-2006-final 8/122
38A08032
Copyright © Pöyry Forest Industry vi
An increase in maturity within the estate because of biological growth.
Revised wood flow strategy.
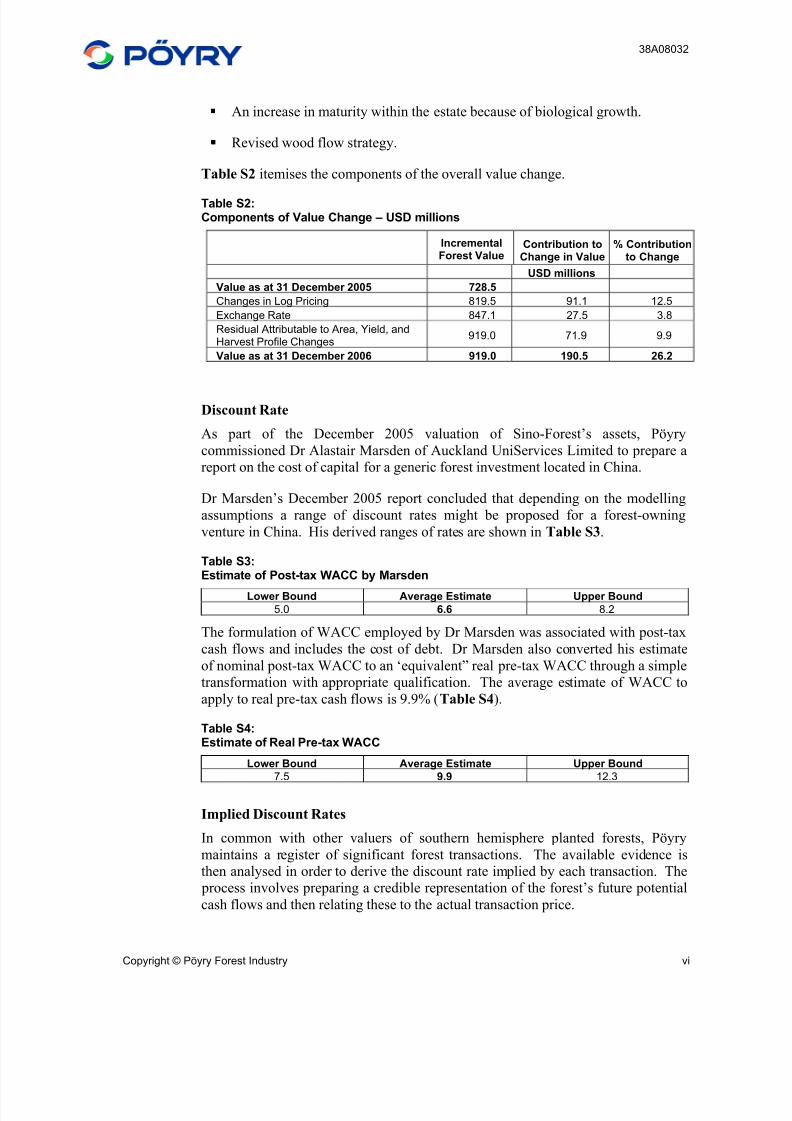
Table S2 itemises the components of the overall value change.
Table S2:Components of Value Change – USD millions
IncrementalForest Value
Contribution toChange in Value
% Contributionto Change
USD millions
Value as at 31 December 2005 728.5
Changes in Log Pricing 819.5 91.1 12.5
Exchange Rate 847.1 27.5 3.8
Residual Attributable to Area, Yield, andHarvest Profile Changes
919.0 71.9 9.9
Value as at 31 December 2006 919.0 190.5 26.2
Discount Rate
As part of the December 2005 valuation of Sino-Forest’s assets, Pöyry
commissioned Dr Alastair Marsden of Auckland UniServices Limited to prepare a
report on the cost of capital for a generic forest investment located in China.
Dr Marsden’s December 2005 report concluded that depending on the modelling
assumptions a range of discount rates might be proposed for a forest-owning
venture in China. His derived ranges of rates are shown in Table S3.
Table S3:Estimate of Post-tax WACC by Marsden
Lower Bound Average Estimate Upper Bound
5.0 6.6 8.2
The formulation of WACC employed by Dr Marsden was associated with post-tax
cash flows and includes the cost of debt. Dr Marsden also converted his estimate
of nominal post-tax WACC to an ‘equivalent” real pre-tax WACC through a simple
transformation with appropriate qualification. The average estimate of WACC to
apply to real pre-tax cash flows is 9.9% (Table S4).
Table S4:Estimate of Real Pre-tax WACC
Lower Bound Average Estimate Upper Bound
7.5 9.9 12.3
Implied Discount Rates
In common with other valuers of southern hemisphere planted forests, Pöyry
maintains a register of significant forest transactions. The available evidence is
then analysed in order to derive the discount rate implied by each transaction. The
process involves preparing a credible representation of the forest’s future potential
cash flows and then relating these to the actual transaction price.
8/3/2019 Sino-Forest Poyry Valuation Dec 2006 Final
http://slidepdf.com/reader/full/sino-forest-poyry-valuation-dec-2006-final 9/122
38A08032
Copyright © Pöyry Forest Industry vii
From this type of exercise conducted in Australia and New Zealand, Pöyry has
observed derived discount rates for recent transactions to generally fall within the
range of 8-10%. These are real rates, applied to post-tax cash flows.
As yet Pöyry has little implied discount rate data for the Southern China region. As
the commercial plantation forest industry develops and more forests change hands,empirical evidence from which to derive implied discount rates will arise. The
capacity to utilise implied discount rates in this valuation is limited to considering
how the forest investment in China compares with such investment in other
locations.
Commercial forestry in Southern China is still developing and faces some
challenges, these include:
The reliability of forest descriptions
The accuracy of yield prediction
Achieving high growth in a consistent manner.
It is Pöyry’s opinion that for many forest investors, investing in plantation forestryin China would be considered a riskier proposition than, for instance, investing in
the industry in Australia or New Zealand.
Incorporating Risk in the Discount Rate
If forest investment in China is at present perceived to be a more risky proposition
than like activity in other international counterparts, the issue then becomes how to
quantify this difference. The textbook treatments of the subject make it clear that
the discount rate cannot be regarded as a simple catch-all for any and all forms of
perceived risk. Because the discount rate may be a very blunt instrument in such a
role it is preferable instead to attempt to acknowledge risk in the development of
the cash flows to which the discount rate is applied. However, despite this principle, there is an inclination by potential purchasers to load the discount rate
where they feel uneasy.
The Discount Rate Applied in Valuing the Sino-Forest Resource
Given the complexities in identifying what margin above other implied discount
rates that forestry in Southern China should attract, Pöyry is disinclined to place
weight on an implied discount rate derivation for this resource. Disconcertingly,
the range of rates suggested by the alternative approach - the WACC/CAPM - is
very broad.
Ultimately we have exercised our professional judgement in selecting a rate at the
upper end of the WACC/CAPM range. This is a real rate of 11.5%. In selecting
such a rate we have been inclined to recognise that investors in forestry in Southern
China will inherently be taking a long term view, and do have grounds for
optimism on the forest industry’s future there. The fundamental factors that affect
forestry performance are favourable. Importantly, too, the definition of market
value for the forests requires that there be not just willing buyers, but also willing
sellers. If the only purchase offers to be extended involved very high discount rates
we would expect that forests would not be willingly sold.
8/3/2019 Sino-Forest Poyry Valuation Dec 2006 Final
http://slidepdf.com/reader/full/sino-forest-poyry-valuation-dec-2006-final 10/122
38A08032
Copyright © Pöyry Forest Industry viii
In the current market Pöyry considers that 10.5% to 12.5% is representative of the
range of real pre-tax discount rates that might be expected in forest transactions in
Southern China. A discount rate of 11.5% has been selected and applied to pre-tax
cash flows. It is Pöyry’s perception that with a carefully timed and managed sale,
other buyers could be attracted who would be willing to accept a similar pre-tax
discount rate.
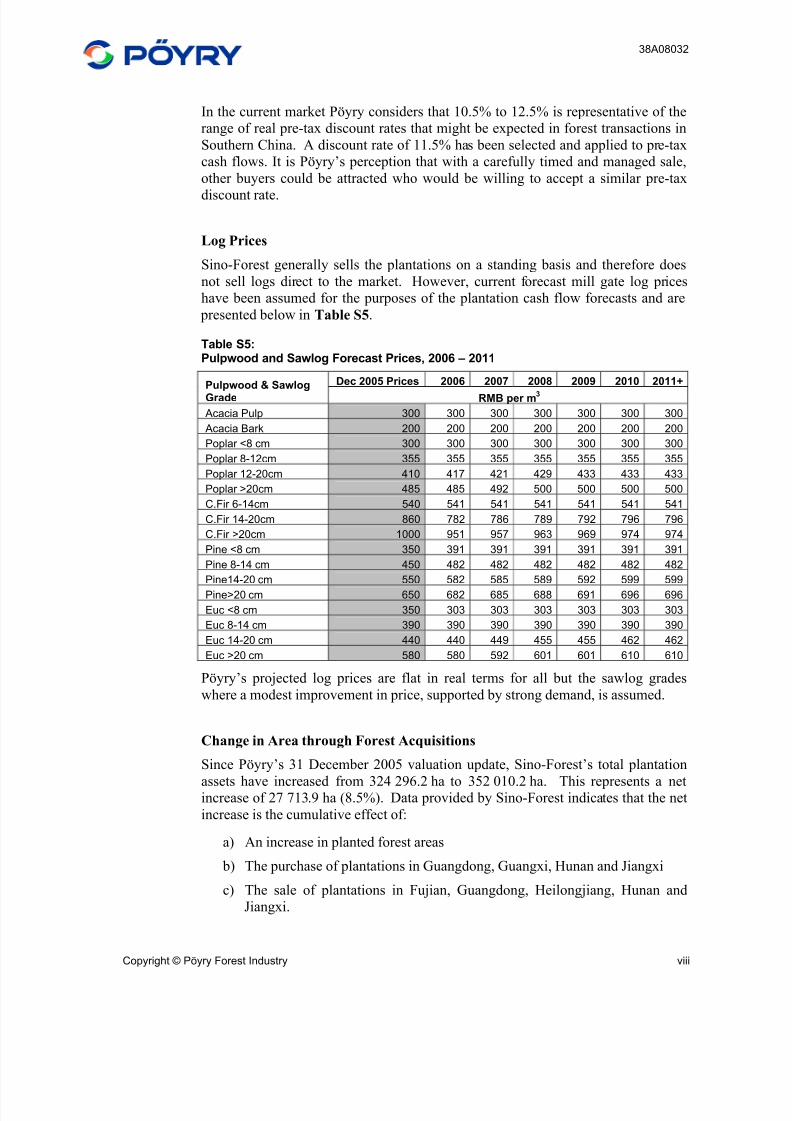
Log Prices
Sino-Forest generally sells the plantations on a standing basis and therefore does
not sell logs direct to the market. However, current forecast mill gate log prices
have been assumed for the purposes of the plantation cash flow forecasts and are
presented below in Table S5.
Table S5:Pulpwood and Sawlog Forecast Prices, 2006 – 2011
Dec 2005 Prices 2006 2007 2008 2009 2010 2011+Pulpwood & SawlogGrade RMB per m3
Acacia Pulp 300 300 300 300 300 300 300
Acacia Bark 200 200 200 200 200 200 200
Poplar <8 cm 300 300 300 300 300 300 300
Poplar 8-12cm 355 355 355 355 355 355 355
Poplar 12-20cm 410 417 421 429 433 433 433
Poplar >20cm 485 485 492 500 500 500 500
C.Fir 6-14cm 540 541 541 541 541 541 541
C.Fir 14-20cm 860 782 786 789 792 796 796
C.Fir >20cm 1000 951 957 963 969 974 974
Pine <8 cm 350 391 391 391 391 391 391
Pine 8-14 cm 450 482 482 482 482 482 482
Pine14-20 cm 550 582 585 589 592 599 599
Pine>20 cm 650 682 685 688 691 696 696
Euc <8 cm 350 303 303 303 303 303 303
Euc 8-14 cm 390 390 390 390 390 390 390
Euc 14-20 cm 440 440 449 455 455 462 462
Euc >20 cm 580 580 592 601 601 610 610
Pöyry’s projected log prices are flat in real terms for all but the sawlog grades
where a modest improvement in price, supported by strong demand, is assumed.
Change in Area through Forest Acquisitions
Since Pöyry’s 31 December 2005 valuation update, Sino-Forest’s total plantation
assets have increased from 324 296.2 ha to 352 010.2 ha. This represents a netincrease of 27 713.9 ha (8.5%). Data provided by Sino-Forest indicates that the net
increase is the cumulative effect of:
a) An increase in planted forest areas
b) The purchase of plantations in Guangdong, Guangxi, Hunan and Jiangxi
c) The sale of plantations in Fujian, Guangdong, Heilongjiang, Hunan and
Jiangxi.
8/3/2019 Sino-Forest Poyry Valuation Dec 2006 Final
http://slidepdf.com/reader/full/sino-forest-poyry-valuation-dec-2006-final 11/122
38A08032
Copyright © Pöyry Forest Industry ix
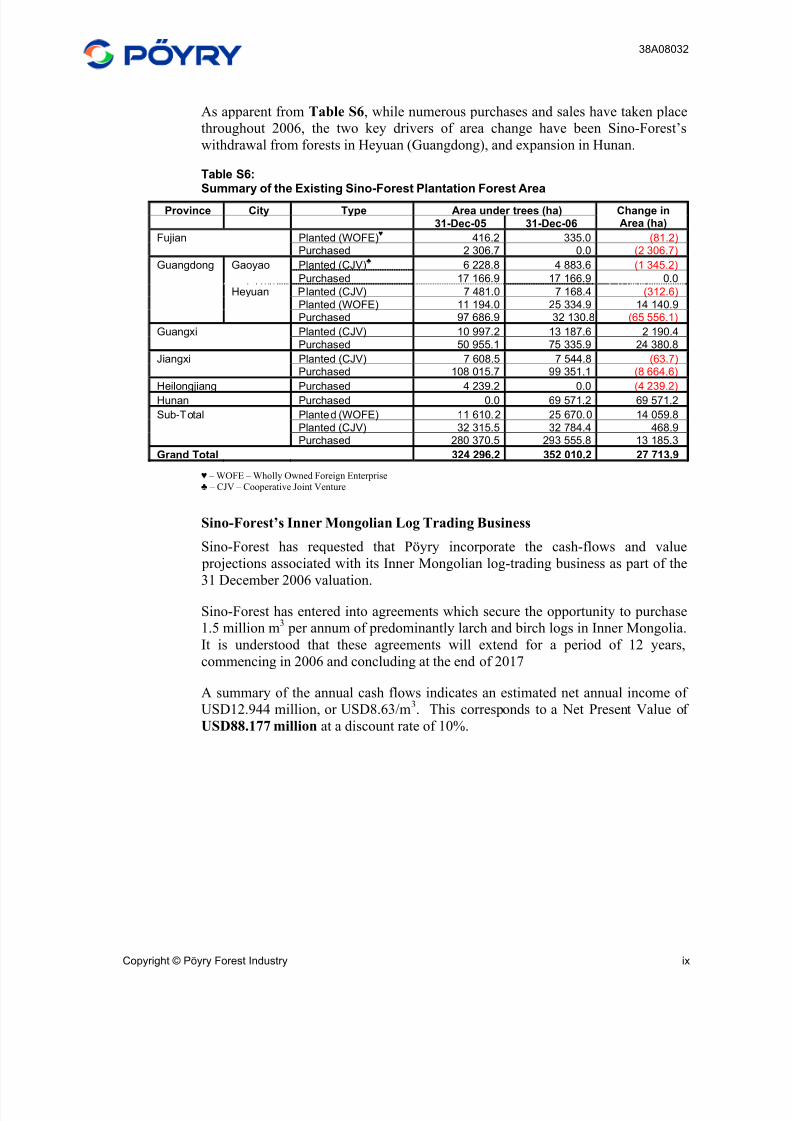
As apparent from Table S6, while numerous purchases and sales have taken place
throughout 2006, the two key drivers of area change have been Sino-Forest’s
withdrawal from forests in Heyuan (Guangdong), and expansion in Hunan.
Table S6:Summary of the Existing Sino-Forest Plantation Forest Area
Province City Type Area under trees (ha)
31-Dec-05 31-Dec-06
Change inArea (ha)
Fujian Planted (WOFE)♥
416.2 335.0 (81.2)Purchased 2 306.7 0.0 (2 306.7)
Guangdong Gaoyao Planted (CJV)♣
6 228.8 4 883.6 (1 345.2)
Purchased 17 166.9 17 166.9 0.0
Heyuan Planted (CJV) 7 481.0 7 168.4 (312.6)
Planted (WOFE) 11 194.0 25 334.9 14 140.9Purchased 97 686.9 32 130.8 (65 556.1)
Guangxi Planted (CJV) 10 997.2 13 187.6 2 190.4
Purchased 50 955.1 75 335.9 24 380.8
Jiangxi Planted (CJV) 7 608.5 7 544.8 (63.7)Purchased 108 015.7 99 351.1 (8 664.6)
Heilongjiang Purchased 4 239.2 0.0 (4 239.2)
Hunan Purchased 0.0 69 571.2 69 571.2
Sub-Total Planted (WOFE) 11 610.2 25 670.0 14 059.8
Planted (CJV) 32 315.5 32 784.4 468.9Purchased 280 370.5 293 555.8 13 185.3
Grand Total 324 296.2 352 010.2 27 713.9
♥ – WOFE – Wholly Owned Foreign Enterprise♣ – CJV – Cooperative Joint Venture
Sino-Forest’s Inner Mongolian Log Trading Business
Sino-Forest has requested that Pöyry incorporate the cash-flows and value
projections associated with its Inner Mongolian log-trading business as part of the
31 December 2006 valuation.
Sino-Forest has entered into agreements which secure the opportunity to purchase
1.5 million m3 per annum of predominantly larch and birch logs in Inner Mongolia.
It is understood that these agreements will extend for a period of 12 years,
commencing in 2006 and concluding at the end of 2017
A summary of the annual cash flows indicates an estimated net annual income of
USD12.944 million, or USD8.63/m3. This corresponds to a Net Present Value of
USD88.177 million at a discount rate of 10%.
8/3/2019 Sino-Forest Poyry Valuation Dec 2006 Final
http://slidepdf.com/reader/full/sino-forest-poyry-valuation-dec-2006-final 12/122
38A08032
Copyright © Pöyry Forest Industry x
CONTENTS
PREFACE I
CERTIFICATION II
ASSUMPTIONS AND LIMITING CONDITIONS IV
SUMMARY V
1 INTRODUCTION 1
2 PURPOSE AND SCOPE 2
2.1 Purpose of the Valuation Update 2
2.2 Scope of the Valuation Update 2
2.3 Matters Outside the Scope of the Valuation Update 3
3 VALUATION METHODOLOGY 4
3.1 Outline of Valuation Methods 4
3.2 Comparable Sales 4
3.3 Expectation Approach 6
3.3.1 Realisation Value of Current Standing Stock 6
3.4 Compounding of Costs 7
3.5 Valuation Methods Applied in Valuing the Sino-Forest Assets 83.6 Valuation Process 8
3.7 Other Aspects of Applying the Expectation Approach 9
3.7.1 Analysis of Pre-tax or Post-tax Cash Flows 10
3.7.2 The Period of Analysis 10
4 RESOURCE AREA DESCRIPTION 11
4.1 Resource Location 11
4.2 Resource Area 11
4.2.1 Productive Forest Area as at 31 December 2006 12
4.2.2 Area Revisions and Updates 15
4.2.3 Field Inspection Area Analysis 16
4.2.4 Plantation Asset Development 16
5 GROWTH AND YIELD 17
5.1 History of Yield Table Development 17
5.1.1 Tree Volume Calculations 17
5.1.2 Existing Yield Table Formulation 18
5.2 Inventory Data and Yield Table Revisions 20
5.3 Yields Assumed in the December 2006 Sino-Forest Valuation 20
8/3/2019 Sino-Forest Poyry Valuation Dec 2006 Final
http://slidepdf.com/reader/full/sino-forest-poyry-valuation-dec-2006-final 13/122
38A08032
Copyright © Pöyry Forest Industry xi
5.3.1 Regeneration and Future Yield Profiles 25
6 PLANTATION RISKS 27
6.1 Fire 27
6.2 Frost 276.3 Pests and Disease 27
6.4 Typhoons 28
7 COSTS 29
7.1 Operational Costs 29
7.2 Costs of Production 33
7.2.1 Harvesting Costs 33
7.2.2 Transport Costs 34
7.3 Taxes at Harvest 34
7.4 Overhead Costs 35
7.5 Cooperative Joint Ventures 357.6 Land Rental 35
7.7 Log Traders Margin 36
8 LOG MARKETS AND PRICING 37
8.1 Log Price Benchmark 37
8.1.1 Eucalyptus 37
8.1.2 Chinese fir 38
8.1.3 Pine Species 39
8.2 Logs Prices Employed in the December 2006 Valuation 40
8.3 Market Overview 40
9 WOOD FLOW AND ALLOCATION MODEL 41
9.1 Overview 41
9.2 Observed Practice in Wood Flow Modelling 44
9.3 Modelling Supply and Demand 45
9.4 Croptype Allocation 45
9.5 Model Constraints 46
9.5.1 Clearfell Age Constraints 46
9.5.2 Wood Flow and Allocation Constraints 47
9.6 Wood Flow and Allocation Model Results 48
10 DISCOUNTED CASH FLOW VALUATION 51
10.1 Overview 51
10.2 Treatment of Taxation 52
10.3 Scope of the Analysis 52
10.4 Timing of Cash Flows 53
10.5 Date of Valuation 53
11 DISCOUNT RATE 54
8/3/2019 Sino-Forest Poyry Valuation Dec 2006 Final
http://slidepdf.com/reader/full/sino-forest-poyry-valuation-dec-2006-final 14/122
38A08032
Copyright © Pöyry Forest Industry xii
11.1 Discount Rate Derived from WACC/CAPM 54
11.2 Implied Discount Rates 54
11.3 Incorporating Risk in the Discount Rate 55
11.4 The Discount Rate Applied in Valuing the Sino-Forest Resource 55
12 VALUATION RESULTS 57
12.1 Exchange Rate 57
12.2 Valuation as at 31 December 2006 57
12.3 Merchantable Volume 58
13 SENSITIVITY ANALYSIS 59
14 VALUE CHANGE ANALYSIS 60
15 SINO-FOREST’S INNER MONGOLIAN LOG TRADING BUSINESS 61
Appendices
Appendix 1: Field Inspection Report
Appendix 2: Market Overview
8/3/2019 Sino-Forest Poyry Valuation Dec 2006 Final
http://slidepdf.com/reader/full/sino-forest-poyry-valuation-dec-2006-final 15/122
38A08032
Copyright © Pöyry Forest Industry 1
1 INTRODUCTION
Pöyry Forest Industry Ltd (Pöyry) has been requested by Sino-Forest Corporation
(Sino-Forest) to prepare a valuation of its existing and prospective forest assets of
Sino-Forest in Southern China. Pöyry has previously conducted forest valuationson specific areas within the forest estate in 2000, 2001, 2003, 2004 and 2005.
This valuation presents an update of Pöyry’s 31 December 2005 forest valuation
that was incorporated in Report 38A06804.
The data for this valuation has been provided by Sino-Forest and its associated
Cooperative Joint Venture (CJV) companies.
On 28 September 2006 Sino-Forest issued a news release2
announcing its entering
into a master agreement to acquire approximately 100 000 ha of pine and fir
plantations in Hunan Province. On 7 December 2006, a further news release2 was
issued detailing the signing of an agreement to acquire an additional 300 000 ha in
Hunan, thus bringing the total area of planned acquisitions to 400 000 ha.
Within this valuation exercise Pöyry has confined its field visits to the Provinces of
Guangxi and Hunan. A field inspection report is presented in Appendix 1. It is
Pöyry’s intention to visit other regions in a process of rolling inspections so that all
of Sino-Forest’s operations are visited within the annual valuation update process
over time.
2Available from – http://www.sinoforest.com/companyreleases.asp
8/3/2019 Sino-Forest Poyry Valuation Dec 2006 Final
http://slidepdf.com/reader/full/sino-forest-poyry-valuation-dec-2006-final 16/122
38A08032
Copyright © Pöyry Forest Industry 2
2 PURPOSE AND SCOPE
2.1 Purpose of the Valuation Update
The purpose of the valuation is to estimate the market value of the forests for assetreporting purposes; “market value” is defined as:
“the most probable price which a property should bring in a competitive and open market under all conditions requisite to a fair sale, the buyer and seller each acting prudently and knowledgeably, and assuming that the price is not affected by undue stimulus. Implicit in this definition is the consummation of a
sale as of a specified date and the passing of title from seller to buyer under conditions whereby
The buyer and seller are typically motivated.
Both parties are well informed or well advised, and acting in what they
consider their own best interests.
A reasonable time is allowed for exposure in the open market.
The price represents the normal consideration for the property sold unaffected by special or creative financing or sales concessions granted by anyone associated with the sale”
3.
The market value of the assets is estimated as at 31st
December 2006.
2.2 Scope of the Valuation Update
The Valuation update employs an income expectation approach based on projected
wood flows (Section 3). Asset value has been estimated using pre-tax cash flows
and a discount rate expressed in real terms.
As a valuation update, the exercise has specifically addressed the following:
Material changes to the land base between 31 December 2005 and 31
December 2006.
Acknowledgement of recent inventory data and their impacts on regional
yield estimates.
Acknowledgement of prevailing log prices.
Acknowledgement of expectations for future log prices.
Acknowledgement of new evidence of market perception of forest value
demonstrated in recent transaction announcements.
3Uniform Standards of Professional Appraisal Practice, The Appraisal Institute (www.appraisalinstitute.org).
8/3/2019 Sino-Forest Poyry Valuation Dec 2006 Final
http://slidepdf.com/reader/full/sino-forest-poyry-valuation-dec-2006-final 17/122
38A08032
Copyright © Pöyry Forest Industry 3
Acknowledgement of WACC estimates as provided by UniServices
Auckland Limited.
Recognition that the forest estate is now 12 months further along the cash
flow stream that was projected in the course of the 31 December 2005
valuation.
2.3 Matters Outside the Scope of the Valuation Update
In the absence of any prominent evidence of material change, Pöyry has not
adjusted the valuation for the following factors:
Yield tables (with the exception of Guangxi and Hunan).
Costs of goods sold (i.e. harvesting and transport) except for costs
associated with recent land acquisitions.
Direct costs of forest operations (establishment, silviculture, etc) except for
costs associated with recent land acquisitions.
8/3/2019 Sino-Forest Poyry Valuation Dec 2006 Final
http://slidepdf.com/reader/full/sino-forest-poyry-valuation-dec-2006-final 18/122
38A08032
Copyright © Pöyry Forest Industry 4
3 VALUATION METHODOLOGY
3.1 Outline of Valuation Methods
Accompanying the global expansion in planted forests has been ongoingrefinement of the processes employed in forest appraisal.
Three main methods of appraisal are commonly distinguished. These are:
1. Comparable sales
2. Expectation value
3. Cost
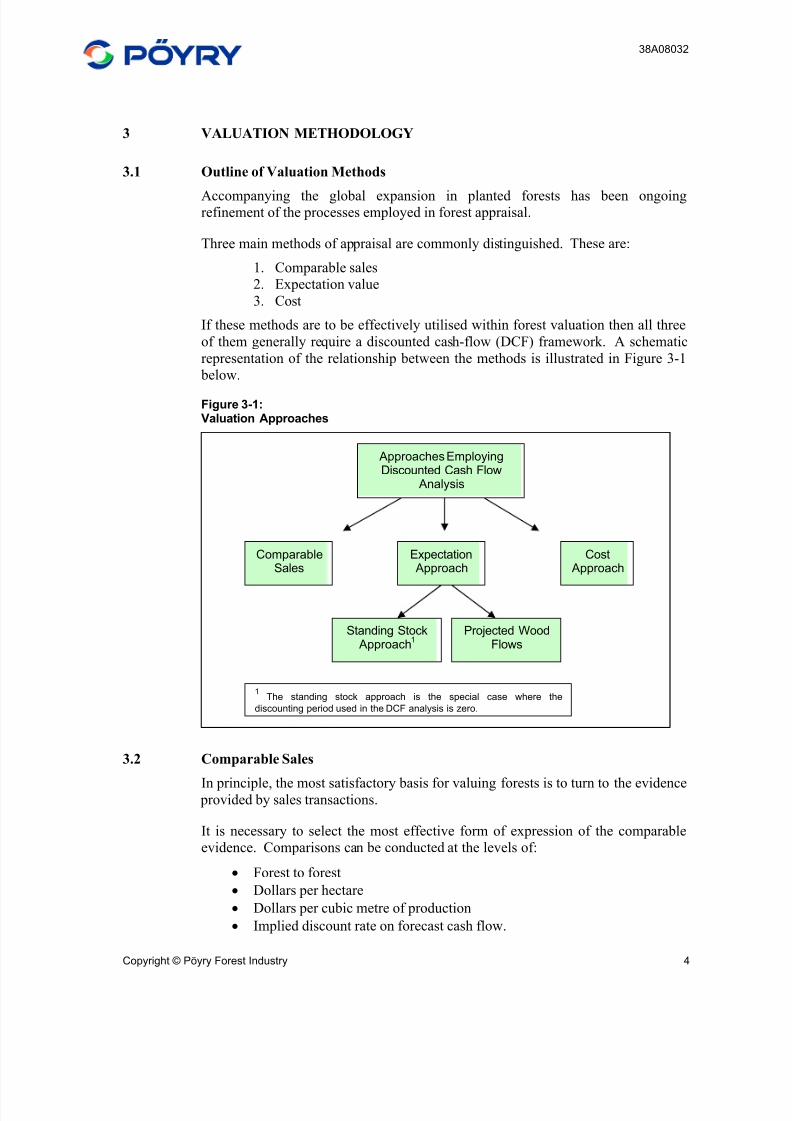
If these methods are to be effectively utilised within forest valuation then all three
of them generally require a discounted cash-flow (DCF) framework. A schematic
representation of the relationship between the methods is illustrated in Figure 3-1
below.
Figure 3-1:Valuation Approaches
3.2 Comparable Sales
In principle, the most satisfactory basis for valuing forests is to turn to the evidence provided by sales transactions.
It is necessary to select the most effective form of expression of the comparable
evidence. Comparisons can be conducted at the levels of:
• Forest to forest
• Dollars per hectare
• Dollars per cubic metre of production
• Implied discount rate on forecast cash flow.
Standing StockApproach
1
Approaches EmployingDiscounted Cash Flow
Analysis
ComparableSales
ExpectationApproach
CostApproach
Projected WoodFlows
1The standing stock approach is the special case where the
discounting period used in the DCF analysis is zero.
8/3/2019 Sino-Forest Poyry Valuation Dec 2006 Final
http://slidepdf.com/reader/full/sino-forest-poyry-valuation-dec-2006-final 19/122
38A08032
Copyright © Pöyry Forest Industry 5
In reviewing the potential role of each parameter it is necessary to consider what
factors influence the value of planted forests. Important factors may include:
• Forest maturity
• Species composition
•
Site productivity• Proximity to market
• Forest terrain (and thereby harvesting system)
• Silvicultural history
• Land value
Each of these factors may have a profound effect on forest value. Other factors are
also recognised. Examples include the standard of roading infrastructure in the
forest, and risk characteristics associated with climatic and pathogenic factors.
Forest size can have an influence, although there may not be a consistent trend with
changing forest area.
When comparing forests and the prices paid for them it is also necessary to
consider the time at which an example sale took place. In the first instance the
timing is reflected in perceptions of log prices. These involve not just the current
prices, but also expectations of future price development.
Given the range of factors affecting forest value, it is statistically unlikely that
forests can be found that are closely similar to a subject forest being valued. This
is especially the case given that forest estate transactions in China have not been, to
date, particularly frequent. Achieving a forest-to-forest match is extremely
unlikely, as it would require finding forests alike in all respects, including size.
Forest appraisers have generally come to accept that the one distillable parameter
that can be most usefully extracted from transactions involving heterogeneous
forest resources is the Implied Discount Rate (IDR). Derivation of the IDR involves developing a credible projection of anticipated wood flows and then cash
flows for each transacted forest, using the best information the analyst can obtain.
This is then juxtaposed with the price actually paid for each resource. The discount
rate at which the discounted cash flows match the purchase price is the IDR.
The IDR offers a device by which differences in size, timing, markets, location,
age-class, volume, operability and other relevant factors are recognised. Further,
the approach also recognises that a useful method of arriving at a market
comparable result is to employ the same means that market participants utilise in
deriving and supporting their negotiating positions. For Southern Hemisphere
forest resources, the most common method of negotiating transaction values
involves DCF constructions.
Given the lack of available comparable sales data for China, combined with the
complexities in identifying what margin above other implied discount rates that
forestry in Southern China should attract, Pöyry’s preference was to not employ
this method in valuing the Sino-Forest assets.
8/3/2019 Sino-Forest Poyry Valuation Dec 2006 Final
http://slidepdf.com/reader/full/sino-forest-poyry-valuation-dec-2006-final 20/122
38A08032
Copyright © Pöyry Forest Industry 6
3.3 Expectation Approach
The Expectation approach provides the Net Present Value of the future net revenue
stream. It is variously referred to as the “NPV”, “PV”, or “Income” approach4. As
the terminology implies, the NPV approach involves projecting the anticipated
future net income stream, and then “discounting” this, at a suitable cost of capital,
in order to acknowledge the lower economic value of delayed receipts.
The NPV approach generally involves adopting the standpoint of a potential
forest purchaser. To this individual or entity, funds previously invested in the
forest are irrelevant – the exclusive focus is on the forest’s future earning
capability.
A crucial parameter within the NPV analysis is the “discount rate”. The longer
the period before income realisation, and the greater the discount rate, the
greater the reduction in NPV. Forest investments are generally of a long term
and their value is especially sensitive to the discount rate.
Provided that the eventual revenues are as good as or better than the valuation
assumes, an investor purchasing the forest at the derived value is assured of a
rate of return on investment at least equivalent to the discount rate.
For the so-called Expectation approach it is common practice to derive a Weighted
Average Cost of Capital. This distinguishes the distinct costs of debt and equity. A
well-recognised procedure for deriving the cost of equity is through application of
the Capital Asset Pricing Model. Pöyry engages the services of an external expert,
Associate Professor Alastair Marsden of Auckland University, to prepare a
WACC-based derivation of discount rate. Institutional investors are mindful that
forestry represents just one opportunity within the full range of capital markets. A
thorough consideration of WACC/CAPM evidence has become an increasingly
important component of forest valuation.
The manner in which the Comparable Sales and Expectation approaches are
applied appears at first impression to be similar. Both employ a DCF formulation
and refer to estimates of future cash flows. This does not imply that they should be
coalesced into one single method. There is sufficient difference between them that
they can potentially lead to quite different results.
3.3.1 Realisation Value of Current Standing Stock
This method warrants some distinct discussion because it has had some historical
application. It recognises the potential net realisation value of the current timber
content of the forest if it were cut down immediately. A value is based on the
merchantable content (or “standing stock”) at the time of the valuation. It istherefore a special case within the Expectation approach. Because the forest is
harvested immediately, the cash flow modelling is confined to a single period. No
discounting is required to recognise the cost of capital. This value is both tangible
4The list is not exhaustive. Other acronyms that may appear include PNW (Present Net Worth) and PW (Present
Worth). In some jurisdictions, Net Present Value may include the costs of bringing the valued entity to sale.
However in referring to NPV in this document we have used the term in its popular if inexact role, and treated it as
providing equivalent results to the income approach.
8/3/2019 Sino-Forest Poyry Valuation Dec 2006 Final
http://slidepdf.com/reader/full/sino-forest-poyry-valuation-dec-2006-final 21/122
38A08032
Copyright © Pöyry Forest Industry 7
and comparatively straightforward to calculate. It does however have obvious
limitations:
For plantation forests, the timber realisation value of the stand may be very low
for most of the rotation length. Despite this, the vendor will be mindful of the
funds invested in each stand and can be expected to seek some reimbursement. By the final years of the characteristic rotation, the marginal rate of value
growth of the standing stock becomes considerable. An informed and rational
owner will recognise the economic opportunity associated with holding the
growing trees rather than selling them. Only if the purchaser’s offer matches
the vendor’s perception of economic opportunity cost can the vendor be
indifferent as to whether to hold or sell. Inherently, therefore, the vendor’s
perspective is based not on the current timber content but instead on the future
anticipated revenue.
For forest resources of significant size (e.g. Sino-Forest) it is unlikely that the
market could absorb all of the forest wood content at once without log prices
being depressed. Furthermore, Annual Allowable Cut (AAC) constraints prevent such harvesting strategies from being employed operationally.
The first effect leads to an unduly conservative valuation while the third can lead to
an overly optimistic result. It is plausible, but unlikely, that the two effects might
offset one another. Pöyry’s preference in valuing forests is to avoid this method
altogether, as it has no rational basis for emulating expected investor behaviour.
3.4 Compounding of Costs
This method takes the costs involved in acquiring or establishing and maintaining
the forest and accumulates these with compound interest from their inception of the
investment to the current point in time. This forest value is therefore the price thatforest owners would have to receive if they were to obtain a satisfactory rate of
return on their investment to date. The method is equivalent to the accountants’
concept of “capitalising” establishment/acquisition costs plus interest, although the
forest valuer is more inclined to adopt assumed costs which are "standard" and
current at the time of the valuation.
By using costs that are current, along with a “real” (inflation-corrected)
compounding rate, the valuation is updated for inflation. The use of “industry
standard” costs ensures that only costs consistent with efficient practice are
recognised. Forest valuers are wary of the compounding approach, and likewise
capitalisation. In the market place a “high cost” forest does not necessarily prove
to be a “high value” forest5
and yet this is what the method can imply.
5Davy, A. (1987) Accounting for forestry activities in New Zealand. New Zealand Society of Accountants Research
Bulletin R117.
8/3/2019 Sino-Forest Poyry Valuation Dec 2006 Final
http://slidepdf.com/reader/full/sino-forest-poyry-valuation-dec-2006-final 22/122
38A08032
Copyright © Pöyry Forest Industry 8
3.5 Valuation Methods Applied in Valuing the Sino-Forest Assets
Within this valuation Pöyry has valued the forests using an expectation approach
based on a projected wood flow profile. Cash flows attributable to both the
existing rotations and planned future rotations of the forest have been included.
The forest estate has been modelled on a perpetual basis for both the existing and
succeeding rotations, thereby recognising the expected long-term management
intentions and continued sustainability of the estate. The valuation is based on real
pre-tax cash flows.
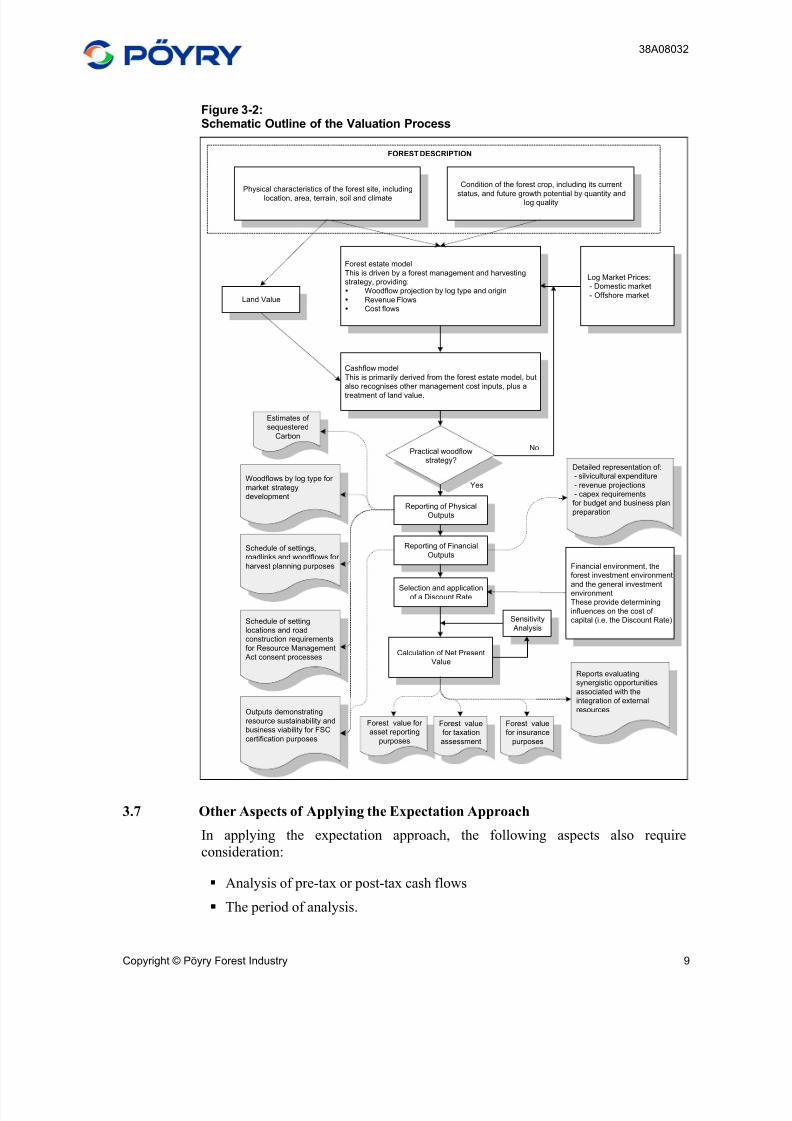
3.6 Valuation Process
The process employed in valuing the Sino-Forest estate can be summarised under
the following key steps:
i) Data assembly and updating of the forest description.
ii) Execution of a field inspection.
iii) Recognition of field inspection findings into the resource description if required.
iv) Review of harvest reconciliations and yield tables (total recoverable volume
and volume by product).
v) Identification of land value and costs and how these are to be incorporated
in the forest valuation.
vi) Review and updating of relevant direct and indirect costs.
vii) Updating of log price data and log price allocation.
viii) Construction of the forest estate model and projection of the future wood
flows by log grade.
ix) Derivation of cost and revenue flows.
x) Selection of the appropriate compounding and discounting rates, including
analysis of:
a) Implied discount rates from transaction evidence (if applicable)
b) Discount rates derived from WACC/CAPM formulations.
xi) Estimation of the value of the forest and tree crop.
xii) Sensitivity analysis.
xiii) Value change analysis.
The above process is illustrated in Figure 3-2.
8/3/2019 Sino-Forest Poyry Valuation Dec 2006 Final
http://slidepdf.com/reader/full/sino-forest-poyry-valuation-dec-2006-final 23/122
38A08032
Copyright © Pöyry Forest Industry 9
Figure 3-2:Schematic Outline of the Valuation Process
Physical characteristics of the forest site, including
location, area, terrain, soil and climate
Condition of the forest crop, including its current
status, and future growth potential by quantity andlog quality
FOREST DESCRIPTION
Forest estate model
This is driven by a forest management and harvestingstrategy, providing:
Woodflow projection by log type and origin
Revenue Flows
Cost flows
Land Value
Cashflow model
This is primarily derived from the forest estate model, butalso recognises other management cost inputs, plus a
treatment of land value.
Log Market Prices:- Domestic market
- Offshore market
Practical woodflowstrategy?
Selection and applicationof a Discount Rate
Sensitivity
Analysis
Financial environment, theforest investment environment
and the general investmentenvironmentThese provide determining
influences on the cost of capital (i.e. the Discount Rate)
Calculation of Net PresentValue
Forest value for asset reporting
purposes
Forest valuefor insurance
purposes
Forest valuefor taxation
assessment
Detailed representation of:- silvicultural expenditure
- revenue projections- capex requirementsfor budget and business plan
preparation
Estimates of sequestered
Carbon
Woodflows by log type for
market strategydevelopment
Schedule of settings,roadlinks and woodflows for
harvest planning purposes
Schedule of settinglocations and roadconstruction requirements
for Resource ManagementAct consent processes
Reports evaluatingsynergistic opportunities
associated with theintegration of external
resourcesOutputs demonstrating
resource sustainability andbusiness viability for FSC
certification purposes
Reporting of PhysicalOutputs
Reporting of Financial
Outputs
No
Yes
3.7 Other Aspects of Applying the Expectation Approach
In applying the expectation approach, the following aspects also require
consideration:
Analysis of pre-tax or post-tax cash flows
The period of analysis.
8/3/2019 Sino-Forest Poyry Valuation Dec 2006 Final
http://slidepdf.com/reader/full/sino-forest-poyry-valuation-dec-2006-final 24/122
38A08032
Copyright © Pöyry Forest Industry 10
3.7.1 Analysis of Pre-tax or Post-tax Cash Flows
Both approaches have been demonstrated in valuing planted forests. For cash
flows derived on a pre-tax basis a pre-tax discount rate is applied. Consistent with
Pöyry’s 31 December 2005 valuation, the valuation has been completed on a pre-
tax basis, using cash flows (and discount rate) expressed in real-terms.
3.7.2 The Period of Analysis
Wood flows and associated cash flows may be modelled on a perpetual basis or
they may be confined to the current rotation.
Pöyry has observed ongoing changes in forest valuation practices. These have
been particularly evident as the level of transaction activity has increased.
Forest estate models have come to be an integral part of the forest valuation
process, being applied to identify the forest’s long-term supply capability. Despite
this extended wood flow-modelling horizon, there has been a general tendency to
confine the scope of the financial analysis to those cash flows solely associated
with the tree crop that currently exists. This includes all parts of the present forest
from the oldest stands to those just established. It excludes, however, trees that are
yet to be planted as these are considered to be part of a new investment cycle.
Wider business appraisal practice encourages the confinement of the scope of
analysis to the current investment cycle. There are arguments that forest valuation
should be no different. The practice of considering the performance of the existing
tree crop alone lies with the general preference for avoiding unnecessary conjecture
associated with costs, yields, anticipated revenues and the future discount rate.
As generally applied, the current rotation model is not to be confused with the
“standing-stock approach”. Instead, the harvesting strategy for the current tree
crop is assumed to be consistent with a long-term sustainable management policy,
and although there will be future rotations, they will not contribute to the net
present value calculation, i.e. they are “NPV neutral”. In effect, all funds invested
in them are assumed to earn such proceeds that the investment generates exactly
the discount rate.
The current rotation model effectively assumes that through adaptive management
the forest owners will seek to secure at least NPV neutrality on their reinvestment
in succeeding rotations. Within the valuation of the Sino-Forest assets Pöyry has
modelled the resource over multiple rotations in order to reflect the long-term
management outlook of the estate. The current valuation assumes however thatsecond and subsequent rotations will be NPV neutral. The analysis is therefore
effectively confined to the cash flows associated with the current rotation.
8/3/2019 Sino-Forest Poyry Valuation Dec 2006 Final
http://slidepdf.com/reader/full/sino-forest-poyry-valuation-dec-2006-final 25/122
38A08032
Copyright © Pöyry Forest Industry 11
4 RESOURCE AREA DESCRIPTION
4.1 Resource Location
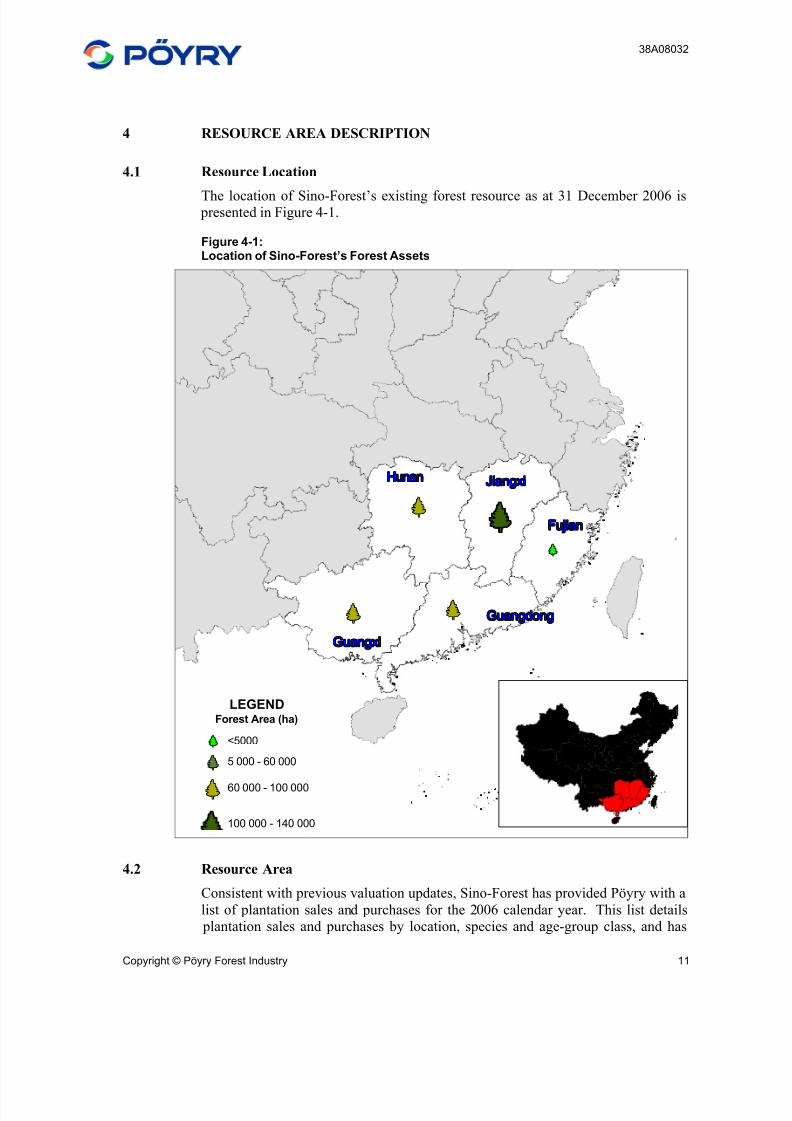
The location of Sino-Forest’s existing forest resource as at 31 December 2006 is presented in Figure 4-1.
Figure 4-1:Location of Sino-Forest’s Forest Assets
YYYYYYYYY
YYYYYYYYYYYYYYYYYYYYYYYYY
YYYYYYYYY
YYYYYYYYY
YYYYYYYYYGuangxiGuangxiGuangxiGuangxiGuangxiGuangxiGuangxiGuangxiGuangxi
GuangdongGuangdongGuangdongGuangdongGuangdongGuangdongGuangdongGuangdongGuangdong
FujianFujianFujianFujianFujianFujianFujianFujianFujian
JiangxiJiangxiJiangxiJiangxiJiangxiJiangxiJiangxiJiangxiJiangxiHunanHunanHunanHunanHunanHunanHunanHunanHunan
LEGENDForest Area (ha)
YYYYYYYYY <5000
YYYYYYYYY 5 000 - 60 000
YYYYYYYYY60 000 - 100 000
100 000 - 140 000
4.2 Resource Area
Consistent with previous valuation updates, Sino-Forest has provided Pöyry with a
list of plantation sales and purchases for the 2006 calendar year. This list details
plantation sales and purchases by location, species and age-group class, and has
8/3/2019 Sino-Forest Poyry Valuation Dec 2006 Final
http://slidepdf.com/reader/full/sino-forest-poyry-valuation-dec-2006-final 26/122
38A08032
Copyright © Pöyry Forest Industry 12
been used to adjust the area statement prepared by Pöyry as part of its 2005
valuation update of Sino-Forest’s resources.
In addition to the adjustments detailed in its 2006 sales and purchases, Sino-Forest
has also provided information on additional area changes that were required.
Pöyry has verified the derived area statement directly with Sino-Forest and has
been advised that the areas are representative of the Company’s plantation
resources as at 31 December 2006.
4.2.1 Productive Forest Area as at 31 December 2006
Sino-Forest’s plantation assets as at 31 December 2006 are summarised in Table
4-1 by Location and Ownership-Type.
Purchases, Sales and Adjustments
The data provided by Sino-Forest details that during the 2006 calendar year, a totalof 101 595 ha of forests have been sold and 129 276.3 ha purchased. Further to
these records, Sino-Forest indicated it has swapped 10 000 ha and sold an
additional 4 496 ha of forests in Heyuan.
Derived Resource Description
Since Pöyry’s 31 December 2005 valuation update, Sino-Forest’s total plantation
assets have increased from 324 296.2 ha to 352 010.2 ha. This represents a net
increase of 27 713.9 ha (8.5%). Data provided by Sino-Forest indicates that the net
increase is the cumulative effect of:
a) An increase in planted forest areas;
b) The purchase of plantations in Guangdong, Guangxi, Hunan and Jiangxi;
c) The sale of plantations in Fujian, Guangdong, Heilongjiang, Hunan and
Jiangxi.
As apparent from Table 4-1, while numerous purchases and sales have taken place
throughout 2006, the two key drivers of area change have been Sino-Forest’s
withdrawal from forests in Heyuan (Guangdong), and expansion in Hunan.
8/3/2019 Sino-Forest Poyry Valuation Dec 2006 Final
http://slidepdf.com/reader/full/sino-forest-poyry-valuation-dec-2006-final 27/122
38A08032
Copyright © Pöyry Forest Industry 13
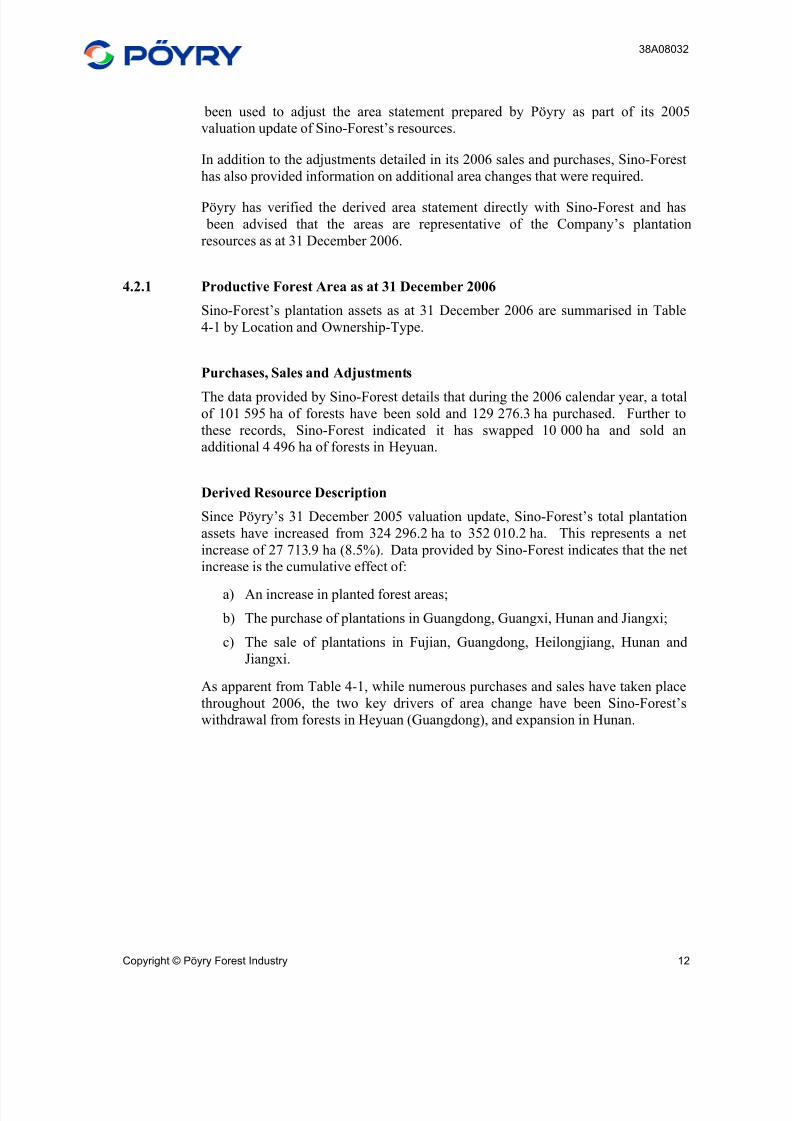
Table 4-1:Summary of the Existing Sino-Forest Plantation Forest Area
Province City Type Area under trees (ha)31-Dec-05 31-Dec-06
Change inArea (ha)
Fujian Planted (WOFE)♥
416.2 335.0 (81.2)Purchased 2 306.7 0.0 (2 306.7)
Guangdong Gaoyao Planted (CJV)♣ 6 228.8 4 883.6 (1 345.2)
Purchased 17 166.9 17 166.9 0.0
Heyuan Planted (CJV) 7 481.0 7 168.4 (312.6)Planted (WOFE) 11 194.0 25 334.9 14 140.9Purchased 97 686.9 32 130.8 (65 556.1)
Guangxi Planted (CJV) 10 997.2 13 187.6 2 190.4
Purchased 50 955.1 75 335.9 24 380.8
Jiangxi Planted (CJV) 7 608.5 7 544.8 (63.7)Purchased 108 015.7 99 351.1 (8 664.6)
Heilongjiang Purchased 4 239.2 0.0 (4 239.2)
Hunan Purchased 0.0 69 571.2 69 571.2
Sub-Total Planted (WOFE) 11 610.2 25 670.0 14 059.8Planted (CJV) 32 315.5 32 784.4 468.9
Purchased 280 370.5 293 555.8 13 185.3
Grand Total 324 296.2 352 010.2 27 713.9
♥ – WOFE – Wholly Owned Foreign Enterprise♣ – CJV – Cooperative Joint Venture
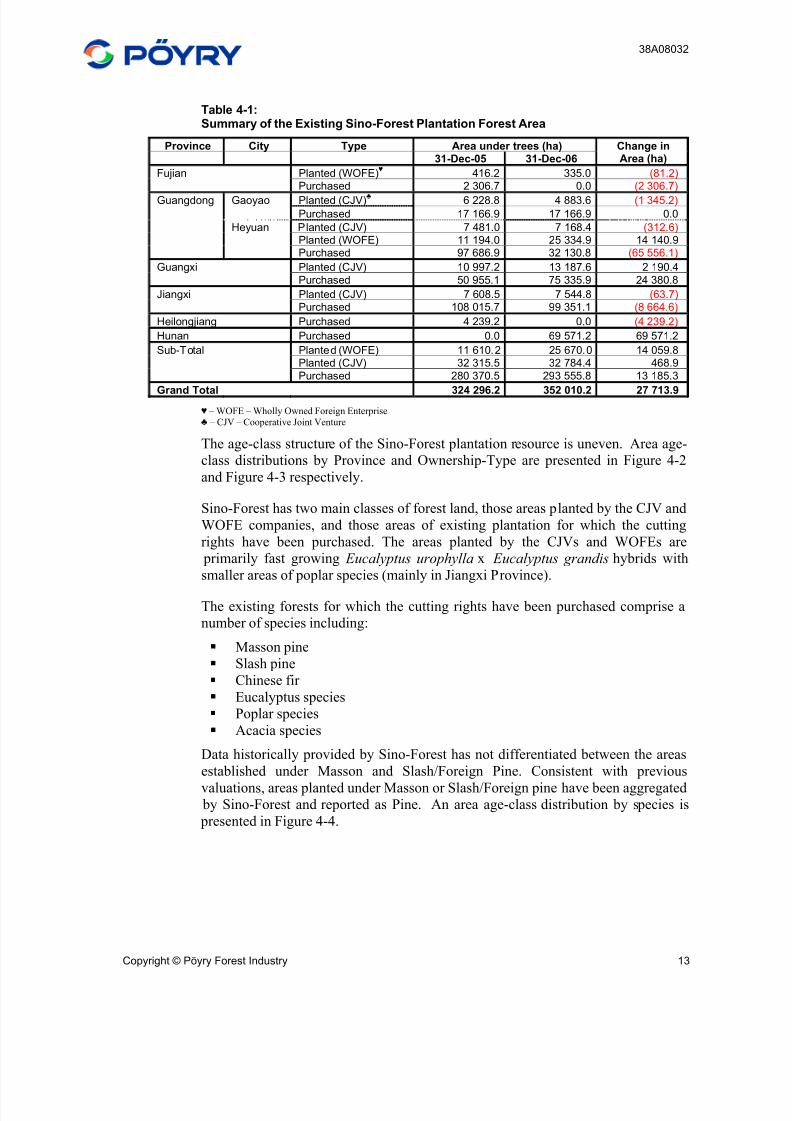
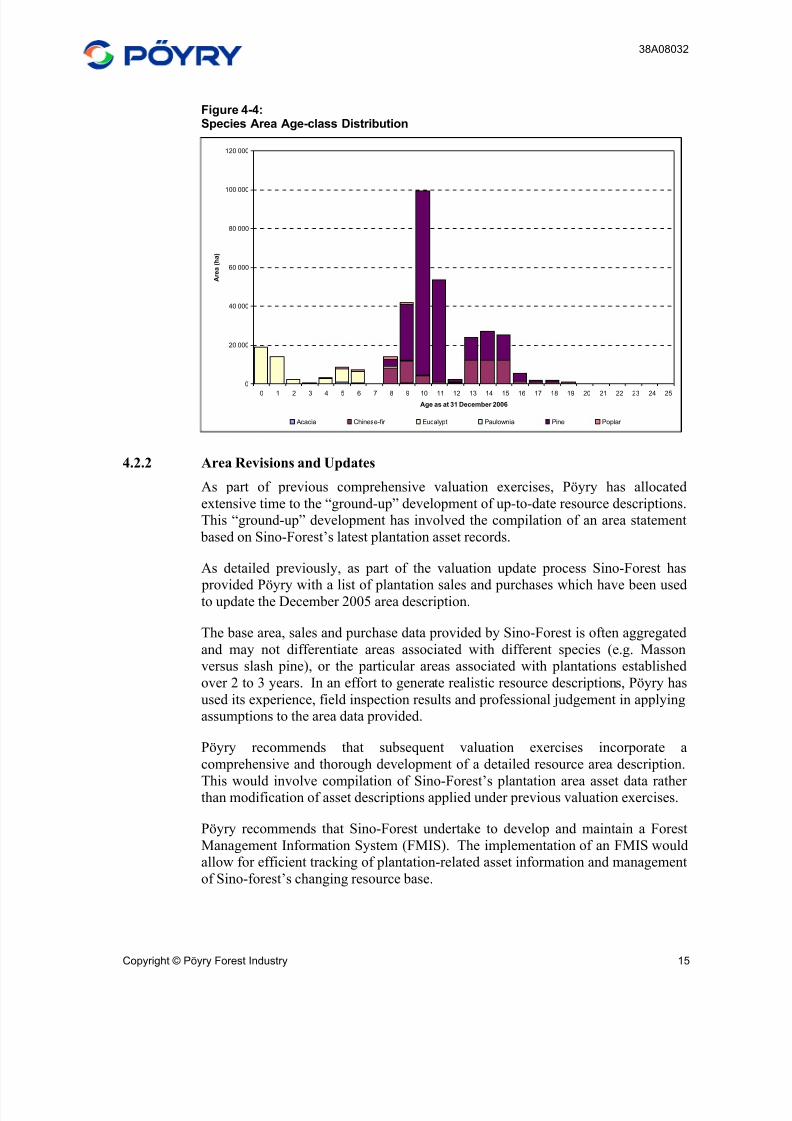
The age-class structure of the Sino-Forest plantation resource is uneven. Area age-
class distributions by Province and Ownership-Type are presented in Figure 4-2
and Figure 4-3 respectively.
Sino-Forest has two main classes of forest land, those areas planted by the CJV and
WOFE companies, and those areas of existing plantation for which the cutting
rights have been purchased. The areas planted by the CJVs and WOFEs are
primarily fast growing Eucalyptus urophylla x Eucalyptus grandis hybrids with
smaller areas of poplar species (mainly in Jiangxi Province).
The existing forests for which the cutting rights have been purchased comprise a
number of species including:
Masson pine
Slash pine
Chinese fir
Eucalyptus species
Poplar species
Acacia species
Data historically provided by Sino-Forest has not differentiated between the areas
established under Masson and Slash/Foreign Pine. Consistent with previous
valuations, areas planted under Masson or Slash/Foreign pine have been aggregated by Sino-Forest and reported as Pine. An area age-class distribution by species is
presented in Figure 4-4.
8/3/2019 Sino-Forest Poyry Valuation Dec 2006 Final
http://slidepdf.com/reader/full/sino-forest-poyry-valuation-dec-2006-final 28/122
38A08032
Copyright © Pöyry Forest Industry 14
Figure 4-2:Provincial Area Age-class Distribution
0
20 000
40 000
60 000
80 000
100 000
120 000
0 1 2 3 4 5 6 7 8 9 10 11 12 13 14 15 16 17 18 19 20 21 22 23 24 25
Age as at 31 December 2006
A r e a ( h a )
Fujian Guangdong Guangxi Hunan Jiangxi
Figure 4-3:Ownership-Type Area Age-class Distribution
0
20 000
40 000
60 000
80 000
100 000
120 000
0 1 2 3 4 5 6 7 8 9 10 11 12 13 14 15 16 17 18 19 20 21 22 23 24 25
Age as at 31 December 2006
A r e a ( h a )
Co-opera tive Join t Vent ure (Pl an ted) Who lly Owned Fore ign Enterpr ise (Plan ted) Purchased
8/3/2019 Sino-Forest Poyry Valuation Dec 2006 Final
http://slidepdf.com/reader/full/sino-forest-poyry-valuation-dec-2006-final 29/122
38A08032
Copyright © Pöyry Forest Industry 15
Figure 4-4:Species Area Age-class Distribution
0
20 000
40 000
60 000
80 000
100 000
120 000
0 1 2 3 4 5 6 7 8 9 10 11 12 13 14 15 16 17 18 19 20 21 22 23 24 25
Age as at 31 December 2006
A r e a ( h a )
Acacia Chinese-fir Eucalypt Paulownia Pine Poplar
4.2.2 Area Revisions and Updates
As part of previous comprehensive valuation exercises, Pöyry has allocated
extensive time to the “ground-up” development of up-to-date resource descriptions.
This “ground-up” development has involved the compilation of an area statement
based on Sino-Forest’s latest plantation asset records.
As detailed previously, as part of the valuation update process Sino-Forest has
provided Pöyry with a list of plantation sales and purchases which have been usedto update the December 2005 area description.
The base area, sales and purchase data provided by Sino-Forest is often aggregated
and may not differentiate areas associated with different species (e.g. Masson
versus slash pine), or the particular areas associated with plantations established
over 2 to 3 years. In an effort to generate realistic resource descriptions, Pöyry has
used its experience, field inspection results and professional judgement in applying
assumptions to the area data provided.
Pöyry recommends that subsequent valuation exercises incorporate a
comprehensive and thorough development of a detailed resource area description.
This would involve compilation of Sino-Forest’s plantation area asset data rather than modification of asset descriptions applied under previous valuation exercises.
Pöyry recommends that Sino-Forest undertake to develop and maintain a Forest
Management Information System (FMIS). The implementation of an FMIS would
allow for efficient tracking of plantation-related asset information and management
of Sino-forest’s changing resource base.
8/3/2019 Sino-Forest Poyry Valuation Dec 2006 Final
http://slidepdf.com/reader/full/sino-forest-poyry-valuation-dec-2006-final 30/122
38A08032
Copyright © Pöyry Forest Industry 16
4.2.3 Field Inspection Area Analysis
As part of the field inspection, Pöyry conducted a series of GPS boundary checks
to determine whether stocked areas provided by Sino-Forest were reasonable and
accurate. Although some variance was apparent at the individual plantation level,
only a 1.1% difference between the Sino-Forest-provided and Pöyry-determined
areas was apparent for the plantations sampled (Appendix 1).
While this was not an exhaustive sample of Sino-Forest’s plantation assets, field
inspection boundary checks suggested that the areas provided by Sino-Forest
appeared reasonable and accurate. Based on this, no adjustment to the areas
provided was deemed necessary.
4.2.4 Plantation Asset Development
In Pöyry’s 31 December 2005 valuation of the Sino-Forest assets, it was reported
that Sino-Forest was embarking on a 200 000 ha expansion of its estate in Heyuan
City. This was reflective of Sino-Forest’s management and development intent atthat time.
On 28 September 2006 Sino-Forest issued a news release announcing its entering
into a master agreement to acquire approximately 100 000 ha of pine and fir
plantations in Hunan Province. On 7 December 2006, a further news release was
issued detailing the signing of an agreement to acquire an additional 300 000 ha in
Hunan, thus bringing the total area of planned acquisitions to 400 000 ha.
Discussions with Sino-Forest suggest that, due to increasing costs, plantation
expansion efforts are now focussed on more cost effective locations such as Hunan.
Pöyry has accounted for the above-detailed expansion plans in developing
perpetual wood flow models. These expansion plans assume the regulated purchase of approximately 28 500 ha/year over the next 14 years. Given that an
area of 69 571.2 ha had already been purchased in Hunan as at 31 December 2006,
Pöyry has assumed that the 330 428.8 ha of subsequent expansions in Hunan will
be at a rate of approximately 23 600 ha/year.
Since there is a lack of available data on areas available for purchase, Pöyry has
made a series of assumptions relating to the species and age-class mix of these
potential acquisitions. These assumptions have been based on historic acquisitions
and expected forest structures.
Wood flows generated based on assumed acquisition areas in Hunan are intended
to be indicative and provide a basis for estimating potential wood flows. Theassumptions made with respect to the structure of acquisitions in Hunan will not
markedly affect the valuation result generated for 31 December 2006.
8/3/2019 Sino-Forest Poyry Valuation Dec 2006 Final
http://slidepdf.com/reader/full/sino-forest-poyry-valuation-dec-2006-final 31/122
38A08032
Copyright © Pöyry Forest Industry 17
5 GROWTH AND YIELD
5.1 History of Yield Table Development
In July 2003, Sino-Forest and its CJVs provided Pöyry with basic data relating tothe growth and yield of their existing plantations. Pöyry combined these with
information gathered from its own field measurements and other third party sources
available at that point in time, to generate growth and yield curves for existing and
future proposed forest plantations.
The development of yield tables usually begins at the time a stand is planted when
an area is assigned to a yield table projection based on a number of factors
including soil type, location, productivity of surrounding stands and genetic
composition.
Tree measurement data collected from inventories undertaken during the 2003 field
inspection were used to generate standing tree and stand volume estimates, asdescribed in Section 5.1.1. Volume estimates were then used to generate a suite of
yield tables (Section 5.1.2) which have been employed in the Sino-Forest
valuations to date.
5.1.1 Tree Volume Calculations
Using diameter (D) and height (H) as variables, individual tree volumes were
estimated. The tree volume equations used by Pöyry have been as follows:
Eucalyptus
V (m
3
) = 0.01774597 - 0.00429255D + 0.0002008136D
2
+ 0.000494599DH +0.00001125969D2H - 0.001782894H
North American
V (m3) = 0.19328321((D/100)2)H) + (0.007734354(D/100)H + (0.82141915
(D/100)2)
Chinese fir
V (m³) = 0.000037 D²H
Slash pine
V (m³) = 0.0001155362D(1.9788108856-0.005574216(D+2*H)) xH(0.5034278471+0.008969134(D+2*H))
Both D (diameter at breast height) and H (tree height) are expressed in metres.
By multiplying the average tree volumes with the measured stockings, a measure of
individual stand yields is produced.
8/3/2019 Sino-Forest Poyry Valuation Dec 2006 Final
http://slidepdf.com/reader/full/sino-forest-poyry-valuation-dec-2006-final 32/122
38A08032
Copyright © Pöyry Forest Industry 18
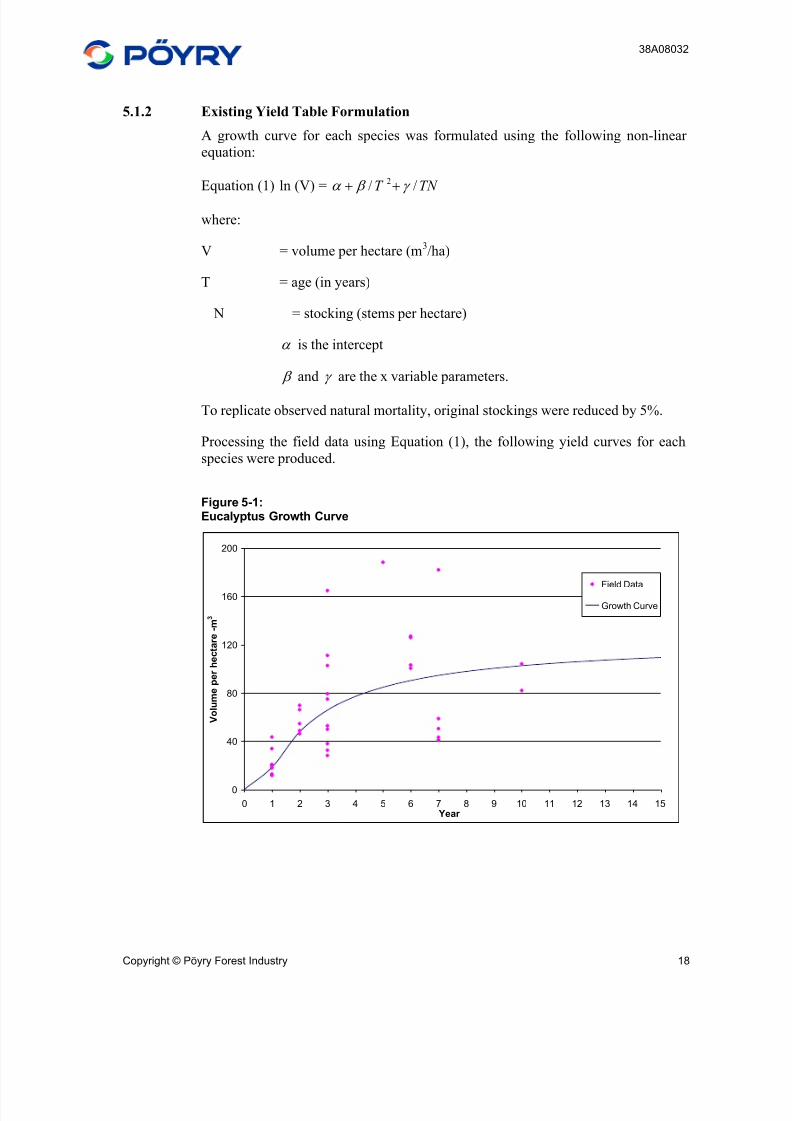
5.1.2 Existing Yield Table Formulation
A growth curve for each species was formulated using the following non-linear
equation:
Equation (1) ln (V) = TN T // 2 γ β α ++
where:
V = volume per hectare (m3/ha)
T = age (in years)
N = stocking (stems per hectare)
α is the intercept
β and γ are the x variable parameters.
To replicate observed natural mortality, original stockings were reduced by 5%.
Processing the field data using Equation (1), the following yield curves for each
species were produced.
Figure 5-1:Eucalyptus Growth Curve
0
40
80
120
160
200
0 1 2 3 4 5 6 7 8 9 10 11 12 13 14 15 Year
V o l u m e p e r h e c t a r e - m
3
Field Data
Growth Curve
8/3/2019 Sino-Forest Poyry Valuation Dec 2006 Final
http://slidepdf.com/reader/full/sino-forest-poyry-valuation-dec-2006-final 33/122
38A08032
Copyright © Pöyry Forest Industry 19
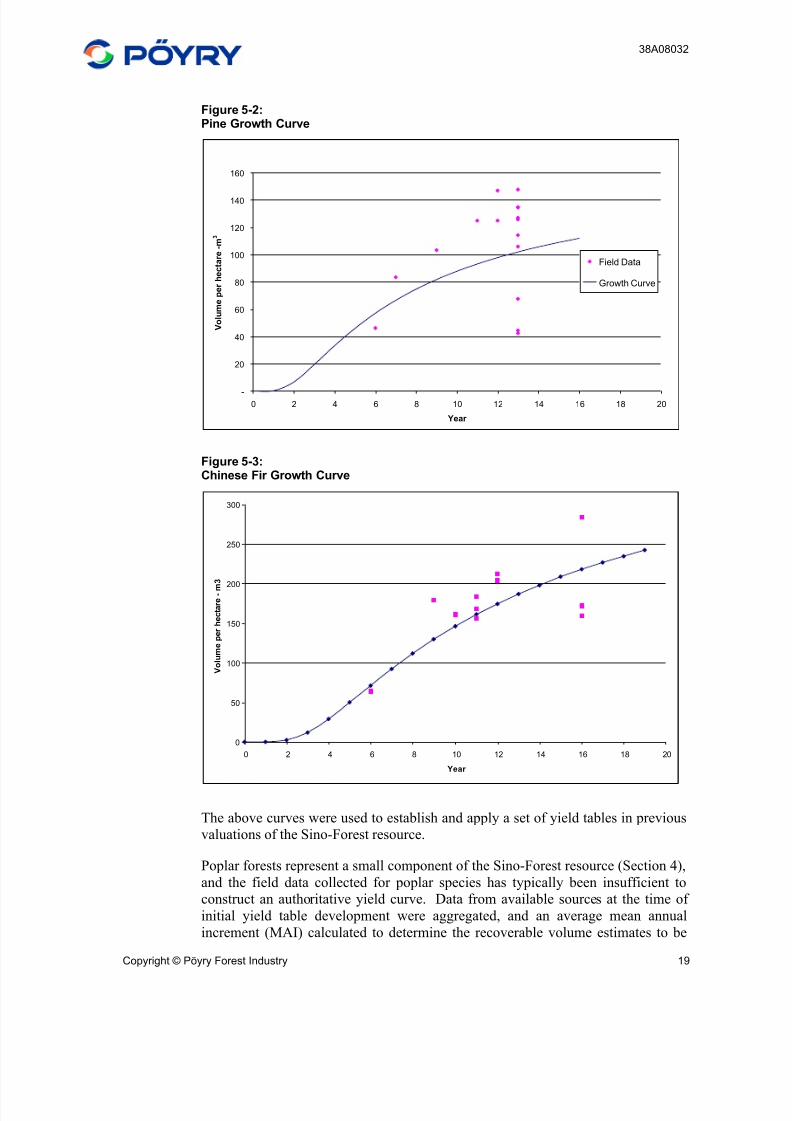
Figure 5-2:Pine Growth Curve
-
20
40
60
80
100
120
140
160
0 2 4 6 8 10 12 14 16 18 20
Year
V o l u m e p e r h e c t a r e - m
3
Field Data
Growth Curve
Figure 5-3:Chinese Fir Growth Curve
0
50
100
150
200
250
300
0 2 4 6 8 10 12 14 16 18 20
Year
V o l u m e p e r h e c t a r e - m
3
The above curves were used to establish and apply a set of yield tables in previous
valuations of the Sino-Forest resource.
Poplar forests represent a small component of the Sino-Forest resource (Section 4),
and the field data collected for poplar species has typically been insufficient to
construct an authoritative yield curve. Data from available sources at the time of
initial yield table development were aggregated, and an average mean annual
increment (MAI) calculated to determine the recoverable volume estimates to be
8/3/2019 Sino-Forest Poyry Valuation Dec 2006 Final
http://slidepdf.com/reader/full/sino-forest-poyry-valuation-dec-2006-final 34/122
38A08032
Copyright © Pöyry Forest Industry 20
used as part of the forest valuation. A recoverable volume MAI of 8.9m3/ha/yr has
historically been assumed.
5.2 Inventory Data and Yield Table Revisions
It is Pöyry’s preference that estimates of current and future yields for individualforest assets are periodically refined as more data are collected from sample plots
and ongoing inventory activities. Through the ongoing capture of data, the
precision of growth and yield estimates are progressively improved. As part of its
31 December 2005 valuation of Sino-Forest’s assets, Pöyry recommended that a
more effective and accurate inventory program be designed and implemented to
better capture the information required to generate reliable yield tables.
Pöyry’s field inspections of forests in China commonly include high level
inventories from which indicative yield tables can be derived. These inventory
initiatives include the measurement of a range of age-classes to provide a basis for
estimating current standing volumes and expected rates of growth.
In addition to inspections of the Sino-Forest resources as part of its annual
valuations, Pöyry has completed a number of projects in China over recent years
that have involved the collection of relevant growth and yield data. These provide
a suitable basis for benchmarking yield table assumptions applied in the Sino-
Forest valuation.
Due to the high annual turnover of forests through purchases and sales, the original
data upon which original yields were based may not necessarily apply to the
current resource. Where more appropriate data has been collated via data
acquisition and field inspections, yield table assumptions have been updated.
5.3 Yields Assumed in the December 2006 Sino-Forest Valuation
During the course of the field inspection, Pöyry has targeted the recent purchases in
the Hunan and Guangxi provinces. Based on the results of the inspection, Pöyry
has adjusted the yield assumptions applied to these regions. The same assumptions
as applied in the 2005 valuation have been maintained for the regions not inspected
as part of the 2006 valuation.
Hunan
Pöyry was provided with detailed Forest Bureau records representing the current
Hunan resource. Additionally, Pöyry conducted a high-level inventory of theChinese fir plantations, specifically checking reported yields and net stocked areas.
The following Chinese fir standing yield profile was derived from the Pöyry
inventory data (Figure 5-4). Although slightly higher, the yield assumptions appear
reasonable when compared to the Forest Bureau records.
8/3/2019 Sino-Forest Poyry Valuation Dec 2006 Final
http://slidepdf.com/reader/full/sino-forest-poyry-valuation-dec-2006-final 35/122
38A08032
Copyright © Pöyry Forest Industry 21
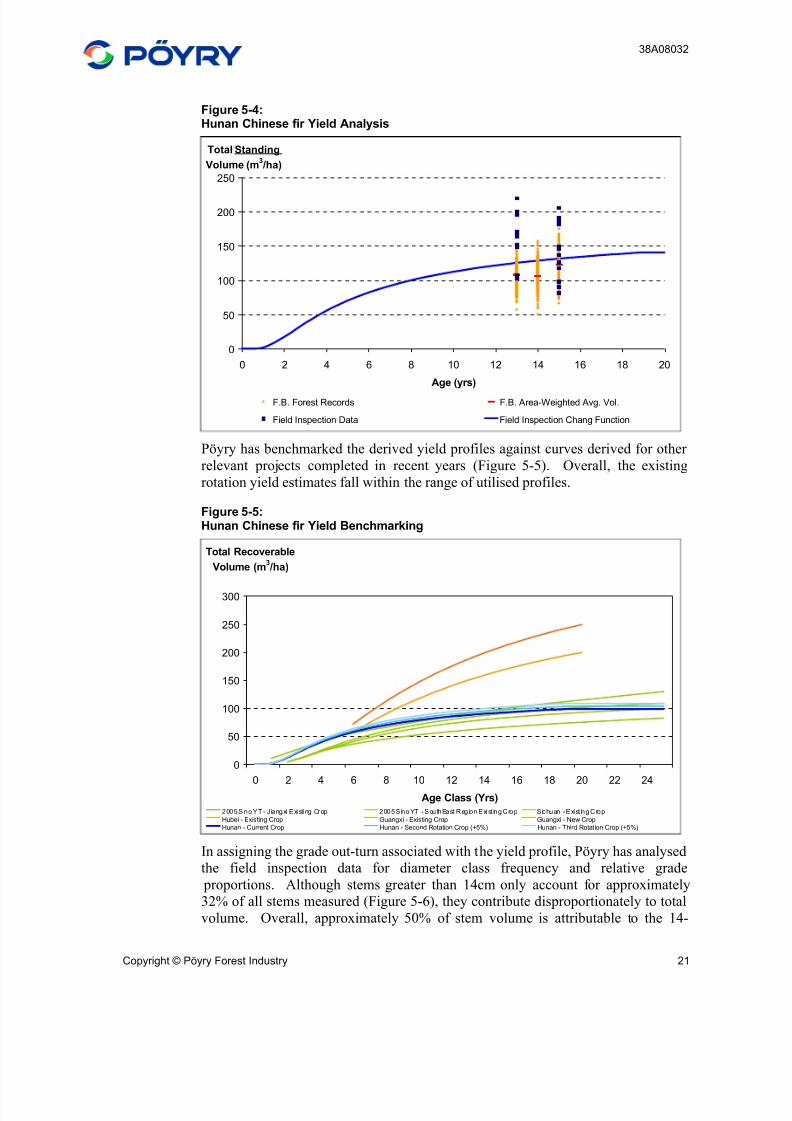
Figure 5-4:Hunan Chinese fir Yield Analysis
0
50
100
150
200
250
0 2 4 6 8 10 12 14 16 18 20
Age (yrs)
Total Standing
Volume (m3 /ha)
F.B. Forest Records F.B. Area-Weighted Avg. Vol.
Field Inspection Data Field Inspection Chang Function
Pöyry has benchmarked the derived yield profiles against curves derived for other
relevant projects completed in recent years (Figure 5-5). Overall, the existing
rotation yield estimates fall within the range of utilised profiles.
Figure 5-5:Hunan Chinese fir Yield Benchmarking
0
50
100
150
200
250
300
0 2 4 6 8 10 12 14 16 18 20 22 24Age Class (Yrs)
Total Recoverable
Volume (m3 /ha)
2005 S ino YT - J iangxi Existing Crop 2005 S ino YT - SouthEast Region Exist ing Crop Sichuan - Exist ing Crop
Hubei - Existing Crop Guangxi - Existing Crop Guangxi - New Crop
Hunan - Current Crop Hunan - Second Rotation Crop (+5%) Hunan - Third Rotation Crop (+5%)
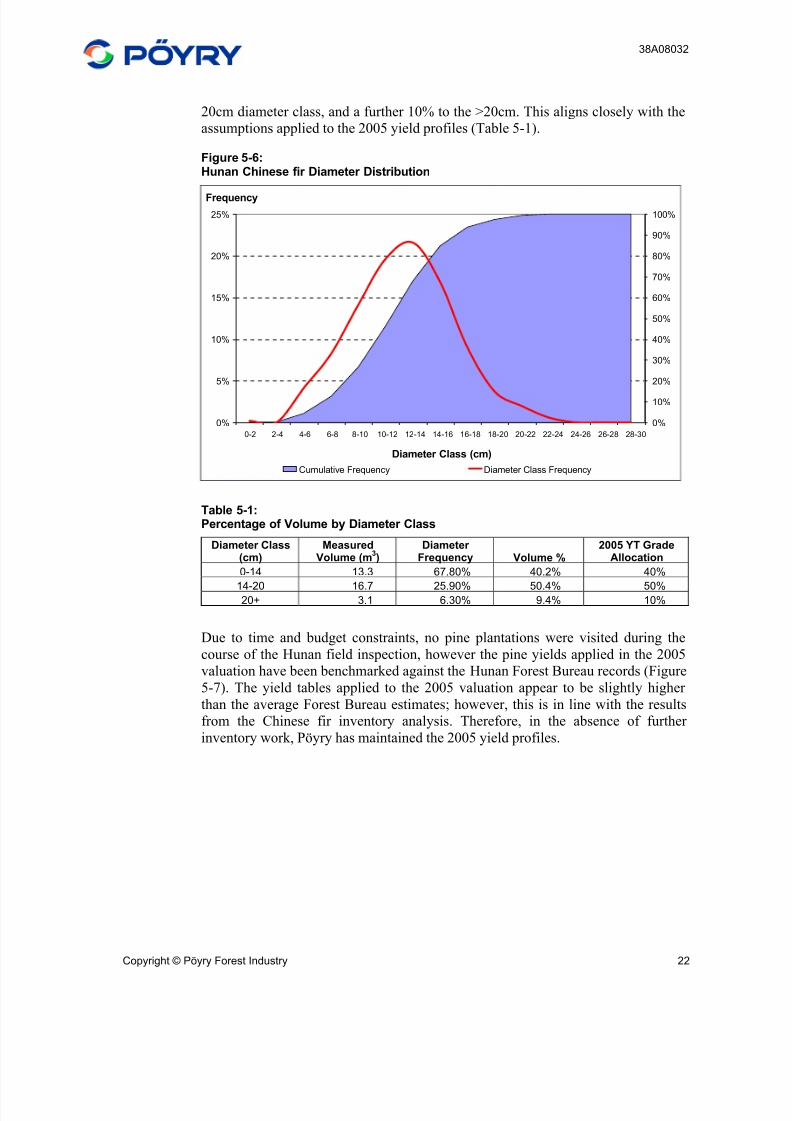
In assigning the grade out-turn associated with the yield profile, Pöyry has analysed
the field inspection data for diameter class frequency and relative grade
proportions. Although stems greater than 14cm only account for approximately
32% of all stems measured (Figure 5-6), they contribute disproportionately to total
volume. Overall, approximately 50% of stem volume is attributable to the 14-
8/3/2019 Sino-Forest Poyry Valuation Dec 2006 Final
http://slidepdf.com/reader/full/sino-forest-poyry-valuation-dec-2006-final 36/122
38A08032
Copyright © Pöyry Forest Industry 22
20cm diameter class, and a further 10% to the >20cm. This aligns closely with the
assumptions applied to the 2005 yield profiles (Table 5-1).
Figure 5-6:Hunan Chinese fir Diameter Distribution
0%
5%
10%
15%
20%
25%
0-2 2-4 4-6 6-8 8-10 10-12 12-14 14-16 16-18 18-20 20-22 22-24 24-26 26-28 28-30
Diameter Class (cm)
Frequency
0%
10%
20%
30%
40%
50%
60%
70%
80%
90%
100%
Cumulative Frequency Diameter Class Frequency
Table 5-1:Percentage of Volume by Diameter Class
Diameter Class(cm)
MeasuredVolume (m
3)
Diameter Frequency Volume %
2005 YT GradeAllocation
0-14 13.3 67.80% 40.2% 40%
14-20 16.7 25.90% 50.4% 50%20+ 3.1 6.30% 9.4% 10%
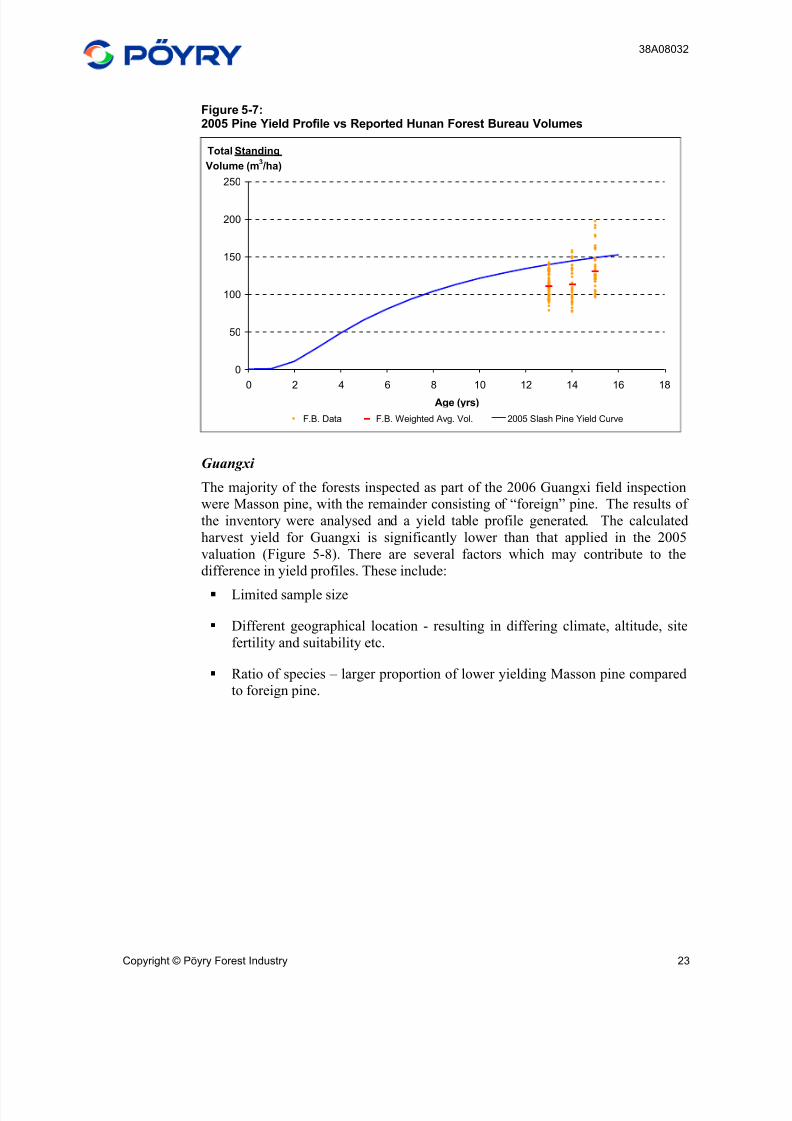
Due to time and budget constraints, no pine plantations were visited during the
course of the Hunan field inspection, however the pine yields applied in the 2005
valuation have been benchmarked against the Hunan Forest Bureau records (Figure
5-7). The yield tables applied to the 2005 valuation appear to be slightly higher
than the average Forest Bureau estimates; however, this is in line with the results
from the Chinese fir inventory analysis. Therefore, in the absence of further
inventory work, Pöyry has maintained the 2005 yield profiles.
8/3/2019 Sino-Forest Poyry Valuation Dec 2006 Final
http://slidepdf.com/reader/full/sino-forest-poyry-valuation-dec-2006-final 37/122
38A08032
Copyright © Pöyry Forest Industry 23
Figure 5-7:2005 Pine Yield Profile vs Reported Hunan Forest Bureau Volumes
0
50
100
150
200
250
0 2 4 6 8 10 12 14 16 18
Age (yrs)
Total Standing
Volume (m3 /ha)
F.B. Data F.B. Weighted Avg. Vol. 2005 Slash Pine Yield Curve
Guangxi
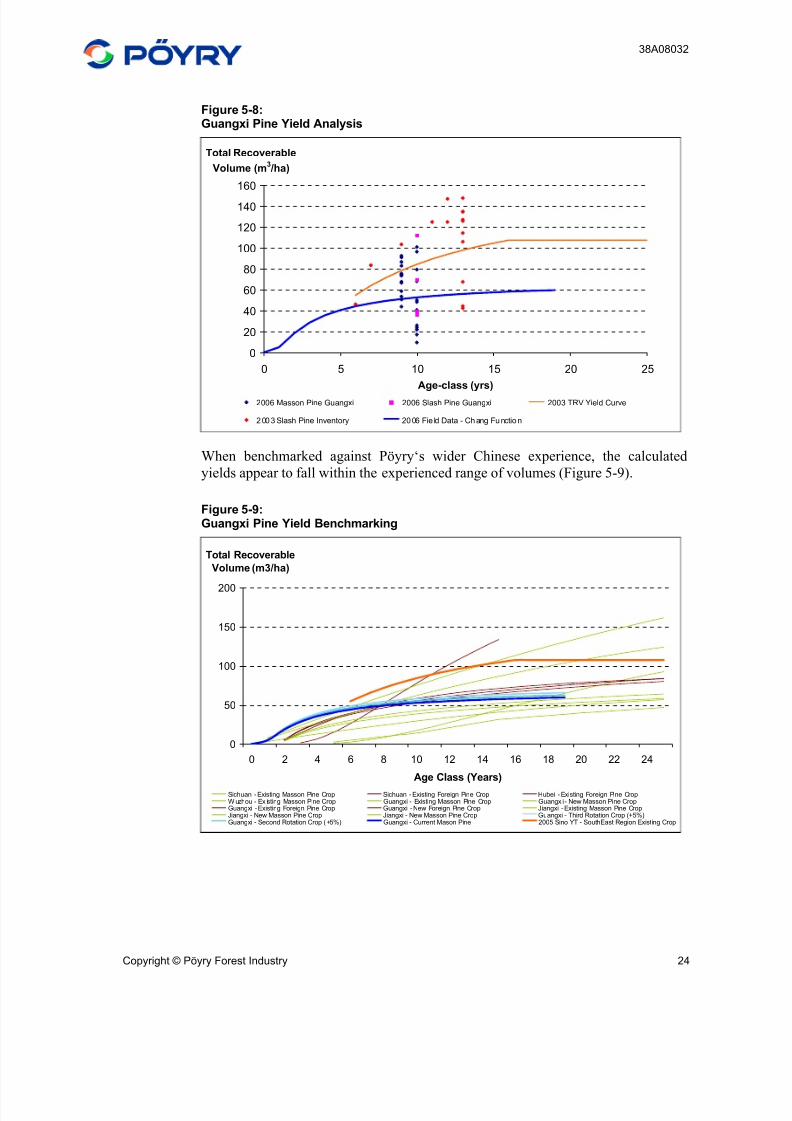
The majority of the forests inspected as part of the 2006 Guangxi field inspection
were Masson pine, with the remainder consisting of “foreign” pine. The results of
the inventory were analysed and a yield table profile generated. The calculated
harvest yield for Guangxi is significantly lower than that applied in the 2005
valuation (Figure 5-8). There are several factors which may contribute to the
difference in yield profiles. These include:
Limited sample size
Different geographical location - resulting in differing climate, altitude, site
fertility and suitability etc.
Ratio of species – larger proportion of lower yielding Masson pine compared
to foreign pine.
8/3/2019 Sino-Forest Poyry Valuation Dec 2006 Final
http://slidepdf.com/reader/full/sino-forest-poyry-valuation-dec-2006-final 38/122
38A08032
Copyright © Pöyry Forest Industry 24
Figure 5-8:Guangxi Pine Yield Analysis
0
20
40
60
80
100
120
140
160
0 5 10 15 20 25
Age-class (yrs)
Total Recoverable
Volume (m3 /ha)
2006 Masson Pine Guangxi 2006 Slash Pine Guangxi 2003 TRV Yield Curve
2003 Slash Pine Inventory 2006 Fie ld Data - Chang Function
When benchmarked against Pöyry‘s wider Chinese experience, the calculated
yields appear to fall within the experienced range of volumes (Figure 5-9).
Figure 5-9:Guangxi Pine Yield Benchmarking
0
50
100
150
200
0 2 4 6 8 10 12 14 16 18 20 22 24
Age Class (Years)
Total Recoverable
Volume (m3/ha)
Sichuan - Existing Masson Pine Crop Sichuan - Existing Foreign Pine Crop Hubei - Existing Foreign Pine CropW uzhou - Ex isting Masson Pine Crop Guangxi - Existing Masson Pine Crop Guangx i - New Masson Pine CropGuangxi - Existing Foreign Pine Crop Guangxi - New Foreign Pine Crop Jiangxi - Existing Masson Pine CropJiangxi - New Masson Pine Crop Jiangxi - New Masson Pine Crop Guangxi - Third Rotation Crop (+5%)Guangxi - Second Rotation Crop ( +5%) Guangxi - Current Mason Pine 2005 Sino YT - SouthEast Region Existing Crop
8/3/2019 Sino-Forest Poyry Valuation Dec 2006 Final
http://slidepdf.com/reader/full/sino-forest-poyry-valuation-dec-2006-final 39/122
38A08032
Copyright © Pöyry Forest Industry 25
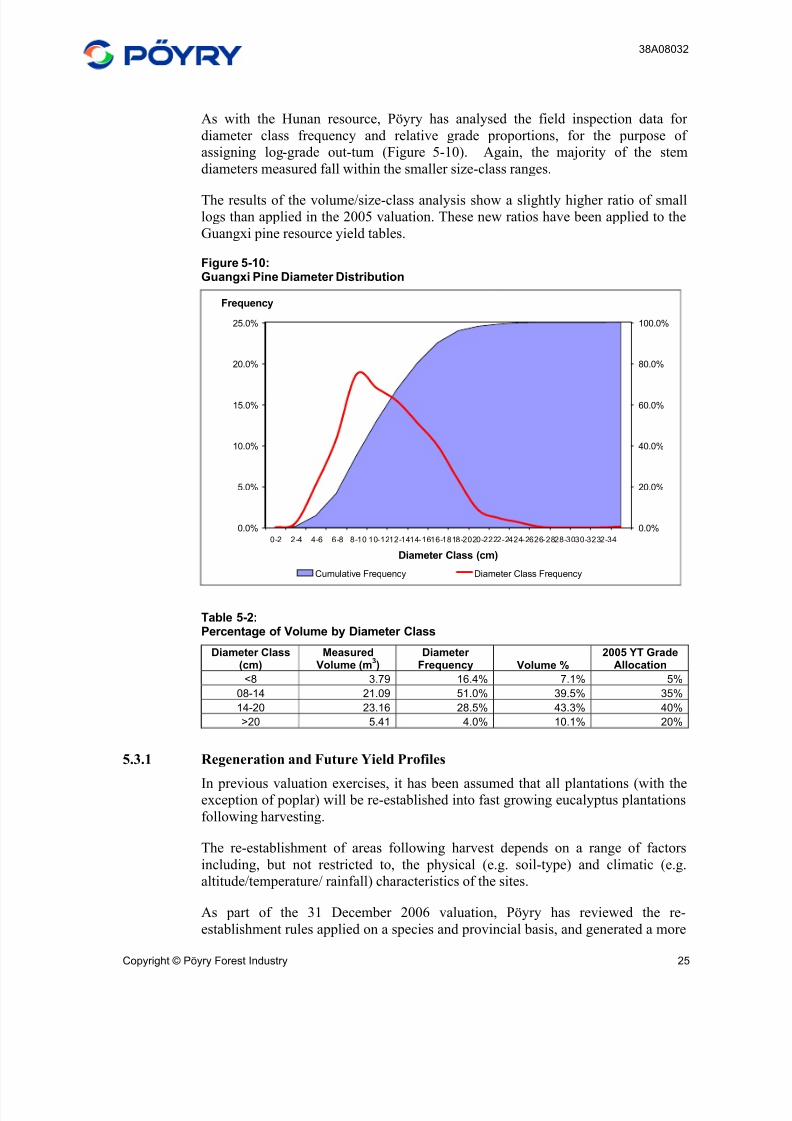
As with the Hunan resource, Pöyry has analysed the field inspection data for
diameter class frequency and relative grade proportions, for the purpose of
assigning log-grade out-turn (Figure 5-10). Again, the majority of the stem
diameters measured fall within the smaller size-class ranges.
The results of the volume/size-class analysis show a slightly higher ratio of smalllogs than applied in the 2005 valuation. These new ratios have been applied to the
Guangxi pine resource yield tables.
Figure 5-10:Guangxi Pine Diameter Distribution
0.0%
5.0%
10.0%
15.0%
20.0%
25.0%
0-2 2-4 4-6 6-8 8-10 10-1212-1414-1616-1818-2020-2222-2424-2626-2828-3030-3232-34
Diameter Class (cm)
Frequency
0.0%
20.0%
40.0%
60.0%
80.0%
100.0%
Cumulative Frequency Diameter Class Frequency
Table 5-2:Percentage of Volume by Diameter Class
Diameter Class(cm)
MeasuredVolume (m
3)
Diameter Frequency Volume %
2005 YT GradeAllocation
<8 3.79 16.4% 7.1% 5%
08-14 21.09 51.0% 39.5% 35%
14-20 23.16 28.5% 43.3% 40%
>20 5.41 4.0% 10.1% 20%
5.3.1 Regeneration and Future Yield Profiles
In previous valuation exercises, it has been assumed that all plantations (with theexception of poplar) will be re-established into fast growing eucalyptus plantations
following harvesting.
The re-establishment of areas following harvest depends on a range of factors
including, but not restricted to, the physical (e.g. soil-type) and climatic (e.g.
altitude/temperature/ rainfall) characteristics of the sites.
As part of the 31 December 2006 valuation, Pöyry has reviewed the re-
establishment rules applied on a species and provincial basis, and generated a more
8/3/2019 Sino-Forest Poyry Valuation Dec 2006 Final
http://slidepdf.com/reader/full/sino-forest-poyry-valuation-dec-2006-final 40/122
38A08032
Copyright © Pöyry Forest Industry 26
realistic and representative regeneration strategy that applies to Sino-Forest’s
current plantation asset base. The regeneration strategy is based on discussions
with Sino-Forest staff and experience gained in additional projects completed in
China, and is summarised in Table 5-3 below.
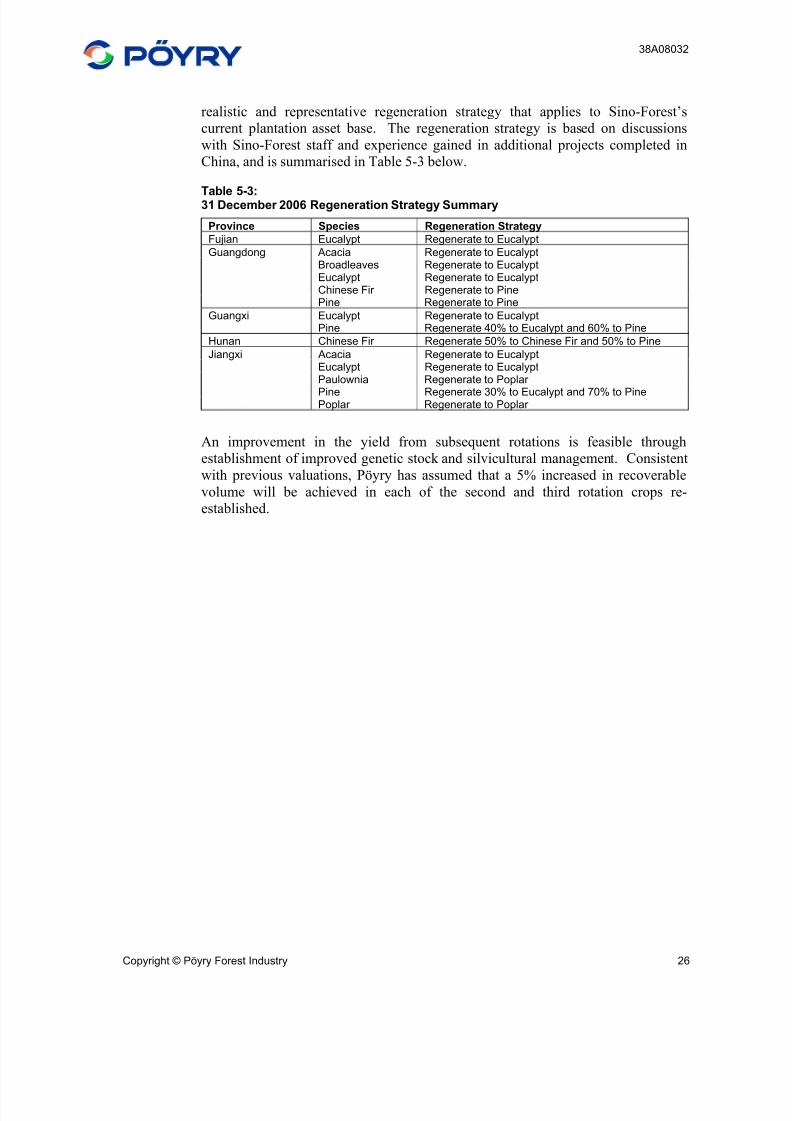
Table 5-3:31 December 2006 Regeneration Strategy Summary
Province Species Regeneration Strategy
Fujian Eucalypt Regenerate to Eucalypt
Guangdong Acacia Regenerate to EucalyptBroadleaves Regenerate to EucalyptEucalypt Regenerate to EucalyptChinese Fir Regenerate to PinePine Regenerate to Pine
Guangxi Eucalypt Regenerate to EucalyptPine Regenerate 40% to Eucalypt and 60% to Pine
Hunan Chinese Fir Regenerate 50% to Chinese Fir and 50% to Pine
Jiangxi Acacia Regenerate to EucalyptEucalypt Regenerate to EucalyptPaulownia Regenerate to Poplar
Pine Regenerate 30% to Eucalypt and 70% to PinePoplar Regenerate to Poplar
An improvement in the yield from subsequent rotations is feasible through
establishment of improved genetic stock and silvicultural management. Consistent
with previous valuations, Pöyry has assumed that a 5% increased in recoverable
volume will be achieved in each of the second and third rotation crops re-
established.
8/3/2019 Sino-Forest Poyry Valuation Dec 2006 Final
http://slidepdf.com/reader/full/sino-forest-poyry-valuation-dec-2006-final 41/122
38A08032
Copyright © Pöyry Forest Industry 27
6 PLANTATION RISKS
In addition to risks relating to the key assumptions there are other risks associated
with establishing a biological resource. In the Sino-Forest plantations the key
identifiable risks include: Fire
Frost
Pest and Disease
Typhoons
6.1 Fire
Fire has historically not been a major threat in South China plantation forests.
However, with the increase in eucalyptus plantation area there is a correspondingly
greater fire risk. This risk can be mitigated by the implementation of fire
prevention techniques such as the construction of firebreaks inside plantations, the
development of human resources trained in fire fighting and supported by physicalinfrastructure such as portable fire fighting equipment. Given that the resource is
geographically fragmented and comprises discreet forest blocks that are generally
less than 500 ha in size the opportunity for a singular catastrophic event is remote.
It is evident from field visits in some regions that farmers have used burning as a
land preparation tool in the past. Sino-Forest has previously used fire to prepare
land for planting but is moving away from this practice to mitigate the negative
impacts on soil fertility as organic matter is volatilised and lost to the atmosphere.
Recently established and young stands are at greatest risk to fire damage as they are
more likely to suffer crown damage that compromises their growth. In older stands
close to harvest age the impact of fire may be less significant as much of the timber affected is able to be recovered and marketed with little discount.
Pöyry understands that Sino-Forest has fire insurance cover.
6.2 Frost
Frost damage is a risk on high altitude inland sites and was responsible for the poor
yield seen in much of the 1996 eucalyptus plantings. The risk of frost damage is
mitigated by careful attention to site selection in order to avoid frost prone sites.
6.3 Pests and Disease
As the area of single species plantations increases so does the potential risk of pest
and disease problems. To date there appears to have been no serious pest or
disease outbreaks. This risk is mitigated by the large research and development
effort assigned to eucalyptus development.
Most of the pest and disease problems have so far occurred in the poplar
plantations. Two pathogens impact the growth and quality of the poplar hybrid
resource. Borer impacts on the quality of logs and has the effect of increasing the
8/3/2019 Sino-Forest Poyry Valuation Dec 2006 Final
http://slidepdf.com/reader/full/sino-forest-poyry-valuation-dec-2006-final 42/122
38A08032
Copyright © Pöyry Forest Industry 28
pulpwood supply by making the butt log unsuitable for veneer where an attack is
severe. The caterpillar of the ‘Yangzhou Moth’ predates the leaves and can
compromise growth if an attack is left unchecked. Adult borer is controlled by the
application of a biological pesticide. Larvae are controlled by inserting a
‘poisonous stick’ into the hole in the stem that represents the entry point of the
larvae.
Leaf eating caterpillars are controlled by the application of pesticide if levels of
infestation are such that 30% of the crown is affected. Poplar plantations are
currently inoculated against these problem pests and disease as a routine part of
plantation establishment and maintenance. Local Forest Bureaus maintain disease
control stations and provide forecasts on pathogen levels and the need for control.
In keeping with good forest practices, Sino-Forest plants trees produced from a
number of different clones; this reduces the risk of a weakness in any one clone
being propagated throughout the plantations and provides genetic diversity. The
clones that have been planted to date have been assessed for resistance against
disease.
6.4 Typhoons
On average the coastal areas of Southern China suffer a number of typhoons each
season during July to September. While in general the forest damage is localised
and confined to young age-classes, every 20 years or so a typhoon is likely to cause
significant damage. The inland coastal strip affected is in the region of up to
200 km from the coast. The risk of typhoons is generally limited to some Sino-
Forest’s plantation areas in Guangxi. This risk is reduced by the high stocking
rates and short rotations of the eucalyptus plantations.
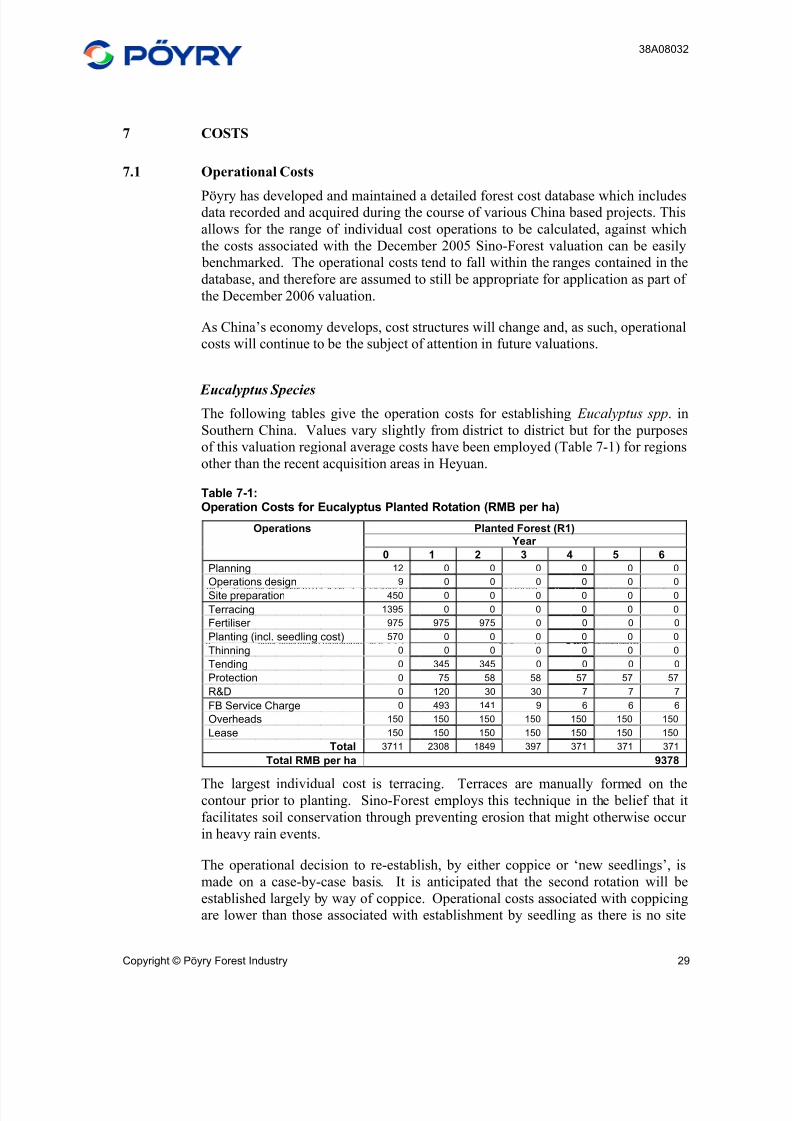
8/3/2019 Sino-Forest Poyry Valuation Dec 2006 Final
http://slidepdf.com/reader/full/sino-forest-poyry-valuation-dec-2006-final 43/122
38A08032
Copyright © Pöyry Forest Industry 29
7 COSTS
7.1 Operational Costs
Pöyry has developed and maintained a detailed forest cost database which includesdata recorded and acquired during the course of various China based projects. This
allows for the range of individual cost operations to be calculated, against which
the costs associated with the December 2005 Sino-Forest valuation can be easily
benchmarked. The operational costs tend to fall within the ranges contained in the
database, and therefore are assumed to still be appropriate for application as part of
the December 2006 valuation.
As China’s economy develops, cost structures will change and, as such, operational
costs will continue to be the subject of attention in future valuations.
Eucalyptus SpeciesThe following tables give the operation costs for establishing Eucalyptus spp. in
Southern China. Values vary slightly from district to district but for the purposes
of this valuation regional average costs have been employed (Table 7-1) for regions
other than the recent acquisition areas in Heyuan.
Table 7-1:Operation Costs for Eucalyptus Planted Rotation (RMB per ha)
Operations Planted Forest (R1) Year
0 1 2 3 4 5 6
Planning 12 0 0 0 0 0 0
Operations design 9 0 0 0 0 0 0
Site preparation 450 0 0 0 0 0 0
Terracing 1395 0 0 0 0 0 0
Fertiliser 975 975 975 0 0 0 0
Planting (incl. seedling cost) 570 0 0 0 0 0 0
Thinning 0 0 0 0 0 0 0
Tending 0 345 345 0 0 0 0
Protection 0 75 58 58 57 57 57
R&D 0 120 30 30 7 7 7
FB Service Charge 0 493 141 9 6 6 6
Overheads 150 150 150 150 150 150 150
Lease 150 150 150 150 150 150 150
Total 3711 2308 1849 397 371 371 371
Total RMB per ha 9378
The largest individual cost is terracing. Terraces are manually formed on thecontour prior to planting. Sino-Forest employs this technique in the belief that it
facilitates soil conservation through preventing erosion that might otherwise occur
in heavy rain events.
The operational decision to re-establish, by either coppice or ‘new seedlings’, is
made on a case-by-case basis. It is anticipated that the second rotation will be
established largely by way of coppice. Operational costs associated with coppicing
are lower than those associated with establishment by seedling as there is no site
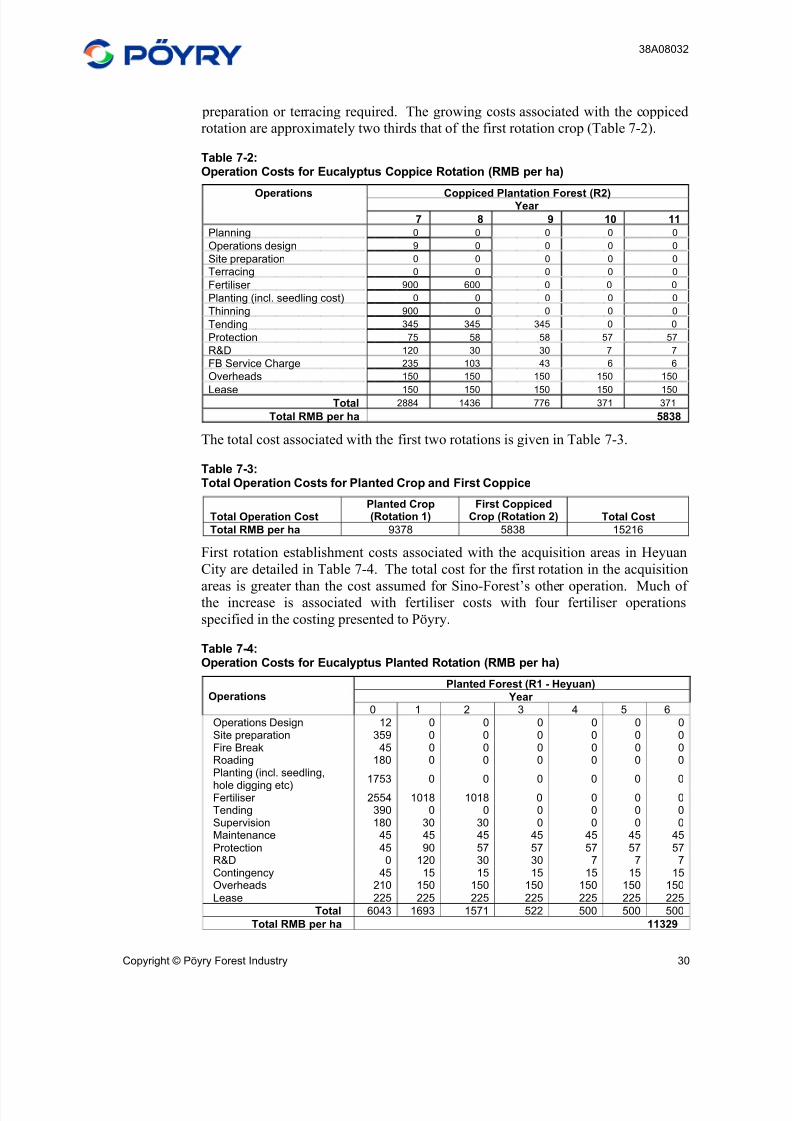
8/3/2019 Sino-Forest Poyry Valuation Dec 2006 Final
http://slidepdf.com/reader/full/sino-forest-poyry-valuation-dec-2006-final 44/122
38A08032
Copyright © Pöyry Forest Industry 30
preparation or terracing required. The growing costs associated with the coppiced
rotation are approximately two thirds that of the first rotation crop (Table 7-2).
Table 7-2:Operation Costs for Eucalyptus Coppice Rotation (RMB per ha)
Operations Coppiced Plantation Forest (R2) Year
7 8 9 10 11
Planning 0 0 0 0 0
Operations design 9 0 0 0 0
Site preparation 0 0 0 0 0
Terracing 0 0 0 0 0
Fertiliser 900 600 0 0 0
Planting (incl. seedling cost) 0 0 0 0 0
Thinning 900 0 0 0 0
Tending 345 345 345 0 0
Protection 75 58 58 57 57
R&D 120 30 30 7 7
FB Service Charge 235 103 43 6 6
Overheads 150 150 150 150 150
Lease 150 150 150 150 150Total 2884 1436 776 371 371
Total RMB per ha 5838
The total cost associated with the first two rotations is given in Table 7-3.
Table 7-3:Total Operation Costs for Planted Crop and First Coppice
Total Operation CostPlanted Crop(Rotation 1)
First CoppicedCrop (Rotation 2) Total Cost
Total RMB per ha 9378 5838 15216
First rotation establishment costs associated with the acquisition areas in Heyuan
City are detailed in Table 7-4. The total cost for the first rotation in the acquisition
areas is greater than the cost assumed for Sino-Forest’s other operation. Much of the increase is associated with fertiliser costs with four fertiliser operations
specified in the costing presented to Pöyry.
Table 7-4:Operation Costs for Eucalyptus Planted Rotation (RMB per ha)
Planted Forest (R1 - Heyuan)
Year Operations
0 1 2 3 4 5 6
Operations Design 12 0 0 0 0 0 0Site preparation 359 0 0 0 0 0 0Fire Break 45 0 0 0 0 0 0Roading 180 0 0 0 0 0 0Planting (incl. seedling,
hole digging etc)1753 0 0 0 0 0 0
Fertiliser 2554 1018 1018 0 0 0 0Tending 390 0 0 0 0 0 0Supervision 180 30 30 0 0 0 0Maintenance 45 45 45 45 45 45 45Protection 45 90 57 57 57 57 57R&D 0 120 30 30 7 7 7Contingency 45 15 15 15 15 15 15Overheads 210 150 150 150 150 150 150Lease 225 225 225 225 225 225 225
Total 6043 1693 1571 522 500 500 500
Total RMB per ha 11329
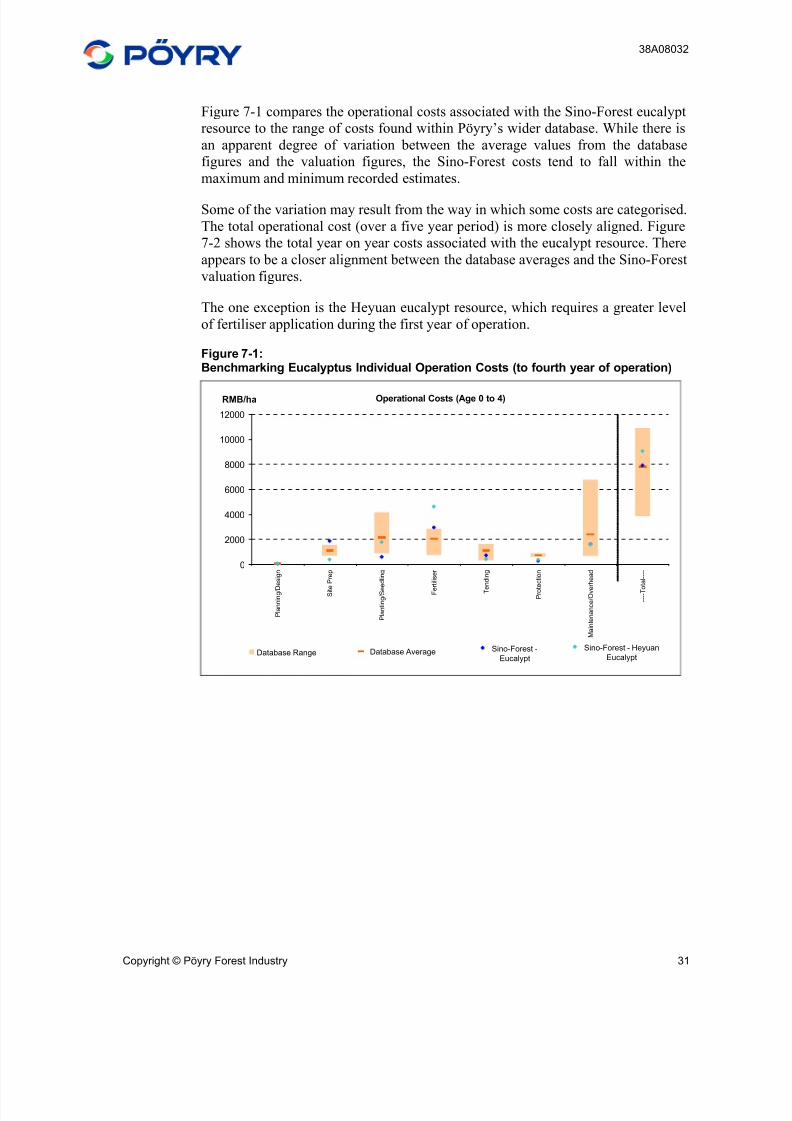
8/3/2019 Sino-Forest Poyry Valuation Dec 2006 Final
http://slidepdf.com/reader/full/sino-forest-poyry-valuation-dec-2006-final 45/122
38A08032
Copyright © Pöyry Forest Industry 31
Figure 7-1 compares the operational costs associated with the Sino-Forest eucalypt
resource to the range of costs found within Pöyry’s wider database. While there is
an apparent degree of variation between the average values from the database
figures and the valuation figures, the Sino-Forest costs tend to fall within the
maximum and minimum recorded estimates.
Some of the variation may result from the way in which some costs are categorised.
The total operational cost (over a five year period) is more closely aligned. Figure
7-2 shows the total year on year costs associated with the eucalypt resource. There
appears to be a closer alignment between the database averages and the Sino-Forest
valuation figures.
The one exception is the Heyuan eucalypt resource, which requires a greater level
of fertiliser application during the first year of operation.
Figure 7-1:Benchmarking Eucalyptus Individual Operation Costs (to fourth year of operation)
Operational Costs (Age 0 to 4)
Database Range Database Average Sino-Forest -
Eucalypt
Sino-Forest - Heyuan
Eucalypt
0
2000
4000
6000
8000
10000
12000
P l a n n i n g / D
e s i g n
S i t e P r e p
P l a n t i n g / S e
e d l i n g
F e
r t i l i s e r
T e
n d i n g
P r o t e c t i o n
M a i n t e n a n c e / O v e
r h e a d
- - - - T o
t a l - - - -
RMB/ha
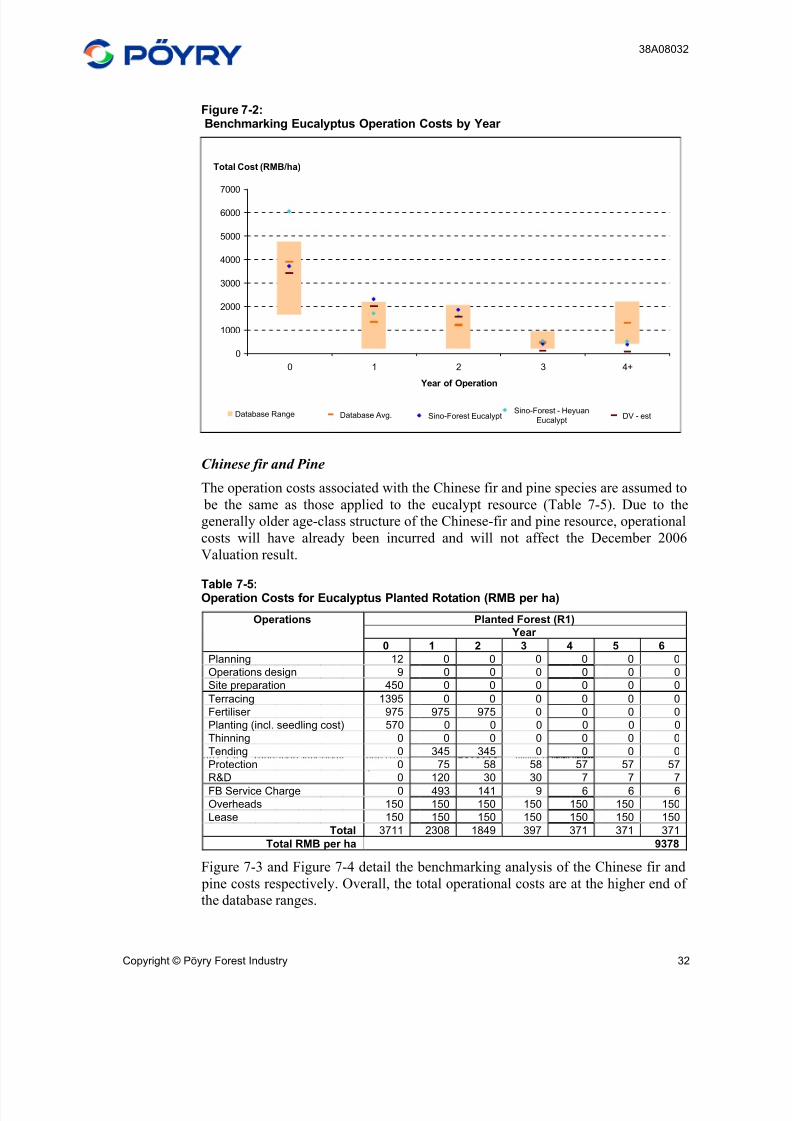
8/3/2019 Sino-Forest Poyry Valuation Dec 2006 Final
http://slidepdf.com/reader/full/sino-forest-poyry-valuation-dec-2006-final 46/122
38A08032
Copyright © Pöyry Forest Industry 32
Figure 7-2:Benchmarking Eucalyptus Operation Costs by Year
Database Range Database Avg. Sino-Forest EucalyptSino-Forest - Heyuan
EucalyptDV - est
0
1000
2000
3000
4000
5000
6000
7000
0 1 2 3 4+
Year of Operation
Total Cost (RMB/ha)
Chinese fir and Pine
The operation costs associated with the Chinese fir and pine species are assumed to
be the same as those applied to the eucalypt resource (Table 7-5). Due to the
generally older age-class structure of the Chinese-fir and pine resource, operational
costs will have already been incurred and will not affect the December 2006
Valuation result.
Table 7-5:Operation Costs for Eucalyptus Planted Rotation (RMB per ha)
Operations Planted Forest (R1)
Year
0 1 2 3 4 5 6
Planning 12 0 0 0 0 0 0
Operations design 9 0 0 0 0 0 0
Site preparation 450 0 0 0 0 0 0
Terracing 1395 0 0 0 0 0 0
Fertiliser 975 975 975 0 0 0 0
Planting (incl. seedling cost) 570 0 0 0 0 0 0
Thinning 0 0 0 0 0 0 0
Tending 0 345 345 0 0 0 0
Protection 0 75 58 58 57 57 57
R&D 0 120 30 30 7 7 7
FB Service Charge 0 493 141 9 6 6 6
Overheads 150 150 150 150 150 150 150
Lease 150 150 150 150 150 150 150
Total 3711 2308 1849 397 371 371 371
Total RMB per ha 9378
Figure 7-3 and Figure 7-4 detail the benchmarking analysis of the Chinese fir and
pine costs respectively. Overall, the total operational costs are at the higher end of
the database ranges.
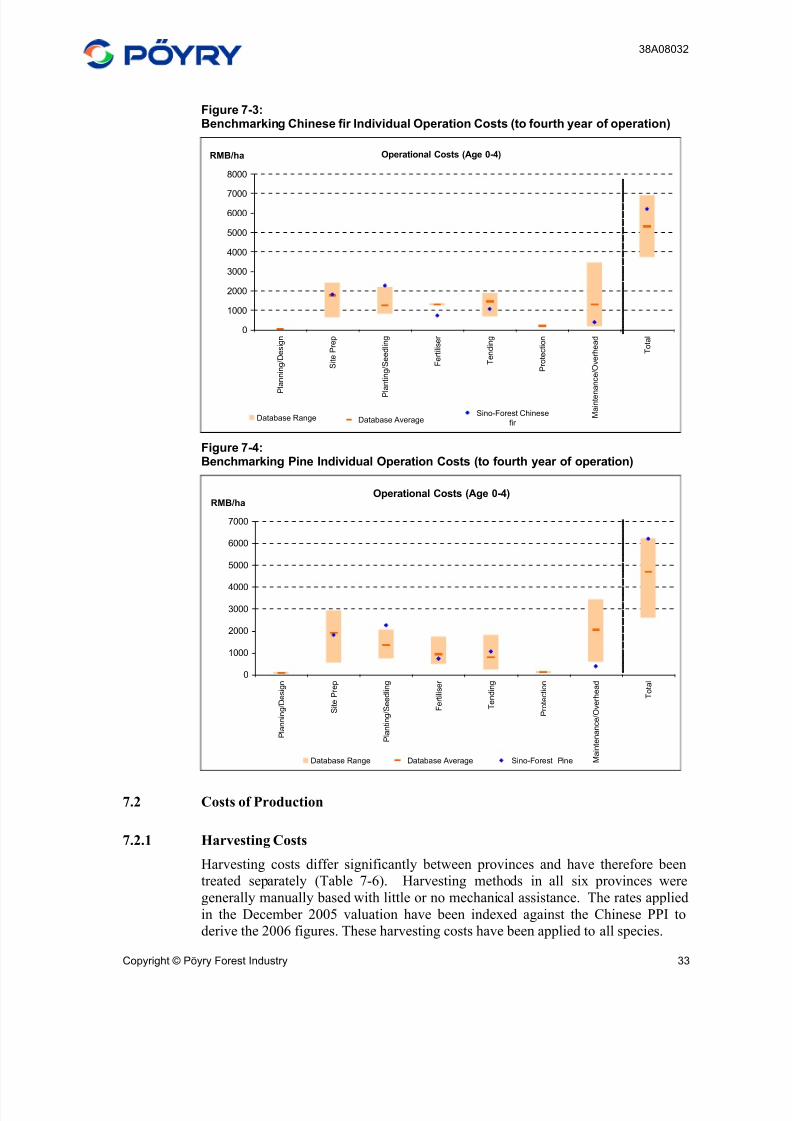
8/3/2019 Sino-Forest Poyry Valuation Dec 2006 Final
http://slidepdf.com/reader/full/sino-forest-poyry-valuation-dec-2006-final 47/122
38A08032
Copyright © Pöyry Forest Industry 33
Figure 7-3:Benchmarking Chinese fir Individual Operation Costs (to fourth year of operation)
Operational Costs (Age 0-4)
Database Range Database AverageSino-Forest Chinese
fir
0
1000
2000
3000
4000
5000
6000
7000
8000
P
l a n n i n g / D e s i g n
S i t e P r e p
P l a n t i n g / S e e d l i n g
F e r t i l i s e r
T e n d i n g
P r o t e c t i o n
M a i n t e n
a n c e / O v e r h e a d
T o t a l
RMB/ha
Figure 7-4:Benchmarking Pine Individual Operation Costs (to fourth year of operation)
Operational Costs (Age 0-4)
Database Range Database Average Sino-Forest Pine
0
1000
2000
3000
4000
5000
6000
7000
P l a n n i n g / D e s i g n
S i t e P r e p
P l a n t i n g / S e e d l i n g
F e r t i l i s e r
T e n d i n g
P r o t e c t i o n
M a i n t e n a n c e / O v e r h e a d
T o t a l
RMB/ha
7.2 Costs of Production
7.2.1 Harvesting Costs
Harvesting costs differ significantly between provinces and have therefore been
treated separately (Table 7-6). Harvesting methods in all six provinces were
generally manually based with little or no mechanical assistance. The rates applied
in the December 2005 valuation have been indexed against the Chinese PPI to
derive the 2006 figures. These harvesting costs have been applied to all species.
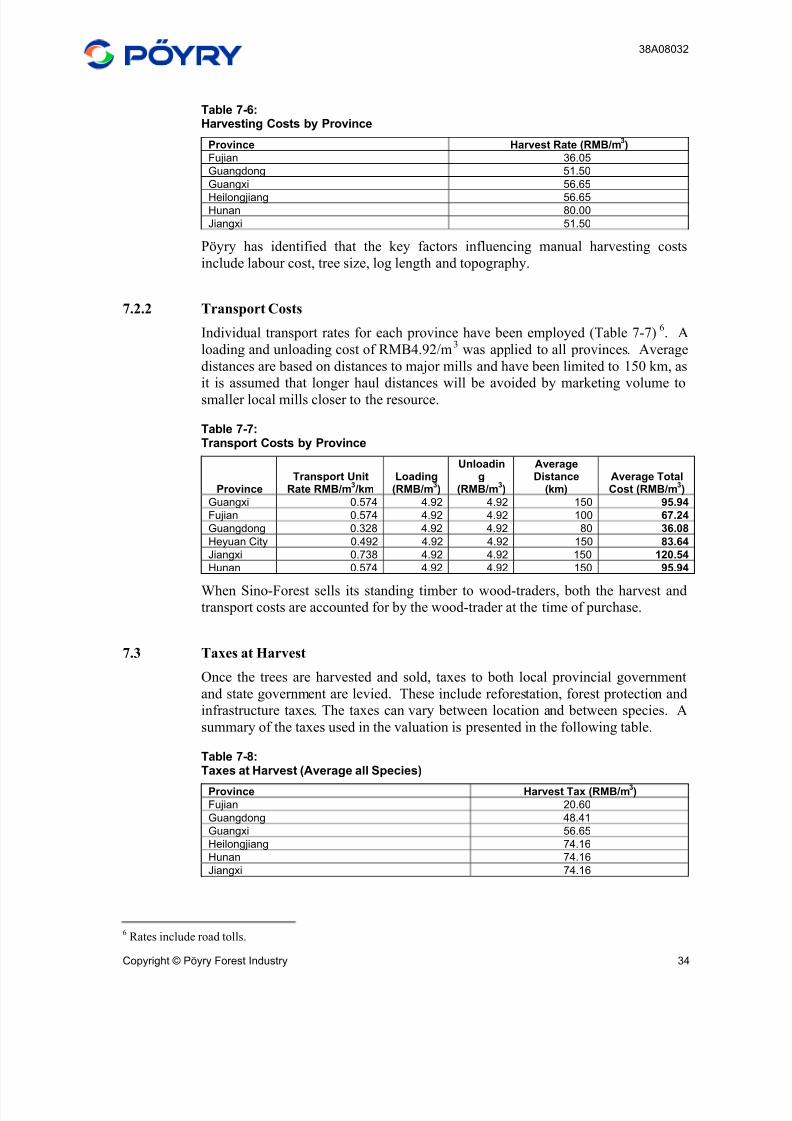
8/3/2019 Sino-Forest Poyry Valuation Dec 2006 Final
http://slidepdf.com/reader/full/sino-forest-poyry-valuation-dec-2006-final 48/122
38A08032
Copyright © Pöyry Forest Industry 34
Table 7-6:Harvesting Costs by Province
Province Harvest Rate (RMB/m3)
Fujian 36.05
Guangdong 51.50
Guangxi 56.65
Heilongjiang 56.65Hunan 80.00
Jiangxi 51.50
Pöyry has identified that the key factors influencing manual harvesting costs
include labour cost, tree size, log length and topography.
7.2.2 Transport Costs
Individual transport rates for each province have been employed (Table 7-7)6. A
loading and unloading cost of RMB4.92/m3
was applied to all provinces. Average
distances are based on distances to major mills and have been limited to 150 km, as
it is assumed that longer haul distances will be avoided by marketing volume to
smaller local mills closer to the resource.
Table 7-7:Transport Costs by Province
ProvinceTransport Unit
Rate RMB/m3 /km
Loading(RMB/m
3)
Unloading
(RMB/m3)
AverageDistance
(km)Average TotalCost (RMB/m
3)
Guangxi 0.574 4.92 4.92 150 95.94
Fujian 0.574 4.92 4.92 100 67.24
Guangdong 0.328 4.92 4.92 80 36.08
Heyuan City 0.492 4.92 4.92 150 83.64
Jiangxi 0.738 4.92 4.92 150 120.54
Hunan 0.574 4.92 4.92 150 95.94
When Sino-Forest sells its standing timber to wood-traders, both the harvest andtransport costs are accounted for by the wood-trader at the time of purchase.
7.3 Taxes at Harvest
Once the trees are harvested and sold, taxes to both local provincial government
and state government are levied. These include reforestation, forest protection and
infrastructure taxes. The taxes can vary between location and between species. A
summary of the taxes used in the valuation is presented in the following table.
Table 7-8:Taxes at Harvest (Average all Species)
Province Harvest Tax (RMB/m3)
Fujian 20.60
Guangdong 48.41
Guangxi 56.65
Heilongjiang 74.16
Hunan 74.16
Jiangxi 74.16
6Rates include road tolls.
8/3/2019 Sino-Forest Poyry Valuation Dec 2006 Final
http://slidepdf.com/reader/full/sino-forest-poyry-valuation-dec-2006-final 49/122
38A08032
Copyright © Pöyry Forest Industry 35
7.4 Overhead Costs
The cost of the direct supervision required for plantation establishment and
management has been identified as 10% of the direct operational costs.
The overhead costs associated with both the CJV companies and the management
of the purchased trees has been identified by the companies as RMB150/ha/year.As per the December 2005 valuation, Sino-Forest has not identified any corporate
overhead costs related to running this business. Pöyry has allocated a further
RMB150/ha/yr for corporate overheads.
7.5 Cooperative Joint Ventures
The forest area originally planted by Sino-Forest has been managed under a
Cooperative Joint Venture (CJV) set up between Sino-Forest and PRC incorporated
forestry trading companies (the commercial arms of government forestry bureaus).
The key points of the CJV agreements are:
The forestry trading company provides the land for the plantation forests. Sino-Forest will pay all the plantation establishment and maintenance costs.
At harvest the wood produced is shared 30% to the forestry trading company
and 70% to Sino-Forest.
Pöyry has only valued Sino-Forest’s 70% share in this valuation.
It is assumed that areas currently planted under CJV agreements will be replanted
under this model into the future. Table 7-9 below identifies the existing planted
area by CJV company:
Table 7-9:Planted Area by CJV Company
Province City CJV CompanyPlanted Area
(ha)
Guangxi Guangxi Guijia Forestry Company Ltd. 13188
Jiangxi Jiangxi Jiachang Forestry Development Company Ltd 7545
Heyuan Heyuan City Jianhe Forestry Development Ltd. 7168Guangdong
Gaoyao Gaoyao City Jiayao Forestry Development Ltd. 4884
Fujian Zhangzhou Jia Min Forestry Development Ltd. 335
Total 33120
Note that the Fujian company is not a CJV but a Wholly Owned Foreign Enterprise
(WOFE), and thus rather than a CJV agreement this company operates under
articles of association.
7.6 Land Rental
In previous valuations, it has been assumed that the existing purchased forest areas
will be harvested and replanted in fast growing eucalyptus hybrids and that the land
will be leased and an annual rental paid. Replanting to eucalypts may not be
appropriate in areas of cooler climate such as Hunan where significant areas of
Chinese fir and pine plantation have recently been purchased. It is assumed that in
these cooler climates, replanting to fast growing pine or back into Chinese fir will
occur.
8/3/2019 Sino-Forest Poyry Valuation Dec 2006 Final
http://slidepdf.com/reader/full/sino-forest-poyry-valuation-dec-2006-final 50/122
38A08032
Copyright © Pöyry Forest Industry 36
Sino-Forest has advised that it expects to pay an annual land rental of
RMB10/mu/year. The land rental associated with the recent acquisitions in Heyuan
is reported as RMB15/mu/year. These levels of land rental are common in
Southern China for land designated for forestry i.e. RMB8 to 15/mu/year. These
rentals are associated with hill country that it is generally unsuited to agricultural
purposes.
Annual land rentals as high as RMB40/mu/year have been observed for forestry
designated land in Southern China. Rentals of this magnitude are associated with
flat land that is suitable for agricultural purposes
7.7 Log Traders Margin
Sino-Forest currently sells most of its logs to log traders on the stump (that is
standing in the forest). Pöyry has calculated the stumpage price as the delivered to
mill gate log price minus the cost of transport and harvest which the log trader must
pay. However, in addition to the harvest and transport costs the log traders’ margin
must also be deducted from the stumpage price paid for the logs. Pöyry hasassumed the log traders margin to be 5% of the gross stumpage price.
8/3/2019 Sino-Forest Poyry Valuation Dec 2006 Final
http://slidepdf.com/reader/full/sino-forest-poyry-valuation-dec-2006-final 51/122
38A08032
Copyright © Pöyry Forest Industry 37
8 LOG MARKETS AND PRICING
8.1 Log Price Benchmark
In reviewing the log prices employed in the Dec 2006 valuation, Pöyry has in thefirst instance turned to log prices associated with wider industry data collated by
Pöyry from recent projects within China.
As well as updated price estimates acquired as part of the field inspection process,
other factors such as the changing nature of the Sino-Forest resource in terms of
location and species mix since the December 2005 valuation, and any generic
changes to China’s forest industry policies have been considered.
Based on the results of this analysis, several revisions have been made to specific
log grade prices. The revisions relate to log prices associated with Chinese fir logs
and eucalyptus small diameter logs.
8.1.1 Eucalyptus
In 2005 a Value Added Tax (VAT) rebate was removed from chip exports by the
government in an effort to reduce export volumes.
In May 2005 the 13% VAT payment rebate to woodchip exporters was removed by
the Chinese government. This has had the effect of reducing the FOB price for
woodchips from Zhanjiang port in Guangdong from USD109/BDMT in April 2005
to USD95/BDMT in May 2005.
This in turn has reduced eucalyptus small diameter log prices delivered to
Zhanjiang port from USD42.50/m3 (RMB352/m3) in April 2005 to USD34.53/m3 (RMB286/m3) in May 2005.
This removal of VAT has meant that Poyry has revised its price estimate for small
diameter eucalypts (i.e. less than 8cm SED) downwards by 13% from RMB350/m3
to RMB305/m3. This price is closer aligned with the wider industry averages that
Poyry has observed on recent projects in Southern China as shown in Figure 8-1.
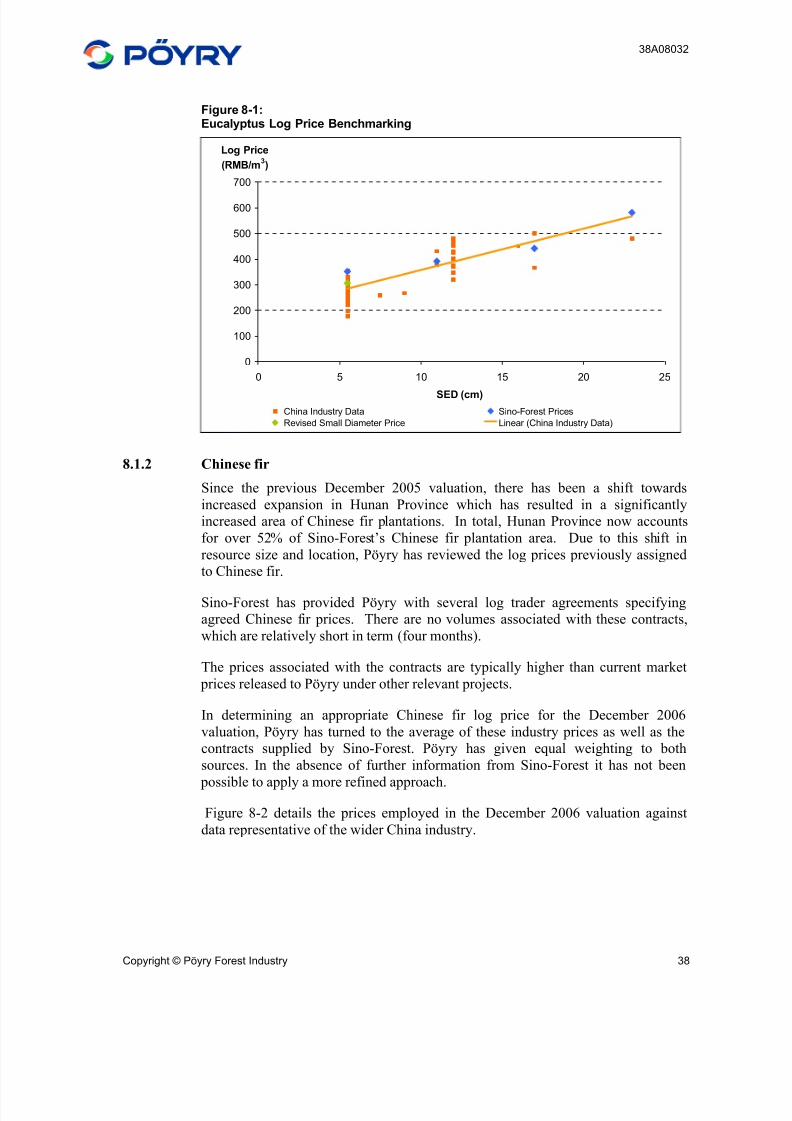
8/3/2019 Sino-Forest Poyry Valuation Dec 2006 Final
http://slidepdf.com/reader/full/sino-forest-poyry-valuation-dec-2006-final 52/122
38A08032
Copyright © Pöyry Forest Industry 38
Figure 8-1:Eucalyptus Log Price Benchmarking
0
100
200
300
400
500
600
700
0 5 10 15 20 25
SED (cm)
Log Price
(RMB/m3)
China Industry Data Sino-Forest Prices
Revised Small Diameter Price Linear (China Industry Data)
8.1.2 Chinese fir
Since the previous December 2005 valuation, there has been a shift towards
increased expansion in Hunan Province which has resulted in a significantly
increased area of Chinese fir plantations. In total, Hunan Province now accounts
for over 52% of Sino-Forest’s Chinese fir plantation area. Due to this shift in
resource size and location, Pöyry has reviewed the log prices previously assigned
to Chinese fir.
Sino-Forest has provided Pöyry with several log trader agreements specifying
agreed Chinese fir prices. There are no volumes associated with these contracts,
which are relatively short in term (four months).
The prices associated with the contracts are typically higher than current market
prices released to Pöyry under other relevant projects.
In determining an appropriate Chinese fir log price for the December 2006
valuation, Pöyry has turned to the average of these industry prices as well as the
contracts supplied by Sino-Forest. Pöyry has given equal weighting to both
sources. In the absence of further information from Sino-Forest it has not been
possible to apply a more refined approach.
Figure 8-2 details the prices employed in the December 2006 valuation against
data representative of the wider China industry.
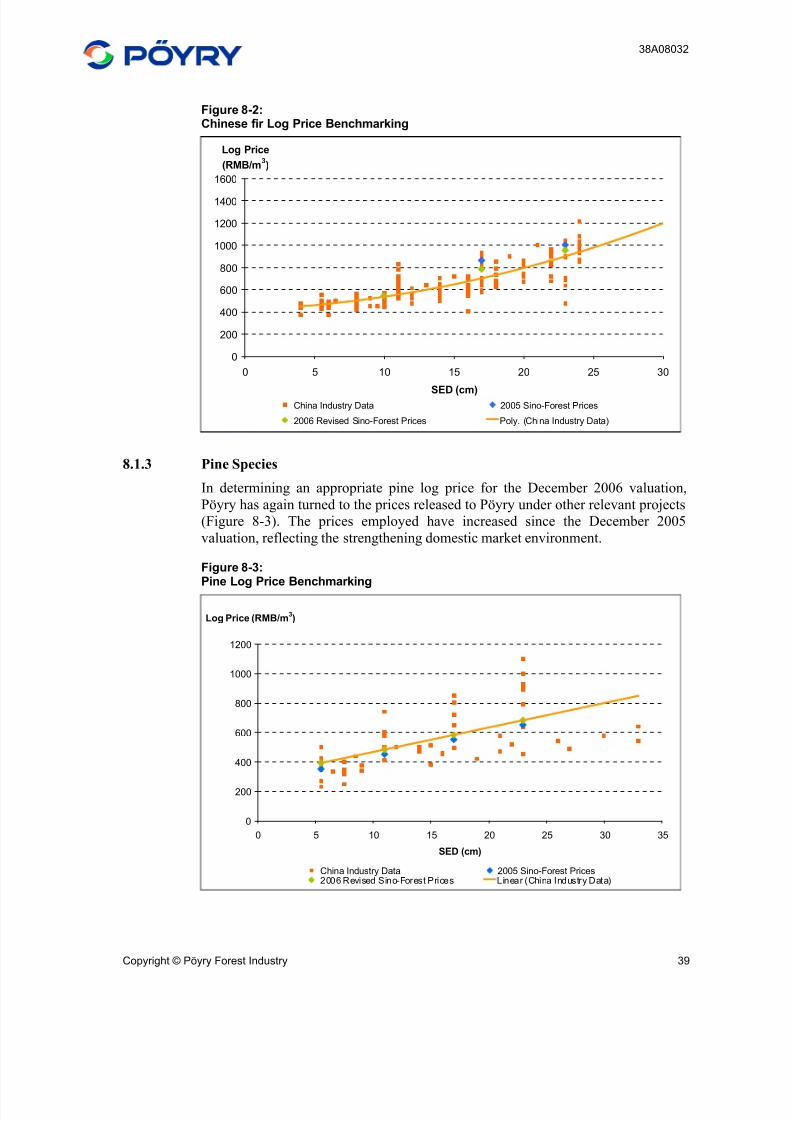
8/3/2019 Sino-Forest Poyry Valuation Dec 2006 Final
http://slidepdf.com/reader/full/sino-forest-poyry-valuation-dec-2006-final 53/122
38A08032
Copyright © Pöyry Forest Industry 39
Figure 8-2:Chinese fir Log Price Benchmarking
0
200
400
600
800
1000
1200
1400
1600
0 5 10 15 20 25 30
SED (cm)
Log Price
(RMB/m3)
China Industry Data 2005 Sino-Forest Prices
2006 Revised Sino-Forest Prices Poly. (China Industry Data)
8.1.3 Pine Species
In determining an appropriate pine log price for the December 2006 valuation,
Pöyry has again turned to the prices released to Pöyry under other relevant projects
(Figure 8-3). The prices employed have increased since the December 2005
valuation, reflecting the strengthening domestic market environment.
Figure 8-3:Pine Log Price Benchmarking
0
200
400
600
800
1000
1200
0 5 10 15 20 25 30 35
SED (cm)
Log Price (RMB/m3)
China Industry Data 2005 Sino-Forest Prices2006 Revised Sino-Forest Prices Linear (China Industry Data)
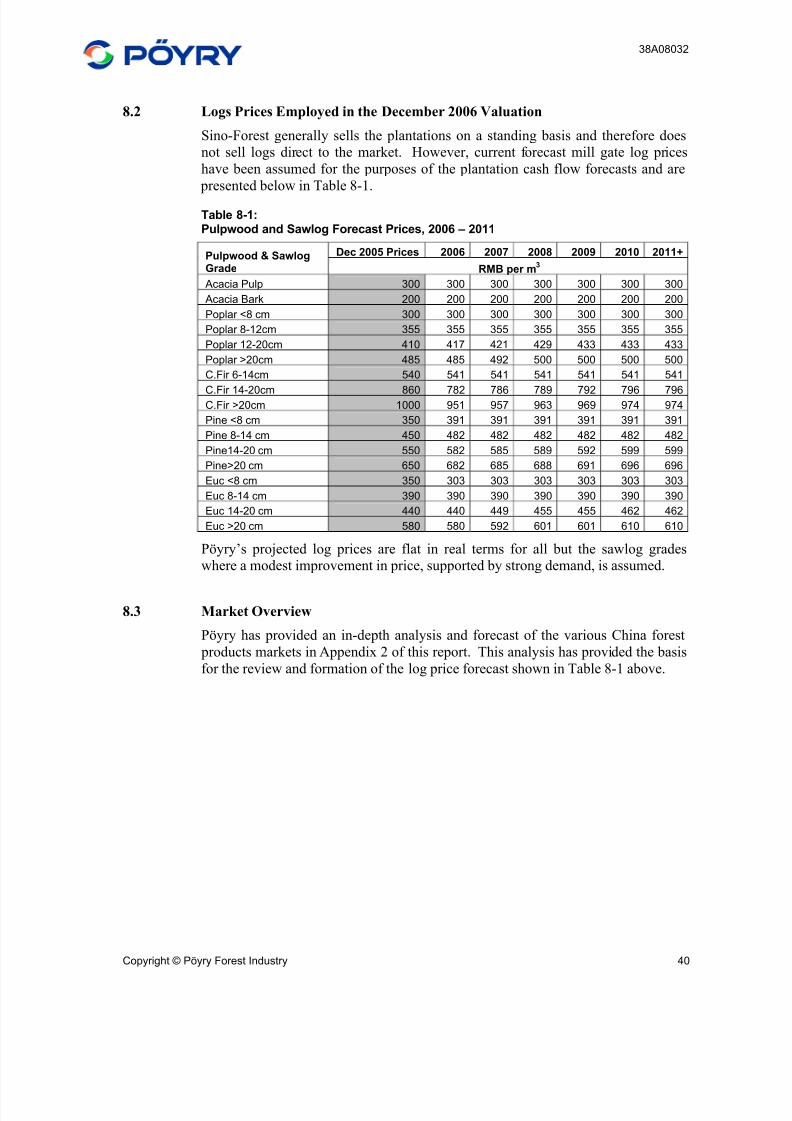
8/3/2019 Sino-Forest Poyry Valuation Dec 2006 Final
http://slidepdf.com/reader/full/sino-forest-poyry-valuation-dec-2006-final 54/122
38A08032
Copyright © Pöyry Forest Industry 40
8.2 Logs Prices Employed in the December 2006 Valuation
Sino-Forest generally sells the plantations on a standing basis and therefore does
not sell logs direct to the market. However, current forecast mill gate log prices
have been assumed for the purposes of the plantation cash flow forecasts and are
presented below in Table 8-1.
Table 8-1:Pulpwood and Sawlog Forecast Prices, 2006 – 2011
Dec 2005 Prices 2006 2007 2008 2009 2010 2011+Pulpwood & SawlogGrade RMB per m
3
Acacia Pulp 300 300 300 300 300 300 300
Acacia Bark 200 200 200 200 200 200 200
Poplar <8 cm 300 300 300 300 300 300 300
Poplar 8-12cm 355 355 355 355 355 355 355
Poplar 12-20cm 410 417 421 429 433 433 433
Poplar >20cm 485 485 492 500 500 500 500
C.Fir 6-14cm 540 541 541 541 541 541 541
C.Fir 14-20cm 860 782 786 789 792 796 796C.Fir >20cm 1000 951 957 963 969 974 974
Pine <8 cm 350 391 391 391 391 391 391
Pine 8-14 cm 450 482 482 482 482 482 482
Pine14-20 cm 550 582 585 589 592 599 599
Pine>20 cm 650 682 685 688 691 696 696
Euc <8 cm 350 303 303 303 303 303 303
Euc 8-14 cm 390 390 390 390 390 390 390
Euc 14-20 cm 440 440 449 455 455 462 462
Euc >20 cm 580 580 592 601 601 610 610
Pöyry’s projected log prices are flat in real terms for all but the sawlog grades
where a modest improvement in price, supported by strong demand, is assumed.
8.3 Market Overview
Pöyry has provided an in-depth analysis and forecast of the various China forest
products markets in Appendix 2 of this report. This analysis has provided the basis
for the review and formation of the log price forecast shown in Table 8-1 above.
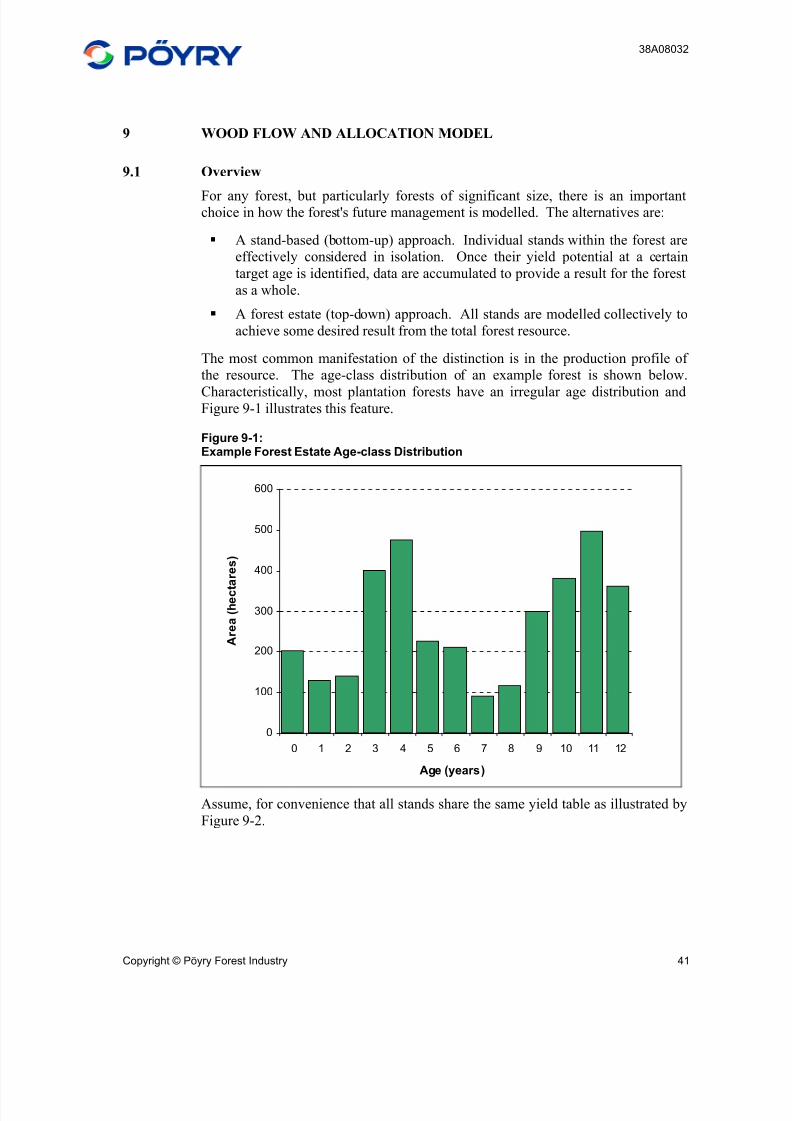
8/3/2019 Sino-Forest Poyry Valuation Dec 2006 Final
http://slidepdf.com/reader/full/sino-forest-poyry-valuation-dec-2006-final 55/122
38A08032
Copyright © Pöyry Forest Industry 41
9 WOOD FLOW AND ALLOCATION MODEL
9.1 Overview
For any forest, but particularly forests of significant size, there is an importantchoice in how the forest's future management is modelled. The alternatives are:
A stand-based (bottom-up) approach. Individual stands within the forest are
effectively considered in isolation. Once their yield potential at a certain
target age is identified, data are accumulated to provide a result for the forest
as a whole.
A forest estate (top-down) approach. All stands are modelled collectively to
achieve some desired result from the total forest resource.
The most common manifestation of the distinction is in the production profile of
the resource. The age-class distribution of an example forest is shown below.
Characteristically, most plantation forests have an irregular age distribution andFigure 9-1 illustrates this feature.
Figure 9-1:Example Forest Estate Age-class Distribution
0
100
200
300
400
500
600
0 1 2 3 4 5 6 7 8 9 10 11 12
Age (years)
A r e a ( h e c t
a r e s )
Assume, for convenience that all stands share the same yield table as illustrated by
Figure 9-2.
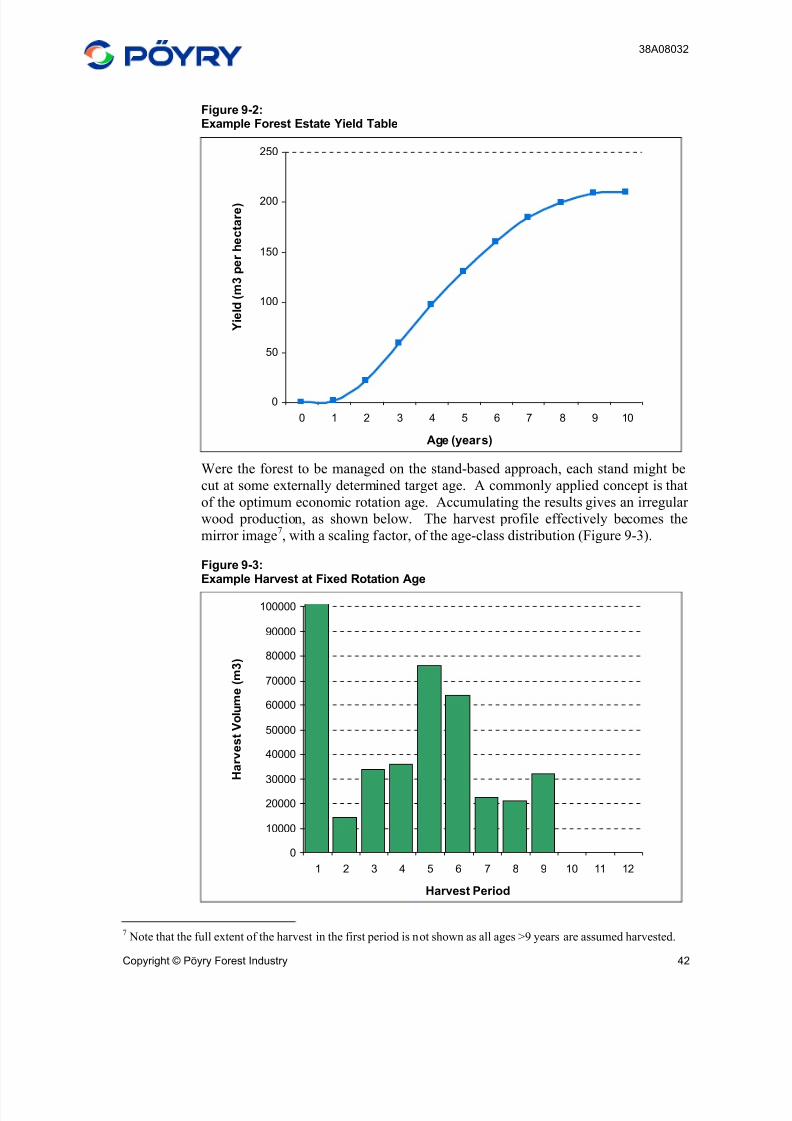
8/3/2019 Sino-Forest Poyry Valuation Dec 2006 Final
http://slidepdf.com/reader/full/sino-forest-poyry-valuation-dec-2006-final 56/122
38A08032
Copyright © Pöyry Forest Industry 42
Figure 9-2:Example Forest Estate Yield Table
0
50
100
150
200
250
0 1 2 3 4 5 6 7 8 9 10
Age (years)
Y i e l d ( m 3 p e r h e c t a r e )
Were the forest to be managed on the stand-based approach, each stand might be
cut at some externally determined target age. A commonly applied concept is that
of the optimum economic rotation age. Accumulating the results gives an irregular
wood production, as shown below. The harvest profile effectively becomes the
mirror image7, with a scaling factor, of the age-class distribution (Figure 9-3).
Figure 9-3:Example Harvest at Fixed Rotation Age
0
10000
20000
30000
40000
50000
60000
70000
80000
90000
100000
1 2 3 4 5 6 7 8 9 10 11 12
Harvest Period
H a r v e s t V o l u m e ( m 3 )
7Note that the full extent of the harvest in the first period is not shown as all ages >9 years are assumed harvested.
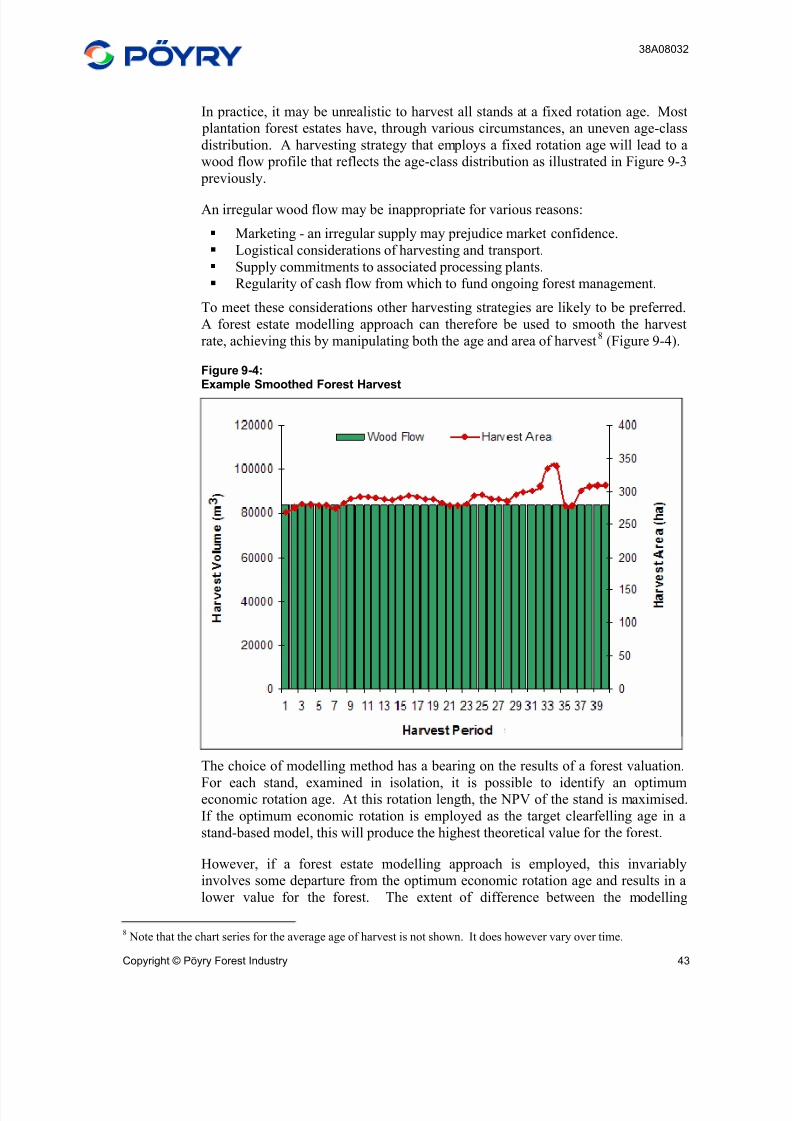
8/3/2019 Sino-Forest Poyry Valuation Dec 2006 Final
http://slidepdf.com/reader/full/sino-forest-poyry-valuation-dec-2006-final 57/122
38A08032
Copyright © Pöyry Forest Industry 43
In practice, it may be unrealistic to harvest all stands at a fixed rotation age. Most
plantation forest estates have, through various circumstances, an uneven age-class
distribution. A harvesting strategy that employs a fixed rotation age will lead to a
wood flow profile that reflects the age-class distribution as illustrated in Figure 9-3
previously.
An irregular wood flow may be inappropriate for various reasons:
Marketing - an irregular supply may prejudice market confidence.
Logistical considerations of harvesting and transport.
Supply commitments to associated processing plants.
Regularity of cash flow from which to fund ongoing forest management.
To meet these considerations other harvesting strategies are likely to be preferred.
A forest estate modelling approach can therefore be used to smooth the harvest
rate, achieving this by manipulating both the age and area of harvest8
(Figure 9-4).
Figure 9-4:Example Smoothed Forest Harvest
The choice of modelling method has a bearing on the results of a forest valuation.
For each stand, examined in isolation, it is possible to identify an optimumeconomic rotation age. At this rotation length, the NPV of the stand is maximised.
If the optimum economic rotation is employed as the target clearfelling age in a
stand-based model, this will produce the highest theoretical value for the forest.
However, if a forest estate modelling approach is employed, this invariably
involves some departure from the optimum economic rotation age and results in a
lower value for the forest. The extent of difference between the modelling
8Note that the chart series for the average age of harvest is not shown. It does however vary over time.
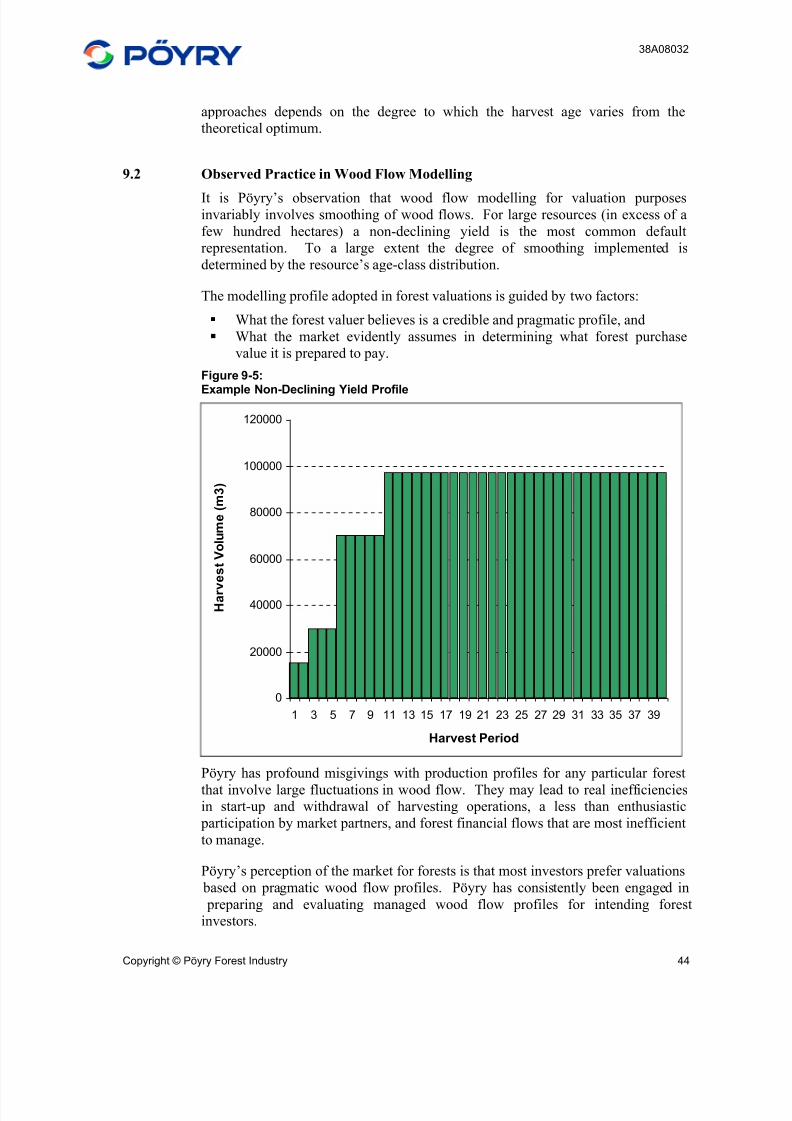
8/3/2019 Sino-Forest Poyry Valuation Dec 2006 Final
http://slidepdf.com/reader/full/sino-forest-poyry-valuation-dec-2006-final 58/122
38A08032
Copyright © Pöyry Forest Industry 44
approaches depends on the degree to which the harvest age varies from the
theoretical optimum.
9.2 Observed Practice in Wood Flow Modelling
It is Pöyry’s observation that wood flow modelling for valuation purposesinvariably involves smoothing of wood flows. For large resources (in excess of a
few hundred hectares) a non-declining yield is the most common default
representation. To a large extent the degree of smoothing implemented is
determined by the resource’s age-class distribution.
The modelling profile adopted in forest valuations is guided by two factors:
What the forest valuer believes is a credible and pragmatic profile, and
What the market evidently assumes in determining what forest purchase
value it is prepared to pay.
Figure 9-5:
Example Non-Declining Yield Profile
0
20000
40000
60000
80000
100000
120000
1 3 5 7 9 11 13 15 17 19 21 23 25 27 29 31 33 35 37 39
Harvest Period
H a r v
e s t V o l u m e ( m 3 )
Pöyry has profound misgivings with production profiles for any particular forest
that involve large fluctuations in wood flow. They may lead to real inefficienciesin start-up and withdrawal of harvesting operations, a less than enthusiastic
participation by market partners, and forest financial flows that are most inefficient
to manage.
Pöyry’s perception of the market for forests is that most investors prefer valuations
based on pragmatic wood flow profiles. Pöyry has consistently been engaged in
preparing and evaluating managed wood flow profiles for intending forest
investors.
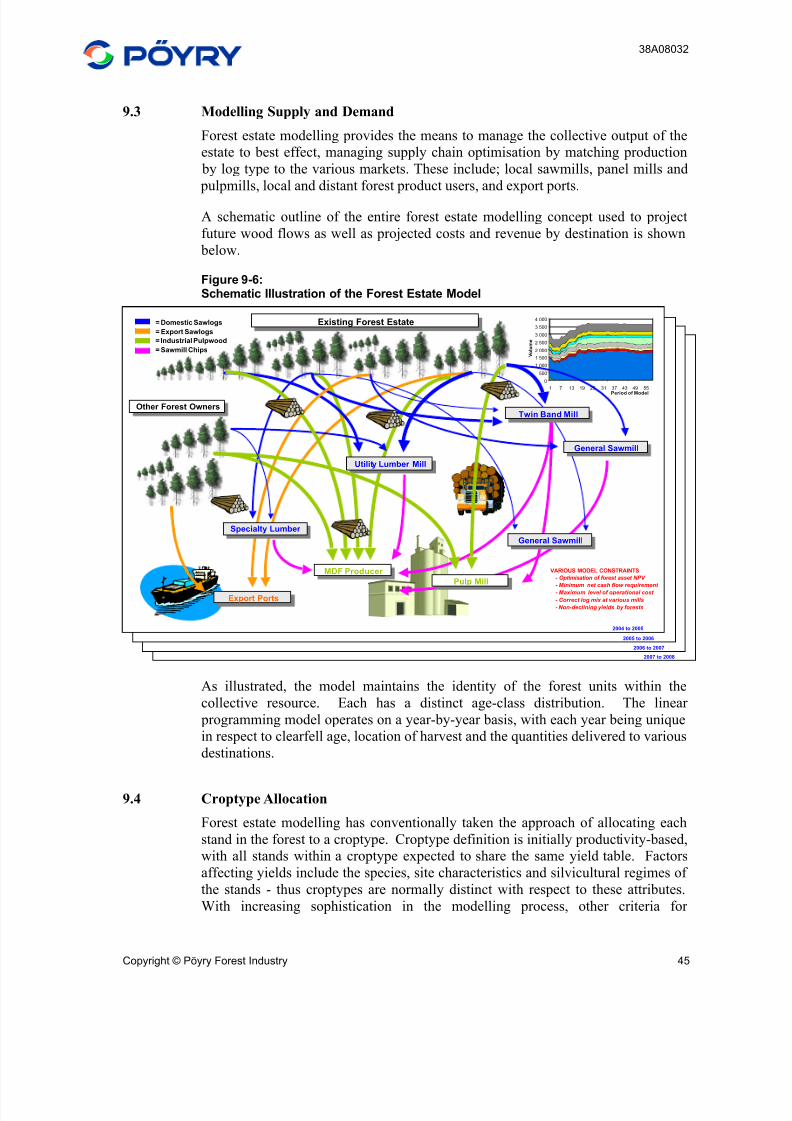
8/3/2019 Sino-Forest Poyry Valuation Dec 2006 Final
http://slidepdf.com/reader/full/sino-forest-poyry-valuation-dec-2006-final 59/122
38A08032
Copyright © Pöyry Forest Industry 45
9.3 Modelling Supply and Demand
Forest estate modelling provides the means to manage the collective output of the
estate to best effect, managing supply chain optimisation by matching production
by log type to the various markets. These include; local sawmills, panel mills and
pulpmills, local and distant forest product users, and export ports.
A schematic outline of the entire forest estate modelling concept used to project
future wood flows as well as projected costs and revenue by destination is shown
below.
Figure 9-6:Schematic Illustration of the Forest Estate Model
0
500
1 000
1 500
2 000
2 500
3 000
3 500
4 000
1 7 13 19 25 31 37 43 49 55
Period of Model
V o l u m e
Existing Forest Estate
Other Forest Owners
Utility Lumber Mill
Twin Band Mill
General Sawmill
General Sawmill
Export Ports
MDF Producer
Pulp Mill
2004 to 2005
2005 to 2006
2006 to 2007
2007 to 2008
= Domestic Sawlogs
= Export Sawlogs
= Industrial Pulpwood
= Sawmill Chips
Specialty Lumber
VARIOUS MODEL CONSTRAINTS
- Optimisation of forest asset NPV
- Minimum net cash flow requirement
- Maximum level of operational cost
- Correct log mix at various mills
- Non-declining yields by forests
As illustrated, the model maintains the identity of the forest units within the
collective resource. Each has a distinct age-class distribution. The linear
programming model operates on a year-by-year basis, with each year being unique
in respect to clearfell age, location of harvest and the quantities delivered to various
destinations.
9.4 Croptype Allocation
Forest estate modelling has conventionally taken the approach of allocating each
stand in the forest to a croptype. Croptype definition is initially productivity-based,
with all stands within a croptype expected to share the same yield table. Factors
affecting yields include the species, site characteristics and silvicultural regimes of
the stands - thus croptypes are normally distinct with respect to these attributes.
With increasing sophistication in the modelling process, other criteria for
8/3/2019 Sino-Forest Poyry Valuation Dec 2006 Final
http://slidepdf.com/reader/full/sino-forest-poyry-valuation-dec-2006-final 60/122
38A08032
Copyright © Pöyry Forest Industry 46
differentiation may also apply. Forest location, slope classification, soil type and
tenure are also commonly distinguished.
The practice of aggregating stands into croptypes has largely been driven by limits
on the computational capacity of available computers. With processing speeds
continuing to increase rapidly, the requirements for aggregation are diminishing. Itis increasingly practicable to construct models in which each stand is a croptype in
its own right. The improved modelling resolution that this offers is attractive,
although greater automation of model construction also becomes necessary. The
forest estate model that has been constructed to describe the Sino-Forest estate
employs a substantial measure of aggregation, but retains a high degree of
resolution inasmuch as geographical identities are maintained and the coppicing of
future stands is modelled.
9.5 Model Constraints
The linear programming based framework allows the specification of a variety of
constraints. The following types of constraint are included within both the woodflow model and the supply chain optimisation model:
Lower and upper harvest age limits.
Overall objective of optimising the NPV of future cash flows.
Croptype allocation for replanting/regeneration of future crops, with an
accompanying variety of replanting constraints and limits.
Harvest constraints, which in turn include a range of further options such
as non-declining yields and product smoothing capabilities.
Cash flow and budgeting constraints, such as maximum expenditure and
minimum cash flow requirements on an annual basis.
Supply chain management such as the delivery of required product mixes
to specific destinations over a managed time horizon.
9.5.1 Clearfell Age Constraints
In order to provide variations in the mix and volume of the products available from
each stand at clearfell, the age at which harvest can occur is allowed to vary. The
linear programming model determines the year of harvest and is constrained to a
range of ages that are realistic industry standards. The minimum and maximumclearfell ages for each species are shown in Table 9-1.
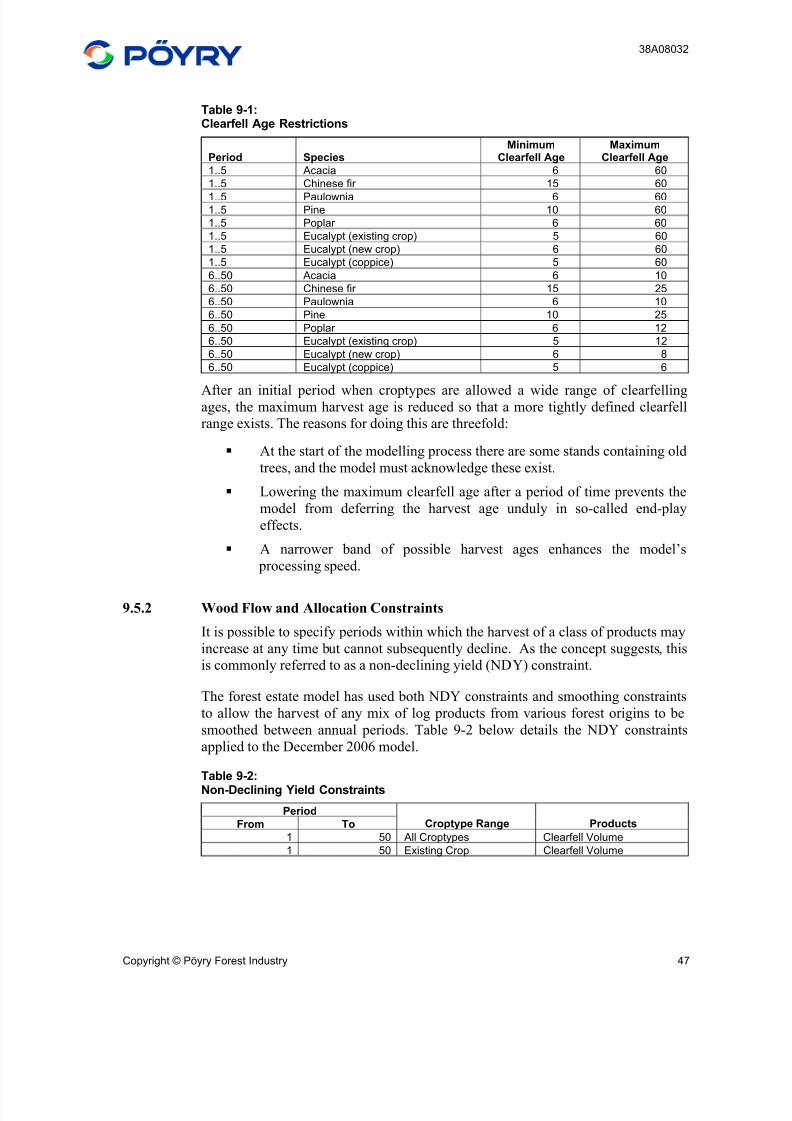
8/3/2019 Sino-Forest Poyry Valuation Dec 2006 Final
http://slidepdf.com/reader/full/sino-forest-poyry-valuation-dec-2006-final 61/122
38A08032
Copyright © Pöyry Forest Industry 47
Table 9-1:Clearfell Age Restrictions
Period SpeciesMinimum
Clearfell AgeMaximum
Clearfell Age
1..5 Acacia 6 60
1..5 Chinese fir 15 60
1..5 Paulownia 6 601..5 Pine 10 60
1..5 Poplar 6 60
1..5 Eucalypt (existing crop) 5 60
1..5 Eucalypt (new crop) 6 60
1..5 Eucalypt (coppice) 5 60
6..50 Acacia 6 10
6..50 Chinese fir 15 25
6..50 Paulownia 6 10
6..50 Pine 10 25
6..50 Poplar 6 12
6..50 Eucalypt (existing crop) 5 12
6..50 Eucalypt (new crop) 6 8
6..50 Eucalypt (coppice) 5 6
After an initial period when croptypes are allowed a wide range of clearfellingages, the maximum harvest age is reduced so that a more tightly defined clearfell
range exists. The reasons for doing this are threefold:
At the start of the modelling process there are some stands containing old
trees, and the model must acknowledge these exist.
Lowering the maximum clearfell age after a period of time prevents the
model from deferring the harvest age unduly in so-called end-play
effects.
A narrower band of possible harvest ages enhances the model’s
processing speed.
9.5.2 Wood Flow and Allocation Constraints
It is possible to specify periods within which the harvest of a class of products may
increase at any time but cannot subsequently decline. As the concept suggests, this
is commonly referred to as a non-declining yield (NDY) constraint.
The forest estate model has used both NDY constraints and smoothing constraints
to allow the harvest of any mix of log products from various forest origins to be
smoothed between annual periods. Table 9-2 below details the NDY constraints
applied to the December 2006 model.
Table 9-2:
Non-Declining Yield Constraints
Period
From To Croptype Range Products
1 50 All Croptypes Clearfell Volume
1 50 Existing Crop Clearfell Volume
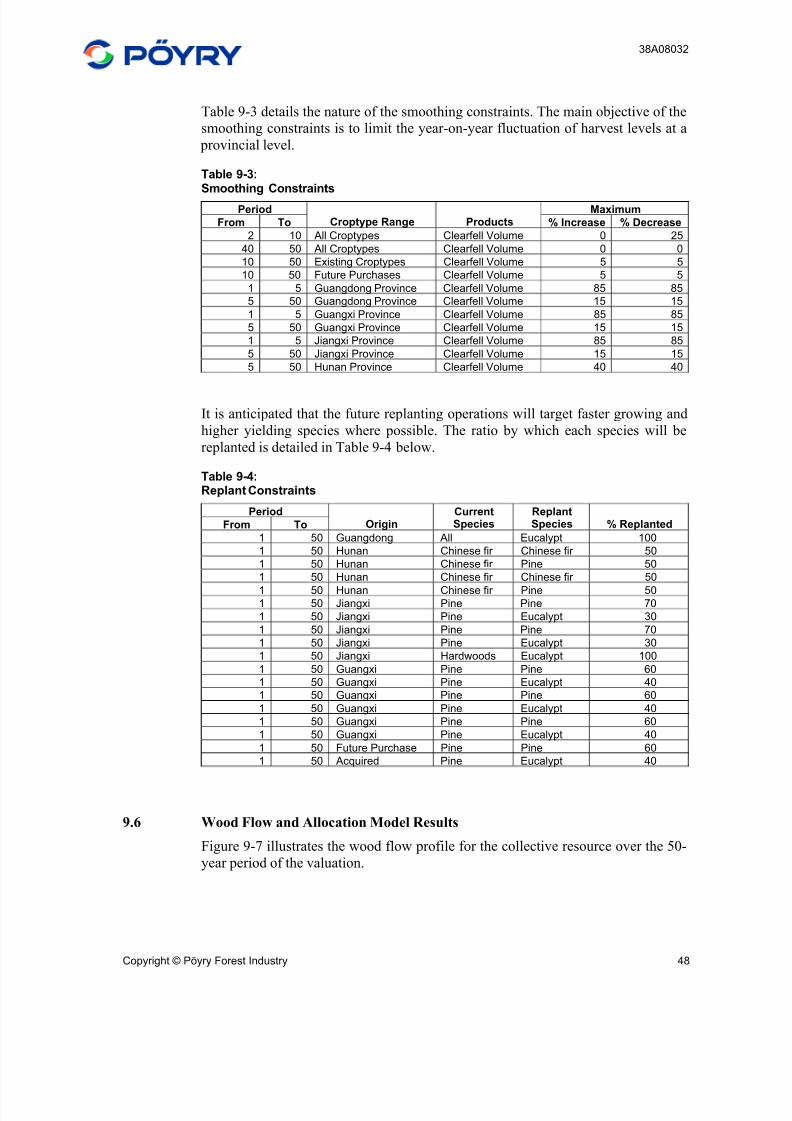
8/3/2019 Sino-Forest Poyry Valuation Dec 2006 Final
http://slidepdf.com/reader/full/sino-forest-poyry-valuation-dec-2006-final 62/122
38A08032
Copyright © Pöyry Forest Industry 48
Table 9-3 details the nature of the smoothing constraints. The main objective of the
smoothing constraints is to limit the year-on-year fluctuation of harvest levels at a
provincial level.
Table 9-3:Smoothing Constraints
Period Maximum
From To Croptype Range Products % Increase % Decrease
2 10 All Croptypes Clearfell Volume 0 25
40 50 All Croptypes Clearfell Volume 0 0
10 50 Existing Croptypes Clearfell Volume 5 5
10 50 Future Purchases Clearfell Volume 5 5
1 5 Guangdong Province Clearfell Volume 85 85
5 50 Guangdong Province Clearfell Volume 15 15
1 5 Guangxi Province Clearfell Volume 85 85
5 50 Guangxi Province Clearfell Volume 15 15
1 5 Jiangxi Province Clearfell Volume 85 85
5 50 Jiangxi Province Clearfell Volume 15 15
5 50 Hunan Province Clearfell Volume 40 40
It is anticipated that the future replanting operations will target faster growing and
higher yielding species where possible. The ratio by which each species will be
replanted is detailed in Table 9-4 below.
Table 9-4:Replant Constraints
Period
From To OriginCurrentSpecies
ReplantSpecies % Replanted
1 50 Guangdong All Eucalypt 100
1 50 Hunan Chinese fir Chinese fir 50
1 50 Hunan Chinese fir Pine 50
1 50 Hunan Chinese fir Chinese fir 50
1 50 Hunan Chinese fir Pine 501 50 Jiangxi Pine Pine 70
1 50 Jiangxi Pine Eucalypt 30
1 50 Jiangxi Pine Pine 70
1 50 Jiangxi Pine Eucalypt 30
1 50 Jiangxi Hardwoods Eucalypt 100
1 50 Guangxi Pine Pine 60
1 50 Guangxi Pine Eucalypt 40
1 50 Guangxi Pine Pine 60
1 50 Guangxi Pine Eucalypt 40
1 50 Guangxi Pine Pine 60
1 50 Guangxi Pine Eucalypt 40
1 50 Future Purchase Pine Pine 60
1 50 Acquired Pine Eucalypt 40
9.6 Wood Flow and Allocation Model Results
Figure 9-7 illustrates the wood flow profile for the collective resource over the 50-
year period of the valuation.
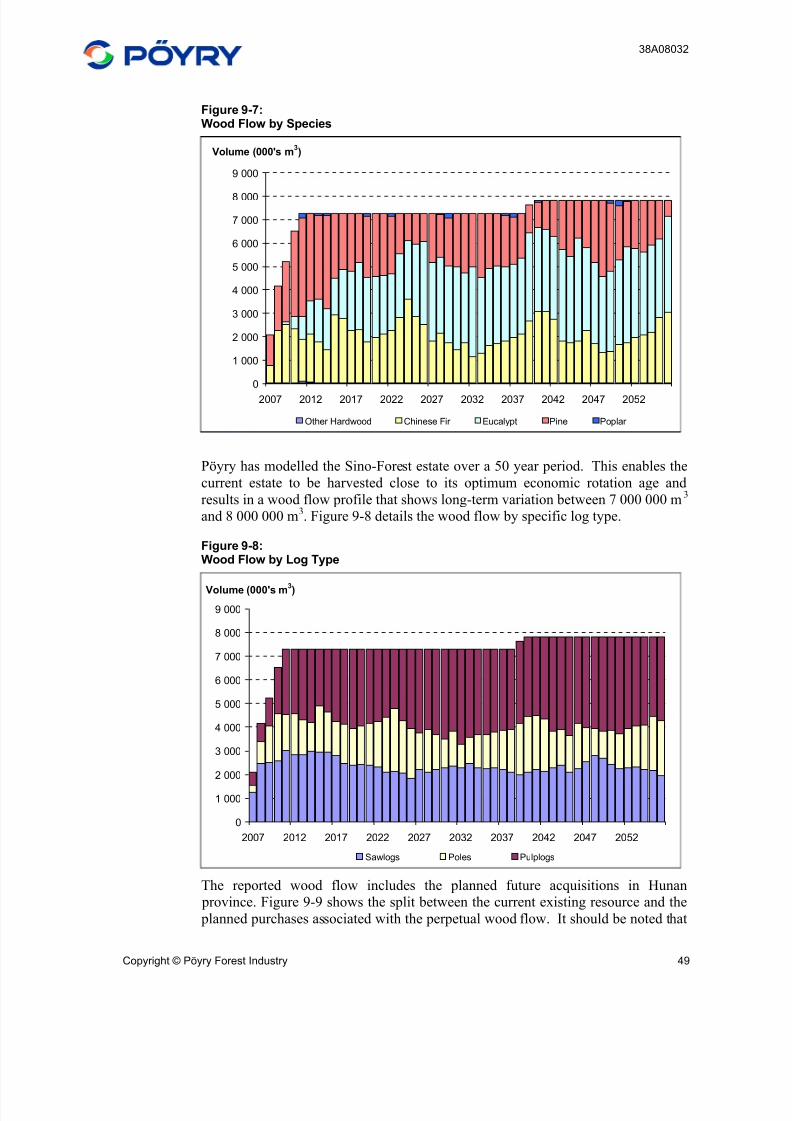
8/3/2019 Sino-Forest Poyry Valuation Dec 2006 Final
http://slidepdf.com/reader/full/sino-forest-poyry-valuation-dec-2006-final 63/122
38A08032
Copyright © Pöyry Forest Industry 49
Figure 9-7:Wood Flow by Species
0
1 000
2 000
3 000
4 000
5 000
6 000
7 000
8 000
9 000
2007 2012 2017 2022 2027 2032 2037 2042 2047 2052
Volume (000's m3)
Other Hardwood Chinese Fir Eucalypt Pine Poplar
Pöyry has modelled the Sino-Forest estate over a 50 year period. This enables the
current estate to be harvested close to its optimum economic rotation age and
results in a wood flow profile that shows long-term variation between 7 000 000 m3
and 8 000 000 m3. Figure 9-8 details the wood flow by specific log type.
Figure 9-8:Wood Flow by Log Type
0
1 000
2 000
3 000
4 000
5 000
6 000
7 000
8 000
9 000
2007 2012 2017 2022 2027 2032 2037 2042 2047 2052
Volume (000's m3)
Sawlogs Poles Pulplogs
The reported wood flow includes the planned future acquisitions in Hunan
province. Figure 9-9 shows the split between the current existing resource and the
planned purchases associated with the perpetual wood flow. It should be noted that
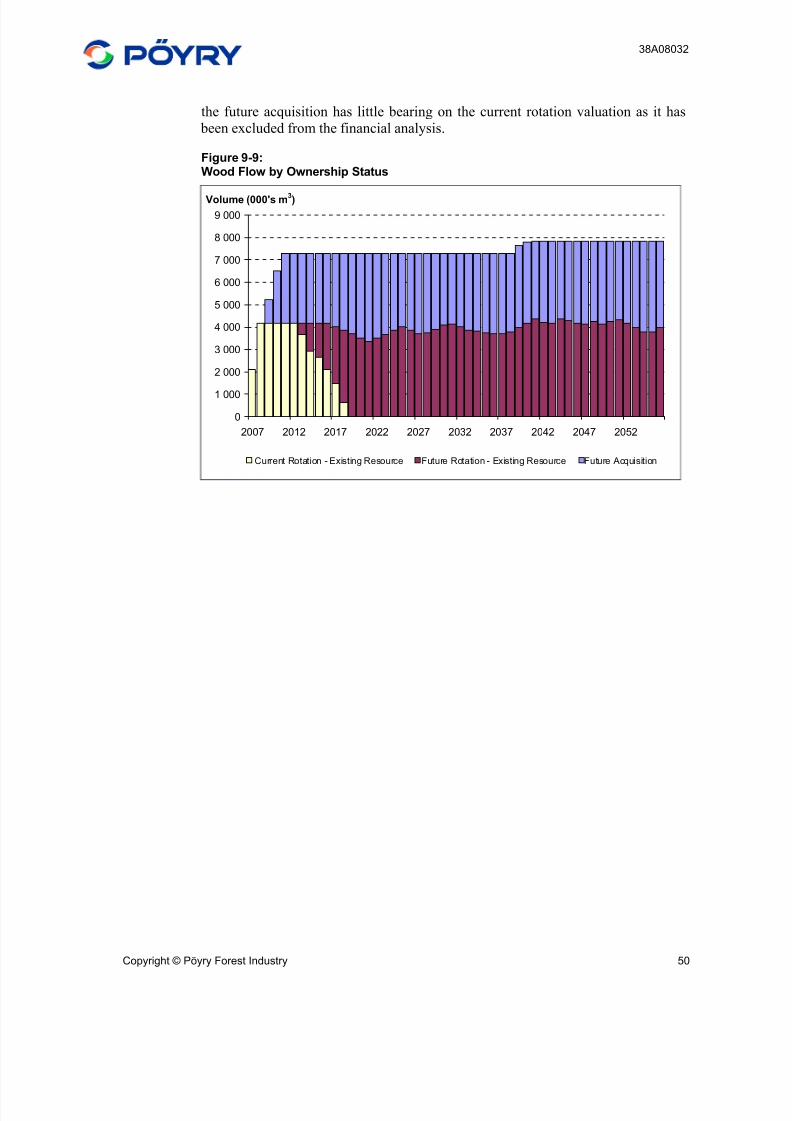
8/3/2019 Sino-Forest Poyry Valuation Dec 2006 Final
http://slidepdf.com/reader/full/sino-forest-poyry-valuation-dec-2006-final 64/122
38A08032
Copyright © Pöyry Forest Industry 50
the future acquisition has little bearing on the current rotation valuation as it has
been excluded from the financial analysis.
Figure 9-9:Wood Flow by Ownership Status
0
1 000
2 000
3 000
4 000
5 000
6 000
7 000
8 000
9 000
2007 2012 2017 2022 2027 2032 2037 2042 2047 2052
Volume (000's m3)
Current Rotation - Existing Resource Future Rotation - Existing Resource Future Acquisition
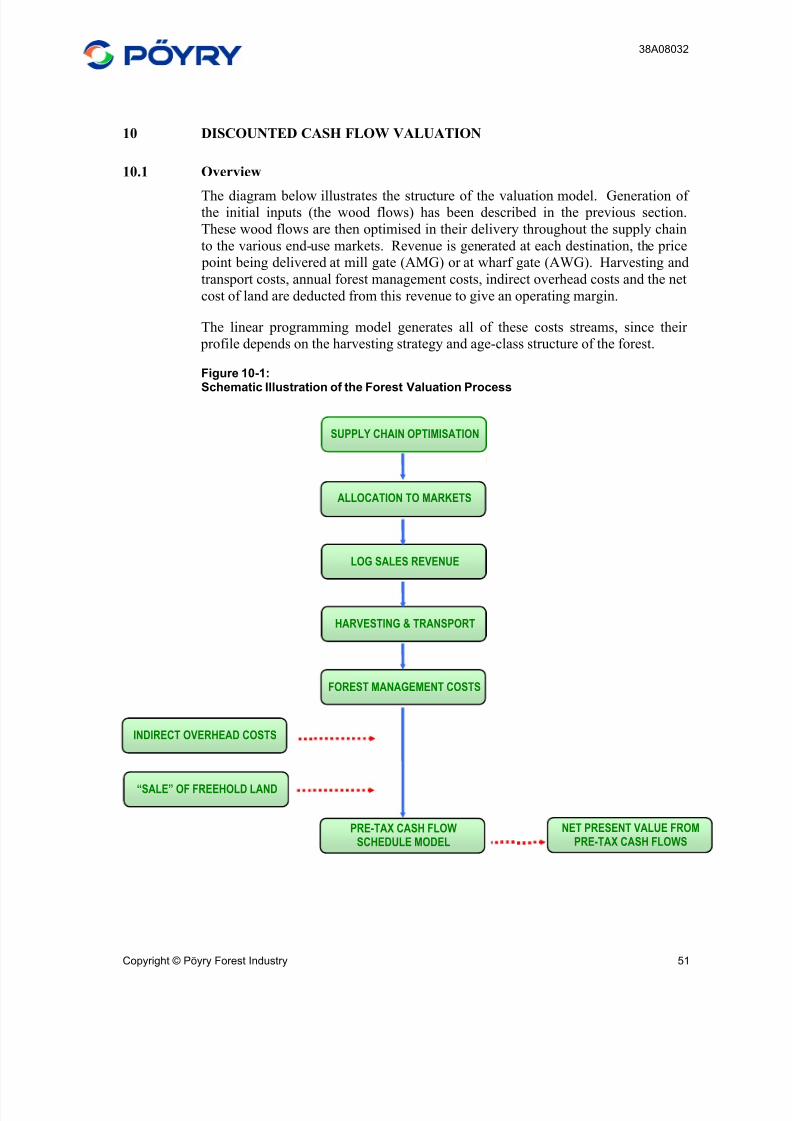
8/3/2019 Sino-Forest Poyry Valuation Dec 2006 Final
http://slidepdf.com/reader/full/sino-forest-poyry-valuation-dec-2006-final 65/122
38A08032
Copyright © Pöyry Forest Industry 51
10 DISCOUNTED CASH FLOW VALUATION
10.1 Overview
The diagram below illustrates the structure of the valuation model. Generation of the initial inputs (the wood flows) has been described in the previous section.
These wood flows are then optimised in their delivery throughout the supply chain
to the various end-use markets. Revenue is generated at each destination, the price
point being delivered at mill gate (AMG) or at wharf gate (AWG). Harvesting and
transport costs, annual forest management costs, indirect overhead costs and the net
cost of land are deducted from this revenue to give an operating margin.
The linear programming model generates all of these costs streams, since their
profile depends on the harvesting strategy and age-class structure of the forest.
Figure 10-1:
Schematic Illustration of the Forest Valuation Process
SUPPLY CHAIN OPTIMISATION
ALLOCATION TO MARKETS
LOG SALES REVENUE
FOREST MANAGEMENT COSTS
PRE-TAX CASH FLOW
SCHEDULE MODEL
INDIRECT OVERHEAD COSTS
HARVESTING & TRANSPORT
“SALE” OF FREEHOLD LAND NET PRESENT VALUE FROM
PRE-TAX CASH FLOWS
8/3/2019 Sino-Forest Poyry Valuation Dec 2006 Final
http://slidepdf.com/reader/full/sino-forest-poyry-valuation-dec-2006-final 66/122
38A08032
Copyright © Pöyry Forest Industry 52
10.2 Treatment of Taxation
Astute forest investors are expected to prepare valuations on the basis of post-tax
cash flows. However, in general the accessible information with which to interpret
transaction evidence almost always excludes any evidence of the buyer’s taxation
position. Accordingly, when forest valuers have sought to derive implied discount
rates, these have largely been based on pre-tax cash flows.
This valuation has been based on real pre-tax cash flows.
10.3 Scope of the Analysis
In this context, scope refers to the time span of the analysis. The forest estate
modelling process can provide projections of cash flows far into the future.
Providing the existing forest is replanted into productive croptypes, it would be
possible to run the analysis indefinitely. Two alternatives are demonstrated in
forest valuation:
Perpetual cash flows - the forest is modelled as an ongoing business, wherestands are replanted as they are felled. All revenue and costs associated
with the sustained venture are modelled in perpetuity. In practice, the model
is extended to the point where, after the discounting process, incremental
cash flows are effectively immaterial. A figure in the order of sixty years is
not uncommon when modelling a large plantation resource.
Current rotation analysis - only the revenue and costs associated with the
existing tree crop are included in the analysis.
In general, Pöyry prefers to confine the analysis to the current rotation. The
justification for this approach is that future rotations, which include a degree of
conjecture, are excluded from the analysis. The current rotation approach is
especially compelling when future rotations appear either spectacularly profitable,
or especially unprofitable. In either case it could be anticipated that some
modifying influence would prevail.
If subsequent rotations are unprofitable, the forest owner will look to contain costs
and increase log prices. If there is no prospect of either, a rational investor will quit
forest ownership.
If subsequent rotations appear super-profitable, it can be anticipated that there will
be competition for the underlying land and its price will increase. When charged
with a higher land price, the profitability of the tree crop, and hence its value, will
decline.
The approach is consistent with wider business appraisal that generally seeks to
confine the analysis to the current investment cycle, and thereby avoid unnecessary
conjecture. However, a disadvantage of the current rotation approach is the
requirement to identify any terminal value associated with the investment. In forest
valuations, the obvious candidate for the terminal value is the value of the land.
Application of the current rotation approach assumes that the freehold land is either
actually or notionally sold as the current crop is harvested.
8/3/2019 Sino-Forest Poyry Valuation Dec 2006 Final
http://slidepdf.com/reader/full/sino-forest-poyry-valuation-dec-2006-final 67/122
38A08032
Copyright © Pöyry Forest Industry 53
10.4 Timing of Cash Flows
Tree planting within the Sino-Forest estate most commonly takes place over the
months, February to April. By convention, stands are generally assumed to have
been fully established by 30 June. The yield estimation process has generated
yields that are projected to apply on the full anniversary of planting. Thus, for
example, trees planted in 1975 were aged 23 full years on 30 June 1998 and the
yields corresponding to 23 years of age were assumed to be available at that date.
With large forests that are subject to continuous harvesting, it would be impractical
to fell all stands just as they turn their nominated target age. Instead, in a valuation
model of the type represented here, they are expected to be felled across the span of
a year. Commonly applied financial modelling procedures would suggest that the
assumption that revenues arise at year-beginning would seem unduly aggressive.
Seemingly, a more realistic approach would be to assume that cash flows arise no
sooner than mid-year.
However, between the exact anniversary of planting and the felling operations, the
tree crop will have grown. If the harvest age is near to the optimal economic
rotation age, the marginal rate of value growth will be close to the discount rate.
Treating the revenue flow as a point event at the planting anniversary is therefore
an acceptable assumption. In principle, cost flows should be treated differently – it
would appear more realistic to consider them as occurring at mid-year. For
convenience they, like revenues, have been treated as coinciding with the stand
anniversary. This approach results in them being discounted less, and therefore
represents conservatism in the valuation process.
10.5 Date of Valuation
The date of the valuation is 31 December 2006. Pöyry uses proprietary software
that allows the isolation of both the cash flows arising from the current rotation and
all future rotations at any point in the valuation horizon. The cash flows
contributing to the Sino-Forest valuation arise during the 50-year period beginning
1 January 2007 and ending 30 June 2056.
8/3/2019 Sino-Forest Poyry Valuation Dec 2006 Final
http://slidepdf.com/reader/full/sino-forest-poyry-valuation-dec-2006-final 68/122
38A08032
Copyright © Pöyry Forest Industry 54
11 DISCOUNT RATE
A valuation based on an NPV approach requires the identification of an appropriate
discount rate. In selecting the rates there are two broad approaches:
Deriving the discount rate from first principles. The most commonexpression of this approach turns first to the Weighted Average Cost of
Capital (WACC). This recognises the costs of both debt and equity. The cost
of equity may be derived using a Capital Asset Pricing Model (CAPM)
method.
A second approach is to derive implied discount rates from transaction
evidence.
11.1 Discount Rate Derived from WACC/CAPM
As part of the December 2005 valuation of Sino-Forest’s assets, Pöyrycommissioned Dr Alastair Marsden of Auckland UniServices Limited to prepare a
report on the cost of capital for a generic forest investment located in China.
Dr Marsden’s December 2005 report concluded that depending on the modelling
assumptions a range of discount rates might be proposed for a forest-owning
venture in China. His derived ranges of rates are shown in Table 11-1.
Table 11-1:Estimate of Post-tax WACC by Marsden
Lower bound Average estimate Upper bound
5.0% 6.6% 8.2
The formulation of WACC employed by Dr Marsden was associated with post-tax
cash flows and includes the cost of debt. Dr Marsden also converted his estimate
of nominal post-tax WACC to an ‘equivalent” real pre-tax WACC through a simple
transformation with appropriate qualification. The average estimate of WACC to
apply to real pre-tax cash flows is 9.9% (Table 11-2).
Table 11-2:Estimate of Real Pre-tax WACC by Marsden
Lower bound Average estimate Upper bound
7.5% 9.9% 12.3
11.2 Implied Discount Rates
In common with other valuers of Southern Hemisphere planted forests, Pöyry
maintains a register of significant forest transactions. The available evidence is
then analysed in an effort to derive the discount rate implied by each transaction.
The process involves preparing a credible representation of the forest’s future
potential cash flows and then relating these to the transaction price.
8/3/2019 Sino-Forest Poyry Valuation Dec 2006 Final
http://slidepdf.com/reader/full/sino-forest-poyry-valuation-dec-2006-final 69/122
38A08032
Copyright © Pöyry Forest Industry 55
From this type of exercise conducted in Australia and New Zealand, Pöyry has
observed derived discount rates for recent transactions to generally fall within the
range of 8-10%. These are real rates, applied to post-tax cash flows.
Pöyry has little implied discount rate data for Southern China. As the commercial
plantation forest industry develops and forests are transacted, empirical evidencefrom which to derive implied discount rates is expected to arise.
The capacity to utilise implied discount rates in this valuation is limited to
considering how the forest investment in China compares with such investment in
other locations.
Commercial forestry in Southern China is still its infancy and faces some
challenges, these include:
The reliability of forest descriptions
The accuracy of yield prediction
Achieving high growth rates in a consistent manner.
It is Pöyry’s opinion that for many forest investors, investing in plantation forestry
in China would be considered a riskier proposition than investing in the industry in
Australia or New Zealand, for instance.
11.3 Incorporating Risk in the Discount Rate
If forest investment in China is at present perceived to be a more risky proposition
than like activity in other international counterparts, the issue then becomes how to
quantify this difference. The textbook treatments of the subject make it clear that
the discount rate cannot be regarded as a simple catch-all for any and all forms of
perceived risk. Because the discount rate may be a very blunt instrument in such a
role it is preferable instead to attempt to acknowledge risk in the development of the cash flows to which the discount rate is applied. However, despite this
principle, there is an inclination by potential purchasers to load the discount rate
where they feel uneasy.
As detailed in Section 5.2, Pöyry has detailed the need for more extensive analysis
of inventory and yield related data. The yield tables employed in the valuation are
based on limited data. While the continued sale and purchase of forests by Sino-
Forests makes the long-term monitoring of forest growth more challenging,
analysis of inventory data collected by Pöyry over recent years warrants further
consideration and application in the yield tables assigned to the Sino-Forest assets.
Pöyry has considered the risk and uncertainty associated with yield tables inselecting an appropriate discount rate for the 31 December 2006 valuation.
11.4 The Discount Rate Applied in Valuing the Sino-Forest Resource
Given the complexities in identifying what margin above other implied discount
rates that forestry in Southern China should attract, Pöyry is disinclined to place
weight on an implied discount rate derivation for this resource. This is consistent
8/3/2019 Sino-Forest Poyry Valuation Dec 2006 Final
http://slidepdf.com/reader/full/sino-forest-poyry-valuation-dec-2006-final 70/122
38A08032
Copyright © Pöyry Forest Industry 56
with the position taken by Pöyry in its 2005 valuation. The range of rates
suggested by the alternative approach - the WACC/CAPM - is very broad.
Ultimately we have exercised our professional judgement in selecting a rate at the
upper end of the WACC/CAPM range. This is a real rate of 11.5%. In selecting
such a rate we have been inclined to recognise that investors in forestry in SouthernChina will inherently be taking a long term view, and do have grounds for
optimism on the forest industry’s future there. The fundamental factors that affect
forestry performance are favourable. Importantly, too, the definition of market
value for the forests requires that there be not just willing buyers, but also willing
sellers. If the only purchase offers to be extended involved very high discount rates
we would expect that forests would not be willingly sold.
In the current market Pöyry considers that 10.5% to 12.5% is representative of the
range of real pre-tax discount rates that might be expected in forest transactions in
Southern China. A discount rate of 11.5% has been selected and applied to pre-tax
cash flows. It is Pöyry’s perception that with a carefully timed and managed sale,
other buyers could be attracted who would be willing to accept a similar pre-taxdiscount rate.
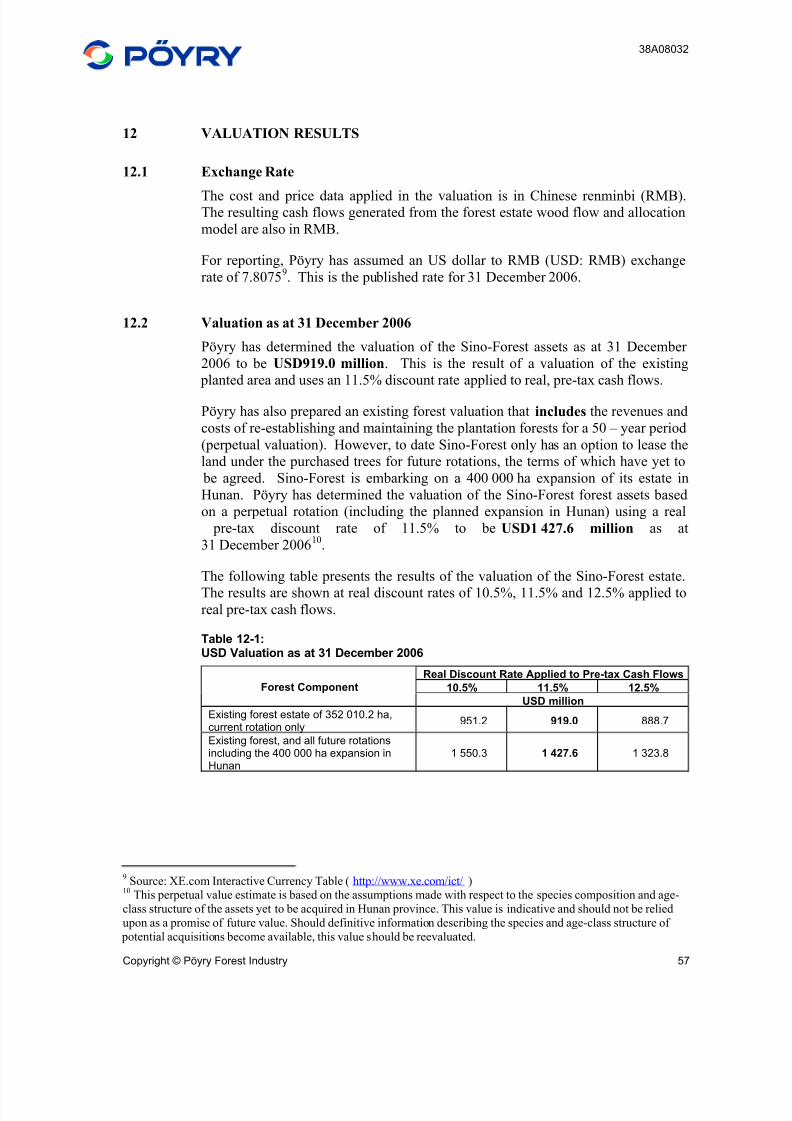
8/3/2019 Sino-Forest Poyry Valuation Dec 2006 Final
http://slidepdf.com/reader/full/sino-forest-poyry-valuation-dec-2006-final 71/122
38A08032
Copyright © Pöyry Forest Industry 57
12 VALUATION RESULTS
12.1 Exchange Rate
The cost and price data applied in the valuation is in Chinese renminbi (RMB).The resulting cash flows generated from the forest estate wood flow and allocation
model are also in RMB.
For reporting, Pöyry has assumed an US dollar to RMB (USD: RMB) exchange
rate of 7.80759. This is the published rate for 31 December 2006.
12.2 Valuation as at 31 December 2006
Pöyry has determined the valuation of the Sino-Forest assets as at 31 December
2006 to be USD919.0 million. This is the result of a valuation of the existing
planted area and uses an 11.5% discount rate applied to real, pre-tax cash flows.
Pöyry has also prepared an existing forest valuation that includes the revenues and
costs of re-establishing and maintaining the plantation forests for a 50 – year period
(perpetual valuation). However, to date Sino-Forest only has an option to lease the
land under the purchased trees for future rotations, the terms of which have yet to
be agreed. Sino-Forest is embarking on a 400 000 ha expansion of its estate in
Hunan. Pöyry has determined the valuation of the Sino-Forest forest assets based
on a perpetual rotation (including the planned expansion in Hunan) using a real
pre-tax discount rate of 11.5% to be USD1 427.6 million as at
31 December 200610
.
The following table presents the results of the valuation of the Sino-Forest estate.
The results are shown at real discount rates of 10.5%, 11.5% and 12.5% applied toreal pre-tax cash flows.
Table 12-1:USD Valuation as at 31 December 2006
Real Discount Rate Applied to Pre-tax Cash Flows
10.5% 11.5% 12.5%Forest Component
USD million
Existing forest estate of 352 010.2 ha,current rotation only
951.2 919.0 888.7
Existing forest, and all future rotationsincluding the 400 000 ha expansion inHunan
1 550.3 1 427.6 1 323.8
9Source: XE.com Interactive Currency Table ( http://www.xe.com/ict/ )
10This perpetual value estimate is based on the assumptions made with respect to the species composition and age-
class structure of the assets yet to be acquired in Hunan province. This value is indicative and should not be relied
upon as a promise of future value. Should definitive information describing the species and age-class structure of
potential acquisitions become available, this value should be reevaluated.
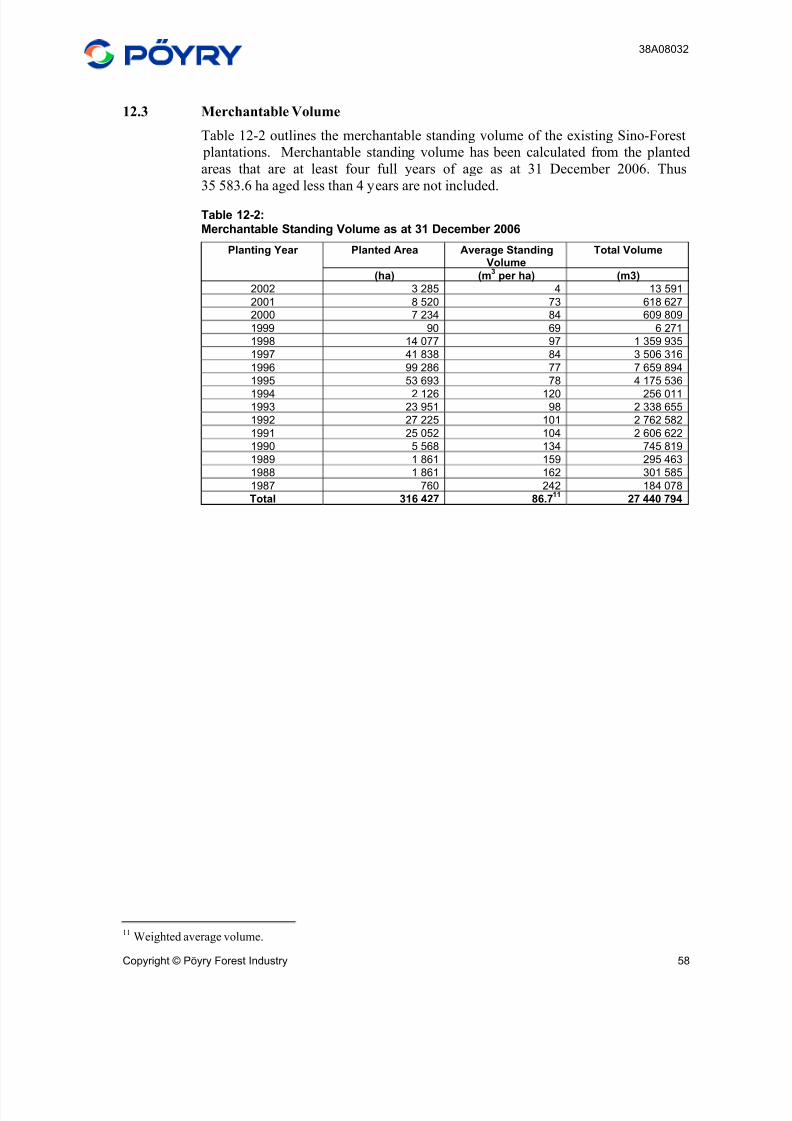
8/3/2019 Sino-Forest Poyry Valuation Dec 2006 Final
http://slidepdf.com/reader/full/sino-forest-poyry-valuation-dec-2006-final 72/122
38A08032
Copyright © Pöyry Forest Industry 58
12.3 Merchantable Volume
Table 12-2 outlines the merchantable standing volume of the existing Sino-Forest
plantations. Merchantable standing volume has been calculated from the planted
areas that are at least four full years of age as at 31 December 2006. Thus
35 583.6 ha aged less than 4 years are not included.
Table 12-2:Merchantable Standing Volume as at 31 December 2006
Planted Area Average StandingVolume
Total VolumePlanting Year
(ha) (m3
per ha) (m3)
2002 3 285 4 13 591
2001 8 520 73 618 627
2000 7 234 84 609 809
1999 90 69 6 271
1998 14 077 97 1 359 935
1997 41 838 84 3 506 316
1996 99 286 77 7 659 894
1995 53 693 78 4 175 536
1994 2 126 120 256 0111993 23 951 98 2 338 655
1992 27 225 101 2 762 582
1991 25 052 104 2 606 622
1990 5 568 134 745 819
1989 1 861 159 295 463
1988 1 861 162 301 585
1987 760 242 184 078
Total 316 427 86.711
27 440 794
11Weighted average volume.
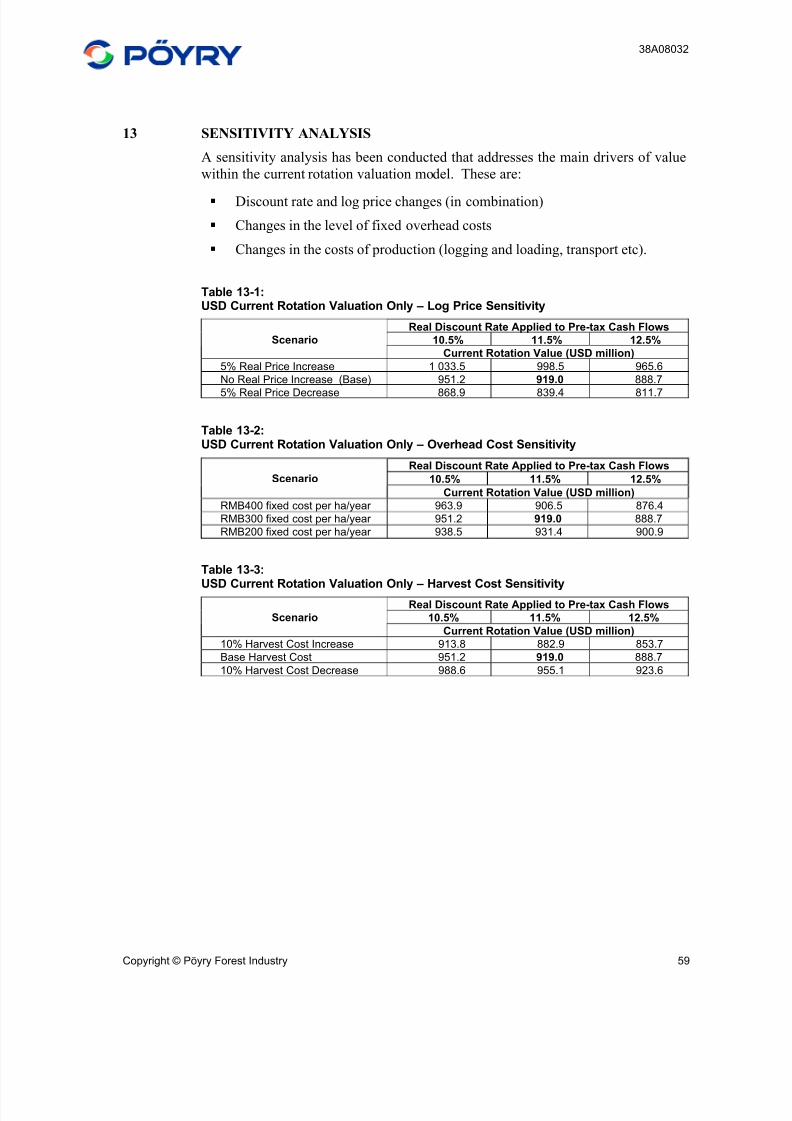
8/3/2019 Sino-Forest Poyry Valuation Dec 2006 Final
http://slidepdf.com/reader/full/sino-forest-poyry-valuation-dec-2006-final 73/122
38A08032
Copyright © Pöyry Forest Industry 59
13 SENSITIVITY ANALYSIS
A sensitivity analysis has been conducted that addresses the main drivers of value
within the current rotation valuation model. These are:
Discount rate and log price changes (in combination)
Changes in the level of fixed overhead costs
Changes in the costs of production (logging and loading, transport etc).
Table 13-1:USD Current Rotation Valuation Only – Log Price Sensitivity
Real Discount Rate Applied to Pre-tax Cash Flows
10.5% 11.5% 12.5%Scenario
Current Rotation Value (USD million)
5% Real Price Increase 1 033.5 998.5 965.6
No Real Price Increase (Base) 951.2 919.0 888.7
5% Real Price Decrease 868.9 839.4 811.7
Table 13-2:USD Current Rotation Valuation Only – Overhead Cost Sensitivity
Real Discount Rate Applied to Pre-tax Cash Flows
10.5% 11.5% 12.5%Scenario
Current Rotation Value (USD million)
RMB400 fixed cost per ha/year 963.9 906.5 876.4
RMB300 fixed cost per ha/year 951.2 919.0 888.7
RMB200 fixed cost per ha/year 938.5 931.4 900.9
Table 13-3:
USD Current Rotation Valuation Only – Harvest Cost SensitivityReal Discount Rate Applied to Pre-tax Cash Flows
10.5% 11.5% 12.5%Scenario
Current Rotation Value (USD million)
10% Harvest Cost Increase 913.8 882.9 853.7
Base Harvest Cost 951.2 919.0 888.7
10% Harvest Cost Decrease 988.6 955.1 923.6
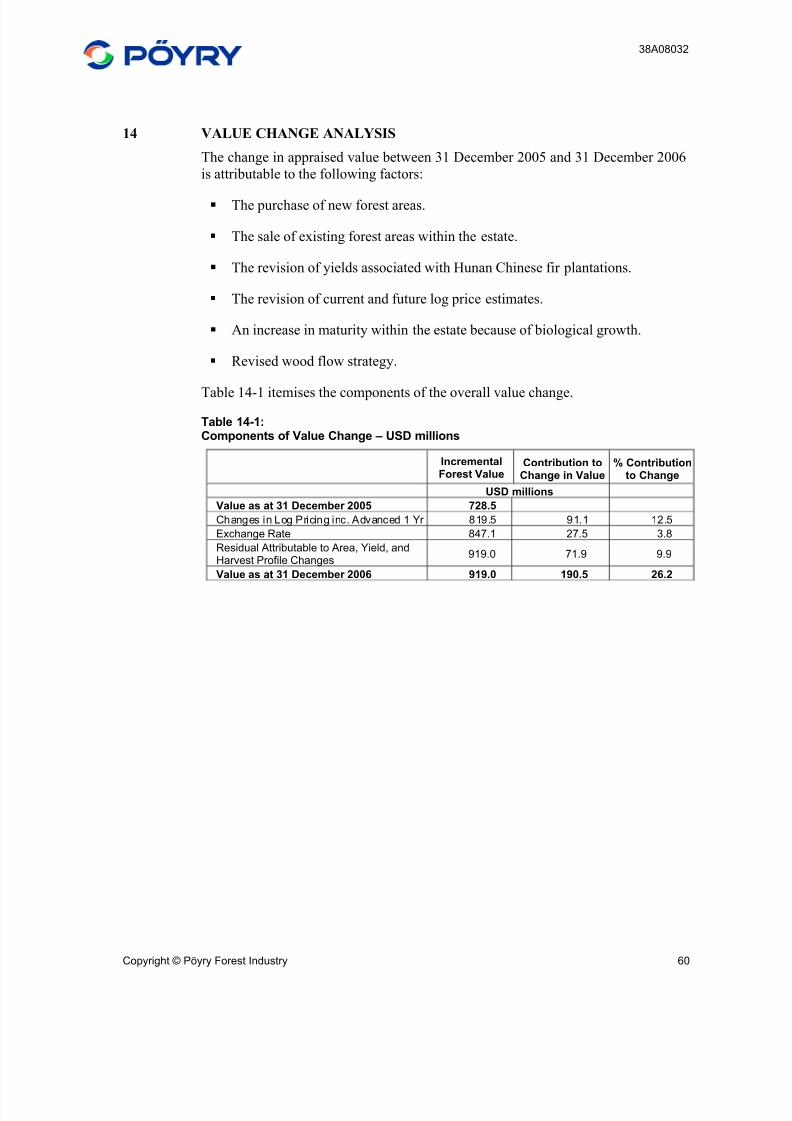
8/3/2019 Sino-Forest Poyry Valuation Dec 2006 Final
http://slidepdf.com/reader/full/sino-forest-poyry-valuation-dec-2006-final 74/122
38A08032
Copyright © Pöyry Forest Industry 60
14 VALUE CHANGE ANALYSIS
The change in appraised value between 31 December 2005 and 31 December 2006
is attributable to the following factors:
The purchase of new forest areas.
The sale of existing forest areas within the estate.
The revision of yields associated with Hunan Chinese fir plantations.
The revision of current and future log price estimates.
An increase in maturity within the estate because of biological growth.
Revised wood flow strategy.
Table 14-1 itemises the components of the overall value change.
Table 14-1:Components of Value Change – USD millions
IncrementalForest Value
Contribution toChange in Value
% Contributionto Change
USD millions
Value as at 31 December 2005 728.5
Changes in Log Pricing inc. Advanced 1 Yr 819.5 91.1 12.5
Exchange Rate 847.1 27.5 3.8
Residual Attributable to Area, Yield, andHarvest Profile Changes
919.0 71.9 9.9
Value as at 31 December 2006 919.0 190.5 26.2
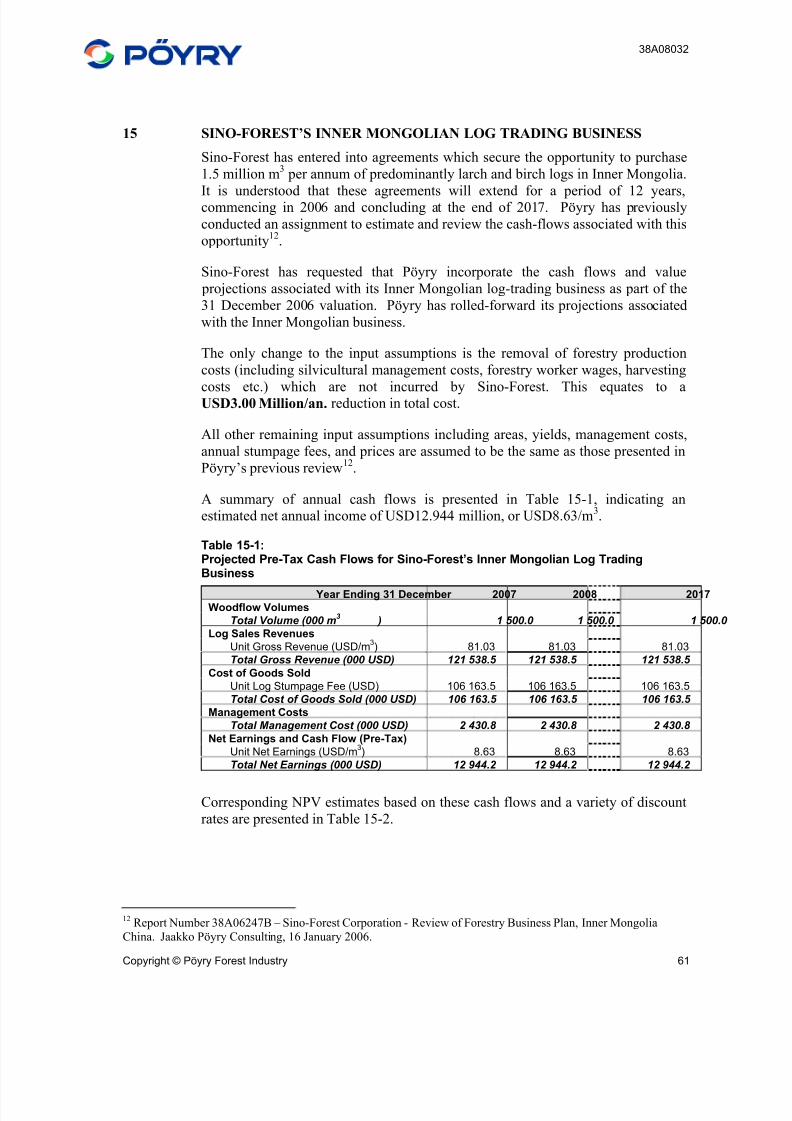
8/3/2019 Sino-Forest Poyry Valuation Dec 2006 Final
http://slidepdf.com/reader/full/sino-forest-poyry-valuation-dec-2006-final 75/122
38A08032
Copyright © Pöyry Forest Industry 61
15 SINO-FOREST’S INNER MONGOLIAN LOG TRADING BUSINESS
Sino-Forest has entered into agreements which secure the opportunity to purchase
1.5 million m3
per annum of predominantly larch and birch logs in Inner Mongolia.
It is understood that these agreements will extend for a period of 12 years,commencing in 2006 and concluding at the end of 2017. Pöyry has previously
conducted an assignment to estimate and review the cash-flows associated with this
opportunity12
.
Sino-Forest has requested that Pöyry incorporate the cash flows and value
projections associated with its Inner Mongolian log-trading business as part of the
31 December 2006 valuation. Pöyry has rolled-forward its projections associated
with the Inner Mongolian business.
The only change to the input assumptions is the removal of forestry production
costs (including silvicultural management costs, forestry worker wages, harvesting
costs etc.) which are not incurred by Sino-Forest. This equates to aUSD3.00 Million/an. reduction in total cost.
All other remaining input assumptions including areas, yields, management costs,
annual stumpage fees, and prices are assumed to be the same as those presented in
Pöyry’s previous review12
.
A summary of annual cash flows is presented in Table 15-1, indicating an
estimated net annual income of USD12.944 million, or USD8.63/m3.
Table 15-1:Projected Pre-Tax Cash Flows for Sino-Forest’s Inner Mongolian Log TradingBusiness
Year Ending 31 December 2007 2008 2017
Woodflow Volumes
Total Volume (000 m3 ) 1 500.0 1 500.0 1 500.0
Log Sales Revenues
Unit Gross Revenue (USD/m3) 81.03 81.03 81.03
Total Gross Revenue (000 USD) 121 538.5 121 538.5 121 538.5
Cost of Goods Sold
Unit Log Stumpage Fee (USD) 106 163.5 106 163.5 106 163.5
Total Cost of Goods Sold (000 USD) 106 163.5 106 163.5 106 163.5
Management Costs
Total Management Cost (000 USD) 2 430.8 2 430.8 2 430.8
Net Earnings and Cash Flow (Pre-Tax)
Unit Net Earnings (USD/m3) 8.63 8.63 8.63
Total Net Earnings (000 USD) 12 944.2 12 944.2 12 944.2
Corresponding NPV estimates based on these cash flows and a variety of discount
rates are presented in Table 15-2.
12Report Number 38A06247B – Sino-Forest Corporation - Review of Forestry Business Plan, Inner Mongolia
China. Jaakko Pöyry Consulting, 16 January 2006.
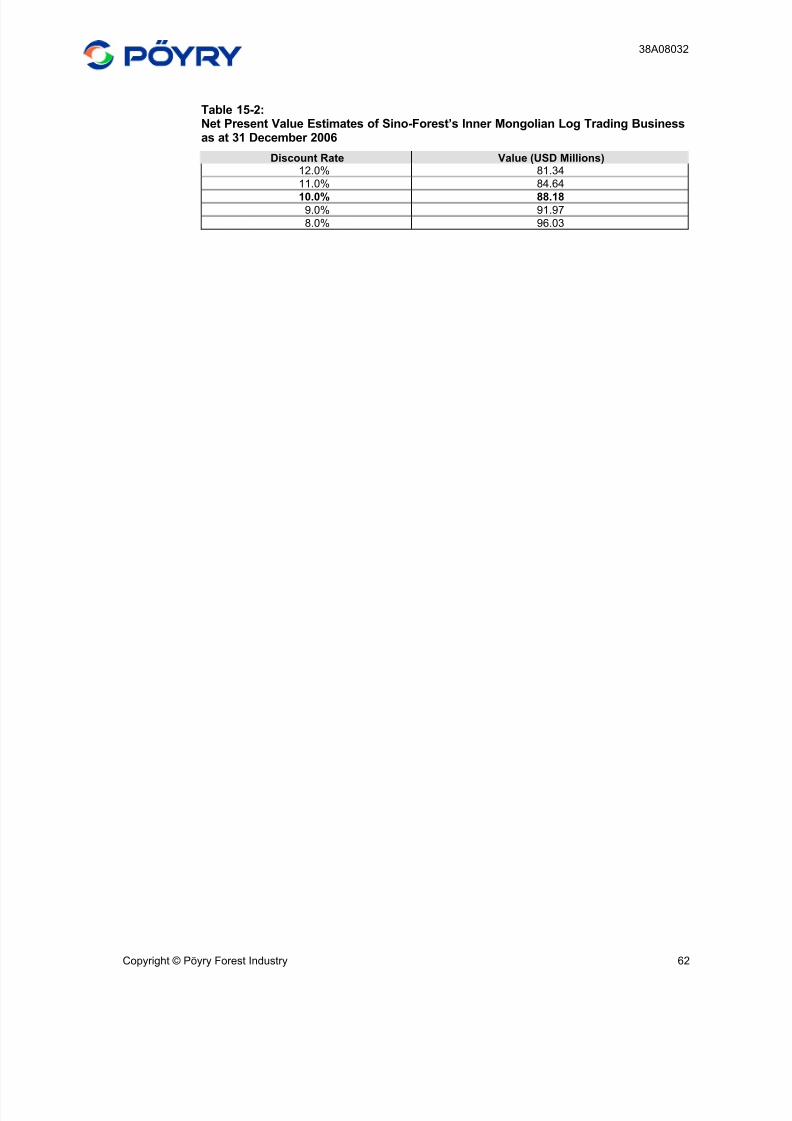
8/3/2019 Sino-Forest Poyry Valuation Dec 2006 Final
http://slidepdf.com/reader/full/sino-forest-poyry-valuation-dec-2006-final 76/122
38A08032
Copyright © Pöyry Forest Industry 62
Table 15-2:Net Present Value Estimates of Sino-Forest’s Inner Mongolian Log Trading Businessas at 31 December 2006
Discount Rate Value (USD Millions)12.0% 81.34
11.0% 84.64
10.0% 88.189.0% 91.97
8.0% 96.03

8/3/2019 Sino-Forest Poyry Valuation Dec 2006 Final
http://slidepdf.com/reader/full/sino-forest-poyry-valuation-dec-2006-final 77/122
APPENDIX 1
Field Inspection
8/3/2019 Sino-Forest Poyry Valuation Dec 2006 Final
http://slidepdf.com/reader/full/sino-forest-poyry-valuation-dec-2006-final 78/122
38A08032
Appendix 1
Copyright © Pöyry Forest Industry 1
1 BACKGROUND
During the 10 day period of the 15th
to 25th
of January 2007, two consultant teams
from Pöyry undertook a high-level field inspection of the Sino-Forest resource. The
field inspection exercise included:
Meetings with local Sino-Forest staff to discuss key events and inputs
which may influence the forest valuation
Meetings with local Forest Bureau staff regarding local forestry related
issues, relevant local governmental restrictions, taxation, general forest
costs etc.
A high-level inventory of key yield characteristics including stocking,
height, diameter, volume and grade out-turn,
Verification of stand boundaries and areas via the use of hand held GPS
devices and Forest Bureau maps.
One team focused on the new acquisitions within Guangxi Province while the other
targeted the Chinese fir forests in Hunan.
1.1 Guangxi
Guangxi Province covers a total area in excess of 23.5 million ha. Around 39%
(9.2 million ha) of this area is classified as forested, and approximately 67%
(6.1 million ha) of these forested areas are managed commercially.
According to the data provided, Sino-Forest owns and manages a total of
88 523.4 ha of plantation forests throughout Guangxi. Area by age-class
distributions by ownership, species group and city are presented in the following
figures.
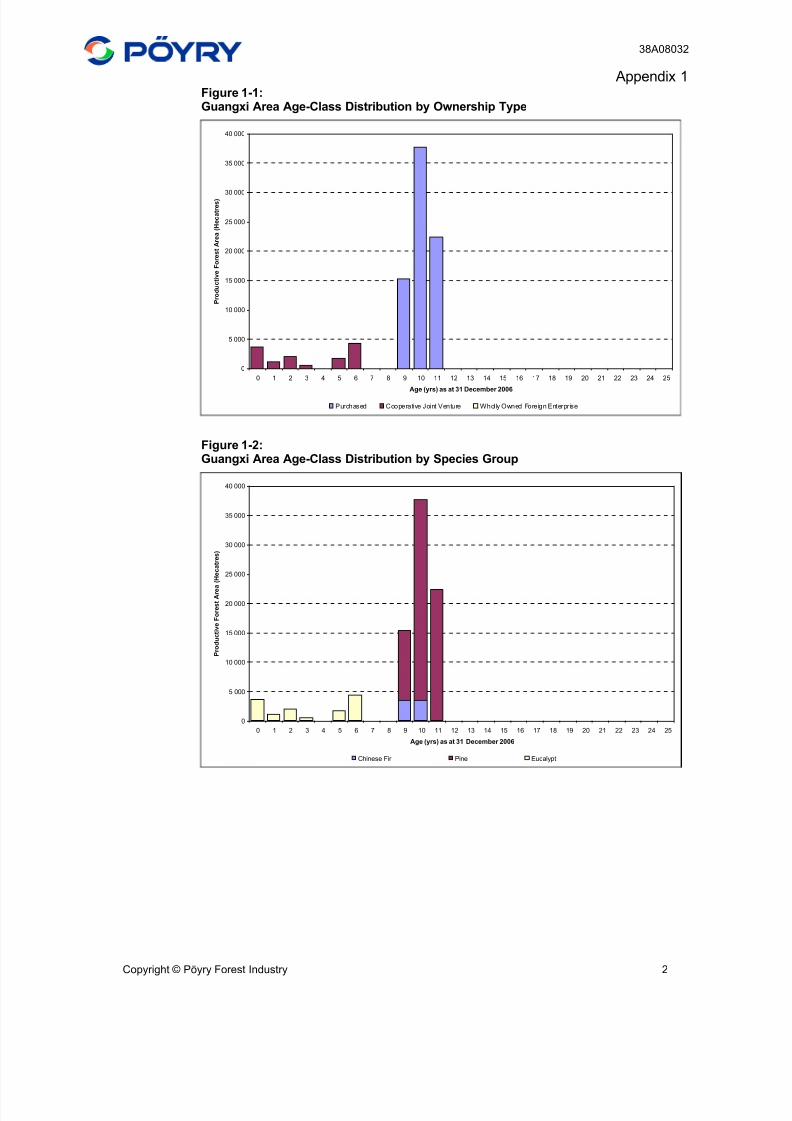
8/3/2019 Sino-Forest Poyry Valuation Dec 2006 Final
http://slidepdf.com/reader/full/sino-forest-poyry-valuation-dec-2006-final 79/122
38A08032
Appendix 1
Copyright © Pöyry Forest Industry 2
Figure 1-1:Guangxi Area Age-Class Distribution by Ownership Type
0
5 000
10 000
15 000
20 000
25 000
30 000
35 000
40 000
0 1 2 3 4 5 6 7 8 9 10 11 12 13 14 15 16 17 18 19 20 21 22 23 24 25
Age (yrs) as at 31 December 2006
P r o d u c t i v e F o r e s t A r e a ( H e c a t r e s )
Purchased Cooperative Joint Venture Wholly Owned Foreign Enterprise
Figure 1-2:Guangxi Area Age-Class Distribution by Species Group
0
5 000
10 000
15 000
20 000
25 000
30 000
35 000
40 000
0 1 2 3 4 5 6 7 8 9 10 11 12 13 14 15 16 17 18 19 20 21 22 23 24 25
Age (yrs) as at 31 December 2006
P r o d u c t i v e F o r e s t A r e a ( H e c a t r e s )
Chinese Fir Pine Eucalypt
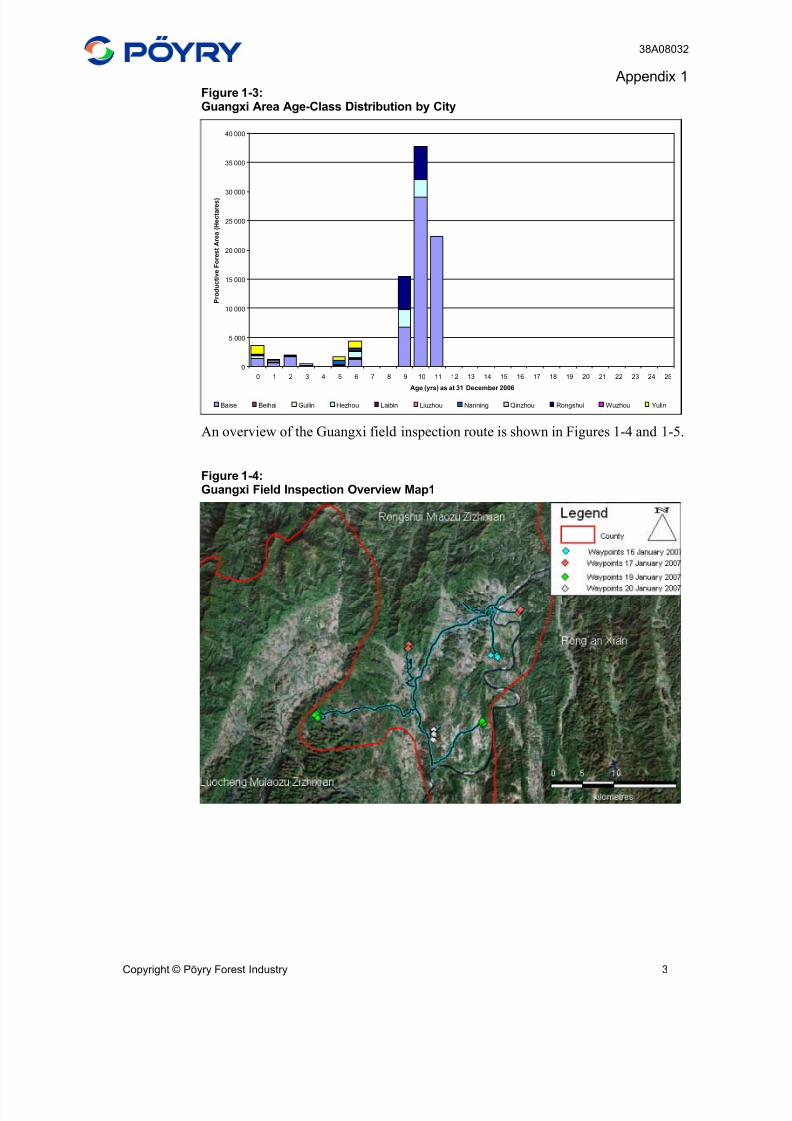
8/3/2019 Sino-Forest Poyry Valuation Dec 2006 Final
http://slidepdf.com/reader/full/sino-forest-poyry-valuation-dec-2006-final 80/122
38A08032
Appendix 1
Copyright © Pöyry Forest Industry 3
Figure 1-3:Guangxi Area Age-Class Distribution by City
0
5 000
10 000
15 000
20 000
25 000
30 000
35 000
40 000
0 1 2 3 4 5 6 7 8 9 10 11 12 13 14 15 16 17 18 19 20 21 22 23 24 25
Age (yrs) as at 31 December 2006
P r o d u c t i v e F o r e s t A r e a ( H e c t a r e s )
Baise Beihai Guilin Hezhou Laibin Liuzhou Nanning Qinzhou Rongshui Wuzhou Yulin
An overview of the Guangxi field inspection route is shown in Figures 1-4 and 1-5.
Figure 1-4:Guangxi Field Inspection Overview Map1
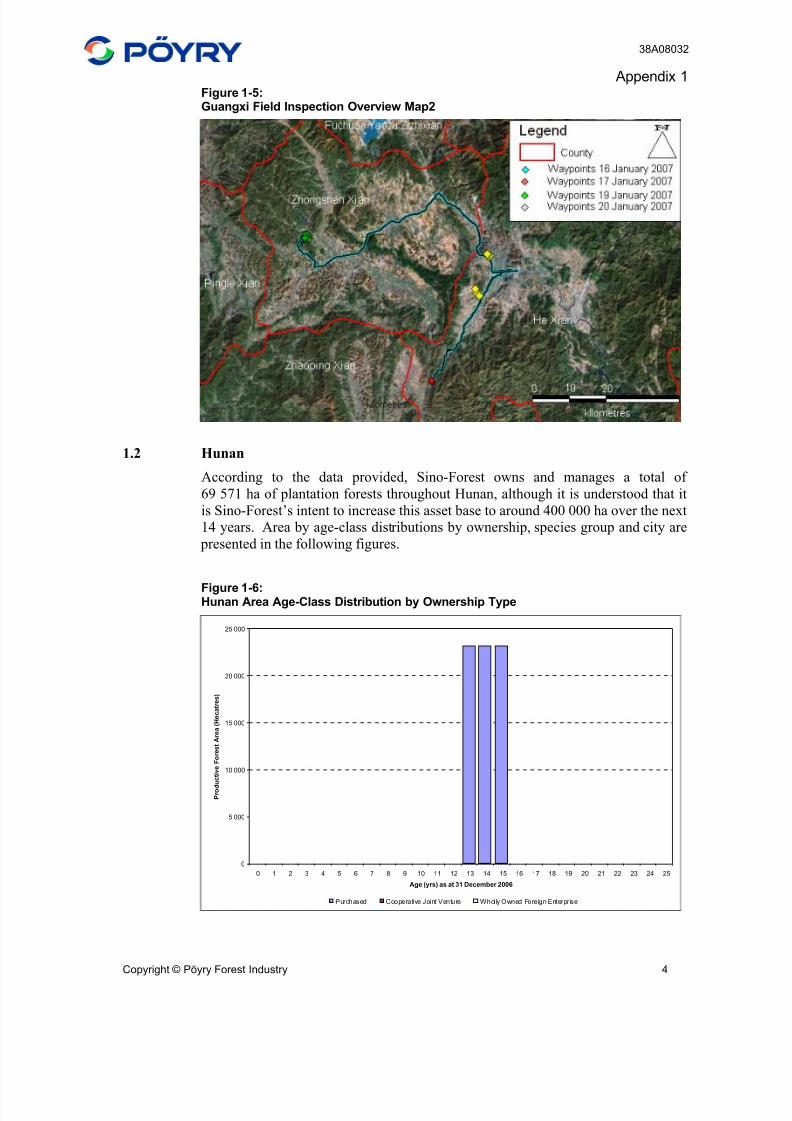
8/3/2019 Sino-Forest Poyry Valuation Dec 2006 Final
http://slidepdf.com/reader/full/sino-forest-poyry-valuation-dec-2006-final 81/122
38A08032
Appendix 1
Copyright © Pöyry Forest Industry 4
Figure 1-5:Guangxi Field Inspection Overview Map2
1.2 Hunan
According to the data provided, Sino-Forest owns and manages a total of
69 571 ha of plantation forests throughout Hunan, although it is understood that it
is Sino-Forest’s intent to increase this asset base to around 400 000 ha over the next
14 years. Area by age-class distributions by ownership, species group and city are
presented in the following figures.
Figure 1-6:Hunan Area Age-Class Distribution by Ownership Type
0
5 000
10 000
15 000
20 000
25 000
0 1 2 3 4 5 6 7 8 9 10 11 12 13 14 15 16 17 18 19 20 21 22 23 24 25
Age (yrs) as at 31 December 2006
P r o d u c t i v e F o r e s t A r e a ( H e c a t r e s )
Purchased Cooperative Joint Venture Wholly Owned Foreign Enterprise
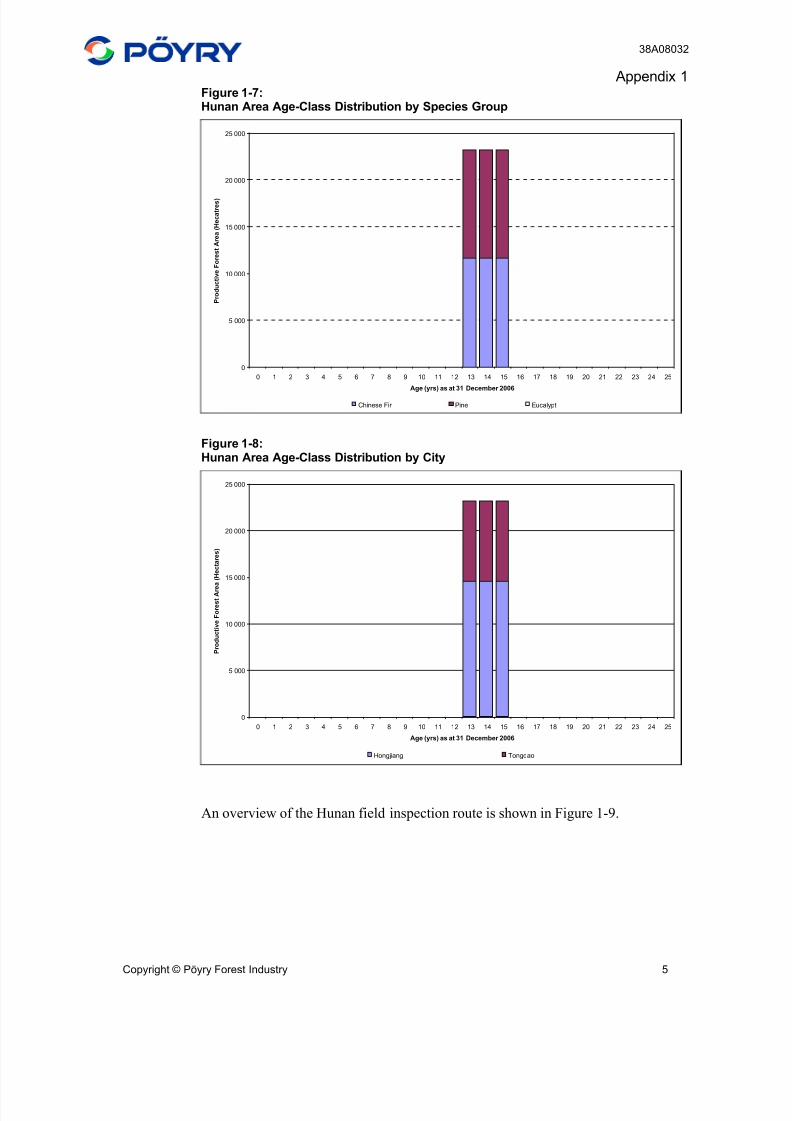
8/3/2019 Sino-Forest Poyry Valuation Dec 2006 Final
http://slidepdf.com/reader/full/sino-forest-poyry-valuation-dec-2006-final 82/122
38A08032
Appendix 1
Copyright © Pöyry Forest Industry 5
Figure 1-7:Hunan Area Age-Class Distribution by Species Group
0
5 000
10 000
15 000
20 000
25 000
0 1 2 3 4 5 6 7 8 9 10 11 12 13 14 15 16 17 18 19 20 21 22 23 24 25
Age (yrs) as at 31 December 2006
P r o d u c t i v e F o r e s t A r e a ( H e c a t r e s )
Chinese Fir Pine Eucalypt
Figure 1-8:Hunan Area Age-Class Distribution by City
0
5 000
10 000
15 000
20 000
25 000
0 1 2 3 4 5 6 7 8 9 10 11 12 13 14 15 16 17 18 19 20 21 22 23 24 25
Age (yrs) as at 31 December 2006
P r o d u c t i v e F o r e s t A r e
a ( H e c t a r e s )
Hongjiang Tongdao
An overview of the Hunan field inspection route is shown in Figure 1-9.
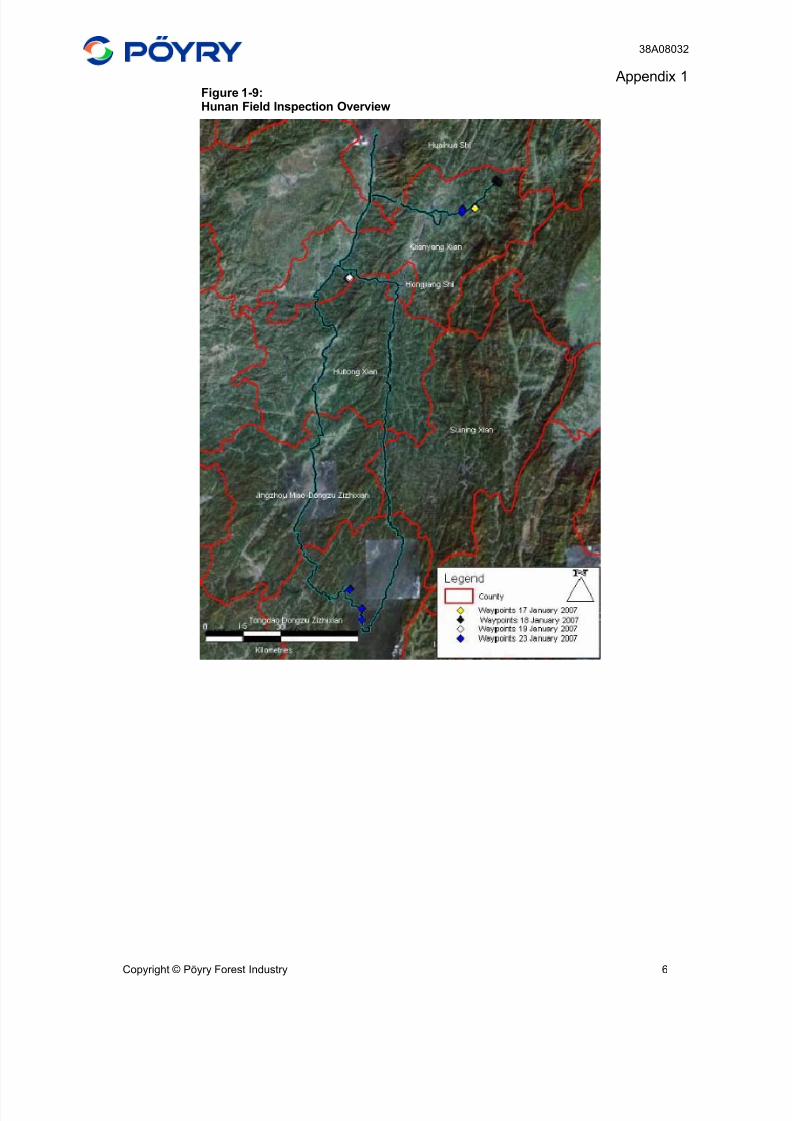
8/3/2019 Sino-Forest Poyry Valuation Dec 2006 Final
http://slidepdf.com/reader/full/sino-forest-poyry-valuation-dec-2006-final 83/122
38A08032
Appendix 1
Copyright © Pöyry Forest Industry 6
Figure 1-9:Hunan Field Inspection Overview
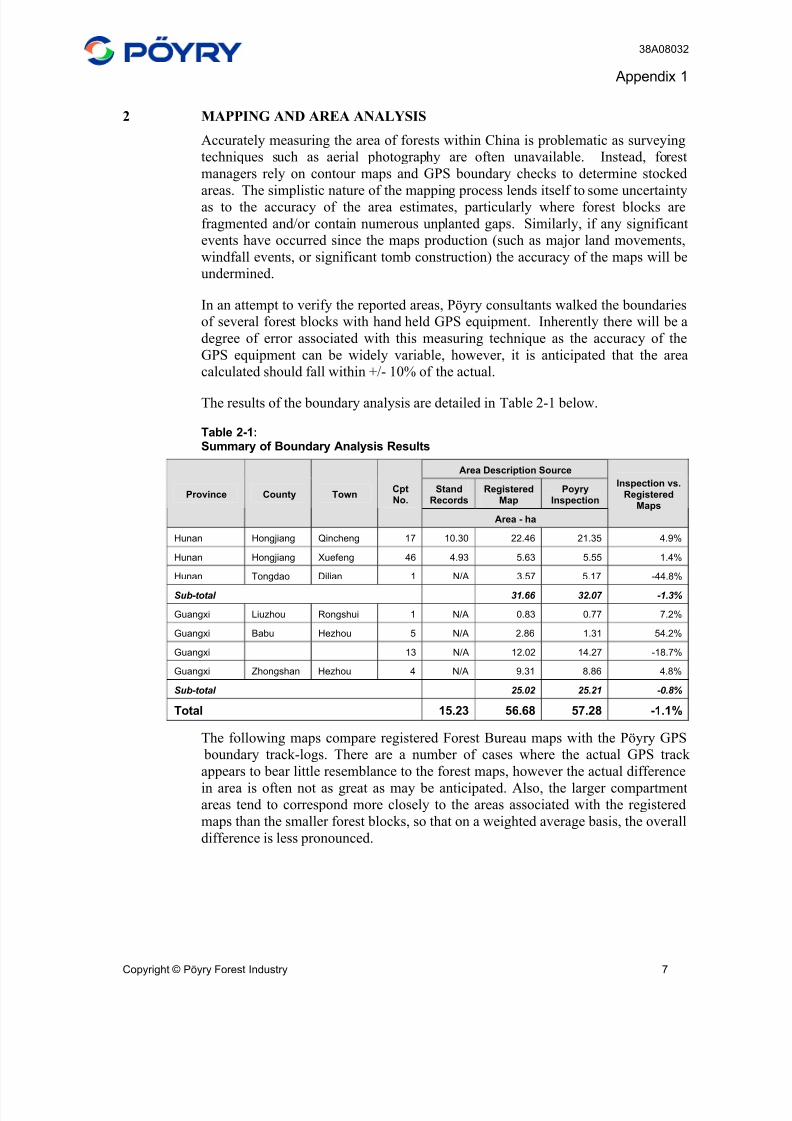
8/3/2019 Sino-Forest Poyry Valuation Dec 2006 Final
http://slidepdf.com/reader/full/sino-forest-poyry-valuation-dec-2006-final 84/122
38A08032
Appendix 1
Copyright © Pöyry Forest Industry 7
2 MAPPING AND AREA ANALYSIS
Accurately measuring the area of forests within China is problematic as surveying
techniques such as aerial photography are often unavailable. Instead, forest
managers rely on contour maps and GPS boundary checks to determine stocked
areas. The simplistic nature of the mapping process lends itself to some uncertaintyas to the accuracy of the area estimates, particularly where forest blocks are
fragmented and/or contain numerous unplanted gaps. Similarly, if any significant
events have occurred since the maps production (such as major land movements,
windfall events, or significant tomb construction) the accuracy of the maps will be
undermined.
In an attempt to verify the reported areas, Pöyry consultants walked the boundaries
of several forest blocks with hand held GPS equipment. Inherently there will be a
degree of error associated with this measuring technique as the accuracy of the
GPS equipment can be widely variable, however, it is anticipated that the area
calculated should fall within +/- 10% of the actual.
The results of the boundary analysis are detailed in Table 2-1 below.
Table 2-1:Summary of Boundary Analysis Results
Area Description Source
StandRecords
RegisteredMap
PoyryInspection
Province County TownCptNo.
Area - ha
Inspection vs.Registered
Maps
Hunan Hongjiang Qincheng 17 10.30 22.46 21.35 4.9%
Hunan Hongjiang Xuefeng 46 4.93 5.63 5.55 1.4%
Hunan Tongdao Dilian 1 N/A 3.57 5.17 -44.8%
Sub-total 31.66 32.07 -1.3%
Guangxi Liuzhou Rongshui 1 N/A 0.83 0.77 7.2%
Guangxi Babu Hezhou 5 N/A 2.86 1.31 54.2%
Guangxi 13 N/A 12.02 14.27 -18.7%
Guangxi Zhongshan Hezhou 4 N/A 9.31 8.86 4.8%
Sub-total 25.02 25.21 -0.8%
Total 15.23 56.68 57.28 -1.1%
The following maps compare registered Forest Bureau maps with the Pöyry GPS
boundary track-logs. There are a number of cases where the actual GPS track
appears to bear little resemblance to the forest maps, however the actual difference
in area is often not as great as may be anticipated. Also, the larger compartmentareas tend to correspond more closely to the areas associated with the registered
maps than the smaller forest blocks, so that on a weighted average basis, the overall
difference is less pronounced.
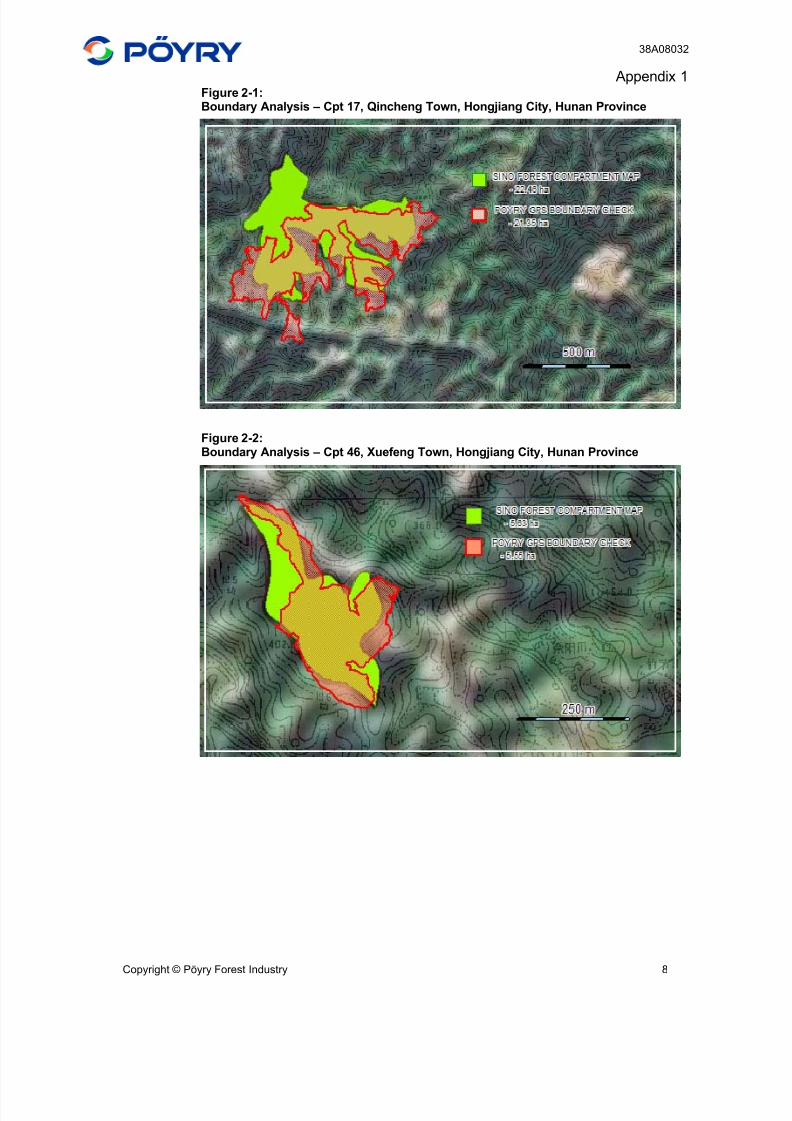
8/3/2019 Sino-Forest Poyry Valuation Dec 2006 Final
http://slidepdf.com/reader/full/sino-forest-poyry-valuation-dec-2006-final 85/122
38A08032
Appendix 1
Copyright © Pöyry Forest Industry 8
Figure 2-1:Boundary Analysis – Cpt 17, Qincheng Town, Hongjiang City, Hunan Province
Figure 2-2:Boundary Analysis – Cpt 46, Xuefeng Town, Hongjiang City, Hunan Province
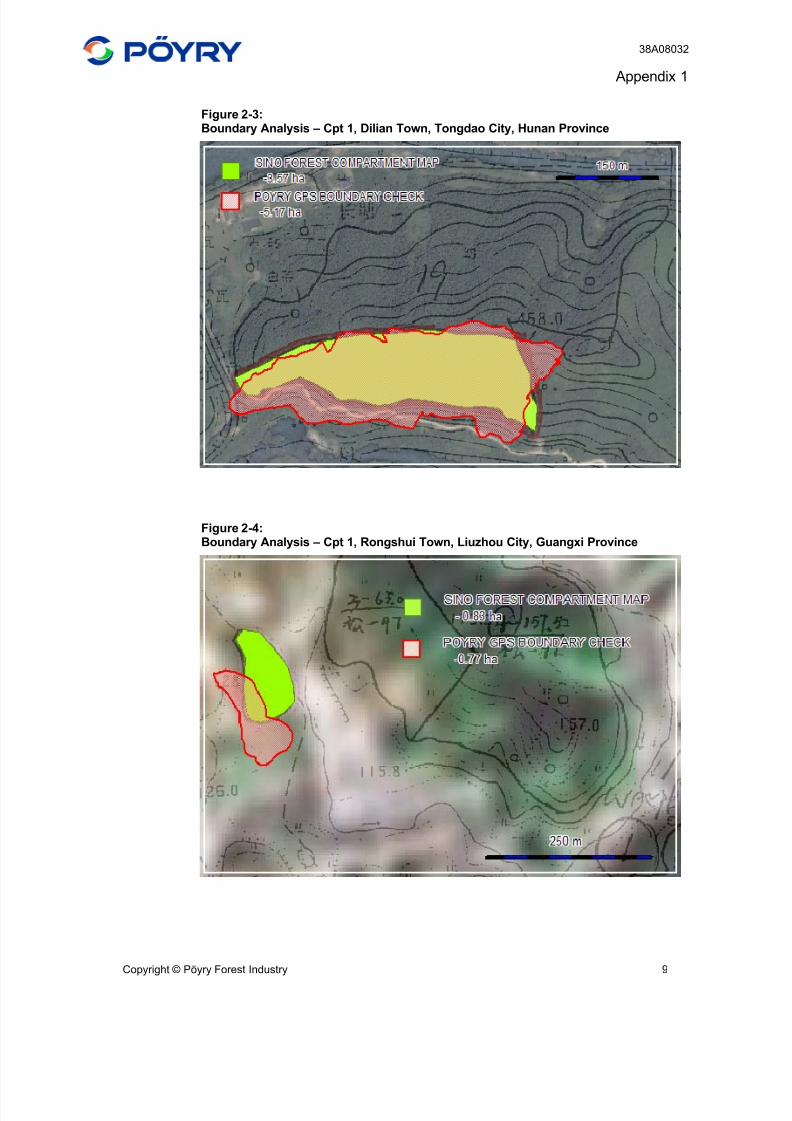
8/3/2019 Sino-Forest Poyry Valuation Dec 2006 Final
http://slidepdf.com/reader/full/sino-forest-poyry-valuation-dec-2006-final 86/122
38A08032
Appendix 1
Copyright © Pöyry Forest Industry 9
Figure 2-3:Boundary Analysis – Cpt 1, Dilian Town, Tongdao City, Hunan Province
Figure 2-4:Boundary Analysis – Cpt 1, Rongshui Town, Liuzhou City, Guangxi Province
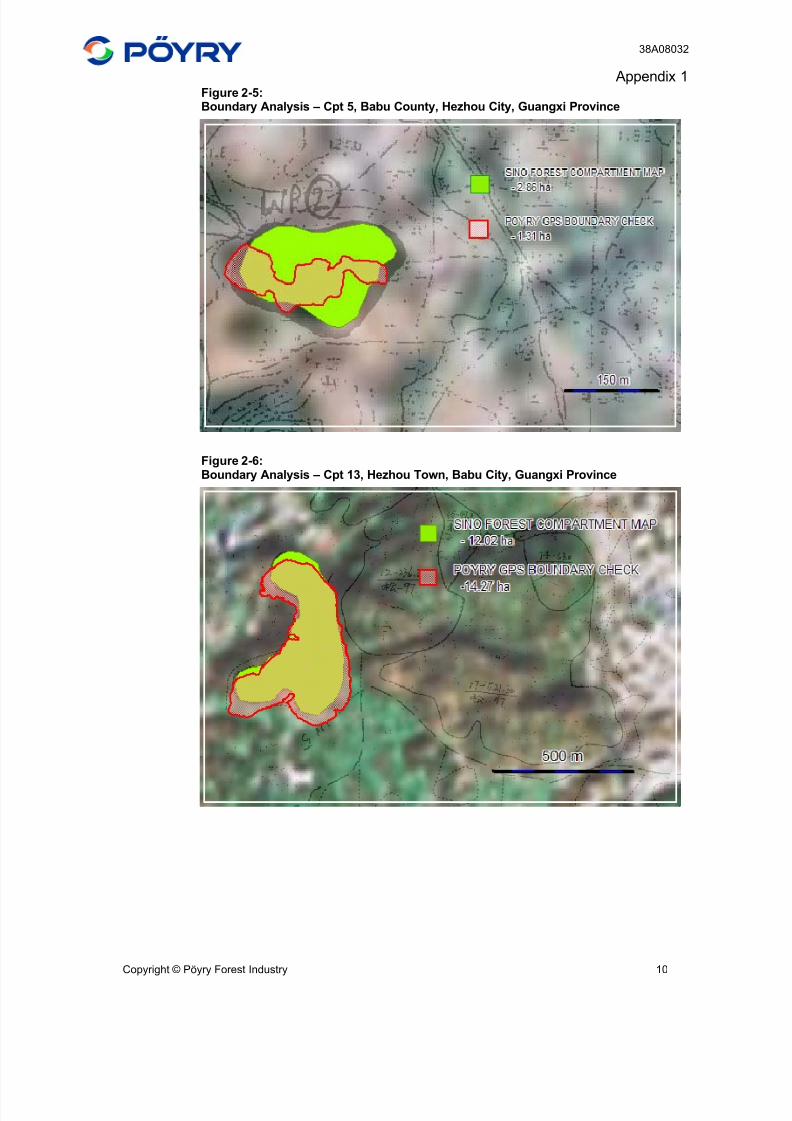
8/3/2019 Sino-Forest Poyry Valuation Dec 2006 Final
http://slidepdf.com/reader/full/sino-forest-poyry-valuation-dec-2006-final 87/122
38A08032
Appendix 1
Copyright © Pöyry Forest Industry 10
Figure 2-5:Boundary Analysis – Cpt 5, Babu County, Hezhou City, Guangxi Province
Figure 2-6:Boundary Analysis – Cpt 13, Hezhou Town, Babu City, Guangxi Province
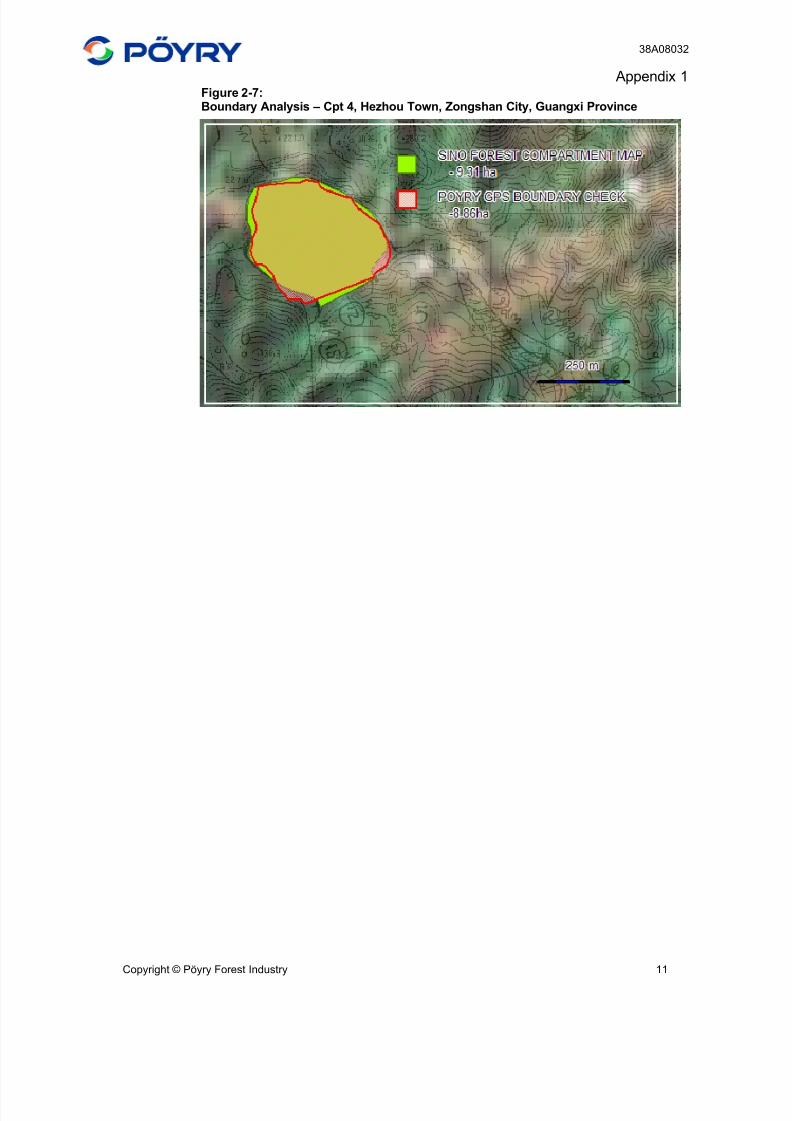
8/3/2019 Sino-Forest Poyry Valuation Dec 2006 Final
http://slidepdf.com/reader/full/sino-forest-poyry-valuation-dec-2006-final 88/122
38A08032
Appendix 1
Copyright © Pöyry Forest Industry 11
Figure 2-7:Boundary Analysis – Cpt 4, Hezhou Town, Zongshan City, Guangxi Province
8/3/2019 Sino-Forest Poyry Valuation Dec 2006 Final
http://slidepdf.com/reader/full/sino-forest-poyry-valuation-dec-2006-final 89/122
38A08032
Appendix 1
Copyright © Pöyry Forest Industry 12
3 INVENTORY AND YIELD ANALYSIS
A high-level forest inventory survey was undertaken as part of the field inspection
exercise. The main objectives of the inventory were to test the appropriateness of
Sino-Forest’s forest records against actual measurements and to evaluate the
anticipated standing volumes and grade recoveries.
The results of the inventory analysis are reported in Section 5.3 of the main body of
the report.
4 GENERAL FIELD INSPECTION RESULTS AND PHOTO ESSAY
4.1 Hunan
Due to time and budget constraints, the Hunan field concentrated on the Chinese fir
resource which represents the majority of the current Hunan acquisition.
Overall, the forests visited as part of the inspection were well stocked, withtypically uniform size and stem form. The average standing volume measured was
164 m3/ha from an average stocking of 2327 stems per hectare. Stocking levels for
this species are typically high, however it is in Pöyry’s opinion that future replant
stocking levels could be reduced to encourage greater diameter growth (Photo 4-7).
Access to the forests was generally satisfactory and, with the development of a new
provincial level motorway, the transportation of harvested trees will become easier
in the near future.
The overall terrain profile is moderate to steep, with the majority of plots being
located on slopes greater than 25 degrees. The weighted average slope recorded
was 31 degrees. Sino-Forest will need to be diligent during the harvesting and siteestablishment phases to retain adequate ground cover and avoid excessive soil
disturbance/mass movement.
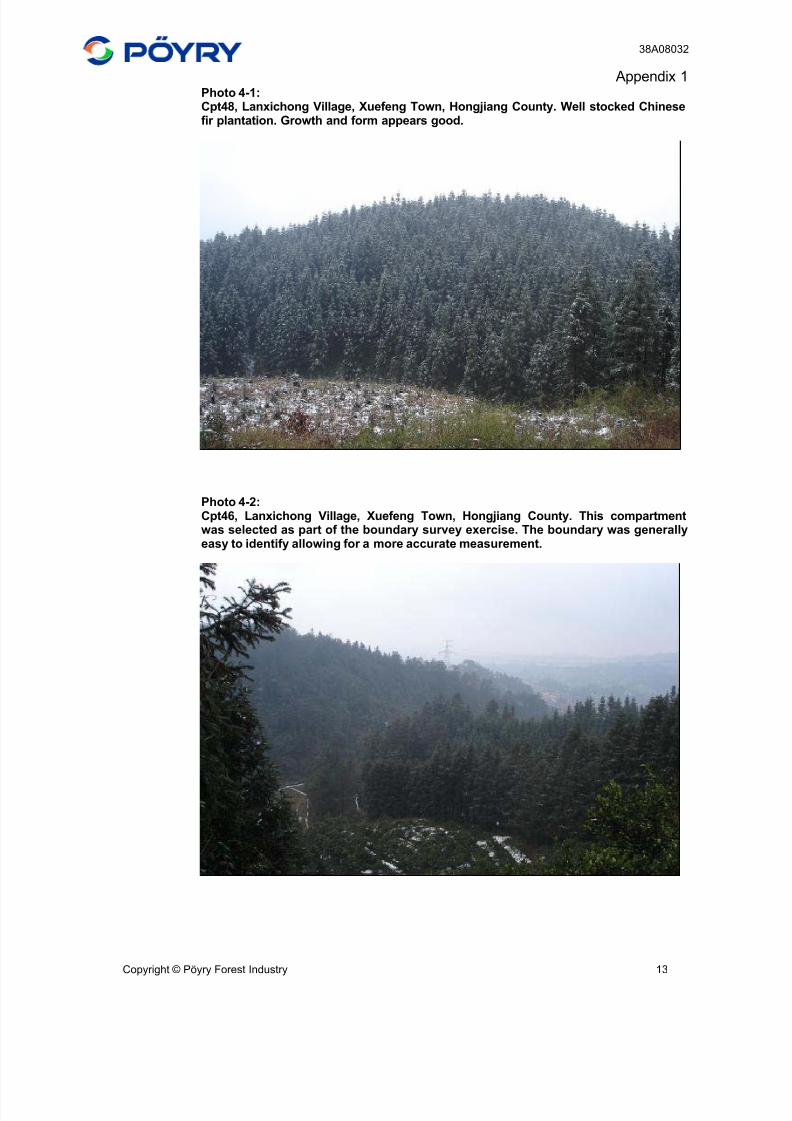
8/3/2019 Sino-Forest Poyry Valuation Dec 2006 Final
http://slidepdf.com/reader/full/sino-forest-poyry-valuation-dec-2006-final 90/122
38A08032
Appendix 1
Copyright © Pöyry Forest Industry 13
Photo 4-1:Cpt48, Lanxichong Village, Xuefeng Town, Hongjiang County. Well stocked Chinesefir plantation. Growth and form appears good.
Photo 4-2:Cpt46, Lanxichong Village, Xuefeng Town, Hongjiang County. This compartmentwas selected as part of the boundary survey exercise. The boundary was generallyeasy to identify allowing for a more accurate measurement.
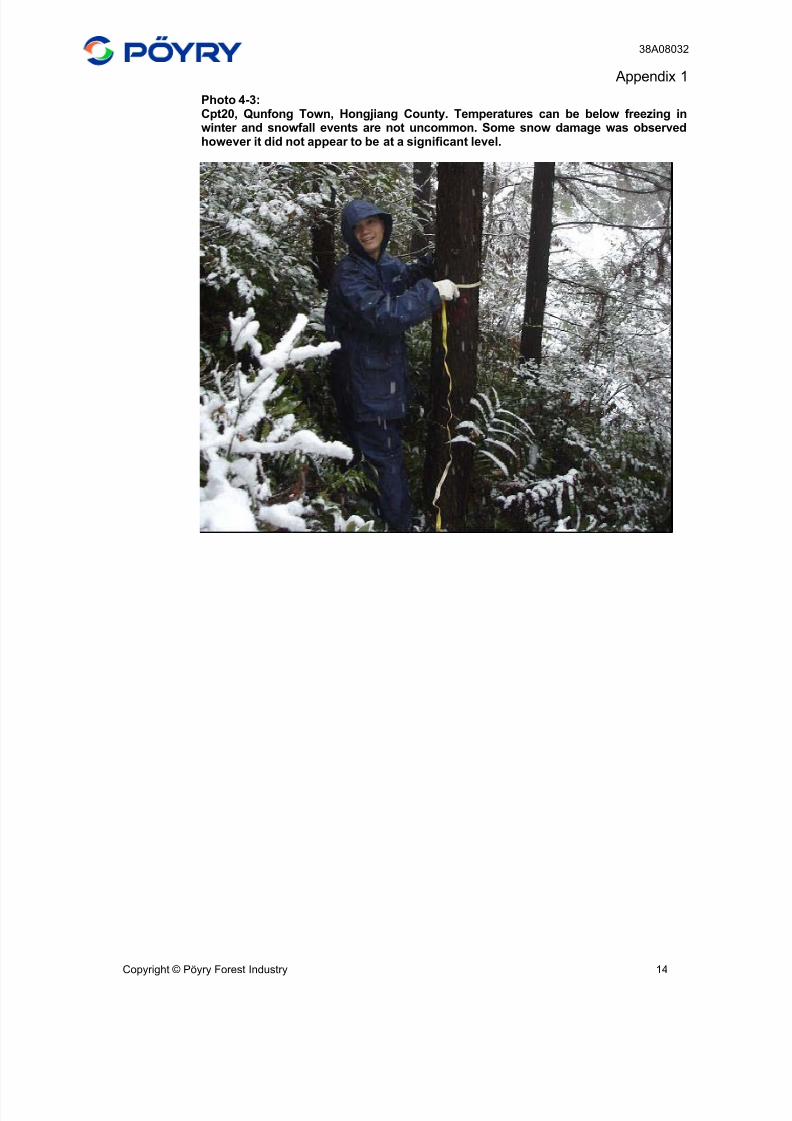
8/3/2019 Sino-Forest Poyry Valuation Dec 2006 Final
http://slidepdf.com/reader/full/sino-forest-poyry-valuation-dec-2006-final 91/122
38A08032
Appendix 1
Copyright © Pöyry Forest Industry 14
Photo 4-3:Cpt20, Qunfong Town, Hongjiang County. Temperatures can be below freezing inwinter and snowfall events are not uncommon. Some snow damage was observedhowever it did not appear to be at a significant level.
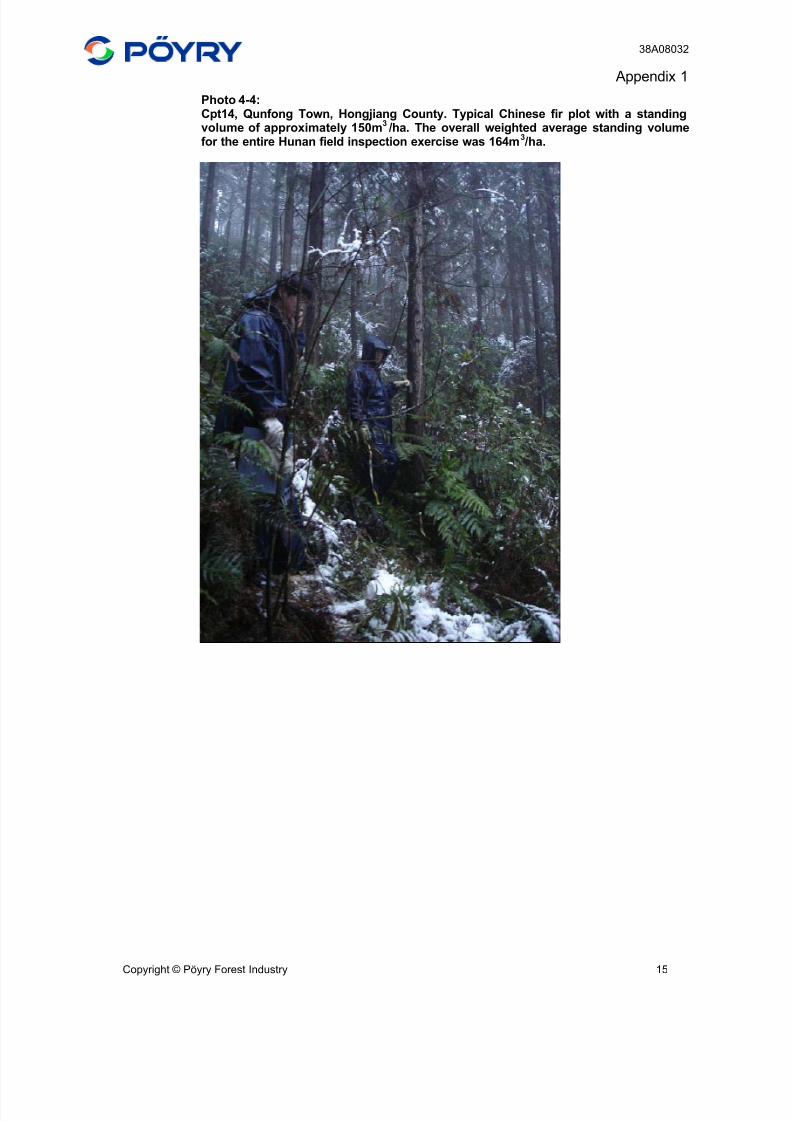
8/3/2019 Sino-Forest Poyry Valuation Dec 2006 Final
http://slidepdf.com/reader/full/sino-forest-poyry-valuation-dec-2006-final 92/122
38A08032
Appendix 1
Copyright © Pöyry Forest Industry 15
Photo 4-4:Cpt14, Qunfong Town, Hongjiang County. Typical Chinese fir plot with a standingvolume of approximately 150m
3 /ha. The overall weighted average standing volume
for the entire Hunan field inspection exercise was 164m3 /ha.
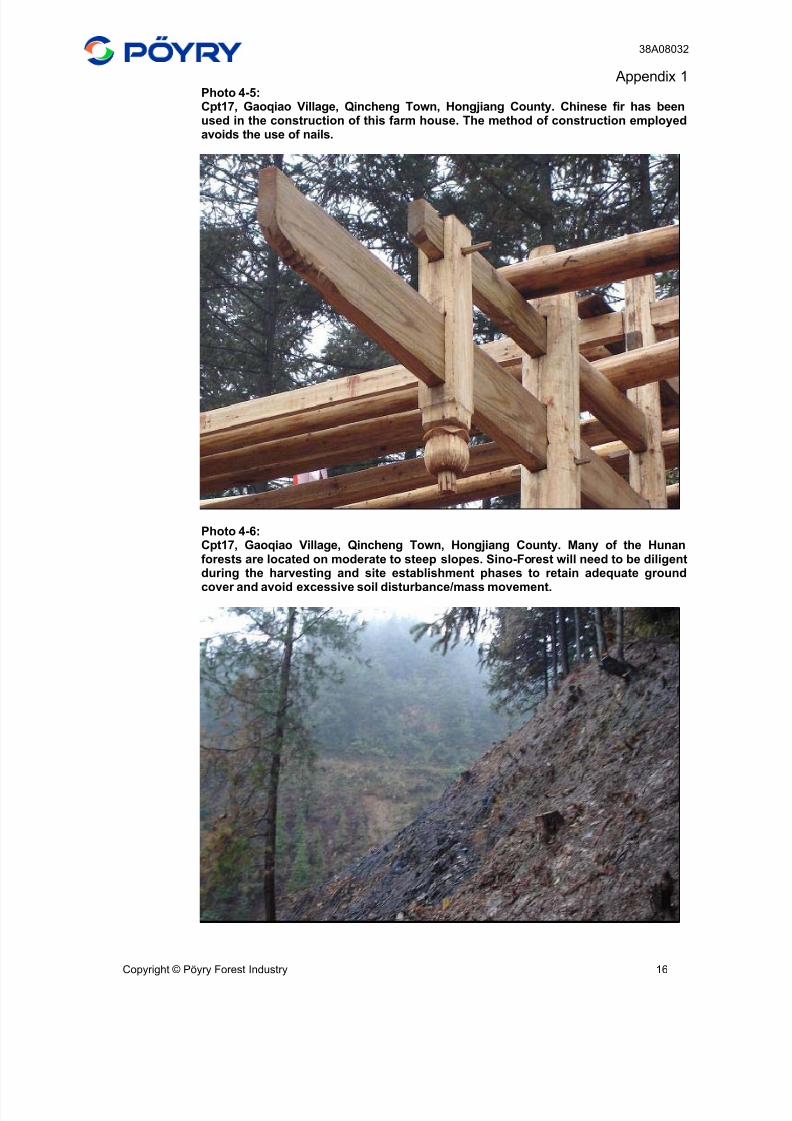
8/3/2019 Sino-Forest Poyry Valuation Dec 2006 Final
http://slidepdf.com/reader/full/sino-forest-poyry-valuation-dec-2006-final 93/122
38A08032
Appendix 1
Copyright © Pöyry Forest Industry 16
Photo 4-5:Cpt17, Gaoqiao Village, Qincheng Town, Hongjiang County. Chinese fir has beenused in the construction of this farm house. The method of construction employedavoids the use of nails.
Photo 4-6:Cpt17, Gaoqiao Village, Qincheng Town, Hongjiang County. Many of the Hunanforests are located on moderate to steep slopes. Sino-Forest will need to be diligentduring the harvesting and site establishment phases to retain adequate ground
cover and avoid excessive soil disturbance/mass movement.
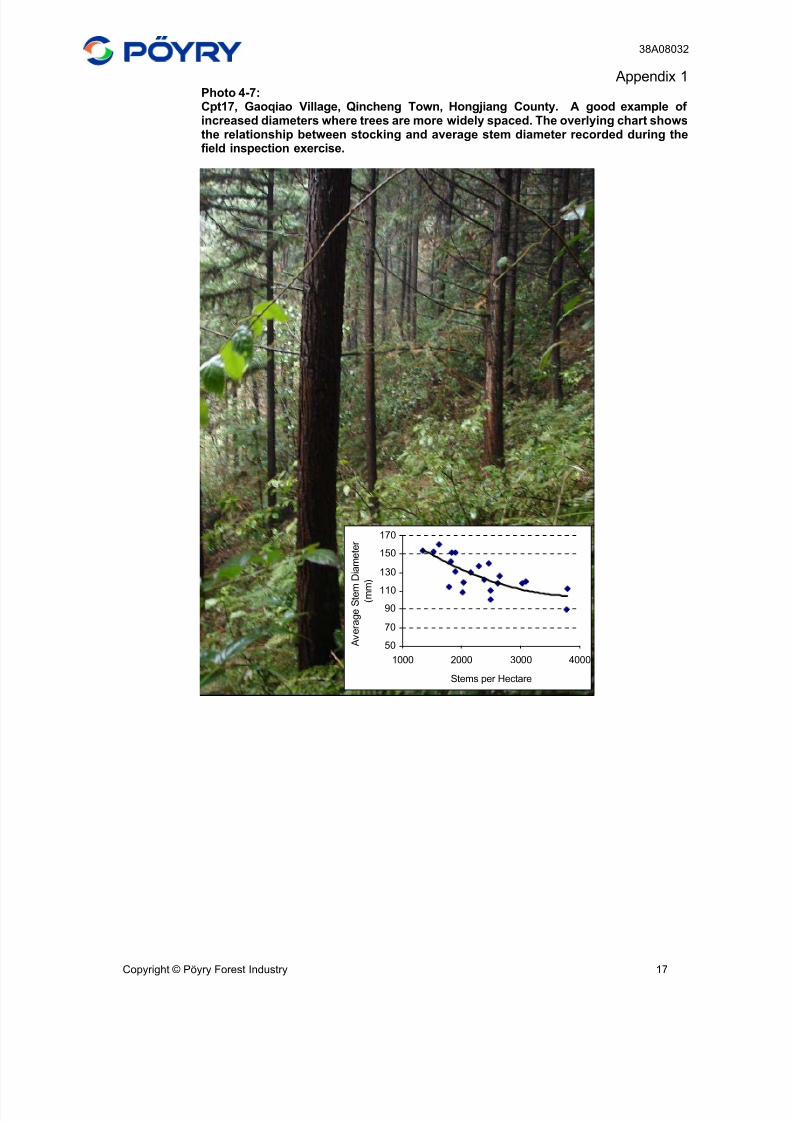
8/3/2019 Sino-Forest Poyry Valuation Dec 2006 Final
http://slidepdf.com/reader/full/sino-forest-poyry-valuation-dec-2006-final 94/122
38A08032
Appendix 1
Copyright © Pöyry Forest Industry 17
Photo 4-7:Cpt17, Gaoqiao Village, Qincheng Town, Hongjiang County. A good example of increased diameters where trees are more widely spaced. The overlying chart showsthe relationship between stocking and average stem diameter recorded during thefield inspection exercise.
50
70
90
110
130
150
170
1000 2000 3000 4000
Stems per Hectare
A v e r a g e S t e m
D i a m e t e r
( m m
)
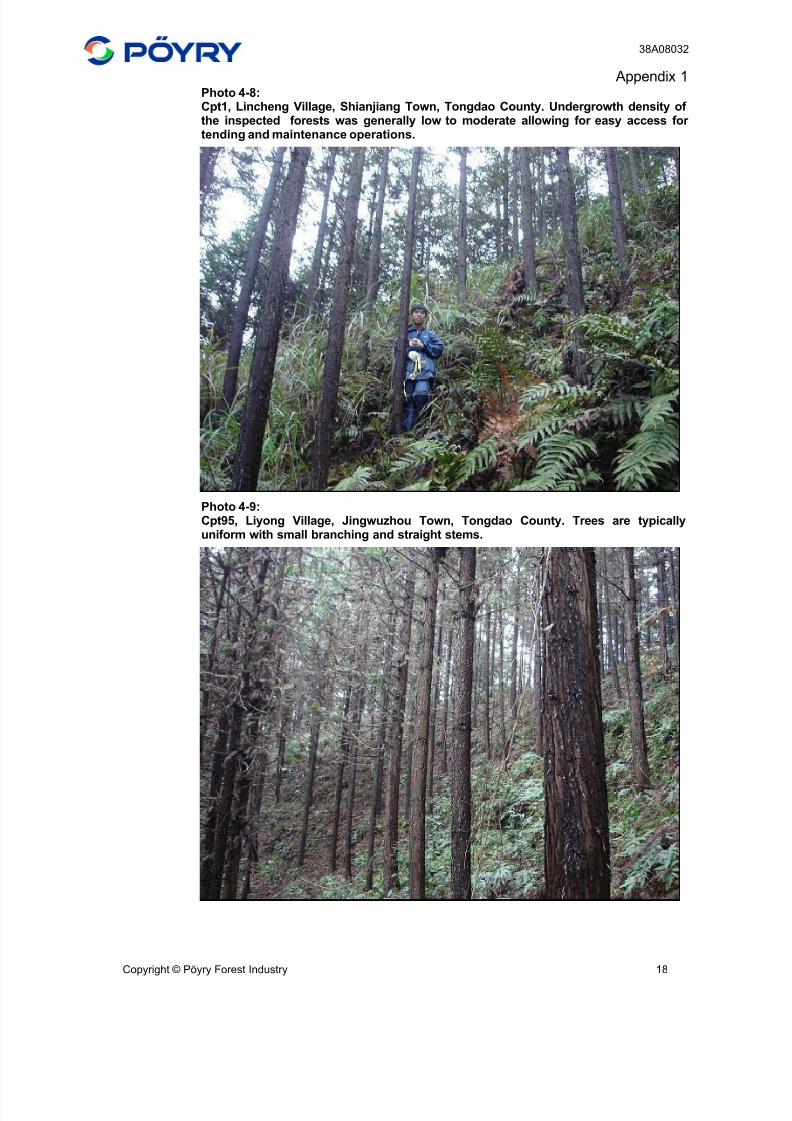
8/3/2019 Sino-Forest Poyry Valuation Dec 2006 Final
http://slidepdf.com/reader/full/sino-forest-poyry-valuation-dec-2006-final 95/122
38A08032
Appendix 1
Copyright © Pöyry Forest Industry 18
Photo 4-8:Cpt1, Lincheng Village, Shianjiang Town, Tongdao County. Undergrowth density of the inspected forests was generally low to moderate allowing for easy access for tending and maintenance operations.
Photo 4-9:Cpt95, Liyong Village, Jingwuzhou Town, Tongdao County. Trees are typicallyuniform with small branching and straight stems.
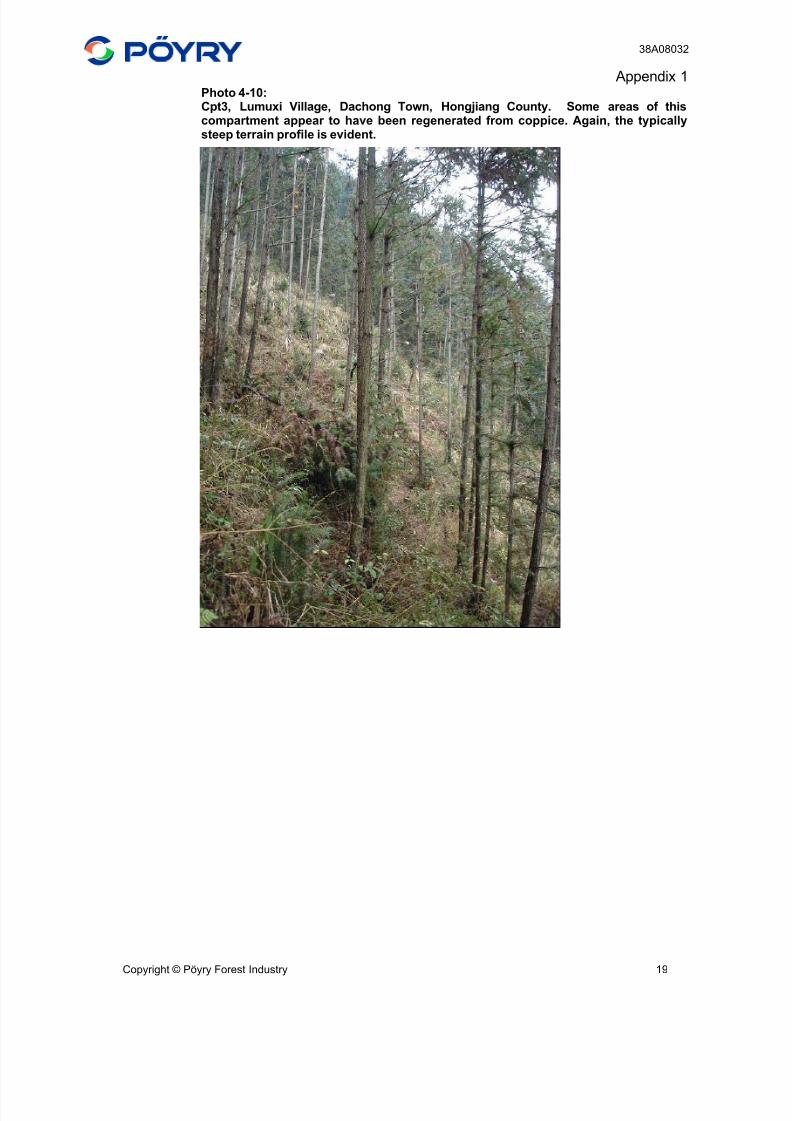
8/3/2019 Sino-Forest Poyry Valuation Dec 2006 Final
http://slidepdf.com/reader/full/sino-forest-poyry-valuation-dec-2006-final 96/122
38A08032
Appendix 1
Copyright © Pöyry Forest Industry 19
Photo 4-10:Cpt3, Lumuxi Village, Dachong Town, Hongjiang County. Some areas of thiscompartment appear to have been regenerated from coppice. Again, the typicallysteep terrain profile is evident.
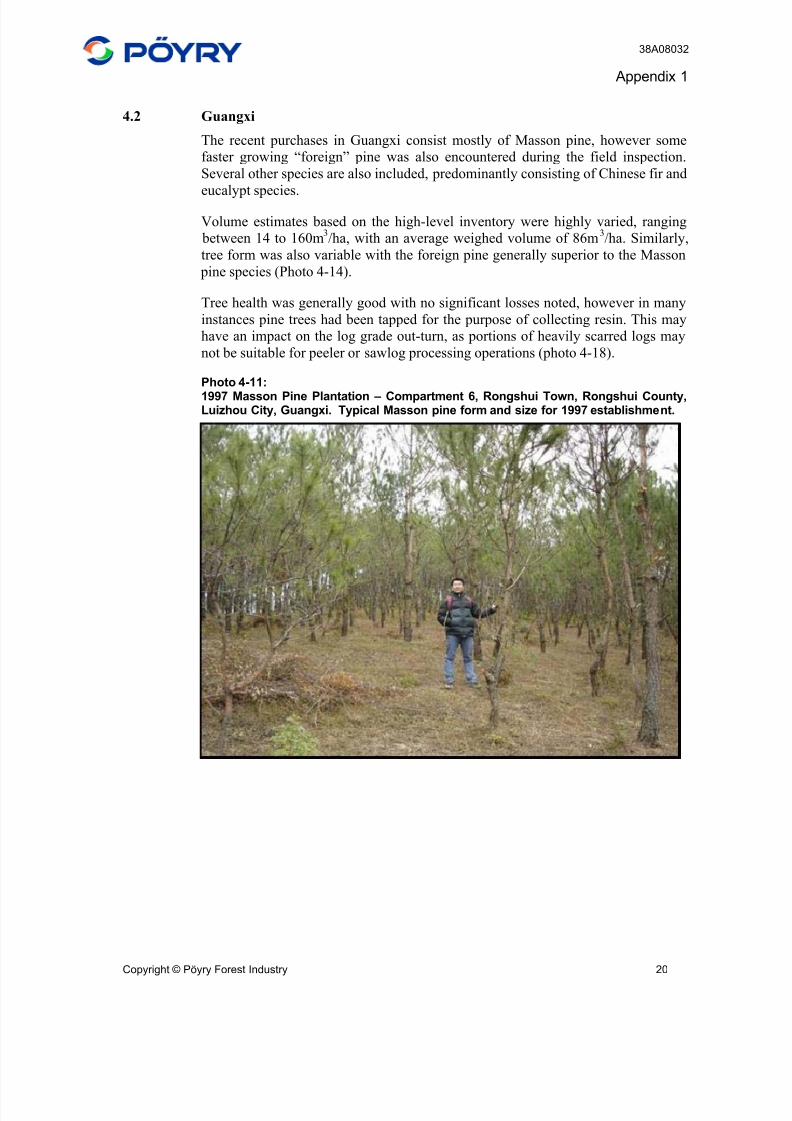
8/3/2019 Sino-Forest Poyry Valuation Dec 2006 Final
http://slidepdf.com/reader/full/sino-forest-poyry-valuation-dec-2006-final 97/122
38A08032
Appendix 1
Copyright © Pöyry Forest Industry 20
4.2 Guangxi
The recent purchases in Guangxi consist mostly of Masson pine, however some
faster growing “foreign” pine was also encountered during the field inspection.
Several other species are also included, predominantly consisting of Chinese fir and
eucalypt species.
Volume estimates based on the high-level inventory were highly varied, ranging
between 14 to 160m3/ha, with an average weighed volume of 86m
3/ha. Similarly,
tree form was also variable with the foreign pine generally superior to the Masson
pine species (Photo 4-14).
Tree health was generally good with no significant losses noted, however in many
instances pine trees had been tapped for the purpose of collecting resin. This may
have an impact on the log grade out-turn, as portions of heavily scarred logs may
not be suitable for peeler or sawlog processing operations (photo 4-18).
Photo 4-11:
1997 Masson Pine Plantation – Compartment 6, Rongshui Town, Rongshui County,Luizhou City, Guangxi. Typical Masson pine form and size for 1997 establishment.
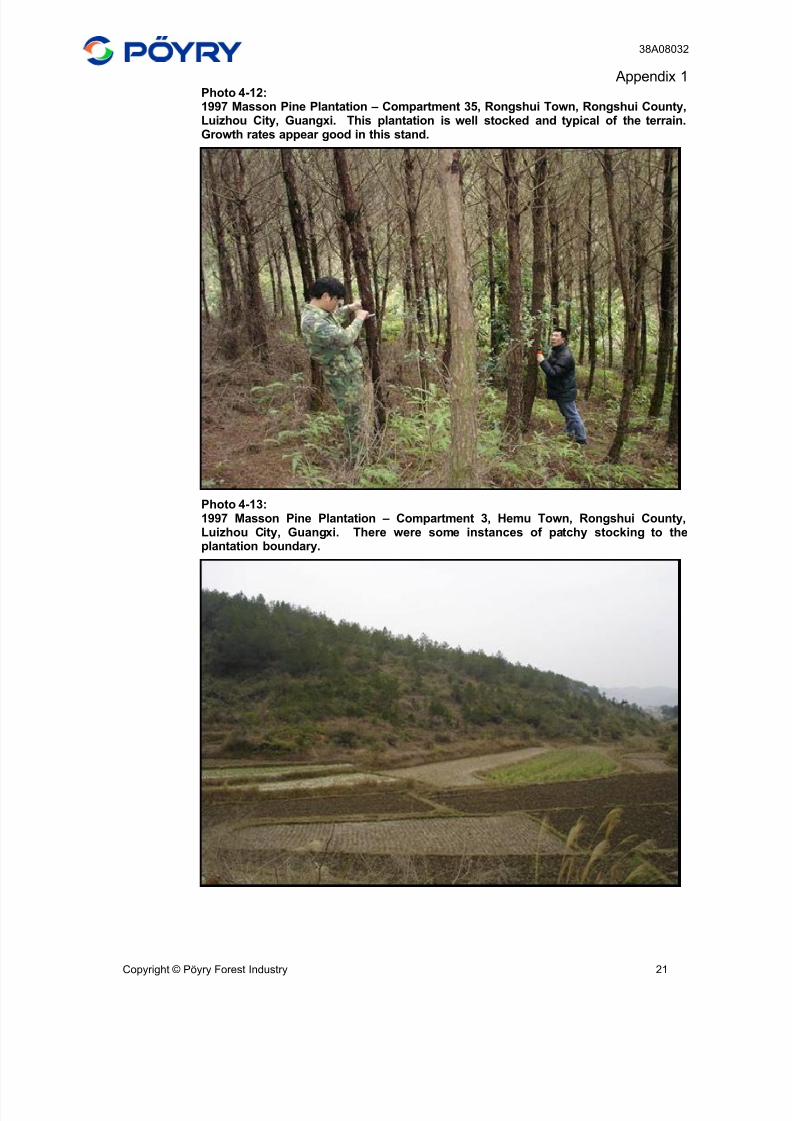
8/3/2019 Sino-Forest Poyry Valuation Dec 2006 Final
http://slidepdf.com/reader/full/sino-forest-poyry-valuation-dec-2006-final 98/122
38A08032
Appendix 1
Copyright © Pöyry Forest Industry 21
Photo 4-12:1997 Masson Pine Plantation – Compartment 35, Rongshui Town, Rongshui County,Luizhou City, Guangxi. This plantation is well stocked and typical of the terrain.Growth rates appear good in this stand.
Photo 4-13:1997 Masson Pine Plantation – Compartment 3, Hemu Town, Rongshui County,Luizhou City, Guangxi. There were some instances of patchy stocking to theplantation boundary.
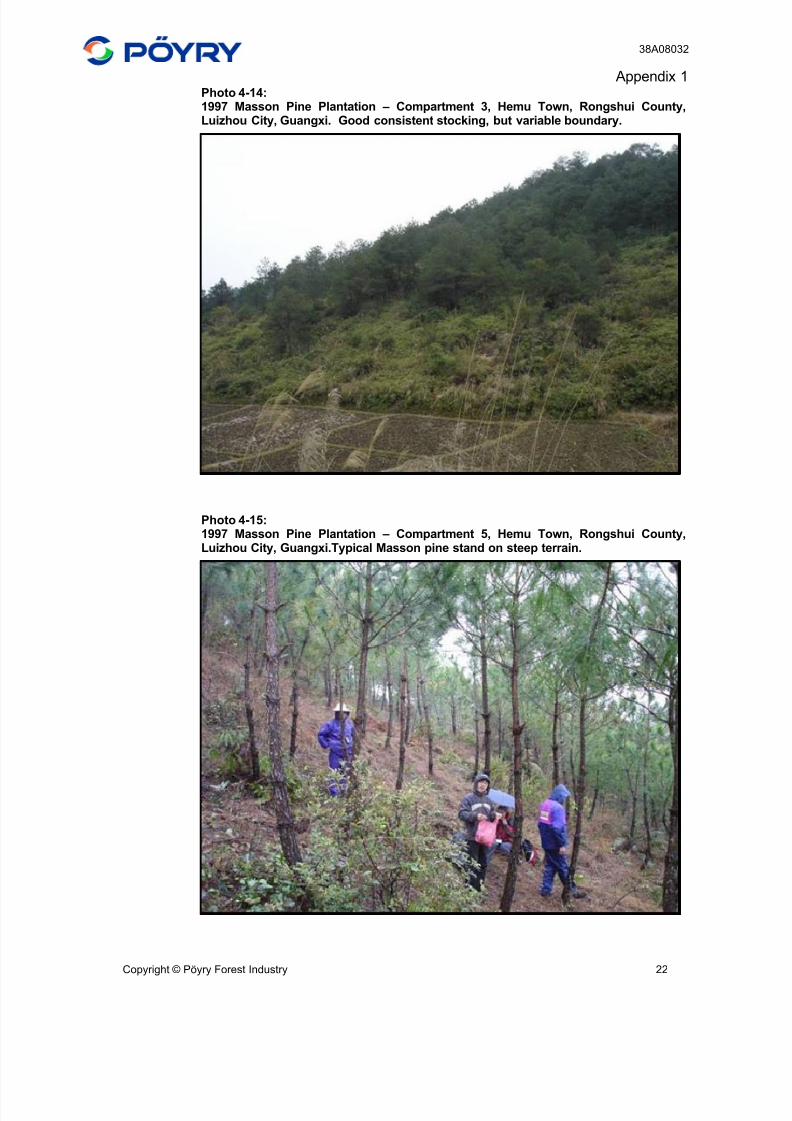
8/3/2019 Sino-Forest Poyry Valuation Dec 2006 Final
http://slidepdf.com/reader/full/sino-forest-poyry-valuation-dec-2006-final 99/122
38A08032
Appendix 1
Copyright © Pöyry Forest Industry 22
Photo 4-14:1997 Masson Pine Plantation – Compartment 3, Hemu Town, Rongshui County,Luizhou City, Guangxi. Good consistent stocking, but variable boundary.
Photo 4-15:1997 Masson Pine Plantation – Compartment 5, Hemu Town, Rongshui County,Luizhou City, Guangxi.Typical Masson pine stand on steep terrain.
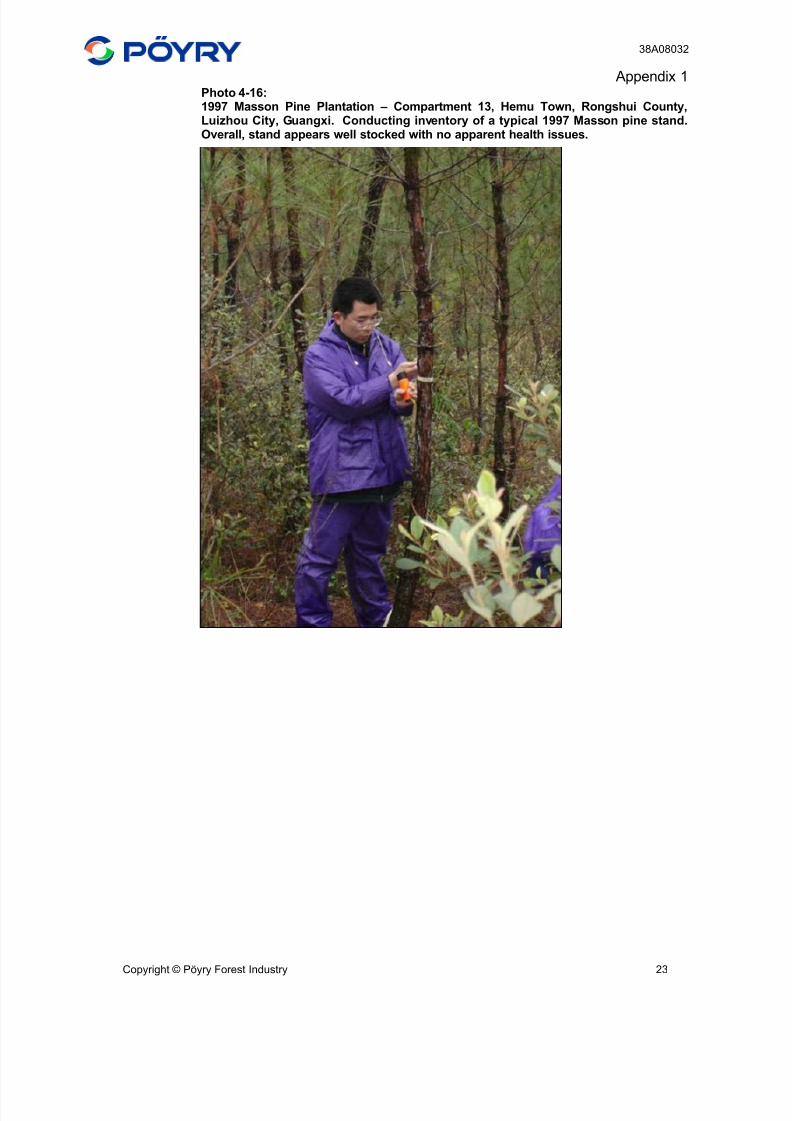
8/3/2019 Sino-Forest Poyry Valuation Dec 2006 Final
http://slidepdf.com/reader/full/sino-forest-poyry-valuation-dec-2006-final 100/122
38A08032
Appendix 1
Copyright © Pöyry Forest Industry 23
Photo 4-16:1997 Masson Pine Plantation – Compartment 13, Hemu Town, Rongshui County,Luizhou City, Guangxi. Conducting inventory of a typical 1997 Masson pine stand.Overall, stand appears well stocked with no apparent health issues.
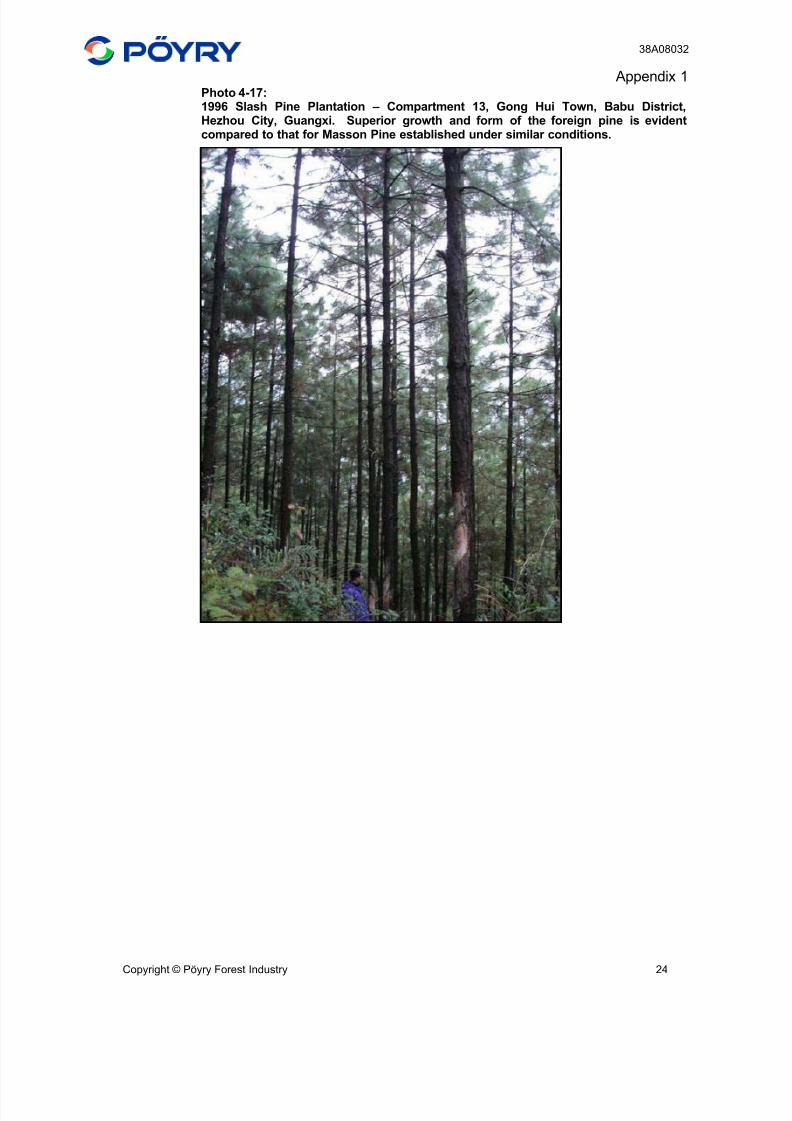
8/3/2019 Sino-Forest Poyry Valuation Dec 2006 Final
http://slidepdf.com/reader/full/sino-forest-poyry-valuation-dec-2006-final 101/122
38A08032
Appendix 1
Copyright © Pöyry Forest Industry 24
Photo 4-17:1996 Slash Pine Plantation – Compartment 13, Gong Hui Town, Babu District,Hezhou City, Guangxi. Superior growth and form of the foreign pine is evidentcompared to that for Masson Pine established under similar conditions.
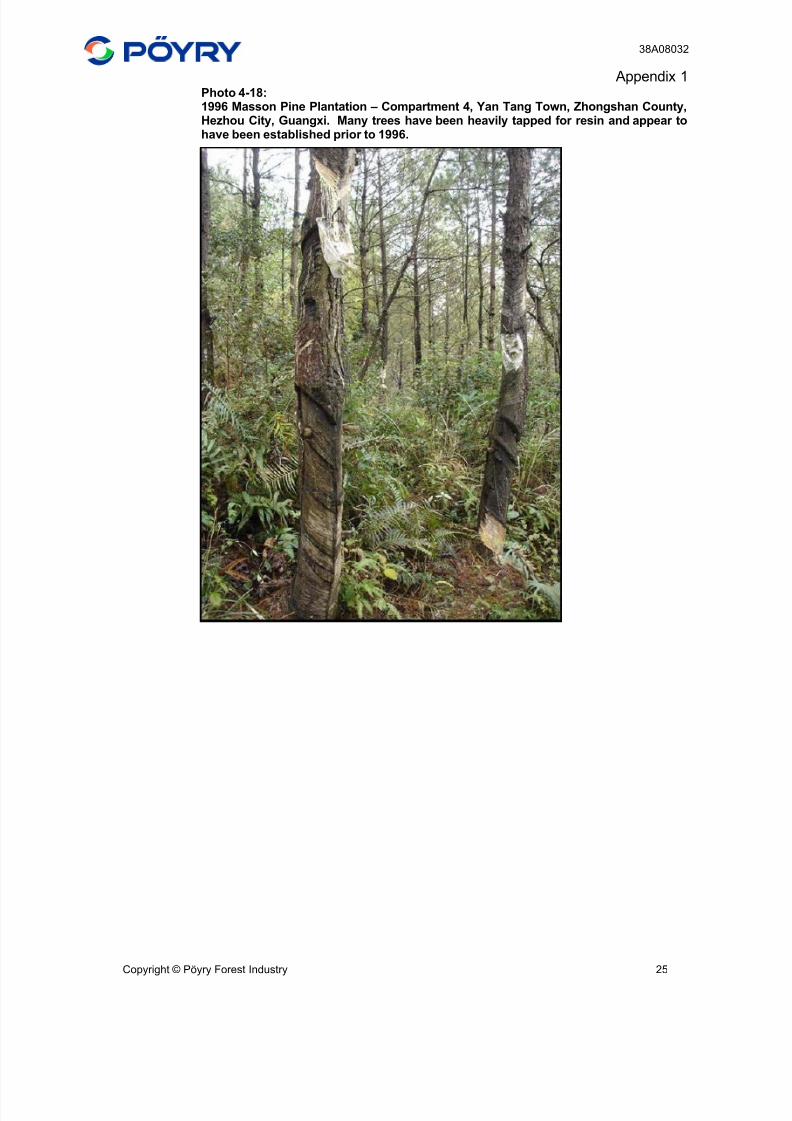
8/3/2019 Sino-Forest Poyry Valuation Dec 2006 Final
http://slidepdf.com/reader/full/sino-forest-poyry-valuation-dec-2006-final 102/122
38A08032
Appendix 1
Copyright © Pöyry Forest Industry 25
Photo 4-18:1996 Masson Pine Plantation – Compartment 4, Yan Tang Town, Zhongshan County,Hezhou City, Guangxi. Many trees have been heavily tapped for resin and appear tohave been established prior to 1996.
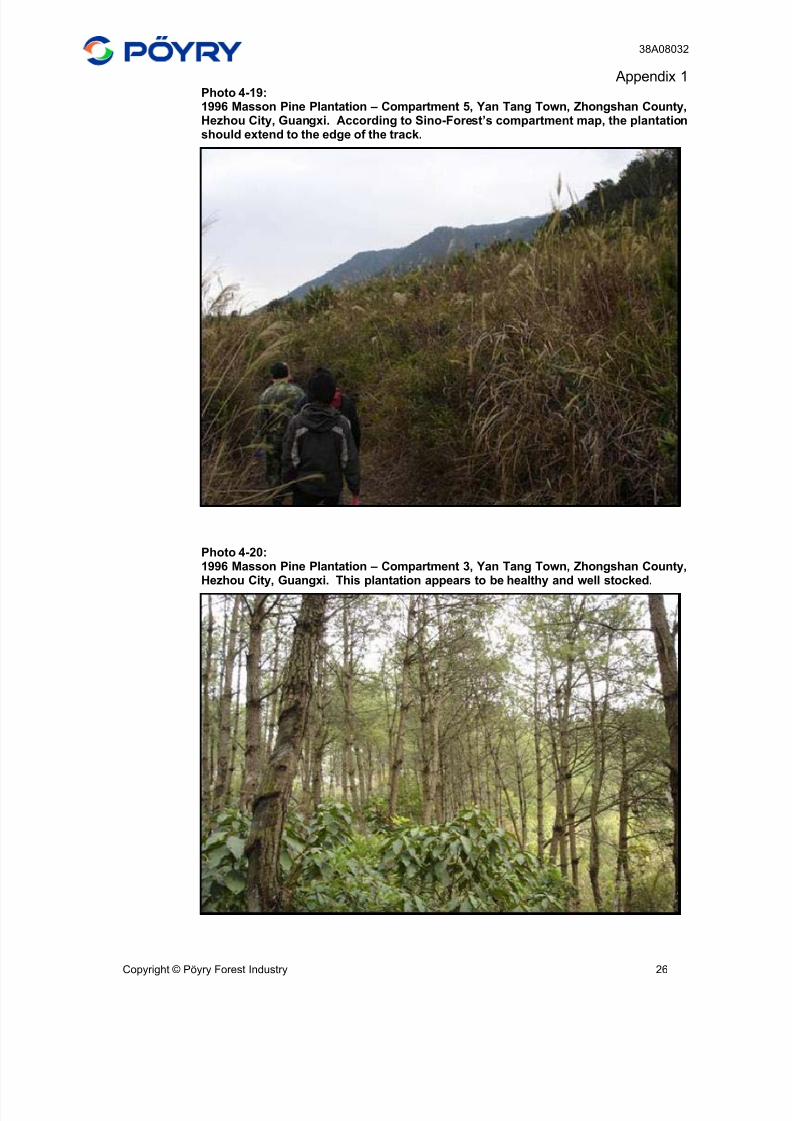
8/3/2019 Sino-Forest Poyry Valuation Dec 2006 Final
http://slidepdf.com/reader/full/sino-forest-poyry-valuation-dec-2006-final 103/122
38A08032
Appendix 1
Copyright © Pöyry Forest Industry 26
Photo 4-19:1996 Masson Pine Plantation – Compartment 5, Yan Tang Town, Zhongshan County,Hezhou City, Guangxi. According to Sino-Forest’s compartment map, the plantationshould extend to the edge of the track.
Photo 4-20:1996 Masson Pine Plantation – Compartment 3, Yan Tang Town, Zhongshan County,Hezhou City, Guangxi. This plantation appears to be healthy and well stocked.
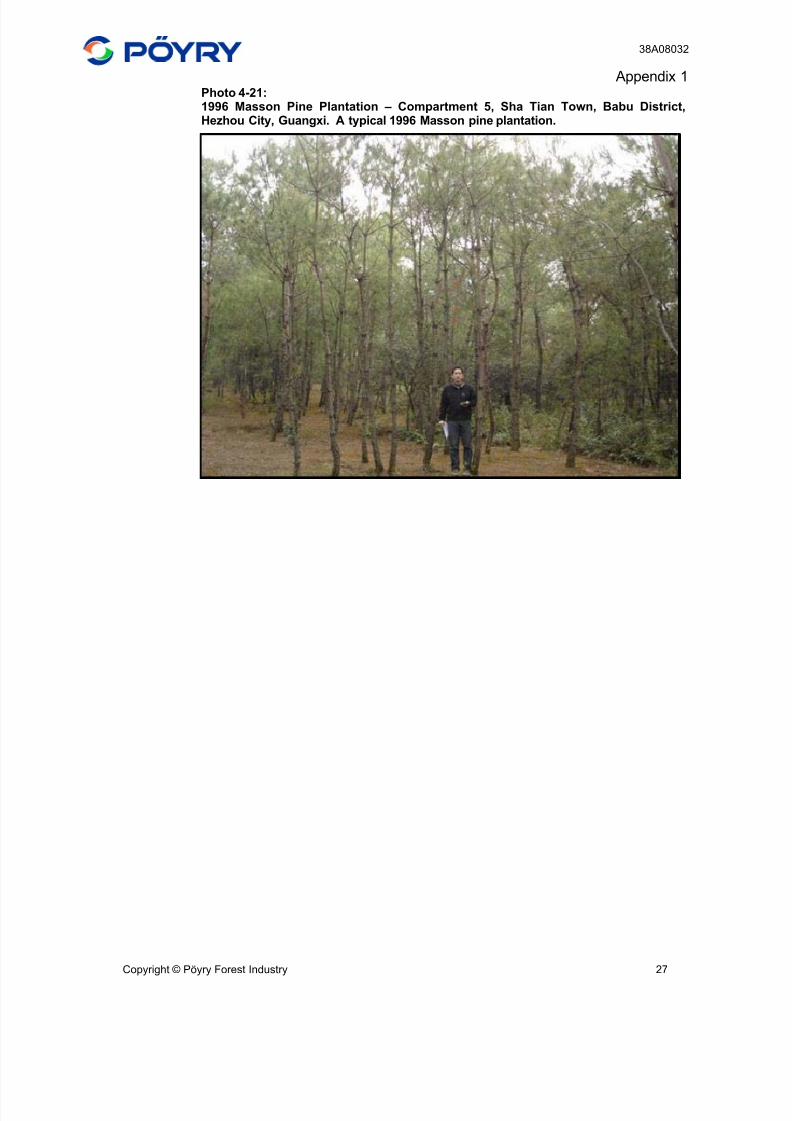
8/3/2019 Sino-Forest Poyry Valuation Dec 2006 Final
http://slidepdf.com/reader/full/sino-forest-poyry-valuation-dec-2006-final 104/122
38A08032
Appendix 1
Copyright © Pöyry Forest Industry 27
Photo 4-21:1996 Masson Pine Plantation – Compartment 5, Sha Tian Town, Babu District,Hezhou City, Guangxi. A typical 1996 Masson pine plantation.

8/3/2019 Sino-Forest Poyry Valuation Dec 2006 Final
http://slidepdf.com/reader/full/sino-forest-poyry-valuation-dec-2006-final 105/122
APPENDIX 2
China Market Overview
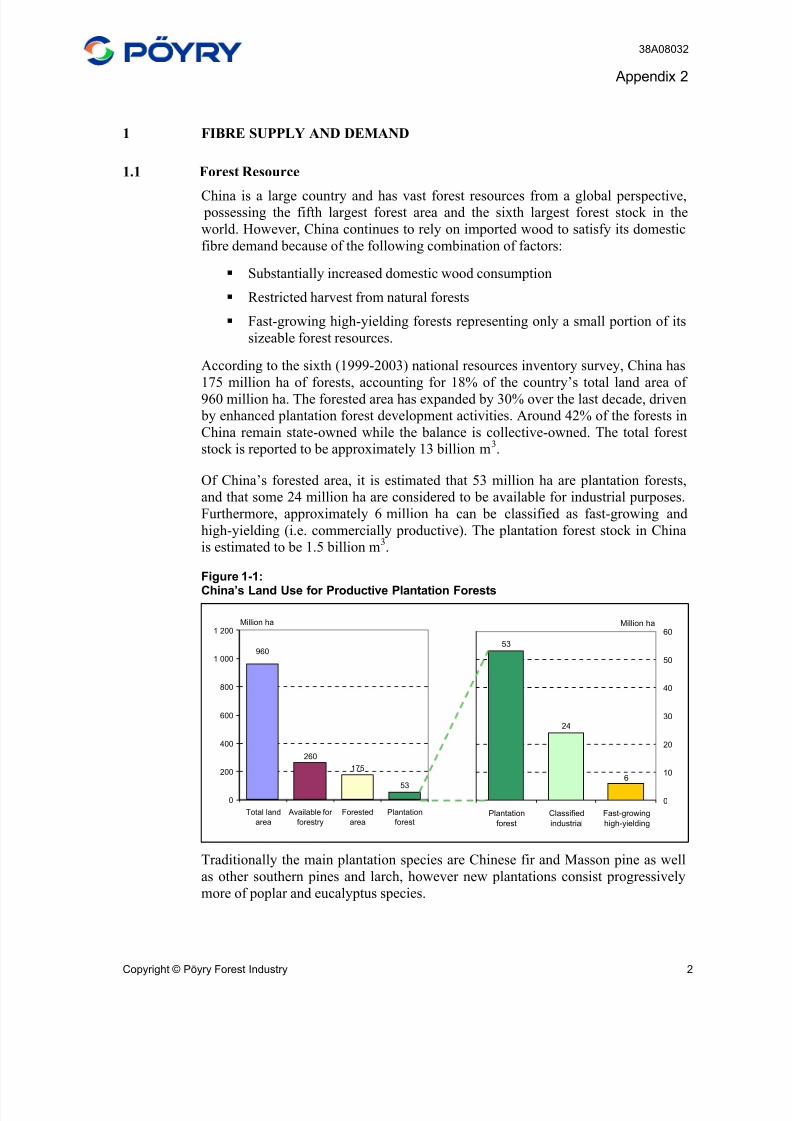
8/3/2019 Sino-Forest Poyry Valuation Dec 2006 Final
http://slidepdf.com/reader/full/sino-forest-poyry-valuation-dec-2006-final 106/122
38A08032
Appendix 2
Copyright © Pöyry Forest Industry 2
1 FIBRE SUPPLY AND DEMAND
1.1 Forest Resource
China is a large country and has vast forest resources from a global perspective, possessing the fifth largest forest area and the sixth largest forest stock in the
world. However, China continues to rely on imported wood to satisfy its domestic
fibre demand because of the following combination of factors:
Substantially increased domestic wood consumption
Restricted harvest from natural forests
Fast-growing high-yielding forests representing only a small portion of its
sizeable forest resources.
According to the sixth (1999-2003) national resources inventory survey, China has
175 million ha of forests, accounting for 18% of the country’s total land area of
960 million ha. The forested area has expanded by 30% over the last decade, driven
by enhanced plantation forest development activities. Around 42% of the forests in
China remain state-owned while the balance is collective-owned. The total forest
stock is reported to be approximately 13 billion m3.
Of China’s forested area, it is estimated that 53 million ha are plantation forests,
and that some 24 million ha are considered to be available for industrial purposes.
Furthermore, approximately 6 million ha can be classified as fast-growing and
high-yielding (i.e. commercially productive). The plantation forest stock in China
is estimated to be 1.5 billion m3.
Figure 1-1:
China’s Land Use for Productive Plantation Forests
Million ha
260
175
53
960
0
200
400
600
800
1 000
1 200
Total land
area
Available for
forestry
Forested
area
Plantation
forest
Million ha
53
24
6
0
10
20
30
40
50
60
Plantation
forest
Classified
industrial
Fast-growing
high-yielding
Traditionally the main plantation species are Chinese fir and Masson pine as well
as other southern pines and larch, however new plantations consist progressively
more of poplar and eucalyptus species.
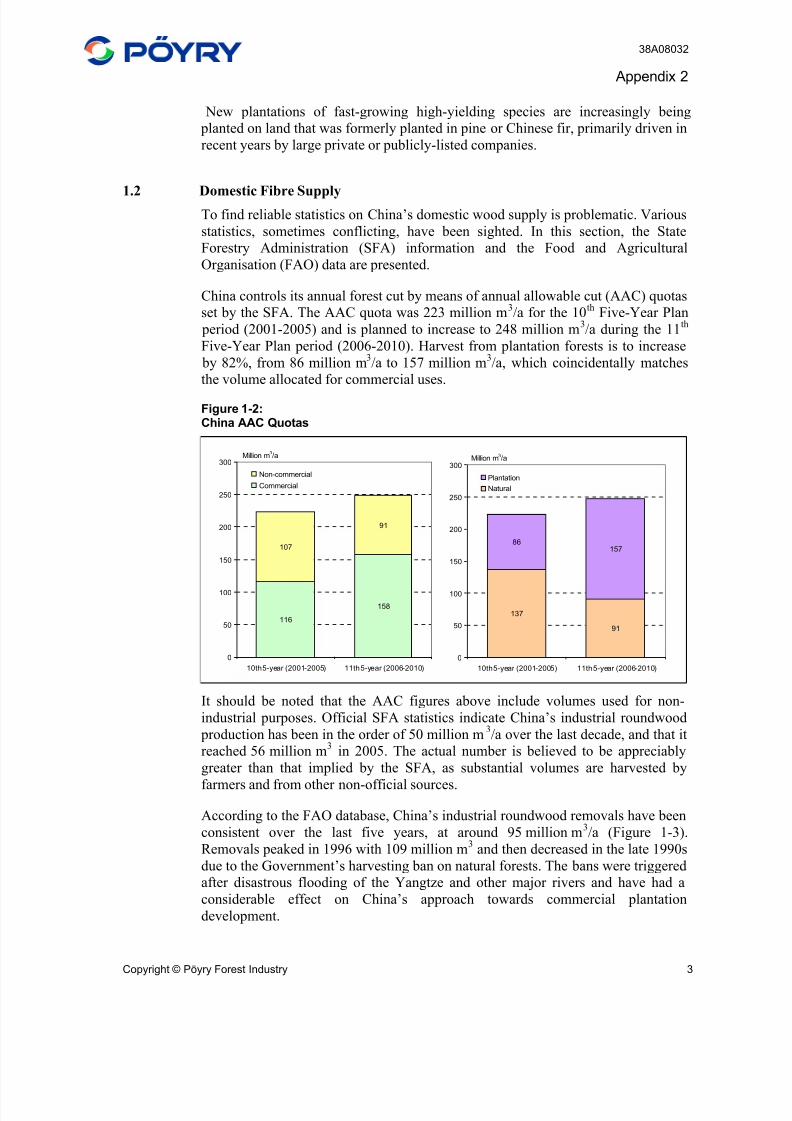
8/3/2019 Sino-Forest Poyry Valuation Dec 2006 Final
http://slidepdf.com/reader/full/sino-forest-poyry-valuation-dec-2006-final 107/122
38A08032
Appendix 2
Copyright © Pöyry Forest Industry 3
New plantations of fast-growing high-yielding species are increasingly being
planted on land that was formerly planted in pine or Chinese fir, primarily driven in
recent years by large private or publicly-listed companies.
1.2 Domestic Fibre SupplyTo find reliable statistics on China’s domestic wood supply is problematic. Various
statistics, sometimes conflicting, have been sighted. In this section, the State
Forestry Administration (SFA) information and the Food and Agricultural
Organisation (FAO) data are presented.
China controls its annual forest cut by means of annual allowable cut (AAC) quotas
set by the SFA. The AAC quota was 223 million m3/a for the 10th Five-Year Plan
period (2001-2005) and is planned to increase to 248 million m3/a during the 11
th
Five-Year Plan period (2006-2010). Harvest from plantation forests is to increase
by 82%, from 86 million m3/a to 157 million m
3/a, which coincidentally matches
the volume allocated for commercial uses.
Figure 1-2:China AAC Quotas
Million m3/a
116
158
107
91
0
50
100
150
200
250
300
10th 5-year (2001-2005) 11th 5-year (2006-2010)
Non-commercial
Commercial
Million m3/a
137
91
86157
0
50
100
150
200
250
300
10th 5-year (2001-2005) 11th 5-year (2006-2010)
Plantation
Natural
It should be noted that the AAC figures above include volumes used for non-
industrial purposes. Official SFA statistics indicate China’s industrial roundwood
production has been in the order of 50 million m3/a over the last decade, and that it
reached 56 million m3
in 2005. The actual number is believed to be appreciably
greater than that implied by the SFA, as substantial volumes are harvested by
farmers and from other non-official sources.
According to the FAO database, China’s industrial roundwood removals have been
consistent over the last five years, at around 95 million m3/a (Figure 1-3).
Removals peaked in 1996 with 109 million m3
and then decreased in the late 1990s
due to the Government’s harvesting ban on natural forests. The bans were triggered
after disastrous flooding of the Yangtze and other major rivers and have had a
considerable effect on China’s approach towards commercial plantation
development.
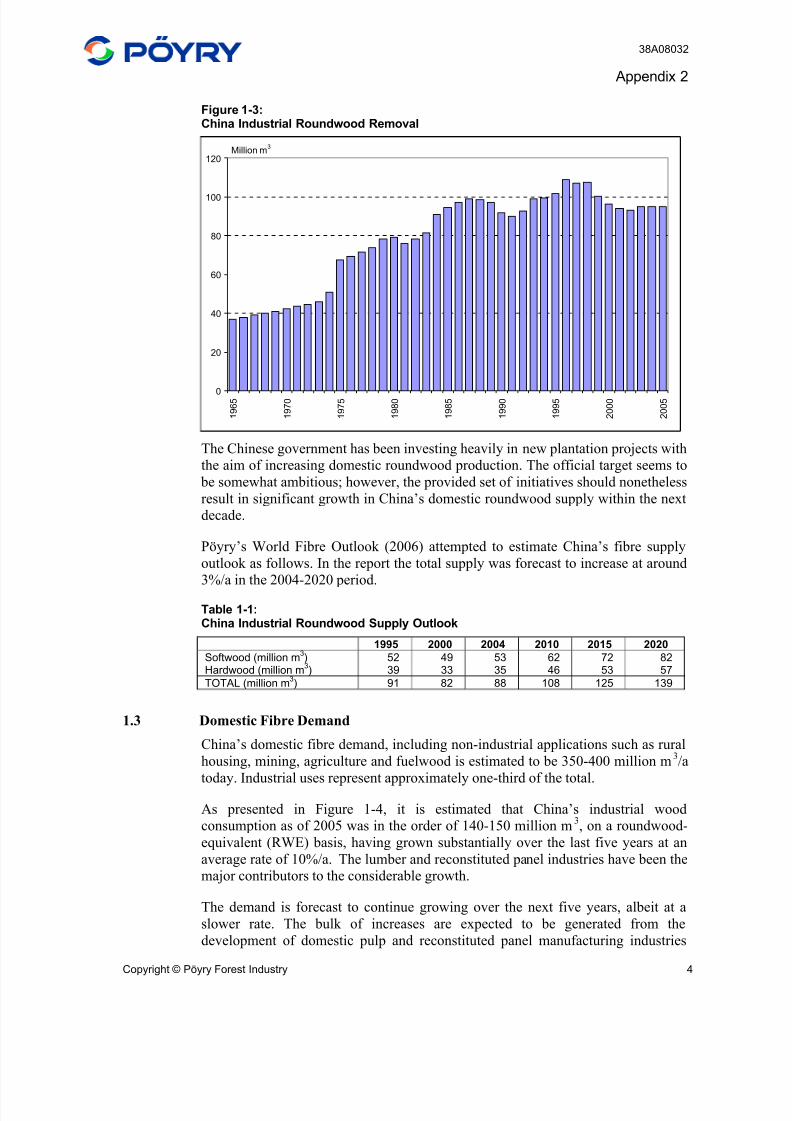
8/3/2019 Sino-Forest Poyry Valuation Dec 2006 Final
http://slidepdf.com/reader/full/sino-forest-poyry-valuation-dec-2006-final 108/122
38A08032
Appendix 2
Copyright © Pöyry Forest Industry 4
Figure 1-3:China Industrial Roundwood Removal
Million m3
0
20
40
60
80
100
120
1 9 6 5
1 9 7 0
1 9 7 5
1 9 8 0
1 9 8 5
1 9 9 0
1 9 9 5
2 0 0 0
2 0 0 5
The Chinese government has been investing heavily in new plantation projects with
the aim of increasing domestic roundwood production. The official target seems to
be somewhat ambitious; however, the provided set of initiatives should nonetheless
result in significant growth in China’s domestic roundwood supply within the next
decade.
Pöyry’s World Fibre Outlook (2006) attempted to estimate China’s fibre supply
outlook as follows. In the report the total supply was forecast to increase at around
3%/a in the 2004-2020 period.
Table 1-1:China Industrial Roundwood Supply Outlook
1995 2000 2004 2010 2015 2020
Softwood (million m3) 52 49 53 62 72 82
Hardwood (million m3) 39 33 35 46 53 57
TOTAL (million m3) 91 82 88 108 125 139
1.3 Domestic Fibre Demand
China’s domestic fibre demand, including non-industrial applications such as rural
housing, mining, agriculture and fuelwood is estimated to be 350-400 million m3/a
today. Industrial uses represent approximately one-third of the total.
As presented in Figure 1-4, it is estimated that China’s industrial wood
consumption as of 2005 was in the order of 140-150 million m3, on a roundwood-
equivalent (RWE) basis, having grown substantially over the last five years at an
average rate of 10%/a. The lumber and reconstituted panel industries have been the
major contributors to the considerable growth.
The demand is forecast to continue growing over the next five years, albeit at a
slower rate. The bulk of increases are expected to be generated from the
development of domestic pulp and reconstituted panel manufacturing industries
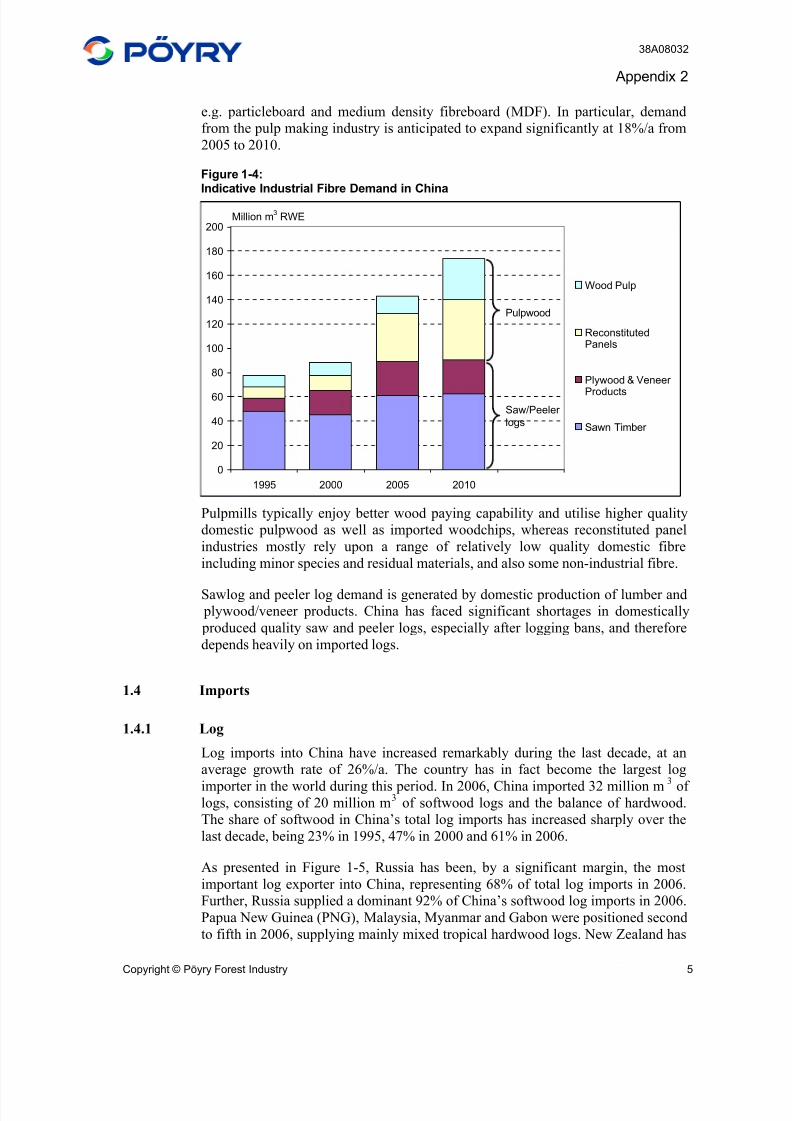
8/3/2019 Sino-Forest Poyry Valuation Dec 2006 Final
http://slidepdf.com/reader/full/sino-forest-poyry-valuation-dec-2006-final 109/122
38A08032
Appendix 2
Copyright © Pöyry Forest Industry 5
e.g. particleboard and medium density fibreboard (MDF). In particular, demand
from the pulp making industry is anticipated to expand significantly at 18%/a from
2005 to 2010.
Figure 1-4:Indicative Industrial Fibre Demand in China
Million m3
RWE
0
20
40
60
80
100
120
140
160
180
200
1995 2000 2005 2010
Wood Pulp
ReconstitutedPanels
Plywood & Veneer
Products
Sawn Timber
Pulpwood
Saw/Peeler
logs
Pulpmills typically enjoy better wood paying capability and utilise higher quality
domestic pulpwood as well as imported woodchips, whereas reconstituted panel
industries mostly rely upon a range of relatively low quality domestic fibre
including minor species and residual materials, and also some non-industrial fibre.
Sawlog and peeler log demand is generated by domestic production of lumber and plywood/veneer products. China has faced significant shortages in domestically
produced quality saw and peeler logs, especially after logging bans, and therefore
depends heavily on imported logs.
1.4 Imports
1.4.1 Log
Log imports into China have increased remarkably during the last decade, at an
average growth rate of 26%/a. The country has in fact become the largest log
importer in the world during this period. In 2006, China imported 32 million m3 of logs, consisting of 20 million m
3of softwood logs and the balance of hardwood.
The share of softwood in China’s total log imports has increased sharply over the
last decade, being 23% in 1995, 47% in 2000 and 61% in 2006.
As presented in Figure 1-5, Russia has been, by a significant margin, the most
important log exporter into China, representing 68% of total log imports in 2006.
Further, Russia supplied a dominant 92% of China’s softwood log imports in 2006.
Papua New Guinea (PNG), Malaysia, Myanmar and Gabon were positioned second
to fifth in 2006, supplying mainly mixed tropical hardwood logs. New Zealand has
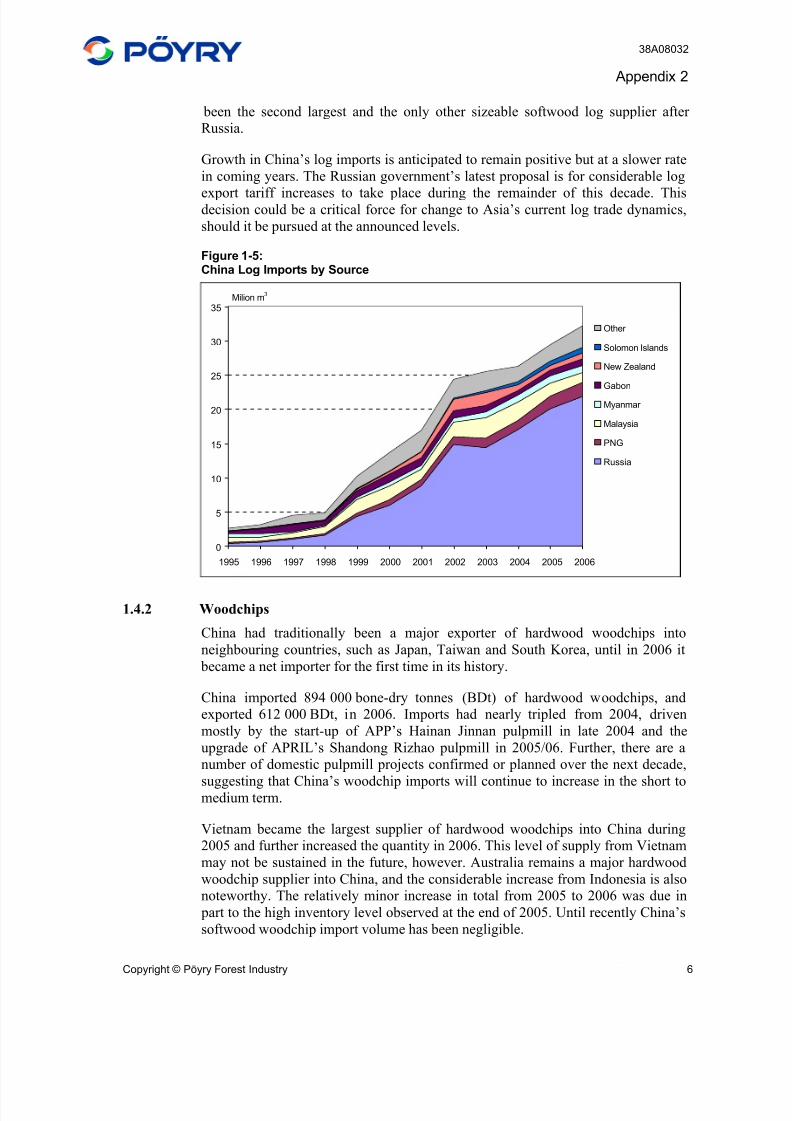
8/3/2019 Sino-Forest Poyry Valuation Dec 2006 Final
http://slidepdf.com/reader/full/sino-forest-poyry-valuation-dec-2006-final 110/122
38A08032
Appendix 2
Copyright © Pöyry Forest Industry 6
been the second largest and the only other sizeable softwood log supplier after
Russia.
Growth in China’s log imports is anticipated to remain positive but at a slower rate
in coming years. The Russian government’s latest proposal is for considerable log
export tariff increases to take place during the remainder of this decade. Thisdecision could be a critical force for change to Asia’s current log trade dynamics,
should it be pursued at the announced levels.
Figure 1-5:China Log Imports by Source
Milion m3
0
5
10
15
20
25
30
35
1995 1996 1997 1998 1999 2000 2001 2002 2003 2004 2005 2006
Other
Solomon Islands
New Zealand
Gabon
Myanmar
Malaysia
PNG
Russia
1.4.2 Woodchips
China had traditionally been a major exporter of hardwood woodchips into
neighbouring countries, such as Japan, Taiwan and South Korea, until in 2006 it
became a net importer for the first time in its history.
China imported 894 000 bone-dry tonnes (BDt) of hardwood woodchips, and
exported 612 000 BDt, in 2006. Imports had nearly tripled from 2004, driven
mostly by the start-up of APP’s Hainan Jinnan pulpmill in late 2004 and the
upgrade of APRIL’s Shandong Rizhao pulpmill in 2005/06. Further, there are a
number of domestic pulpmill projects confirmed or planned over the next decade,
suggesting that China’s woodchip imports will continue to increase in the short tomedium term.
Vietnam became the largest supplier of hardwood woodchips into China during
2005 and further increased the quantity in 2006. This level of supply from Vietnam
may not be sustained in the future, however. Australia remains a major hardwood
woodchip supplier into China, and the considerable increase from Indonesia is also
noteworthy. The relatively minor increase in total from 2005 to 2006 was due in
part to the high inventory level observed at the end of 2005. Until recently China’s
softwood woodchip import volume has been negligible.
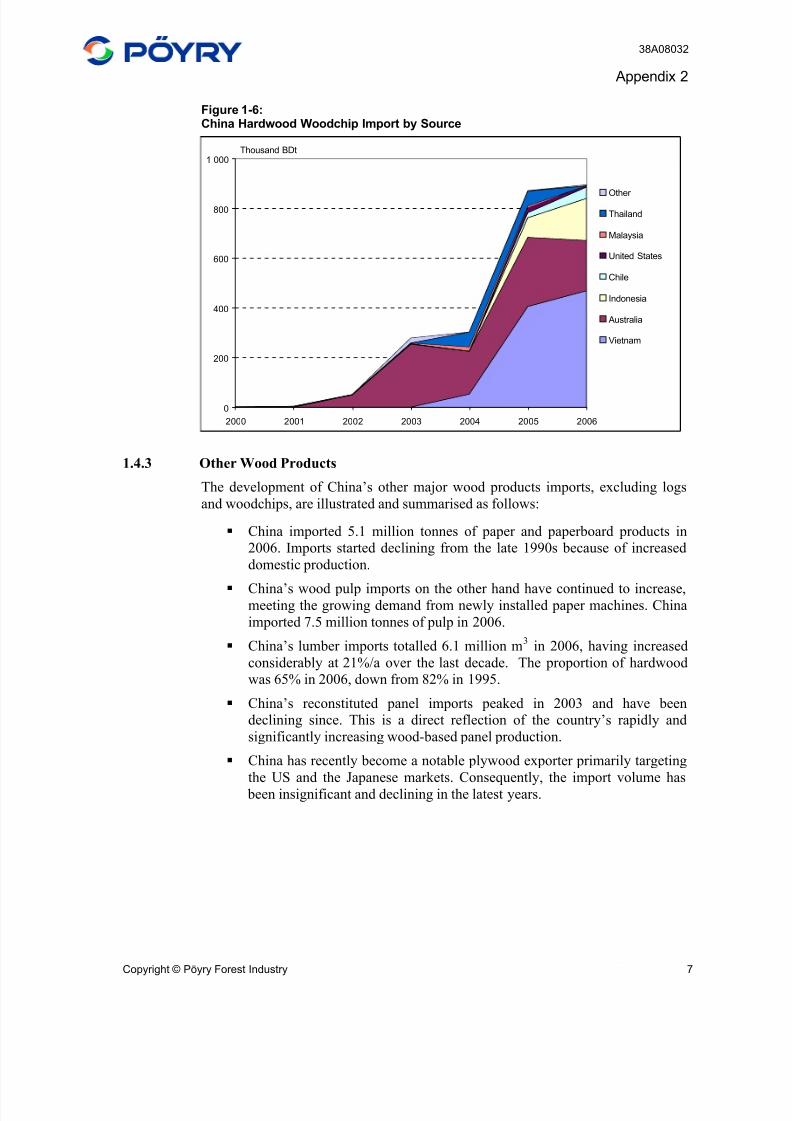
8/3/2019 Sino-Forest Poyry Valuation Dec 2006 Final
http://slidepdf.com/reader/full/sino-forest-poyry-valuation-dec-2006-final 111/122
38A08032
Appendix 2
Copyright © Pöyry Forest Industry 7
Figure 1-6:China Hardwood Woodchip Import by Source
Thousand BDt
0
200
400
600
800
1 000
2000 2001 2002 2003 2004 2005 2006
Other
Thailand
Malaysia
United States
Chile
Indonesia
Australia
Vietnam
1.4.3 Other Wood Products
The development of China’s other major wood products imports, excluding logs
and woodchips, are illustrated and summarised as follows:
China imported 5.1 million tonnes of paper and paperboard products in
2006. Imports started declining from the late 1990s because of increased
domestic production.
China’s wood pulp imports on the other hand have continued to increase,meeting the growing demand from newly installed paper machines. China
imported 7.5 million tonnes of pulp in 2006.
China’s lumber imports totalled 6.1 million m3
in 2006, having increased
considerably at 21%/a over the last decade. The proportion of hardwood
was 65% in 2006, down from 82% in 1995.
China’s reconstituted panel imports peaked in 2003 and have been
declining since. This is a direct reflection of the country’s rapidly and
significantly increasing wood-based panel production.
China has recently become a notable plywood exporter primarily targeting
the US and the Japanese markets. Consequently, the import volume has
been insignificant and declining in the latest years.
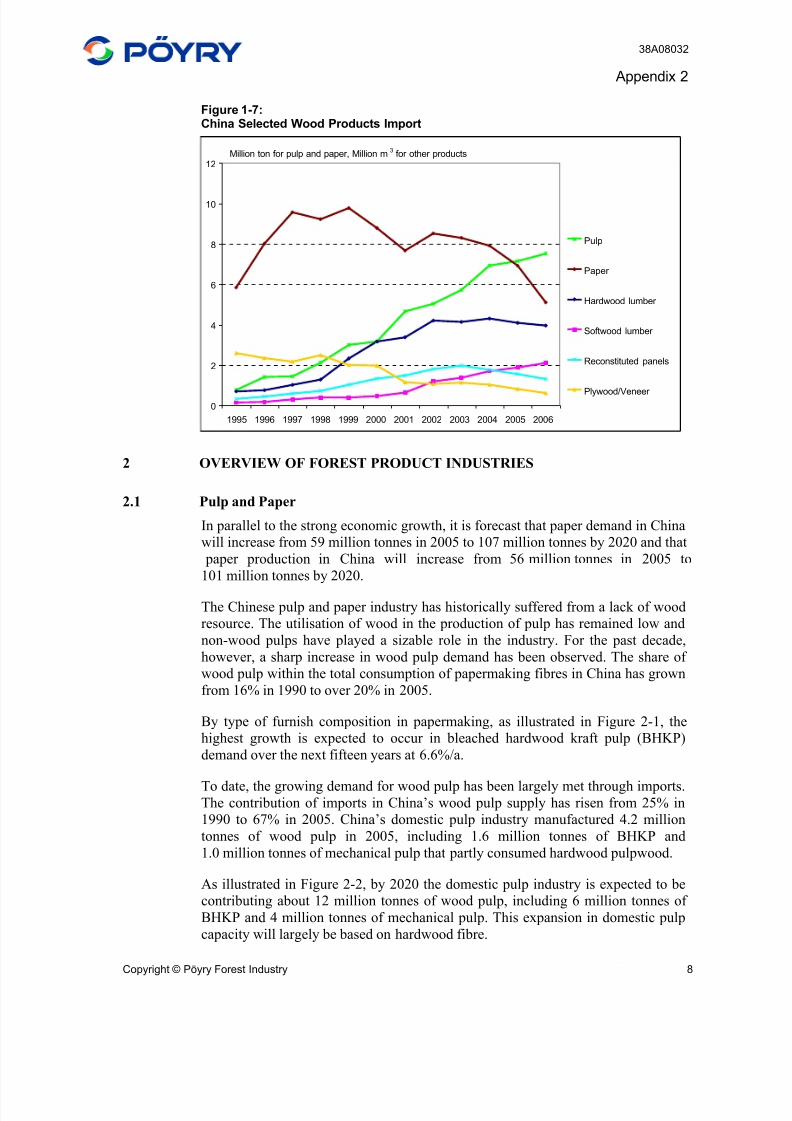
8/3/2019 Sino-Forest Poyry Valuation Dec 2006 Final
http://slidepdf.com/reader/full/sino-forest-poyry-valuation-dec-2006-final 112/122
38A08032
Appendix 2
Copyright © Pöyry Forest Industry 8
Figure 1-7:China Selected Wood Products Import
Million ton for pulp and paper, Million m3
for other products
0
2
4
6
8
10
12
1995 1996 1997 1998 1999 2000 2001 2002 2003 2004 2005 2006
Pulp
Paper
Hardwood lumber
Softwood lumber
Reconstituted panels
Plywood/Veneer
2 OVERVIEW OF FOREST PRODUCT INDUSTRIES
2.1 Pulp and Paper
In parallel to the strong economic growth, it is forecast that paper demand in China
will increase from 59 million tonnes in 2005 to 107 million tonnes by 2020 and that
paper production in China will increase from 56 million tonnes in 2005 to
101 million tonnes by 2020.
The Chinese pulp and paper industry has historically suffered from a lack of wood
resource. The utilisation of wood in the production of pulp has remained low and
non-wood pulps have played a sizable role in the industry. For the past decade,
however, a sharp increase in wood pulp demand has been observed. The share of
wood pulp within the total consumption of papermaking fibres in China has grown
from 16% in 1990 to over 20% in 2005.
By type of furnish composition in papermaking, as illustrated in Figure 2-1, the
highest growth is expected to occur in bleached hardwood kraft pulp (BHKP)
demand over the next fifteen years at 6.6%/a.
To date, the growing demand for wood pulp has been largely met through imports.The contribution of imports in China’s wood pulp supply has risen from 25% in
1990 to 67% in 2005. China’s domestic pulp industry manufactured 4.2 million
tonnes of wood pulp in 2005, including 1.6 million tonnes of BHKP and
1.0 million tonnes of mechanical pulp that partly consumed hardwood pulpwood.
As illustrated in Figure 2-2, by 2020 the domestic pulp industry is expected to be
contributing about 12 million tonnes of wood pulp, including 6 million tonnes of
BHKP and 4 million tonnes of mechanical pulp. This expansion in domestic pulp
capacity will largely be based on hardwood fibre.
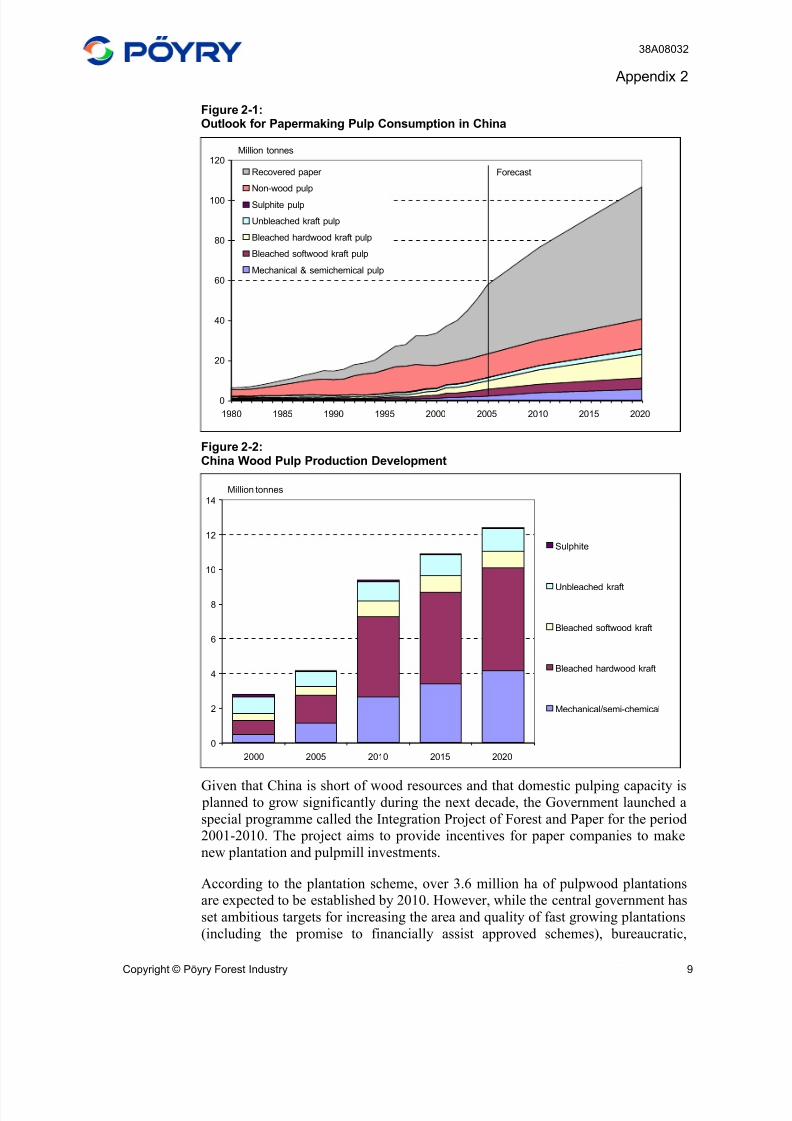
8/3/2019 Sino-Forest Poyry Valuation Dec 2006 Final
http://slidepdf.com/reader/full/sino-forest-poyry-valuation-dec-2006-final 113/122
38A08032
Appendix 2
Copyright © Pöyry Forest Industry 9
Figure 2-1:Outlook for Papermaking Pulp Consumption in China
Million tonnes
0
20
40
60
80
100
120
1980 1985 1990 1995 2000 2005 2010 2015 2020
Recovered paper
Non-wood pulp
Sulphite pulp
Unbleached kraft pulp
Bleached hardwood kraft pulp
Bleached softwood kraft pulp
Mechanical & semichemical pulp
Forecast
Figure 2-2:China Wood Pulp Production Development
Million tonnes
0
2
4
6
8
10
12
14
2000 2005 2010 2015 2020
Sulphite
Unbleached kraft
Bleached softwood kraft
Bleached hardwood kraft
Mechanical/semi-chemical
Given that China is short of wood resources and that domestic pulping capacity is planned to grow significantly during the next decade, the Government launched a
special programme called the Integration Project of Forest and Paper for the period
2001-2010. The project aims to provide incentives for paper companies to make
new plantation and pulpmill investments.
According to the plantation scheme, over 3.6 million ha of pulpwood plantations
are expected to be established by 2010. However, while the central government has
set ambitious targets for increasing the area and quality of fast growing plantations
(including the promise to financially assist approved schemes), bureaucratic,
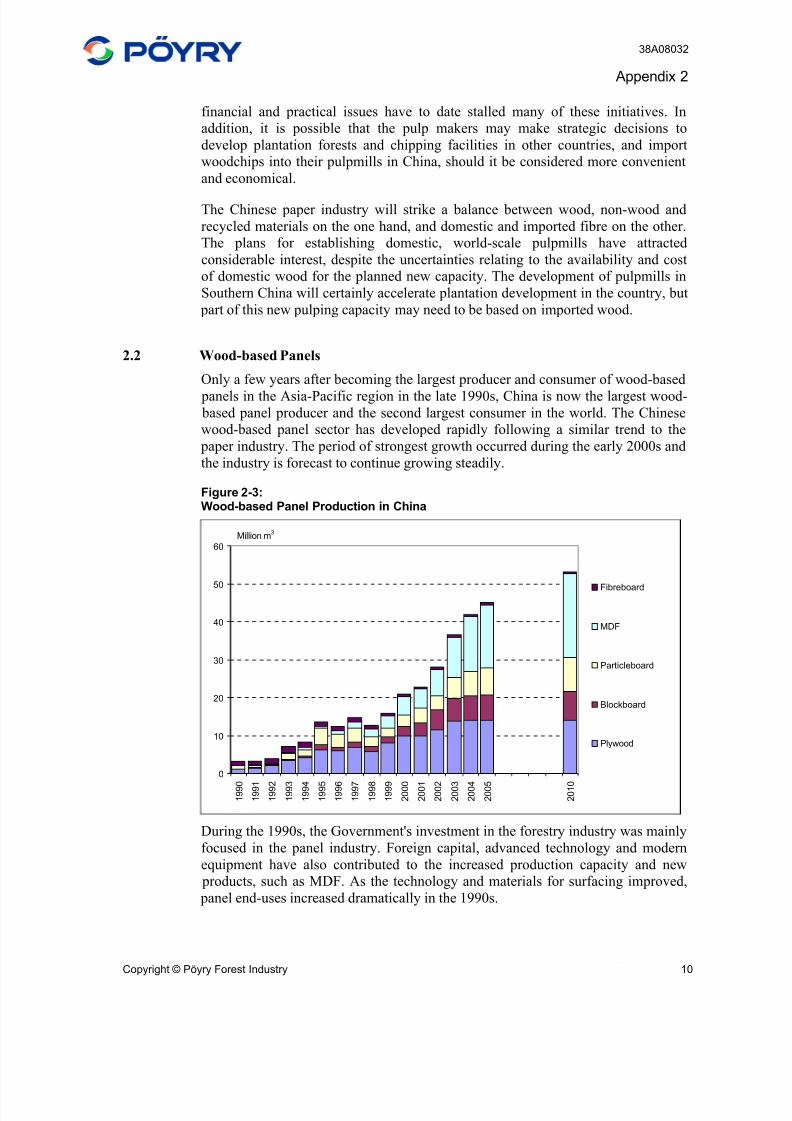
8/3/2019 Sino-Forest Poyry Valuation Dec 2006 Final
http://slidepdf.com/reader/full/sino-forest-poyry-valuation-dec-2006-final 114/122
38A08032
Appendix 2
Copyright © Pöyry Forest Industry 10
financial and practical issues have to date stalled many of these initiatives. In
addition, it is possible that the pulp makers may make strategic decisions to
develop plantation forests and chipping facilities in other countries, and import
woodchips into their pulpmills in China, should it be considered more convenient
and economical.
The Chinese paper industry will strike a balance between wood, non-wood and
recycled materials on the one hand, and domestic and imported fibre on the other.
The plans for establishing domestic, world-scale pulpmills have attracted
considerable interest, despite the uncertainties relating to the availability and cost
of domestic wood for the planned new capacity. The development of pulpmills in
Southern China will certainly accelerate plantation development in the country, but
part of this new pulping capacity may need to be based on imported wood.
2.2 Wood-based Panels
Only a few years after becoming the largest producer and consumer of wood-based
panels in the Asia-Pacific region in the late 1990s, China is now the largest wood- based panel producer and the second largest consumer in the world. The Chinese
wood-based panel sector has developed rapidly following a similar trend to the
paper industry. The period of strongest growth occurred during the early 2000s and
the industry is forecast to continue growing steadily.
Figure 2-3:Wood-based Panel Production in China
Million m3
0
10
20
30
40
50
60
1 9 9 0
1 9 9 1
1 9 9 2
1 9 9 3
1 9 9 4
1 9 9 5
1 9 9 6
1 9 9 7
1 9 9 8
1 9 9 9
2 0 0 0
2 0 0 1
2 0 0 2
2 0 0 3
2 0 0 4
2 0 0 5
2 0 1 0
Fibreboard
MDF
Particleboard
Blockboard
Plywood
During the 1990s, the Government's investment in the forestry industry was mainly
focused in the panel industry. Foreign capital, advanced technology and modern
equipment have also contributed to the increased production capacity and new
products, such as MDF. As the technology and materials for surfacing improved,
panel end-uses increased dramatically in the 1990s.
8/3/2019 Sino-Forest Poyry Valuation Dec 2006 Final
http://slidepdf.com/reader/full/sino-forest-poyry-valuation-dec-2006-final 115/122
38A08032
Appendix 2
Copyright © Pöyry Forest Industry 11
Wood-based panel production in China has increased substantially at an average
growth rate of 13%/a over the last decade. Production exceeded 45 million m3
in
2005 and is forecast to reach 53 million m3
by 2010. The future increase is
primarily generated from growth in reconstituted panel products, including MDF at
5.8%/a and particleboard at 4.6%/a during the rest of this decade.
MDF has indeed been the most significant contributor to the growth in China’s
wood-based panel production and represented 37% of the total in 2005, while
particleboard, another expanding sector, accounted for 16%.
Plywood has traditionally been the most consumed wood-based panel type in Asia
in a variety of end-use applications. Production of plywood in China has however
been relatively static in recent years due to product substitution threats from
reconstituted panels, as well as shortages of quality peeler logs.
End-users of MDF in China are mainly manufacturers of furniture/interior-
decoration and laminated flooring. The main demand drivers include strong
economic growth, improving living standards and lifestyle changes, expansion of the furniture and interior decoration industries and developments in the
construction industry.
Particleboard is primarily used in the production of furniture, particularly kitchen
and office furniture. To date, particleboard applications in construction end-uses
have been limited because of the current dominance of plywood. However, some
particleboard is used in partitions and sheathing applications where it provides a
cost effective solution.
2.3 Sawmilling
China's sawmilling industry has undergone transitions since 1998 caused by effortsto protect national forests and an increased awareness of environmental problems
in the country. The impact of the Natural Forest Protection Program's logging ban
has been realised. China faces significant shortages in domestically produced
sawlogs, and relies heavily on imported sawlogs for the production of domestic
sawn timber.
Small to medium sized producers continue to dominate the sawn timber industry.
There are a vast number of non-industrialised workshop operations across China.
More recently, as log importing has increased, many individuals operating simple
saw and carriage sawnwood businesses have located around major log import ports
or cities such as Suifenhe in Heilongjiang, Zhangjiagang in Jiangsu, and Jiaxing in
Zhejiang.
Given the very fragmented nature of China’s sawmilling industry, the assessment
of national production and consumption is challenging. Pöyry estimates that China
produced some 30-31 million m3 and consumed 35-36 million m3 of sawn timber in
2005, having increased at an annual average of 2.4%/a and 3.9%/a respectively.
The sharp and steady growth from 2000 till now has been significant.
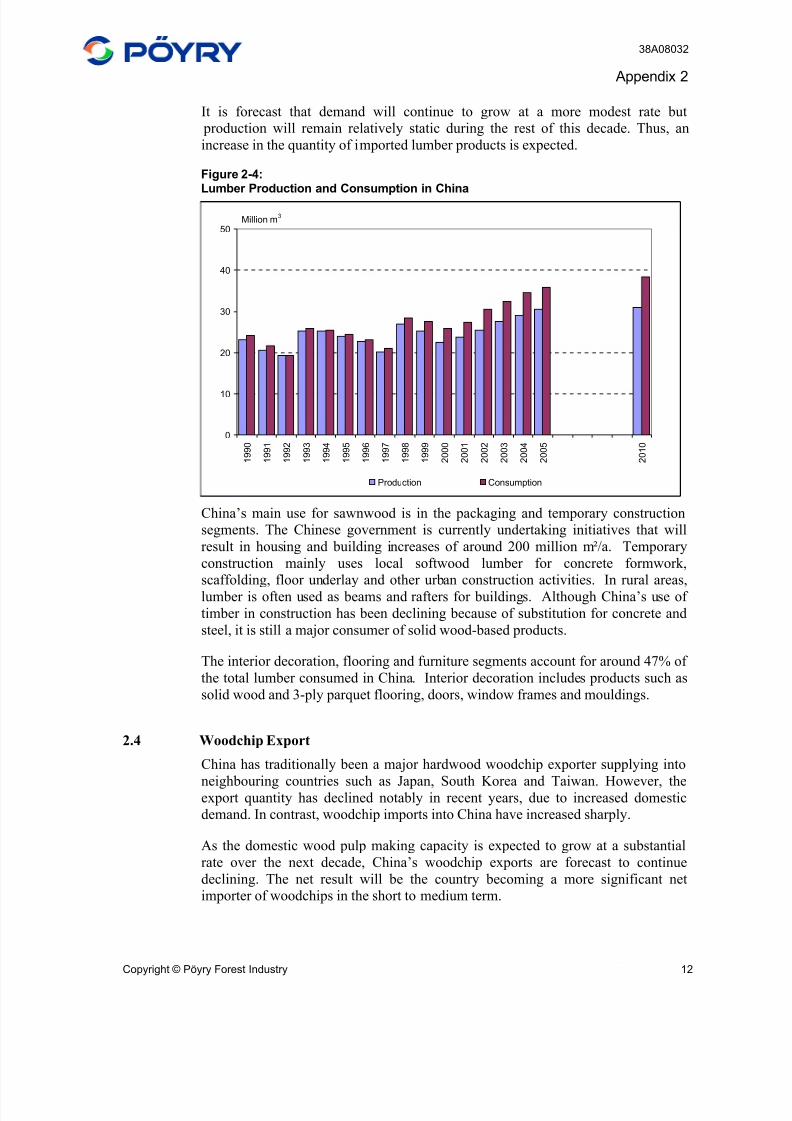
8/3/2019 Sino-Forest Poyry Valuation Dec 2006 Final
http://slidepdf.com/reader/full/sino-forest-poyry-valuation-dec-2006-final 116/122
38A08032
Appendix 2
Copyright © Pöyry Forest Industry 12
It is forecast that demand will continue to grow at a more modest rate but
production will remain relatively static during the rest of this decade. Thus, an
increase in the quantity of imported lumber products is expected.
Figure 2-4:Lumber Production and Consumption in China
Million m3
0
10
20
30
40
50
1 9 9 0
1 9 9 1
1 9 9 2
1 9 9 3
1 9 9 4
1 9 9 5
1 9 9 6
1 9 9 7
1 9 9 8
1 9 9 9
2 0 0 0
2 0 0 1
2 0 0 2
2 0 0 3
2 0 0 4
2 0 0 5
2 0 1 0
Production Consumption
China’s main use for sawnwood is in the packaging and temporary construction
segments. The Chinese government is currently undertaking initiatives that will
result in housing and building increases of around 200 million m²/a. Temporary
construction mainly uses local softwood lumber for concrete formwork,
scaffolding, floor underlay and other urban construction activities. In rural areas,
lumber is often used as beams and rafters for buildings. Although China’s use of
timber in construction has been declining because of substitution for concrete and
steel, it is still a major consumer of solid wood-based products.
The interior decoration, flooring and furniture segments account for around 47% of
the total lumber consumed in China. Interior decoration includes products such as
solid wood and 3-ply parquet flooring, doors, window frames and mouldings.
2.4 Woodchip Export
China has traditionally been a major hardwood woodchip exporter supplying into
neighbouring countries such as Japan, South Korea and Taiwan. However, theexport quantity has declined notably in recent years, due to increased domestic
demand. In contrast, woodchip imports into China have increased sharply.
As the domestic wood pulp making capacity is expected to grow at a substantial
rate over the next decade, China’s woodchip exports are forecast to continue
declining. The net result will be the country becoming a more significant net
importer of woodchips in the short to medium term.
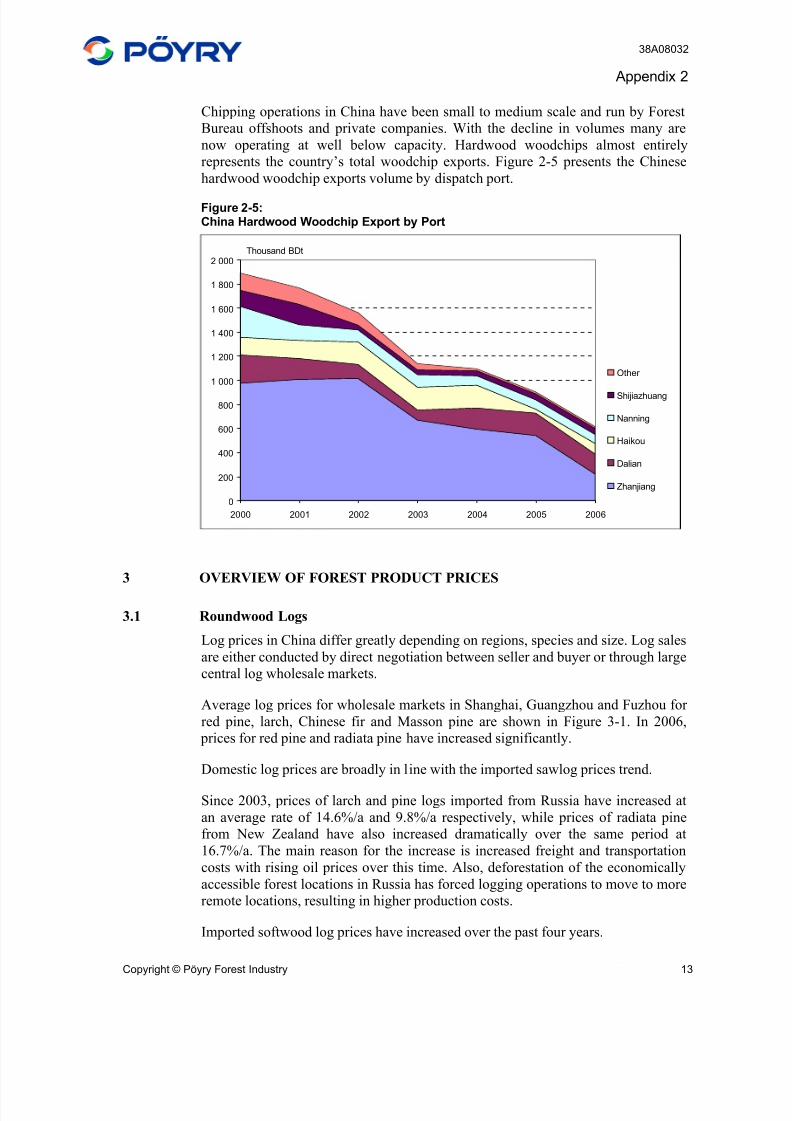
8/3/2019 Sino-Forest Poyry Valuation Dec 2006 Final
http://slidepdf.com/reader/full/sino-forest-poyry-valuation-dec-2006-final 117/122
38A08032
Appendix 2
Copyright © Pöyry Forest Industry 13
Chipping operations in China have been small to medium scale and run by Forest
Bureau offshoots and private companies. With the decline in volumes many are
now operating at well below capacity. Hardwood woodchips almost entirely
represents the country’s total woodchip exports. Figure 2-5 presents the Chinese
hardwood woodchip exports volume by dispatch port.
Figure 2-5:China Hardwood Woodchip Export by Port
Thousand BDt
0
200
400
600
800
1 000
1 200
1 400
1 600
1 800
2 000
2000 2001 2002 2003 2004 2005 2006
Other
Shijiazhuang
Nanning
Haikou
Dalian
Zhanjiang
3 OVERVIEW OF FOREST PRODUCT PRICES
3.1 Roundwood Logs
Log prices in China differ greatly depending on regions, species and size. Log sales
are either conducted by direct negotiation between seller and buyer or through large
central log wholesale markets.
Average log prices for wholesale markets in Shanghai, Guangzhou and Fuzhou for
red pine, larch, Chinese fir and Masson pine are shown in Figure 3-1. In 2006,
prices for red pine and radiata pine have increased significantly.
Domestic log prices are broadly in line with the imported sawlog prices trend.
Since 2003, prices of larch and pine logs imported from Russia have increased at
an average rate of 14.6%/a and 9.8%/a respectively, while prices of radiata pine
from New Zealand have also increased dramatically over the same period at
16.7%/a. The main reason for the increase is increased freight and transportation
costs with rising oil prices over this time. Also, deforestation of the economically
accessible forest locations in Russia has forced logging operations to move to more
remote locations, resulting in higher production costs.
Imported softwood log prices have increased over the past four years.
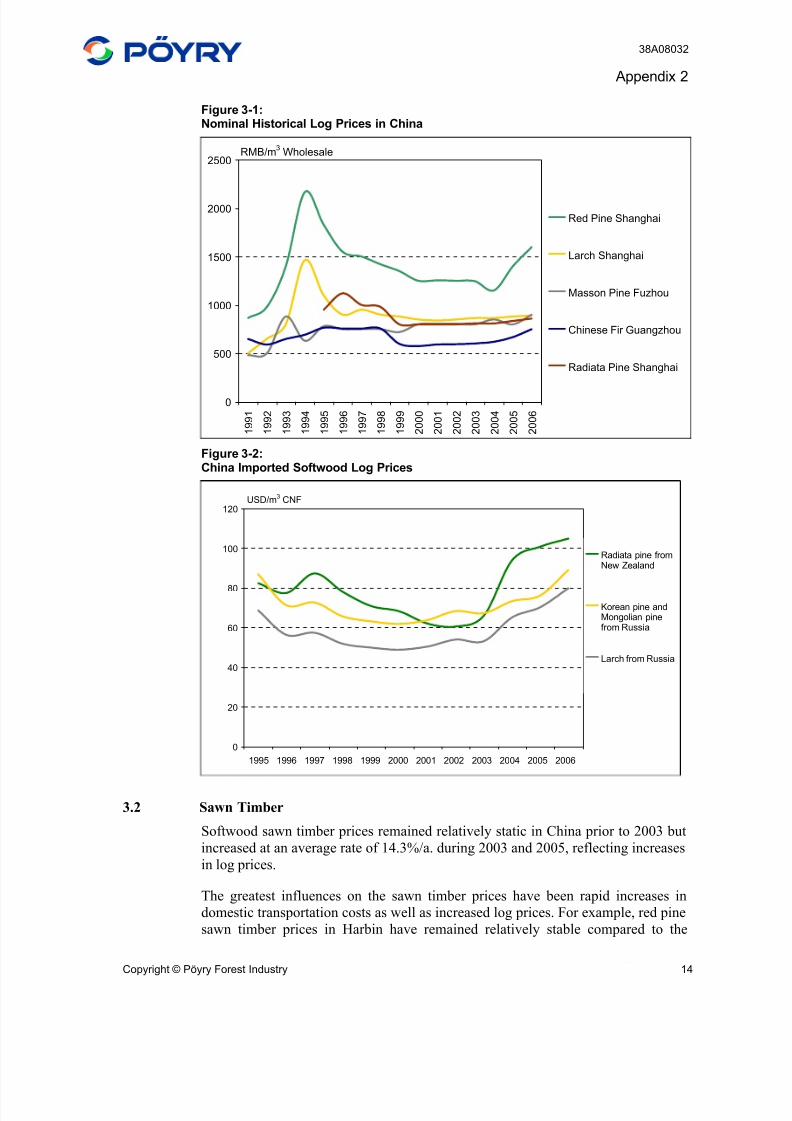
8/3/2019 Sino-Forest Poyry Valuation Dec 2006 Final
http://slidepdf.com/reader/full/sino-forest-poyry-valuation-dec-2006-final 118/122
38A08032
Appendix 2
Copyright © Pöyry Forest Industry 14
Figure 3-1:Nominal Historical Log Prices in China
RMB/m3
Wholesale
0
500
1000
1500
2000
2500
1 9 9 1
1 9 9 2
1 9 9 3
1 9 9 4
1 9 9 5
1 9 9 6
1 9 9 7
1 9 9 8
1 9 9 9
2 0 0 0
2 0 0 1
2 0 0 2
2 0 0 3
2 0 0 4
2 0 0 5
2 0 0 6
Red Pine Shanghai
Larch Shanghai
Masson Pine Fuzhou
Chinese Fir Guangzhou
Radiata Pine Shanghai
Figure 3-2:China Imported Softwood Log Prices
0
20
40
60
80
100
120
1995 1996 1997 1998 1999 2000 2001 2002 2003 2004 2005 2006
USD/m3
CNF
Radiata pine fromNew Zealand
Korean pine andMongolian pinefrom Russia
Larch from Russia
3.2 Sawn Timber
Softwood sawn timber prices remained relatively static in China prior to 2003 but
increased at an average rate of 14.3%/a. during 2003 and 2005, reflecting increases
in log prices.
The greatest influences on the sawn timber prices have been rapid increases in
domestic transportation costs as well as increased log prices. For example, red pine
sawn timber prices in Harbin have remained relatively stable compared to the
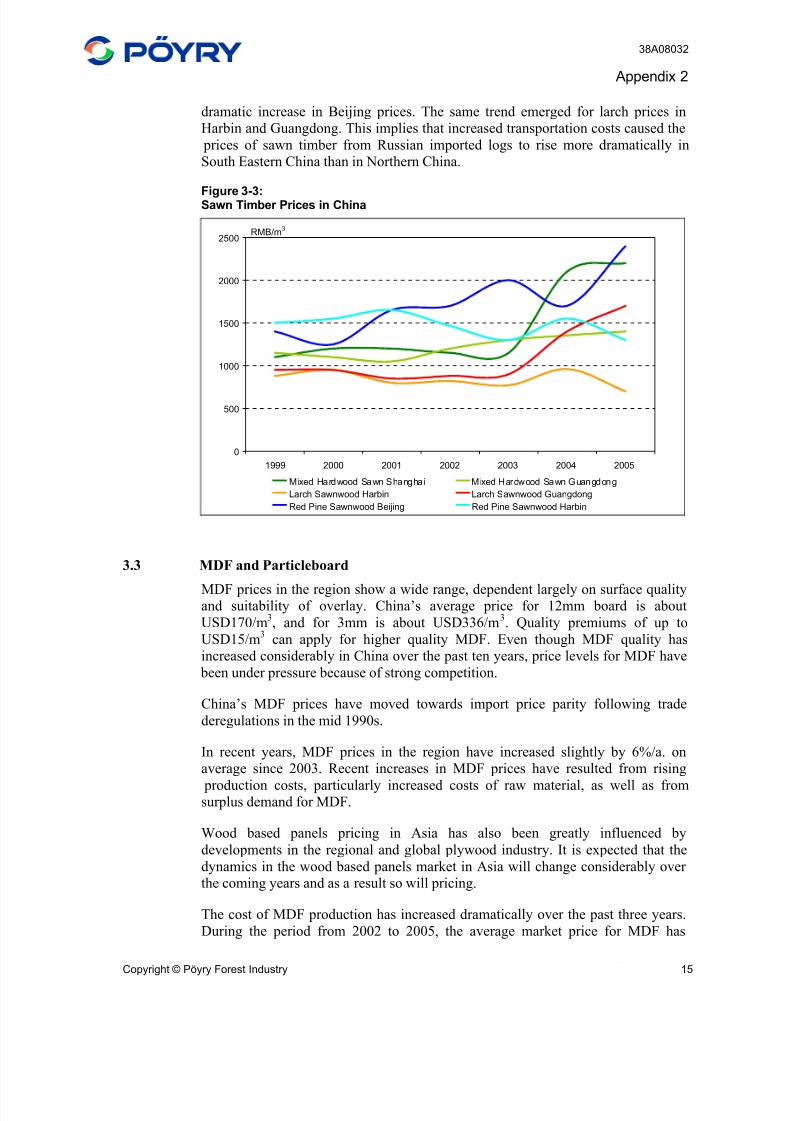
8/3/2019 Sino-Forest Poyry Valuation Dec 2006 Final
http://slidepdf.com/reader/full/sino-forest-poyry-valuation-dec-2006-final 119/122
38A08032
Appendix 2
Copyright © Pöyry Forest Industry 15
dramatic increase in Beijing prices. The same trend emerged for larch prices in
Harbin and Guangdong. This implies that increased transportation costs caused the
prices of sawn timber from Russian imported logs to rise more dramatically in
South Eastern China than in Northern China.
Figure 3-3:Sawn Timber Prices in China
0
500
1000
1500
2000
2500
1999 2000 2001 2002 2003 2004 2005
RMB/m3
Mixed Hardwood Sawn Shanghai Mixed Hardwood Sawn Guangdong
Larch Sawnwood Harbin Larch Sawnwood Guangdong
Red Pine Sawnwood Beijing Red Pine Sawnwood Harbin
3.3 MDF and Particleboard
MDF prices in the region show a wide range, dependent largely on surface qualityand suitability of overlay. China’s average price for 12mm board is about
USD170/m3, and for 3mm is about USD336/m
3. Quality premiums of up to
USD15/m3
can apply for higher quality MDF. Even though MDF quality has
increased considerably in China over the past ten years, price levels for MDF have
been under pressure because of strong competition.
China’s MDF prices have moved towards import price parity following trade
deregulations in the mid 1990s.
In recent years, MDF prices in the region have increased slightly by 6%/a. on
average since 2003. Recent increases in MDF prices have resulted from rising
production costs, particularly increased costs of raw material, as well as fromsurplus demand for MDF.
Wood based panels pricing in Asia has also been greatly influenced by
developments in the regional and global plywood industry. It is expected that the
dynamics in the wood based panels market in Asia will change considerably over
the coming years and as a result so will pricing.
The cost of MDF production has increased dramatically over the past three years.
During the period from 2002 to 2005, the average market price for MDF has
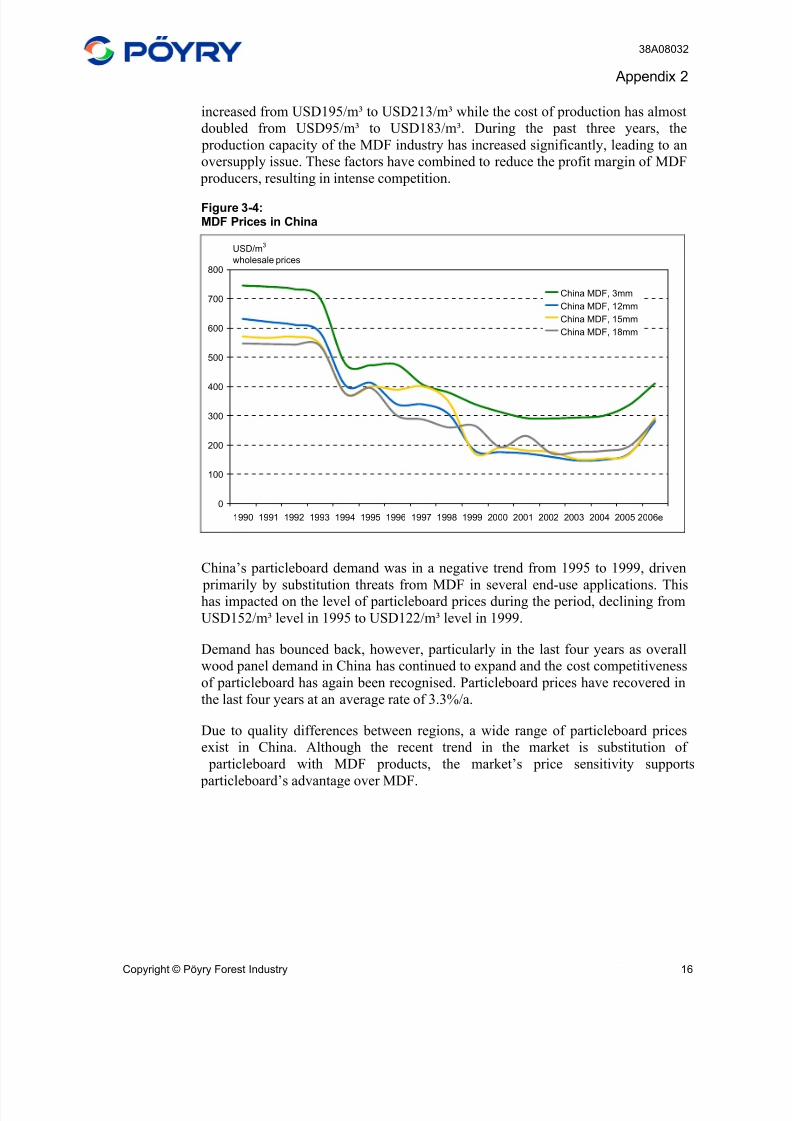
8/3/2019 Sino-Forest Poyry Valuation Dec 2006 Final
http://slidepdf.com/reader/full/sino-forest-poyry-valuation-dec-2006-final 120/122
38A08032
Appendix 2
Copyright © Pöyry Forest Industry 16
increased from USD195/m³ to USD213/m³ while the cost of production has almost
doubled from USD95/m³ to USD183/m³. During the past three years, the
production capacity of the MDF industry has increased significantly, leading to an
oversupply issue. These factors have combined to reduce the profit margin of MDF
producers, resulting in intense competition.
Figure 3-4:MDF Prices in China
0
100
200
300
400
500
600
700
800
1990 1991 1992 1993 1994 1995 1996 1997 1998 1999 2000 2001 2002 2003 2004 2005 2006e
USD/m3
wholesale prices
China MDF, 3mm
China MDF, 12mm
China MDF, 15mm
China MDF, 18mm
China’s particleboard demand was in a negative trend from 1995 to 1999, driven
primarily by substitution threats from MDF in several end-use applications. Thishas impacted on the level of particleboard prices during the period, declining from
USD152/m³ level in 1995 to USD122/m³ level in 1999.
Demand has bounced back, however, particularly in the last four years as overall
wood panel demand in China has continued to expand and the cost competitiveness
of particleboard has again been recognised. Particleboard prices have recovered in
the last four years at an average rate of 3.3%/a.
Due to quality differences between regions, a wide range of particleboard prices
exist in China. Although the recent trend in the market is substitution of
particleboard with MDF products, the market’s price sensitivity supports
particleboard’s advantage over MDF.
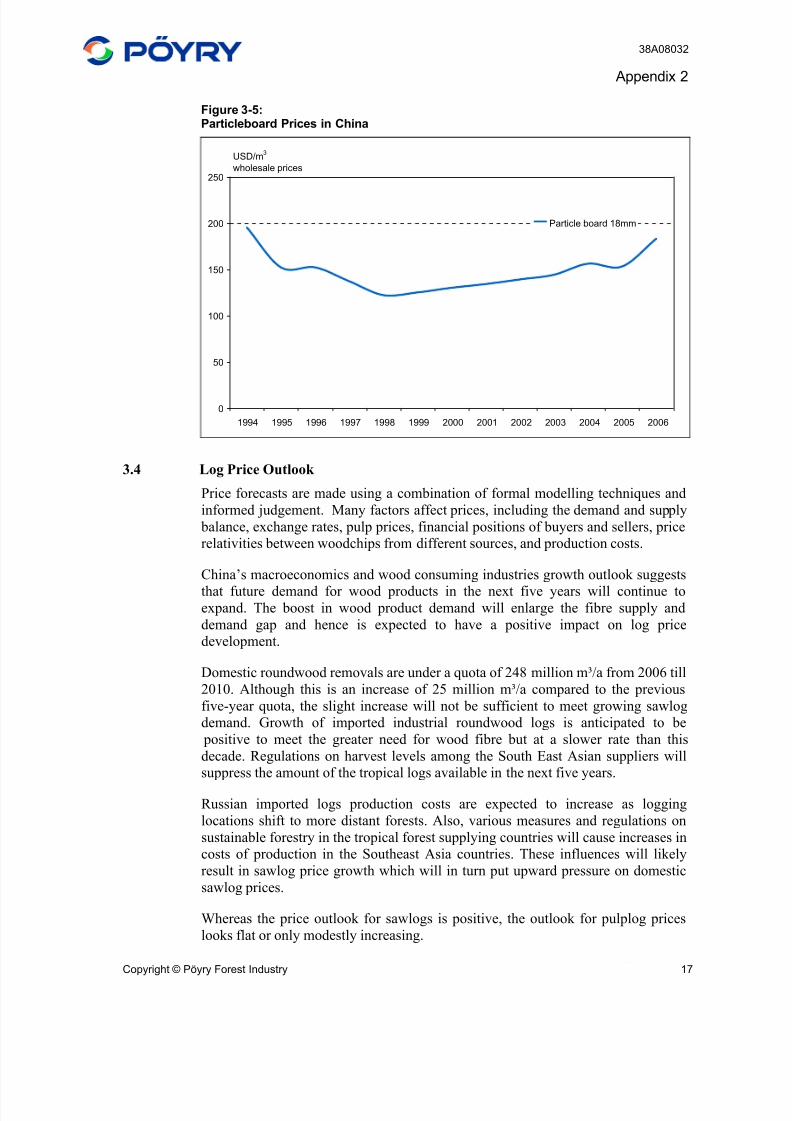
8/3/2019 Sino-Forest Poyry Valuation Dec 2006 Final
http://slidepdf.com/reader/full/sino-forest-poyry-valuation-dec-2006-final 121/122
38A08032
Appendix 2
Copyright © Pöyry Forest Industry 17
Figure 3-5:Particleboard Prices in China
0
50
100
150
200
250
1994 1995 1996 1997 1998 1999 2000 2001 2002 2003 2004 2005 2006
USD/m3
wholesale prices
Particle board 18mm
3.4 Log Price Outlook
Price forecasts are made using a combination of formal modelling techniques and
informed judgement. Many factors affect prices, including the demand and supply
balance, exchange rates, pulp prices, financial positions of buyers and sellers, price
relativities between woodchips from different sources, and production costs.
China’s macroeconomics and wood consuming industries growth outlook suggests
that future demand for wood products in the next five years will continue toexpand. The boost in wood product demand will enlarge the fibre supply and
demand gap and hence is expected to have a positive impact on log price
development.
Domestic roundwood removals are under a quota of 248 million m³/a from 2006 till
2010. Although this is an increase of 25 million m³/a compared to the previous
five-year quota, the slight increase will not be sufficient to meet growing sawlog
demand. Growth of imported industrial roundwood logs is anticipated to be
positive to meet the greater need for wood fibre but at a slower rate than this
decade. Regulations on harvest levels among the South East Asian suppliers will
suppress the amount of the tropical logs available in the next five years.
Russian imported logs production costs are expected to increase as logging
locations shift to more distant forests. Also, various measures and regulations on
sustainable forestry in the tropical forest supplying countries will cause increases in
costs of production in the Southeast Asia countries. These influences will likely
result in sawlog price growth which will in turn put upward pressure on domestic
sawlog prices.
Whereas the price outlook for sawlogs is positive, the outlook for pulplog prices
looks flat or only modestly increasing.
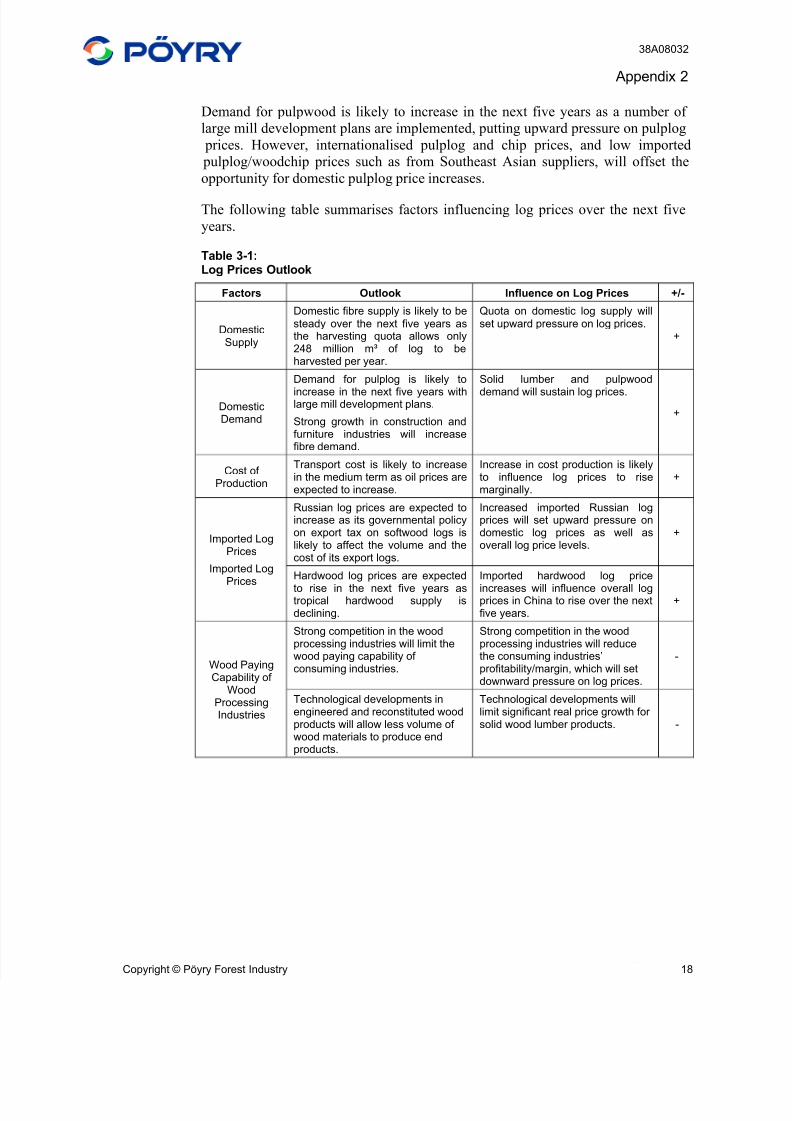
8/3/2019 Sino-Forest Poyry Valuation Dec 2006 Final
http://slidepdf.com/reader/full/sino-forest-poyry-valuation-dec-2006-final 122/122
38A08032
Appendix 2
Demand for pulpwood is likely to increase in the next five years as a number of
large mill development plans are implemented, putting upward pressure on pulplog
prices. However, internationalised pulplog and chip prices, and low imported
pulplog/woodchip prices such as from Southeast Asian suppliers, will offset the
opportunity for domestic pulplog price increases.
The following table summarises factors influencing log prices over the next five
years.
Table 3-1:Log Prices Outlook
Factors Outlook Influence on Log Prices +/-
DomesticSupply
Domestic fibre supply is likely to besteady over the next five years asthe harvesting quota allows only248 million m³ of log to beharvested per year.
Quota on domestic log supply willset upward pressure on log prices.
+
DomesticDemand
Demand for pulplog is likely to
increase in the next five years withlarge mill development plans.
Strong growth in construction andfurniture industries will increasefibre demand.
Solid lumber and pulpwood
demand will sustain log prices.
+
Cost of Production
Transport cost is likely to increasein the medium term as oil prices areexpected to increase.
Increase in cost production is likelyto influence log prices to risemarginally.
+
Russian log prices are expected toincrease as its governmental policyon export tax on softwood logs islikely to affect the volume and thecost of its export logs.
Increased imported Russian logprices will set upward pressure ondomestic log prices as well asoverall log price levels.
+Imported Log
Prices
Imported LogPrices
Hardwood log prices are expected
to rise in the next five years astropical hardwood supply isdeclining.
Imported hardwood log price
increases will influence overall logprices in China to rise over the nextfive years.
+
Strong competition in the wood Strong competition in the wood
Recommended