Sections 2/3
Organizing Data and Review

• Scientific method
• Variables
• Conversion and Sig. Figs review
• Metric Review
• Three Types of graphs
• Scientific notation review

Overview
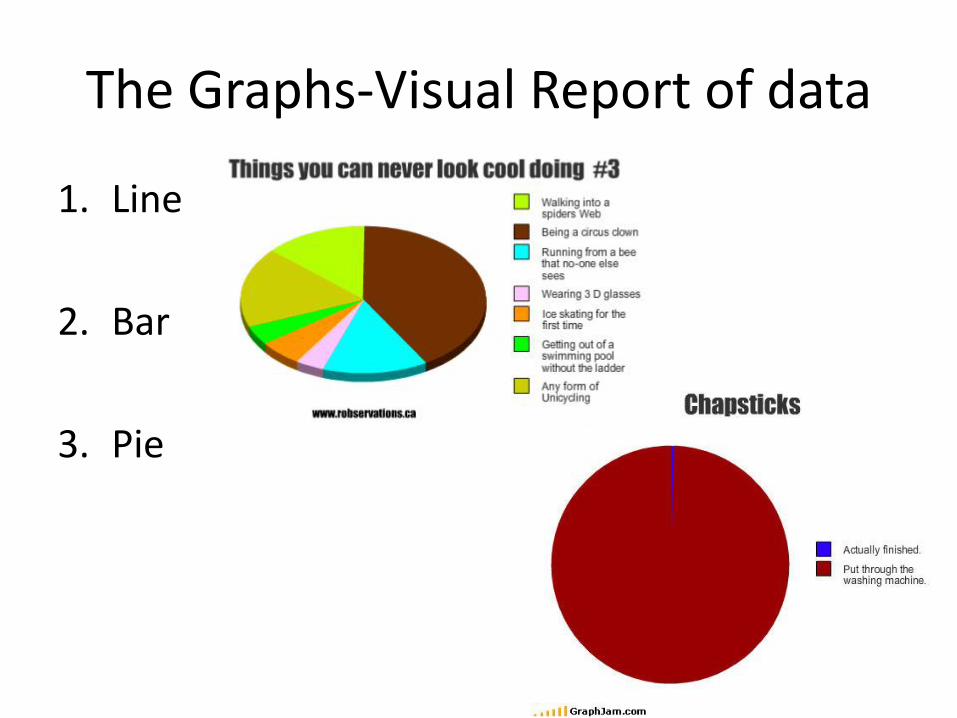
The Graphs-Visual Report of data
1. Line
2. Bar
3. Pie

Hypothetical Procrastination Experiment
• Question: Do you procrastinate before a project?
– Monitor Progress
– Present your data
– Dependent variable- “Y” axis
• Variable being tested
– Independent Variable- “X” axis
• Variable that affects the dependent variable
• Days before project is due and work completed

Overview

This is why we use graphs…
• Today I decided to monitor the progress of my projects over the time span in days. This will be compared to the percent completion starting from the first day I am assigned the project. One day one I was very studious and completed 25% of my project. Then I found out the packers lost and became depressed for the next two days but completed 25% more of my project before I found out. Then my mother-in-law showed and proceeded to lecture me which in turn depressed me for the next two days. I got nothing done. Then I realized my project was due and stayed up till one in the morning to finish the project. I was late to class.

Getting better…
Work Done (% completion) Time Before Project Deadline (Days)
25% Project Start (6 days)
50% 5
50% 4
50% 3
50% 2
100% 1

That’s why we use graphs…

Line Graphs
• Best for Continuous Change
• How many Variables?

Example: Bunnies and Time of Year
Title

Bar
• Useful for comparing data with similar individual items
• What’s wrong with the graph below?

Example: Type of fish caught and time of day

Pie Chart
• Displays data that are parts of a whole

Example: Stuff I do in a day
• -
• -
• -
• -
• -

Metric Review
• Mr. Hoeldtke wanted to burn his ditches with napalm . Because napalm is cool…duh! Unfortunately, Mr. H. didn’t compensate for the fact that his napalm distributer (Flamethrower) held napalm in liters and not gallons like he thought. For this reason Mr. H lives in a cardboard box on his ashy property. Don’t live in a cardboard box! Learn to convert!
Conversion review
• Your ditch can withstand the intensity of 40 liters of flaming fury. The napalm distributer only measures its cargo in gallons…how many gallons are in 40L of burning beautifulness?
40L to Gallons

Scientific Notation Review
• 400,000
• .000000000005
• 200
• 10
• One google (100 zeros behind a 1)

Google Glory!
• 10000000000000000000000000000000000000000000000000000000000000000000000000000000000000000000000000000= 1 x10^100

Significant Figures Review
• What are the number of Sig. Figs?
• .0012=
• .102204=
• 100.01001=

Significant Figures Review
• 13.7 x 45.22=
• 2 x 4=
• 3 x 1.88877766555=

Significant Figures Review
• 13.7 + 45.22=
• 2 + 4=
• 3 + 1.88877766555

Any Questions?
Mr. Hoeldtke
Recommended