SAMPLING RESEARCH Color Psychology
Tianjie Li
Simple Version
Click www.tianjieli.com to view my online portfolio.
For questions or details please contact [email protected].
1. OVERVIEW
This project practised HCI theory and methods through the HCI & UI research of 3D modeling software. The research had built the user's action & congition model through user research and provi
ded the design guidelines of this kind of software. The research analyzed congitive demands of the icons of different user typesunder different circumstances and proposed the icons' standard to
wards the user centered design.
2. BASIC INVESTIGATION RESULTS (SAMPLE)
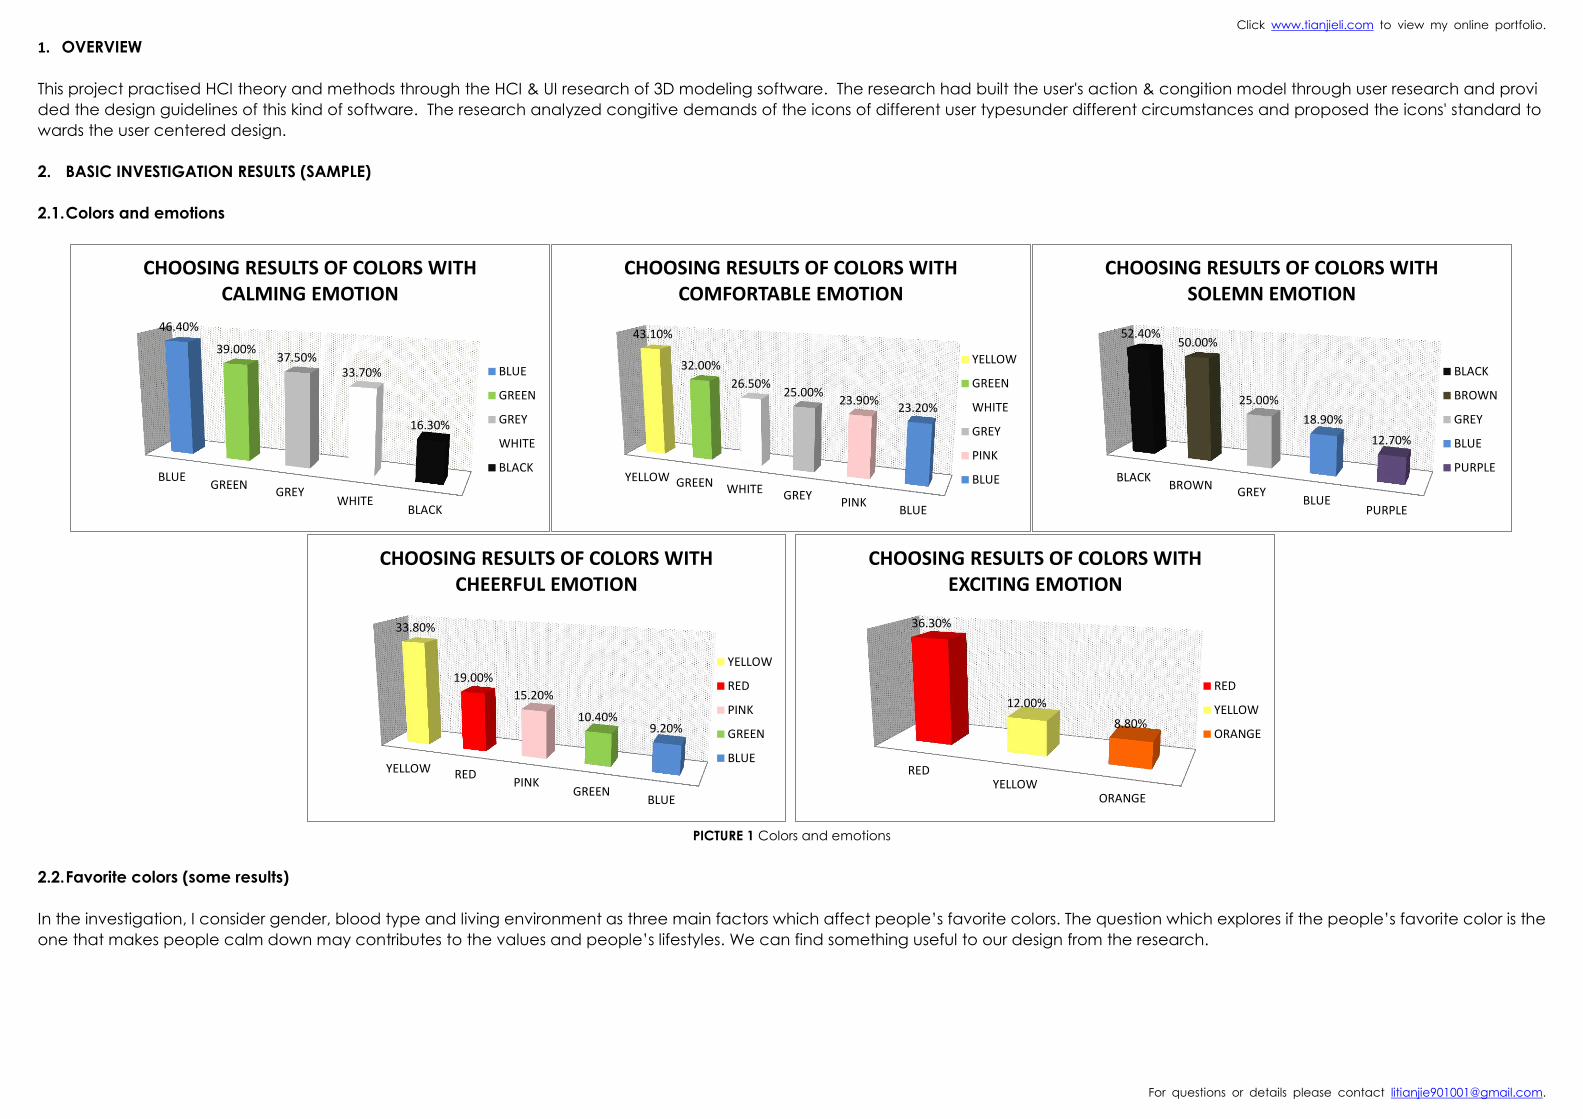
2.1. Colors and emotions
PICTURE 1 Colors and emotions
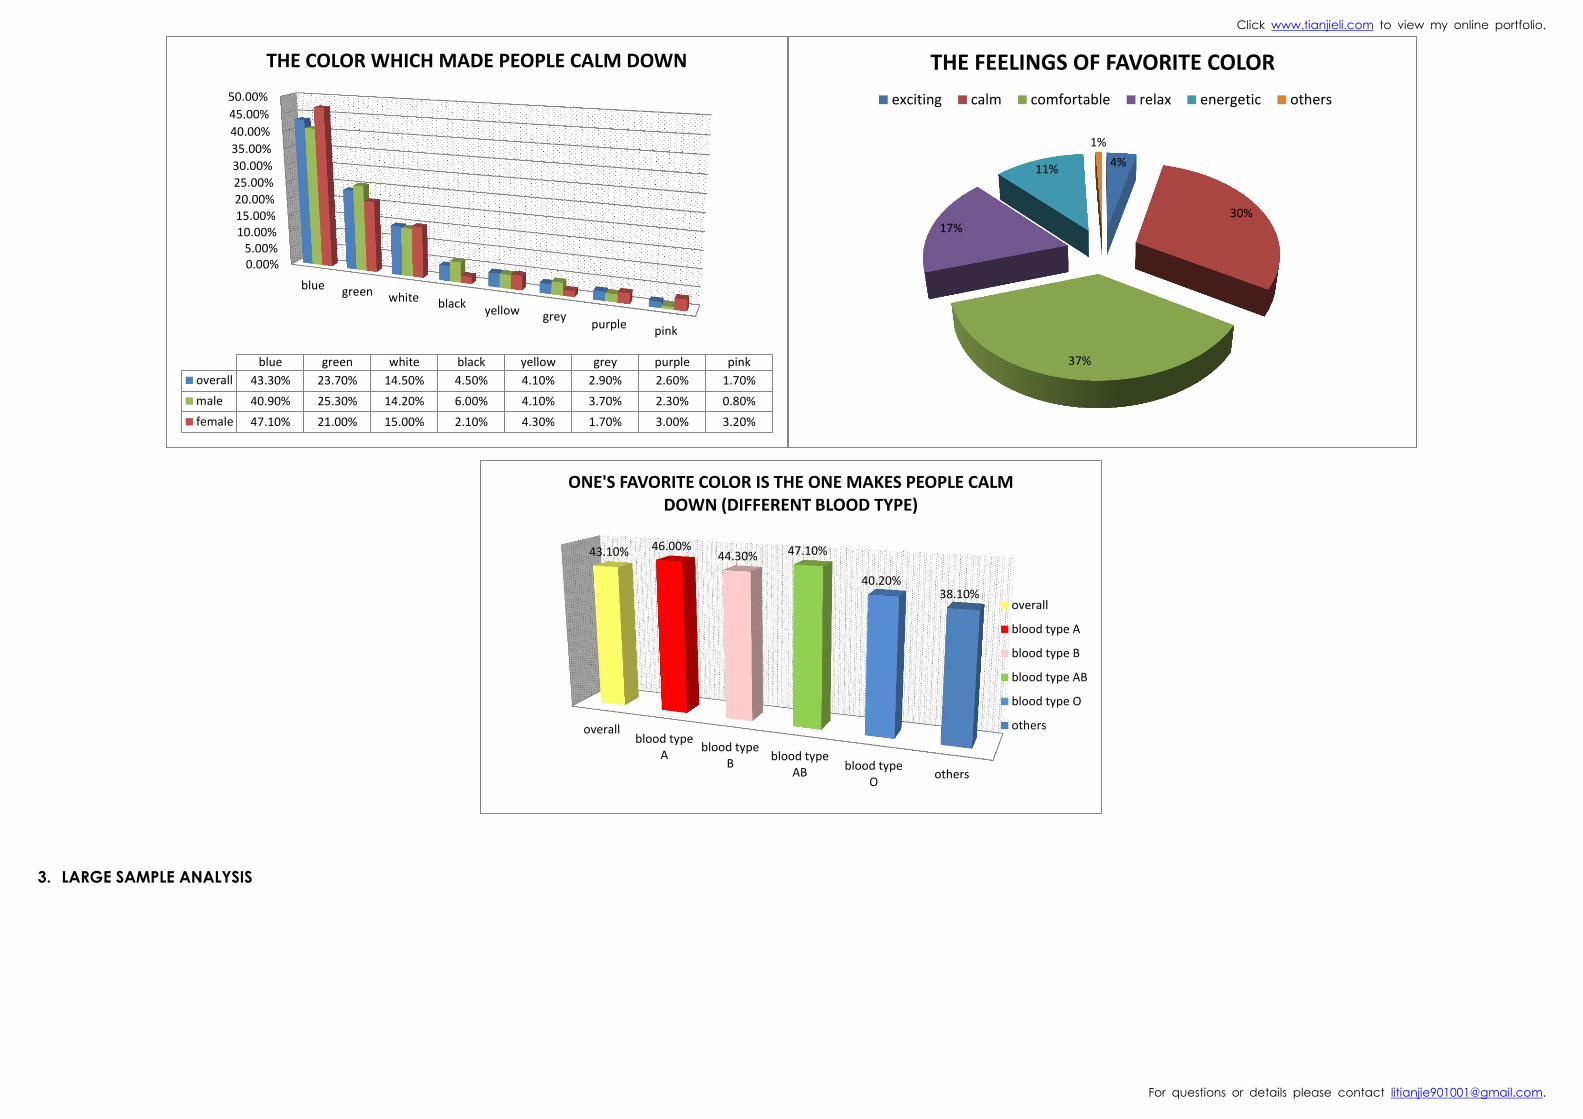
2.2. Favorite colors (some results)
In the investigation, I consider gender, blood type and living environment as three main factors which affect people’s favorite colors. The question which explores if the people’s favorite color is the
one that makes people calm down may contributes to the values and people’s lifestyles. We can find something useful to our design from the research.
BLUEGREEN
GREYWHITE
BLACK
46.40%
39.00% 37.50%
33.70%
16.30%
CHOOSING RESULTS OF COLORS WITH CALMING EMOTION
BLUE
GREEN
GREY
WHITE
BLACKYELLOW GREEN WHITE GREY
PINKBLUE
43.10%
32.00%
26.50% 25.00%
23.90% 23.20%
CHOOSING RESULTS OF COLORS WITH COMFORTABLE EMOTION
YELLOW
GREEN
WHITE
GREY
PINK
BLUE BLACKBROWN
GREYBLUE
PURPLE
52.40% 50.00%
25.00%
18.90%
12.70%
CHOOSING RESULTS OF COLORS WITH SOLEMN EMOTION
BLACK
BROWN
GREY
BLUE
PURPLE
YELLOW REDPINK
GREENBLUE
33.80%
19.00%
15.20%
10.40% 9.20%
CHOOSING RESULTS OF COLORS WITH CHEERFUL EMOTION
YELLOW
RED
PINK
GREEN
BLUERED
YELLOWORANGE
36.30%
12.00%
8.80%
CHOOSING RESULTS OF COLORS WITH EXCITING EMOTION
RED
YELLOW
ORANGE
Click www.tianjieli.com to view my online portfolio.
For questions or details please contact [email protected].
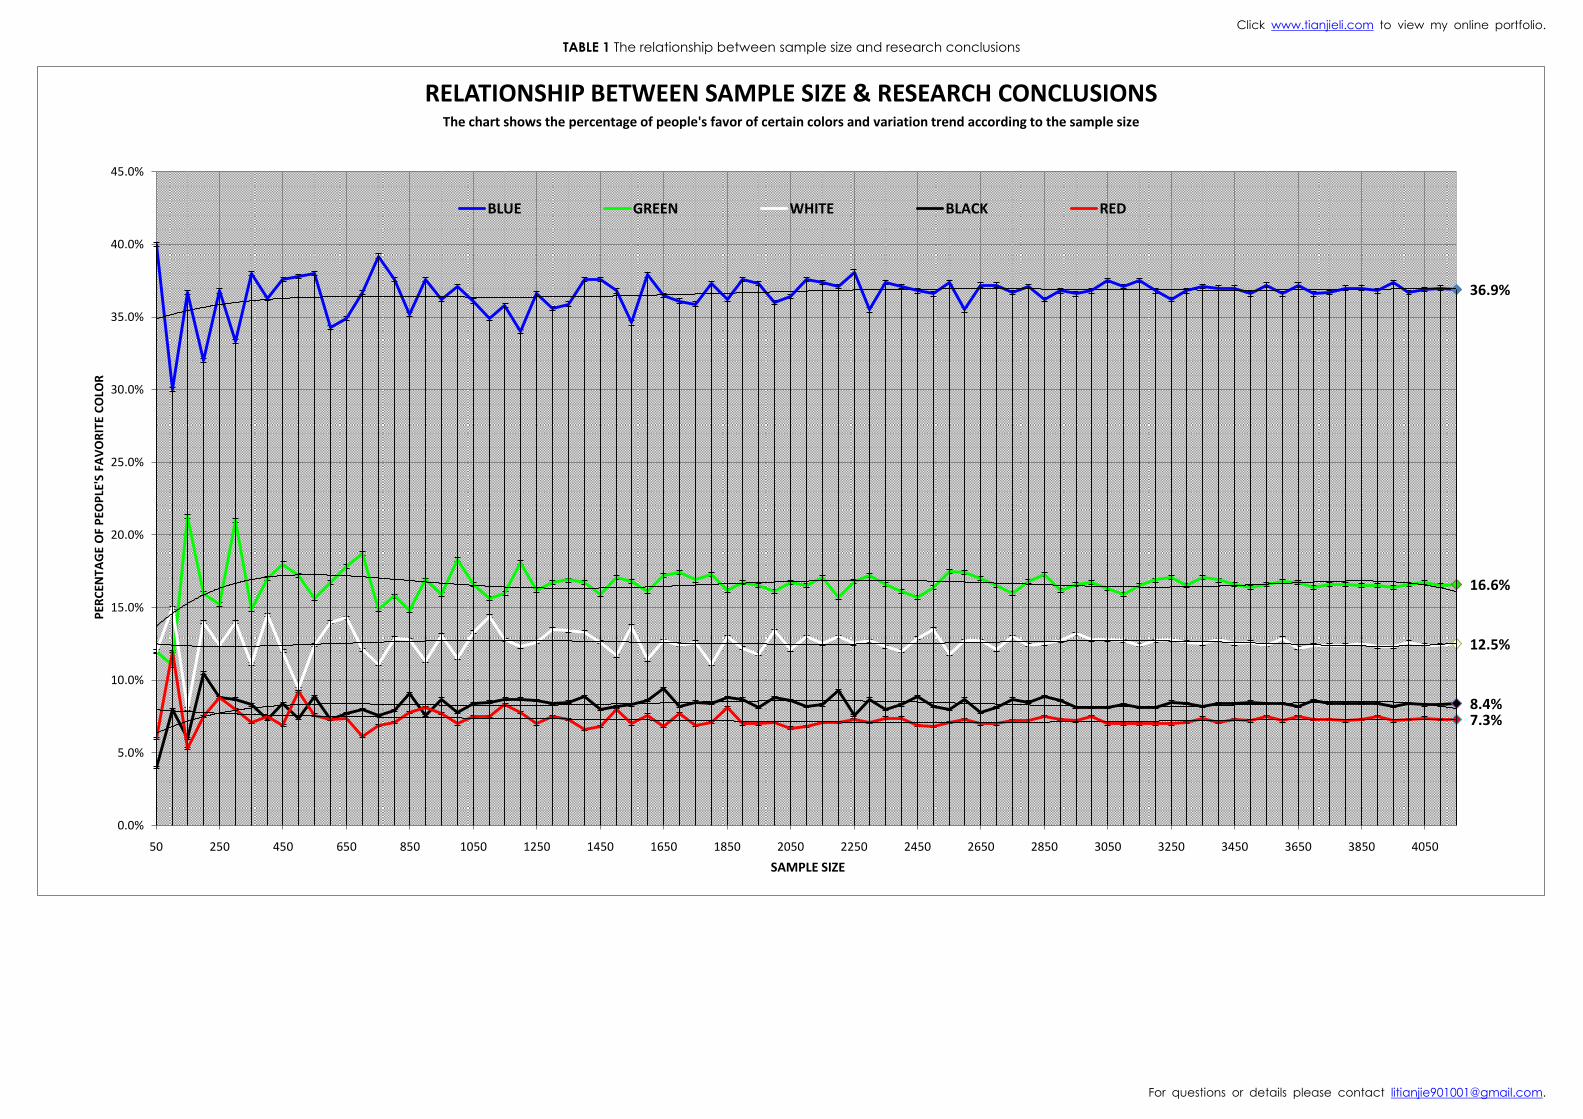
3. LARGE SAMPLE ANALYSIS
0.00%5.00%
10.00%15.00%20.00%
25.00%
30.00%
35.00%
40.00%
45.00%
50.00%
blue green white blackyellow grey
purple pink
blue green white black yellow grey purple pink
overall 43.30% 23.70% 14.50% 4.50% 4.10% 2.90% 2.60% 1.70%
male 40.90% 25.30% 14.20% 6.00% 4.10% 3.70% 2.30% 0.80%
female 47.10% 21.00% 15.00% 2.10% 4.30% 1.70% 3.00% 3.20%
THE COLOR WHICH MADE PEOPLE CALM DOWN
4%
30%
37%
17%
11%
1%
THE FEELINGS OF FAVORITE COLOR
exciting calm comfortable relax energetic others
overallblood type
Ablood type
Bblood type
ABblood type
Oothers
43.10% 46.00% 44.30% 47.10%
40.20% 38.10%
ONE'S FAVORITE COLOR IS THE ONE MAKES PEOPLE CALM DOWN (DIFFERENT BLOOD TYPE)
overall
blood type A
blood type B
blood type AB
blood type O
others
Click www.tianjieli.com to view my online portfolio.
For questions or details please contact [email protected].
TABLE 1 The relationship between sample size and research conclusions
36.9%
16.6%
12.5%
8.4% 7.3%
0.0%
5.0%
10.0%
15.0%
20.0%
25.0%
30.0%
35.0%
40.0%
45.0%
50 250 450 650 850 1050 1250 1450 1650 1850 2050 2250 2450 2650 2850 3050 3250 3450 3650 3850 4050
PER
CEN
TAG
E O
F P
EOP
LE'S
FA
VO
RIT
E C
OLO
R
SAMPLE SIZE
RELATIONSHIP BETWEEN SAMPLE SIZE & RESEARCH CONCLUSIONS The chart shows the percentage of people's favor of certain colors and variation trend according to the sample size
BLUE GREEN WHITE BLACK RED
Click www.tianjieli.com to view my online portfolio.
For questions or details please contact [email protected].
0.00%
-30.00%
-25.00%
-20.00%
-15.00%
-10.00%
-5.00%
0.00%
5.00%
10.00%
15.00%
20.00%
25.00%
30.00%
50 250 450 650 850 1050 1250 1450 1650 1850 2050 2250 2450 2650 2850 3050 3250 3450 3650 3850 4050
DEV
IATI
ON
S
SAMPLE SIZE
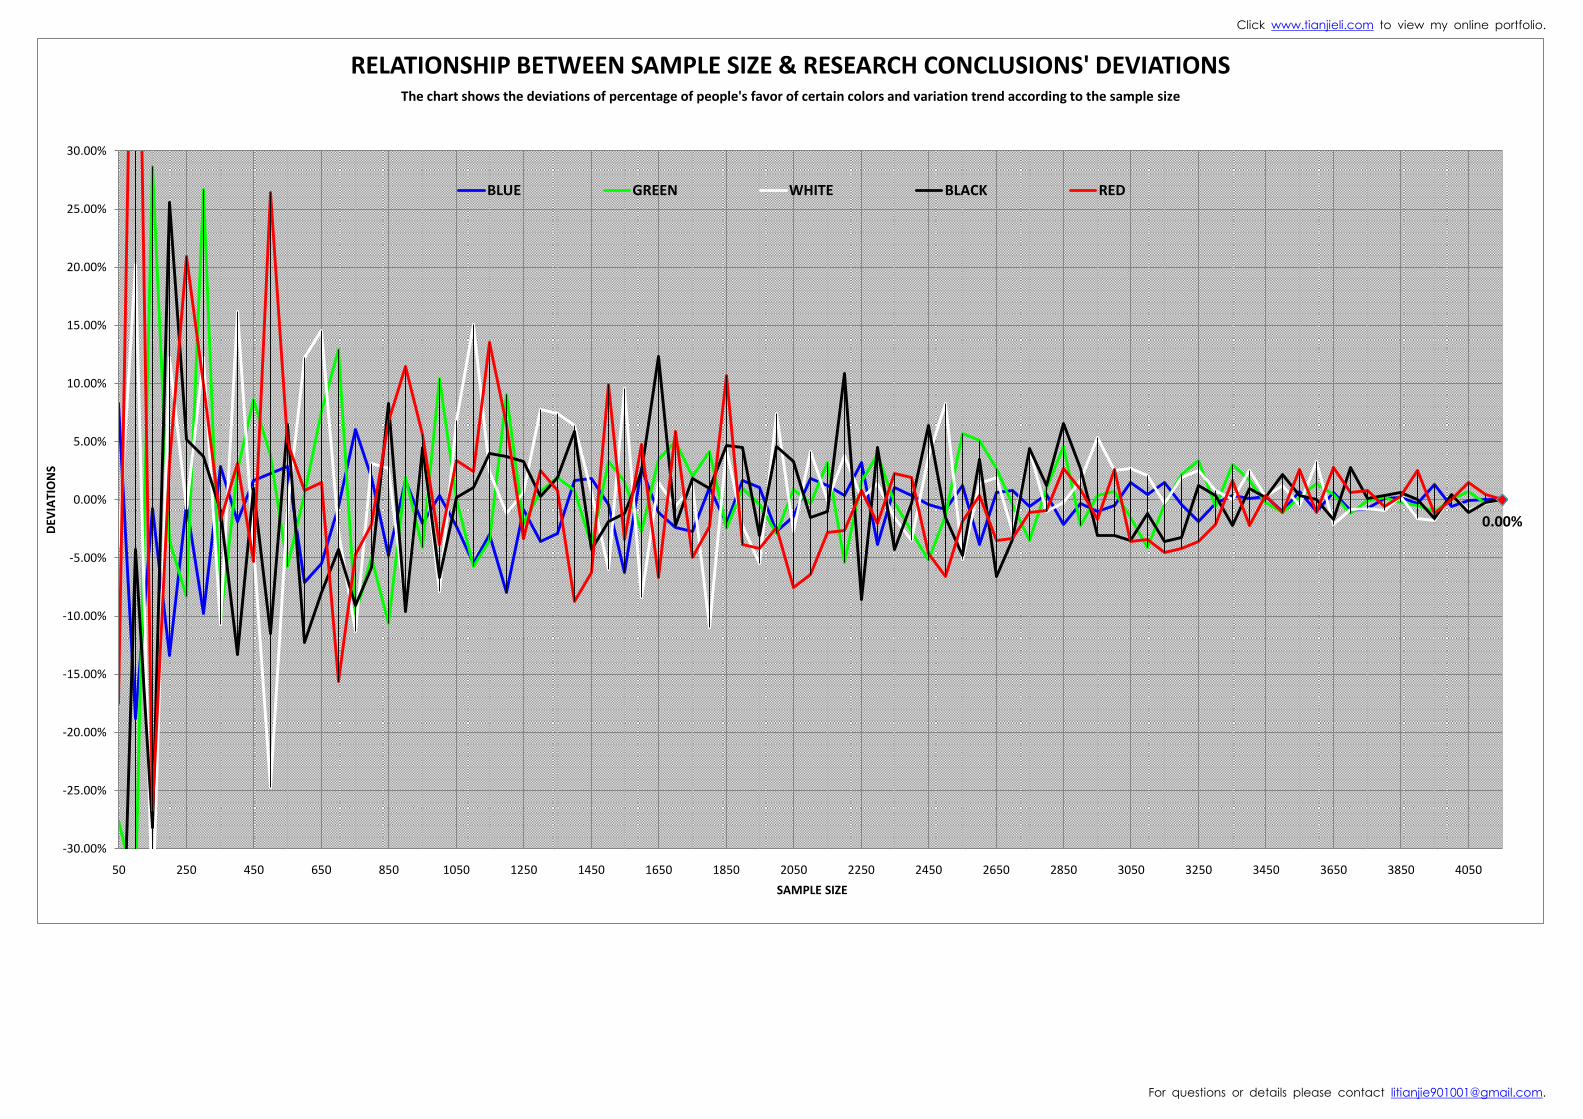
RELATIONSHIP BETWEEN SAMPLE SIZE & RESEARCH CONCLUSIONS' DEVIATIONS The chart shows the deviations of percentage of people's favor of certain colors and variation trend according to the sample size
BLUE GREEN WHITE BLACK RED
Recommended