Principles of Economics II
Lecture 5: The competitivelabour market modelFall 2021Mitri Kitti

Outline for this lecture
• Measuring unemployment
• Competitive labour market model and applications• Immigration, minimum wage
2

Measuring unemployment

The unemployed
The unemployed are the people who:• are not in paid employment or self-employment
• are available for work
• are actively seeking work
Definition of ILO• without a job, have been actively seeking work in the past four
weeks and are available to start work in the next two weeks
4

The labour market
5

The Finnish labour market in 2017
6
Population of working age (15–74y) : 4.1M
Labour force:2.7M
Employed:2.5M
Unemployed:230 000
Out of labourforce: 1.4M

Labour market statistics
Unemployment rate:• unemployed / labour force = 0.23M/2.7M = 8.5%
Employment rate:• employed / population of working age = 2.5M/4.1M = 61.0%
Participation rate:• labour force / population of working age = 2.7M/4.1M = 65.8%
7

Employment and unemployment
8Source: Economic Policy CouncilReport 2018

Flows between employment,unemployment and inactivity in 2017
9Source: Economic Policy CouncilReport 2018
In 2017, 65,000 unemployedpersons (28%) found a new jobwithin a typical 3 monthunemployment period
44,000 employed(1.5%) into
unemployed
Flows betweenemployment andinactivity are largerthan betweenemployment andunemployment
As are flows between inactivityand unemployment

Registered unemployed persons vs.Labour Force Survey
10Source: Economic Policy CouncilReport 2018

Unemployment benefits during pandemic
11Source: Helsinki GSE situation room. Situation room report 7.10.2021 - latest developments in the labormarket, households and firms – Helsinki GSE

Registered unemployed vs. LabourForce SurveyLabour Force Survey:
• A random sample from the Statistics Finland population database• The monthly sample consists of some 12,000 persons and the data are
collected with computer-assisted telephone interviews• Unemployed = respondent says (i) unemployed, (ii) has seeked a job within
the last four months and (iii) is willing to accept a job offer within twoweeks of the offer
Employment Service Statistics:• Jobseekers registered at the employment and economic development
offices• Unemployed = person registered as jobseeker who is not working over 4h a
week, is not a student, entrepreneur or pensioner• https://www.stat.fi/til/tyti/tyti_2016-08-23_men_001_en.html
12
A1

Slide 12
A1 kts. tutkimusblogi.kela.fi/arkisto/1504Author, 11.11.2021

Employment impact of parenthood
13Source: European Commission, Women in the Labour Market, (2015 data)

Employment impact of parenthood
14

Competitive labour marketmodel

Building blocks of the model
Firms maximise profits and are competitive both in the productmarket (seller) and the labour market (buyer)Labour demand: how many workers to hire at a given wage level
• Firms hire workers as long as workers’ marginal productivity ishigher than the wage level
• Diminishing marginal product => demand curve slopes down
Labour supply: how much workers are willing to work for agiven wage level
• Assume that as wage increases the willingness to work increases =>supply curve slopes up
16

Market equilibrium
17
w*
D
S
L*
Wag
e
Employment
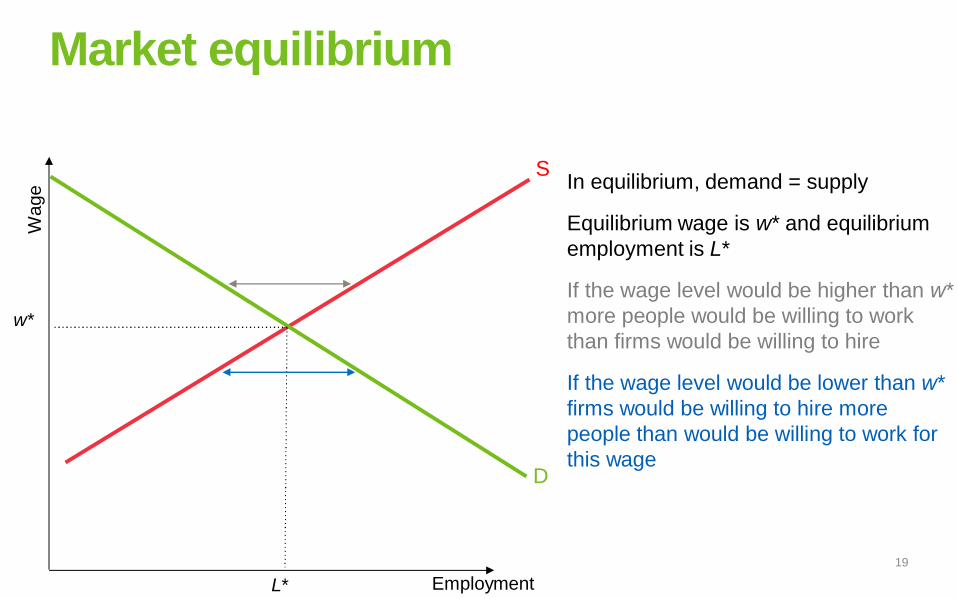
In equilibrium, demand = supply
Equilibrium wage is w* and equilibriumemployment is L*

Market equilibrium
18
w*
D
S
L*
Wag
e
Employment
In equilibrium, demand = supply
Equilibrium wage is w* and equilibriumemployment is L*
If the wage level would be higher than w*more people would be willing to workthan firms would be willing to hire
Market equilibrium
19
w*
D
S
L*
Wag
e
Employment
In equilibrium, demand = supply
Equilibrium wage is w* and equilibriumemployment is L*
If the wage level would be higher than w*more people would be willing to workthan firms would be willing to hire
If the wage level would be lower than w*firms would be willing to hire morepeople than would be willing to work forthis wage

Effect of immigration on wages andemployment
This is a simple model, but let’s use it to analyse someimportant and not so simple questions
• What happens to wages and employment when immigrationincreases?
• What about when a minimum wage is introduced?
20

Immigration
21
w*
L*
Wag
e
Employment
S
D
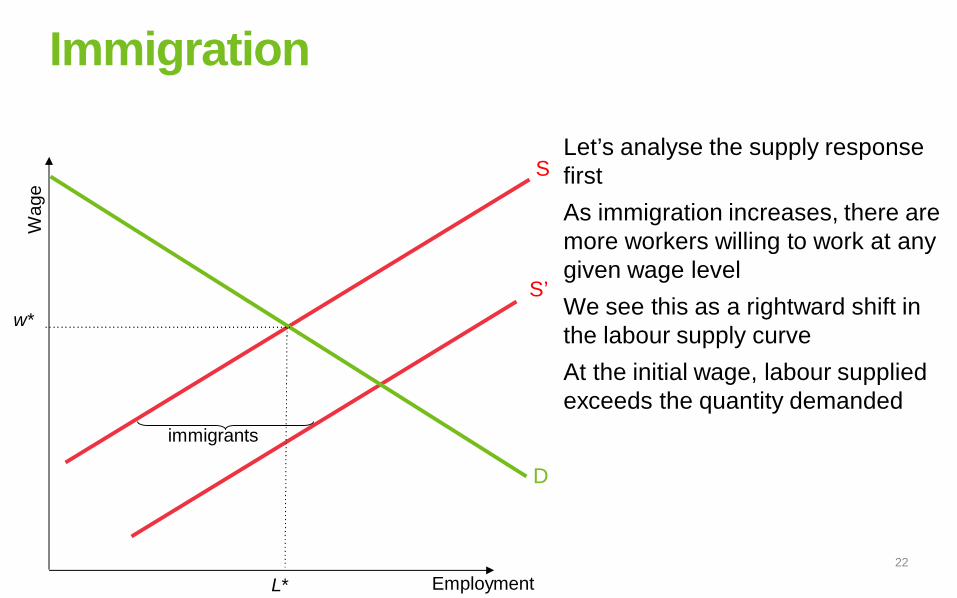
Let’s analyse the supply responsefirst
Immigration
22
w*
L*
Wag
e
immigrants
Employment
S
D
S’
Let’s analyse the supply responsefirstAs immigration increases, there aremore workers willing to work at anygiven wage levelWe see this as a rightward shift inthe labour supply curveAt the initial wage, labour suppliedexceeds the quantity demanded

Immigration
23
w*
L*
w’
L’
Wag
e
immigrants
new jobs
Employment
S
D
S’
Let’s analyse the supply responsefirstAs immigration increases, there aremore workers willing to work at anygiven wage levelWe see this as a rightward shift inthe labour supply curveAt the initial wage, labour suppliedexceeds the quantity demandedThis puts downward pressure onwage: w* => w’But the supply response is not thewhole story!

Immigration
24
w*
L*
w’
L’
Wag
e
L’’
S
D
S’
The new workers will of coursespend their moneyThey may become employers etc.This means that as a result labourdemand will also increaseWe see this as a rightward shift inthe labour demand curveIn the figure, immigration has noeffect on the wage level oremployment of the native workersWhat happens in the end, willdepend on the magnitude of thelabour demand shift
D’

Effect of immigration on wages andemployment
In a more general model we would have heterogeneity amongworkers
• Some native workers have more similar skills than immigrants(substitutes) => competition in the labour market increases
• For others, the immigrants are complements in terms of skills andtasks => for these natives wages and employment opportunitiesmay increase
The labour market effects of immigration will depend on• Are immigrants substitutes or complements?• How fast the economy will adjust to increased labour? 25

Empirical challenges
The causal question• For example, what is the average wage of a particular worker group
in Helsinki today when immigrant share is x, as oppose to the sharebeing y (the counterfactual)?
How can we construct a plausible counterfactual?• Experimental research designs difficult/impossible to come by =>
we need to compare labour markets with high and low immigration
26

Average income and immigrant share inFinnish municipalities
27
Is this sorting or due immigrantsreally increase the local wagelevel?
What would be an ideal researchdesign?

Natural experiments
Card (1990): Cuban mass immigration during the “Marielboatlift”
• On April 20, 1980, Fidel Castro declared that any Cuban wishing toemigrate to the US can do so from the port of Mariel
• From May to September, 125,000 immigrants arrived in Miami• Roughly 70 percent stayed permanently => a 7% increase in the
labour force and a 20% in the number of Cuban workers• Card finds virtually no effect on the wages or unemployment rates
of less-skilled workers, even among Cubans who had immigratedearlier
• Still ongoing debate28

29

30

Natural experimentsFriedberg (2001):
• Mass migration from the former Soviet Union into Israel had no effect orslightly increased Israeli wages and employment
Glitz (2012):• Mass migration to West Germany: Within 15 years, 2.8 million arrived and
these immigrants were exogenously allocated to different regions to ensurean even distribution across the country
• Lowered West German employment, but had no effect on wages
Bratsberg and Raaum (2012):• EU enlargement• Licensing requirements in the Norwegian construction sector: Easy to
enter some segments (e.g. electrical installation and plumbing companies)but not others (e.g. carpenter and painting firms)
• Lowered wages of construction workers who faced more competition 31

Immigration empirics recap
Immigration seems to have a moderate effect on native wagesand employment possibly due to
• Economy adjusts in many dimensions: employment, wages,industry structure, technology
• Some native groups may lose substantially, while many may gainmoderately
• The estimates are biased?
What about Finland?• Labour market effects likely to be small• Larger effects maybe through public finances and politics
32

Minimum wage
33
L*
w*
Wag
e
S
D
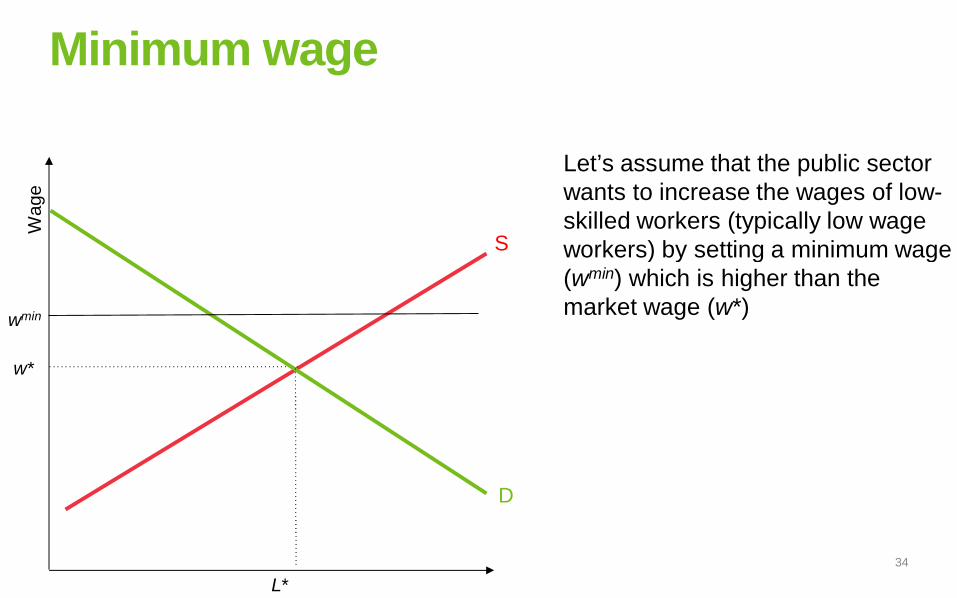
Let’s assume that the public sectorwants to increase the wages of low-skilled workers (typically low wageworkers) by setting a minimum wage(wmin) which is higher than themarket wage (w*)
Minimum wage
34
wmin
L*
w*
Wag
e
S
D
Let’s assume that the public sectorwants to increase the wages of low-skilled workers (typically low wageworkers) by setting a minimum wage(wmin) which is higher than themarket wage (w*)

Minimum wage
35
wmin
L*
w*
L’
Wag
e
L’’
S
D
Let’s assume that the public sectorwants to increase the wages of low-skilled workers (typically low wageworkers) by setting a minimum wage(wmin) which is higher than themarket wage (w*)At this new higher wage L’’ workersare willing to work, but firms are onlywilling to hire L’ workersThe result is a surplus orunemployment (at the higher wagelevel)
surplus

Empirical example: New Jerseyminimum wage increase
On April 1, 1992, NJ increased the stateminimum wage from $4.25 to $5.05; PA’sminimum wage stayed at $4.25Card & Krueger (1994) surveyed about400 fast food stores both in NJ and in PAbefore (February) and after (November)the minimum wage increaseResults: Surprisingly, employment rose inNew Jersey!In models where employers have marketpower in the labour market, this canhappenBut sufficiently large increases willdecrease employment in any model!
36

Newer results on minimum wage
Still an open question and also quite a heated debate• It seems that major employment effects are rarely found• At the same time, minimum wage reforms are often quite small• Large enough minimum wage hikes are going to lower employment
Incidence of the minimum wage is also an interesting question• If employment and hours are unaffected, do employers bear the
cost through lower profits or consumers through higher prices?• Harasztosi and Lindner (2019): In Hungary, small employment
effects and 75 percent of the minimum wage increase was paid byconsumers and 25 percent by firm owners
37

Minimum wage as a transfer program
If there are no employment effects, low-wage workers get atransfer from employers of low-wage workers
• Equivalent to an additional tax on the employers• Usually transfer programs are funded through the tax system so
that everyone chips in• Compare to rent control and landlords
If the employers can shift some of the burden into higher prices,the minimum wage is similar to a transfer to low-wage workersfunded by a tax on employers and a consumption tax onconsumers
38

Summary
• The model assumes that the labour market is simply a re-labelled product market with complete contracts
• Unrealistic, but is the model useful?• Yes! Real-world markets are typically not perfectly competitive, but
some policy problems can be analysed using this rather simpledemand and supply model
• You will see lots of more applications in future courses (especiallyin product markets)
• On the other hand, it is too simple for some markets andquestions
• Next we will turn to another labour market model39
Recommended