General rights Copyright and moral rights for the publications made accessible in the public portal are retained by the authors and/or other copyright owners and it is a condition of accessing publications that users recognise and abide by the legal requirements associated with these rights.
Users may download and print one copy of any publication from the public portal for the purpose of private study or research.
You may not further distribute the material or use it for any profit-making activity or commercial gain
You may freely distribute the URL identifying the publication in the public portal If you believe that this document breaches copyright please contact us providing details, and we will remove access to the work immediately and investigate your claim.
Downloaded from orbit.dtu.dk on: Jan 25, 2022
Numerical Simulation of the SrZrO3 Formation in Solid Oxide Fuel Cells
Cheng, Kaiming; Xu, Huixia; Zhang, Lijun; Du, Yong; Zhou, Jixue; Tang, Shouqiu; Chen, Ming
Published in:Journal of Electronic Materials
Link to article, DOI:10.1007/s11664-019-07236-0
Publication date:2019
Document VersionPeer reviewed version
Link back to DTU Orbit
Citation (APA):Cheng, K., Xu, H., Zhang, L., Du, Y., Zhou, J., Tang, S., & Chen, M. (2019). Numerical Simulation of the SrZrO3Formation in Solid Oxide Fuel Cells. Journal of Electronic Materials, 48(9), 5510-5515.https://doi.org/10.1007/s11664-019-07236-0

1
Numerical simulation of the SrZrO3 formation in solid oxide fuel cells
Kaiming Chenga,b,*, Huixia Xub,c, Lijun Zhangc, Yong Duc, Jixue Zhoua, Shouqiu Tanga, Ming
Chenb,*
a Shandong Provincial Key Laboratory for High Strength Lightweight Metallic Materials,
Advanced Materials Institute, Qilu University of Technology (Shandong Academy of Sciences),
Jinan 250014, China
b Department of Energy Conversion and Storage, Technical University of Denmark, Risø campus,
Roskilde 4000, Denmark
c State Key Laboratory of Powder Metallurgy, Central South University, Changsha 410083, China
* Corresponding author: [email protected] (M. Chen), [email protected] (K.M. Cheng)
Abstract
The Ce1−xGdxO2−δ (CGO) interlayer is a common reaction barrier layer employed in solid
oxide fuel cells (SOFCs), to prevent chemical reactions between the (La1−xSrx)(Co1−yFey)O3−δ
(LSCF) cathode and the Y2O3-stabilized ZrO2 (YSZ) electrolyte. However, even with the existence
of the CGO layer, formation of SrZrO3 (SZO) insulating phase can still take place, causing cell
degradation. Considering there have been already a large amount of experimental investigations
conducted on the above degradation phenomenon, the current work is attempting to numerically
model the process. A simplified numerical model of SZO formation at the YSZ-CGO interface is
constructed. Based on the thermodynamic information and diffusion kinetics of the YSZ-CGO-
LSCF system from the literature, the interdiffusion between YSZ and CGO, the Sr diffusion
through the CGO layer, and the formation of SZO at the YSZ-CGO interface are modelled,
reproducing the experimental data well. Limitations of the current modeling work are further
discussed.

2
Keywords: Solid oxide fuel cells; Cathode degradation; YSZ-CGO interdiffusion; SrZrO3
formation; Numerical simulation
1. Introduction
The iron- and cobalt-containing perovskites, i.e. (La1−xSrx)(Co1−yFey)O3−δ (LSCF), exhibit
high electronic and oxygen ion conductivity and have been shown as a high-performance cathode
material for solid oxide fuel cell (SOFC) applications at the so-called intermediate operating
temperatures between 600 °C and 800 °C [1]. Considering that LSCF perovskite can easily react
with the Y2O3-stabilized ZrO2 (YSZ) electrolyte at high temperature to form oxide ion insulators,
e.g. La2Zr2O7 and SrZrO3 (SZO) [2], an interlayer or so-called reaction barrier layer consisting of
Ce1−xGdxO2−δ (CGO) is normally required to avoid such hazardous interface reactions [3, 4].
However, even with a CGO interlayer, the SOFC cell degradation can still take place in the YSZ-
CGO-LSCF region, partly caused by the YSZ-CGO interdiffusion during sintering of the CGO
layer and SZO formation at the YSZ-CGO interface during cathode sintering and long-term cell
operation. Generally, the CGO interlayer should be as dense as possible to maximize its protective
effect as diffusion barrier, which on the other hand requires a higher sintering temperature,
resulting in a thicker YSZ-CGO inter-diffusion zone with low ionic conductivity [5, 6]. Therefore,
a tradeoff must be made between reducing YSZ-CGO interdiffusion during CGO layer sintering
and controlling SZO formation during cathode sintering and cell long-term operation, and the
selection of fabrication method and sintering temperature for the CGO interlayer is of particular
importance.
So far, a large number of experimental investigations have been conducted on the SZO

3
formation with different heat-treatment conditions for the CGO layer and several common findings
have been reported [6-15]. When CGO is sintered below 1200 ºC, sintering the LSCF cathode at
1100 ºC for 2 h results in a SZO layer covering the YSZ electrolyte surface entirely. When the
sintering temperature of the CGO interlayer is above 1300 ºC, the amount of SZO formed during
cathode sintering (at 1100 ºC for 2 h) decreases with increasing CGO sintering temperature and
the SZO grains tend to distribute dispersedly, i.e. not as a continuous layer [14]. However, in the
case of CGO sintered at 1300 ºC, with prolonging cathode sintering time up to 16 h, SZO can still
cover the YSZ electrolyte surface entirely as presented by Matsuda et al. [15]. With regard to cell
performance, latest studies [8, 13] further demonstrate that in the case of screen-printed CGO layer,
heat treatment of CGO at high temperature to reduce SZO formation can compensate the losses
caused by lower ionic conductivity of the YSZ-CGO interdiffusion zone. Considering the
extensive experimental results reported so far, it is of urgent need to perform theoretical analysis
in order to obtain deeper understanding of these phenomena and possibly help optimize the cell
fabrication process. The current work is thus devoted to reproducing the experimental results in
the frame of thermodynamic and kinetic modeling, with a focus on simulating formation and
growth of SZO at the YSZ-CGO interface.
2. Methodology
2.1. CALPHAD method
The basic idea for the CALculation of PHAse Diagram (CALPHAD) approach is to
describe the thermodynamic properties of each phase in a system with a mathematical model
containing adjustable parameters, which can be evaluated by optimizing the fit of the model to all
the experiential information. It is then possible to recalculate the phase diagram as well as the

4
thermodynamic properties of all the phases. [16]. The Compound Energy Formalism (CEF) [17]
is widely used in CALPHAD modeling, which is introduced to describe the Gibbs energy for all
the phases in the current YSZ-CGO-LSCF system. However, it is an extensive project to establish
the thermodynamic database for the complete Zr-Y-Ce-Gd-La-Sr-Co-Fe-O system, which is also
unnecessary for the current simulation. In the current work, the YSZ-CGO-LSCF system is
simplified to a model system as ZrO2-CeO2-SrO, taking into account the Zr and Ce interdiffusion
between YSZ and CGO, the Sr diffusion through the CGO layer, and the formation of SZO at the
YSZ-CGO interface.
2.2. Grain boundary diffusion model
The kinetic modeling is carried out using the Thermo-Calc & DICTRA software [18-20].
Thermo-Calc is a powerful tool for phase equilibrium calculations, whereas DICTRA is a software
package for simulation of diffusional reactions in multicomponent alloys. Thermal-Calc &
DICTRA together can reveal a good coupling between thermodynamic information and diffusion
kinetics, i.e. thermodynamic database and diffusion coefficients (atomic mobility). In the current
simulation, the grain boundary model in DICTRA [21-23] is employed to account for the
contribution of grain boundary diffusion in both of the YSZ and CGO region, to be consistent with
experimental observation. According to the model, the grain boundary diffusion is correlated to
the bulk diffusion by using the same frequency factor of 𝐷𝐷0𝑏𝑏𝑏𝑏𝑏𝑏𝑏𝑏, but a modified bulk activation
energy of 𝑄𝑄𝑏𝑏𝑏𝑏𝑏𝑏𝑏𝑏, as specified by the equation below,
𝐷𝐷𝑔𝑔𝑏𝑏 = 𝐷𝐷0𝑏𝑏𝑏𝑏𝑏𝑏𝑏𝑏 ∙ exp (𝐹𝐹 ∙𝑄𝑄𝑏𝑏𝑏𝑏𝑏𝑏𝑏𝑏
𝑅𝑅𝑅𝑅) (1)

5
where 𝐷𝐷𝑔𝑔𝑏𝑏 is the contribution of grain boundary diffusivity and 𝐹𝐹 is the bulk diffusion activation
energy multiplier. The total diffusivity including both bulk and grain boundary diffusion is then
formulated as:
𝐷𝐷𝑡𝑡𝑡𝑡𝑡𝑡𝑡𝑡𝑏𝑏 =𝛿𝛿𝑑𝑑∙ 𝐷𝐷𝑔𝑔𝑏𝑏 + (1 −
𝛿𝛿𝑑𝑑
) ∙ 𝐷𝐷𝑏𝑏𝑏𝑏𝑏𝑏𝑏𝑏 (2)
where 𝛿𝛿 and 𝑑𝑑 are the grain boundary thickness and the grain size, respectively.
3. Results and Discussion
3.1. Thermodynamic and diffusion kinetic data
Based on the above simplification, the CALPHAD-type modeling of phases that should be
included in the current thermodynamic database are cubic ZrO2 [24], CeO2 [24], SrO [25] and
SrZrO3 [26]. Attention should be drawn to the thermodynamic modeling of cubic ZrO2, where
cubic structure is not stable without the existence of Y2O3 in YSZ. In order to describe the cubic
ZrO2 phase in the current modeling, the metastable thermodynamic parameters of cubic phase in
the ZrO2-CeO2 system presented by Du et al. [24] is adopted. Besides, the thermodynamic
parameters for other phases are directly acquired form literature and no higher order parameter is
adjusted to the ZrO2-CeO2-SrO system. The available elemental bulk diffusion coefficients are
adopted from literature, including Ce in YSZ [27], Zr in YSZ [28], Sr in CGO [29] and Zr in SZO
[30]. Due to lack of experimental data, it is assumed in the current work that the diffusivities of Zr
and Ce in CGO are the same as those in YSZ.
3.2. Numerical modeling
6
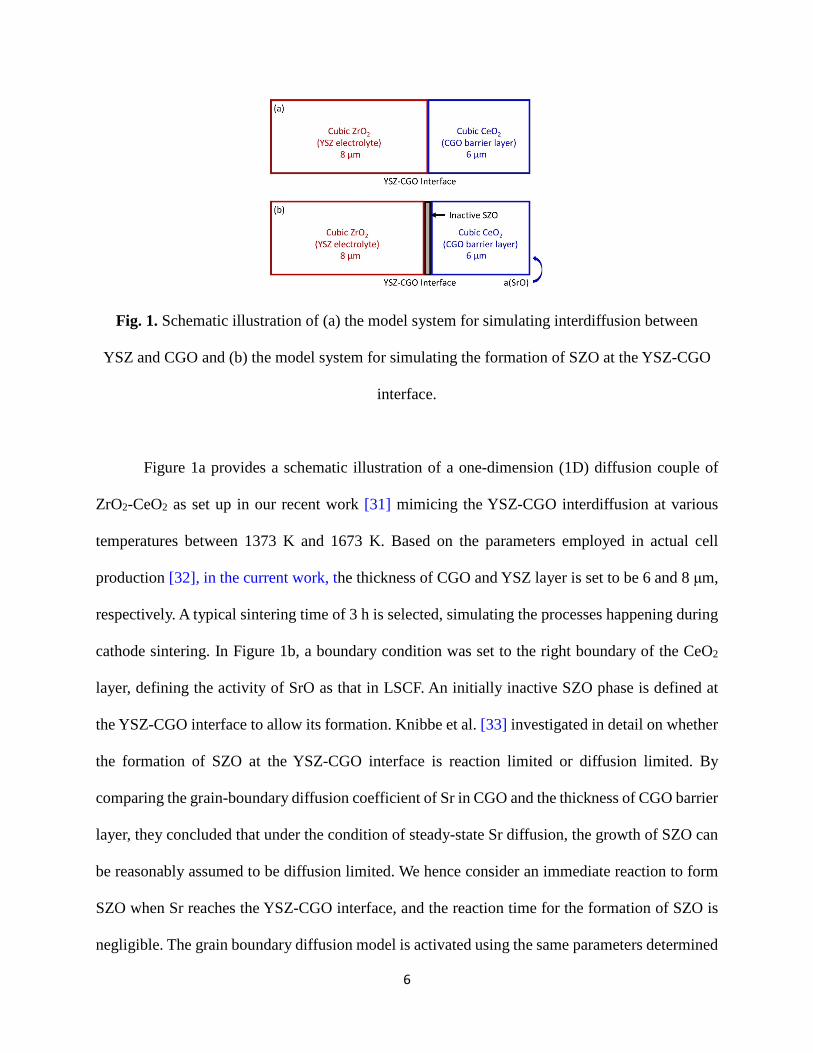
Fig. 1. Schematic illustration of (a) the model system for simulating interdiffusion between
YSZ and CGO and (b) the model system for simulating the formation of SZO at the YSZ-CGO
interface.
Figure 1a provides a schematic illustration of a one-dimension (1D) diffusion couple of
ZrO2-CeO2 as set up in our recent work [31] mimicing the YSZ-CGO interdiffusion at various
temperatures between 1373 K and 1673 K. Based on the parameters employed in actual cell
production [32], in the current work, the thickness of CGO and YSZ layer is set to be 6 and 8 μm,
respectively. A typical sintering time of 3 h is selected, simulating the processes happening during
cathode sintering. In Figure 1b, a boundary condition was set to the right boundary of the CeO2
layer, defining the activity of SrO as that in LSCF. An initially inactive SZO phase is defined at
the YSZ-CGO interface to allow its formation. Knibbe et al. [33] investigated in detail on whether
the formation of SZO at the YSZ-CGO interface is reaction limited or diffusion limited. By
comparing the grain-boundary diffusion coefficient of Sr in CGO and the thickness of CGO barrier
layer, they concluded that under the condition of steady-state Sr diffusion, the growth of SZO can
be reasonably assumed to be diffusion limited. We hence consider an immediate reaction to form
SZO when Sr reaches the YSZ-CGO interface, and the reaction time for the formation of SZO is
negligible. The grain boundary diffusion model is activated using the same parameters determined

7
as in our previous modeling work of the YSZ-CGO interdiffusion [31]. During kinetic simulation,
the CALPHAD-type thermodynamic database of the ZrO2-CeO2-SrO system is coupled to
DICTRA to guarantee the local thermodynamic equilibrium, while the diffusion flux and the
diffusion depth are determined by the elemental diffusivity.
3.3. Interdiffusion between YSZ and CGO
Fig. 2. Simulated composition profiles of the ZrO2-CeO2 diffusion couple sintered at 1373 K,
1523 K and 1673 K for 3 h using parameters from Xu et al. [31].
Considering our recent experimental and simulation work on the interdiffusion between
YSZ and CGO [31], the parameters of Eq. 2 in the current simulation are selected accordingly. It
should be mentioned that in our DICTRA simulation the grain size in the CGO layer is set to be
constant over time, but varies with temperature, 0.1 μm at 1373 K, 0.5 μm at 1523K and 1 μm at
1673K. These values are chosen based on the CGO layer microstructure after sintering as presented

8
in [8]. Fig. 2 plots the simulated composition profiles at different heat treatment temperatures for
3 h. It should be noticed that the x axis applied in Fig. 2 focuses only on a small region at the ZrO2-
CeO2 interface, where the interdiffusion zone can be detected. It can be seen that the element
diffusion in the CeO2 layer is faster than that in the ZrO2 layer, and the interdiffusion zone becomes
thicker with increasing temperature as expected. The composition jump at the ZrO2-CeO2 interface
is a result of the miscibility gap existing in the ZrO2-CeO2 system.
3.4. Growth of SZO at the YSZ-CGO interface
Fig. 3. Calculated (a) ZrO2-CeO2-SrO isothermal section at 1373 K and (b) an enlargement in
the composition range of 0 ~ 10 at.% SrO.
Figure 3 shows the calculated metastable phase diagram of the ZrO2-CeO2-SrO isothermal
section at 1373 K from the current work and an enlargement in the composition range of 0-10 mol %
SrO. The initial composition of each end-member in the current simulation (i.e. ZrO2 and CeO2)
lies in the cubic ZrO2 and CeO2 single phase region, respectively. A boundary condition was set to
the right boundary of the CeO2 layer, defining the activity of SrO as that in LSCF. From a
9
thermodynamic point of view, as the amount of Sr increases, the overall composition of the entire
diffusion couple can reach to a point located inside the ZrO2 + SrO + SrZrO3 three-phase region.
The inactive SrZrO3 layer set initially at the YSZ-CGO interface can then be activated to form and
grow with time. The sintering temperature and time in the current simulation (simulating cathode
sintering) are 1373 K and 3 h, respectively. In order to describe the grain boundary diffusion, the
same set of parameters for simulating the YSZ-CGO interdiffusion are used. For simplification,
the current simulation is performed at 1373K only, which does not include the process where the
YSZ-CGO bilayer is first sintered at high temperature. However, in order to reveal the dependence
of SZO formation on the heat-treatment temperature of the CGO layer, different CGO grain sizes
of 0.1 μm, 0.5 μm and 1 μm are introduced to represent the microstructure change after the YSZ-
CGO interdiffusion at 1373K, 1523K and 1673K. The difference in grain size can then affect both
the Sr diffusion across CGO layer and the growth of SZO at the YSZ-CGO interface.
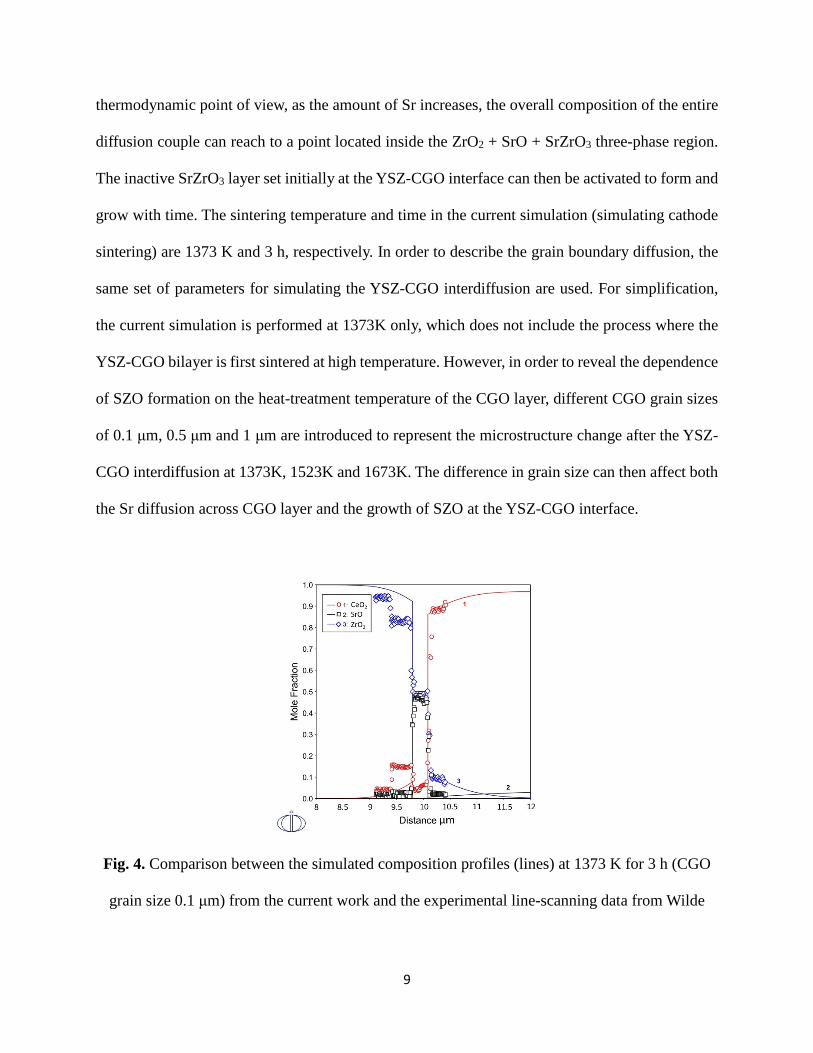
Fig. 4. Comparison between the simulated composition profiles (lines) at 1373 K for 3 h (CGO
grain size 0.1 μm) from the current work and the experimental line-scanning data from Wilde

10
et al. [8] (symbols).
Fig. 5. Comparison between the simulated composition profiles (lines) at 1373 K for 3 h (CGO
grain size 0.5 μm) from the current work and the experimental line-scanning data from Wilde
et al. [8] (symbols).
Fig. 6. Comparison between the simulated composition profiles (lines) at 1373 K for 3 h (CGO
grain size 1 μm) from the current work and the experimental line-scanning data from Wilde et
al. [8] (symbols).

11
Fig. 7. Calculated SZO layer thickness vs. time for CGO layers sintered at different
temperatures.
Figures 4-6 present the simulated composition profiles in comparison with the
experimental line-scanning data [8]. The current simulation can only handle formation of a
continuous thin SZO layer at the YSZ-CGO interface as observed by Wilde et al. [8], but not
possible to model appearance of dispersed SZO reported previously [6-15]. The simulated SZO
layer thickness decreases with increasing the grain size in the CGO region, indicating that the
ability of the CGO layer as Sr diffusion barrier is enhanced when increasing CGO sintering
temperature. Fig. 7 shows a plot of the SZO layer thickness vs. time under different conditions. It
can be seen that the growth rate of SZO decreases with increasing the CGO sintering temperature,
i.e. the higher the CGO sintering temperature, the larger the CGO grain size, the less the Sr
diffusion via grain boundaries. For the same reason, the starting point for the first appearance of
SZO (as l(SZO) = 10 nm) is postponed with increasing the CGO sintering temperature, as shown
in Fig. 7. It is, however, interesting to notice that a linear relationship exists between the thickness
of the formed SZO layer and time in such a diffusion-controlled situation. This indicates that the
limiting factor for the growth of SZO is the amount of Sr diffuse through the CGO region, which

12
is a constant due to the existence of the CGO diffusion barrier layer.
Summary
The formation of a SZO thin layer at the YSZ-CGO interface is numerically modeled in
the current work. The YSZ-CGO-LSCF system is simplified to ZrO2-CeO2-SrO, taking into
account the Zr and Ce interdiffusion, the transportation of Sr and formation of SZO. The simulation
of the SZO formation and growth at the YSZ-CGO interface is then performed with further
simplifications. No temperature- or time-evolution of the grain size is considered in this work.
However, different grain size in the CGO layer is introduced to represent the effect of CGO
sintering temperature on the formation of SZO. Simplification is also made by considering the
YSZ-CGO interdiffusion only during the cathode sintering, not during the CGO layer sintering.
Further assumption is made to ignore the dispersed distribution of SZO grains, but to consider a
continuous thin layer of SZO. However, even with the simplifications mentioned above, the current
simulation result can still qualitatively describe the SZO formation and reproduce some of the
experimental data well. Further improvement on the model is needed to be able to quantitatively
predict the YSZ-CGO interdiffusion and SZO formation and optimize the sintering parameters
based on the results.
Acknowledgement
The support from National Natural Science Foundation of China (Grant No. 51801116),
Natural Science Foundation of Shandong Province (No. ZR2017BEM022) and Youth Fund of
Shandong Academy of Sciences (2018QN0032) is acknowledged. This work is further supported
by European Horizon 2020 - Research and Innovation Framework Programme (H2020-JTI-FCH-

13
2015-1) under grant agreement n°735918 (INSIGHT project).
References
[1] A. Mai, V.A.C. Haanappel, S. Uhlenbruck, F. Tietz, and D. Stöver, Solid State Ionics 176, 1341
(2005).
[2] H.Y. Tu, Y. Takeda, N. Imanishi, and O. Yamamoto, Solid State Ionics 117, 277 (1999).
[3] H. Uchida, S. Arisaka, and M. Watanabe, Electrochem. Solid State Lett. 2, 428 (1999).
[4] A. Tsoga, A. Gupta, A. Naoumidis, and P. Nikolopoulos, Acta mater. 48, 4709 (2000).
[5] T. Horita, N. Sakai, H. Yokokawa, M. Dokiya, T. Kawada, J.V. Herle, and K. Sasaki, J.
Electroceramics 1, 15 (1997).
[6] A. Mai, V.A.C. Haanappel, F. Tietz, and D. Stöver, Solid State Ionics 177, 2103 (2006).
[7] A. Tsoga, A. Gupta, A. Naoumidis, D. Skarmoutsos, and P. Nikolopoulos, Ionics 4, 234 (1998).
[8] V. Wilde, H. Störmer, J. Szász, F. Wankmüller, E. Ivers-Tiffée, and D. Gerthsen, ACS Appl.
Energy Mater. (2018) DOI: 10.1021/acsaem.8b00847.
[9] N. Jordan, W. Assenmacher, S. Uhlenbruck, V.A.C. Haanappel, H.P. Buchkremer, D. Stöver,
and W. Mader, Solid State Ionics 179, 919 (2008).
[10] S. Uhlenbruck, T. Moskalewicz, N. Jordan, H.-J. Penkalla, and H.P. Buchkremer, Solid State
Ionics 180, 418 (2009).
[11] F. Wang, M. Nishi, M.E. Brito, H. Kishimoto, K. Yamaji, H. Yokokawa, and T. Horita, J.
Power Sources 258, 281 (2014).
[12] R. Kiebach, W. Zhang, W. Zhang, M. Chen, K. Norrman, H.-J. Wang, J.R. Bowen, R. Barfod,
and P.V. Hendriksen, J. Power Sources 283, 151 (2015).
[13] J. Szasz, F. Wankmüller, V. Wilde, H. Störmer, D. Gerthsen, N.H. Menzler, and E. Ivers-Tiffée,

14
ECS Trans. 68, 763 (2015).
[14] F. Wankmüller, J. Szasz, J. Joos, V. Wilde, H. Störmer, D. Gerthsen, and E. Ivers-Tiffée, J.
Power Sources 360, 399 (2017).
[15] J. Matsuda, S. Kanae, T. Kawabata, J.-T. Chou, Y. Inoue, S. Taniguchi, and K. Sasaki, ECS
Trans. 78, 993 (2017).
[16] H. Lukas, S.G. Fries, and B. Sundman, Computational Thermodynamics: The Calphad
Method, Cambridge University Press, New York (2007).
[17] M. Hillert, J. Alloys Compd. 320, 161 (2001).
[18] J.-O. Andersson, T. Helander, L. Höglund, P. Shi, and B. Sundman, CALPHAD 26, 273 (2002).
[19] J.-O. Andersson and J. Ågren, J. Appl. Phys. 72, 1350 (1992).
[20] A. Borgenstam, A. Engström, L. Höglund, and J. Ågren, J. Phase Equilib. 21, 269 (2000).
[21] S. Hallström, L. Höglund, and J. Ågren, Acta Mater. 59, 53 (2011).
[22] N. Ta, L. Zhang, Q. Li, Z. Lu, and Y. Lin, Corros. Sci. 139 (2018) 355–369.
[23] N. Ta, M. Chen, L. Zhang, C. Chatzichristodoulou, W. Chen, P. V. Hendriksen, and Y. Du, J.
Membrane Sci. 548, 526 (2017).
[24] Y. Du, M. Yashima, T. Koura. M. Kakihana, and M. Yoshimura, Scr. Mater. 31, 327 (1994).
[25] D. Risold, B. Hallstedt, and L.J. Gauckler, CALPHAD 20, 353 (1996).
[26] W. Gong, T. Chen, Y. Liu, D. Li, Z. Jin, and B. Huang, Trans. Nonferrous Met. SOC. China
17, 739 (2007).
[27] M. Kilo, G. Borchardt, B. Lesage, O. KaõÈtasov, S. Weber, and S. Scherrer, J. Eur. Ceram.
Soc. 20, 2069 (2000).
[28] V.M. Bekale, A.M. Huntz, C. Legros, G. Sattonnay, and F. Jomard, Philos. Mag. 88, 1 (2008).
[29] M. Izuki, M.E. Brito, K. Yamaji, H. Kishimoto, D.-H. Cho, T. Shimonosono, T. Horita, and

15
H. Yokokawa, J. Power Sources 196, 7232 (2011).
[30] R. Sažinas, I. Sakaguchi, M.-A. Einarsrud and T. Grande, Inorganics 6, 14 (2018).
[31] H. Xu, M. Chen, K. Cheng, L. Zhang, K. Brodersen and Y. Du, (2019) unpublished.
[32] A. Hauch, K. Brodersen, M. Chen and M.B. Mogensen, Solid State Ionics 293, 27 (2016).
[33] R. Knibbe, J. Hjelm, M. Menon, N. Pryds, M. Søgaard, H. Wang and K. Neufeld, J. Am.
Ceram. Soc. 93, 2877 (2010).
Recommended