NCHRP12-116 PROPOSED AASHTO SPECIFICATIONS FOR DESIGN
OF PILES FOR DOWNDRAG
Prepared for
National Cooperative Highway Research Program
Transportation Research Board
of
The National Academies of Sciences, Engineering, and Medicine
for Period
July to September 2019
Kyle Rollins Brigham Young University
Provo, Utah November 2019
TRANSPORTATION RESEARCH BOARD OF THE NATIONAL ACADEMIES OF SCIENCES,
ENGINEERING AND MEDICINE PRIVILEGED DOCUMENT
This document not released for publication, is furnished only for
review to members of or participants in the work CRP. This document is to be regarded as privileged, and dissemination of the
information included herein must be approved by CRP.
Permission to use any unoriginal material is pending from copyright holders
NCHRP

NCHRP12-116 Proposed AASHTO Specifications for Design of Piles for Downdrag
Task 1. Literature Survey
1.1 Studies on single piles in compressible clays
Negative skin friction is side resistance mobilized as the adjacent soil moves downward
relative to a pile. Drag force (or drag load) is the axial compressive force that develops within a
pile due to negative skin friction. Testing of full-scale instrumented piles to study the magnitude
and development of negative skin friction dates back to the 1960s and early 1970s. Fellenius (2006)
presented details of many early studies and summarized their important findings.
Bjerrum and Johannessen (1965) monitored single, steel piles driven in clay in Norway and
were the first to show the development of a neutral plane—that is, the location along the pile where
the load applied to the pile head plus the accumulated negative skin friction is in equilibrium with
the positive resistance below (shaft and toe resistances). The neutral plane development was
confirmed by Bjerrum et al. (1969), Endo et al. (1969), Fellenius and Broms (1969), Fellenius
(1972), and Fellenius (1998).
Figure 1-1 shows the distributions of forces and settlement with depth from data published by
Endo et al. (1969) based on in three test piles in clay after 672 days of soil settlement. Combining
the test data of distributions of axial pile force and of settlement with depth, shows that the depth
of the neutral place, the force equilibrium, is also the depth where the settlement of the pile is the
same as the settlement of the soil, the settlement equilibrium. The latter governs the settlement of
the pile head, i.e., the settlement of the foundation supported by the pile. This means that when
determining the neutral plane from an analysis of force distribution and correlating this to a
settlement analysis, the settlement of the pile head (downdrag) introduced by the settling soil
(general subsidence) can be established. Adding sustained load to the pile head will eventually
reduce the depth to the neutral plane and vice versa. All other conditions being identical, a stiffer
toe response will increase and a softer response will reduce the depth to the neutral plane. A change
in the depth of the neutral plane will only moderately affect the maximum axial load in the pile.
The pile-toe force-displacement response is a critical factor aspect for calculating the pile
settlement resulting from drag force.
NCHRP

Fig. 1-1. Distribution of force in the three full-length test piles and of soil
settlement 672 days after start [Data from Endo et al. (1969)].
Bozozuk and Labrecque (1969), Bozozuk (1970; 1972; 1981), and Bozozuk et al. (1972)
reported long-term measurements on a 49 m long, 320 mm diameter, closed-toe floating, pipe pile
installed in Berthierville, Quebec, Canada. Following placement of a highway fill embankment,
the test pile was driven through the fill embankment and into the native clay. The axial forces were
monitored for ten years after driving and a static loading test was then performed. Over time,
negative skin friction developed from the ground surface to the neutral plane and positive friction
developed below the neutral plane as shown in Figure 1-2. Following the application of static load
at the pile head, positive skin friction developed from the ground surface downward until pile
failure occurred. Thus, the development of negative skin friction did not reduce the compressive
geotechnical resistance of the pile.
Interpretation of the data prior to the static load test indicated that the shaft resistance was
governed by effective stress, that the accumulated negative skin friction was equal in magnitude
to the accumulated positive shaft resistance and mobilized toe resistance (which was small), and
that the shaft resistance was a function of the horizontal stress. Furthermore, the mobilization of
shaft shear occurred as a result of only about 4 mm (or 0.15 in) movement between the pile and
the surrounding soil. Following static loading, the positive skin friction above the original neutral
plane was approximately equal in magnitude to the negative skin friction that had previously
developed in this zone.
0
5
10
15
20
25
30
35
40
45
50
0 1,000 2,000 3,000 4,000
DEP
TH (
m)
LOAD (kN)
0
5
10
15
20
25
30
35
40
45
50
0 50 100 150 200SETTLEMENT (mm)
Closed-toePiles: Inclined and Vertical
Open-toePile
SandySilt
Clay
SoilClosed-toe Vertical Pile
NEUTRAL PLANE
Toe Penetration
Sand
Silt
NCHRP

Fig. 1-2. Load distribution in test pile at various levels of applied load (from Bozozuk 1981).
Rollins and Sears (2008) measured drag force in 40 cm (16 in) OD steel pipe piles at two
bridge abutments in Salt Lake City, Utah prior to fill placement, during fill placement and
consolidation settlement, and during subsequent construction of the bridge superstructure. The
piles were driven through 15 to 18 m (48 to 60 ft.) of compressible clays and into a silty sand
bearing layer. Negative friction developed in both test piles as a result of consolidation settlement.
In one case, structural loads from the bridge superstructure were applied to the piles prior to the
completion of consolidation settlement. As structural dead loads were applied, drag force
decreased to some extent, due to the development of positive friction from the pile head downward.
However, within a short time, the continuing consolidation settlement brought the drag force back
to about its original value and increased the total pile load at the neutral plane by the amount of
the applied pile head load. In the other case, structural loads from the bridge were applied to the
pile after the completion of consolidation settlement. Once again, positive skin friction developed
from the pile head downward but the increase in pile load at the neutral plane was only about 50%
of the applied dead load as shown in Figure 1-3. Pile load at the neutral plane increased very little
over 400 days of observation following completion of the bridge. Unfortunately, static load tests
NCHRP

and ground settlement versus depth profiles were not obtained for these abutment pile tests.
Walker et al. (1973) installed two 760 mm diameter, 22 m long, open-toe pipe piles into an
interbedded sand, silt, and gravel profile. One of the test piles was coated with bitumen along its
entire length. After completion of pile driving, fill was placed in the area of the two piles. Over
the next 238 days, a large drag force developed in the uncoated pile due to settlement induced by
the fill. In contrast, the coated pile attracted insignificant negative drag force. The ground
settlement measured at the ground surface was only about 25 mm (1 inch) during the monitoring
period. The pile head settlement was small and corresponded to the compression of the pile due to
the axial load.
Fig. 1-3. Axial load distribution in bridge abutment pile following consolidation settlement from approach fill placement and subsequent application of dead load from construction of bridge superstructure. Positive skin friction develops from the pile head downward during dead load application after completion of primarily consolidation settlement (Rollins and Sears, 2008).
NCHRP

Since the 1960’s and early 1970’s, many other studies have been published addressing the
development of negative skin friction on single piles in settling ground due to a variety of causes
(Garlanger 1974, Auvinet and Hanell 1981, Clemente 1979; 1981, Keenan and Bozozuk (1985),
Leung et al. 1991, Indraratna et al. 1992, Rollins and Strand 2006, Vijayaruban et al. 2015, Fellenius
et al. 2015, Muhunthan et al. 2017, Elvis 2018). Only a few studies involve piles without an
obvious cause for ground subsidence. Fellenius (2001) presented an analysis of instrumented bored
piles that were dynamically tested and illustrated the presence of drag force. Altaee et al. (1992)
instrumented a precast concrete pile that exhibited substantial drag force due to the effects of
installation. Siegel and McGillivray (2009) monitored a single cast-in-place pile in Rincon,
Georgia, USA with zero load applied to the pile head and no external cause of ground settlement
and determined that negative skin friction fully mobilized over a period of 58 days from
installation. Vipulanandan et al. (2007) monitored strain in a cast-in-place pile in dense sand for a
time period of 7 days after installation at a site in Texas USA and observed compressive strain
increasing with depth with zero load at the pile head.
Okabe (1977) monitored strain-gage instrumented, 600 mm diameter, 43 m long, pipe piles
driven through silty clay and silt with silty sand. A fill was placed on the ground over a vast area
of the site and pumping of water at depth lowered the pore pressures at depth. The axial force
distribution in one single pile increased continually and a neutral plane developed at about 40 m
depth. After the first 3 months, the maximum drag force was about 4,000 kN and after 4.5 years,
the maximum force had increased to about 7,000 kN. An identical second test pile was also
monitored and showed a similar response. However, after 1.5 years, a 700 kN load was applied to
the pile head and after an additional two months, the applied load was raised to 1,700 kN. Both
load applications reduced the drag force at first, but it re-developed over the next 2 months. The
final depth to the neutral plane was 30 m and the maximum drag force was 3,000 kN.
Fellenius (1988) identified changes in effective stress during reconsolidation of the soil after
pile construction as a possible cause of negative skin friction development. Fellenius (1969),
Leung at al. (1991), and Leifer (1992) showed that a transient (live) load will not coexist with a
drag force.
While much of the drag force research and associated literature focuses on measured drag
force on single vertical piles in settling ground, attention has also been given to other fundamental
pile response (Nishi and Esahi 1982, Burland and Starke 1994, Lam et al. 2013, Lucarelli et al.
NCHRP

2014, Tan and Fellenius 2016, Siegel and Lucarelli 2017), and specifically, inclined piles
(Takahashi 1985, Sawaguchi 1989, Davisson 1993, and pile groups (Lee et al. 2001; 2002,
Fellenius 2017).
In summary, the results of the many field tests show that negative skin friction on single piles
can accumulate to a very large drag force, that the distribution of negative skin friction is
proportional to the effective stress, and that the relative movement between pile and soil required
to fully mobilize shaft resistance can be insignificantly small. For example, substantial drag force
was observed where the ground surface settlement rate was as little as 1 to 2 mm (0.04 to 0.08 in)
per year.
1.2 Studies on pile groups in compressible clays
Okabe (1977) also monitored the force development of four piles in a pile group comprised
of 38 piles placed in an octagonal formation. All piles were connected with a concrete raft about
300-mm thick. No load was applied to the raft. The weight of the raft was almost 8,000 kN, that
is, about 200 kN/pile. The pile spacing was 1.7 pile diameter and the footprint ratio was 22%. The
free distance between the piles was about the same value as the raft thickness. One of the four
monitored piles was along the perimeter and the other three were interior piles. Figure 1-4 shows
the layout of the pile group and the axial force distributions measured in the monitored piles
after 1,040 days.
The response of the perimeter pile was very similar to that of an adjacent single pile. Because
the raft prevented the pile from being dragged down by the soil subsidence, a tensile force of
about 600 kN developed at the pile head, which lowered the neutral plane causing the entire length
of the perimeter piles to be affected by negative skin friction.
The axial load distribution for the interior piles was neither affected by negative skin friction
nor positive shaft resistance; the pile head load went unaltered to the pile toe region. The 14
perimeter piles did not support the weight of the raft but actually added load to the 24 interior piles.
Note that the pile head load measured for the interior piles was about 600 kN/pile as opposed to
the about 200 kN/pile weight of the raft. The reason for the difference was that the interior piles
had to resist the load portion of the 14 perimeter piles as well as the tension force due to drag force.
NCHRP

Fig. 1-4. Layout of pile group and distribution of axial force in the four test piles and in a single test pile away from the group. (After Okabe 1977)
Russo and Viggiani (1995) and Mandolini et al. (2005) monitored forces in perimeter and
interior piles of a group of 144 piles mandrel-driven, then concrete-filled, steel pipe piles, 406-mm
diameter, 48 m long, uniformly distributed in a 10.6 m by 19.0 m raft in a rectangular configuration
supporting a bridge abutment during and following construction of a cable-stayed bridge over the
Garigliano River in Southern Italy; constructed in 1991-94. The soil profile consisted of about 10
m of clay on about 10 m of dense sand underlain by soft clay deposited at about 48 m depth on a
very dense sand and gravel bed. The pile c/c distance was 1.2 m (3.0 pile diameters). The footprint
ratio was 9%. The clay was undergoing small regional subsidence. Figure 1-5 shows the load
distributions in corner, side, and interior piles during and after the construction. At the end of the
500-day construction period, the interior piles resisted 60% of the attributed to the corner piles.
After the bridge had been constructed, two trends in the distribution of pile loads can be seen: the
load on the interior piles increased and the load on the corner and side piles decreased, while the
total load on all of the piles increased by 10%. After completion of construction, the regional
subsidence developed negative skin friction along the perimeter piles, causing their response to
the raft load to become less stiff, thus, reducing their ability to take on load from the raft. The load
on the corner piles reduced significantly and the load on the side piles reduced slightly, while the
load on the interior increased as the load was transferred to the interior piles. Moreover, the
increase is also due to accumulated negative skin friction (drag force) on the perimeter piles that
added load to the total load on the raft, which was then supported by the interior piles.
0
10
20
30
40
50
-1,000 0 1,000 2,000 3,000 4,000 5,000
DEP
TH (
m)
LOAD (kN)
Interior piles
Perimeter pile
Single pile installed away from group
Perimeter pile with loads shifted to same load at start as the others
Actual Working load for the 24 interior piles
Monitored Perimeter Pile;N.B., connectedto the raft
9.4 m
10.6
m
1.5
m
1.5 m 0.7 m
Monitored Interior Piles
Pulling force for the 14 perimeter piles
NCHRP

Fig. 1-5. Measured axial load during and after construction (data from Russo and Viggiani 1995).
Inoue et al. (1969) presented a case history of monitoring settlement of a three-story building
with a plan dimensions of 15 m by 100 m founded on 500 mm diameter open-toe pipe piles driven
through sand and silty clay to bearing within a sand layer at about 35 m below the ground surface.
The piles had more than adequate geotechnical resistance to support the building. Two years after
construction, about 150 mm of differential settlement across the pile foundation was noticed to
have occurred. Measurements during the following two years showed about 200 mm additional
settlement. The settlement was downdrag due to pumping of water in the bearing soil below the
neutral plane. The building could not be repaired but had to be demolished.
Luna et al. (2015) instrumented and monitored rock-socketed micropiles that were installed
in a circular group of ten per cap for an elevated roadway in mountainous terrain in eastern
Tennessee USA. The results showed drag force within a year after installation. Budge and
Dasenbrock (2011) and Budge et al. (2015) monitored instrumented piles at five sites in Minnesota
USA including in-service piles within a group. Negative skin friction and a distinct neutral plane
developed at several of the Minnesota test sites.
1.3 Applying the information to piled foundation design in compressible clays
On the basis of long-term pile monitoring data, Fellenius (1984; 1988) concluded that
essentially all piles will progress toward equilibrium where the sustained applied load, if present,
0
200
400
600
800
0 100 200 300 400 500 600 700 800
AXIA
L LO
AD (k
N/p
ile)
TIME AFTER CONSTRUCTION START (days)
CORNERSIDE
INTERIOREnd of Construction
NCHRP

and the cumulative negative skin friction (i.e., drag force) will act downward and be opposed by
the positive shaft resistance and mobilized toe resistance.
Fellenius (1984; 1988; 2004; 2006; 2017; 2018; 2019) developed a method for design analysis
of single pile and small pile groups called the Unified Method. The method correlates the force
and settlement distributions and the force-movement response of the pile toe to determine the depth
to the neutral plane. The method makes use of the dependency of force equilibrium on the toe force
and the dependency of settlement equilibrium on the toe movement. The location of the neutral
plane is iteratively adjusted until the pile head load and drag force are in equilibrium with the
positive friction and mobilized end-bearing. In addition, the settlement of the pile toe, based on
the neutral plane settlement, must be consistent with the movement necessary to develop the
required toe resistance for force equilibrium.
The Unified method is illustrated in Figure 1-6. The force distribution graph shows the
development of axial force in the pile at three events: (1) after pile installation just before the
supported structure has been placed on the pile applying a sustained load, and (2) just after
completion of the supported structure, and (3) the long-term distribution.
The settlement graph shows the distribution soil settlement (N.B., settlement below the pile
toe level is not shown). The graph also shows the pile toe penetration for the pile-toe force
indicated in the first graph and as a function of the pile-toe load-movement relation shown below
the graph. The distribution of pile settlement is shown with the pile compression for the axial load
added to the pile-toe penetration. When the pile-toe force in the load-distribution diagram matches
the pile-toe penetration in the settlement diagram per the particular q-z function for the pile toe,
the neutral plane determined as force or by settlement equilibrium will be at the same depth and
the loop shown as a dashed line will have closed. The q-z function is the pile-toe load-movement
response as determined experimentally in a static loading test or by a theoretical analysis pertinent
to the pile and site.
The two-graphs in Figure 1-6 demonstrates that a stiffer pile response corresponds to a small
pile settlement, while conversely, the softer the pile response (notably the pile toe response) results
in a larger the pile settlement. It is obvious that whether a pile is acceptable or not acceptable as a
foundation unit depends on the settlement response, not on the magnitude of maximum axial
force—provided that the maximum axial force can still be accepted structurally by the pile.
NCHRP
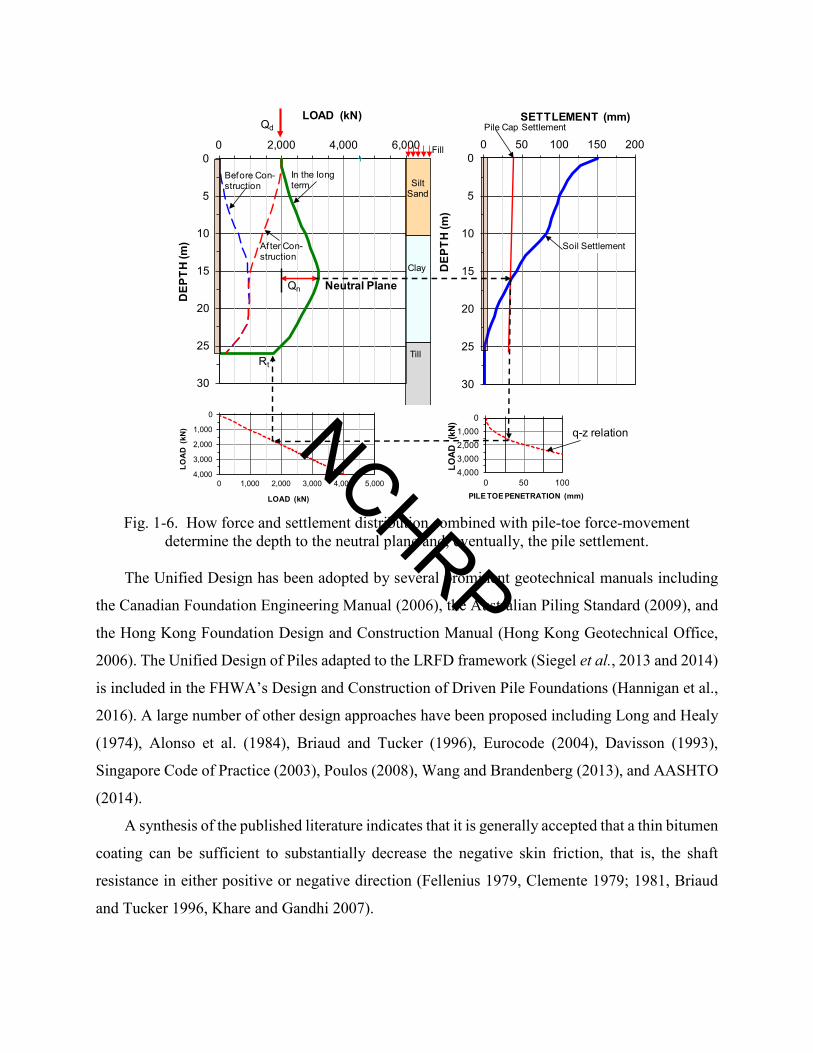
Fig. 1-6. How force and settlement distribution combined with pile-toe force-movement determine the depth to the neutral plane and, eventually, the pile settlement.
The Unified Design has been adopted by several prominent geotechnical manuals including
the Canadian Foundation Engineering Manual (2006), the Australian Piling Standard (2009), and
the Hong Kong Foundation Design and Construction Manual (Hong Kong Geotechnical Office,
2006). The Unified Design of Piles adapted to the LRFD framework (Siegel et al., 2013 and 2014)
is included in the FHWA’s Design and Construction of Driven Pile Foundations (Hannigan et al.,
2016). A large number of other design approaches have been proposed including Long and Healy
(1974), Alonso et al. (1984), Briaud and Tucker (1996), Eurocode (2004), Davisson (1993),
Singapore Code of Practice (2003), Poulos (2008), Wang and Brandenberg (2013), and AASHTO
(2014).
A synthesis of the published literature indicates that it is generally accepted that a thin bitumen
coating can be sufficient to substantially decrease the negative skin friction, that is, the shaft
resistance in either positive or negative direction (Fellenius 1979, Clemente 1979; 1981, Briaud
and Tucker 1996, Khare and Gandhi 2007).
0
5
10
15
20
25
30
0 50 100 150 200
DEP
TH (m
)
SETTLEMENT (mm)
0
5
10
15
20
25
30
0 2,000 4,000 6,000
DEP
TH (m
)
LOAD (kN)
SiltSand
Clay
Till
01,0002,0003,0004,000
0 50 100
LOAD
(kN
)
Qd
PILE TOE PENETRATION (mm)
Pile Cap Settlement
Soil Settlement
q-z relation
0
1,000
2,000
3,000
4,0000 1,000 2,000 3,000 4,000 5,000
LOA
D (
kN)
LOAD (kN)
Qn
Before Con-struction
Neutral Plane
Rt
After Con-struction
In the long term
Fill
NCHRP

Fellenius (2019) and Fellenius et al. (2019) confirmed the Russo and Viggiani (1995) case
history in a Plaxis analysis indicating that interior piles in a wide pile group (from four or more
piles in a row) transfer a load applied to the pile head to the soil starting at the pile toe level,
whereas perimeter piles essentially start mobilizing the soil from the ground surface similar to
single piles. Thus, an interior pile has minimal negative skin friction and the positive shaft
resistance develops near the pile toe level. Perimeter piles will not only appear stiffer than interior
piles at first loading and, thus, be receiving more than their share of the average pile load. If
installed at a site with subsiding soils, they will be subjected to negative skin friction and downdrag
that, depending on the rigidity of the raft, will transfer load to the interior piles—both portion of
the applied load and portion of the drag force.
Fig. 1-7. Load distribution for a perimeter pile and an interior pile in a wide pile group.
The movement of the raft (the pile heads) under an absolutely rigid raft will move equally,
but have quite different loads, whereas piles under a flexible raft will have the same load but the
interior piles will move more. This is illustrated in Figure 1-7.
If negative skin friction develops, the load received by perimeter piles will reduce and be
transferred to the interior piles for a rigid or flexible pile cap. The effect is important for the design
of the actual pile cap. Through rational analysis, it can be shown that negative skin friction does
not decrease the ultimate geotechnical resistance (pile bearing capacity). The drag force and the
applied sustained load concern only the internal compressive axial strength.
NCHRP
2.1 Studies on single piles in following liquefaction-induced settlement
In contrast to non-liquefiable layers, where the negative skin friction is typically found to be
equivalent to the positive skin friction, the negative skin friction immediately following
liquefaction is likely to be a very small fraction of the pre-liquefaction value or perhaps zero.
Nevertheless, as the earthquake-induced pore pressures dissipate in the liquefiable layer and
settlement occurs, the skin friction at the pile-soil interface is likely to increase. Therefore, the
negative skin friction which ultimately develops will likely be higher than zero and may depend
on the dissipation rate and the increase in effective stress.
In the absence of test results, some investigators have used theoretical concepts to predict
the behavior of piles when subjected to liquefaction induced drag loads. Boulanger et al. (2004)
defined negative skin friction in the liquefied zone in terms of the effective stress during
reconsolidation, but concluded that the negative skin friction could be assumed to be zero with
little error in the computed pile force or settlement. Fellenius and Siegel (2008) applied the Unified
Design of Piles approach that was developed for downdrag in clays, to the problem of downdrag
in liquefied sand, once again assuming that negative skin friction in the liquefied zone would be
zero. They also conclude that liquefaction above the neutral plane would not increase the load in
the pile based on the concept that negative friction would already be present prior to liquefaction.
To understand better the development of negative skin friction on piles in liquefied sand
and the resulting pile response, Rollins and his co-workers have conducted a number of full-scale
field tests involving blast-induced liquefaction as summarized in Table 1. Blast-induced
liquefaction was first used to investigate the lateral resistance of piles in liquefied sands (Ashford
et al. 2005, Rollins et al. 2005) and has become widely used to investigate a number of ground
improvement strategies (Wentz et al. 2015, Rollins et al. 2004, Ashford et al. 2000).
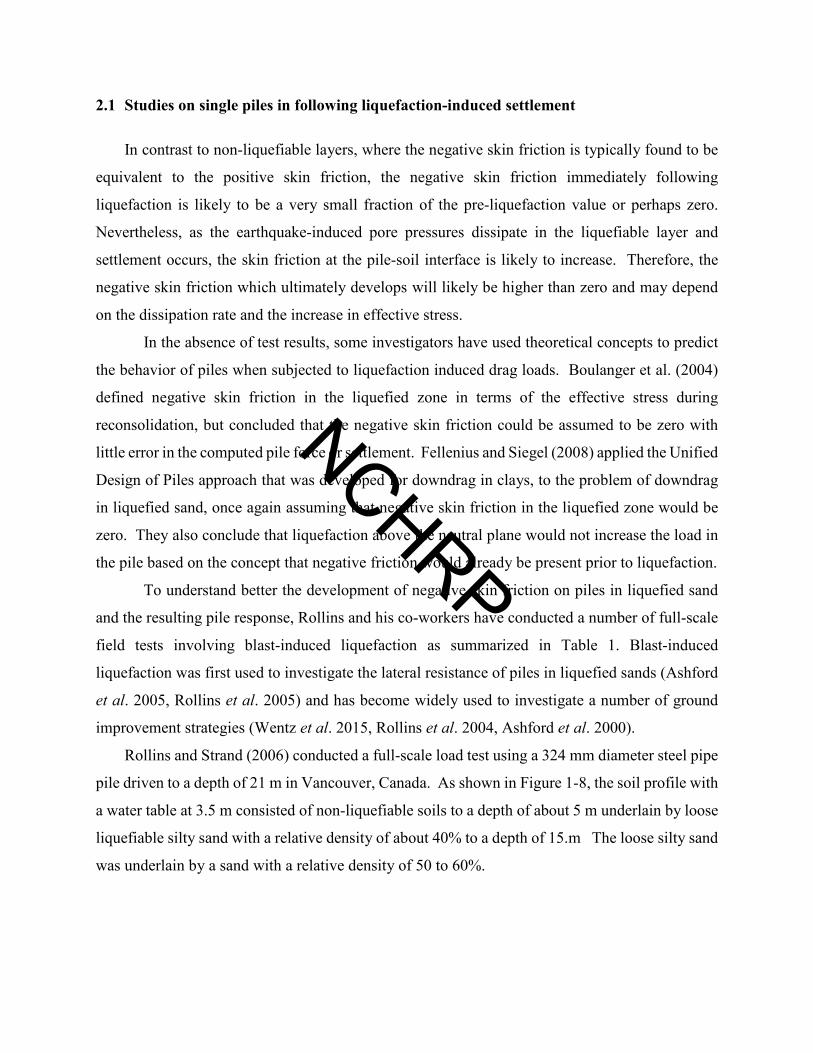
Rollins and Strand (2006) conducted a full-scale load test using a 324 mm diameter steel pipe
pile driven to a depth of 21 m in Vancouver, Canada. As shown in Figure 1-8, the soil profile with
a water table at 3.5 m consisted of non-liquefiable soils to a depth of about 5 m underlain by loose
liquefiable silty sand with a relative density of about 40% to a depth of 15.m The loose silty sand
was underlain by a sand with a relative density of 50 to 60%.
NCHRP

Table 1 Summary of blast-induced liquefaction downdrag tests. Site Location Pile Type Soil Profile Reference
Vancouver, Canada
Driven Steel Pipe 12.75” diameter 70 ft long
20 ft of cohesive soil over loose clean sand (Dr=40%)
Strand & Rollins (2006) Rollins et al. (2018)
Christchurch, New Zealand
Three Augercast Piles 20” diameter 28 ft long 39 ft long 46 ft long
5 ft of cohesive soil over medium silty sand (Dr = 60%)
Rollins and Hollenbaugh (2015) Rollins et al. (2018)
Mirabello, Italy Bored piles 10” diameter 50 ft long
20 ft of cohesive soil over 10 ft sandy silt and 60 ft of silty sand
Rollins et al. (2019), Amoroso et al. (2017)
Turrell, Arkansas
Three Driven Piles H pile (H14 x 117) 92 ft long Pipe pile (18” diam.) 78 ft long 18” square PSC pile 74 ft long Three Drilled Shafts 4 ft dia., 90.5 ft long 6 ft dia., 70 ft long 4 ft dia. 92 ft long
30 ft of cohesive soil over silty sand and sandy silt
Kevan et al. (2019)
Ishimwe et al. (2018)
Fig. 1-8. Schematic drawing showing soil profile at Vancouver, Canada test site along with test pile, reaction piles, pore pressure transducers, strain gauges and blast charge locations
-20
-10
0
10
20
30
40
50
60
70
80
Depth
(ft)
-6
-3
0
3
6
9
12
15
18
21
24
Depth
(m)
Strain GaugesPiezometersBlast Charges
Loose Liquefied Sand
Silty Sand/Clayey Silt
Clean Sand
DenserNon-Liquefied Sand
Hydraulic Rams
Reaction Frame
Test Pile Reaction PilesReaction Piles
NCHRP

Reacting against the load frame, the hydraulic jacks initially applied a load of 536 kN which
was about 50% of the ultimate pile resistance based on the Davisson criteria. On the basisi of pore
pressure transducer measurements, detonation of the sequence of explosive charges produced
liquefaction from about 5.5 m to 13 m. Reconsolidation of the liquefied sand produced 27 cm of
settlement or about 3% volumetric strain, similar to what would be expected for liquefaction
produced by an earthquake.
Figure 1-9 provides a summary of the load in the pile versus depth before liquefaction,
immediately after liquefaction, and at the completion of pore pressure dissipation. Prior to blasting
pile head load was transferred to the surrounding soil primarily by side friction. At the onset of
blasting, the test pile settled slightly so that the load applied by the hydraulic jacks dropped by 156
kN at the top of the pile. When this 156 kN load was re-applied, this load was resisted by positive
skin friction from the top downward in the upper section of the pile. It should be noted that the
total measured skin friction from the ground surface to a depth of 6 m immediately prior to blasting
was approximately 166 kN. Therefore, the redevelopment of positive skin friction due to this
applied load appears to be reasonable. The load of 536 kN was maintained throughout the
remainder of the test by adding hydraulic fluid to the jack as the pile began to settle and relieved
the load. This apparently maintained the positive friction in the upper 6 m of the pile. This result
indicates that it would be desirable to apply dead load to the top of the pile in future tests to avoid
the complication of re-application of pile head load.
Following liquefaction, load transfer within the liquefied zone dropped to near zero and the
load originally carried by positive skin friction liquefied in this zone was transferred to the lower
end of the pile where liquefaction had not developed. As a result, at the base of the liquefied zone
the load in the pile increased by 130 kN after blast induced liquefaction and the pile settled about
4.5 mm as a result of mobilization of skin friction and end-bearing in the underlying sand layer.
Once excess pore pressure had dissipated and settlement had stopped, the load vs. depth curve
in the previously liquefied zone developed a negative slope as shown in Figure 1-9. The negative
slope indicates that negative skin friction had developed in this zone and was applying drag load
to the pile. The drag load produced during reconsolidation was approximately one-half of the
positive skin friction force prior to liquefaction. As the pore pressures dissipated and effective
stresses increased, the skin friction at the pile interface also increased and produced a drag load of
NCHRP

about 100 kN (22.5 kips). This load was again transferred to the sand below the liquefied zone
with a resulting additional pile settlement of about 2.5 mm or a total pile settlement of 7 mm.
Fig. 1-9. Pile load vs. depth curves before blasting, immediately after blasting and after settlement of the liquefied layer at Vancouver, Canada (Rollins and Strand, 2006).
Rollins et al. (2015) report results of additional blast liquefaction tests on three 60 cm diameter
continuous flight auger piles in Christchurch, New Zealand. The three test piles were installed in
a triangular arrangement at 2 m center-to-center spacing to depths of 8.5, 12, and 14 m,
respectively. In these tests, the soil profile consisted of a 1.5 m thick layer of sandy silt underlain
by poorly graded medium-dense clean sand to a depth of 10.5 m. This layer was in turn underlain
by inter-bedded layers of medium-dense to dense clean sand.
Two blast-induced liquefaction downdrag tests were performed on the piles to evaluate their
performance with and without applied static load. In the first blast test here was no load applied
to the piles. Detonation of a sequence of small explosive charges liquefied a layer of sand from
the water table at 1.5 m to a depth of about 13 m. Ground settlement was approximately 4 cm
0
5
10
15
20
0 100 200 300 400 500 600 700
Dep
th B
elow
Gro
und
(m)
Load in Pile (kN)
Before LiquefactionAfter LiquefactionEnd of Settlement
Target Liquefaction
Zone
NCHRP

immediately around the group but higher beyond it. Because the ground settled more than the
piles (1 to 2 cm), negative skin friction developed in each case.
Plots of the load in each pile as a function of depth interpreted from the strain gauge readings
are provided in Figure 1-10 for the conditions 60 minutes after blasting when liquefaction induced
settlement was completed. Because no pile head load is applied, any load in the piles is induced
by negative skin friction or drag load above the neutral plane. Clearly, the negative skin friction
is not zero at the end of consolidation. The neutral plane is visible in each of the plots as the point
where the load in the pile begins to decrease. Because the neutral plane in each case is located
within the liquefied layer, rather than at the bottom of the liquefied layer as suggested by some
design procedures, positive skin friction below the neutral plane is also occurs within the liquefied
zone as reconsolidation occurs. The depth to the neutral plane increased as the length of the pile
increased suggesting that the pile settlement decreased as the pile length increased.
About one month after the initial blast induced liquefaction tests, static load tests were
performed on each pile using dead weights (Rollins and Hollenbaugh, 2015). Figure 1-10 also
presents dashed lines showing the load in the pile assuming 50% of the average positive skin
friction found in the static load test along the pile length were liquefaction occurred. Because the
neutral plane is located within the liquefied zone, both negative and positive skin friction are
reduced by 50% in the computations. Agreement with the measured curves is generally very good
and confirms the reduced skin friction value obtained from the test in Vancouver.
NCHRP

Fig. 1-10. Interpreted pile load versus depth curves (solid lines) following blast liquefaction along with predicted curves (dashed lines) assuming skin friction equal to 50% of measured average positive skin friction from the static load test. The neutral plane is shown in each plot with a horizontal line separating negative skin friction above from positive skin friction below (Rollins et al. 2018).
Following the static load tests, a total of 300 tons of dead load was distributed among the test
piles prior to a subsequent blast-induced liquefaction downdrag test. The load carried by each test
pile was measured by a load cell on the top of each pile. In this test, liquefaction developed from
a depth of 3 to 7 m below the ground surface. Because of the load on the piles they settled more
than the surrounding ground and positive skin friction developed even within the liquefied layers.
Skin friction within the non-liquefied layers was roughly the same as that measured prior to
Negative Friction
Positive Friction Neutral
Plane
Neutral Plane
Neutral Plane
Negative Friction
Positive Friction
Negative Friction
Positive Friction
NCHRP
liquefaction, while skin friction in the liquefied zones immediately after reconsolidations was
about 40% of the pre-liquefaction skin friction.
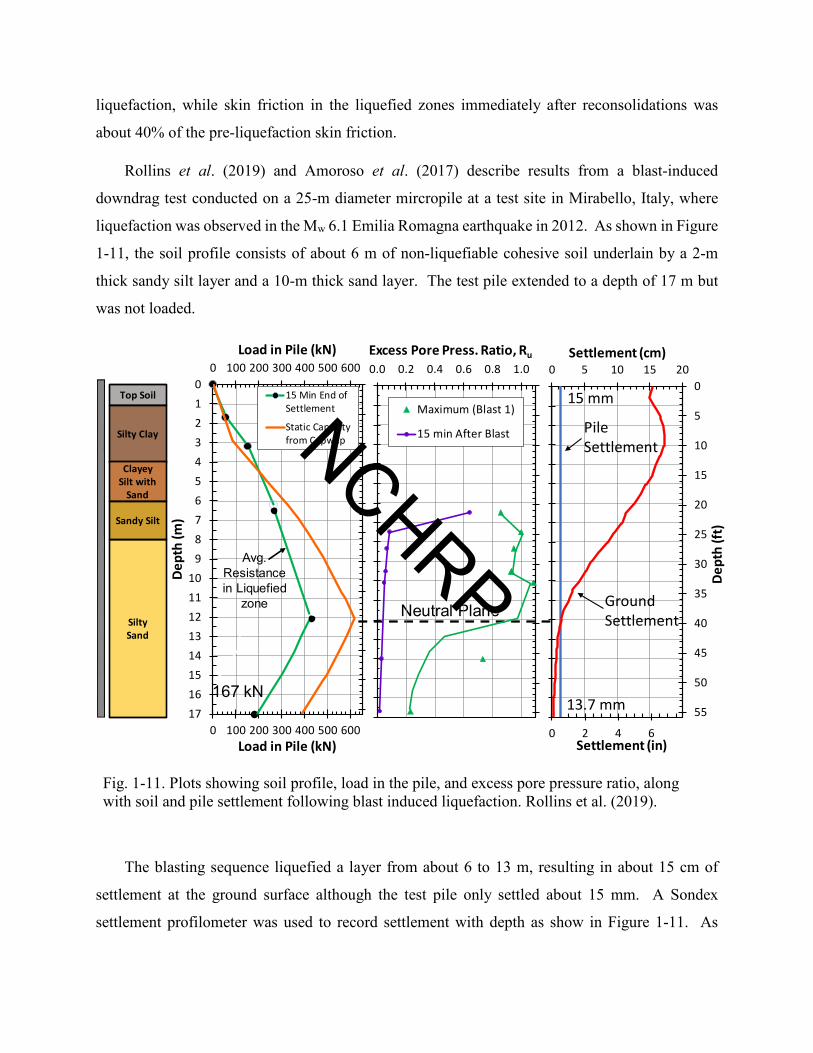
Rollins et al. (2019) and Amoroso et al. (2017) describe results from a blast-induced
downdrag test conducted on a 25-m diameter mircropile at a test site in Mirabello, Italy, where
liquefaction was observed in the Mw 6.1 Emilia Romagna earthquake in 2012. As shown in Figure
1-11, the soil profile consists of about 6 m of non-liquefiable cohesive soil underlain by a 2-m
thick sandy silt layer and a 10-m thick sand layer. The test pile extended to a depth of 17 m but
was not loaded.
Fig. 1-11. Plots showing soil profile, load in the pile, and excess pore pressure ratio, along with soil and pile settlement following blast induced liquefaction. Rollins et al. (2019).
The blasting sequence liquefied a layer from about 6 to 13 m, resulting in about 15 cm of
settlement at the ground surface although the test pile only settled about 15 mm. A Sondex
settlement profilometer was used to record settlement with depth as show in Figure 1-11. As
Top Soil
Silty Sand
Silty Clay
Clayey Silt with
Sand
Sandy Silt
0 2 4 6
0
5
10
15
20
25
30
35
40
45
50
55
0 5 10 15 20
Settlement (in)
Dept
h (ft
)
Settlement (cm)
Pile Settlement
Ground Settlement
13.7 mm
15 mm
0 100 200 300 400 500 600
0123456789
1011121314151617
0 100 200 300 400 500 600
Load in Pile (kN)
Dept
h (m
)
Load in Pile (kN)
15 Min End ofSettlement
Static Capacityfrom Capwap
Neutral Plane
167 kN
Avg. Resistance in Liquefied
zone
0.0 0.2 0.4 0.6 0.8 1.0Excess Pore Press. Ratio, Ru
Maximum (Blast 1)
15 min After BlastNCHRP

excess pore pressure dissipated and the sand reconsolidated, the liquefied layers from 6 to 12 m
settled about 11.5 cm (≈ 2% volumetric strain). The cohesive surface layer largely settled as a
block on top of the liquefied layer and settlement below 12 m was relatively minor (less than 1.5
cm). The volumetric strain in the liquefied zone produced by blasting is consistent with that
expected in an earthquake based on predictive equations developed by Ishihara & Yoshimine
(1992) and Zhang et al. (2002).
During re-consolidation of the liquefied soil, negative skin friction developed from the ground
surface to the neutral plane at a depth of about 12 m where pile settlement and soil settlement were
equal as shown in Figure 1-11. The negative skin friction in the non-liquefied layers was similar
to the positive skin friction prior to liquefaction; however, the average negative friction in the
liquefied layers was only about 50% of the positive skin friction based on CAPWAP measurements
without liquefaction. Significant end-bearing resistance was mobilized at the toe of the pile as a
result of dragload that produced a settlement equal to about 4% of the pile diameter at the toe even
without any load at the top of the pile.
Kevan et al. (2019) and Ishimwe et al. (2018) report results from blast-induced downdrag
tests conducted on three driven piles and three drilled shafts at a test site near the Mississippi River
in Turrell, Arkansas. The driven piles consisted of a H pile (HP14x117), a 46-cm (18-inch)
diameter pipe pile and a 46-cm (18-inch square) pre-stressed concrete pile. The drilled shafts
consisted of two 4-ft diameter shafts and one 6-ft diameter shaft. The test piles were loaded using
a pile cap and steel beams.
The soil profile consisted of a 9 m of non-liquefiable clay underlain by liquefiable silty sand
and sand layers, underlain by a dense sand layer as shown in Figure 1-12. Three separate blast
tests were performed involving one shaft and one driven pile and typical results are provided in
Figure 1-12. Liquefaction was typically induced within the 5-m thick silty sand layer and
elevated pressure extended into the underlying sand. Liquefaction produced ground surface
settlements of about 75 to 100 mm or a volumetric strain of about 1.0 to 1.5%.
NCHRP

Fig.1-12. Plots showing excess pore pressure ratio, pile and soil settlement, and load in the pile vs. depth along with toe (end-bearing) resistance vs. settlement curve for the steel pipe pile (Kevan et al. 2019).
For the pipe pile test shown in Figure 1-12, the neutral plane, where the pile settlement
equals the ground settlement, was located at a depth of about 18.3 m and this point also
corresponded with the maximum load in the pile. The average side resistance in the liquefied
soil layers following reconsolidation was calculated as 38% of the static resistance prior to
liquefaction. In contrast, the side resistance in the non-liquefied clay was within 4% of the pre-
blast resistance in the clay layer but about 20% higher in the sand layer below the liquefied zone.
Similar results were obtained for the other test piles and shafts.
Although significant negative skin friction was developed along the length of the deep
foundations and liquefaction induced settlement was substantial, measured settlement of the deep
foundations was normally within acceptable levels for the pile head loads involved. The
measured pile settlement was generally consistent with the neutral plane concept obtained by
Clay
Silty Sand
Sand
Dense Sand
NCHRP

balancing applied pile head force and negative friction with the positive friction and
displacement-compatible toe resistance after reducing skin friction in the liquefied layers.
2.2 Conclusions regarding liquefaction-induced downdrag
1. In liquefied soils, negative and positive skin friction after liquefaction and
reconsolidation was 40 to 55% of the skin friction before liquefaction.
2. In non-liquefied soils, negative friction was equal to positive friction.
3. These results are generally consistent for all available tests and suggest that this may be a
typical result
4. The depth to the neutral plane increased (and pile settlement decreased) as pile length
increased
5. In general, the neutral plane was not located at the base of the liquefied layer.
6. Measured pile settlement was generally consistent with neutral plane concept after
balancing applied pile head force and negative friction with the positive friction and
displacement-compatible toe resistance.
NCHRP

Task 2. Synthesis of Literature Review
After more than 50 years of full-scale field studies in many parts of the world, the response of
single piles and narrow pile groups to soil subsidence is generally well understood. However,
many details to consider in the foundation design are poorly expressed in textbooks and standards
and much effort is needed to bring the necessary information out to the engineering practice. This
is likely a result of the fact that no single test case history has provided a complete record of pile
performance, rather, results from a variety of separate case histories have been required to produce
a general design procedure.
For example, some field case histories have shown that a static neutral plane can develop after
pile installation even prior to placement of an approach fill and subsequent consolidation
settlement. In contrast, other case histories did not observe this phenomenon, but may not have
been instrumented sufficiently or monitored for a sufficient time prior to fill placement to make
the observation. As a result, confusion and uncertainty exist regarding this point. Likewise, in some
case histories a pile head load has been applied following the development of negative skin friction
and the development of a neutral plane. This loading shows that positive skin friction develops
from the pile head downward as the pile settles more than the surrounding soil until the full positive
side friction and toe resistance are mobilized. However, in many case histories no pile head load
is applied following the development of negative skin friction above the neutral plane therefore,
they provide no information about pile resistance at the ultimate state.
Lastly, some case histories do not provide the soil settlement profile relative to the pile
settlement profile, while others do not have a load test that provides the distribution of side
resistance and toe resistance or the movement necessary to develop the toe-resistance. The absence
of these key measurements make it difficult to confirm the accuracy one analysis procedure relative
to another.
To supplement the existing field test data, we believe it would be desirable to conduct a full-
scale downdrag test on an instrumented test pile at a bridge abutment in which the pile is driven
into a compressible clay profile prior to construction of the approach fill. This instrumented test
pile would then provide data on load distribution: (a) prior to fill placement, (b) during
consolidation settlement after fill placement, and (c) during application of dead load from the
bridge superstructure. This test would provide a case history documenting pile performance during
the typical sequence of load experienced by an abutment pile. Ideally, a static load test or bi-
NCHRP

directional load test would be performed on an adjacent test pile to define the toe resistance-
deflection relationship and the distribution of load in the pile at the ultimate state. In addition, pile
driving analyzer (PDA) measurements would be made during pile driving so that a CAPWAP
analysis could provide complimentary side resistance and toe resistance data. Strain measurements
along the length of the pile would define load in the pile and ground settlement would be measured
with depth. A test such as this would provide all the information needed to evaluate competing
analysis procedures and would provide a well-documented case history for calibrating numerical
models that could then be used for parametric studies.
With regards to liquefaction-induced downdrag and negative skin friction on single piles, a
growing set of test data has been accumulated to provide a basic framework for understanding pile
behavior for this condition. However, a couple of important issues remain unresolved. First, the
analysis method suggested by Fellenius and Siegel (2007) assumes that a static neutral plane
develops for any pile such that negative skin friction above the neutral plane need not be considered
should liquefaction occur. In contrast, tests conducted by Rollins and his co-workers (Rollins and
Strand 2006; Rollins and Hollenbaugh, 2015; Kevan et al. 2019) have not shown the development
of a static neutral plane prior to blast-induced liquefaction. It is presently unclear from the
available data whether or not essentially all piles will develop negative skin friction and a static
neutral plane as previous research has primarily focused on piles in settling ground. Different
initial assumptions can have a significant effect on computed pile load and settlement.
Secondly, field test results to date have indicated that the average negative skin friction in
liquefied layers following dissipation and reconsolidation is approximately 50% of the positive
skin friction prior to liquefaction. However, there is considerable uncertainty regarding whether
or not the full positive skin friction can again be relied upon after some time period (e.g. one
month) once the micro-structure of the sand has had a chance to recover. For example, shear wave
velocity tests often show a reduction in velocity immediately following blast-induced liquefaction
followed by an increase with time (Amoroso et al. 2017). This issue could be readily investigated
by performing static pile load tests before liquefaction and then again a month or so after the
liquefaction
In contrast to our understanding of single pile behavior during downdrag loading, the response
of larger (wider) pile groups is less well researched and understood. It is also more complex, as it
NCHRP

involves additional aspects, such as pile cap rigidity, whether the subsidence is due to lowering of
groundwater table or to placing of fill, manner and sequence of construction, and location of a pile
within the pile group, for example, a perimeter pile location relative to an interior pile location
within the group. Unfortunately, the cost and logistical difficulties associated with testing and
instrumenting a pile group are relatively high and fewer tests are available as a result. Therefore,
we feel that it would be desirable to conduct downdrag tests on a group of piles at a compressible
clay site and at a liquefiable sand site in connection with this study if the budget can be
accommodated. Ideally, the pile groups should have a minimum of two interior piles, which could
be produced with a 13-pile group, along with a companion single pile for comparison purposes. A
static load test would be performed on the single companion single. Strain gauges would need to
be monitored long-term on three to four piles in each group and ground settlement would need to
be measured versus depth inside and outside the group. For the liquefiable sand site, ground
settlement could be induced by blasting whereas a limited amount of fill would likely be required
to induced settlement for the pile group in clay. Group tests would provide important case histories
with which to evaluate competing analysis techniques and they would be particularly valuable in
calibrating numerical models which then be used to conduct “virtual” load tests with variations in
pile type, cap type and geometries.
NCHRP

References
AASHTO (2014) LRFD Bridge Design Specifications. American Association of State Highway and Transportation Officials, 4th ed., Washington, D.C.
Alonso, E.E., Josa, A. and Ledesma, A. (1984) Negative skin friction on piles, a simplified analysis and prediction procedure, Geotechnique, 34(3), 341-357.
Amoroso, S., Milana, G., Rollins, K.M., Comina, C. Minarelli, L. Manuelo, M.R., Monaco, P. et al. (2017). The First Italian Blast-Induced Liquefaction Test (Mirabello, Emilia-Romagna, Italy): Description of Experiment and Preliminary Results. Annals of Geophysics, Vol. 60, No. 5, 19 p.
Altaee, A., Fellenius, B.H., and Evgin, E. (1992) Axial load transfer for piles in sand. I. Tests on an instrumented precast pile Canadian Geotechnical Journal, 29(1), 11-20.
Australian Piling Standard (2009). Piling - design and installation, Standard AS2159-2009, Australian Council of Standards, Committee CE/18, Adelaide, Australia.
Ashford, S.A., Rollins, K.M., and Lane, J.D. (2004) “Blast-induced liquefaction for full-scale foundation testing.” J. Geotech. and Geoenvir. Engrg., ASCE, Vol. 130, No. 8, 798-806.
Ashford, S.A., Rollins, K.M, and Baez, J.I. (2000) Comparison of Deep Foundation Performance in Improved and Non-Improved Ground Using Blast-Induced Liquefaction. ASCE, Geotechnical Special Publication 107, Soil Dynamics and Liquefaction 2000, p. 35-57.
Auvinet, G. and Hanell, J.J. (1981) Negative skin friction on piles in Mexico City Clay Proceedings, 10th ICSMFE, Vol. 2, 599-604.
Bjerrum, L. and Johannessen, I.J. (1965) Measurements of the compression of a steel pile to rock due to settlement of the surrounding clay, Proceedings, 6th International Conference on Soil Mechanics and Foundation Engineering, Montreal, Vol.2, 261-264.
Bjerrum, L., Johannessen, I.J. and Eide, O. (1969) Reduction of negative skin friction on steel piles to rock, Proceedings, 7th International Conference on Soil Mechanics and Foundation Engineering, Mexico City, Vol.2, 27-33.
Boulanger, R.W. and Brandenberg, S.J. (2004) Neutral plane solution for liquefaction-induced downdrag on vertical pile GSP No. 126, ASCE, 470-478.
Bozozuk, M. (1970) Field observations of negative skin friction loads in marine clay. Proceedings, Conference on Design and Installation of Cellular Structures, 273-279.
Bozozuk, M., (1972) Downdrag measurements on a 160-ft floating pipe test pile in marine clay, Canadian Geotechnical Journal, 9(2), 127-136.
Bozozuk, M. (1981) Bearing capacity of a pile preloaded by downdrag, Proceedings, 10th ICSMFE, Stockholm, Vol.2, 631-636.
Bozozuk, M. and Labrecque, A. (1969) Downdrag measurement on 270-ft composite piles. Proceedings, Symposium on Performance of Deep Foundations, ASTM STP 444, 15-40.
Bozozuk, M., Keenan, G.H., and Pheeney, P.E. (1978) Analysis of load tests on instrumented steel test piles in compressible silty soil, ASTM STP 670, 153-180.
Briaud, J. and Tucker, L.M. (1996) Design and construction guidelines for downdrag on uncoated and bitumen-coated piles, National Cooperative Highway Research Program Transportation Research Board, 1-198.
BSI (1986) BS EN 8004:1986: Code of practice for foundations. BSI, London, UK. BSI (2004) BS EN 997-1:2004: Eurocode 7. Geotechnical design. General rules. BSI, London, UK.
NCHRP

Budge, A.S. and Dasenbrock, D.D. (2011) Performance data collected from instrumentation on a MN/DOT bridge abutment foundation subject to downdrag, GSP No.211, ASCE, 273-282.
Budge, A.S., Dasenbrock, D.D. and Mattison, D.J. (2015) A synthesis of pile performance monitoring projects in downdrag environments in Minnesota, GSP No.256, ASCE, 457-471.
Burland, J.B. and Starke, W. (1994). Review of measured negative pile friction in terms of effective stress Proceedings, 13th ICSMFE, 493-496.
Canadian Geotechnical Society (2006) Canadian Foundation Engineering Manual, BiTech Publishers, 512 p.
Clemente, F.M. (1981) Downdrag on bitumen coated piles in a warm climate, Proceedings, 10th ICSMFE, Vol.2, 673-676.
Clemente, F.M. (1979) Downdrag. A comparative study of bitumen coated and uncoated prestressed piles, Proceedings, Associated Pile and Fittings 7th Pile Talk Seminar, NY, 49-71.
Davisson, M.T. (1993) Negative skin friction in piles and design decisions, Proceedings, Third International Conference on Case Histories in Geotechnical Engineering, 1792-1801.
Elvis, I. (2018) Liquefaction-induced dragload and/or downdrag on deep foundation within the New Madrid seismic zone, Ph.D. Dissertation, University of Arkansas.
Endo, M., Minou, A., Kawasaki, T., and Shibata, T. (1969) Negative skin friction acting on steel piles in clay, Proceedings, 7th ICSMFE, Vol.2, 85-92.
Eurocode, 2004. Eurocode, Chapter 7, Pile Foundations (preliminary draft), 25 p. Fellenius, B.H. (1972) Downdrag on piles in clay due to negative skin friction, Canadian Geotechnical
Journal, 9(4), 323-337. Fellenius, B.H. (1979) Downdrag on bitumen coated piles, Journal of Geotechnical Engineering,
105(GT10), 1262-1265. Fellenius, B.H. (1984) Negative skin friction and settlement of piles, Proceedings, Second International
Seminar, Pile Foundations, 1-12. Fellenius, B.H. (1988) Unified design of piles and pile groups, Transportation Research Record, 1169, 74-
82. Fellenius, B.H. (1998) Recent advances in the design of piles for axial loads, dragloads, downdrag, and
settlement, Proceedings, ASCE and Port of NY & NJ Seminar, 18 p. Fellenius, B.H. (2001) Static capacity by dynamic methods for three bored piles, Discussion, Journal of
Geotechnical Engineering, 127(12), 1078-1081. Fellenius, B.H. (2004) Unified design of piled foundations with emphasis on settlement analysis, Geo-
Institute Geo-Trans Conference, 252-275. Fellenius, B.H. (2006) Results from long-term measurement in piles of drag force and downdrag, Canadian
Geotechnical Journal, 43(4), 409-430. Fellenius, B.H. (2016) The unified design of piled foundations, The Sven Hansbo Lecture, Geotechnics for
Sustainable Infrastructure Development, Geotechnics for Sustainable Infrastructure Development – Geotec Hanoi 2016, edited by Phung Duc Long, Hanoi, November 23-25, pp. 3-28.
Fellenius, B.H. (2017) Design of single piles, small pile groups, and wide piled foundations, Proceedings, International Conference on Advancement of Pile Technology and Pile Case Histories, Bali, Indonesia, Edited by Rahardjo, P.T. and Mutapea, B.M., September. 25 - 27, A2-1 – A2-19.
Fellenius, B.H., (2018). Basics of foundation design—a textbook. Electronic Edition, www.Fellenius.net, 484 p.
Fellenius, B.H. (2019) Observations and analysis of wide piled foundations, Canadian Geotechnical Journal, 56, 378-397.
Fellenius, B.H. and Broms, B.B., 1969. Negative skin friction for long piles driven in clay. Proc. 7th International Conference on Soil Mechanics and Foundation Engineering, Mexico City, August 25-29, Vol. 2, pp. 93-97.
Fellenius, B.H. and Siegel, T.C. (2007) Pile drag load and downdrag in a liquefaction event, Journal of Geotechnical and Environmental Engineering, ASCE, 132(9), 1412-1416.
NCHRP

Fellenius, B.H., Muhunthan, B., Vijayaruban, V.N. (2015) Liquefaction-induced downdrag on piles and drilled shafts Proceedings, International Conference on Earthquake Geotechnical Engineering, 62, 1-8.
Fellenius, B.H., Terceros, M.H., Terceros, M.A., Massarsch, K.R., and Mandolini, A. (2020) Static response of a group of 13 piles tested simultaneously, Fourth Bolivian International Conference on Deep Foundations, Santa Cruz de la Sierra, Bolivia, May 23-24, 13 p..
Garlanger, J.E. (1974). Measurement of pile downdrag beneath a bridge abutment. Transportation Research Record 517, 61-69.
Hannigan, P.J., Rausche, F., Likins, G.E., Robinson, B.R. and Becker, M.L. (2016) Geotechnical Engineering Circular No. 12 – Volume I Design and construction of driven pile foundations, U.S. Department of Transportation.
Hong Kong Geotechnical Engineering Office (2006) Foundation design and construction, Geo Publications No. 1/2006, The Government of Hong Kong, Hong Kong.
Indraratna, B., Balusubramaniam, A.S., Phamvan, P., and Wong, Y.K. (1992) Development of negative skin friction on driven piles in soft Bangkok clay, Canadian Geotechnical Journal, 29(3), 393-404.
Inoue, Y., Tamaoki, K., and Ogai, T., 1977. Settlement of building due to pile downdrag. Proc. 9th ICSMFE, Tokyo, July 10-15, Vol. 1, pp. 561– 564.
Ishihara, K. & Yoshimine, M. (1992). Evaluation of settlements in sand deposits following liquefaction during earthquakes. Soils and Foundations, Vol. 32, 173-188
Ishimwe, E., Coffman, R.A., and Rollins, K.M. (2018). Analysis of post-liquefaction axial capacities of driven pile and drilled shaft foundations. Procs., International Foundation Congress and Equipment Expo. 10 p.
Keenan, G.H. and Bozuzuk, M. (1985). Downdrag on a three-pile group of pipe piles Proceedings, 11th ICSMFE, Vol.2, 1407-1412.
Kevan, L.I., Rollins, K.M., Coffmann, R.A., and Ishimwe, E., (2019). Full-scale blast liquefaction testing in Arkansas USA to evaluate pile downdrag and neutral plane concepts. Earthquake Geotechnical Engineering for Protection and Development of Environment and Constructions, Assoc. Geotechnica Italiana, p. 648-655.
Khare, M.G. and Gandhi, S.R. (2007) Behavior of coated piles under dragload, Proceedings, Soil Mechanics and Geotechnical Engineering – Asian Regional Conference, 321-324.
Leifer, S.A. (1994). The effect of live load on downdrag forces., GSP 40, ASCE, 1805-1826. Lucarelli, A., Blanksma, D., Dasenbrock, D. and Peterson, R. (2014) The effects of tip stiffness on piles
with downdrag, Journal of the Transportation Research Board, 2511(1), 1-15. Lam, S.Y., Ng., W.W., and Poulos, H.G. (2013) Shielding piles from downdrag in consolidating ground,
Journal of Geotechnical and Geoenvironmental Engineering, 956-968. Law, H. and Wilson, P. (2017) Displacement-based downdrag analysis for pile design Proceedings, PBD
III Earthquake Engineering, 6 p. Lee, C.J. Bolton, M.D. and Al-Tabbaa, A. (2001) Recent findings on negative skin friction in piles and pile
groups in consolidating ground, 5th International Conference on Deep Foundation Practice incorporating Piletalk, 4(6), 273-280.
Lee, C.J. Bolton, M.D. and Al-Tabbaa, A. (2002) Numerical modelling of group effects on the distribution of dragloads in pile foundations, Geotechnique, 52(5), 325-335.
Leung, C.F. (2009) Negative skin friction on piles, IGC, 827-836. Leung, C.F., Radhakrishnan, R., and Tan, S.A., 1991. Performance of precast driven piles in marine clay.
ASCE Journal of Geotechnical Engineering, 117(4) 637-657. Long, R.P. and Healy, K.A. (1974) Negative skin friction on piles, Final Report JHR 74-77, 1-23. Lucarelli, A., Blanksma, D., Dasenbrock, D. and Peterson, R. (2014) “The effects of tip stiffness on piles
with downdrag”, Journal of the Transportation Research Board, 2511(1), 1-15. Luna, R., Dixon, D.T., Kershaw, K.A., and Siegel, T.C. (2015) Monitoring micropile foundations of bridge
during construction, GSP No. 256.
NCHRP

Mandolini, A., Russo, G. and Viggiani, C. (2005). Pile foundations: experimental investigations, analysis, and design. Proc. 16th ICSMGE, September 12 -16, Osaka, Japan, pp. 177-213.Matyas, E.L. and Santamarina, J.C. (1994) Negative skin friction and the neutral plane Canadian Geotechnical Journal, 31, 591-597.
Muhunthan, B., Vijayathasan, N.V. and Abbasi, B. (2017) Liquefaction-induced downdrag on drilled shafts, WA-RD 865.1, Washington State Department of Transportation, 1-162.
Nishi, K. and Esahi, Y. (1982) Negative friction and lateral movement induced in pile by surcharge, Central Research Institute of Electric Power Industry, 1-68.
Okabe, T., 1977. Large negative friction and friction-free piles methods. 9th ICSMFE, Tokyo, July 11-15, Vol.1, pp. 679-682.
Poulos H.G., (2008) A practical design approach for piles with negative friction, Proceedings, Institution of Civil Engineers, 19-27.
Rollins, K.M., Goughnour, R.R., Anderson J.K.S. and McCain, A. (2004). “Liquefaction hazard mitigation using vertical composite drains.” Proceedings. 13th World Conf. on earthquake Engineering, EERI, Vancouver
Rollins, K.M., Gerber, T.M., Lane, J.D. and Ashford. S.A. (2005). “Lateral Resistance of a Full-Scale Pile Group in Liquefied Sand.” J. Geotechnical and Geoenvironmental Engrg., ASCE, Vol. 131, No. 1, p. 115-125.
Rollins, K.M. and Strand, S.R. (2006) Downdrag forces due to liquefaction surrounding a pile. Proceedings, 8th U.S. National Conference on earthquake Engineering, Paper 1646, 10 p.
Rollins, K.M. and Sears, B.K. (2008) Pile downdrag during construction of two bridge abutments. Final Report to Research Division, Utah Dept. of Transportation, 253 p.
Rollins, K.M., Strand, S.R., and Hollenbaugh, J.E. (2018). Liquefaction Induced Downdrag and Dragload from Full-Scale Tests. Chapter 5, Springer International Publishing, Editor: Iai, S., 25 p.
Rollins, K.M., Lusvardi, C., Amoroso, S., Franceschini, M. (2019). Liquefaction induced downdrag on full-scale micropile foundation. Procs. 2nd Intl. Conf. on Natural Hazards and Infrastructure, 2 p. Crete
Russo, G. and Viggiani C. (1995). Long-term monitoring of a piled foundation. Fourth International Symposium on Field Measurements in Geomechanics, Bergamo, pp. 283–290.Saha, A. (2015) The influence of negative skin friction on piles and pile groups & settlement of existing structures, International Journal on Emerging Technologies, 6(2), 53-59.
Sawaguchi, M. (1989) Prediction of bending moment of a batter pile in subsiding ground Soils and Foundations, 29(4), 120-125.
Siegel, T.C. and McGillivray, A., (2009) Interpreted residual load in an augered cast-in-place pile, Proceedings, DFI 34th Annual Conference.
Siegel, T.C., Lamb, R., Dasenbrock, D., Axtell, P. (2013) Alternative design approach for drag load and downdrag of deep foundations within the LRFD framework, Proceedings, DFI 38th Annual Conference.
Siegel, T.C., Lamb, R., Dasenbrock, D., and Axtell, P.J. (2014) Neutral plane method for drag force of deep foundations and AASHTO LRFD bridge design specifications, Proceedings, University of Minnesota Annual Geotechnical Conference, 10 p.
Siegel, T.C. and Lucarelli, A. (2017) Theory and modelling of negative skin friction on a pile in soil, The Journal of the Deep Foundations Institute, 10(3), 135-142.
Singapore (2003) CP4:2003; Code practice for foundations. Spring Singapore, Singapore. Tan, S.A. and Fellenius, B.H. (2016) Negative skin friction pile concepts with soil-structure interaction,
ICE Geotechnical Research Journal, Paper 16.00006, 1-11. Takahashi, K. (1985) Bending of a batter pile due to ground settlement Soils and Foundations, 25(4), 75-
91. Vijayaruban, V.N., Muhunthan, B., Fellenius, B.H. (2015) Liquefaction-induced downdrag on piles and
drilled shafts, 6th International Conference on Earthquake Geotechnical Engineering, 1-8.
NCHRP

Vipulanandan, C. Guvener, O., and McLelland, M. (2007) Monitoring the installation and curing of a large diameter ACIP pile in very dense sand, GSP No. 158, ASCE, 1-10.
Walker, L.K., Le, P. and Darvall, L. (1973) Downdrag on coated and uncoated piles, Proceedings, 8th ICSMFE, Vol.2, 257-262.
Wang, R. and Brandenberg, J. (2013) Beam on nonlinear winkler foundation and modified neutral plane solution for calculating downdrag settlement, Journal of Geotechnical and Geoenvironmental Engineering, 139(9), 1433-1442.
Wentz, F.J., van Ballegooy, S., Rollins, K.M., Ashford, S.A., and Olsen, M.J. (2015). “Large Scale Testing of Shallow Ground Improvements using Blast-Induced Liquefaction” Procs., 6th Intl. Conf. on Earthquake Geotechnical Engineering, Christchurch, New Zealand, New Zealand Geotechnical Society, 10 p.
Zhang, G., Robertson, P. K., and Brachman R. W.I. (2002). Estimating liquefaction-induced ground settlements from CPT for level ground. Canadian. Geotech. J., NRC Canada, 39(5), 1168–1180.
NCHRP
Recommended