2
Introduction Porosity is one of the important physical properties that govern physical attributes of rocks such as strength, deformability and hydraulic conductivity (Franklin and Dusseault 1991). Porosity is the representative characteristic of rock which shows the particle formation change due to the weathering process. Such weathering process is more rapid in tropical climate due to the high temperature and high humidity. The boundary crack that has been developed during weathering process contributes to the porosity of weathered rock mass. The fracture of mineral grains (grains boundary) is continuously developed and creates bulk of crack line all over the rock mass. Those cracks can be subdivided into two categories as micro-cracks and macro-cracks. Portion of soluble minerals decreases as the weathering degree increases. It controls the change of porosity of granitic rock mass. This study presents the evaluation of micro and macro level porosities of granitic rock by using analytical image processing and saturation and caliper techniques considering the degree of weathering. Furthermore, additional experimental tests were performed to characterize the relation between porosity and various engineering properties such as uniaxial compressive strength (UCS), resistivity and compressive wave velocity depending on the degree of weathering. Materials and methods Four different grade of Tropical granite with no presence of bedding were taken from typical quarry in Sungai Buloh, Selangor with total of 34 samples. Rebound hammer was used as initial identification of weathering degree (WD) of r ock sample (refer Figure 2). Saturation and caliper method (ISRM 1981) were conducted to determine macro scale porosity. The porosity was calculated based on the fluid fill the pore space and microcraack. Acknowledgments This research was made possible by the support from Faculty of Civil Engineering, University Technology MARA, Malaysia. Results From the study, it can be generalized that the study was succesfull characterized the porosity based on the  weathering degree. The porosity increases as the degree of weathering increases (i.e., rebound number decreases). It was found that:- The macro scale porosity of weathered granite obtained from the saturation and caliper technique varies between 1.5 % and 14.0 %. It can be concluded that pore space expands and pore structure is developed due to the  weathering pr ocess. The micro scale porosities of tropical weathered granite ranged from 2 % to 8 %. The porosity of the relatively fresh rock (i.e., WD I and WD II) was as small as 4 % thus both approaches showed similar porosity range. Porosity difference between two different methods became significant in moderate and highly weathered granite (i.e., WD III and WD IV): micro scale porosity  was smaller than the macro scale poro sity. From the electro microscopy images, it can be deduced that micro-cracks occur along the boundaries of mineral grain and contribute to the development of pore structure before the mineral grains begin to break. Conclusions The evaluation process of micro and macro level porosities of granitic rock by using analytical image processing and saturation and caliper techniques taking into consideration the degree of weathering is presented in this study. The salient findings obtained from this study can be summarized as follows: Porosity increases as the weathering degree increases. Macro scale porosity is relatively higher than micro scale porosity. Porosity has significant influence on the engineering properties: As porosity increases, compressive wave  velocity , resistivity , and uniaxial compressiv e strength decrease. Ahmad Syauqi Md Hasan Zainab Mohamed Ki-Il Song  Faculty of Civil Engineering, University T echnology MARA Malaysia, 40450 S hah Alam, Selangor, Malaysia Literature cited Husaini, O., Pauzi, N.I., Shariah, M.A., Yusof, Z.M., and Maail,S. 2009. Microcracks pa ttern and the degree of  weathering in granite. Electronic Journal of Geotechnical Engineering 14: 1-21. Lindqvist, L.E., Akesson, U., and Malaga, K. 2007 Microstructure and functional properties of rock materials.  Materials Characterizati on58: 1183-1188. Takemura ,T ., Golshani, A., Oda, M., Suzuki, K. 2003. Preferred orientations of open micrcracks in granite and their relation with anisotropic elasticity. International Journal of Rock Mechanics and Mining Sciences40: 443-454. Tugrul, A. 2004. The effect of weathering on pore geometry and compressive strength of selected rock types from Turkey. Engineering Geology 75: 215-227. Franklin ,J.A., and Dusseault, M.B. 1991. Rock engineering application.  McGraw-Hil l, New York. International Society for Rock Mechanics, Rock Characterisati on, Testing and Monitoring. In: Brown ET(Ed.), ISRM suggested methods. Oxford: Pergamon; 1981. p. 211 Figure 2 . Rebound number and dry density of collected granite samples. Note: WD denotes weathering degree. Figure 5. Va riation of micro and macro scale porosity depending on the degree of weathering For further information Pleasecontact [email protected]. Fresh rock : porosities in the horizontal and vertical direction are almost identical, since micro-cracks rarely develop and pore structure is relatively isotropic. Moderate and highly weathered rock : the micro-cracks are fully developed and pore structure shows anisotropic characteristic in horizontal and vertical direction. Inter-relation between Porosity and Engineering Properties The changes of porosity due to the weathering process have significant influence on the various engineering properties. Compressive wave velocity decreases as the porosity increases. Resistivity decreases as the porosity increases. Uniaxial compressive strength decreases as the porosityincreases. Micro and macro approaches for characterization of porosity depending on the weathering degree Figure 1. Presence of micro-crack in Granite 2.2 2.3 2.4 2.5 2.6 2.7 0 10 20 30 40 50 60 70 ReboundNumber,R    D   r   y    D   e   n   s    i    t   y    (   g    /   c   m    3    )  . WDI WDII WDIII WDIV Sampleplacedon dessicator  Weightthesample Dry thesamplein theovenat105°C  Weightthesample Figure 3 . Saturation and caliper method technique  Analytical image processing technique to determine the porosity from the images taken from the petrographic thin section is newly suggested in this study. Porosity calculated in this approach can be considered as micro scale porosity Figure 4. Description of calculation process of analytical image processing from petrographic thin section slide 0 2 4 6 8 10 12 14 16 0 10 20 30 40 50 60 70 ReboundNumber, R    P   o   r   o   s    i    t   y    (    %    ) WDI (Macro) WDII(Macro) WDIII(Macro) WDIV(Macro) Average (Macro) WDI (Micro) WDII(Micro) WDIII(Micro) WDIV(Micro) Average(Micro) Variati on ofmacro scale porosity Varition ofmicro scale porosity porosity increases as the degree of weathering increases 0 1000 2000 3000 4000 5000 0 3 6 9 12 15 Porosity (%)    C   o   m   p   r   e   s   s    i   v   e   w   a   v   e   v   e    l   o   c    i    t   y    (   m    /   s   e   c    ) WDI(Macro) WDII(Macro) WDIII(Macro) WDIV(Macro) Average (Macro) WDI(Micro) WDII(Micro) WDIII(Micro) WDIV(Micro) Average (Micro) Macro scale porosity vs compressive wave velocity Micro scale porosity vs compressive wave (a) 0 20 40 60 80 100 0 3 6 9 12 15 Porosity (%)    U   n    i   a   x    i   a    l   c   o   m   p   r   e   s   s    i   v   e   s    t   r   e   n   g    t    h    (    M    P   a    )  .  . Macro scale porosity vs uniaxialcompressive strength Micro scale porosity vs uniaxialcompressive strength (c)    v    v    v   y    / WDI(Macro) WDII(Macro) WDIII(Macro) WDIV(Macro) Average (Macro) WDI(Micro) WDII(Micro) WDIII(Micro) WDIV(Micro) Average (Micro)  1.0E+00 1.0E+01 1.0E+02 1.0E+03 1.0E+04 1.0E+05 1.0E+06 1.0E+07 0 3 6 9 12 15 Porosity (%)    R   e   s    i   s    t    i   v    i    t   y    (    O    h   m     m    )  . Macroscale porosity vs resistivity in dry Macroscale porosity vs resistivity in saturation Microscale porosity vs resistivity in dry Microscale porosity vs resistivity in saturation (b)    v    v    v     / WDI(Macro) WDII(Macro) WDIII(Macro) WDIV(Macro) Average (Macro) WDI(Micro) WDII(Micro) WDIII(Micro) WDIV(Micro) Average (Micro) v v v v v v v Figure 7. Porosity against a) Compressive wave velocity, b) Resistivity, and c) Uniaxial compressive strength Figure 6. Direction of micro-craks

Poster Ver1

Embed Size (px)

Citation preview

8/2/2019 Poster Ver1

http://slidepdf.com/reader/full/poster-ver1 1/1

Introduction

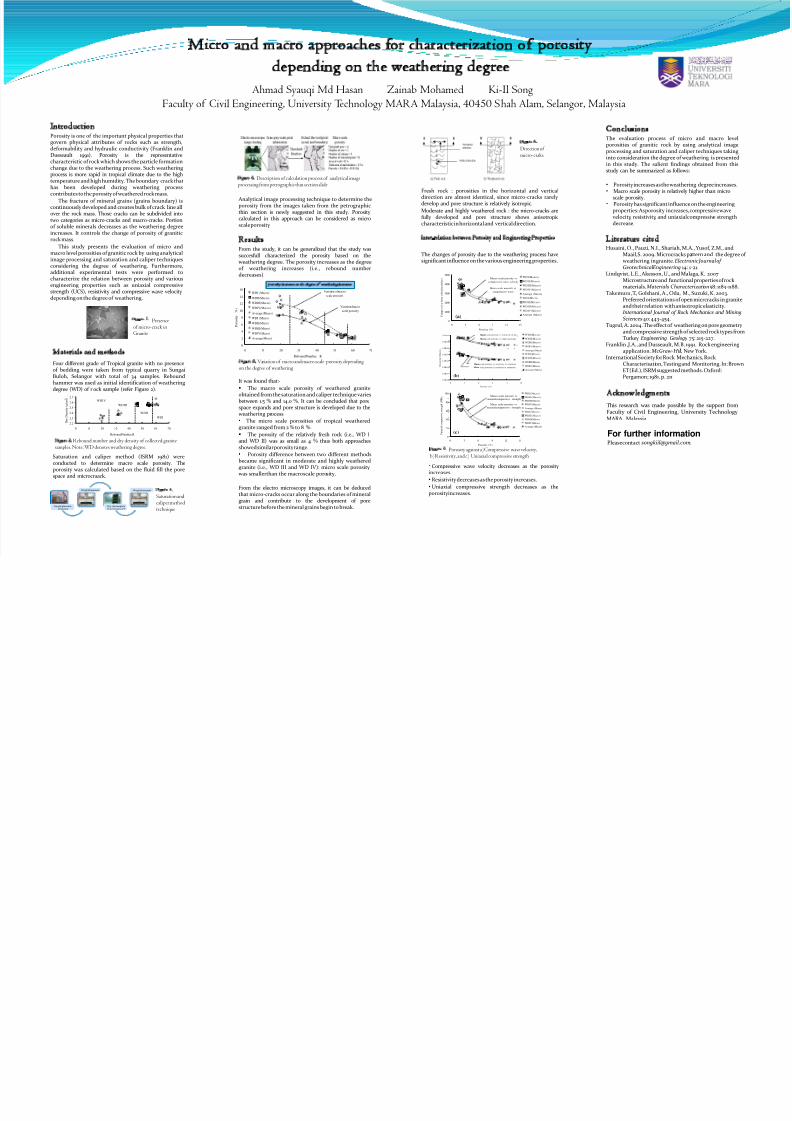
Porosity is one of the important physical properties thatgovern physical attributes of rocks such as strength,deformability and hydraulic conductivity (Franklin andDusseault 1991). Porosity is the representativecharacteristic of rock which shows the particle formationchange due to the weathering process. Such weatheringprocess is more rapid in tropical climate due to the hightemperature and high humidity. The boundary crack thathas been developed during weathering processcontributes to the porosity of weathered rock mass.

The fracture of mineral grains (grains boundary) iscontinuously developed and creates bulk of crack line allover the rock mass. Those cracks can be subdivided intotwo categories as micro-cracks and macro-cracks. Portionof soluble minerals decreases as the weathering degreeincreases. It controls the change of porosity of graniticrock mass.

This study presents the evaluation of micro andmacro level porosities of granitic rock by using analyticalimage processing and saturation and caliper techniquesconsidering the degree of weathering. Furthermore,additional experimental tests were performed tocharacterize the relation between porosity and variousengineering properties such as uniaxial compressivestrength (UCS), resistivity and compressive wave velocity depending on the degree of weathering.

Materials and methods

Four different grade of Tropical granite with no presenceof bedding were taken from typical quarry in SungaiBuloh, Selangor with total of 34 samples. Reboundhammer was used as initial identification of weatheringdegree (WD) of r ock sample (refer Figure 2).

Saturation and caliper method (ISRM 1981) wereconducted to determine macro scale porosity. Theporosity was calculated based on the fluid fill the porespace and microcraack.

AcknowledgmentsThis research was made possible by the support from

Faculty of Civil Engineering, University Technology MARA, Malaysia.

ResultsFrom the study, it can be generalized that the study wassuccesfull characterized the porosity based on the

 weathering degree. The porosity increases as the degreeof weathering increases (i.e., rebound number

decreases).

It was found that:-

The macro scale porosity of weathered graniteobtained from the saturation and caliper technique variesbetween 1.5 % and 14.0 %. It can be concluded that porespace expands and pore structure is developed due to the

 weathering process. The micro scale porosities of tropical weatheredgranite ranged from 2 % to 8 %.

The porosity of the relatively fresh rock (i.e., WD Iand WD II) was as small as 4 % thus both approachesshowed similar porosity range.

Porosity difference between two different methodsbecame significant in moderate and highly weatheredgranite (i.e., WD III and WD IV): micro scale porosity 

 was smaller than the macro scale porosity.

From the electro microscopy images, it can be deducedthat micro-cracks occur along the boundaries of mineralgrain and contribute to the development of porestructure before the mineral grains begin to break.

ConclusionsThe evaluation process of micro and macro levelporosities of granitic rock by using analytical imageprocessing and saturation and caliper techniques takinginto consideration the degree of weathering is presentedin this study. The salient findings obtained from thisstudy can be summarized as follows:

• Porosity increases as the weathering degree increases.• Macro scale porosity is relatively higher than micro

scale porosity.• Porosity has significant influence on the engineering

properties: As porosity increases, compressive wave velocity, resistivity, and uniaxial compressive strengthdecrease.

Ahmad Syauqi Md Hasan Zainab Mohamed Ki-Il Song 

Faculty of Civil Engineering, University Technology MARA Malaysia, 40450 Shah Alam, Selangor, Malaysia

Literature citedHusaini, O., Pauzi, N.I., Shariah, M.A., Yusof, Z.M., and

Maail,S. 2009. Microcracks pattern and the degree of  weathering in granite. Electronic Journal of Geotechnical Engineering 14: 1-21.

Lindqvist, L.E., Akesson, U., and Malaga, K. 2007Microstructure and functional properties of rockmaterials. Materials Characterization 58: 1183-1188.

Takemura ,T., Golshani, A., Oda, M., Suzuki, K. 2003.Preferred orientations of open micrcracks in graniteand their relation with anisotropic elasticity.International Journal of Rock Mechanics and MiningSciences40: 443-454.

Tugrul, A. 2004. The effect of weathering on pore geometry and compressive strength of selected rock types fromTurkey. Engineering Geology 75: 215-227.

Franklin ,J.A., and Dusseault, M.B. 1991. Rock engineeringapplication. McGraw-Hill, New York.

International Society for Rock Mechanics, RockCharacterisation, Testing and Monitoring. In: BrownET(Ed.), ISRM suggested methods. Oxford:Pergamon; 1981. p. 211

Figure 2. Rebound number and dry density of collected granitesamples. Note: WD denotes weathering degree.

Figure 5. Variation of micro and macro scale porosity dependingon the degree of weathering

For further informationPlease contact [email protected].

Fresh rock : porosities in the horizontal and verticaldirection are almost identical, since micro-cracks rarely develop and pore structure is relatively isotropic.

Moderate and highly weathered rock : the micro-cracks arefully developed and pore structure shows anisotropiccharacteristic in horizontal and vertical direction.

Inter-relation between Porosity and Engineering Properties

The changes of porosity due to the weathering process havesignificant influence on the various engineering properties.

• Compressive wave velocity decreases as the porosity increases.

• Resistivity decreases as the porosity increases.

• Uniaxial compressive strength decreases as theporosity increases.

Micro and macro approaches for characterization of porosity

depending on the weathering degree

Figure 1. Presenceof micro-crack inGranite

2.2

2.32.4

2.5

2.6

2.7

0 10 20 30 40 50 60 70

ReboundNumber,R

   D  r  y   D  e

  n  s   i   t  y   (  g   /  c  m

   3   )

 .

WDIWDII

WDIII

WDIV

Sampleplacedondessicator

 Weightthesample

Dry thesampleintheovenat105°C

 Weightthesample Figure 3.Saturation andcaliper methodtechnique

 Analytical image processing technique to determine theporosity from the images taken from the petrographicthin section is newly suggested in this study. Porosity calculated in this approach can be considered as microscale porosity 

Figure 4. Description of calculation process of analytical imageprocessing from petrographic thin section slide

0

2

4

6

8

10

12

14

16

0 10 20 30 40 50 60 70

ReboundNumber, R

   P  o  r  o  s   i   t  y

   (   %   )

WDI (Macro)

WDII(Macro)

WDIII(Macro)

WDIV(Macro)

Average (Macro)

WDI (Micro)

WDII(Micro)

WDIII(Micro)

WDIV(Micro)

Average (Micro)

Variation ofmacro

scale porosity

Varition ofmicro

scale porosity

porosity increases as the degree of weathering increases

0

1000

2000

3000

4000

5000

0 3 6 9 12 15

Porosity (%)

   C  o  m  p  r  e  s  s   i  v  e  w  a  v  e  v  e   l  o  c   i   t  y   (  m   /  s  e  c   ) WDI(Macro)

WDII(Macro)

WDIII(Macro)

WDIV(Macro)

Average (Macro)

WDI(Micro)

WDII(Micro)

WDIII(Micro)

WDIV(Micro)

Average (Micro)

Macro scale porosity vs

compressive wave velocity

Micro scale porosity vs

compressive wave

(a)

0

20

40

60

80

100

0 3 6 9 12 15

Porosity (%)

   U  n   i  a  x   i  a   l  c  o  m  p  r  e  s  s   i  v

  e  s   t  r  e  n  g   t   h   (   M   P  a   ) . . Macro scale porosity vs

uniaxialcompressive strength

Micro scale porosity vs

uniaxialcompressive strength

(c)


  v 

  v   v

  y

   /

WDI(Macro)

WDII(Macro)

WDIII(Macro)

WDIV(Macro)

Average (Macro)

WDI(Micro)

WDII(Micro)

WDIII(Micro)

WDIV(Micro)

Average (Micro)


1.0E+00

1.0E+01

1.0E+02

1.0E+03

1.0E+04

1.0E+05

1.0E+06

1.0E+07

0 3 6 9 12 15

Porosity (%)

   R  e  s   i  s   t   i  v   i   t  y   (   O   h  m  ·  m   ) .

Macro scale porosity vs resistivity in dry

Macro scale porosity vs resistivity in saturation

Microscale porosity vs resistivity in dry

Micro scale porosity vs resistivity in saturation

(b)


  v 

  v   v


   /

WDI(Macro)

WDII(Macro)

WDIII(Macro)

WDIV(Macro)

Average (Macro)

WDI(Micro)

WDII(Micro)

WDIII(Micro)

WDIV(Micro)

Average (Micro)

v

v v v

v

v v

Figure 7. Porosity against a) Compressive wave velocity,b) Resistivity, and c) Uniaxial compressive strength

Figure 6.Direction of micro-craks