Insciences Journal | Sensors ISSN 1664-171X
Insciences J. 2013, 3(2), 24-44; doi:10.5640/insc.030224 ISSN 1664-171X
Full Research Paper
Multispectral Plant Health Imaging System for Space Biology and
Hypobaric Plant Growth Studies
Talal Abboud 1,2,
*, Alain Berinstain 1, Matthew Bamsey
3, Robert Ferl
3,5, Anna-Lisa Paul
3,
Thomas Graham 4, Mike Dixon
4, Demos Leonardos
4, Michael Stasiak
4, and Rita Noumeir
2
1 Space Science and Technology, Canadian Space Agency, 6767 route de l’aéroport, Longueuil, QC
J3Y8Y9, Canada;
2 École de technologie supérieure, 1100 rue Notre-Dame O, Montréal, QC H3C1K3, Canada;
3 Horticultural Sciences, University of Florida, Gainesville, FL 32601, USA;
4 Controlled Environment Systems Research Facility, School of Environmental Sciences, University of
Guelph, 50 Stone Road East, Guelph, ON N1G2W1, Canada;
5 Interdisciplinary Center for Biotechnology Research, University of Florida, Gainesville, FL 32610,
USA
* Author to whom correspondence should be addressed; E-Mail: [email protected]
Received: 11 April 2013 / Accepted: 16 May 2013 / Published: 03 June 2013
Abstract: Ensuring high plant yields is critical for the application of higher plants to space-
based biological life support systems. An imager capable of monitoring several fluorescent
biological markers in real-time would provide a robust health monitoring system and allow
growers to minimize environmental stressors. This article reports the results of the design
and development of a multispectral plant health imager prototype, employed in a low-
pressure plant growth chamber as a test of its functionality in spaceflight systems. Images
were collected every four hours with a monochromatic camera and a commercial liquid
crystal tunable filter. This arrangement permitted the monitoring of emission from
introduced green fluorescent proteins as well as chlorophyll fluorescence. Data were saved
locally and accessed in real-time from the exterior of the chamber.
Keywords: plant health imaging; multispectral imaging; remote sensor; biological life support; space
analog.
25
Insciences Journal | Sensors ISSN 1664-171X
1. Introduction
Humans face a variety of challenges as they continue to explore beyond the frontiers of planet
Earth. Exploration missions are often severely constrained by launch mass and resupply
considerations. The use of plants as part of life support systems continues to be explored as an
approach for more sustained human presence in space. In particular, bioregenerative life support
systems have been considered since the early 20th
century [1]. The Canadian Space Agency, University
of Florida and University of Guelph have been involved in assessing the possibility of supporting
human presence on the Moon and Mars by deploying greenhouses as plant production system test-
beds [2, 3]. The main concept is the use of plants to regenerate the three cornerstones of human
consumable requirements; air, water and food [4]. Spaceflight and other extraterrestrial environments
provide unique challenges for plant life. There originates the importance of understanding the
metabolic issues that can influence plant growth and development in space. Plant monitoring systems
with the capacity to observe the condition of the crop in real-time within these systems would permit
operators to take immediate action to ensure optimum system yield and reliability. In addition to the
utilization of chlorophyll fluorescence, specific stress response genes can be tagged with reporter
genes encoding a variety of fluorescent proteins, allowing gene activities, and by extension plant
health, to be monitored through the fluorescence of these gene products [5]. The Transgenic
Arabidopsis Gene Expression System (TAGES) is a biosensor that uses Arabidopsis thaliana
fluorescence information from both naturally occurring chlorophyll red/near infrared fluorescence, as
well as green fluorescence originating from the gene products of green fluorescent protein (GFP)
reporter genes [6, 7]. Several commercial systems are available for imaging and capturing plant
fluorescence, but most analytical procedures involve laboratory examination and human input.
However, advanced biological experiments on orbit, the Moon, and Mars are likely to be autonomous,
precluding any direct human control over the monitoring/imaging systems. Furthermore, if a mission
does include a physical human presence, there are still system trade-off considerations between
internal greenhouse/growth chamber operating pressure, up-mass and crew time requirements that may
still dictate completely robotic and/or autonomous bioregenerative life support systems [8].
A Multispectral Plant Health Imaging System (M-PHIS) would provide a considerable step forward
in our capacity to monitor advanced life support crops in an autonomous manner [6, 9, 10, 11, 12].
This article describes the design and development of a prototype multispectral fluorescent imaging
system deployed in a hypobaric plant growth chamber at University of Guelph. The imager was
designed primarily for multiband imaging of chlorophyll and protein fluorescence with the design
being driven by portability and autonomous functionality considerations. The design was also novel in
that it employed a commercially available liquid crystal tunable filter (LCTF) and a custom developed
LED board with an independently variable grow light LED array. This prototype imager provided real-
time data while it was operated within a low pressure chamber through the use of a controller, a smart
camera, and a custom designed and variable outputs grow and excitation light emitting diode (LED)
light array. The deployment in a low-pressure chamber represents one of a number of possible space
analogue and on orbit deployment scenarios. The results of this work will direct future efforts in this
area of research and drive further design improvements.
26
Insciences Journal | Sensors ISSN 1664-171X
2. Materials and Methods
The primary improvement of the M-PHIS over previously developed space analogue plant health
imagers employed by this research team is its ability to selectively detect fluorescence at user
selectable center wavelengths and bandwidths. In particular, the LCTF permits the ability to monitor
plant-emitted light at any wavelength between 420 and 730 nm and at varied bandwidths. A custom
developed LED board furthers the imager selectivity through highly controllable grow light output and
selection of varied excitation energy and center wavelengths and thus better permits the targeting of
individual fluorophores [compounds that can re-emit light upon excitation] of interest.
2.1. Excitation, Emission and Imaging Capture Requirements
Green fluorescent protein fluoresces in the green waveband when exposed to light in the blue
through ultraviolet wavebands. Many GFP variants exist; however, the S65T variant is utilized in this
hardware demonstration and characterization study (the S65T variant will be referred to simply as GFP
for the remainder of this paper). GFP emission arises within the green portion of the visible spectrum
with a peak at approximately 512 nm [6, 13]. However, fluorescence emitted by GFP covers a
considerable bandwidth, meaning that useful data is also available on either side of this λ = 512 nm
emission peak. It is important to note that GFP’s excitation peak is at approximately λ = 488 nm and
that this wavelength is very close to the short end of the GFP emission spectrum [6, 14] . This small
separation implies that care must be taken to ensure that the excitation light is sufficiently filtered to
guarantee no overlap with the emitted light from the sample. This can be achieved by selecting
excitation lights that do not radiate above some specified wavelength, or more easily, by filtering all
wavelengths above the selected wavelength; in this case, approximately 493 nm. For GFP fluorescence
the image sensor must then be capable of monitoring wavelengths between 502 and 550 nm.
Chlorophyll autofluorescence e.g. red (630 – 680 nm) and NIR (>680 nm) can be excited across a
broad wavelength region spanning 250 to 675 nm with excitation peaks at 430 nm, 470 nm, 600 nm
and 660 nm [15].
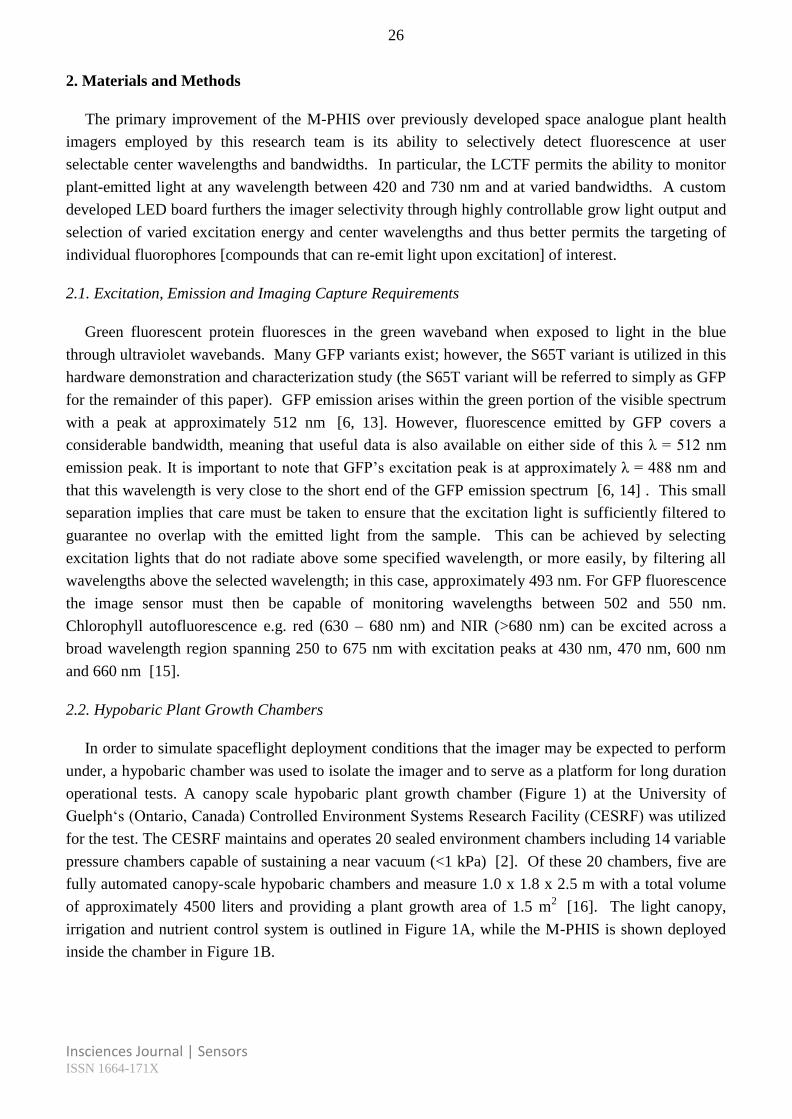
2.2. Hypobaric Plant Growth Chambers
In order to simulate spaceflight deployment conditions that the imager may be expected to perform
under, a hypobaric chamber was used to isolate the imager and to serve as a platform for long duration
operational tests. A canopy scale hypobaric plant growth chamber (Figure 1) at the University of
Guelph‘s (Ontario, Canada) Controlled Environment Systems Research Facility (CESRF) was utilized
for the test. The CESRF maintains and operates 20 sealed environment chambers including 14 variable
pressure chambers capable of sustaining a near vacuum (<1 kPa) [2]. Of these 20 chambers, five are
fully automated canopy-scale hypobaric chambers and measure 1.0 x 1.8 x 2.5 m with a total volume
of approximately 4500 liters and providing a plant growth area of 1.5 m2 [16]. The light canopy,
irrigation and nutrient control system is outlined in Figure 1A, while the M-PHIS is shown deployed
inside the chamber in Figure 1B.
27
Insciences Journal | Sensors ISSN 1664-171X
Figure 1. Canopy-scale hypobaric chambers at the Controlled Environment Systems Research Facility
(CESRF), University of Guelph: A) Exterior showing lighting canopy, irrigation and nutrient control
system, B) M-PHIS deployed in a CESRF hypobaric plant growth chamber.
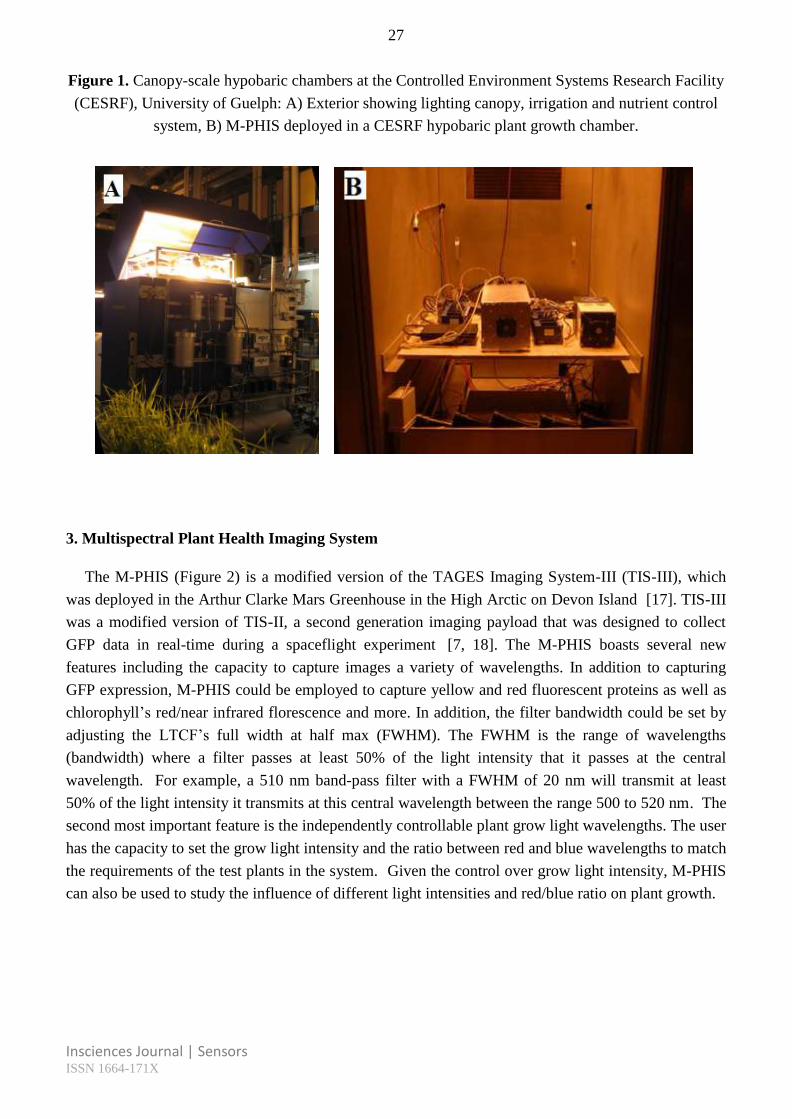
3. Multispectral Plant Health Imaging System
The M-PHIS (Figure 2) is a modified version of the TAGES Imaging System-III (TIS-III), which
was deployed in the Arthur Clarke Mars Greenhouse in the High Arctic on Devon Island [17]. TIS-III
was a modified version of TIS-II, a second generation imaging payload that was designed to collect
GFP data in real-time during a spaceflight experiment [7, 18]. The M-PHIS boasts several new
features including the capacity to capture images a variety of wavelengths. In addition to capturing
GFP expression, M-PHIS could be employed to capture yellow and red fluorescent proteins as well as
chlorophyll’s red/near infrared florescence and more. In addition, the filter bandwidth could be set by
adjusting the LTCF’s full width at half max (FWHM). The FWHM is the range of wavelengths
(bandwidth) where a filter passes at least 50% of the light intensity that it passes at the central
wavelength. For example, a 510 nm band-pass filter with a FWHM of 20 nm will transmit at least
50% of the light intensity it transmits at this central wavelength between the range 500 to 520 nm. The
second most important feature is the independently controllable plant grow light wavelengths. The user
has the capacity to set the grow light intensity and the ratio between red and blue wavelengths to match
the requirements of the test plants in the system. Given the control over grow light intensity, M-PHIS
can also be used to study the influence of different light intensities and red/blue ratio on plant growth.
28
Insciences Journal | Sensors ISSN 1664-171X
3.1. Hardware
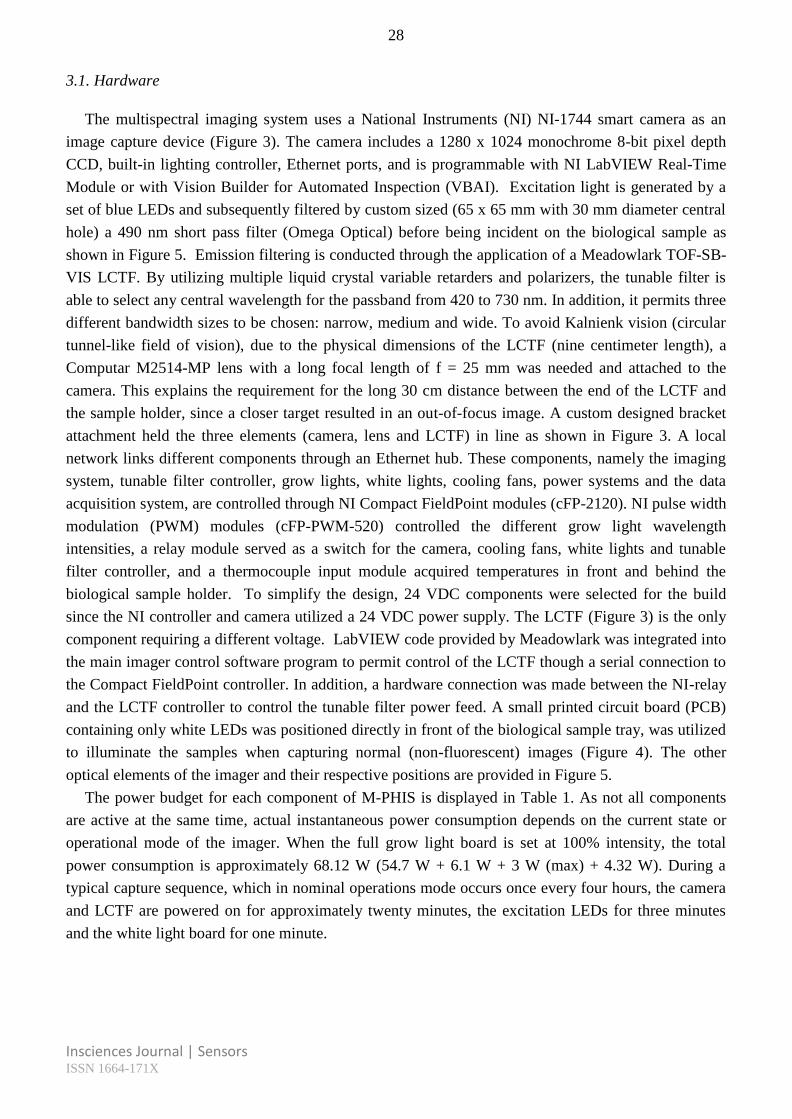
The multispectral imaging system uses a National Instruments (NI) NI-1744 smart camera as an
image capture device (Figure 3). The camera includes a 1280 x 1024 monochrome 8-bit pixel depth
CCD, built-in lighting controller, Ethernet ports, and is programmable with NI LabVIEW Real-Time
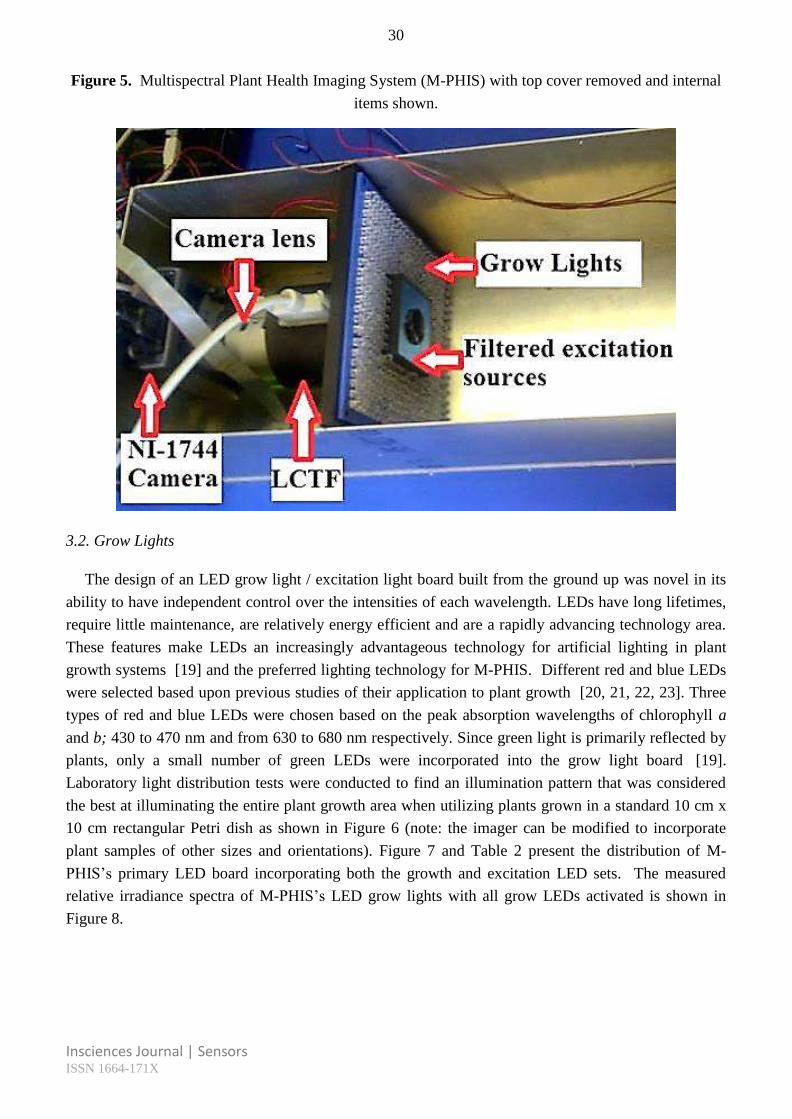
Module or with Vision Builder for Automated Inspection (VBAI). Excitation light is generated by a
set of blue LEDs and subsequently filtered by custom sized (65 x 65 mm with 30 mm diameter central
hole) a 490 nm short pass filter (Omega Optical) before being incident on the biological sample as
shown in Figure 5. Emission filtering is conducted through the application of a Meadowlark TOF-SB-
VIS LCTF. By utilizing multiple liquid crystal variable retarders and polarizers, the tunable filter is
able to select any central wavelength for the passband from 420 to 730 nm. In addition, it permits three
different bandwidth sizes to be chosen: narrow, medium and wide. To avoid Kalnienk vision (circular
tunnel-like field of vision), due to the physical dimensions of the LCTF (nine centimeter length), a
Computar M2514-MP lens with a long focal length of f = 25 mm was needed and attached to the
camera. This explains the requirement for the long 30 cm distance between the end of the LCTF and
the sample holder, since a closer target resulted in an out-of-focus image. A custom designed bracket
attachment held the three elements (camera, lens and LCTF) in line as shown in Figure 3. A local
network links different components through an Ethernet hub. These components, namely the imaging
system, tunable filter controller, grow lights, white lights, cooling fans, power systems and the data
acquisition system, are controlled through NI Compact FieldPoint modules (cFP-2120). NI pulse width
modulation (PWM) modules (cFP-PWM-520) controlled the different grow light wavelength
intensities, a relay module served as a switch for the camera, cooling fans, white lights and tunable
filter controller, and a thermocouple input module acquired temperatures in front and behind the
biological sample holder. To simplify the design, 24 VDC components were selected for the build
since the NI controller and camera utilized a 24 VDC power supply. The LCTF (Figure 3) is the only
component requiring a different voltage. LabVIEW code provided by Meadowlark was integrated into
the main imager control software program to permit control of the LCTF though a serial connection to
the Compact FieldPoint controller. In addition, a hardware connection was made between the NI-relay
and the LCTF controller to control the tunable filter power feed. A small printed circuit board (PCB)
containing only white LEDs was positioned directly in front of the biological sample tray, was utilized
to illuminate the samples when capturing normal (non-fluorescent) images (Figure 4). The other
optical elements of the imager and their respective positions are provided in Figure 5.
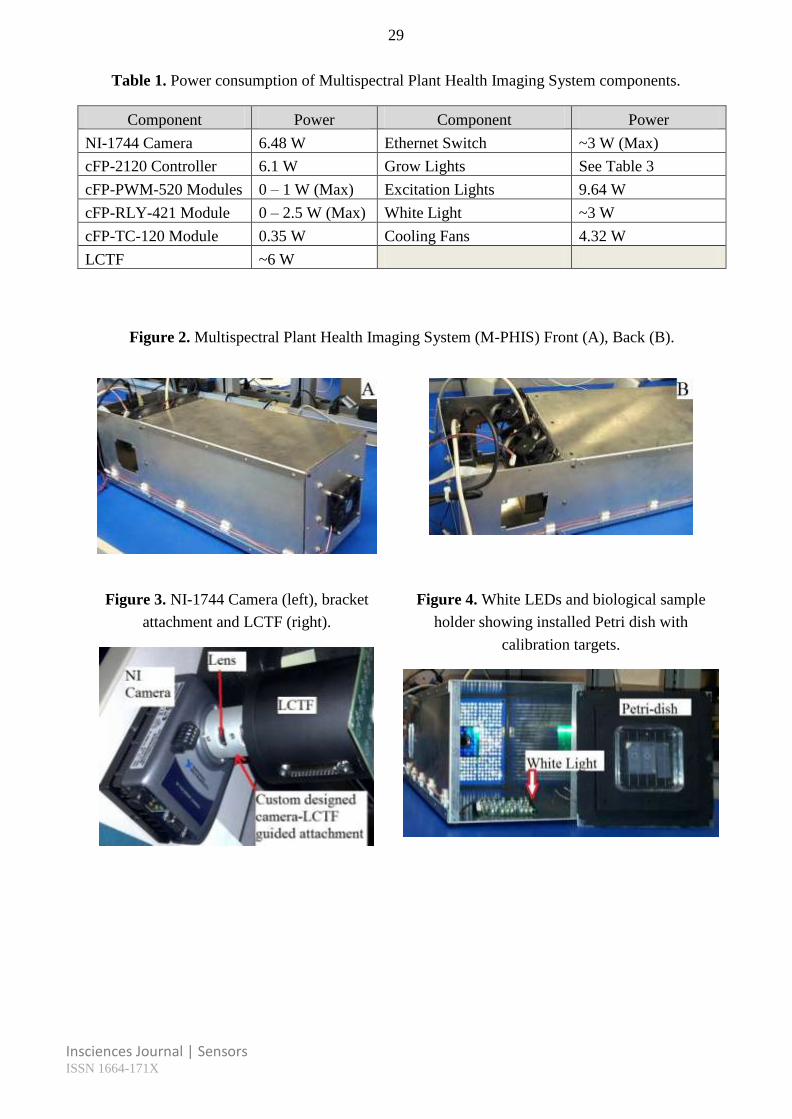
The power budget for each component of M-PHIS is displayed in Table 1. As not all components
are active at the same time, actual instantaneous power consumption depends on the current state or
operational mode of the imager. When the full grow light board is set at 100% intensity, the total
power consumption is approximately 68.12 W (54.7 W + 6.1 W + 3 W (max) + 4.32 W). During a
typical capture sequence, which in nominal operations mode occurs once every four hours, the camera
and LCTF are powered on for approximately twenty minutes, the excitation LEDs for three minutes
and the white light board for one minute.
29
Insciences Journal | Sensors ISSN 1664-171X
Table 1. Power consumption of Multispectral Plant Health Imaging System components.
Component Power Component Power
NI-1744 Camera 6.48 W Ethernet Switch ~3 W (Max)
cFP-2120 Controller 6.1 W Grow Lights See Table 3
cFP-PWM-520 Modules 0 – 1 W (Max) Excitation Lights 9.64 W
cFP-RLY-421 Module 0 – 2.5 W (Max) White Light ~3 W
cFP-TC-120 Module 0.35 W Cooling Fans 4.32 W
LCTF ~6 W
Figure 2. Multispectral Plant Health Imaging System (M-PHIS) Front (A), Back (B).
Figure 3. NI-1744 Camera (left), bracket
attachment and LCTF (right).
Figure 4. White LEDs and biological sample
holder showing installed Petri dish with
calibration targets.
30
Insciences Journal | Sensors ISSN 1664-171X
Figure 5. Multispectral Plant Health Imaging System (M-PHIS) with top cover removed and internal
items shown.
3.2. Grow Lights
The design of an LED grow light / excitation light board built from the ground up was novel in its
ability to have independent control over the intensities of each wavelength. LEDs have long lifetimes,
require little maintenance, are relatively energy efficient and are a rapidly advancing technology area.
These features make LEDs an increasingly advantageous technology for artificial lighting in plant
growth systems [19] and the preferred lighting technology for M-PHIS. Different red and blue LEDs
were selected based upon previous studies of their application to plant growth [20, 21, 22, 23]. Three
types of red and blue LEDs were chosen based on the peak absorption wavelengths of chlorophyll a
and b; 430 to 470 nm and from 630 to 680 nm respectively. Since green light is primarily reflected by
plants, only a small number of green LEDs were incorporated into the grow light board [19].
Laboratory light distribution tests were conducted to find an illumination pattern that was considered
the best at illuminating the entire plant growth area when utilizing plants grown in a standard 10 cm x
10 cm rectangular Petri dish as shown in Figure 6 (note: the imager can be modified to incorporate
plant samples of other sizes and orientations). Figure 7 and Table 2 present the distribution of M-
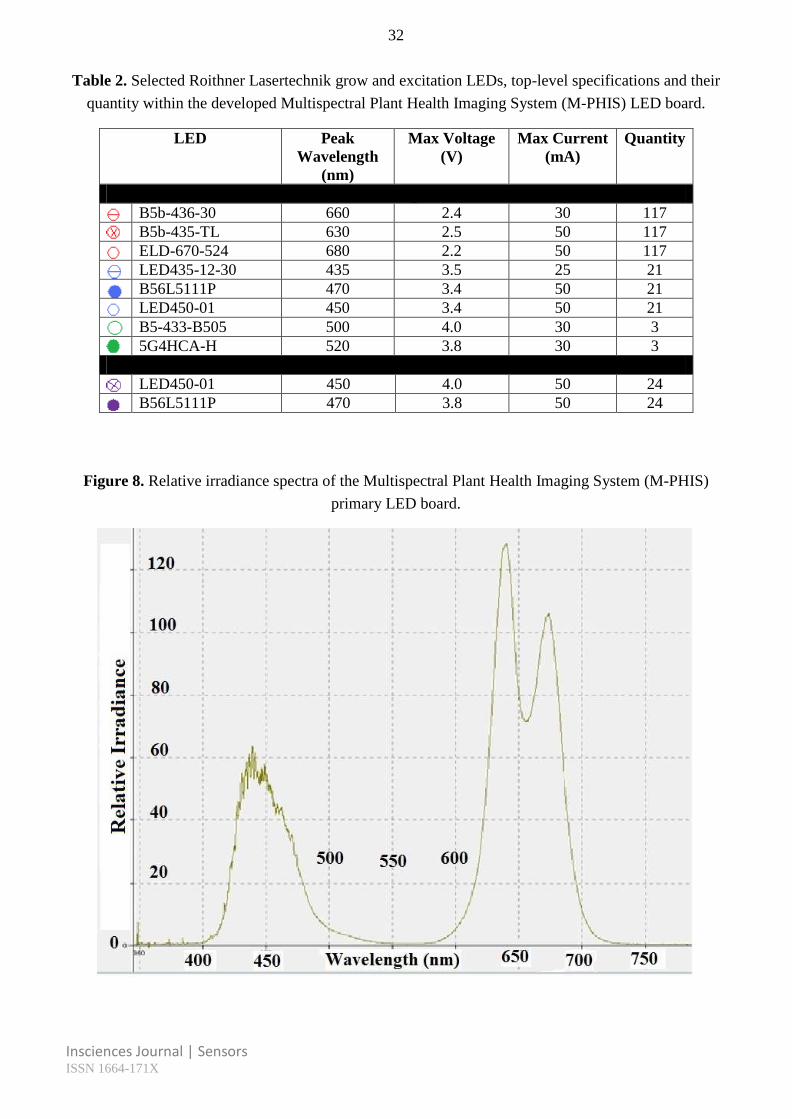
PHIS’s primary LED board incorporating both the growth and excitation LED sets. The measured
relative irradiance spectra of M-PHIS’s LED grow lights with all grow LEDs activated is shown in
Figure 8.
31
Insciences Journal | Sensors ISSN 1664-171X
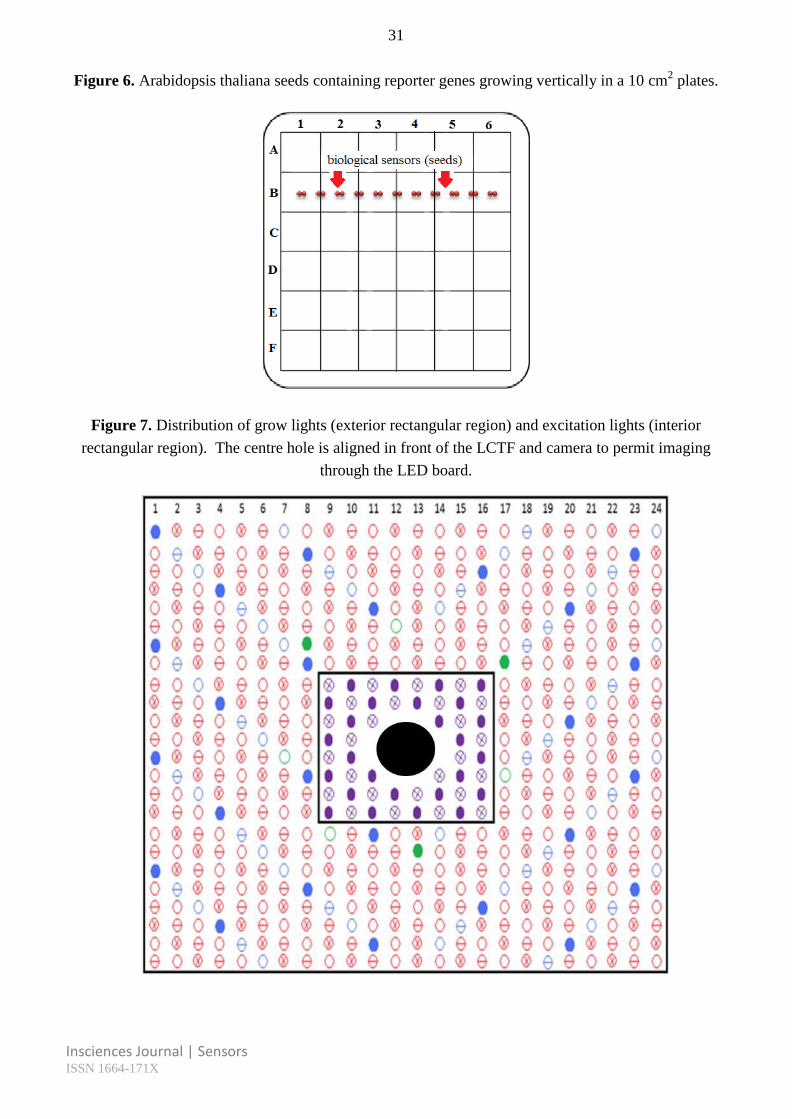
Figure 6. Arabidopsis thaliana seeds containing reporter genes growing vertically in a 10 cm2 plates.
Figure 7. Distribution of grow lights (exterior rectangular region) and excitation lights (interior
rectangular region). The centre hole is aligned in front of the LCTF and camera to permit imaging
through the LED board.
32
Insciences Journal | Sensors ISSN 1664-171X
Table 2. Selected Roithner Lasertechnik grow and excitation LEDs, top-level specifications and their
quantity within the developed Multispectral Plant Health Imaging System (M-PHIS) LED board.
LED Peak
Wavelength
(nm)
Max Voltage
(V)
Max Current
(mA)
Quantity
Grow Lights
B5b-436-30 660 2.4 30 117
B5b-435-TL 630 2.5 50 117
ELD-670-524 680 2.2 50 117
LED435-12-30 435 3.5 25 21
B56L5111P 470 3.4 50 21
LED450-01 450 3.4 50 21
B5-433-B505 500 4.0 30 3
5G4HCA-H 520 3.8 30 3
Excitation Lights
LED450-01 450 4.0 50 24
B56L5111P 470 3.8 50 24
Figure 8. Relative irradiance spectra of the Multispectral Plant Health Imaging System (M-PHIS)
primary LED board.
33
Insciences Journal | Sensors ISSN 1664-171X
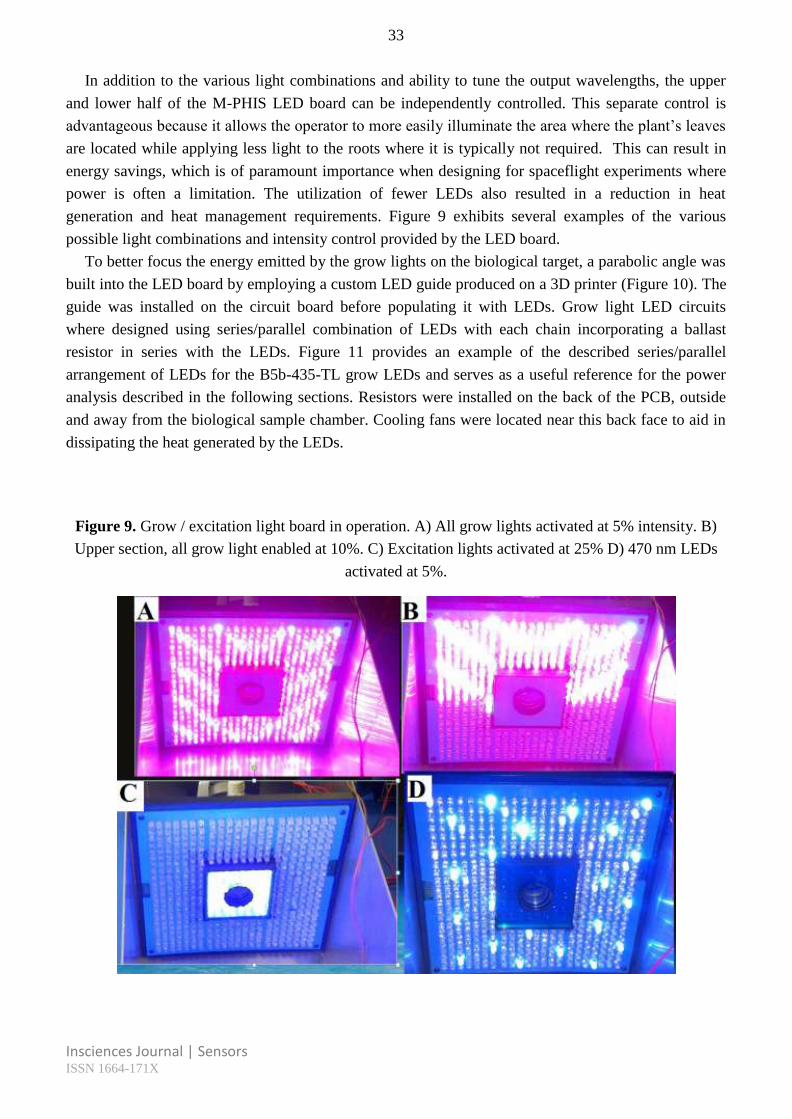
In addition to the various light combinations and ability to tune the output wavelengths, the upper
and lower half of the M-PHIS LED board can be independently controlled. This separate control is
advantageous because it allows the operator to more easily illuminate the area where the plant’s leaves
are located while applying less light to the roots where it is typically not required. This can result in
energy savings, which is of paramount importance when designing for spaceflight experiments where
power is often a limitation. The utilization of fewer LEDs also resulted in a reduction in heat
generation and heat management requirements. Figure 9 exhibits several examples of the various
possible light combinations and intensity control provided by the LED board.
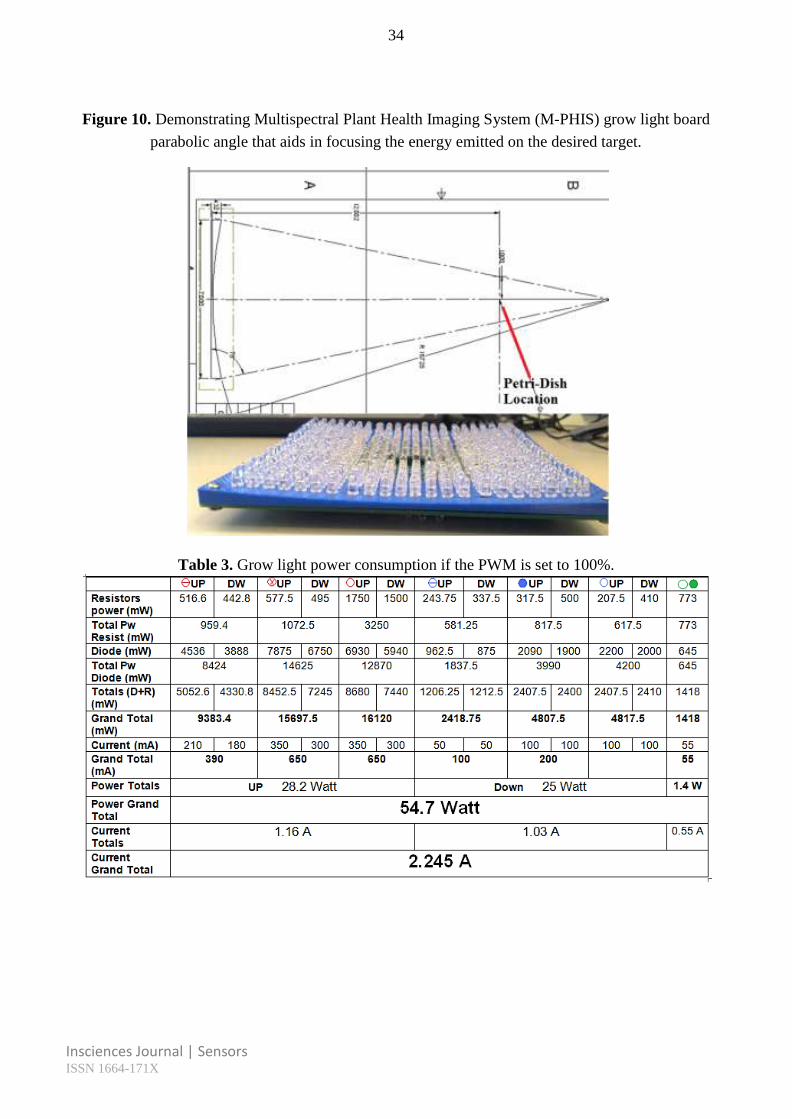
To better focus the energy emitted by the grow lights on the biological target, a parabolic angle was
built into the LED board by employing a custom LED guide produced on a 3D printer (Figure 10). The
guide was installed on the circuit board before populating it with LEDs. Grow light LED circuits
where designed using series/parallel combination of LEDs with each chain incorporating a ballast
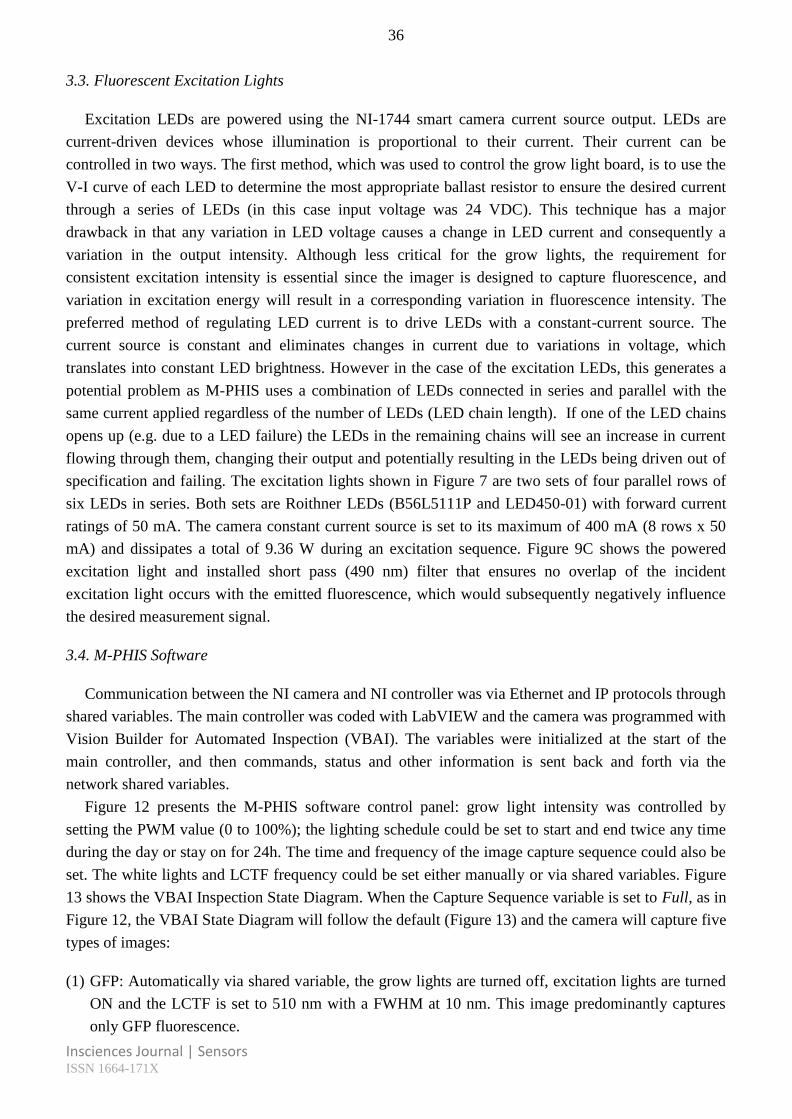
resistor in series with the LEDs. Figure 11 provides an example of the described series/parallel
arrangement of LEDs for the B5b-435-TL grow LEDs and serves as a useful reference for the power
analysis described in the following sections. Resistors were installed on the back of the PCB, outside
and away from the biological sample chamber. Cooling fans were located near this back face to aid in
dissipating the heat generated by the LEDs.
Figure 9. Grow / excitation light board in operation. A) All grow lights activated at 5% intensity. B)
Upper section, all grow light enabled at 10%. C) Excitation lights activated at 25% D) 470 nm LEDs
activated at 5%.
34
Insciences Journal | Sensors ISSN 1664-171X
Figure 10. Demonstrating Multispectral Plant Health Imaging System (M-PHIS) grow light board
parabolic angle that aids in focusing the energy emitted on the desired target.
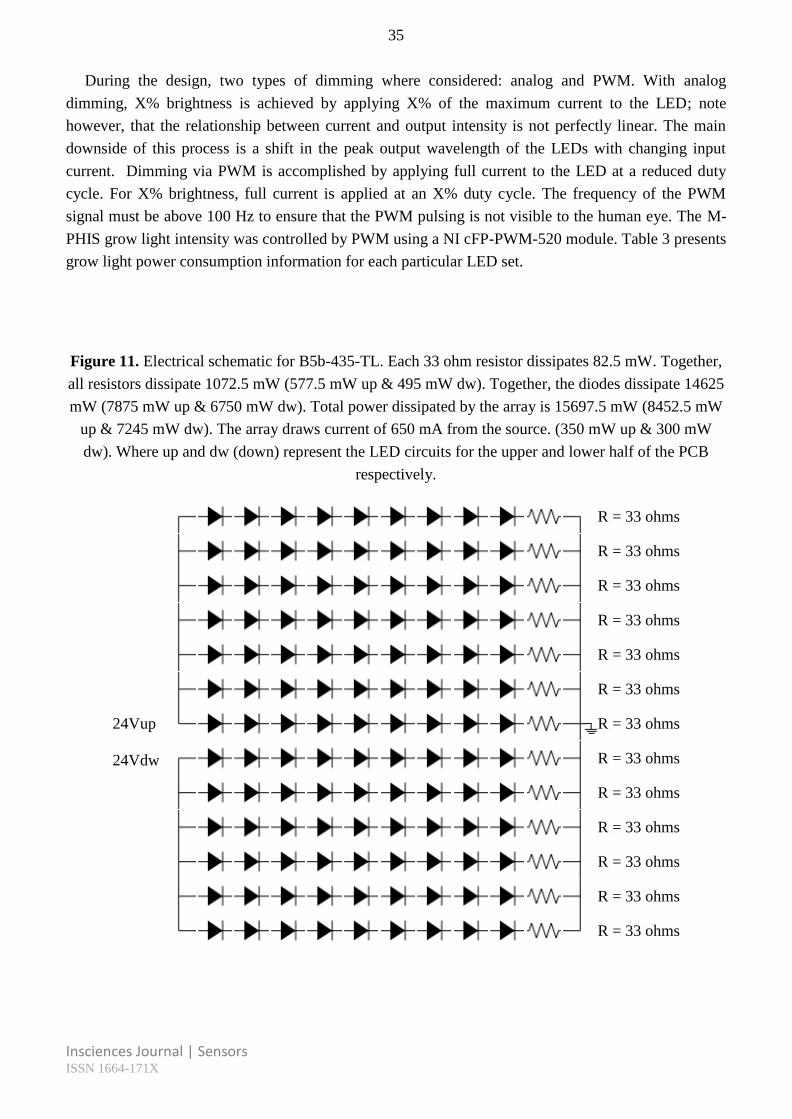
Table 3. Grow light power consumption if the PWM is set to 100%.
35
Insciences Journal | Sensors ISSN 1664-171X
During the design, two types of dimming where considered: analog and PWM. With analog
dimming, X% brightness is achieved by applying X% of the maximum current to the LED; note
however, that the relationship between current and output intensity is not perfectly linear. The main
downside of this process is a shift in the peak output wavelength of the LEDs with changing input
current. Dimming via PWM is accomplished by applying full current to the LED at a reduced duty
cycle. For X% brightness, full current is applied at an X% duty cycle. The frequency of the PWM
signal must be above 100 Hz to ensure that the PWM pulsing is not visible to the human eye. The M-
PHIS grow light intensity was controlled by PWM using a NI cFP-PWM-520 module. Table 3 presents
grow light power consumption information for each particular LED set.
Figure 11. Electrical schematic for B5b-435-TL. Each 33 ohm resistor dissipates 82.5 mW. Together,
all resistors dissipate 1072.5 mW (577.5 mW up & 495 mW dw). Together, the diodes dissipate 14625
mW (7875 mW up & 6750 mW dw). Total power dissipated by the array is 15697.5 mW (8452.5 mW
up & 7245 mW dw). The array draws current of 650 mA from the source. (350 mW up & 300 mW
dw). Where up and dw (down) represent the LED circuits for the upper and lower half of the PCB
respectively.
24Vup
24Vdw
R = 33 ohms
R = 33 ohms
R = 33 ohms
R = 33 ohms
R = 33 ohms
R = 33 ohms
R = 33 ohms
R = 33 ohms
R = 33 ohms
R = 33 ohms
R = 33 ohms
R = 33 ohms
R = 33 ohms
36
Insciences Journal | Sensors ISSN 1664-171X
3.3. Fluorescent Excitation Lights
Excitation LEDs are powered using the NI-1744 smart camera current source output. LEDs are
current-driven devices whose illumination is proportional to their current. Their current can be
controlled in two ways. The first method, which was used to control the grow light board, is to use the
V-I curve of each LED to determine the most appropriate ballast resistor to ensure the desired current
through a series of LEDs (in this case input voltage was 24 VDC). This technique has a major
drawback in that any variation in LED voltage causes a change in LED current and consequently a
variation in the output intensity. Although less critical for the grow lights, the requirement for
consistent excitation intensity is essential since the imager is designed to capture fluorescence, and
variation in excitation energy will result in a corresponding variation in fluorescence intensity. The
preferred method of regulating LED current is to drive LEDs with a constant-current source. The
current source is constant and eliminates changes in current due to variations in voltage, which
translates into constant LED brightness. However in the case of the excitation LEDs, this generates a
potential problem as M-PHIS uses a combination of LEDs connected in series and parallel with the
same current applied regardless of the number of LEDs (LED chain length). If one of the LED chains
opens up (e.g. due to a LED failure) the LEDs in the remaining chains will see an increase in current
flowing through them, changing their output and potentially resulting in the LEDs being driven out of
specification and failing. The excitation lights shown in Figure 7 are two sets of four parallel rows of
six LEDs in series. Both sets are Roithner LEDs (B56L5111P and LED450-01) with forward current
ratings of 50 mA. The camera constant current source is set to its maximum of 400 mA (8 rows x 50
mA) and dissipates a total of 9.36 W during an excitation sequence. Figure 9C shows the powered
excitation light and installed short pass (490 nm) filter that ensures no overlap of the incident
excitation light occurs with the emitted fluorescence, which would subsequently negatively influence
the desired measurement signal.
3.4. M-PHIS Software
Communication between the NI camera and NI controller was via Ethernet and IP protocols through
shared variables. The main controller was coded with LabVIEW and the camera was programmed with
Vision Builder for Automated Inspection (VBAI). The variables were initialized at the start of the
main controller, and then commands, status and other information is sent back and forth via the
network shared variables.
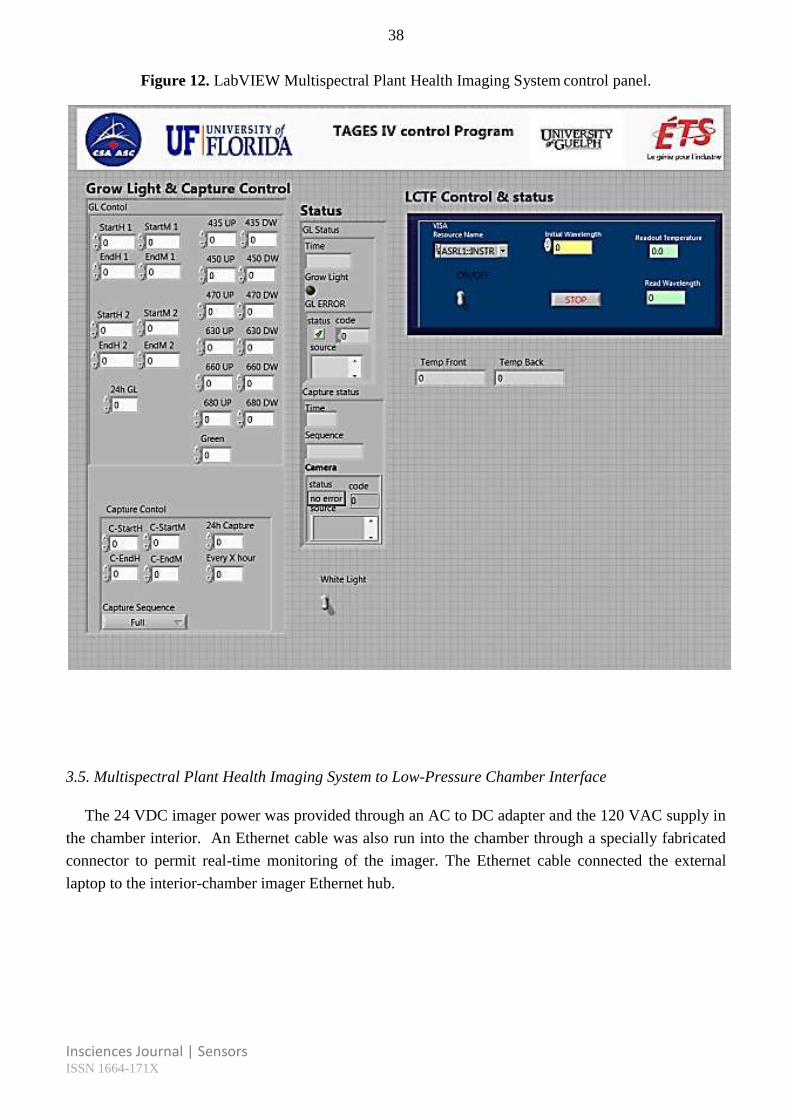
Figure 12 presents the M-PHIS software control panel: grow light intensity was controlled by
setting the PWM value (0 to 100%); the lighting schedule could be set to start and end twice any time
during the day or stay on for 24h. The time and frequency of the image capture sequence could also be
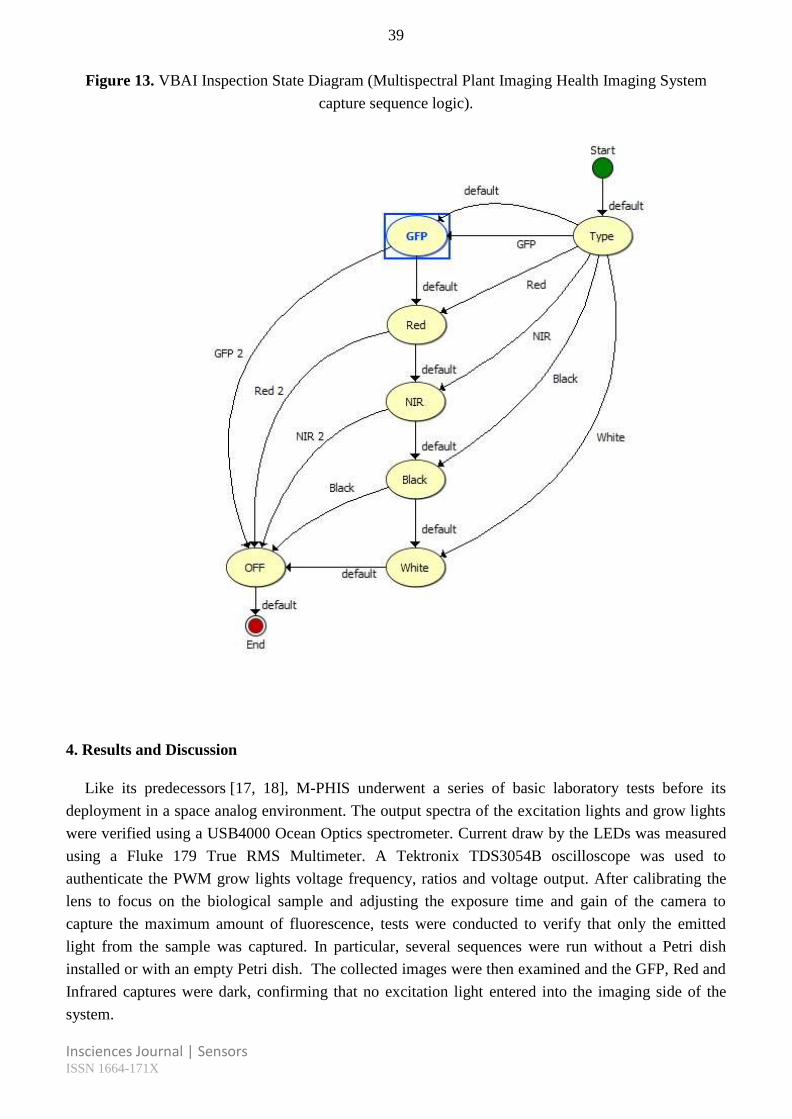
set. The white lights and LCTF frequency could be set either manually or via shared variables. Figure
13 shows the VBAI Inspection State Diagram. When the Capture Sequence variable is set to Full, as in
Figure 12, the VBAI State Diagram will follow the default (Figure 13) and the camera will capture five
types of images:
(1) GFP: Automatically via shared variable, the grow lights are turned off, excitation lights are turned
ON and the LCTF is set to 510 nm with a FWHM at 10 nm. This image predominantly captures
only GFP fluorescence.
37
Insciences Journal | Sensors ISSN 1664-171X
(2) RED: Same as the GFP except the LCTF is set to 630 nm with a FWHM at 20 nm. This image
predominantly captures only red chlorophyll fluorescence.
(3) NIR: Same as the two above except the LCTF is set to 730 nm with a FWHM at 20 nm. This image
predominantly captures only near infrared chlorophyll fluorescence.
(4) Black: All lights are off. This image is subtracted from the GFP image to remove certain CCD
imperfections (e.g. bad pixels).
(5) White: The white lights are on. This image produces a regular ‘white light’ image.
All images files are saved in two formats. The Tagged Image File Format (TIFF) [24] is a flexible
format that normally saves 8 bits or 16 bits of pixel depth per color (8 bits equal 256 level of gray in
our case) and uses a lossless compression. For the implemented camera, the file size was 1.25 MB per
image when the resolution was set to 1280 x 1024. The second format was JPEG (Joint Photographic
Experts Group) [25], a "lossy" compression method that compresses data by discarding (losing) some
of it. The process aims to minimize the amount of data that needs to be transferred telemetrically, an
important consideration for remote deployments of this imager and the primary reason why the M-
PHIS is configured to also save in the JPEG format. The camera stored the data on the cFP-2120
controller’s 4 GB compact flash card with filenames of the following format; ddmmyy-HHMMSS-
type-Image-temp-Fxx-Bxx.tif (or jpg) where Fxx and Bxx are the temperatures of the front and back of
the Petri plate at the time of the image capture. Temperature data is also saved to a separate text file at
a one minute frequency. When the imager is physically accessible or communication bandwidth
permits, TIFF images are downloaded from the imager and serve as the main dataset for scientific
studies and in-depth image analysis.
38
Insciences Journal | Sensors ISSN 1664-171X
Figure 12. LabVIEW Multispectral Plant Health Imaging System control panel.
3.5. Multispectral Plant Health Imaging System to Low-Pressure Chamber Interface
The 24 VDC imager power was provided through an AC to DC adapter and the 120 VAC supply in
the chamber interior. An Ethernet cable was also run into the chamber through a specially fabricated
connector to permit real-time monitoring of the imager. The Ethernet cable connected the external
laptop to the interior-chamber imager Ethernet hub.
39
Insciences Journal | Sensors ISSN 1664-171X
Figure 13. VBAI Inspection State Diagram (Multispectral Plant Imaging Health Imaging System
capture sequence logic).
4. Results and Discussion
Like its predecessors [17, 18], M-PHIS underwent a series of basic laboratory tests before its
deployment in a space analog environment. The output spectra of the excitation lights and grow lights
were verified using a USB4000 Ocean Optics spectrometer. Current draw by the LEDs was measured
using a Fluke 179 True RMS Multimeter. A Tektronix TDS3054B oscilloscope was used to
authenticate the PWM grow lights voltage frequency, ratios and voltage output. After calibrating the
lens to focus on the biological sample and adjusting the exposure time and gain of the camera to
capture the maximum amount of fluorescence, tests were conducted to verify that only the emitted
light from the sample was captured. In particular, several sequences were run without a Petri dish
installed or with an empty Petri dish. The collected images were then examined and the GFP, Red and
Infrared captures were dark, confirming that no excitation light entered into the imaging side of the
system.
40
Insciences Journal | Sensors ISSN 1664-171X
4.1. Short Duration Low Pressure Run
The imager was installed in a hypobaric chamber at CESRF to evaluate the ability of the imager to
capture images of induced GFP, natural red and near-infrared fluorescence and simulate plant health
studies in a hypobaric environment. The testing was also designed to shed light on the operational
constraints that a fully automated plant health imaging system may face on-orbit or other spaceflight
scenarios.
Although the imager hardware and software went through several weeks of operational testing prior
to deployment at CESRF, it was still unknown if the imager would operate at the low atmospheric
pressures planned for the experiment. Such extreme operational conditions are far from standard, and
as such no data was available regarding low pressure operation of each individual imager component.
To address this question of operability under low pressure, a preliminary test was performed without
biological samples in the imager. On February 16 2012, the imager was installed in the hypobaric
chamber and set to capture a Full sequence (GFP, Red, InfraRed, Black and White) every 20 minutes
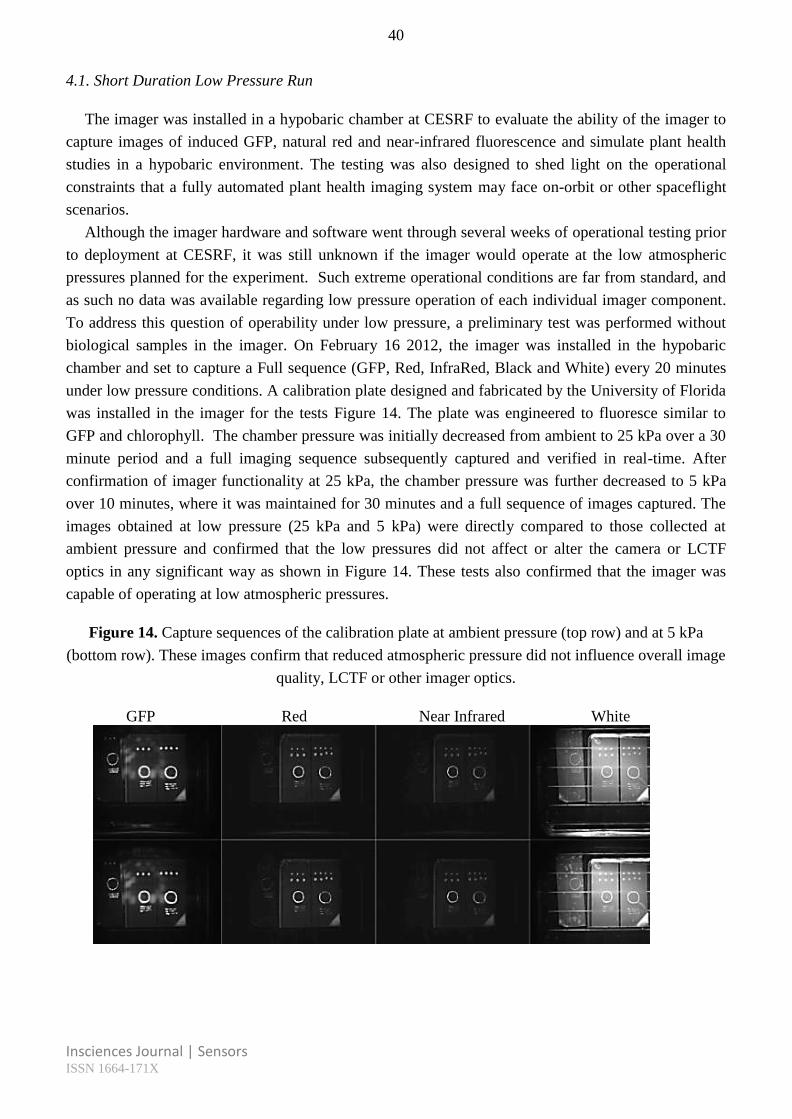
under low pressure conditions. A calibration plate designed and fabricated by the University of Florida
was installed in the imager for the tests Figure 14. The plate was engineered to fluoresce similar to
GFP and chlorophyll. The chamber pressure was initially decreased from ambient to 25 kPa over a 30
minute period and a full imaging sequence subsequently captured and verified in real-time. After
confirmation of imager functionality at 25 kPa, the chamber pressure was further decreased to 5 kPa
over 10 minutes, where it was maintained for 30 minutes and a full sequence of images captured. The
images obtained at low pressure (25 kPa and 5 kPa) were directly compared to those collected at
ambient pressure and confirmed that the low pressures did not affect or alter the camera or LCTF
optics in any significant way as shown in Figure 14. These tests also confirmed that the imager was
capable of operating at low atmospheric pressures.
Figure 14. Capture sequences of the calibration plate at ambient pressure (top row) and at 5 kPa
(bottom row). These images confirm that reduced atmospheric pressure did not influence overall image
quality, LCTF or other imager optics.
GFP Red Near Infrared White
41
Insciences Journal | Sensors ISSN 1664-171X
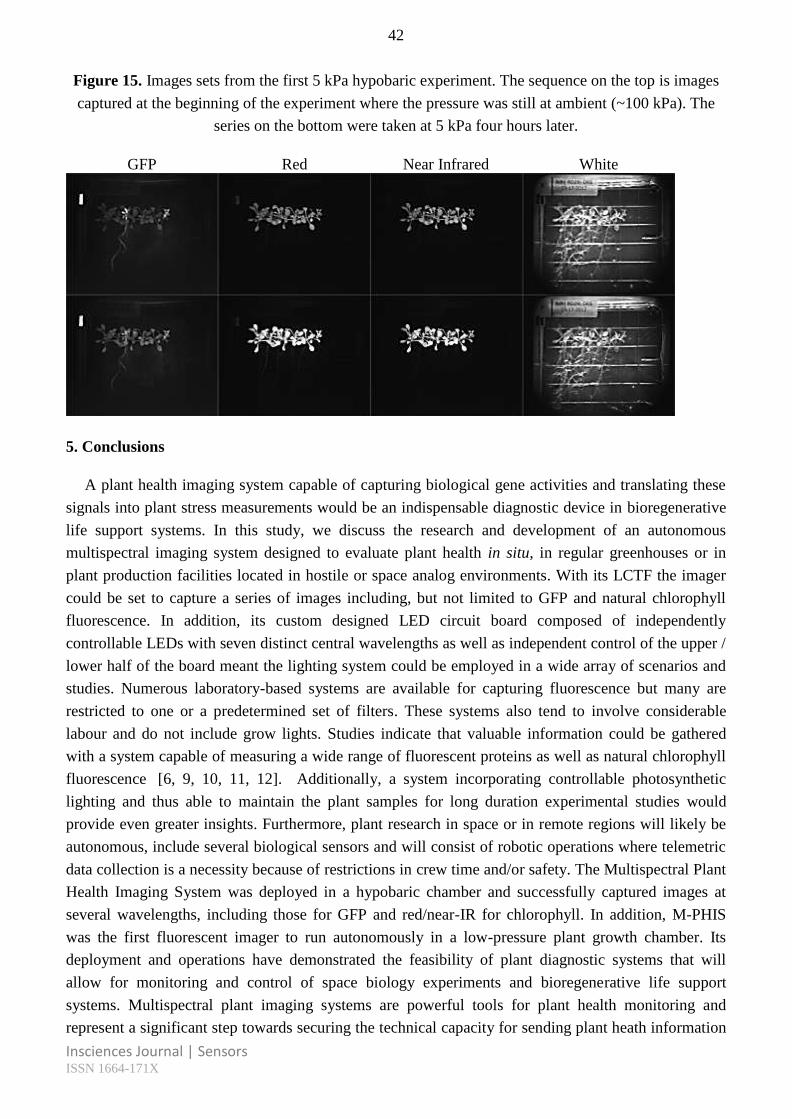
4.2. Long Duration Low Pressure Run
Following the general confirmation of M-PHIS functionality in low-pressure environments, a long
duration low pressure run utilizing actual biological samples was conducted. After the chamber was
closed for the first 5 kPa run, M-PHIS was set to capture a sequence of images (GFP, Red, Infrared,
Black, and White) at the start and every four hours thereafter for a period of forty-eight hours. This
meant that the first capture sequence was taken when the chamber pressure was still at ambient. The
chamber reached 5 kPa 84-min following initiation of pressure draw-down. The second series of
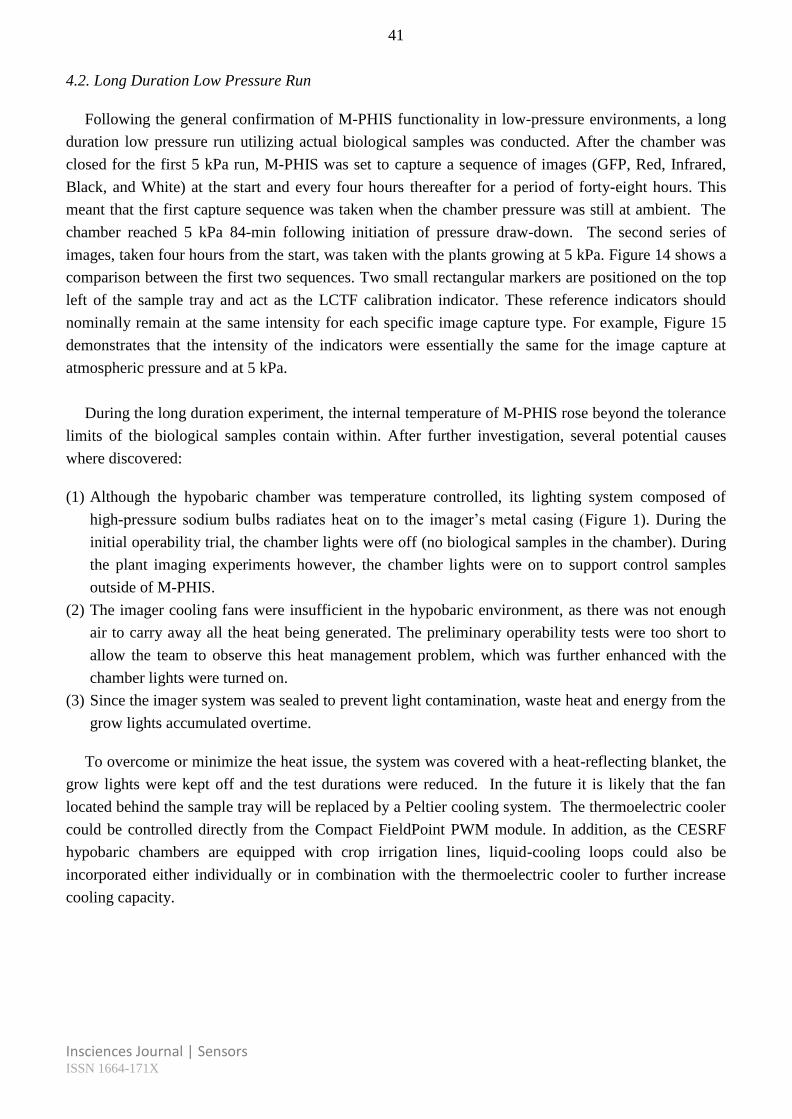
images, taken four hours from the start, was taken with the plants growing at 5 kPa. Figure 14 shows a
comparison between the first two sequences. Two small rectangular markers are positioned on the top
left of the sample tray and act as the LCTF calibration indicator. These reference indicators should
nominally remain at the same intensity for each specific image capture type. For example, Figure 15
demonstrates that the intensity of the indicators were essentially the same for the image capture at
atmospheric pressure and at 5 kPa.
During the long duration experiment, the internal temperature of M-PHIS rose beyond the tolerance
limits of the biological samples contain within. After further investigation, several potential causes
where discovered:
(1) Although the hypobaric chamber was temperature controlled, its lighting system composed of
high-pressure sodium bulbs radiates heat on to the imager’s metal casing (Figure 1). During the
initial operability trial, the chamber lights were off (no biological samples in the chamber). During
the plant imaging experiments however, the chamber lights were on to support control samples
outside of M-PHIS.
(2) The imager cooling fans were insufficient in the hypobaric environment, as there was not enough
air to carry away all the heat being generated. The preliminary operability tests were too short to
allow the team to observe this heat management problem, which was further enhanced with the
chamber lights were turned on.
(3) Since the imager system was sealed to prevent light contamination, waste heat and energy from the
grow lights accumulated overtime.
To overcome or minimize the heat issue, the system was covered with a heat-reflecting blanket, the
grow lights were kept off and the test durations were reduced. In the future it is likely that the fan
located behind the sample tray will be replaced by a Peltier cooling system. The thermoelectric cooler
could be controlled directly from the Compact FieldPoint PWM module. In addition, as the CESRF
hypobaric chambers are equipped with crop irrigation lines, liquid-cooling loops could also be
incorporated either individually or in combination with the thermoelectric cooler to further increase
cooling capacity.
42
Insciences Journal | Sensors ISSN 1664-171X
Figure 15. Images sets from the first 5 kPa hypobaric experiment. The sequence on the top is images
captured at the beginning of the experiment where the pressure was still at ambient (~100 kPa). The
series on the bottom were taken at 5 kPa four hours later.
GFP Red Near Infrared White
5. Conclusions
A plant health imaging system capable of capturing biological gene activities and translating these
signals into plant stress measurements would be an indispensable diagnostic device in bioregenerative
life support systems. In this study, we discuss the research and development of an autonomous
multispectral imaging system designed to evaluate plant health in situ, in regular greenhouses or in
plant production facilities located in hostile or space analog environments. With its LCTF the imager
could be set to capture a series of images including, but not limited to GFP and natural chlorophyll
fluorescence. In addition, its custom designed LED circuit board composed of independently
controllable LEDs with seven distinct central wavelengths as well as independent control of the upper /
lower half of the board meant the lighting system could be employed in a wide array of scenarios and
studies. Numerous laboratory-based systems are available for capturing fluorescence but many are
restricted to one or a predetermined set of filters. These systems also tend to involve considerable
labour and do not include grow lights. Studies indicate that valuable information could be gathered
with a system capable of measuring a wide range of fluorescent proteins as well as natural chlorophyll
fluorescence [6, 9, 10, 11, 12]. Additionally, a system incorporating controllable photosynthetic
lighting and thus able to maintain the plant samples for long duration experimental studies would
provide even greater insights. Furthermore, plant research in space or in remote regions will likely be
autonomous, include several biological sensors and will consist of robotic operations where telemetric
data collection is a necessity because of restrictions in crew time and/or safety. The Multispectral Plant
Health Imaging System was deployed in a hypobaric chamber and successfully captured images at
several wavelengths, including those for GFP and red/near-IR for chlorophyll. In addition, M-PHIS
was the first fluorescent imager to run autonomously in a low-pressure plant growth chamber. Its
deployment and operations have demonstrated the feasibility of plant diagnostic systems that will
allow for monitoring and control of space biology experiments and bioregenerative life support
systems. Multispectral plant imaging systems are powerful tools for plant health monitoring and
represent a significant step towards securing the technical capacity for sending plant heath information

43
Insciences Journal | Sensors ISSN 1664-171X
in a telemetric fashion from an extra-terrestrial location. Results from this work, combined with past
and future experiments will be used to evaluate remote sensing plant response to low pressure
environments.
Acknowledgements
The Canadian Space Agency founded the research and materiel to develop and build the imager.
We thank Mr. Jamie Lawson from the University of Guelph’s Controlled Environment Systems
Research Facility. We also thank Pierre Lortie, Ralph Nolting and Maxime Pepin-Thivierge of the
Canadian Space Agency machine shop for contributing to the mechanical design and for aiding in
prototype construction. The authors recognize and thank Éric Gloutnay EMC & Electronic Component
Engineer at Canadian Space Agency for his support in LED PCB layout and fabrication. We also thank
Nathalie Cassidy from the Canadian Space Agency for her important logistical contributions to this
work.
References
1. Wheeler, R.M. Plants for human life support in space: from Myers to Mars. Gravitational and
Space Biology 2010, 23, 25-36.
2. Bamsey, M.; Graham, T.; Stasiak, M.; Berinstain, A.; Scott, A.; Vuk, T.R.; Dixon, M.
Canadian advanced life support capacities and future directions. Advances in Space Research
2009, 44, 151-161.
3. Bamsey, M.; Berinstain, A.; Graham, T.; Neron, P.; Giroux, R.; Braham, S.; Ferl, R.; Paul, A.-
L.; Dixon, M. Developing strategies for automated remote plant production systems:
Environmental control and monitoring of the Arthur Clarke Mars Greenhouse in the Canadian
High Arctic. Advances in Space Research 2009, 44, 1367-1381.
4. Tamponnet, C.; Savage, C. Closed Ecological Systems. Journal of Biological Education 1994,
28, 167-174.
5. Plautz, J.D.; Day, R.N.; Dailey, G.M.; Welsh, S.B.; Hall, J.C.; Halpain, S.; Kay, S.A. Green
fluorescent protein and its derivatives as versatile markers for gene expression in living
Drosophila melanogaster, plant and mammalian cells. Gene 1996, 173, 83-87.
6. Manak, M.S.; Paul, A.-L.; Sehnke, P.C.; Ferl, R.J. Remote sensing of gene expression in
Planta: transgenic plants as monitors of exogenous stress perception in extraterrestrial
environments. Life Support Biosph Sci 2002, 8:83-91.
7. Paul, A.-L.; Murdoch, T.; Ferl, E.; Levine, H.G.; Ferl, R. The TAGES Imaging System:
Optimizing a green fluorescent protein imaging system for plants. SAE Technical Paper 2003,
2003-01-2477.
8. Paul, A.-L.; Ferl, R.J. The biology of low atmospheric pressure - implications for exploration
mission design and advanced life support. Gravitational and Space Biology 2006, 19, 3-18.
9. Baker, N.R.; Rosenqvist, E. Applications of chlorophyll fluorescence can improve crop
production strategies: an examination of future possibilities. Journal of Experimental Botany
2004, 55, 1607-1621.
10. Ehlert, B.; Hincha, D. Chlorophyll fluorescence imaging accurately quantifies freezing damage
and cold acclimation responses in Arabidopsis leaves. Plant Methods 2008, 4, 12.
11. Galston, A.W. Photosynthesis as a basis for life support on Earth and in space: photosynthesis
and transpiration in enclosed spaces. Bioscience 1992, 42, 490-493.
12. Lichtenthaler, H.K.; Babani, F. Detection of photosynthetic activity and water stressby imaging
the red chlorophyll fluorescence. Plant Physiology and Biochemistry 2000, 38, 889-895.
13. Stewart, C.N., Jr. The utility of green fluorescent protein in transgenic plants. Plant cell reports
2001, 20, 376-382.
44
Insciences Journal | Sensors ISSN 1664-171X
14. Heim, R.; Tsien, R.Y. Engineering green fluorescent protein for improved brightness, longer
wavelengths and fluorescence resonance energy transfer. Curr Biol 1996, 6, 178-182.
15. Corp, L.A.; McMurtrey, J.E.; Chappelle, E.W.; Kim, M.S.; Daughtry, C.S.T. In Optimal
fluorescence excitation wavelengths for detection of stress in vegetation, Geoscience and
Remote Sensing Symposium, 1996. IGARSS '96. 'Remote Sensing for a Sustainable Future.',
International, 27-31 May 1996, 1996; 1996; pp. 1812-1815 vol.1813.
16. Wehkamp, C.A.; Stasiak, M.; Lawson, J.; Yorio, N.; Stutte, G.; Richards, J.; Wheeler, R.;
Dixon, M. Radish (Raphanus sativa L. cv. Cherry Bomb II) growth, net carbon exchange rate,
and transpiration at decreased atmospheric pressure and / or oxygen. Gravitational and Space
Biology 2012, 26, 3-16.
17. Abboud, T.; Bamsey, M.; Paul, A.-L.; Graham, T.; Braham, S.; Noumeir, R.; Berinstain, A.;
Ferl, R. Deployment of a Fully-Automated Green Fluorescent Protein Imaging System in a
High Arctic Autonomous Greenhouse. Sensors 2013, 13, 3530-3548.
18. Paul, A.-L.; Bamsey, M.; Berinstain, A.; Braham, S.; Neron, P.; Murdoch, T.; Thomas, G.;
Ferl, J.R. Deployment of a prototype plant GFP imager at the Arthur Clarke Mars Greenhouse
of the Haughton Mars Project. Sensors 2008, 8, 2762-2773.
19. Folta, K.; Koss, L.; McMorrow, R.; Kim, H.-H.; Kenitz, J.D.; Wheeler, R.; Sager, J. Design
and fabrication of adjustable red-green-blue LED light arrays for plant research. BMC Plant
Biology 2005, 5, 17.
20. Goins, G.D.; Yorio, N.C.; Sanwo, M.M.; Brown, C.S. Photomorphogenesis, photosynthesis,
and seed yield of wheat plants grown under red light-emitting diodes (LEDs) with and without
supplemental blue lighting. Journal of Experimental Botany 1997, 48, 1407-1413.
21. Porra, R.J.; Thompson, W.A.; Kriedemann, P.E. Determination of accurate extinction
coefficients and simultaneous equations for assaying chlorophylls a and b extracted with four
different solvents: verification of the concentration of chlorophyll standards by atomic
absorption spectroscopy. Biochimica et Biophysica Acta (BBA) - Bioenergetics 1989, 975, 384-
394.
22. Schurr, U.; Walter, A.; Rascher, U. Functional dynamics of plant growth and photosynthesis--
from steady-state to dynamics--from homogeneity to heterogeneity. Plant Cell Environ 2006,
29, 340-352.
23. West-Eberhard, M.J.; Smith, J.A.; Winter, K. Plant science. Photosynthesis, reorganized.
Science 2011, 332, 311-312.
24. Wikipedia, t.f.e. Tagged Image File Format. Available online:
http://en.wikipedia.org/wiki/Tagged_Image_File_Format#cite_ref-0 (5 september 2012),
25. Wikipedia, t.f.e. JPEG. Available online: http://en.wikipedia.org/wiki/JPEG (5 september
2012).
© 2013 by the authors; licensee Insciences Journal.
Open Access article under the terms and conditions of Creative Commons Attribution Non‐Commercial License 3.0 Unported.
Recommended