Embed Size (px)
Citation preview
© analytikLtd
analytikLtd
Multispectral Imaging in Pharmaceuticals
Rapid Non-destructive Surface Analysis
Adrian Waltho, Analytik Ltd (Cambridge, UK)
www.analytik.co.uk/multispectral-imaging
www.analytik.co.uk
Light reflectance surface mapping for accurate measurement of colour, texture, shape, size and chemical composition
© analytikLtd
• Nuanced, human-like analysis of heterogeneous samples
• Objective, repeatable measurements
• Non-destructive testing
• Rapid assessment
• No sample preparation
Why use Imaging?
© analytikLtd
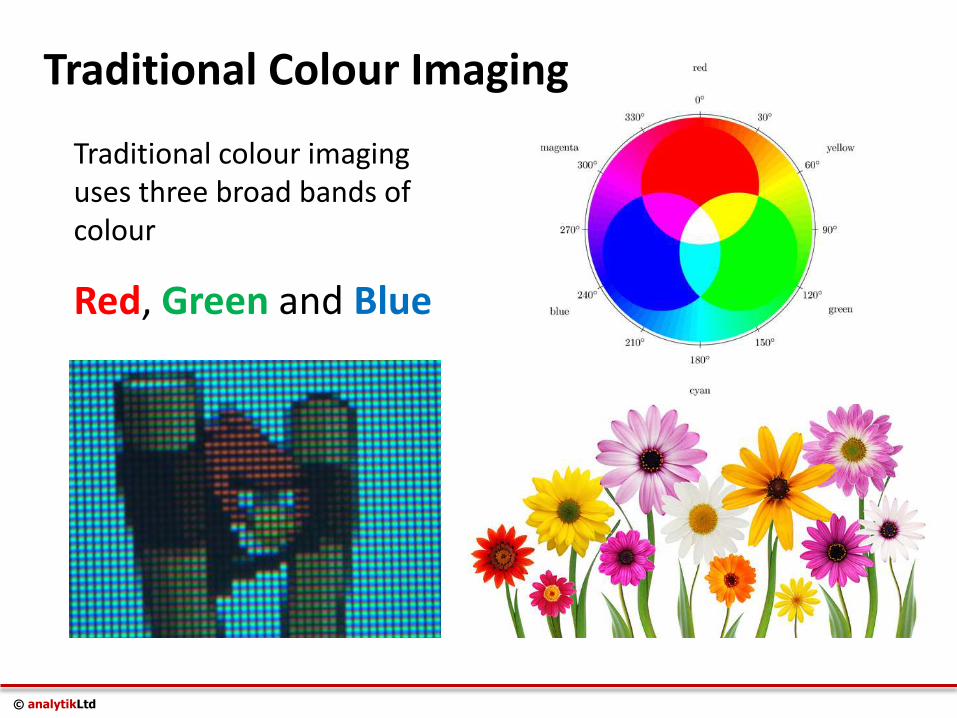
Traditional colour imaging uses three broad bands of colour
Red, Green and Blue
Traditional Colour Imaging
© analytikLtd
Traditional Colour Imaging
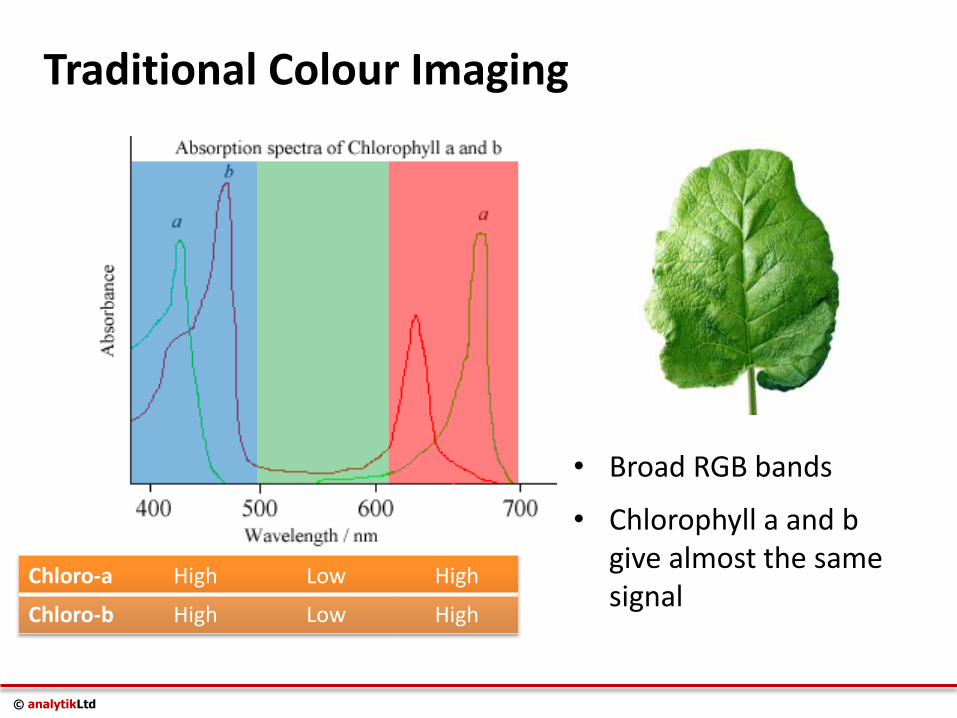
• Broad RGB bands
• Chlorophyll a and b give almost the same signal
Chloro-a High Low High
Chloro-b High Low High
© analytikLtd
Multispectral Imaging
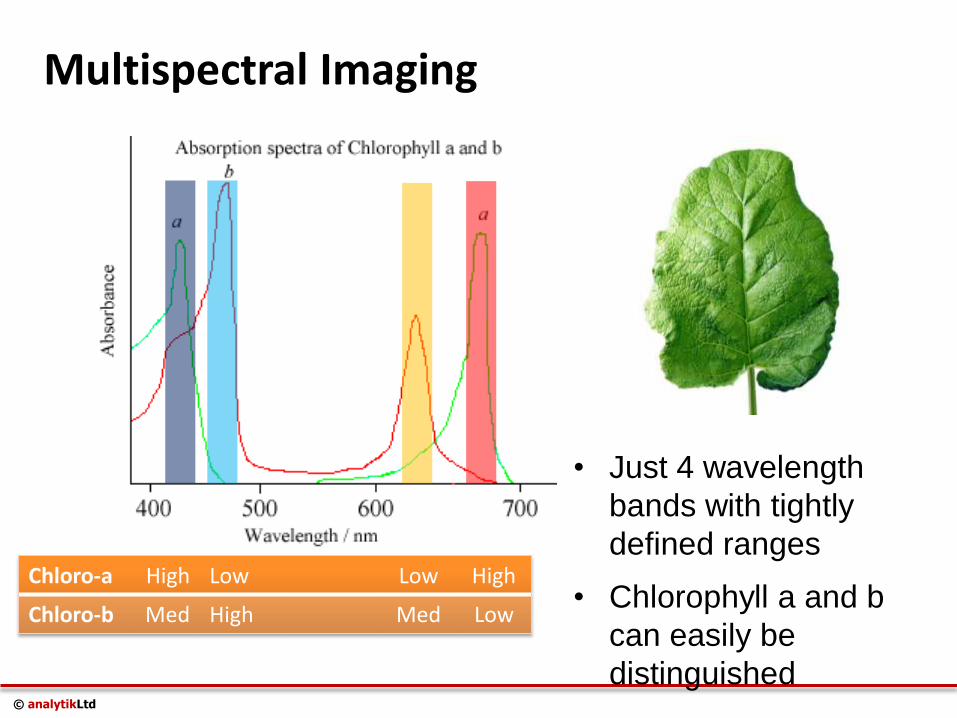
Chloro-a High Low Low High
Chloro-b Med High Med Low
• Just 4 wavelength
bands with tightly
defined ranges
• Chlorophyll a and b
can easily be
distinguished
© analytikLtd
Multispectral Imaging
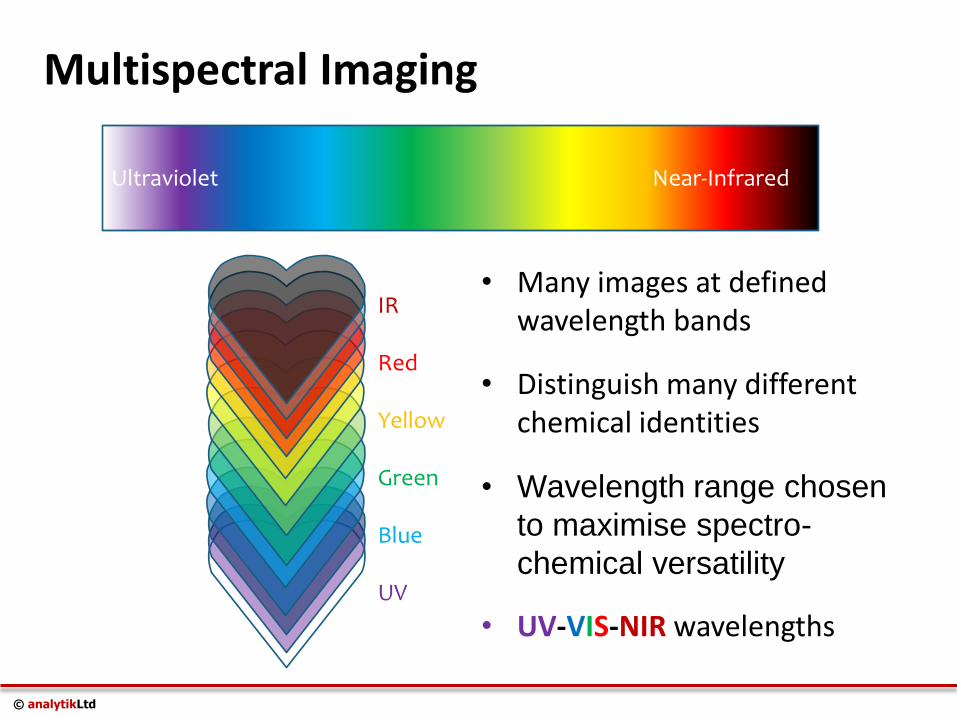
• Many images at defined wavelength bands
• Distinguish many different chemical identities
• Wavelength range chosen
to maximise spectro-
chemical versatility
• UV-VIS-NIR wavelengths
Ultraviolet Near-Infrared
IR Red Yellow Green Blue UV
© analytikLtd
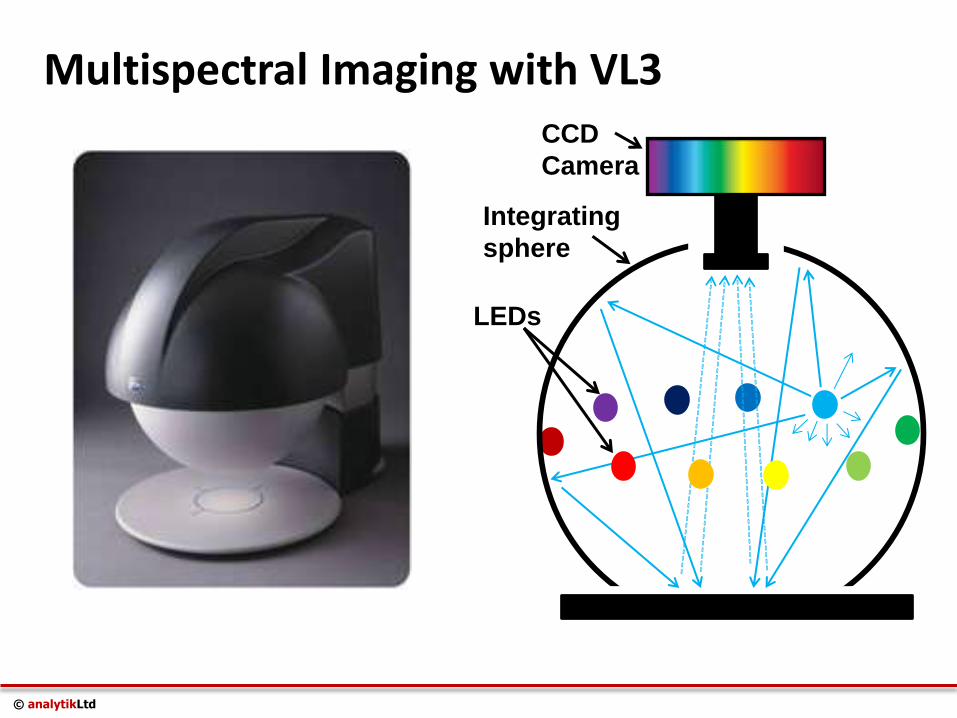
Multispectral Imaging with VL3 CCD
Camera
LEDs
Integrating
sphere
© analytikLtd
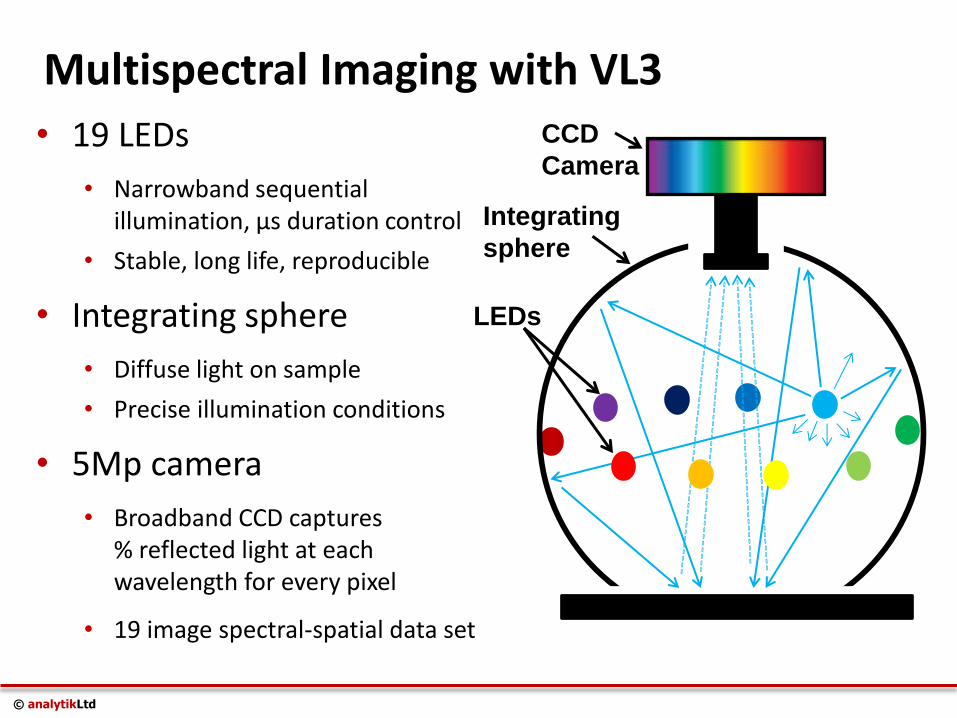
Multispectral Imaging with VL3
• 19 LEDs
• Narrowband sequential illumination, µs duration control
• Stable, long life, reproducible
• Integrating sphere
• Diffuse light on sample
• Precise illumination conditions
• 5Mp camera
• Broadband CCD captures % reflected light at each wavelength for every pixel
• 19 image spectral-spatial data set
CCD
Camera
LEDs
Integrating
sphere
© analytikLtd
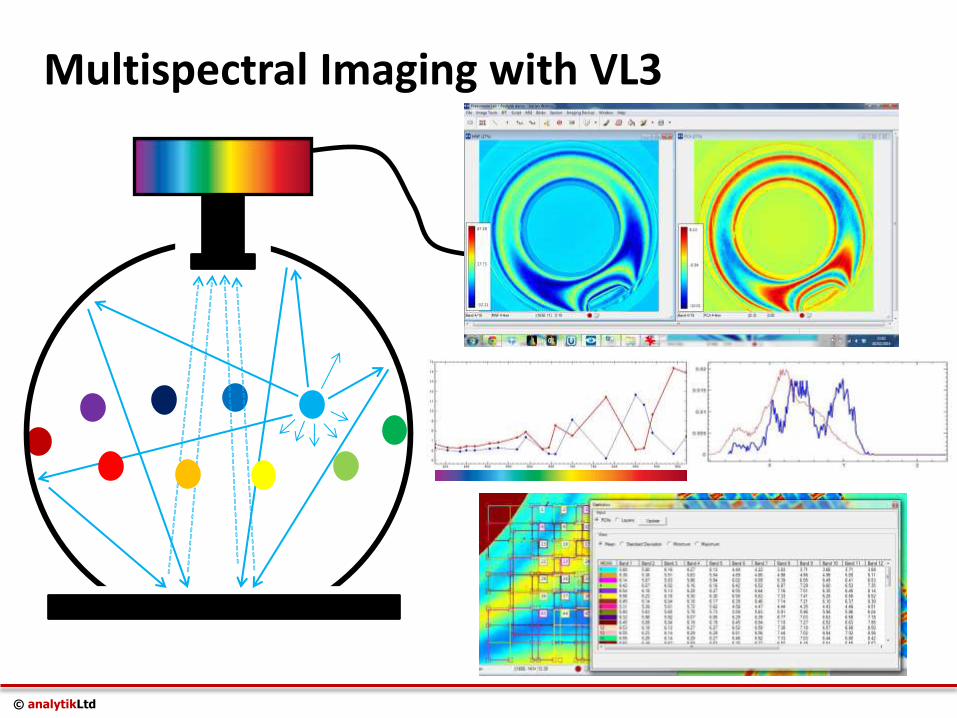
Multispectral Imaging with VL3
© analytikLtd
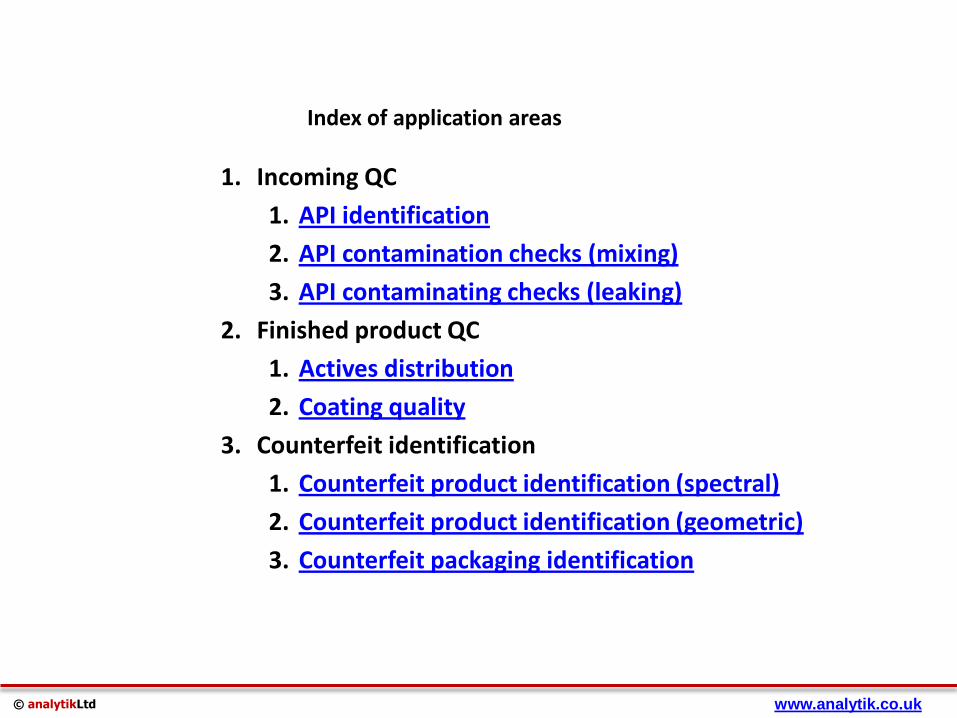
Index of application areas
1. Incoming QC
1. API identification
2. API contamination checks (mixing)
3. API contaminating checks (leaking)
2. Finished product QC
1. Actives distribution
2. Coating quality
3. Counterfeit identification
1. Counterfeit product identification (spectral)
2. Counterfeit product identification (geometric)
3. Counterfeit packaging identification
www.analytik.co.uk
© analytikLtd
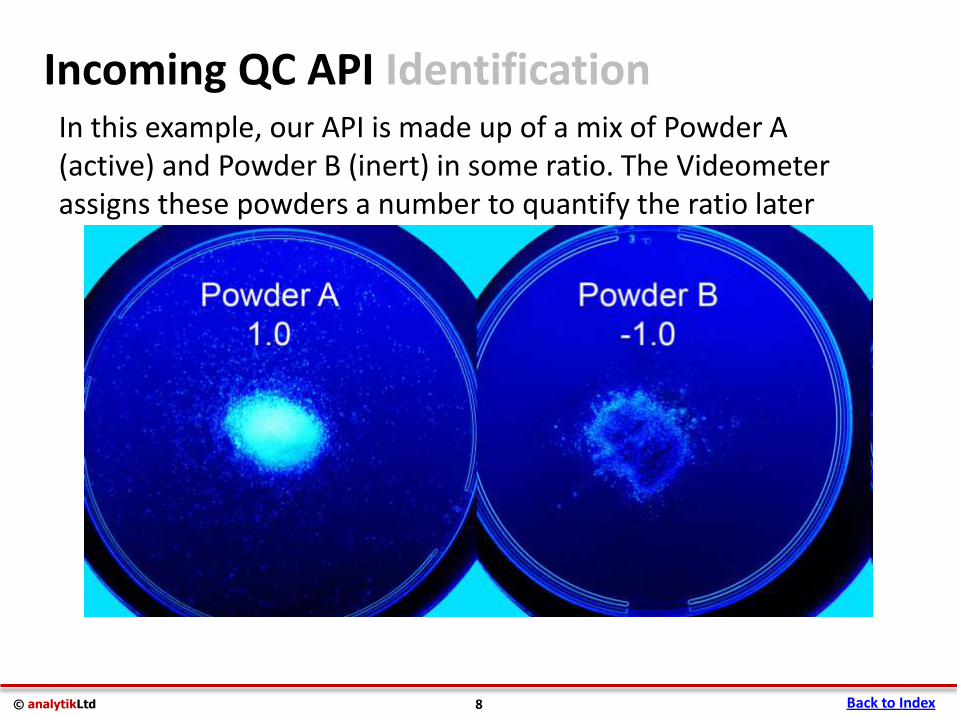
In this example, our API is made up of a mix of Powder A (active) and Powder B (inert) in some ratio. The Videometer assigns these powders a number to quantify the ratio later
Incoming QC API Identification
Back to Index 8
© analytikLtd
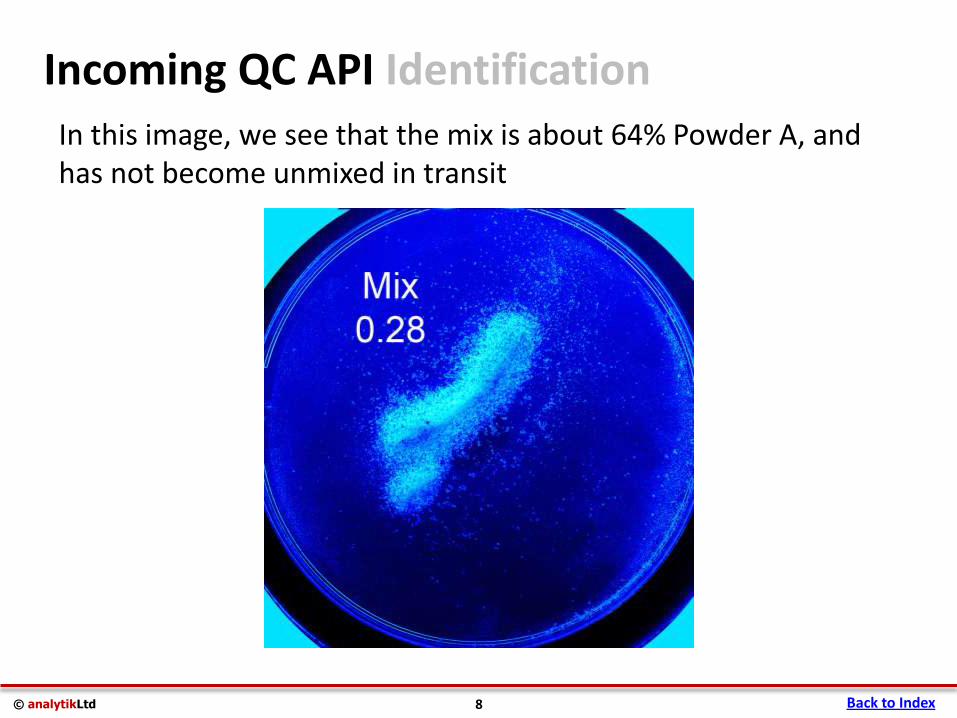
In this image, we see that the mix is about 64% Powder A, and has not become unmixed in transit
Incoming QC API Identification
Back to Index 8
© analytikLtd
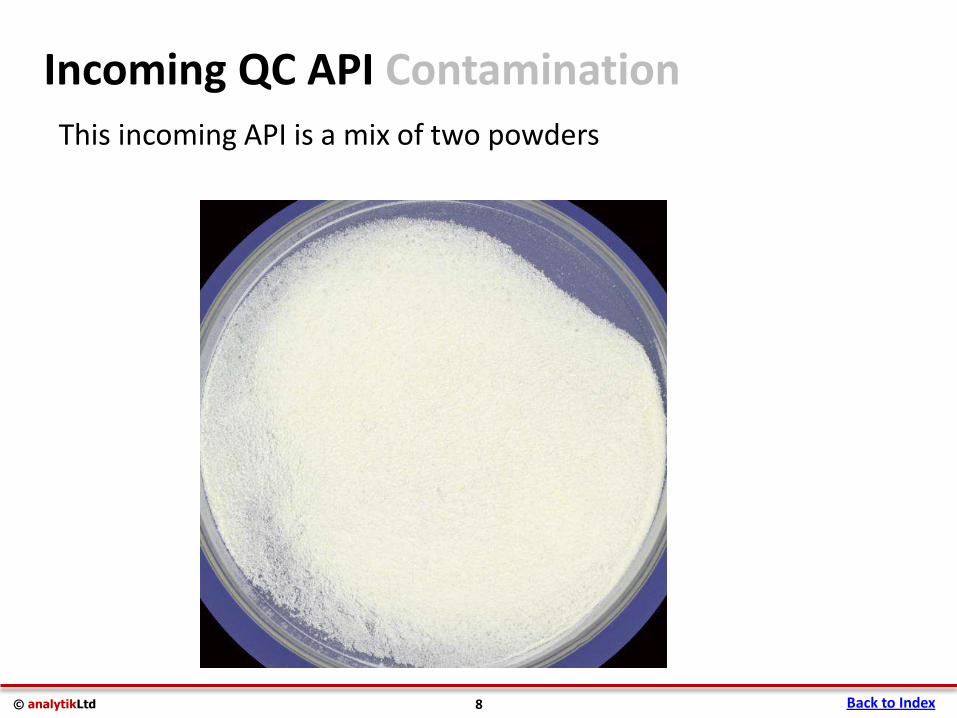
This incoming API is a mix of two powders
Incoming QC API Contamination
Back to Index 8
© analytikLtd
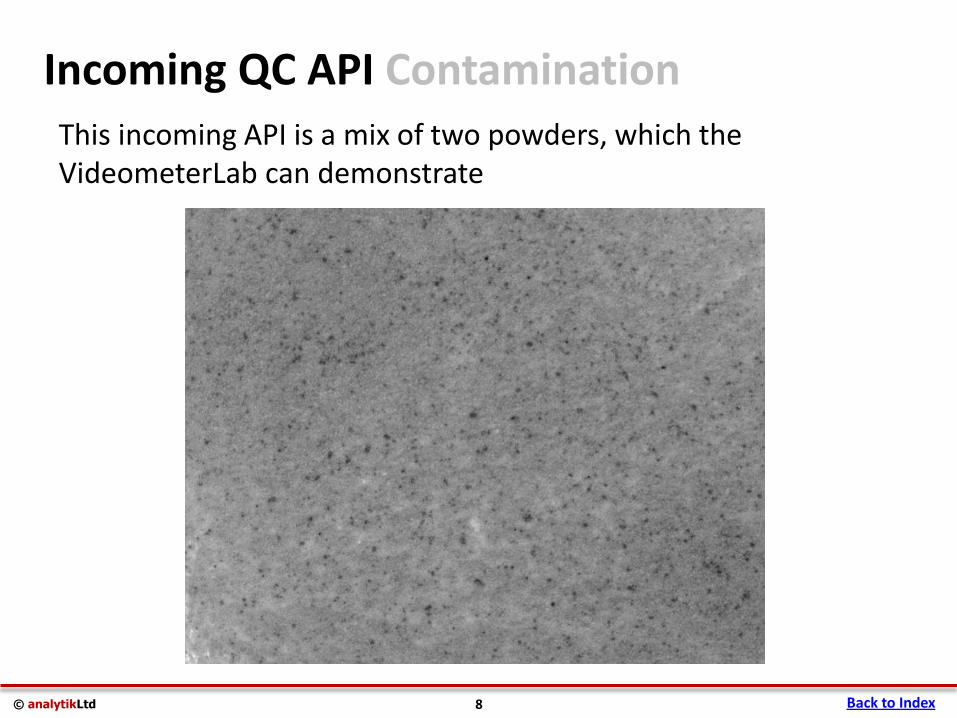
This incoming API is a mix of two powders, which the VideometerLab can demonstrate
Incoming QC API Contamination
Back to Index 8
© analytikLtd
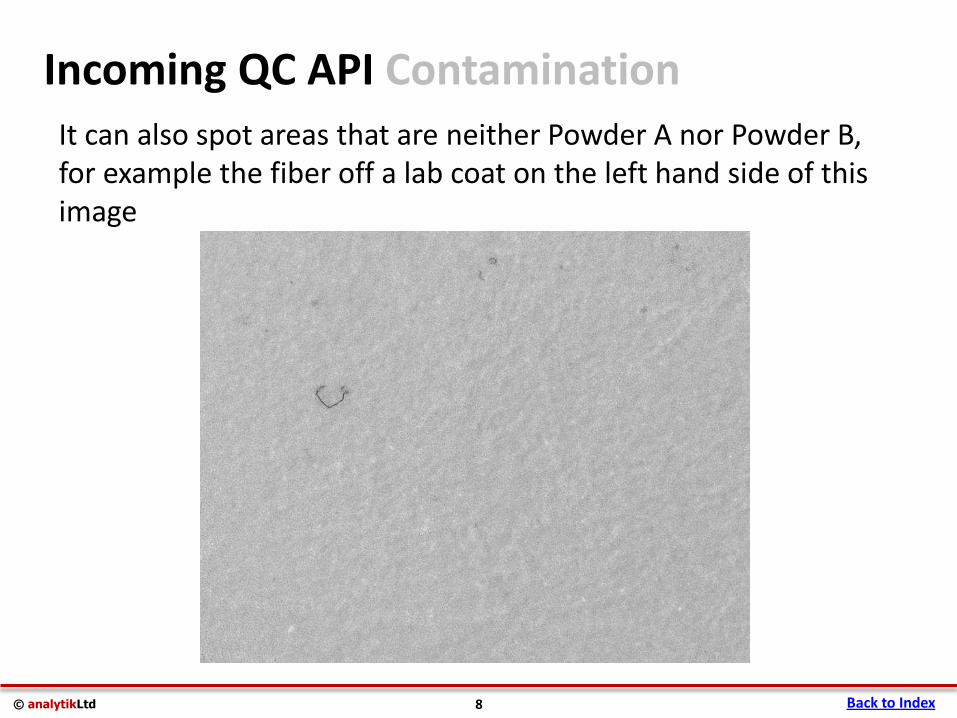
It can also spot areas that are neither Powder A nor Powder B, for example the fiber off a lab coat on the left hand side of this image
Incoming QC API Contamination
Back to Index 8
© analytikLtd
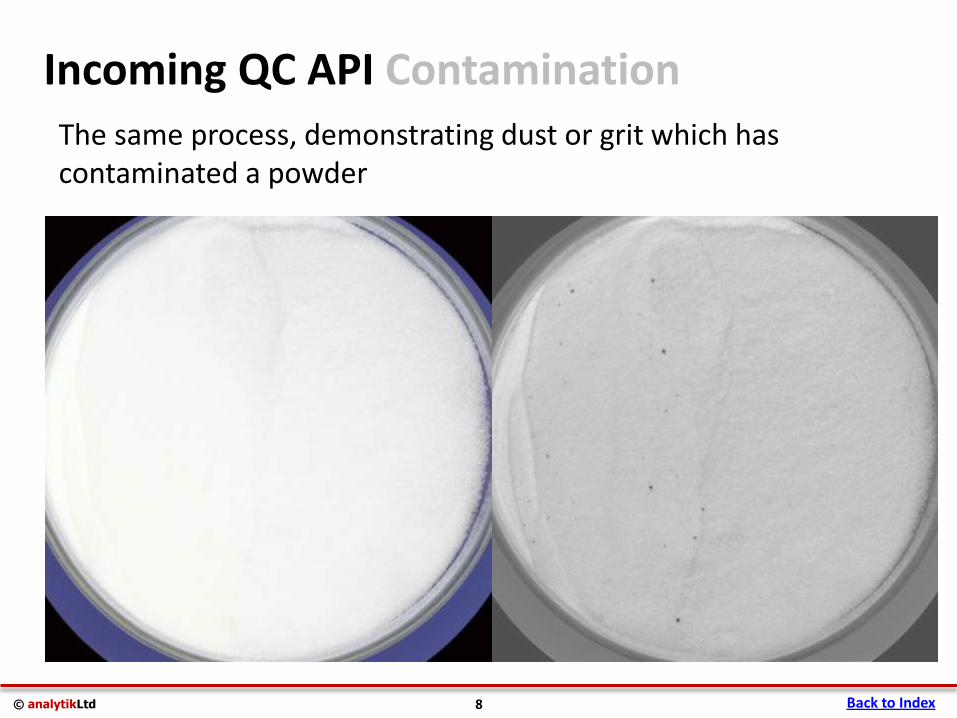
The same process, demonstrating dust or grit which has contaminated a powder
Incoming QC API Contamination
Back to Index 8
© analytikLtd
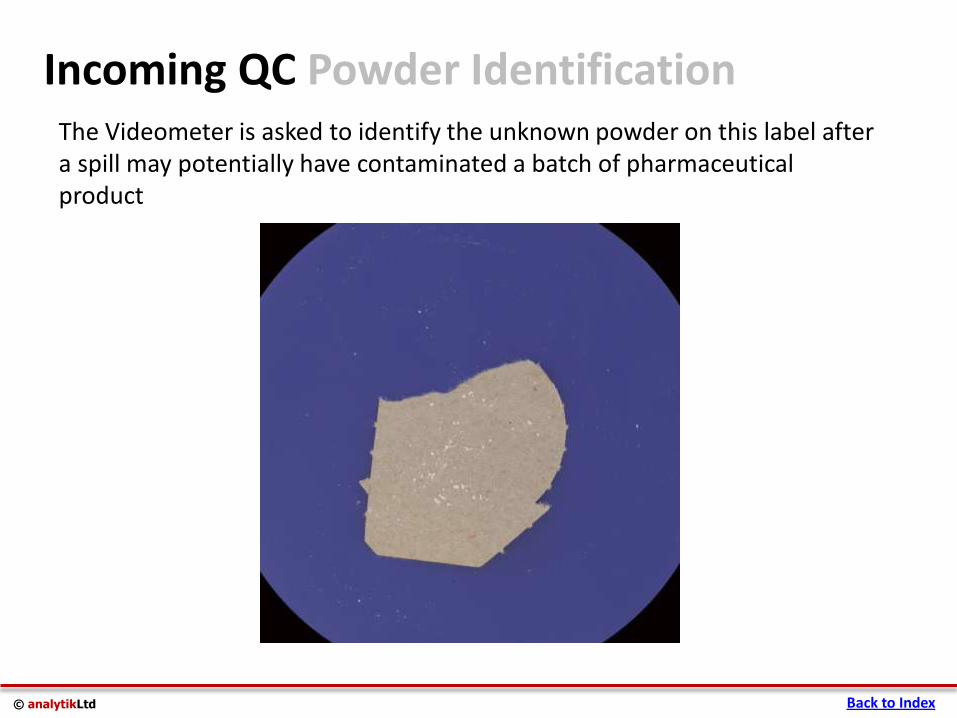
The Videometer is asked to identify the unknown powder on this label after a spill may potentially have contaminated a batch of pharmaceutical product
Incoming QC Powder Identification
Back to Index
© analytikLtd
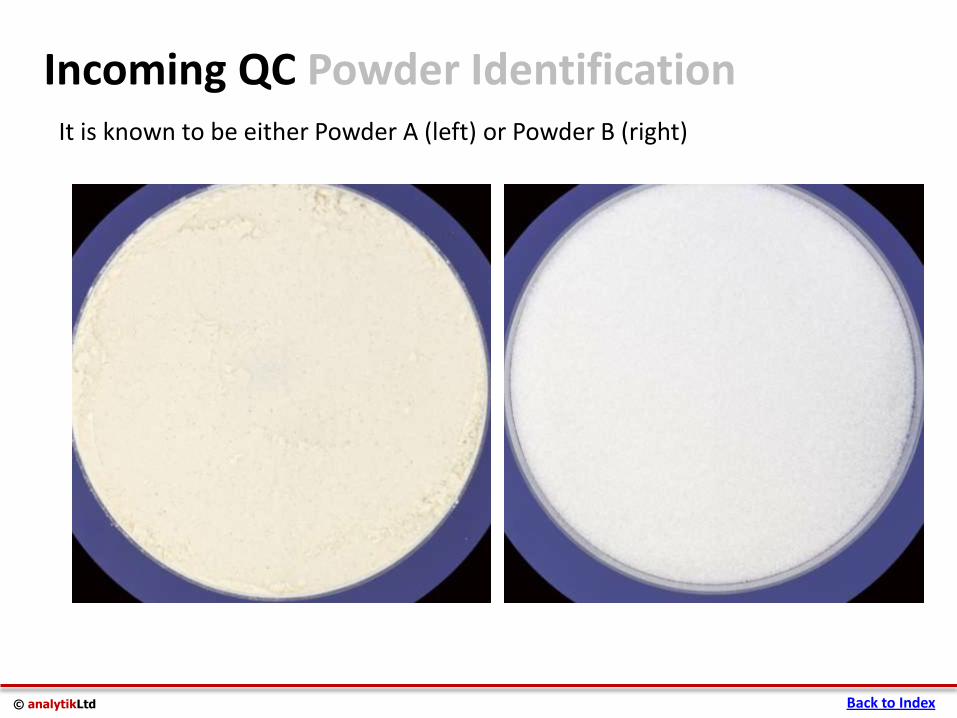
It is known to be either Powder A (left) or Powder B (right)
Incoming QC Powder Identification
Back to Index
© analytikLtd
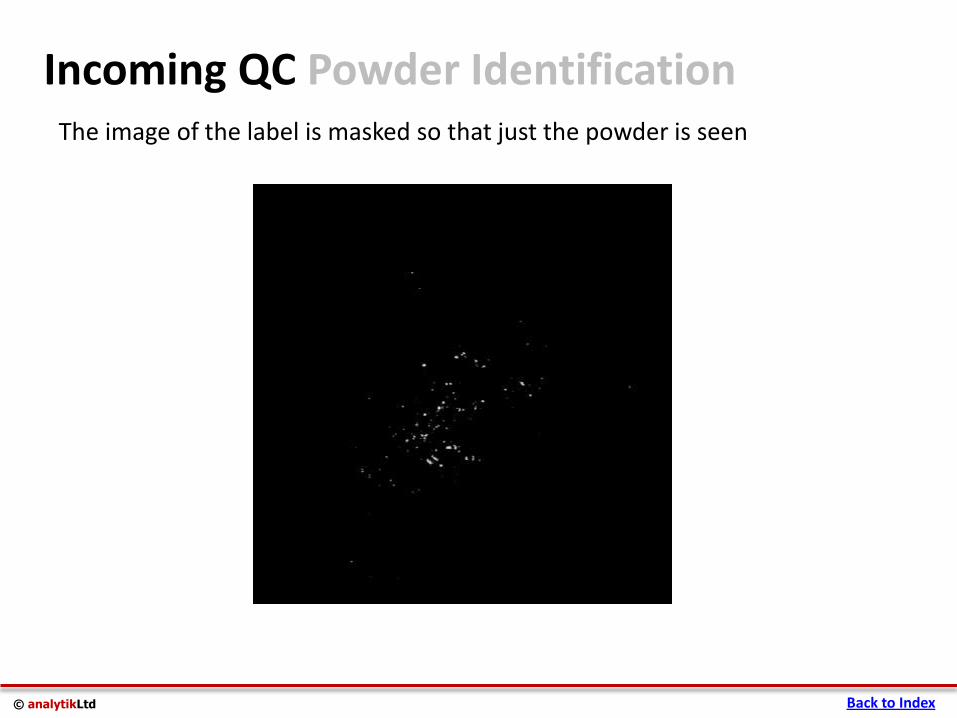
The image of the label is masked so that just the powder is seen
Incoming QC Powder Identification
Back to Index
© analytikLtd
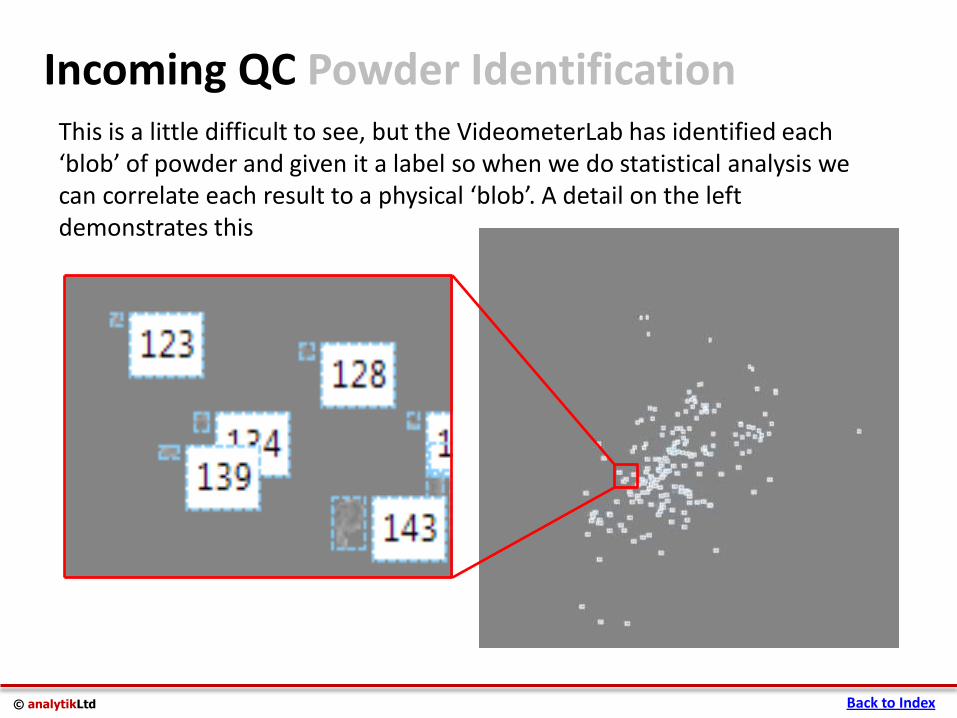
This is a little difficult to see, but the VideometerLab has identified each ‘blob’ of powder and given it a label so when we do statistical analysis we can correlate each result to a physical ‘blob’. A detail on the left demonstrates this
Incoming QC Powder Identification
Back to Index
© analytikLtd
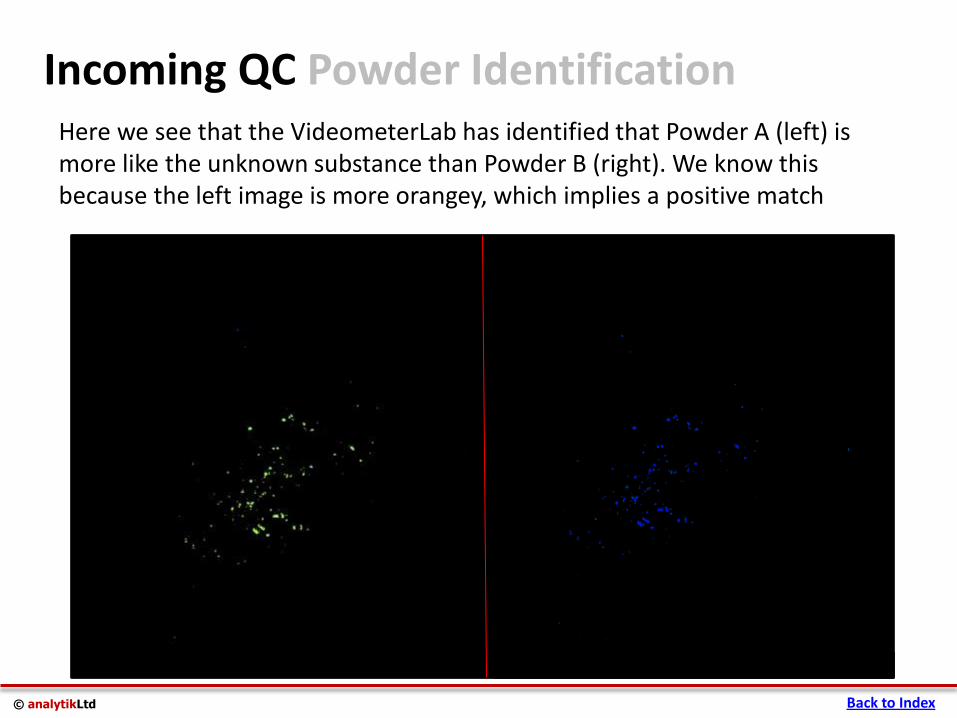
Here we see that the VideometerLab has identified that Powder A (left) is more like the unknown substance than Powder B (right). We know this because the left image is more orangey, which implies a positive match
Incoming QC Powder Identification
Back to Index
© analytikLtd
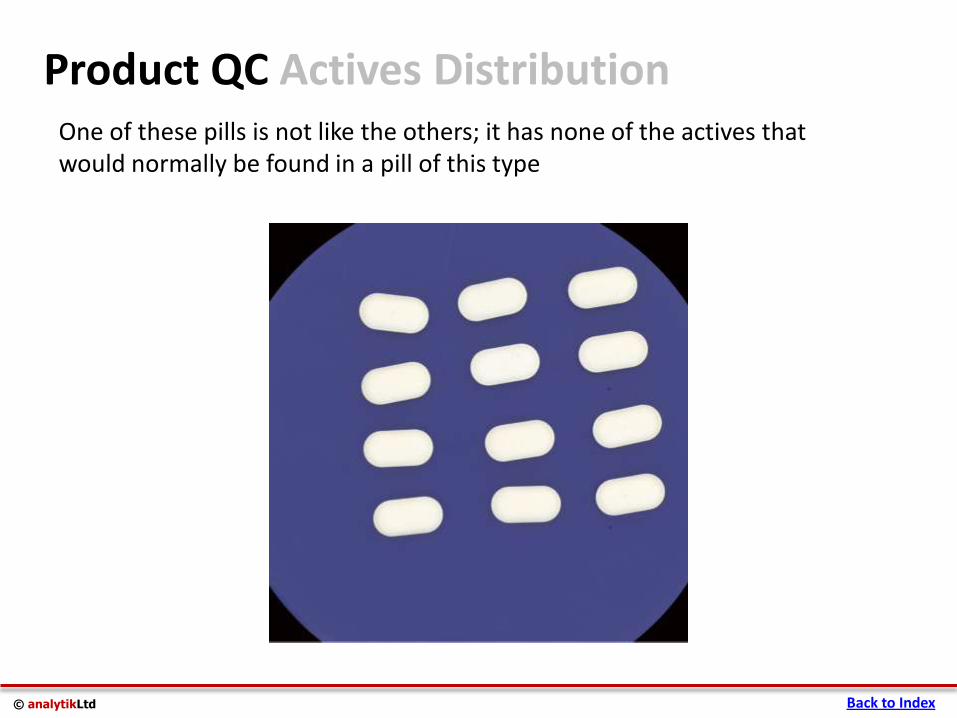
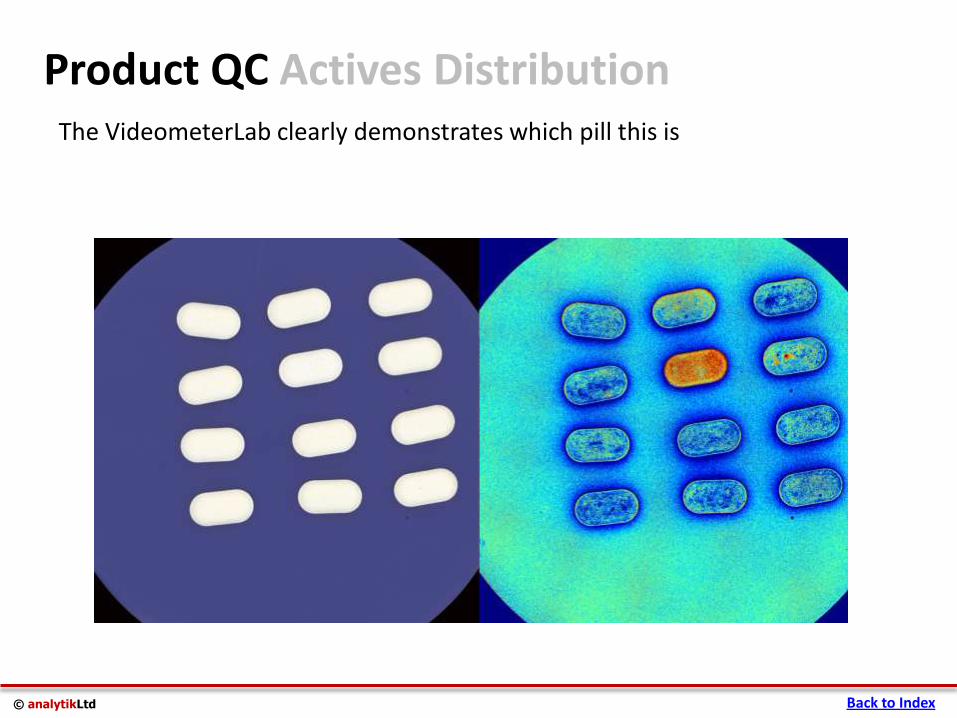
One of these pills is not like the others; it has none of the actives that would normally be found in a pill of this type
Product QC Actives Distribution
Back to Index
© analytikLtd
The VideometerLab clearly demonstrates which pill this is
Product QC Actives Distribution
Back to Index
© analytikLtd
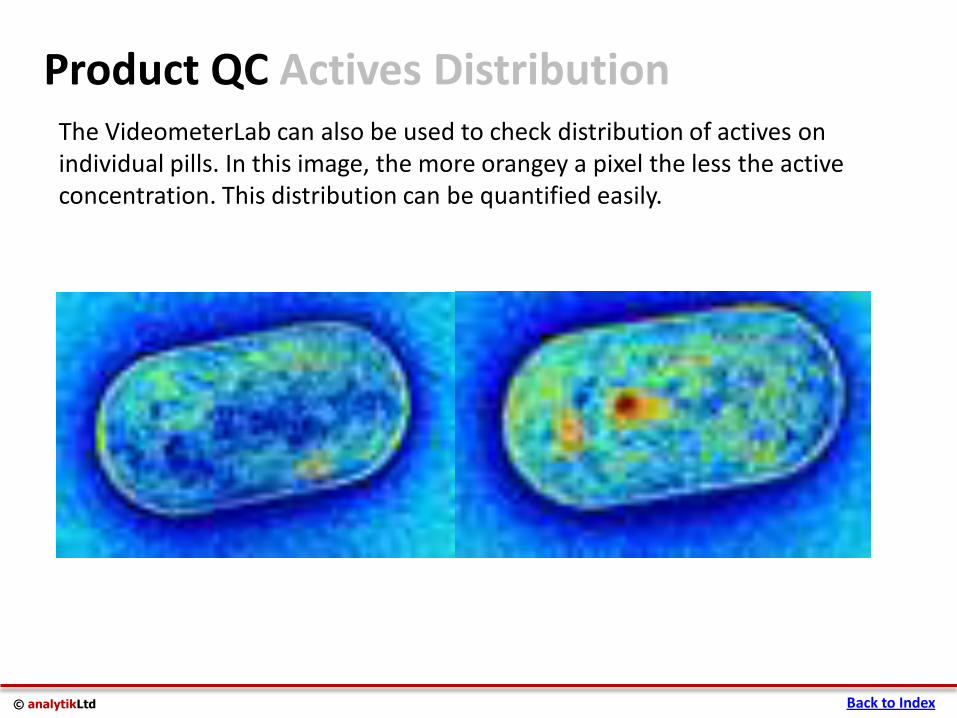
The VideometerLab can also be used to check distribution of actives on individual pills. In this image, the more orangey a pixel the less the active concentration. This distribution can be quantified easily.
Product QC Actives Distribution
Back to Index
© analytikLtd
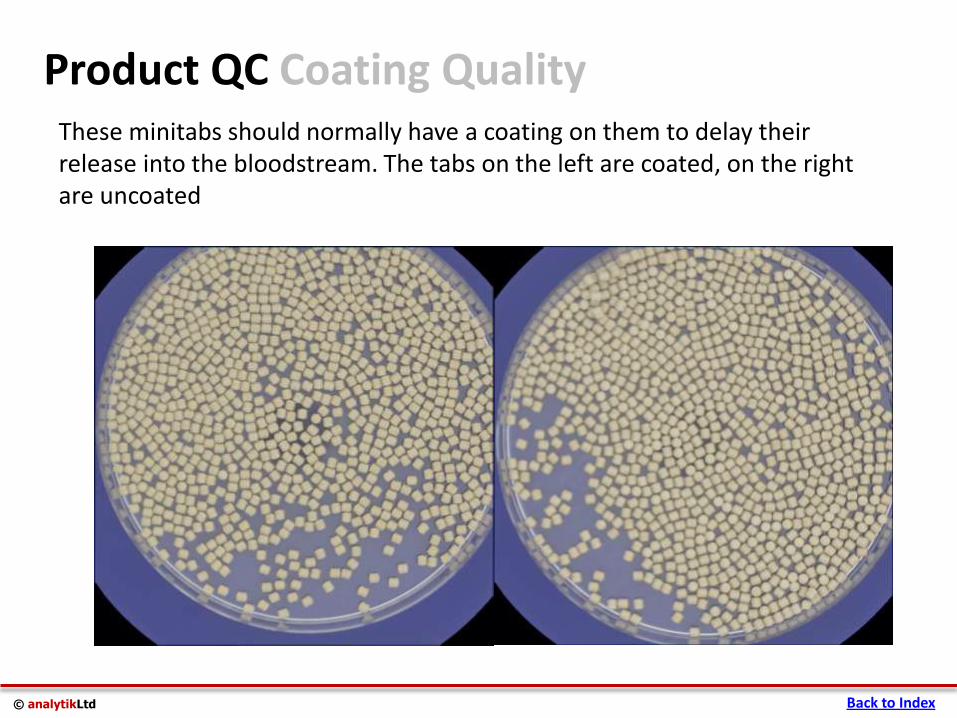
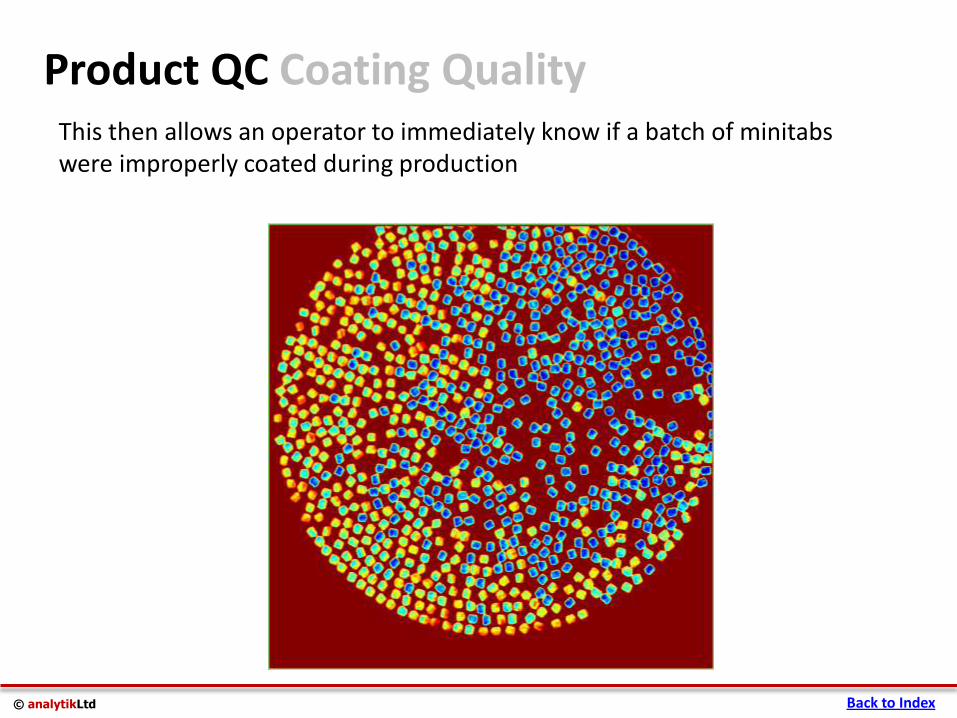
These minitabs should normally have a coating on them to delay their release into the bloodstream. The tabs on the left are coated, on the right are uncoated
Product QC Coating Quality
Back to Index
© analytikLtd
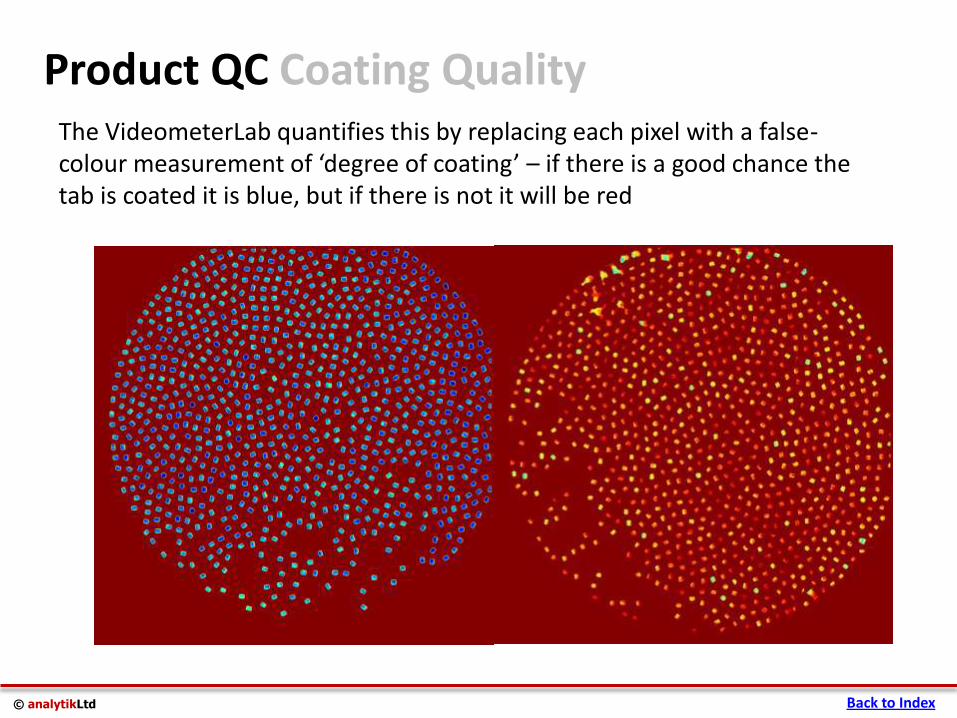
The VideometerLab quantifies this by replacing each pixel with a false-colour measurement of ‘degree of coating’ – if there is a good chance the tab is coated it is blue, but if there is not it will be red
Product QC Coating Quality
Back to Index
© analytikLtd
This then allows an operator to immediately know if a batch of minitabs were improperly coated during production
Product QC Coating Quality
Back to Index
© analytikLtd
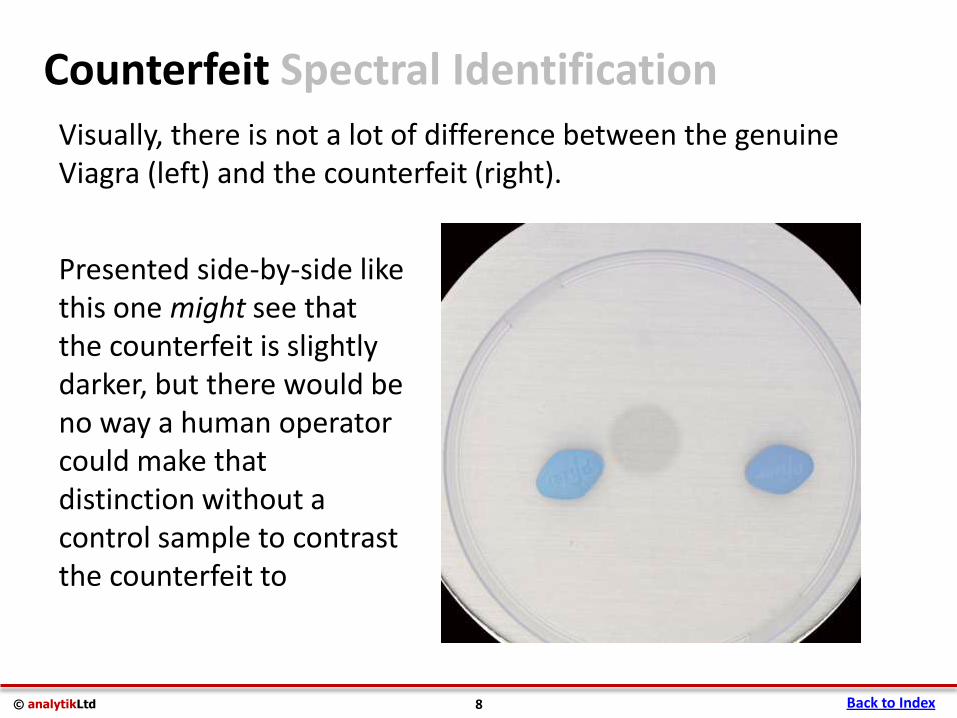
Visually, there is not a lot of difference between the genuine Viagra (left) and the counterfeit (right).
Counterfeit Spectral Identification
Back to Index 8
Presented side-by-side like this one might see that the counterfeit is slightly darker, but there would be no way a human operator could make that distinction without a control sample to contrast the counterfeit to
© analytikLtd
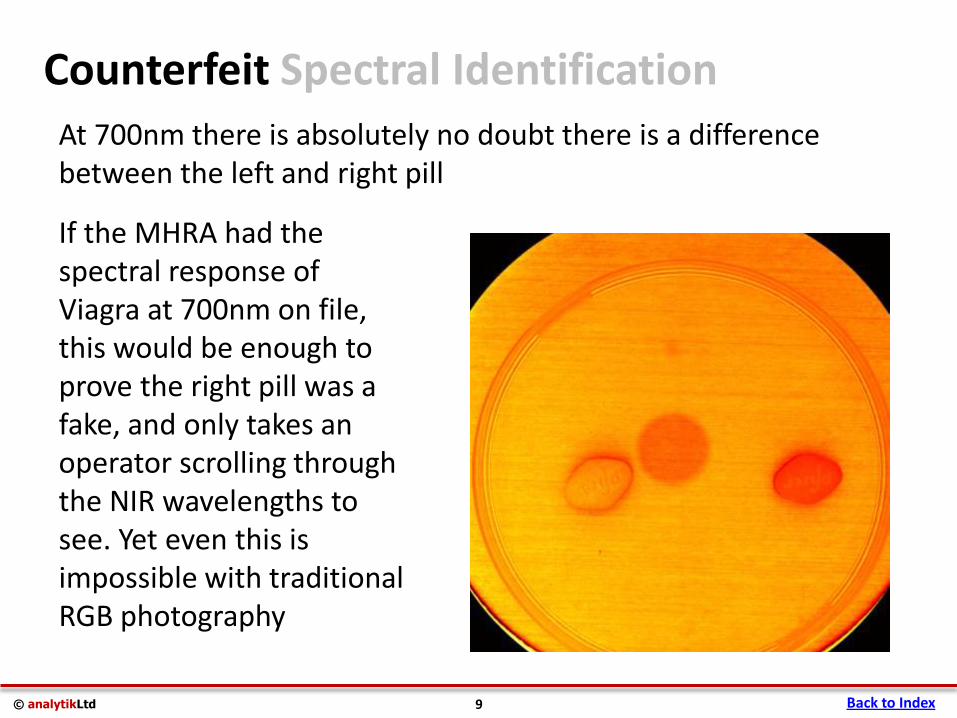
At 700nm there is absolutely no doubt there is a difference between the left and right pill
Counterfeit Spectral Identification
Back to Index 9
If the MHRA had the spectral response of Viagra at 700nm on file, this would be enough to prove the right pill was a fake, and only takes an operator scrolling through the NIR wavelengths to see. Yet even this is impossible with traditional RGB photography
© analytikLtd
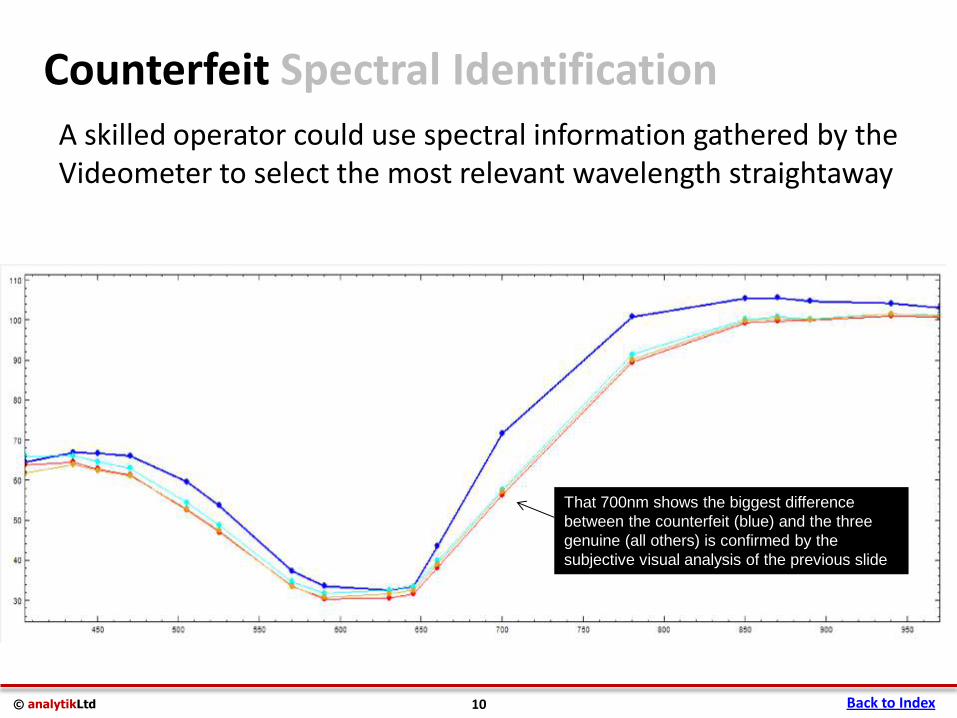
A skilled operator could use spectral information gathered by the Videometer to select the most relevant wavelength straightaway
Counterfeit Spectral Identification
Back to Index 10
That 700nm shows the biggest difference
between the counterfeit (blue) and the three
genuine (all others) is confirmed by the
subjective visual analysis of the previous slide
© analytikLtd
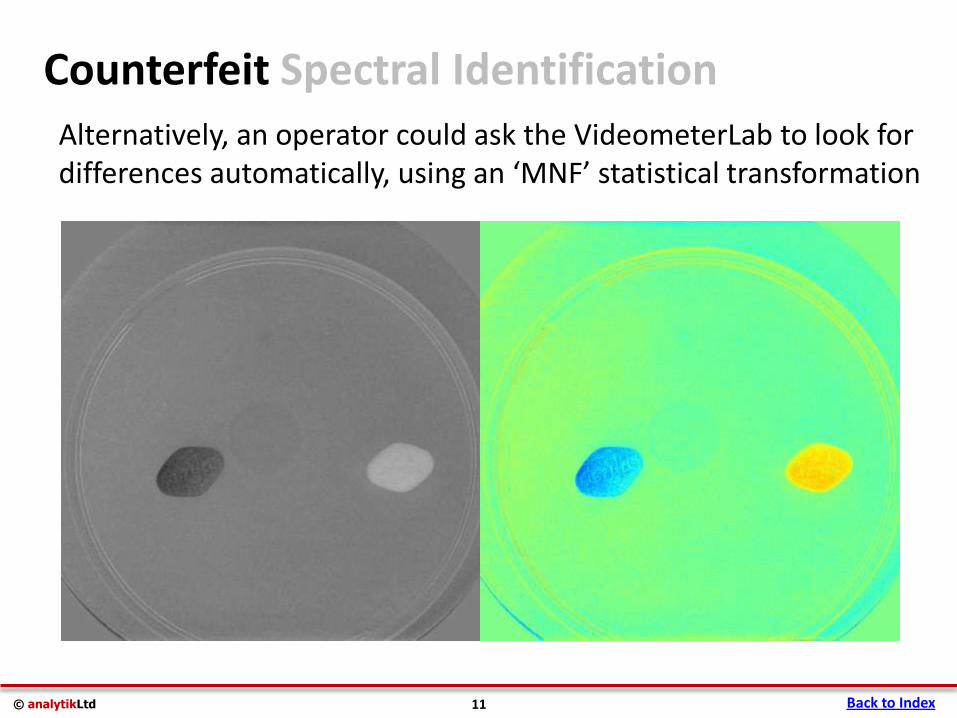
Alternatively, an operator could ask the VideometerLab to look for differences automatically, using an ‘MNF’ statistical transformation
Counterfeit Spectral Identification
Back to Index 11
© analytikLtd
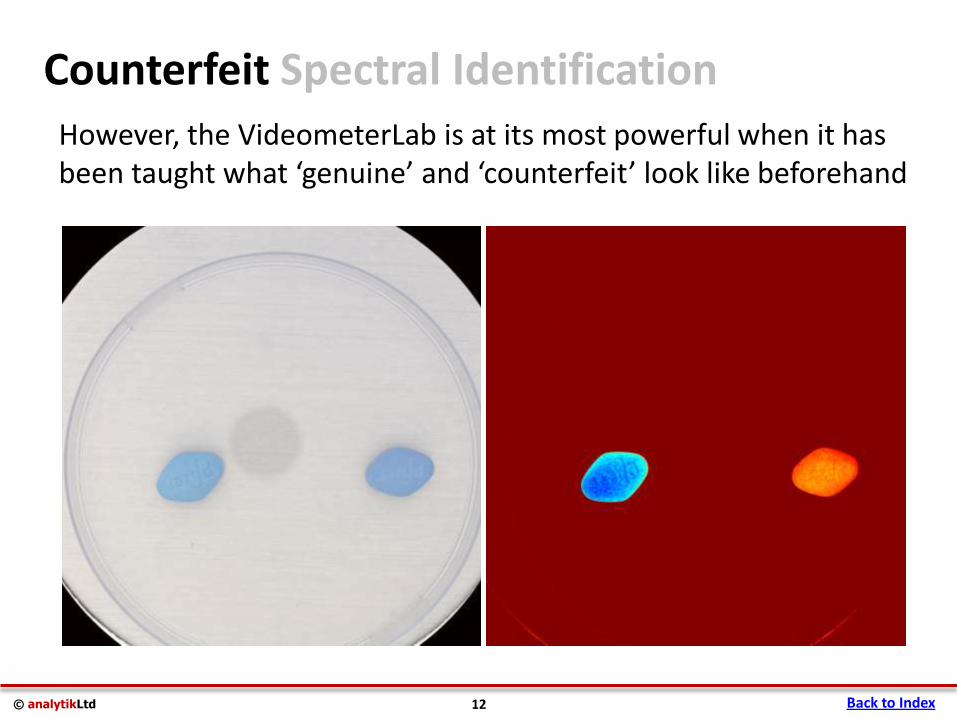
However, the VideometerLab is at its most powerful when it has been taught what ‘genuine’ and ‘counterfeit’ look like beforehand
Counterfeit Spectral Identification
Back to Index 12
© analytikLtd
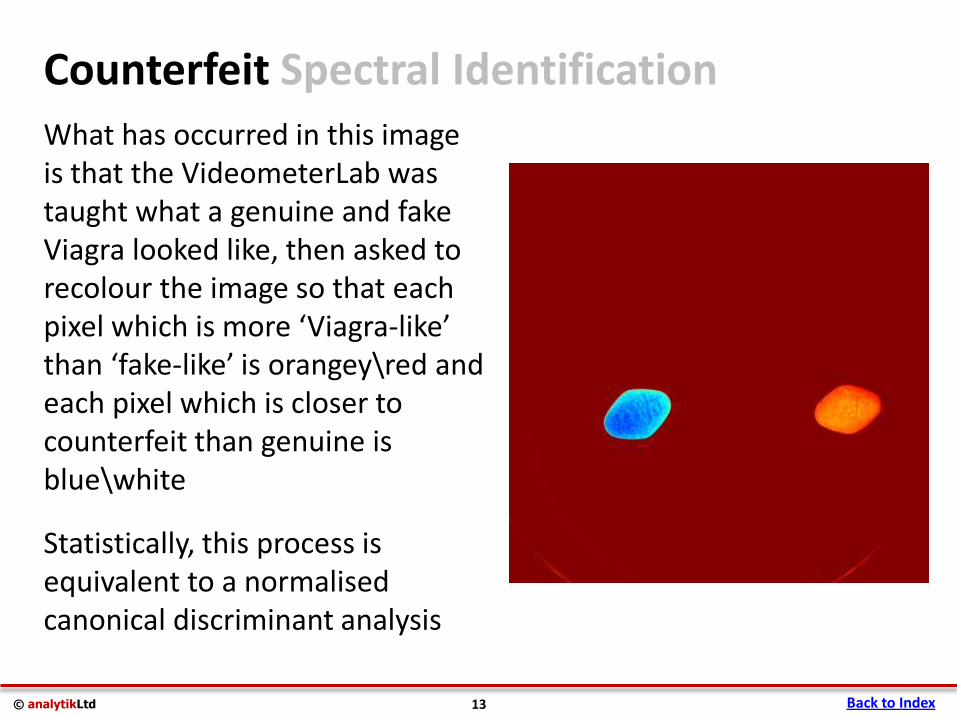
What has occurred in this image is that the VideometerLab was taught what a genuine and fake Viagra looked like, then asked to recolour the image so that each pixel which is more ‘Viagra-like’ than ‘fake-like’ is orangey\red and each pixel which is closer to counterfeit than genuine is blue\white
Statistically, this process is equivalent to a normalised canonical discriminant analysis
Counterfeit Spectral Identification
Back to Index 13
© analytikLtd
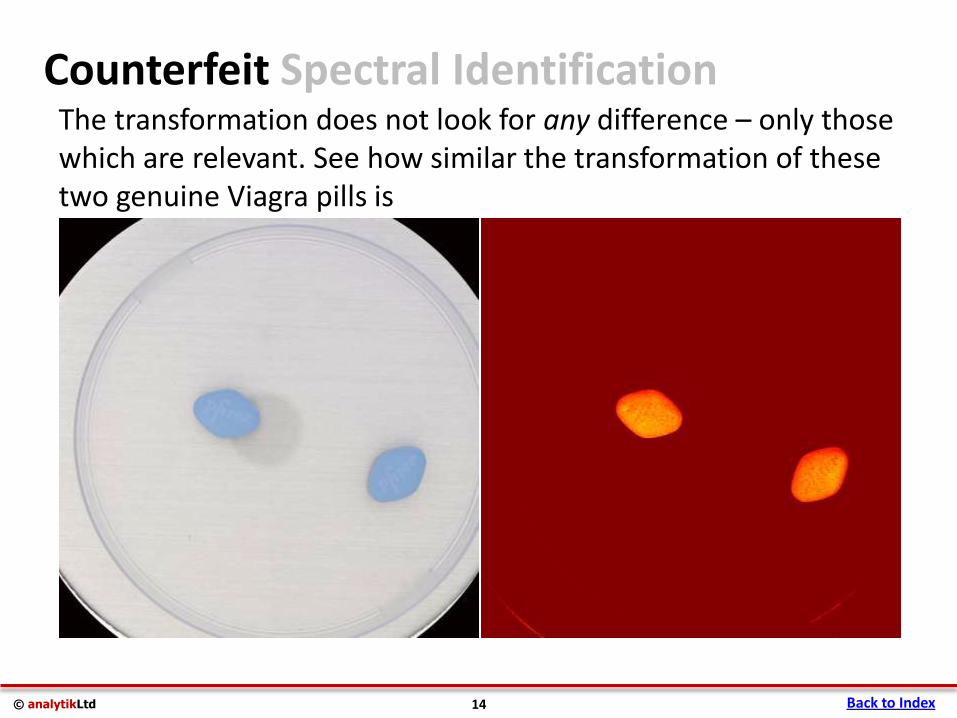
The transformation does not look for any difference – only those which are relevant. See how similar the transformation of these two genuine Viagra pills is
Counterfeit Spectral Identification
Back to Index 14
© analytikLtd
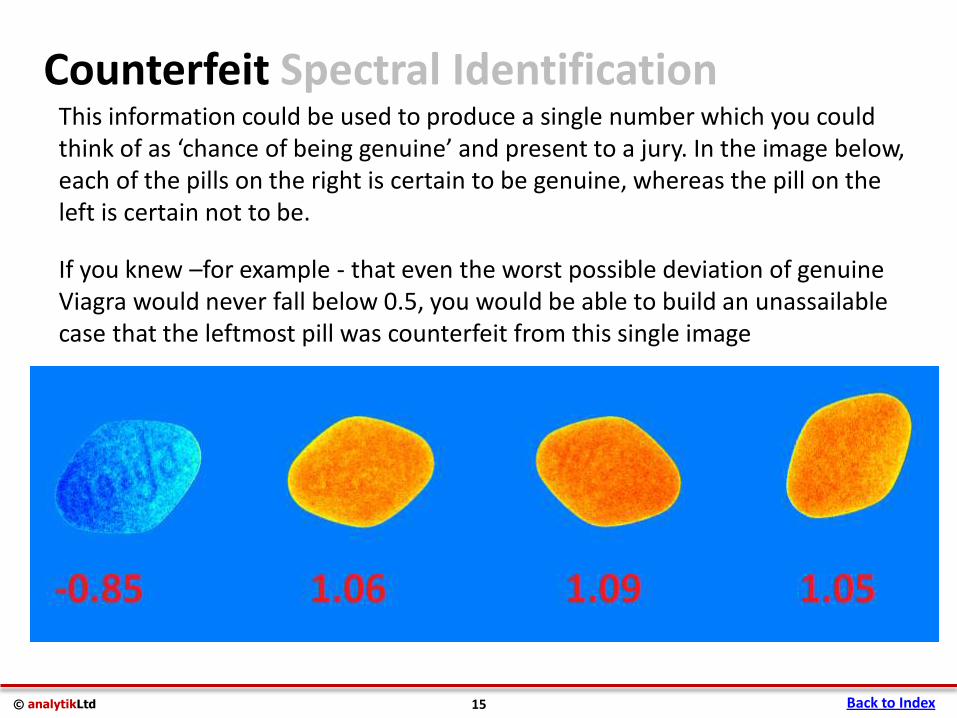
This information could be used to produce a single number which you could think of as ‘chance of being genuine’ and present to a jury. In the image below, each of the pills on the right is certain to be genuine, whereas the pill on the left is certain not to be.
If you knew –for example - that even the worst possible deviation of genuine Viagra would never fall below 0.5, you would be able to build an unassailable case that the leftmost pill was counterfeit from this single image
Counterfeit Spectral Identification
Back to Index 15
© analytikLtd
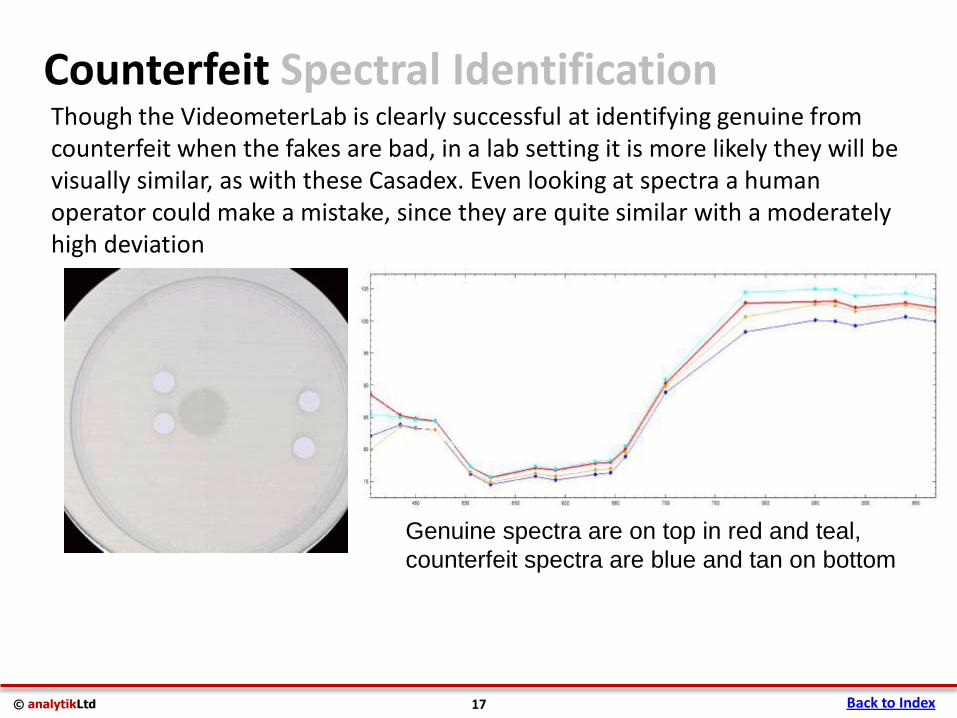
Though the VideometerLab is clearly successful at identifying genuine from counterfeit when the fakes are bad, in a lab setting it is more likely they will be visually similar, as with these Casadex. Even looking at spectra a human operator could make a mistake, since they are quite similar with a moderately high deviation
Counterfeit Spectral Identification
Back to Index 17
Genuine spectra are on top in red and teal,
counterfeit spectra are blue and tan on bottom
© analytikLtd
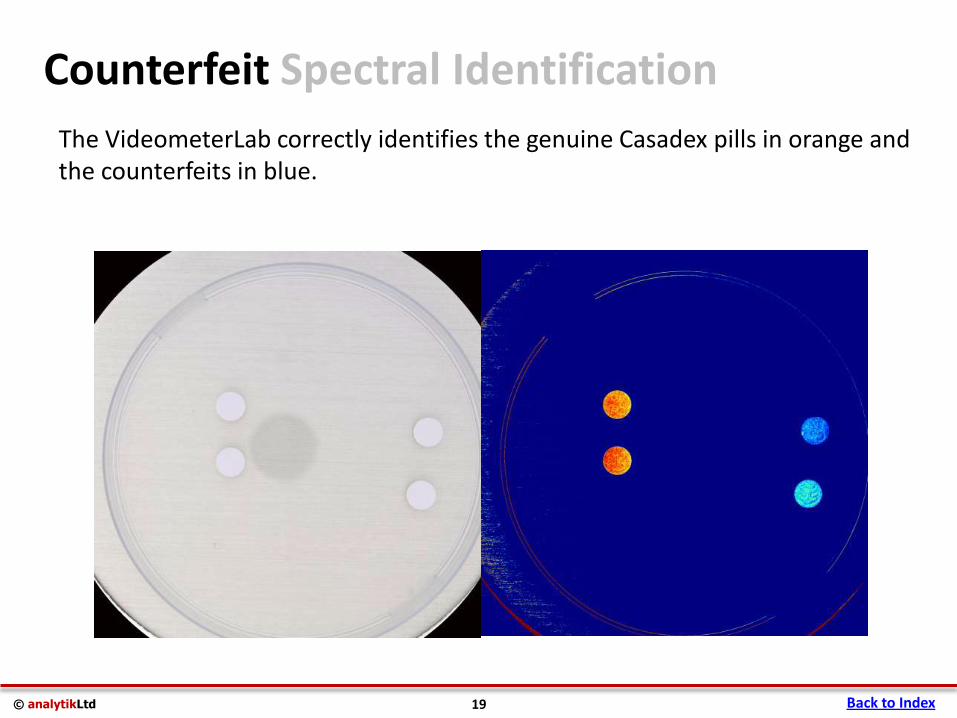
The VideometerLab correctly identifies the genuine Casadex pills in orange and the counterfeits in blue.
Counterfeit Spectral Identification
Back to Index 19
© analytikLtd
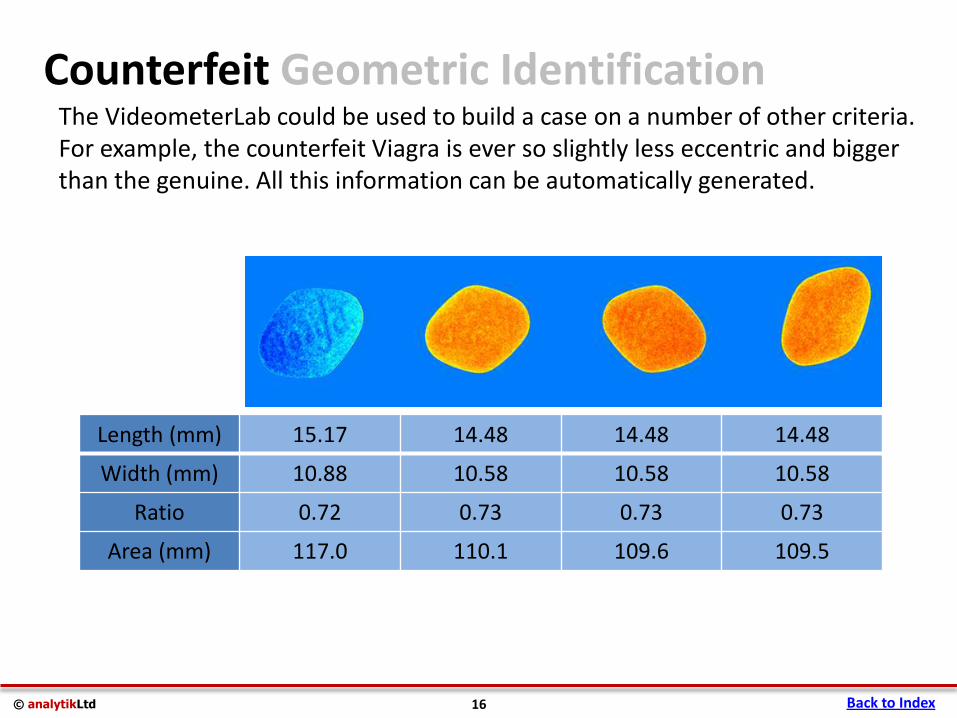
The VideometerLab could be used to build a case on a number of other criteria. For example, the counterfeit Viagra is ever so slightly less eccentric and bigger than the genuine. All this information can be automatically generated.
Counterfeit Geometric Identification
Back to Index 16
Length (mm) 15.17 14.48 14.48 14.48
Width (mm) 10.88 10.58 10.58 10.58
Ratio 0.72 0.73 0.73 0.73
Area (mm) 117.0 110.1 109.6 109.5
© analytikLtd
The Videometer can tell counterfeit from real even without opening the packaging
Counterfeit Packaging Identification
Back to Index 21
The next slides show a Cialis blister packet. The counterfeit packet is on the left, the genuine on the right.
Just as an aside, the Videometer usually has no trouble imaging through plastic. If – for whatever reason – you do not want to break the seal on a blister pack the Videometer can still return high-quality results through the plastic windows
© analytikLtd
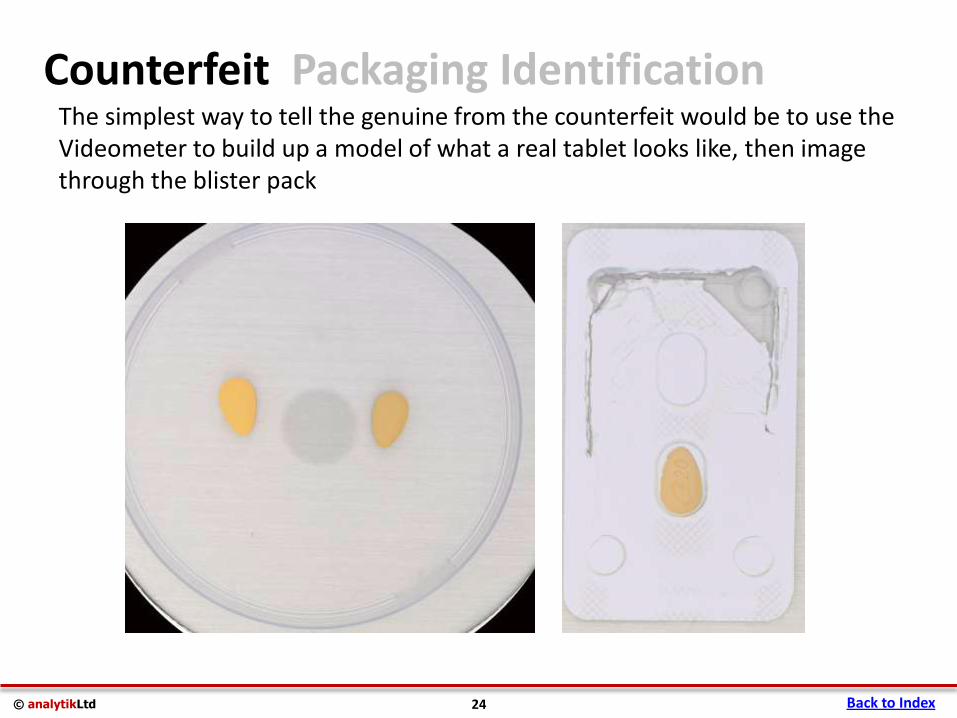
The simplest way to tell the genuine from the counterfeit would be to use the Videometer to build up a model of what a real tablet looks like, then image through the blister pack
Counterfeit Packaging Identification
Back to Index 24
© analytikLtd
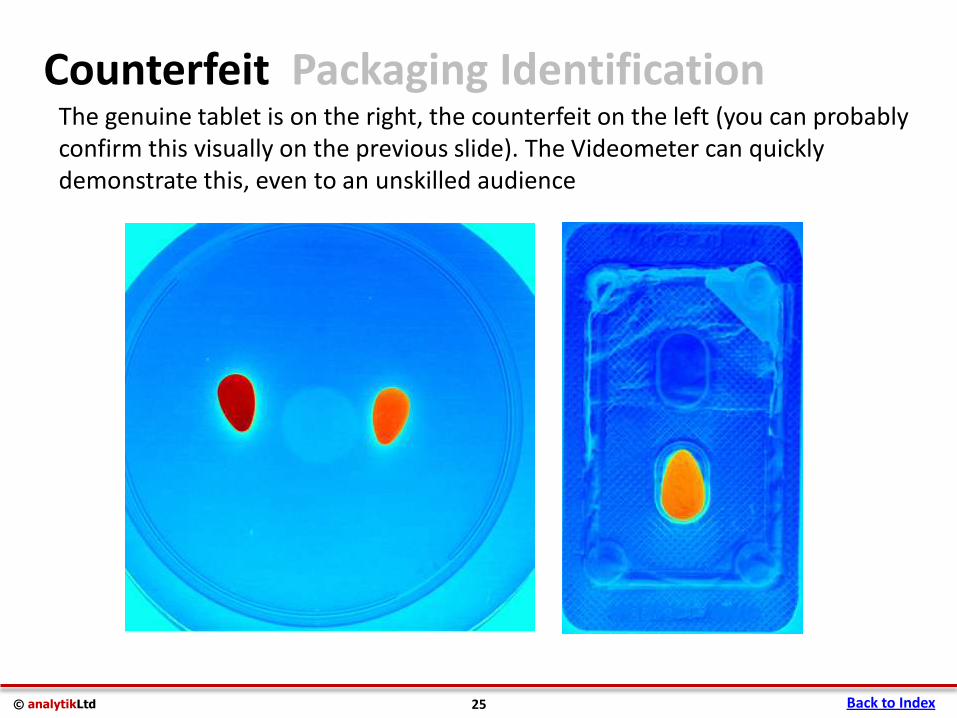
The genuine tablet is on the right, the counterfeit on the left (you can probably confirm this visually on the previous slide). The Videometer can quickly demonstrate this, even to an unskilled audience
Counterfeit Packaging Identification
Back to Index 25
© analytikLtd
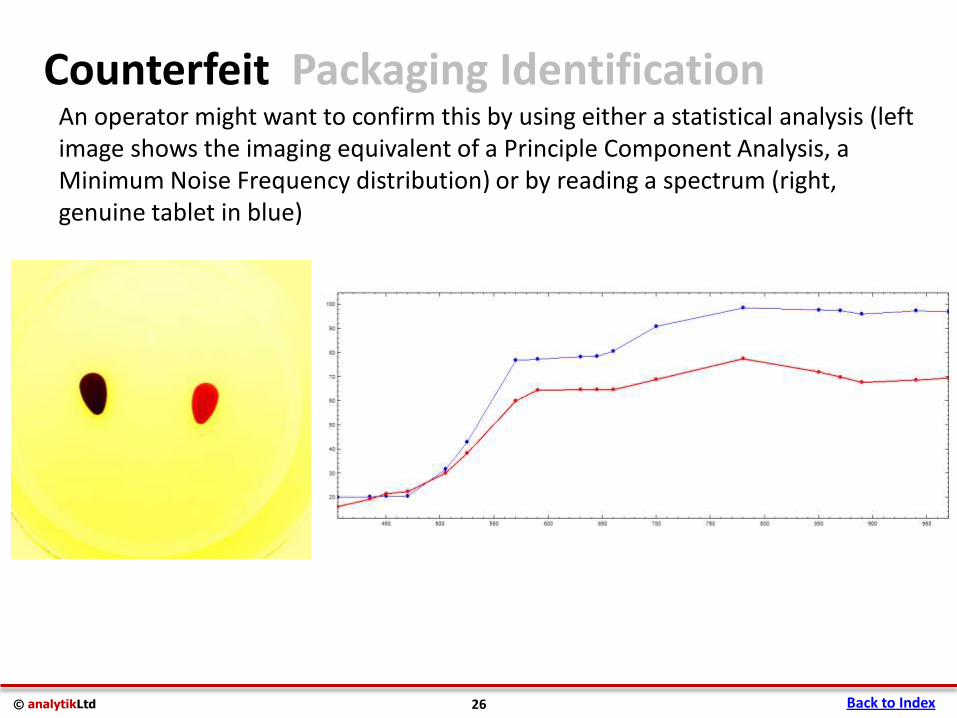
An operator might want to confirm this by using either a statistical analysis (left image shows the imaging equivalent of a Principle Component Analysis, a Minimum Noise Frequency distribution) or by reading a spectrum (right, genuine tablet in blue)
Counterfeit Packaging Identification
Back to Index 26
© analytikLtd
However, if we pretend for a moment that this is impossible – maybe the counterfeit blister packet has been used completely before being confiscated – the Videometer is still a powerful tool for detecting differences
Counterfeit Packaging Identification
Back to Index 27
The next slides show a series of differences which an operator was able to pick up between the two packets. The operator was moderately skilled at using the Videometer, but completely untrained at counterfeit pharmaceutical detection – all of these differences were pointed out by the Videometer and it is certain that if it were operated by someone who knew something about counterfeiting many more differences could be discovered
In every image, the counterfeit is always presented on the left, genuine on the right
© analytikLtd
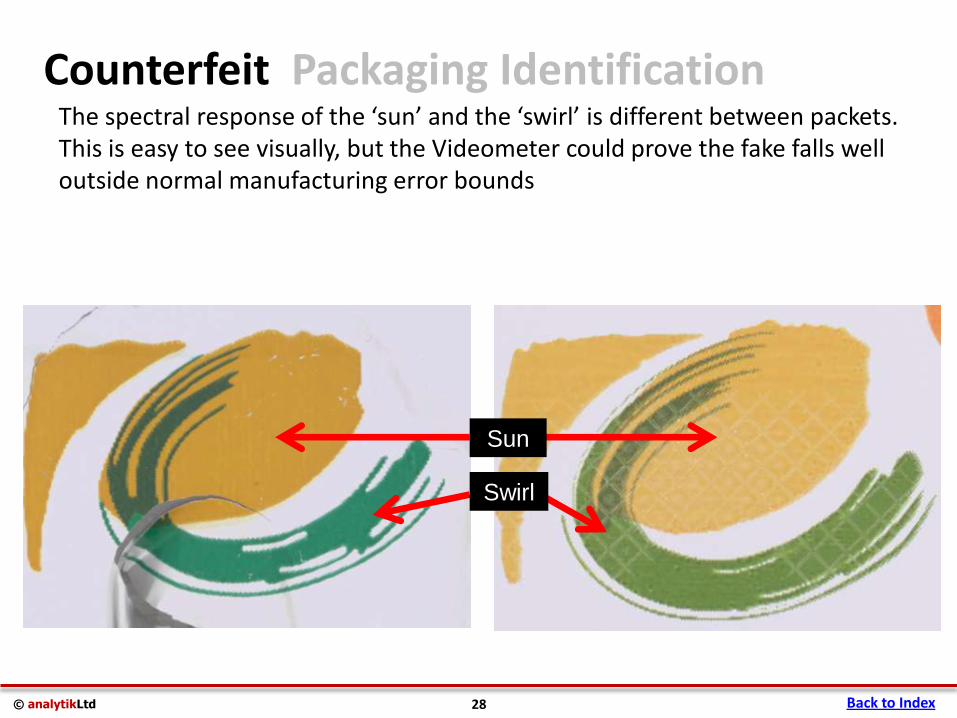
The spectral response of the ‘sun’ and the ‘swirl’ is different between packets. This is easy to see visually, but the Videometer could prove the fake falls well outside normal manufacturing error bounds
Counterfeit Packaging Identification
Back to Index 28
Swirl
Sun
© analytikLtd
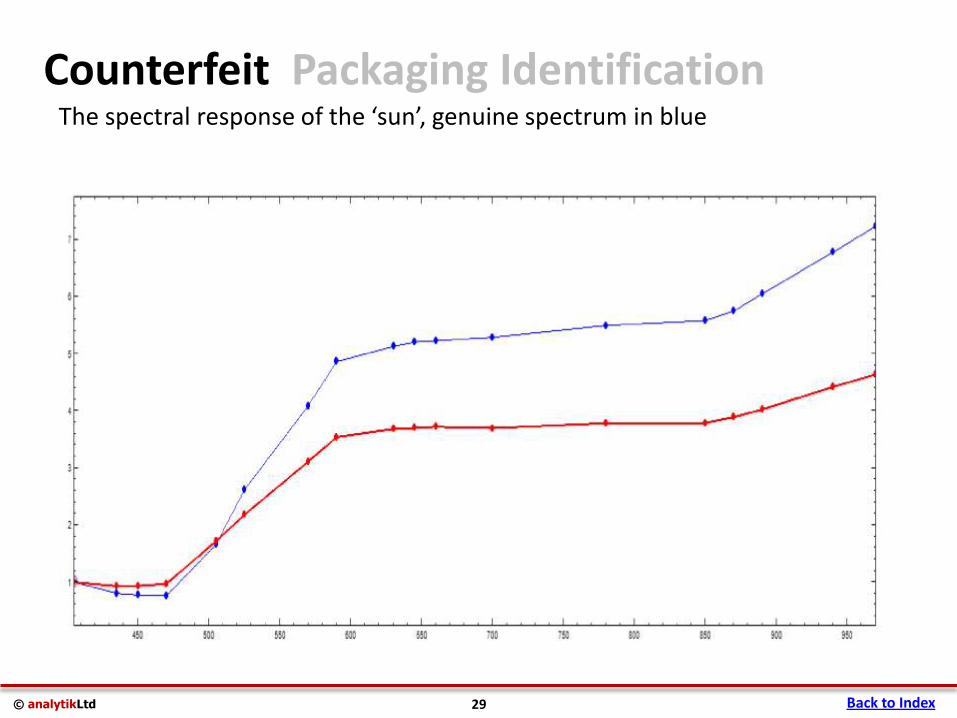
The spectral response of the ‘sun’, genuine spectrum in blue
Counterfeit Packaging Identification
Back to Index 29
© analytikLtd
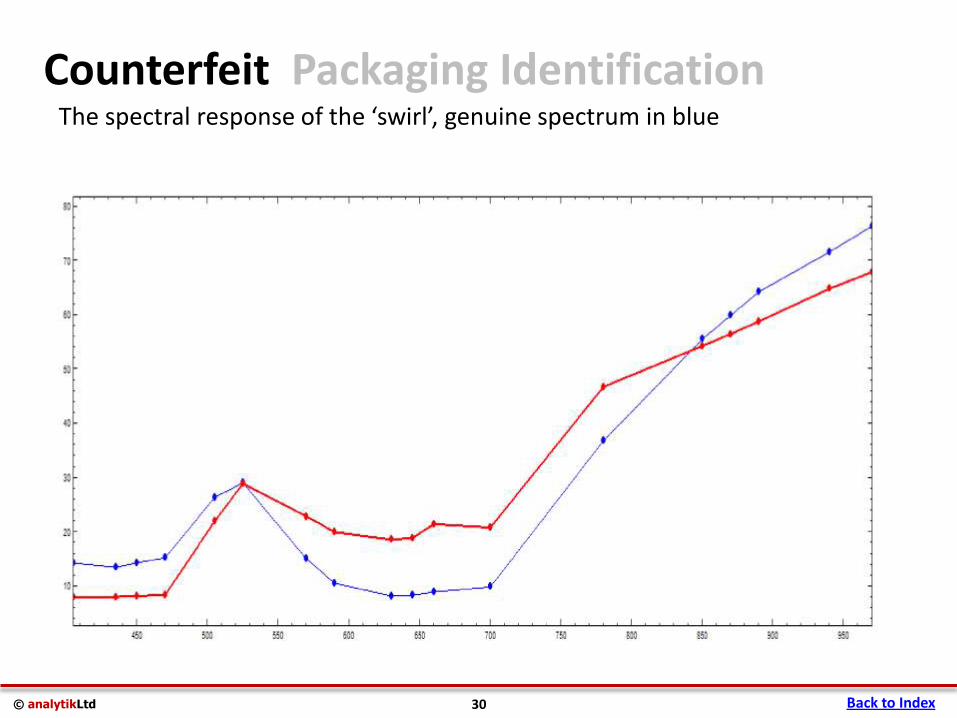
The spectral response of the ‘swirl’, genuine spectrum in blue
Counterfeit Packaging Identification
Back to Index 30
© analytikLtd
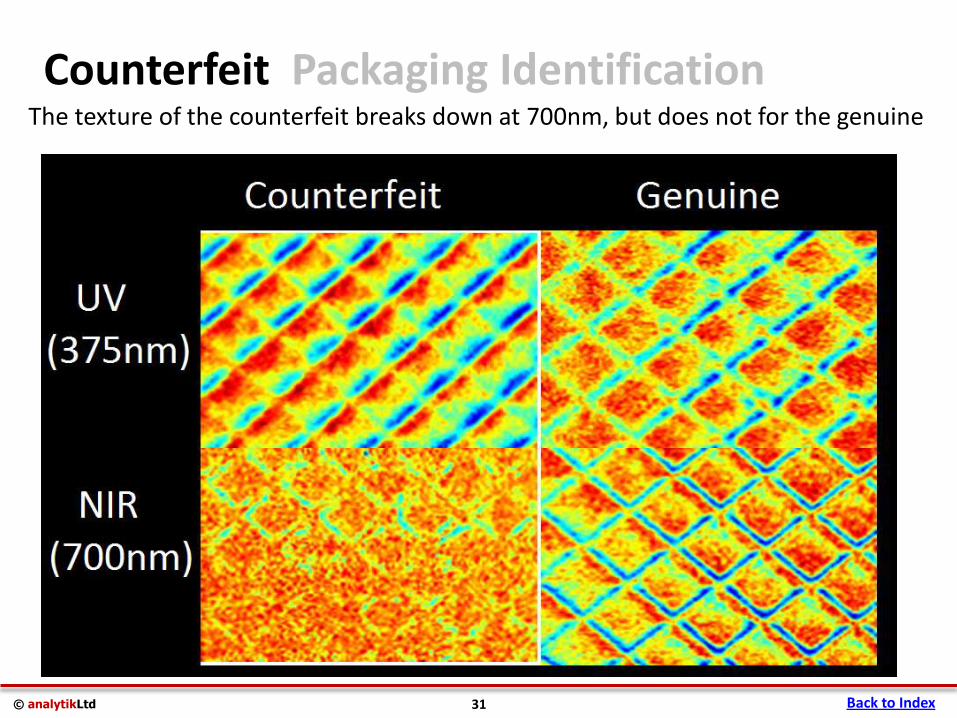
The texture of the counterfeit breaks down at 700nm, but does not for the genuine
Counterfeit Packaging Identification
Back to Index 31
© analytikLtd
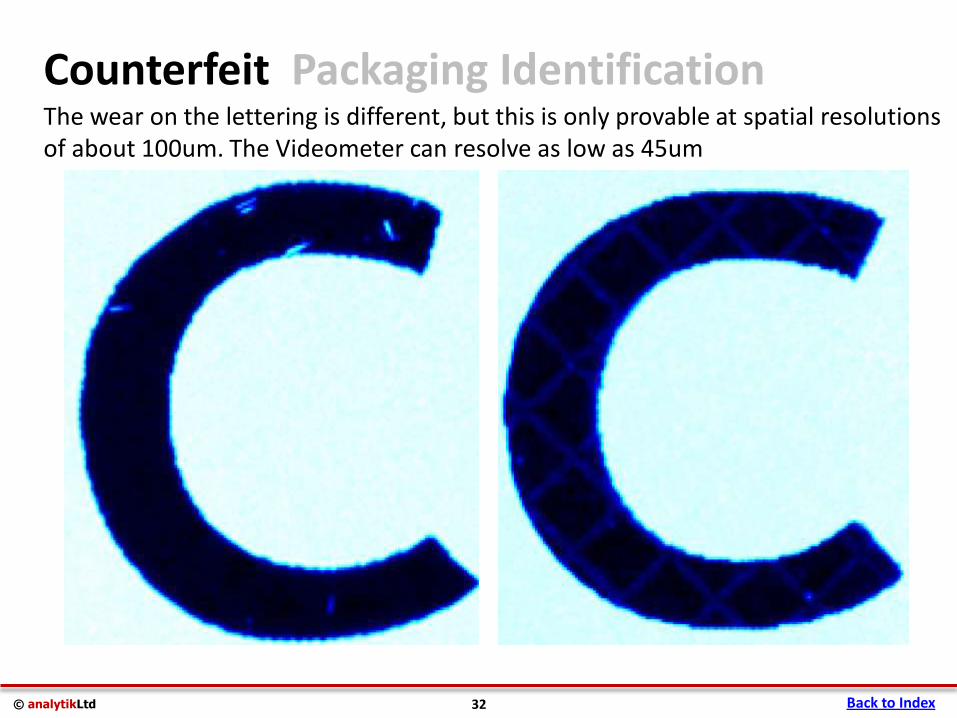
The wear on the lettering is different, but this is only provable at spatial resolutions of about 100um. The Videometer can resolve as low as 45um
Counterfeit Packaging Identification
Back to Index 32
© analytikLtd
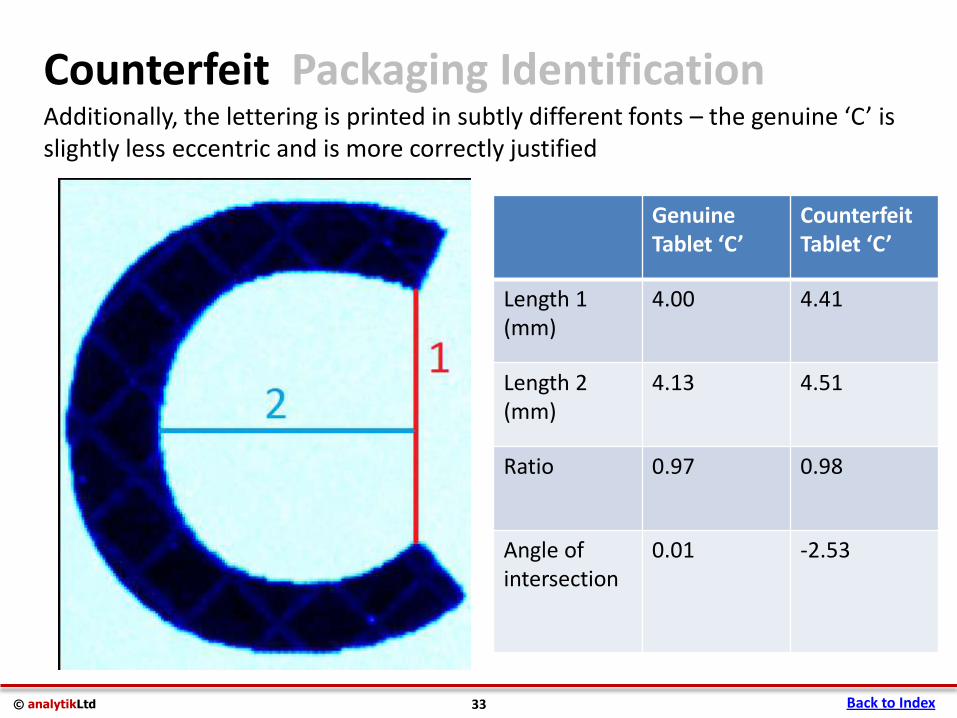
Additionally, the lettering is printed in subtly different fonts – the genuine ‘C’ is slightly less eccentric and is more correctly justified
Counterfeit Packaging Identification
Back to Index 33
Genuine Tablet ‘C’
Counterfeit Tablet ‘C’
Length 1 (mm)
4.00 4.41
Length 2 (mm)
4.13 4.51
Ratio 0.97 0.98
Angle of intersection
0.01 -2.53
© analytikLtd
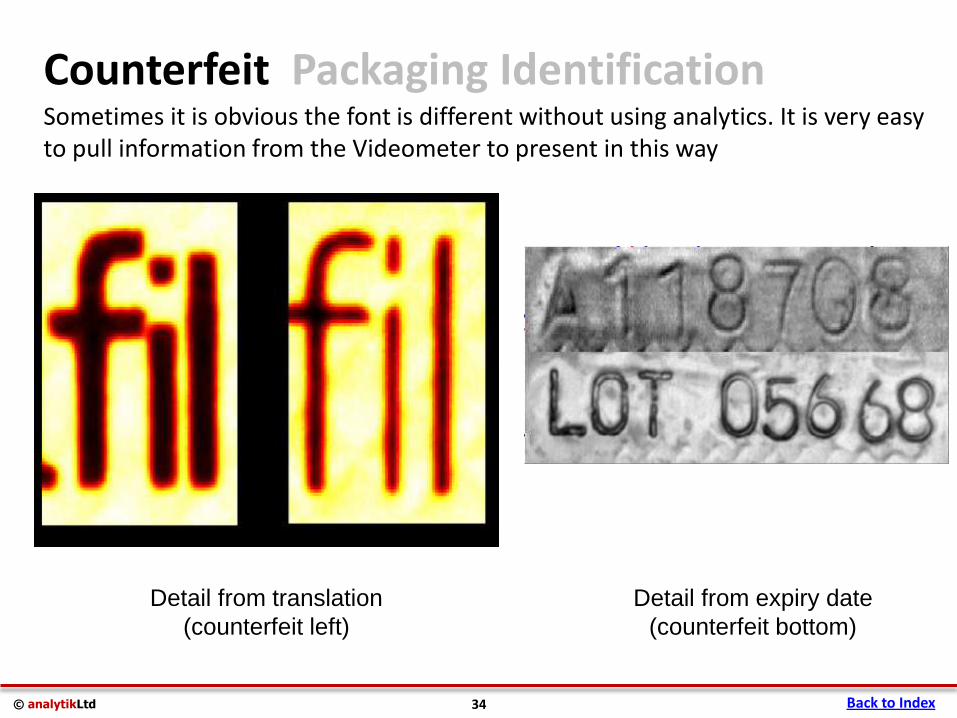
Sometimes it is obvious the font is different without using analytics. It is very easy to pull information from the Videometer to present in this way
Counterfeit Packaging Identification
Back to Index 34
Detail from translation
(counterfeit left)
Detail from expiry date
(counterfeit bottom)
© analytikLtd
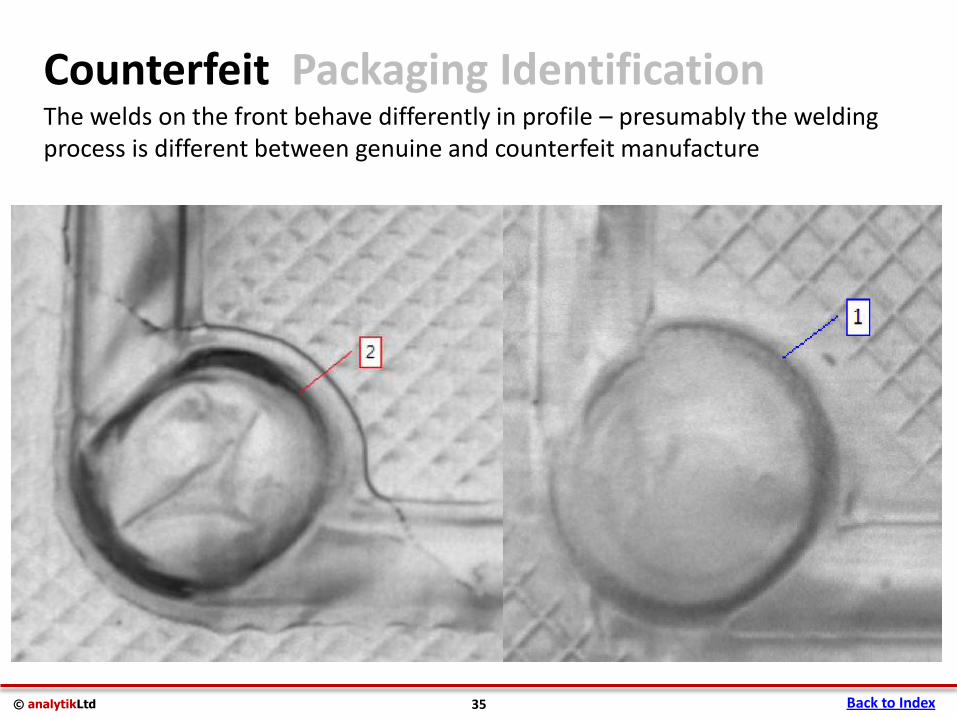
The welds on the front behave differently in profile – presumably the welding process is different between genuine and counterfeit manufacture
Counterfeit Packaging Identification
Back to Index 35
© analytikLtd
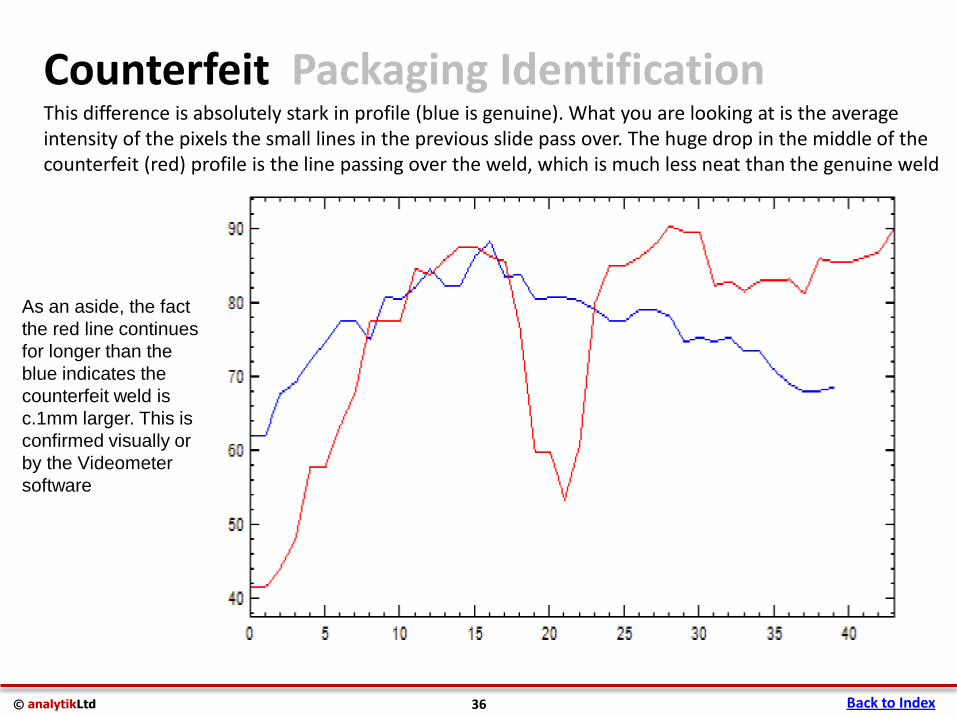
This difference is absolutely stark in profile (blue is genuine). What you are looking at is the average intensity of the pixels the small lines in the previous slide pass over. The huge drop in the middle of the counterfeit (red) profile is the line passing over the weld, which is much less neat than the genuine weld
Counterfeit Packaging Identification
Back to Index 36
As an aside, the fact
the red line continues
for longer than the
blue indicates the
counterfeit weld is
c.1mm larger. This is
confirmed visually or
by the Videometer
software
© analytikLtd
Conclusions and Further Actions
Back to Index
• The Videometer is a powerful tool in pharmaceutical QC and anti-counterfeiting applications. As well as being cutting edge in its own right as an analytical instrument, one major advantage it has over the competition is the fact that the images it produces are extremely accessible, which means it can be operated and interpreted far faster and by less skilled technicians than conventional techniques
37
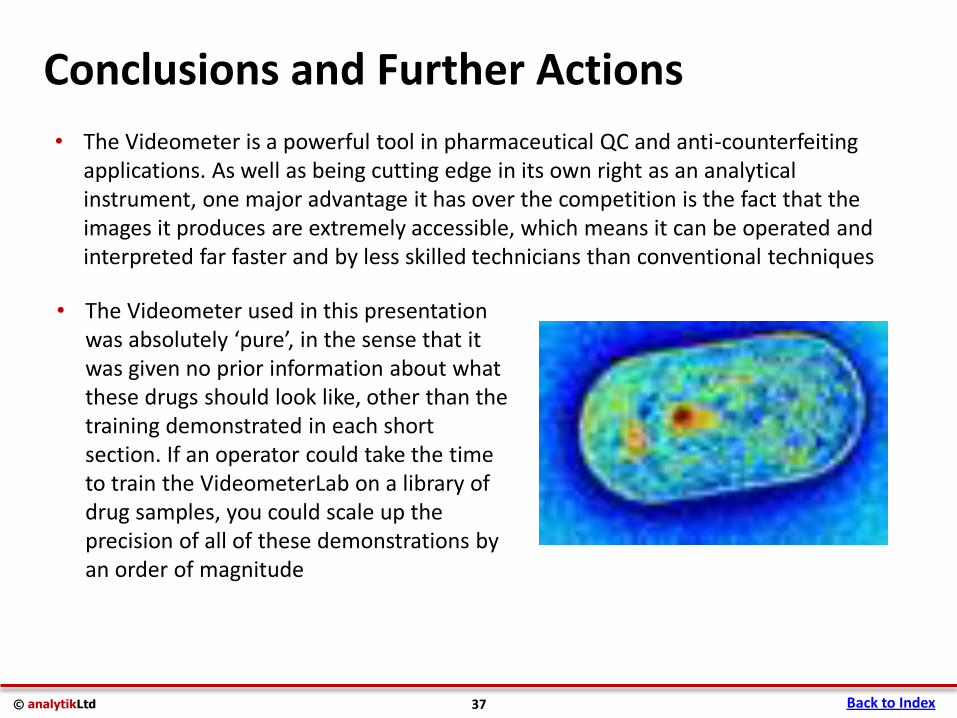
• The Videometer used in this presentation was absolutely ‘pure’, in the sense that it was given no prior information about what these drugs should look like, other than the training demonstrated in each short section. If an operator could take the time to train the VideometerLab on a library of drug samples, you could scale up the precision of all of these demonstrations by an order of magnitude