Malaysian Journal of Analytical Sciences, Vol 21 No 2 (2017): 484 - 495
DOI: https://doi.org/10.17576/mjas-2017-2102-24
484
MALAYSIAN JOURNAL OF ANALYTICAL SCIENCES
Published by The Malaysian Analytical Sciences Society
MOLECULAR WEIGHT CUT-OFF DETERMINATION OF PRESSURE
FILTRATION MEMBRANES VIA COLORIMETRIC DETECTION METHOD
(Penentuan Berat Sekatan Molekul Bagi Membran Penurasan TekananMelalui Kaedah
Pengesanan Kolorimetri)
Izzati Izni Yusoff, Rosiah Rohani*, Abdul Wahab Mohammad
Department of Chemical and Process Engineering,
Faculty of Engineering and Built Environment,
Universiti Kebangsaan Malaysia, 43600 UKM Bangi, Selangor, Malaysia
*Corresponding author: [email protected]
Received: 21 October 2015; Accepted: 14 June 2016
Abstract
Molecular weight cut-off (MWCO) of commercial and in-house fabricated membranes is obtained at 90% rejection of various
types of solutes with different molecular weights (MWs). PEG quantification methods have been favorably employed to
determine membranes’ MWCO. Most of the quantification methods utilizing high-end equipment using high performance liquid
chromatography (HPLC) and low-end colorimetric method. HPLC method requires an established chromatographic technique
using specific diluents, columns and detectors while the most referred colorimetric method requires a few processing steps with
concentration up to 7.5 ppm by using UV spectrophotometer. In this work, a newly modified colorimetric method was
established to conduct a simple measurement for a membrane’s MWCO. The newly modified method has an excellent linearity
for the calibration curves which R2 values are closed to 1 with concentration of up to 150 ppm. A MWCO determination test
conducted using different commercial membranes for confirming this newly modified method found that similar MWCO values
were obtained as given by the membrane’ manufacturers. In conclusion, this newly modified method is simpler than the formerly
used colorimetric method, reliable and applicable for determining the MWCO of membranes ranging from UF to NF at a higher
range of PEG concentrations (>150 ppm).
Keywords: molecular weight cut-off, polyethylene glycol, spectrophotometric, colorimetric, membrane
Abstrak
Berat sekatan molekul (MWCO) bagi membran komersial dan yang dihasilkan sendiri diperolehi pada 90% penolakan pelbagai
jenis bahan larut dengan berat molekul yang berbeza (MWs). Kaedah kuantifikasi menggunakan PEG adalah yang paling
digemari digunakan bagi menentukan MWCO daripada membran yang di sintesis. Kebanyakan kaedah menggunakan peralatan
atasan seperti kromatografi cecair berprestasi tinggi (HPLC) dan kaedah bawahan seperti kaedah kolorimetri. Kaedah HPLC
memerlukan teknik kromatografi yang tertubuh menggunakan bahan pencair, tiang dan pengesan tertentu manakala kaedah
kolorimetri memerlukan beberapa langkah pemprosesan dengan kepekatan hanya dalam julat sehingga 7.5 ppm menggunakan
spektrofotometer UV. Oleh yang demikian dalam kajian ini, satu kaedah kolorimetri baru yang diubahsuai telah ditubuhkan
untuk mengukur MWCO membran. Kaedah ini mempunyai kelinearan yang sangat baik, di mana nilai R2 menghampiri 1 dengan
kepekatan sehingga 150 ppm. Ujian penentuan MWCO dijalankan menggunakan beberapa membran komersial yang berbeza
untuk mengesahkan kaedah baru diubahsuai ini didapati bahawa nilai MWCO yang sama telah diperolehi bagi membran, seperti
yang diberikan oleh pengeluar membran. Kesimpulannya, kaedah yang baru diubahsuai ini adalah lebih mudah daripada kaedah
kalorimetri yang dahulunya digunakan, boleh dipercayai dan diguna pakai bagi menentukan MWCO daripada membran NF
sehingga membran UF malah pada julat kepekatan PEG yang lebih tinggi.
ISSN
1394 - 2506
Izzati Izni et al: MOLECULAR WEIGHT CUT-OFF DETERMINATION OF PRESSURE FILTRATION
MEMBRANES VIA COLORIMETRIC DETECTION METHOD
485
Kata kunci: berat sekatan molekul, polietilena glikol, spektrofotometer, kolorimetri, membran
Introduction
Membrane-based technologies are the leading technology for all kinds of separation techniques due to its intrinsic
characteristics such as operational simplicity, environmental impact, high selectivity and permeability in transport
of specific components [1]. A membrane is an interphase between two adjacent phases acting as a selective barrier,
regulating the transport of substances between the two compartments for separating feed species such as mixture of
liquid, gas and colloidal particle [2, 3]. Membranes with good resistant and selectivity are necessary to ensure
efficient separation process and very important for the industrial sector to obtain high purity products. Selectivity is
dependent on the pore size of the membranes [4]. Furthermore, one of the major factor in obtaining an effective
separation is by determining relative size of solute molecule to pass through the membrane pores [5]. Thus, the pore
sizes of the membrane and its distribution play a crucial role in determining the efficiency of filtration [6, 7].
Membrane pore sizes could be determined by several analytical methods. Solute rejection method, bubble point
method, soluble probe method, liquid replacement and visual observation techniques (e.g., atomic force microscopy
and scanning electron microscopy) are the methods commonly employed to measure the pore sizes of membranes [8
- 10]. Each of these methods has its own advantages and limitations. Some of the techniques outlined might not be
useful in the determination of pore size of membranes in term of their molecular weight cut-off (MWCO) since they
cannot predict the membranes’ sieving effects based on the removal of particles and solutes through the membranes
under actual operating conditions and transport mechanism [10, 11].
Among the outlined methods, the solute rejection method is an effective technique to investigate the separation
characteristics of various solutes by membranes because it measures solute rejection using actual filtration
experiments with non-ionic solutes of a known molecular weight (MW) such as polyethylene glycol (PEG),
oligostyrenes, alkanes and dextrans[10]. A membrane’s MWCO is a representation of membrane selectivity for
solute molecules of different MW, where the MW value is obtained from the solute molecule that gives a 90%
rejection when a range of different MW solutes are filtered in the targeted solvent [12, 13]. PEGs have been widely
used for the determination of the nominal MWCO because of their colloidal properties, which gives low-fouling
levels [11]. There are various detection methods for PEG but most of the methods utilizing high-end equipment
such as high performance liquid chromatography (HPLC) and low-end colorimetric method. HPLC method requires
an established chromatographic technique using specific diluents, columns and detectors while colorimetric method
requires a number of processing steps to dilute PEG based on the formation of a complex with barium chloride and
iodine solution until a very low concentration of up to 7.5 ppm using UV spectrophotometer [14]. Since most
reliable PEG detection techniques require the use of sophisticated instruments (which some instrument may not be
available in many laboratories) and apply complex protocols, the colorimetric detection method have attracted
considerable attentions in PEG detection applications with regard to their simplicity and versatility [15].
MWCO determination by colorimetric method was first used by [16] and has been extensively used thereafter by
many research groups worldwide for quantifying the MWCO of their fabricated membranes [3, 5, 17-19]. However,
there is no work ever reported to date, on the verification of the method with any types of commercial membranes
of known MWCO to confirm its accuracy. Furthermore, the MWCO of the reported synthesized membranes were
only in the ultrafiltration (UF) ranges. For instance, [16] reported the MWCO of the synthesized membrane from
cellulose acetate butyrate was around 15,000 g/mol upon using PEGs in range of 1,000 to 20,000 g/mol to
determine the MWCO value. In different occasions, [3] and [17] have used PEGs with MW of up to 35,000 and
65,000 g/mol, respectively, for the MWCO determination and the reported MWCO was also in UF ranges. So far,
the method has never been reported for determining the MWCO of nanofiltration (NF) range membranes other than
UF only. NF membrane is one type of pressure filtration membrane, situated between reverse osmosis (RO) and UF.
NF typically represents filtration and rejection of solutes with sizes in the region of 200 – 2,000 g/mol [20] while
UF represents solutes greater than 2,000 g/mol. Thus, this colorimetric method for PEG detection in the NF to UF
membrane MWCO application has become the basis to be focused in this study.
Malaysian Journal of Analytical Sciences, Vol 21 No 2 (2017): 484 - 495
DOI: https://doi.org/10.17576/mjas-2017-2102-24
486
Next, one of the identified drawback of this colorimetric method for MWCO determination is that it uses very low
solute concentrations [16]. This is because at high concentration of PEG, the solute solution tends to precipitate.
Thus, the reaction for this method is dependent on the concentration of the solution used [21]. However, low
concentration of solute rejection may affect the membrane solute retention, in which consequently caused inaccurate
MWCO reading. The concentration influenced the dipole moment interaction, which in turn affected the solute
rejection [20]. Therefore, high concentration of feed solution is required to be used when performing the pressured
membrane filtration in order to obtain a more accurate permeate concentration prediction [22]. Therefore in this
study, a simple yet sensitive and detectable PEG of various MW ranges (600 – 20,000 g/mol) at different
concentration ranges from low (0 ppm) and high (150 ppm) was established for a simple and reliable MWCO
determination method in comparison to the previous method reported by [16]. This newly modified method is
further tested using various commercial membranes of NF and UF for method verification to confirm the feasibility
of the modified colorimetric method for determining MWCO of the membranes.
Materials and Methods
Materials
Barium chloride, hydrochloric acid, potassium iodide and iodine were supplied by Friendemann Schmidt from
Chemolab Supplies. PEG with nominal MW (g/mol) of 600 (PEG600), 1,000 (PEG1000), 3,000 (PEG3000), 6,000
(PEG6000), 10,000 (PEG10000) and 20,000 (PEG20000) were from Sigma Aldrich supplied by Chemolab
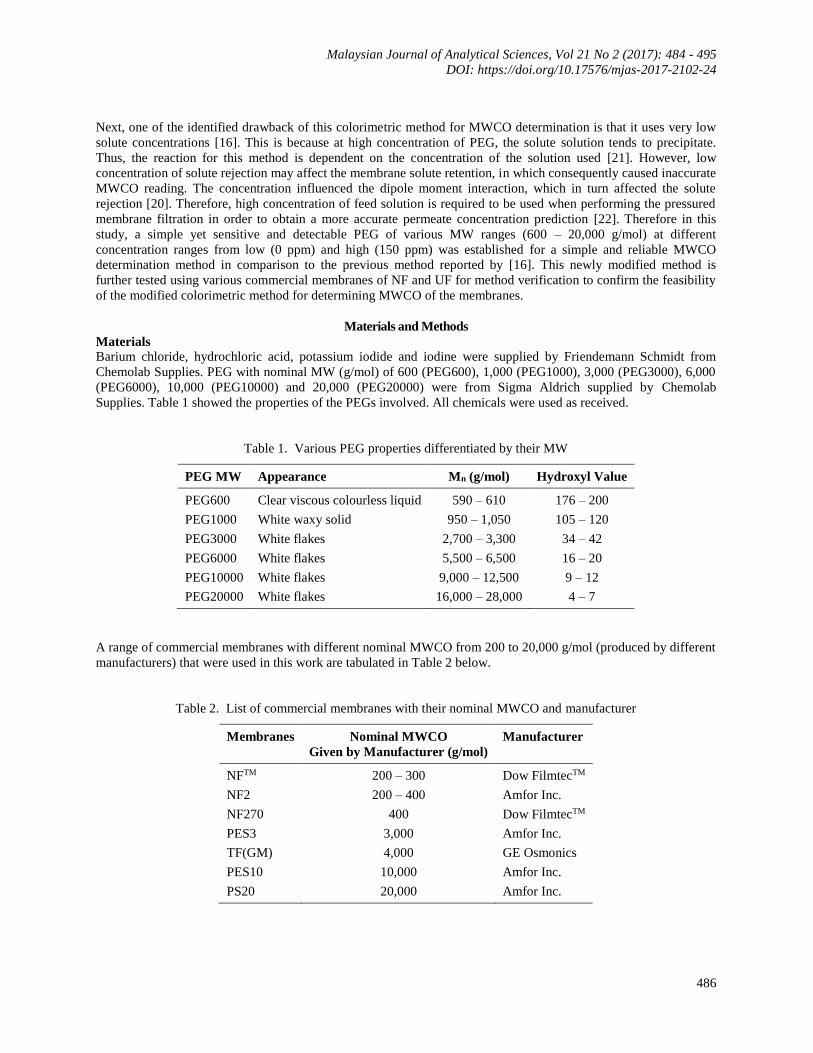
Supplies. Table 1 showed the properties of the PEGs involved. All chemicals were used as received.
Table 1. Various PEG properties differentiated by their MW
PEG MW Appearance Mn (g/mol) Hydroxyl Value
PEG600 Clear viscous colourless liquid 590 – 610 176 – 200
PEG1000 White waxy solid 950 – 1,050 105 – 120
PEG3000 White flakes 2,700 – 3,300 34 – 42
PEG6000 White flakes 5,500 – 6,500 16 – 20
PEG10000 White flakes 9,000 – 12,500 9 – 12
PEG20000 White flakes 16,000 – 28,000 4 – 7
A range of commercial membranes with different nominal MWCO from 200 to 20,000 g/mol (produced by different
manufacturers) that were used in this work are tabulated in Table 2 below.
Table 2. List of commercial membranes with their nominal MWCO and manufacturer
Membranes Nominal MWCO
Given by Manufacturer (g/mol)
Manufacturer
NFTM 200 – 300 Dow FilmtecTM
NF2 200 – 400 Amfor Inc.
NF270 400 Dow FilmtecTM
PES3 3,000 Amfor Inc.
TF(GM) 4,000 GE Osmonics
PES10 10,000 Amfor Inc.
PS20 20,000 Amfor Inc.
Izzati Izni et al: MOLECULAR WEIGHT CUT-OFF DETERMINATION OF PRESSURE FILTRATION
MEMBRANES VIA COLORIMETRIC DETECTION METHOD
487
Reagents and PEG preparation
There were two types of reagents used for the determination of PEG, namely iodine solution (Reagent 1) and
barium chloride solution (Reagent 2). Reagent 1 was prepared by dissolving 1.27 g iodine crystal in 100 mL of 2%
(w/v) solution. It was further diluted for 10 times prior to use. Reagent 2 was prepared by dissolving 5 g of barium
chloride in 100 mL of 1 M hydrochloride acid to form a 5% (w/v) solution [16]. 150 ppm PEG solutions (PEG600,
PEG1000, PEG3000, PEG6000, PEG10000 and PEG20000) were prepared by dissolving 0.15 g of PEG in 1 L
ultrapure water (Arium® Pro, Sartorius Malaysia Sdn Bhd, Malaysia). The solution was then being sonicated by
using Analog Ultrasonic Cleaner (WUC-A03H, Daihan Scientific).
To plot PEGs standard curve, a series of concentration were prepared in range 2.5 - 7.5 ppm for Sabde et al. method
while 10 – 150 ppm for the newly modified method (proposed in this work). Blank for both methods were prepared
by using ultrapure water and were also added with reagent 1 and 2 as samples while blank used for
spectrophotometer (Genesys 10UV, Thermo Electron Corporation, USA) was ultrapure water without addition of
any reagents.
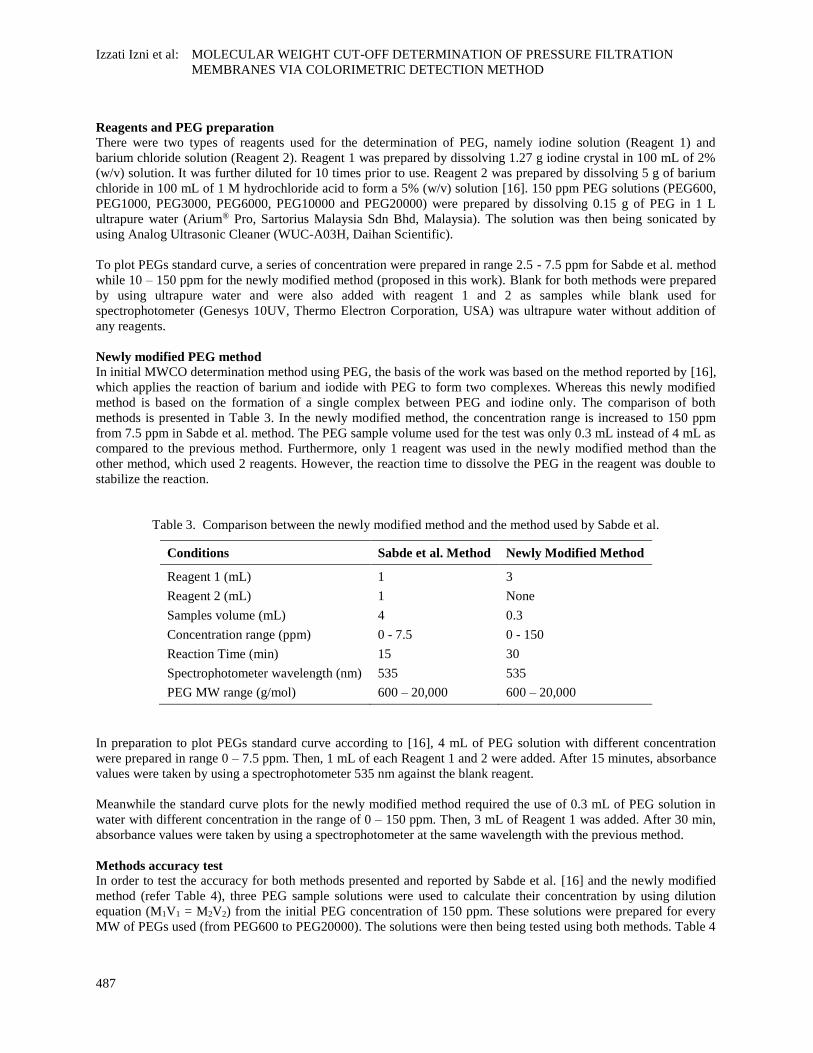
Newly modified PEG method
In initial MWCO determination method using PEG, the basis of the work was based on the method reported by [16],
which applies the reaction of barium and iodide with PEG to form two complexes. Whereas this newly modified
method is based on the formation of a single complex between PEG and iodine only. The comparison of both
methods is presented in Table 3. In the newly modified method, the concentration range is increased to 150 ppm
from 7.5 ppm in Sabde et al. method. The PEG sample volume used for the test was only 0.3 mL instead of 4 mL as
compared to the previous method. Furthermore, only 1 reagent was used in the newly modified method than the
other method, which used 2 reagents. However, the reaction time to dissolve the PEG in the reagent was double to
stabilize the reaction.
Table 3. Comparison between the newly modified method and the method used by Sabde et al.
Conditions Sabde et al. Method Newly Modified Method
Reagent 1 (mL) 1 3
Reagent 2 (mL) 1 None
Samples volume (mL) 4 0.3
Concentration range (ppm) 0 - 7.5 0 - 150
Reaction Time (min) 15 30
Spectrophotometer wavelength (nm) 535 535
PEG MW range (g/mol) 600 – 20,000 600 – 20,000
In preparation to plot PEGs standard curve according to [16], 4 mL of PEG solution with different concentration
were prepared in range 0 – 7.5 ppm. Then, 1 mL of each Reagent 1 and 2 were added. After 15 minutes, absorbance
values were taken by using a spectrophotometer 535 nm against the blank reagent.
Meanwhile the standard curve plots for the newly modified method required the use of 0.3 mL of PEG solution in
water with different concentration in the range of 0 – 150 ppm. Then, 3 mL of Reagent 1 was added. After 30 min,
absorbance values were taken by using a spectrophotometer at the same wavelength with the previous method.
Methods accuracy test
In order to test the accuracy for both methods presented and reported by Sabde et al. [16] and the newly modified
method (refer Table 4), three PEG sample solutions were used to calculate their concentration by using dilution
equation (M1V1 = M2V2) from the initial PEG concentration of 150 ppm. These solutions were prepared for every
MW of PEGs used (from PEG600 to PEG20000). The solutions were then being tested using both methods. Table 4
Malaysian Journal of Analytical Sciences, Vol 21 No 2 (2017): 484 - 495
DOI: https://doi.org/10.17576/mjas-2017-2102-24
488
show the three solutions that were used in this test. The accuracy test is considered as successful when the final
concentration values of the PEG solution calculated from dilution equation is the same or very near with the
concentration values obtained from the standard curve plotted.
Table 4. Sample solutions used for methods accuracy test
Volume of initial
PEG solution (mL)
Volume of ultrapure water
added into the solution (mL)
Final concentration of PEG
solution calculated (ppm)
0.2 14.8 5.3
0.6 14.4 16.0
1.0 14.0 26.7
Note: The PEG sample tested was from PEG600 to PEG20000
Membrane filtration
MWCO values of various commercial NF and UF membranes were given by the manufacturers (refer Table 2) are
to be confirmed by using the newly modified method in comparison to Sabde et al. method. To determine this,
solute rejections (SR) of the membranes were evaluated with various MW PEG solutions from 600 to 20,000 g/mol
with concentration of 150 ppm at 30 bar by using a dead-end filtration cell (HP4750, Sterlitech Corporation, USA)
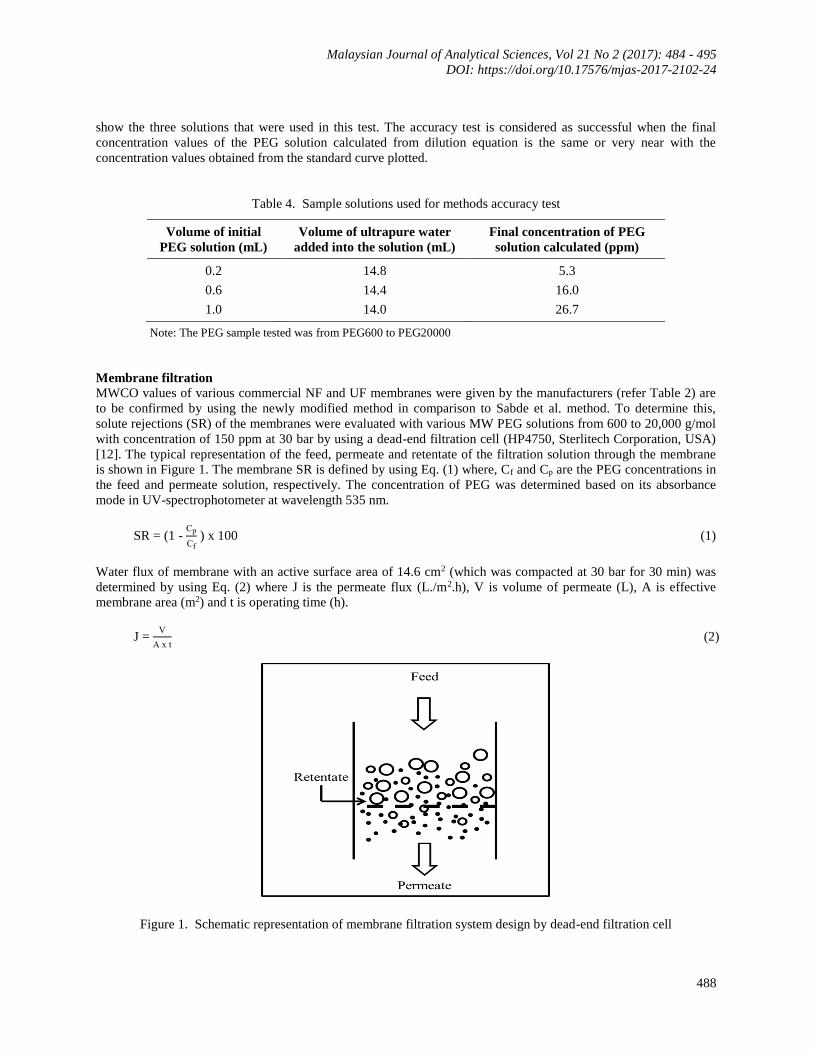
[12]. The typical representation of the feed, permeate and retentate of the filtration solution through the membrane
is shown in Figure 1. The membrane SR is defined by using Eq. (1) where, Cf and Cp are the PEG concentrations in
the feed and permeate solution, respectively. The concentration of PEG was determined based on its absorbance
mode in UV-spectrophotometer at wavelength 535 nm.
SR = (1 - Cp
Cf ) x 100 (1)
Water flux of membrane with an active surface area of 14.6 cm2 (which was compacted at 30 bar for 30 min) was
determined by using Eq. (2) where J is the permeate flux (L./m2.h), V is volume of permeate (L), A is effective
membrane area (m2) and t is operating time (h).
J = V
A x t (2)
Figure 1. Schematic representation of membrane filtration system design by dead-end filtration cell
Izzati Izni et al: MOLECULAR WEIGHT CUT-OFF DETERMINATION OF PRESSURE FILTRATION
MEMBRANES VIA COLORIMETRIC DETECTION METHOD
489
Results and Discussion
Newly modified PEG methods for MWCO determination
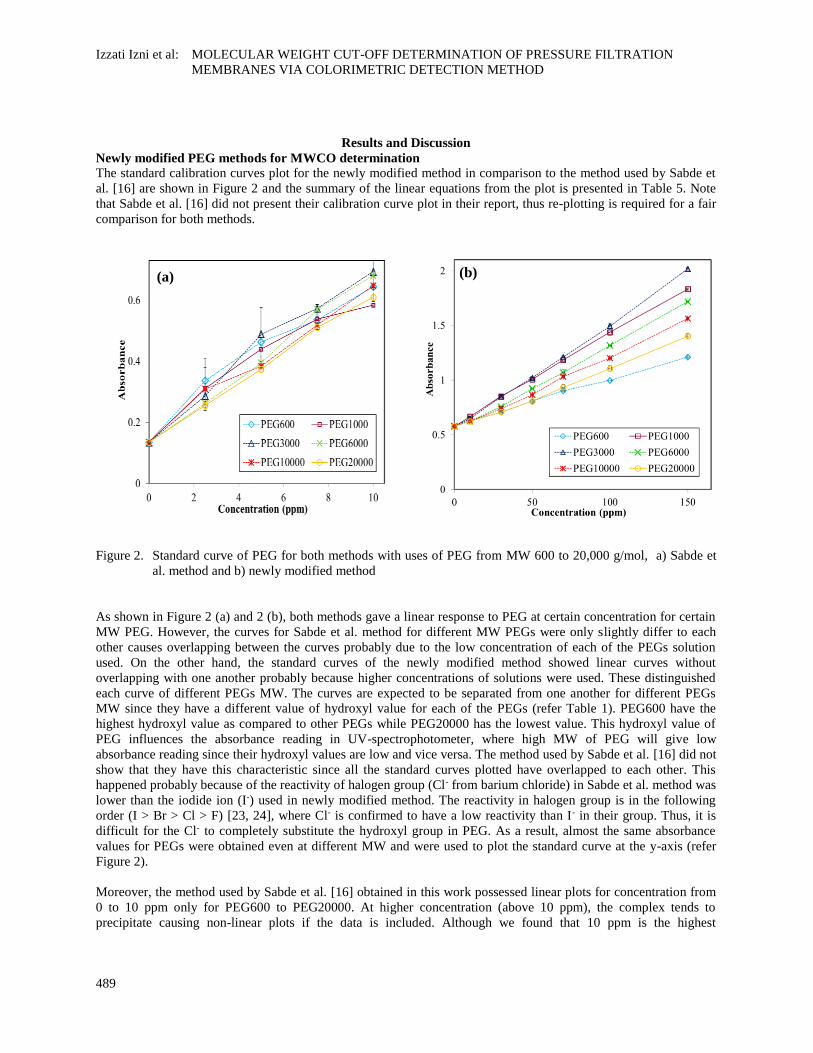
The standard calibration curves plot for the newly modified method in comparison to the method used by Sabde et
al. [16] are shown in Figure 2 and the summary of the linear equations from the plot is presented in Table 5. Note
that Sabde et al. [16] did not present their calibration curve plot in their report, thus re-plotting is required for a fair
comparison for both methods.
Figure 2. Standard curve of PEG for both methods with uses of PEG from MW 600 to 20,000 g/mol, a) Sabde et
al. method and b) newly modified method
As shown in Figure 2 (a) and 2 (b), both methods gave a linear response to PEG at certain concentration for certain
MW PEG. However, the curves for Sabde et al. method for different MW PEGs were only slightly differ to each
other causes overlapping between the curves probably due to the low concentration of each of the PEGs solution
used. On the other hand, the standard curves of the newly modified method showed linear curves without
overlapping with one another probably because higher concentrations of solutions were used. These distinguished
each curve of different PEGs MW. The curves are expected to be separated from one another for different PEGs
MW since they have a different value of hydroxyl value for each of the PEGs (refer Table 1). PEG600 have the
highest hydroxyl value as compared to other PEGs while PEG20000 has the lowest value. This hydroxyl value of
PEG influences the absorbance reading in UV-spectrophotometer, where high MW of PEG will give low
absorbance reading since their hydroxyl values are low and vice versa. The method used by Sabde et al. [16] did not
show that they have this characteristic since all the standard curves plotted have overlapped to each other. This
happened probably because of the reactivity of halogen group (Cl- from barium chloride) in Sabde et al. method was
lower than the iodide ion (I-) used in newly modified method. The reactivity in halogen group is in the following
order (I > Br > Cl > F) [23, 24], where Cl- is confirmed to have a low reactivity than I- in their group. Thus, it is
difficult for the Cl- to completely substitute the hydroxyl group in PEG. As a result, almost the same absorbance
values for PEGs were obtained even at different MW and were used to plot the standard curve at the y-axis (refer
Figure 2).
Moreover, the method used by Sabde et al. [16] obtained in this work possessed linear plots for concentration from
0 to 10 ppm only for PEG600 to PEG20000. At higher concentration (above 10 ppm), the complex tends to
precipitate causing non-linear plots if the data is included. Although we found that 10 ppm is the highest
(a) (b)
Malaysian Journal of Analytical Sciences, Vol 21 No 2 (2017): 484 - 495
DOI: https://doi.org/10.17576/mjas-2017-2102-24
490
concentration to get a plot with R2 of above 0.9 than 7.5 ppm as reported, this concentration is way too low
compared to the newly modified method that can reach 150 ppm or may be more. Initially, this colorimetric method
has been successfully used by few researchers in biological fields for many years [25]. For example, it was used for
detecting PEG and PEGylated molecules in biological samples like protein [26], enzyme [13] and genes [21].
Shaffer and Critchfield on year 1947 was the first to develop this most commonly cited method for quantification of
PEG molecules based on the formation of insoluble complexes between PEG and heteropoly inorganic acids
(phosphomolybdic and silicotungstic acid) in the presence of barium chloride. The precipitate was then collected
and washed for several times prior to testing it with iodine in order to detect the PEG [25]. Perhaps, this was the
main reason for the employment of barium chloride for the quantification of PEG/PEGylated molecules in
biological samples and this has answered the importance of the precipitation to occur in the method reported by
Shaffer and Critchfield [25]. However, in the application of membrane technology especially for MWCO
determination, it was found that precipitation of PEG is an undesirable step and must be avoided since it could
interfere during the reading of absorbance values by using UV spectrophotometer. The presence of precipitate
causes spectral interferences due to the colloidal particles spread in the solution [27, 28]. Therefore, in order to have
an accurate absorbance reading, appropriate dilutions of the samples are necessarily required to make sure their
concentrations are below 7.5 ppm before the addition of the two reagents (barium chloride and iodine) into the
samples to avoid precipitation from occurs.
Table 5. Equation of standard curve and R2 values for Sabde et al. method and newly modified method
PEG MW
(g/mol)
Sabde et al. Method Newly Modified Method
Linear Equation R2 Value Linear Equation R2 value
PEG600 y = 0.0546x + 0.135 0.9431 y = 0.0043x + 0.578 0.9959
PEG1000 y = 0.0506x + 0.135 0.9319 y = 0.0085x + 0.578 0.9991
PEG3000 y = 0.0588x + 0.135 0.9779 y = 0.0094x + 0.578 0.9977
PEG6000 y = 0.0551x + 0.135 0.9955 y = 0.0074x + 0.578 0.9952
PEG10000 y = 0.0517x + 0.135 0.9863 y = 0.0064x + 0.578 0.9954
PEG20000 y = 0.0484x + 0.135 0.9982 y = 0.0053x + 0.578 0.9937
Based on the results shown in Figure 2(b) and Table 5, the newly modified method gave linear relationship from 0
to 150 ppm for PEG600 to PEG20000 with R2 values nearly 1. Please note that this newly modified method is
solely depended on complex formation between PEG and iodine only. The reaction is called halogenation where
hydroxyl group in PEG will be substituted by iodide ion [24]. In this reaction, there is no precipitation produced and
observed since there is no involvement of metal ions like barium ion that can form precipitate. The main advantage
of this method is that there is no precipitate formed even at concentration up to 400 ppm. Furthermore, this newly
modified method only used 0.3 mL of the collected samples, is tenth times much lower than Sabde et al. method
which required as much as 4 mL samples during PEGs detection. There are membranes which requires 1 hour only
to collect 1 mL permeate, thus this newly modified method could reduce the time required for permeate collection.
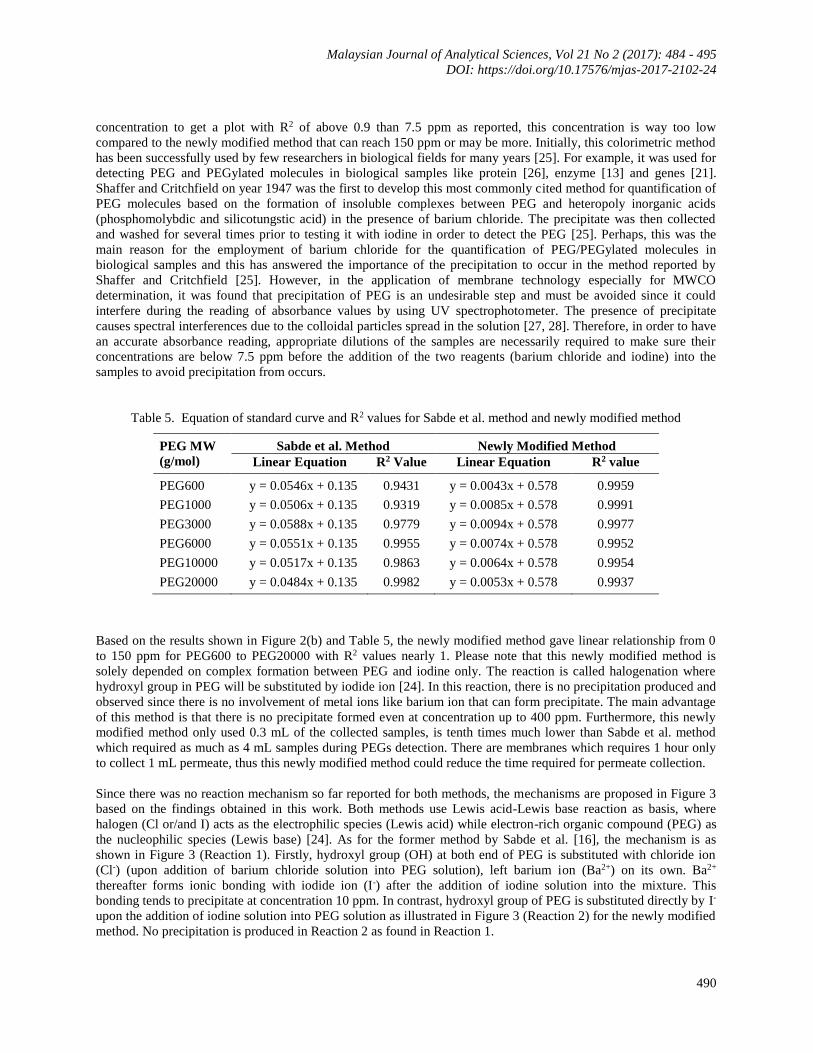
Since there was no reaction mechanism so far reported for both methods, the mechanisms are proposed in Figure 3
based on the findings obtained in this work. Both methods use Lewis acid-Lewis base reaction as basis, where
halogen (Cl or/and I) acts as the electrophilic species (Lewis acid) while electron-rich organic compound (PEG) as
the nucleophilic species (Lewis base) [24]. As for the former method by Sabde et al. [16], the mechanism is as
shown in Figure 3 (Reaction 1). Firstly, hydroxyl group (OH) at both end of PEG is substituted with chloride ion
(Cl-) (upon addition of barium chloride solution into PEG solution), left barium ion (Ba2+) on its own. Ba2+
thereafter forms ionic bonding with iodide ion (I-) after the addition of iodine solution into the mixture. This
bonding tends to precipitate at concentration 10 ppm. In contrast, hydroxyl group of PEG is substituted directly by I-
upon the addition of iodine solution into PEG solution as illustrated in Figure 3 (Reaction 2) for the newly modified
method. No precipitation is produced in Reaction 2 as found in Reaction 1.
Izzati Izni et al: MOLECULAR WEIGHT CUT-OFF DETERMINATION OF PRESSURE FILTRATION
MEMBRANES VIA COLORIMETRIC DETECTION METHOD
491
Figure 3. Proposed reaction mechanism for MWCO determination methods
Methods accuracy test
Three types of PEG with different MW were used for this accuracy test which is PEG with lowest (PEG600),
middle (PEG6000) and highest (PEG20000) MW. A set of samples solution were prepared from these three PEGs
to examine the accuracy of both compared methods. The test was repeated for three times to determine the standard
deviation and further minimizing the error.
From the results showed in Table 6, both methods gave accurate values (calculated and actual) for the concentration
of the samples solution. There was no dilution needed during the accuracy test for the newly modified method.
However, the former method required some dilutions to be done especially for PEG6000 and PEG20000 (refer
Table 6). The concentrations of the solutions were 16.0 and 26.7 ppm, respectively. At this concentration,
precipitation tends to occur since their concentrations are above 10 ppm. Therefore, dilution must be conducted
during using the former method to determine the concentration of the solutions. Luckily, the dilution work that has
been conducted to eliminate precipitation is easily done since their final concentration is known. However, if this
former method is applied for quantifying the MWCO of a membrane from pressure filtration, it will be very difficult
to identify the dilution factor to bring the solution’s concentration at below 10 ppm since the permeate concentration
is unknown. Thus, this test can be showed as a proof that the newly modified method is easier, more reliable and
accurate to be used in determining MWCO of various filtration membranes specifically for NF and UF than the
former method reported by Sabde et al. [16].
Commercial membranes solute filtration test
Commercial NF and UF membranes were used in solute filtration test for the MWCO study. NF and NF270
membranes were kindly donated by Dow Chemical Company. TF(GM) membranes and NF2, PES3, PES10, and
PS20 were purchased from GE Osmonics and Amfor Inc. respectively (refer Table 2 for details). MWCO of all
membranes were determined by using PEG with MW ranges from 600 to 20,000 g/mol. The solute MW ranges was
divided into two categories: (i) NF range for MWCO below 2,000 g/mol, and (ii) UF range for MWCO above 2,000
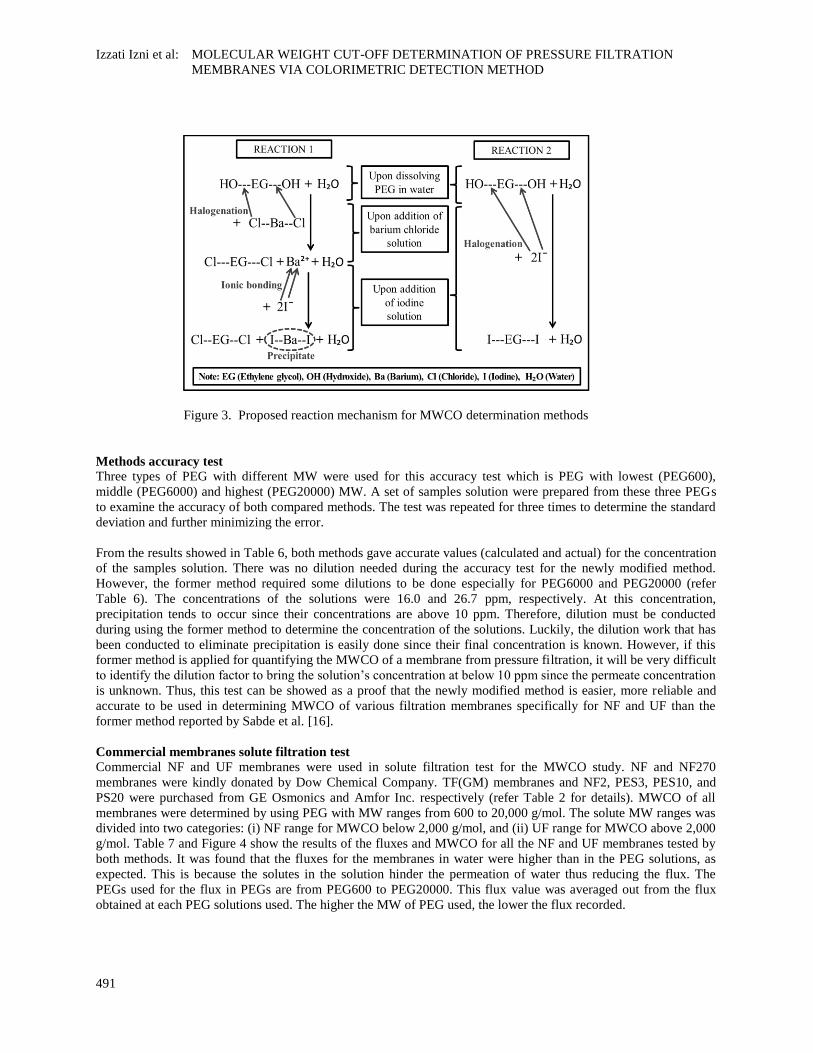
g/mol. Table 7 and Figure 4 show the results of the fluxes and MWCO for all the NF and UF membranes tested by
both methods. It was found that the fluxes for the membranes in water were higher than in the PEG solutions, as
expected. This is because the solutes in the solution hinder the permeation of water thus reducing the flux. The
PEGs used for the flux in PEGs are from PEG600 to PEG20000. This flux value was averaged out from the flux
obtained at each PEG solutions used. The higher the MW of PEG used, the lower the flux recorded.
Malaysian Journal of Analytical Sciences, Vol 21 No 2 (2017): 484 - 495
DOI: https://doi.org/10.17576/mjas-2017-2102-24
492
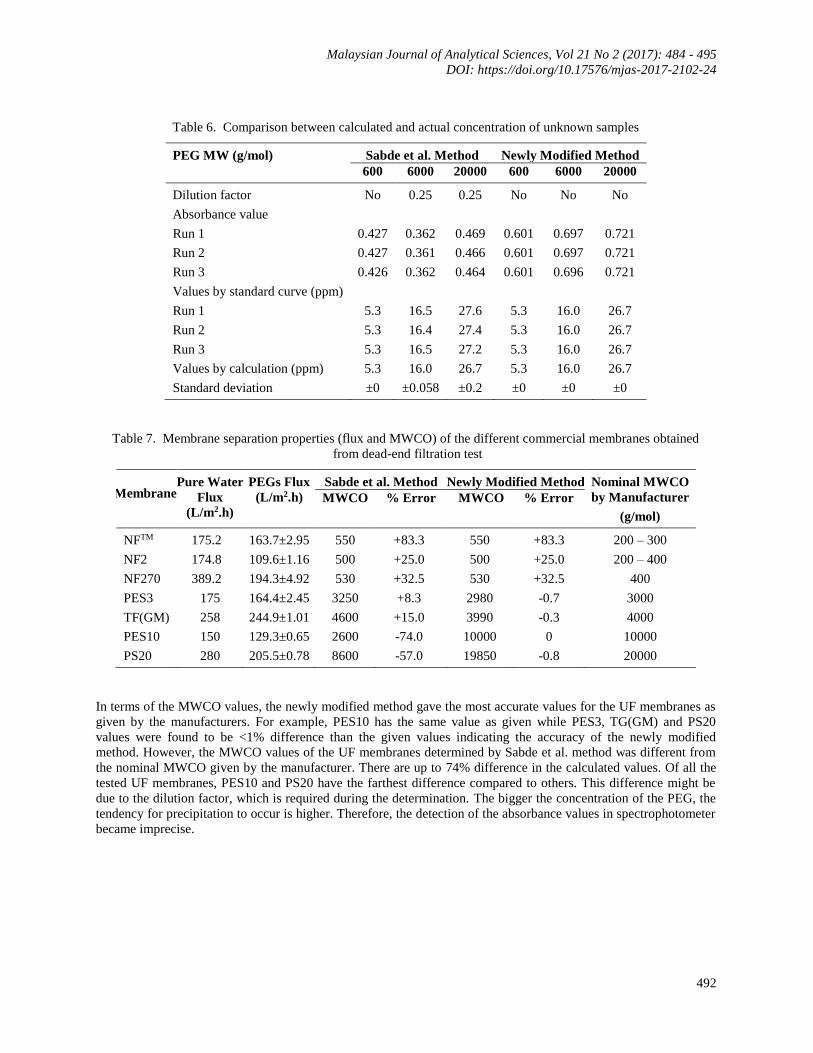
Table 6. Comparison between calculated and actual concentration of unknown samples
PEG MW (g/mol) Sabde et al. Method Newly Modified Method
600 6000 20000 600 6000 20000
Dilution factor No 0.25 0.25 No No No
Absorbance value
Run 1
Run 2
Run 3
0.427
0.427
0.426
0.362
0.361
0.362
0.469
0.466
0.464
0.601
0.601
0.601
0.697
0.697
0.696
0.721
0.721
0.721
Values by standard curve (ppm)
Run 1
Run 2
Run 3
5.3
5.3
5.3
16.5
16.4
16.5
27.6
27.4
27.2
5.3
5.3
5.3
16.0
16.0
16.0
26.7
26.7
26.7
Values by calculation (ppm) 5.3 16.0 26.7 5.3 16.0 26.7
Standard deviation ±0 ±0.058 ±0.2 ±0 ±0 ±0
Table 7. Membrane separation properties (flux and MWCO) of the different commercial membranes obtained
from dead-end filtration test
Membrane Pure Water
Flux
(L/m2.h)
PEGs Flux
(L/m2.h)
Sabde et al. Method Newly Modified Method Nominal MWCO
by Manufacturer
(g/mol)
MWCO % Error MWCO % Error
NFTM 175.2 163.7±2.95 550 +83.3 550 +83.3 200 – 300
NF2 174.8 109.6±1.16 500 +25.0 500 +25.0 200 – 400
NF270 389.2 194.3±4.92 530 +32.5 530 +32.5 400
PES3 175 164.4±2.45 3250 +8.3 2980 -0.7 3000
TF(GM) 258 244.9±1.01 4600 +15.0 3990 -0.3 4000
PES10 150 129.3±0.65 2600 -74.0 10000 0 10000
PS20 280 205.5±0.78 8600 -57.0 19850 -0.8 20000
In terms of the MWCO values, the newly modified method gave the most accurate values for the UF membranes as
given by the manufacturers. For example, PES10 has the same value as given while PES3, TG(GM) and PS20
values were found to be <1% difference than the given values indicating the accuracy of the newly modified
method. However, the MWCO values of the UF membranes determined by Sabde et al. method was different from
the nominal MWCO given by the manufacturer. There are up to 74% difference in the calculated values. Of all the
tested UF membranes, PES10 and PS20 have the farthest difference compared to others. This difference might be
due to the dilution factor, which is required during the determination. The bigger the concentration of the PEG, the
tendency for precipitation to occur is higher. Therefore, the detection of the absorbance values in spectrophotometer
became imprecise.
Izzati Izni et al: MOLECULAR WEIGHT CUT-OFF DETERMINATION OF PRESSURE FILTRATION
MEMBRANES VIA COLORIMETRIC DETECTION METHOD
493
(a)
(b)
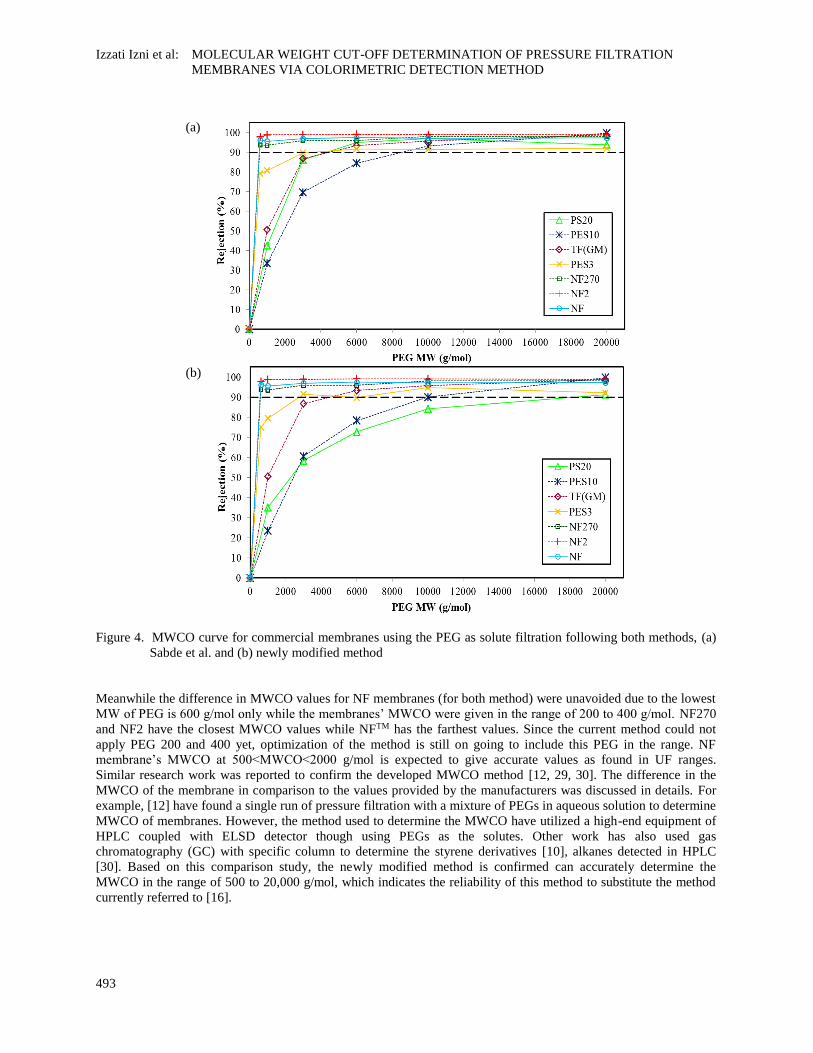
Figure 4. MWCO curve for commercial membranes using the PEG as solute filtration following both methods, (a)
Sabde et al. and (b) newly modified method
Meanwhile the difference in MWCO values for NF membranes (for both method) were unavoided due to the lowest
MW of PEG is 600 g/mol only while the membranes’ MWCO were given in the range of 200 to 400 g/mol. NF270
and NF2 have the closest MWCO values while NFTM has the farthest values. Since the current method could not
apply PEG 200 and 400 yet, optimization of the method is still on going to include this PEG in the range. NF
membrane’s MWCO at 500<MWCO<2000 g/mol is expected to give accurate values as found in UF ranges.
Similar research work was reported to confirm the developed MWCO method [12, 29, 30]. The difference in the
MWCO of the membrane in comparison to the values provided by the manufacturers was discussed in details. For
example, [12] have found a single run of pressure filtration with a mixture of PEGs in aqueous solution to determine
MWCO of membranes. However, the method used to determine the MWCO have utilized a high-end equipment of
HPLC coupled with ELSD detector though using PEGs as the solutes. Other work has also used gas
chromatography (GC) with specific column to determine the styrene derivatives [10], alkanes detected in HPLC
[30]. Based on this comparison study, the newly modified method is confirmed can accurately determine the
MWCO in the range of 500 to 20,000 g/mol, which indicates the reliability of this method to substitute the method
currently referred to [16].
Malaysian Journal of Analytical Sciences, Vol 21 No 2 (2017): 484 - 495
DOI: https://doi.org/10.17576/mjas-2017-2102-24
494
Conclusion
A simple yet sensitive MWCO detection method was modified and developed from the commonly referred method
in order to accurately determine PEG concentration in solute retention. The accuracy of this method is confirmed
based on the filtration test using a range of commercial membranes. The MWCO values were found to be closed to
the values given by the manufacturer. Since the accuracy of this method was verified and confirmed, this newly
modified method could be used for determining membranes MWCO of either commercial or synthesized ones. High
concentration of PEGs solution could be detected without the need for dilution since appropriate single reagent was
used, thus no precipitation is presence as supported by the proposed reaction mechanism. This method can
accurately determine the membrane MWCO (g/mol) in the range of 500<MWCO<20,000 as confirmed in this work.
Acknowledgment
The authors would like to acknowledge the financial support of the Fundamental Research Grant Scheme
(FRGS/2/2013/TK05/UKM/02/4), GUP-2016-086 (UKM), Department of Chemical and Process Engineering,
Universiti Kebangsaan Malaysia and MyMaster by MOSTI for the MSc scholarship.
References
1. Alam, J., Dass, L. A., Alhoshan, M. S., Mostafa Ghasemi and Mohammad, A. W. (2011). Development of
polyaniline-modified polysulfone nanocomposite membrane. Applied Water Science, 2(1): 37 - 46.
2. Zhao, Q., Quanfu, A. F., Ji, Y., Qian, J. and Gao, C. (2011). Polyelectrolyte complex membranes for
pervaporation, nanofiltration and fuel cell applications. Journal of Membrane Science, 379(1-2): 19 - 45.
3. Prafulla, G. B., Sapkal, V. S. and Sapkal, R. S. (2012). The optimization and production polyethersulfone
ultrafiltration flat sheet membranes using lithium chloride as additives. International Journal of Engineering
Research and Development 1(12): 65 - 68.
4. Uludag, H., Paul, D.V. and Patrick, A. T. (2000). Technology of mammalian cell encapsulation. Advanced
Drug Delivery Reviews, 42: 29 - 64.
5. Derakhsheshpoor, R., Homayoonfal, M., Akbari, A. and Mehrnia, M. R. (2013). Amoxicillin separation from
pharmaceutical wastewater by high permeability polysulfone nanofiltration membrane. Journal of
Environmental Health Science and Engineering, 11(1): 9 - 19.
6. Idris, A. and Zain, N. M. (2006). Effect of heat treatment on the performance and structural details of
polyethersulfone ultrafiltration membranes. Jurnal Teknologi, 44: 27 - 40.
7. Kim, K. J., Fanen, A. G., Ben Aimb, R., Liub, M. G., Jonsson, G., Tessaro, C. I. C., Broekd, A. P. and
Bargemand, D. (1994). A comparative study of techniques used for porous membrane characterization: Pore
characterization. Journal of Membrane Science, 87: 35 - 46.
8. Nakao, S.-I. (1994). Review: Determination of pore size distribution 3. Filtration membranes. Journal of
Membrane Science, 96: 131 - 165.
9. Changzsheng, Z., Xuesong, Z. and Yilun, Y. (2000). Determination of pore size and pore size distribution on
the surface of hollow-fiber filtration membranes: A review of methods. Desalination, 129: 107 - 123.
10. Kang, E., Lee, Y., Chon, K. and Cho, J. (2014). Effects of hydrodynamic conditions (diffusion vs. convection)
and solution chemistry on effective molecular weight cut-off of negatively charged nanofiltration membranes.
Desalination, 352: 136 - 141.
11. Hassan, A. R. and Ismail, A. F. (2004). Characterization of nanofiltration membranes by the solute transport
method: some practical aspects in determining of mean pore size and pore size distributions. Regional
Symposium on Membrane Science and Technology. Puteri Pan Pacific Hotel, Johor Bharu, Malaysia: pp. 1 - 13.
12. Rohani, R., Hyland, M. and Patterson, D. (2011). A refined one-filtration method for aqueous based
nanofiltration and ultrafiltration membrane molecular weight cut-off determination using polyethylene glycols.
Journal of Membrane Science, 382(1-2): 278 - 290.
13. Felo, M. and DeFrees, S. (2012). Nucleotide Sugar Purification using membranes in google patent. Novo
Nordisk A/S, Bagsvaerd (DK): United States. 27.
14. Cheng, T. L., Chuang, K. H., Chen, B. M. and Roffler, S. R. (2012). Analytical measurement of PEGylated
molecules. Bioconjugate Chemistry, 23(5): 881 - 899.
15. Kolate, A., Baradia, D., Patil, S., Vhora, I., Kore, G. and Misra, A. (2014). PEG - A versatile conjugating
ligand for drugs and drug delivery systems. Journal of Control Release, 192: 67 - 81.
Izzati Izni et al: MOLECULAR WEIGHT CUT-OFF DETERMINATION OF PRESSURE FILTRATION
MEMBRANES VIA COLORIMETRIC DETECTION METHOD
495
16. Sabde, A. D., Trivedi, M. K., Ramachandhran, V., Hanra, M. S. and Misra, B. M. (1997). Casting and
characterization of cellulose acetate butyrate based UF membranes. Desalination, 114: 223 - 232.
17. Idris, A., Mat Zain, N. and Noordin, M. Y. (2007). Synthesis, characterization and performance of asymmetric
polyethersulfone (PES) ultrafiltration membranes with polyethylene glycol of different molecular weights as
additives. Desalination, 207(1-3): 324 - 339.
18. Padaki, M., Isloor, A. M. and Wanichapichart, P. (2011). Polysulfone/N-phthaloylchitosan novel composite
membranes for salt rejection application. Desalination, 279(1-3): 409 - 414.
19. Prafulla, G. B., Sapkal, R. S. and Sapkal, V. S. (2008). Influence of ethanol concentration on the performance
of polyethersulfone ultrafiltration membranes. International Journal of ChemTech Research, 4(4): 1518 - 1521.
20. Shirley, J., Mandale, S. and Kochkodan, V. (2014). Influence of solute concentration and dipole moment on the
rejection of uncharged molecules with nanofiltration. Desalination, 344: 116 - 122.
21. Fella, C. (2008). Dynamic and effective gene vectors via ph-sensitive peg-shielding. Thesis Doctor of
Philosophy. Faculty of Chemistry and Pharmacy, Ludwig Maximilian University of Munich, Miltenberg.
22. Christopher, B., Drewes, J. E., Pei, X. and Gary, A. (2004). Factors affecting the rejection of organic solutes
during NF/RO treatment - A literature review. Water Research, 38: 2795 - 2809
23. Bernadisiute, U., Antanelis, T., Vareikis, A. and Makuska, R. (2008). Iodination of poly(ethylene glycol) by a
mixture of triphenyl phosphite and iodomethane. Chemija, 19(2): 43 - 49.
24. Moulay, S. (2013). Molecular iodine/polymer complexes. Journal of Polymer Engineering, 33(5): 389 - 443.
25. Shaffer, C. B. and Critchfield, F. H. (1947). Solid polyethylene glycols (carbowax compounds) quantitative
determination in biological materials. Analytical Chemistry, 19(1): 32 - 35.
26. Barker, T. H., Klinger, M. M., Feldman, D. S., Fuller, G. M. and Hagood, J. S. (2001). Spectrophotometric
analysis for determining the average number of poly(ethylene) glycol molecules on PEGylated proteins
utilizing a protein digestion step. Analytical Biochemistry, 290(2): 382 - 385.
27. Lozzi, I., Pucci, A., Pantani, O. L., D’Acqui, L. P. and Calamai, L. (2008). Interferences of suspended clay
fraction in protein quantitation by several determination methods. Analytical Biochemistry, 376: 108 - 114.
28. Wuelfing, W. P., Kosuda, K., Templeton, A. C., Harman, A., Mowery, M. D. and Reed, R. A. (2006).
Polysorbate 80 UV/vis spectral and chromatographic characteristics – defining boundary conditions for use of
the surfactant in dissolution analysis. Journal of Pharmaceutical and Biomedical Analysis, 41: 774 - 782.
29. Tam, C. M. and Tremblay, A. Y. (1991). Membrane pore characterization-comparison between single and
multicomponent solute probe techniques. Journal of Membrane Science, 57: 271 - 287.
30. Rissler, K. (1996). High-performance liquid chromatography and detection of polyethers and their
mono(carboxy)alkyl and -arylalkyl substituted derivatives. Journal of Chromatography A, 742: 1 - 54.
Recommended